
Comparative Surface Quality of Maple (Acer pseudoplatanus) Cut through by CNC Routing and by CO2 Laser at Different Angles as Related to the Wood Grain

 ,
,  , , and
Abstract
1. Introduction
2. Materials and Methods
2.1. Wood Samples
2.1.1. Samples Processed by CNC Routing
2.1.2. Samples Processed by Laser
2.2. Surface Quality Measurements
2.3. Stereo-Microscopy Analysis
2.4. Chemical (FTIR) Analysis
3. Results
3.1. Processing with CNC
3.2. Processing with Laser
3.3. FTIR Analysis of Chemical Changes Produced by Laser Cutting
4. Conclusions
Author Contributions
Funding
Institutional Review Board Statement
Informed Consent Statement
Data Availability Statement
Acknowledgments
Conflicts of Interest
References
- Gurău, L.; Coşereanu, C.; Paiu, I. Comparative Surface Quality of Larch (Larix decidua Mill.) Fretwork Patterns Cut through by CNC Routing and by Laser. Appl. Sci. 2021, 11, 6875. [Google Scholar] [CrossRef]
- Gutowski, S.M. Bend, Break, and Learn. Master’s Thesis, University of Iowa, Iowa City, IA, USA, 2019. [Google Scholar] [CrossRef]
- Chen, R.; Turman, C.; Jiang, M.; Kalantar, N.; Moreno, M.; Muliana, A. Mechanics of kerf patterns for creating freeform structures. Acta Mech. 2020, 231, 3499–3524. [Google Scholar] [CrossRef]
- Shahid, Z.; Hubbard, J.E.; Kalantar, N.; Muliana, A. An investigation of the dynamic response of architectural kerf structures. Acta Mech. 2022, 233, 157–181. [Google Scholar] [CrossRef]
- Condoroţeanu, C.-D.; Gurău, L.; Coşereanu, C.; Georgescu, S.-V. A proposed method to evaluate the effect of changing the kerfing parameters upon the static bending behavior of flexible plywood panels cut by laser. Appl. Sci. 2022, 12, 4303. [Google Scholar] [CrossRef]
- Goli, G.; Bleron, L.; Marchal, R.; Uzielli, L.; Negri, M. Formation and Quality of Wood Surfaces Processed at Various Grain Angles-Douglas Fir and Oak. In Proceedings of the 4th IUFRO Symposium: Wood Structure and Properties, Bystra, Slovakia, 1–3 September 2002; pp. 91–98. [Google Scholar]
- Goli, G.; Marchal, R.; Uzielli, L. Classification of Wood Surface Defects According to Their Mechanical Formation During Machining. In Proceedings of the 2nd International Symposium on Wood Machining—Properties of Wood and Wood Composites Related to Machining, Vienna, Austria, 5–7 July 2004. [Google Scholar]
- Iskra, P.; Hernández, R.E. The influence of cutting parameters on the surface quality of routed paper birch and surface roughness prediction modeling. Wood Fiber Sci. 2009, 41, 28–37. [Google Scholar]
- Gürgen, A.; Çakmak, A.; Yıldız, S.; Malkoçoğlu, A. Optimization of CNC operating parameters to minimize surface roughness of Pinus sylvestris using integrated artificial neural network and genetic algorithm. Maderas-Cienc. Tecnol. 2022, 24, 1–12. Available online: http://revistas.ubiobio.cl/index.php/MCT/article/view/5163 (accessed on 29 May 2022). [CrossRef]
- Li, R.; He, C.; Xu, W.; Wang, X.A. Prediction of surface roughness of CO2 laser modified poplar wood via response surface methodology. Maderas-Cienc. Tecnol. 2022, 24, 1–12. Available online: http://revistas.ubiobio.cl/index.php/MCT/article/view/5397 (accessed on 18 April 2022). [CrossRef]
- Sütçü, A. Investigation of parameters affecting surface roughness in CNC routing operation on wooden EGP. Bioresources 2013, 8, 795–805. [Google Scholar] [CrossRef]
- Hazir, E.; Koc, K.H. Optimization of wood machining parameters in CNC routers: Taguchi orthogonal array based simulated angling algorithm. Maderas-Cienc. Tecnol. 2019, 21, 493–510. [Google Scholar] [CrossRef]
- Yakimovich, B.; Chernykh, M.; Stepanova, A.I.; Siklienka, M. Influence of selected laser parameters on quality of images engraved on the wood. Acta Fac. Xylologiae Zvolen Publica Slovaca 2016, 58, 45–50. [Google Scholar] [CrossRef]
- Gurau, L.; Petru, A. The influence of CO2 laser beam power output and scanning speed on surface quality of Norway maple (Acer platanoides). BioResources 2018, 13, 8168–8183. [Google Scholar] [CrossRef]
- Kúdela, J.; Kubovský, I.; Andrejko, M. Surface Properties of Beech Wood after CO2 Laser Engraving. Coatings 2020, 10, 77. [Google Scholar] [CrossRef]
- Hernandez-Castaneda, C.J.; Sezer, K.H.; Li, L. The effect of moisture content in fiber laser cutting of pine wood. Opt. Lasers Eng. 2011, 49, 1139–1152. [Google Scholar] [CrossRef]
- Rezaei, F.; Wimmer, R.; Gaff, M.; Gusenbauer, C.; Frömel-Frybort, S.; Kumar Sethy, A.; Corleto, R.; Ditommaso, G.; Niemz, P. Anatomical and morphological characteristics of beech wood after CO2-laser cutting. Wood Mater. Sci. Eng. 2022, 17, 459–468. [Google Scholar] [CrossRef]
- Barcikowski, S.; Koch, G.; Odermatt, J. Characterisation and modification of the heat affected zone during laser material processing of wood and wood composites. Holz Roh Werkst. 2006, 64, 94–103. [Google Scholar] [CrossRef]
- Eltawahni, H.A.; Rossini, N.S.; Dassisti, M.; Alrashed, K.; Aldaham, T.A.; Benyounis, K.Y.; Olabi, A.G. Evaluation and optimization of laser cutting parameters for plywood materials. Opt. Lasers Eng. 2013, 51, 1029–1043. [Google Scholar] [CrossRef]
- Kubovský, I.; Krišťák, Ľ.; Suja, J.; Gajtanska, M.; Igaz, R.; Ružiak, I.; Réh, R. Optimization of Parameters for the Cutting of Wood-Based Materials by a CO2 Laser. Appl. Sci. 2020, 10, 8113. [Google Scholar] [CrossRef]
- ISO 4287; Geometrical Product Specifications (GPS). Surface Texture, Profile Method, Terms. Definitions and Surface Texture Parameters. International Organization for Standardization: Geneva, Switzerland, 2009.
- Gurau, L.; Irle, M. Surface roughness evaluation methods for wood products: A review. Curr. For. Rep. 2017, 3, 119–131. [Google Scholar] [CrossRef]
- ISO/TS 16610-31; Geometrical Product Specification (GPS)—Filtration, Part 31: Robust Profile Filters, Gaussian Regression Filters. International Standards Organisation: Geneva, Switzerland, 2010.
- Gurau, L.; Mansfield-Williams, H.; Irle, M. Filtering the Roughness of a Sanded Wood Surface. Holz Roh Werkst. 2006, 64, 363–371. [Google Scholar] [CrossRef]
- Tan, P.L.; Sharif, S.; Sudin, I. Roughness models for sanded wood surfaces. Wood Sci. Technol. 2012, 46, 129–142. [Google Scholar] [CrossRef]
- ISO 13565-2; Geometrical Product Specifications (GPS)—Surface Texture: Profile Method. Surfaces having stratified functional properties. Part 2: Height Characterisation Using the Linear Material Ratio Curve. International Organization for Standardization: Geneva, Switzerland, 1998.
- Magoss, E. General Regularities of Wood Surface Roughness. Acta Silv. Lignaria Hung. 2008, 4, 81–93. [Google Scholar]
- Westkämper, E.; Riegel, A. Qualitätskriterien für geschliffene Massivholzoberflächen. Holz Roh Werkst. 1993, 51, 121–125. [Google Scholar] [CrossRef]
- Gurau, L. The Roughness of Sanded Wood Surfaces. Ph.D. Thesis, Forest Products Research Centre, Buckinghamshire Chilterns University College, Brunel University, London, UK, 2004. [Google Scholar]
- Wagenführ, R. Holzatlas; Fachbuchverlag Leipzig: München, Germany, 2000; p. 707. [Google Scholar]
- Haller, P.; Beyer, E.; Wiedemann, G.; Panzner, M.; Wust, H. Experimental Study of the Effect of a Laser Beam on the Morphology of Wood Surfaces. In Proceedings of the First International Conference of the European Society for Wood Mechanics, Lausanne, Switzerland, 19–21 April 2001; Available online: https://www.researchgate.net/publication/237543545_Experimental_study_of_the_effect_of_a_laser_beam_on_the_morphology_of_wood_surfaces (accessed on 1 May 2018).
- Kúdela, J.; Andrejko, M.; Mišíková, O. Wood surface morphology alteration induced by engraving with CO2 laser under different raster density values. Acta Fac. Xylologiae Zvolen 2021, 63, 35–47. [Google Scholar] [CrossRef]
- Pandey, K.K.; Pitman, A.J. FTIR studies of the changes in wood chemistry following decay by brown-rot and white-rot fungi. Int. Biodeterior. Biodegrad. 2003, 52, 151–160. [Google Scholar] [CrossRef]
- Petutschnigg, A.; Stöckler, A.M.; Steinwendner, F.; Schnepps, J.; Gütler, H.; Blinzer, J.; Holzer, H.; Schnabell, T. Laser Treatment of Wood Surfaces for Ski Cores: An Experimental Parameter Study. Adv. Mater. Sci. Eng. 2013, 2013, 123085. [Google Scholar] [CrossRef]
- Kubovsky, I.; Kačík, F. Colour and chemical changes of the lime wood surface due to CO2 laser thermal modification. Appl. Surf. Sci. 2014, 321, 261–267. [Google Scholar] [CrossRef]
- Kubovsky, I.; Kačík, F. FT-IR study of maple wood changes due to CO2 laser irradiation. Cellul. Chem. Technol. 2009, 43, 235–240. [Google Scholar]


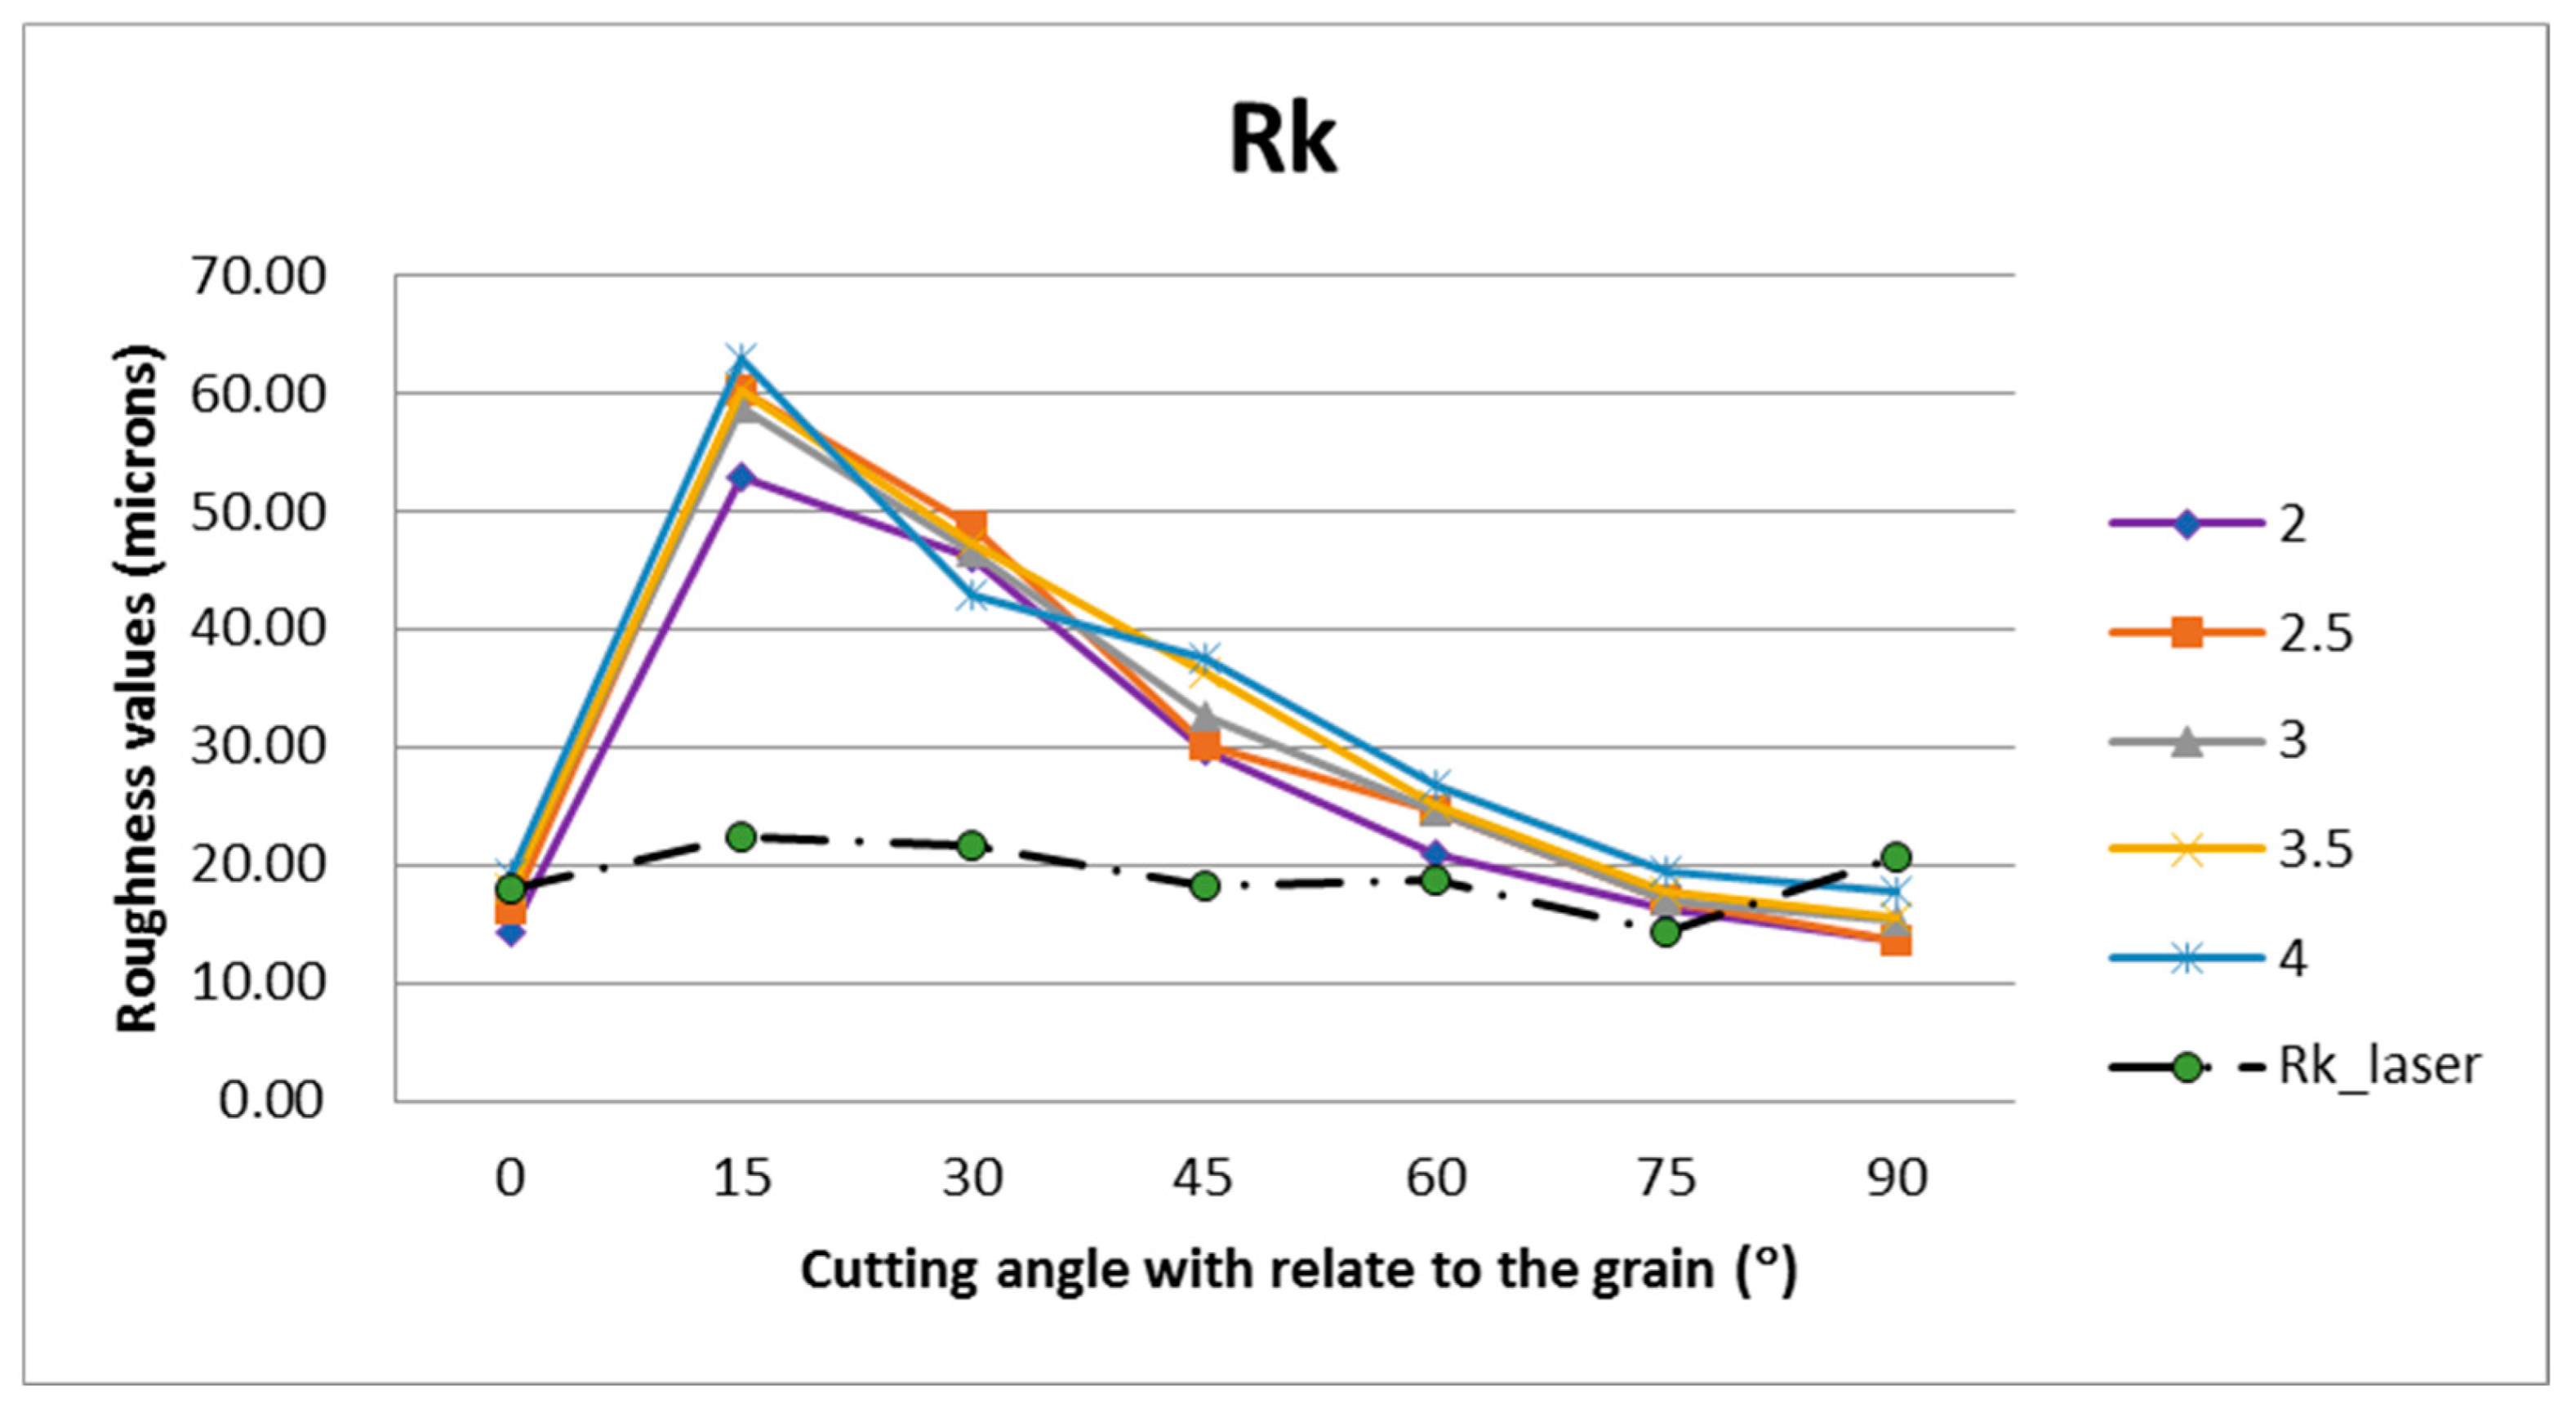
| Cutting Angle, in ° | Data | Rk, in µm, at Various Feed Speeds | ||||
|---|---|---|---|---|---|---|
| 2 m/min | 2.5 m/min | 3 m/min | 3.5 m/min | 4 m/min | ||
| 0 | Mean Rk (STDEV) 1 Significance | 14.40 (2.72) A 2 | 16.16 (2.16) A | 18.19 (2.97) A | 17.89 (1.81) A | 19.23 (1.29) A |
| 15 | Mean Rk (STDEV) Significance | 52.82 (6.88) E | 60.31 (9.60) D | 58.75 (14.74) D | 60.18 (3.80) E | 63.06 (19.91) D |
| 30 | Mean Rk (STDEV) Significance | 46.1 (4.91) D | 48.83 (4.54) C | 46.51 (6.69) C | 47.37 (3.79 D) | 42.84 (6.45) C |
| 45 | Mean Rk (STDEV) Significance | 29.78 (2.42) C | 30.33 (3.24) B | 32.64 (2.58) B | 36.21 (3.96) C | 37.48 (1.97) BC |
| 60 | Mean Rk (STDEV) Significance | 20.89 (3.09) B | 24.70 (3.01) B | 24.68 (3.08) AB | 25.16 (2.28) B | 26.77 (4.25) AB |
| 75 | Mean Rk (STDEV) Significance | 16.21 (1.73) AB | 17.11 (1.70) A | 16.95 (2.54) A | 17.71 (0.98) A | 19.47 (2.74) A |
| 90 | Mean Rk (STDEV) Significance | 13.64 (1.93) A | 13.61 (0.48) A | 15.19 (1.32) A | 15.59 (1.56) A | 17.75 (2.59) A |
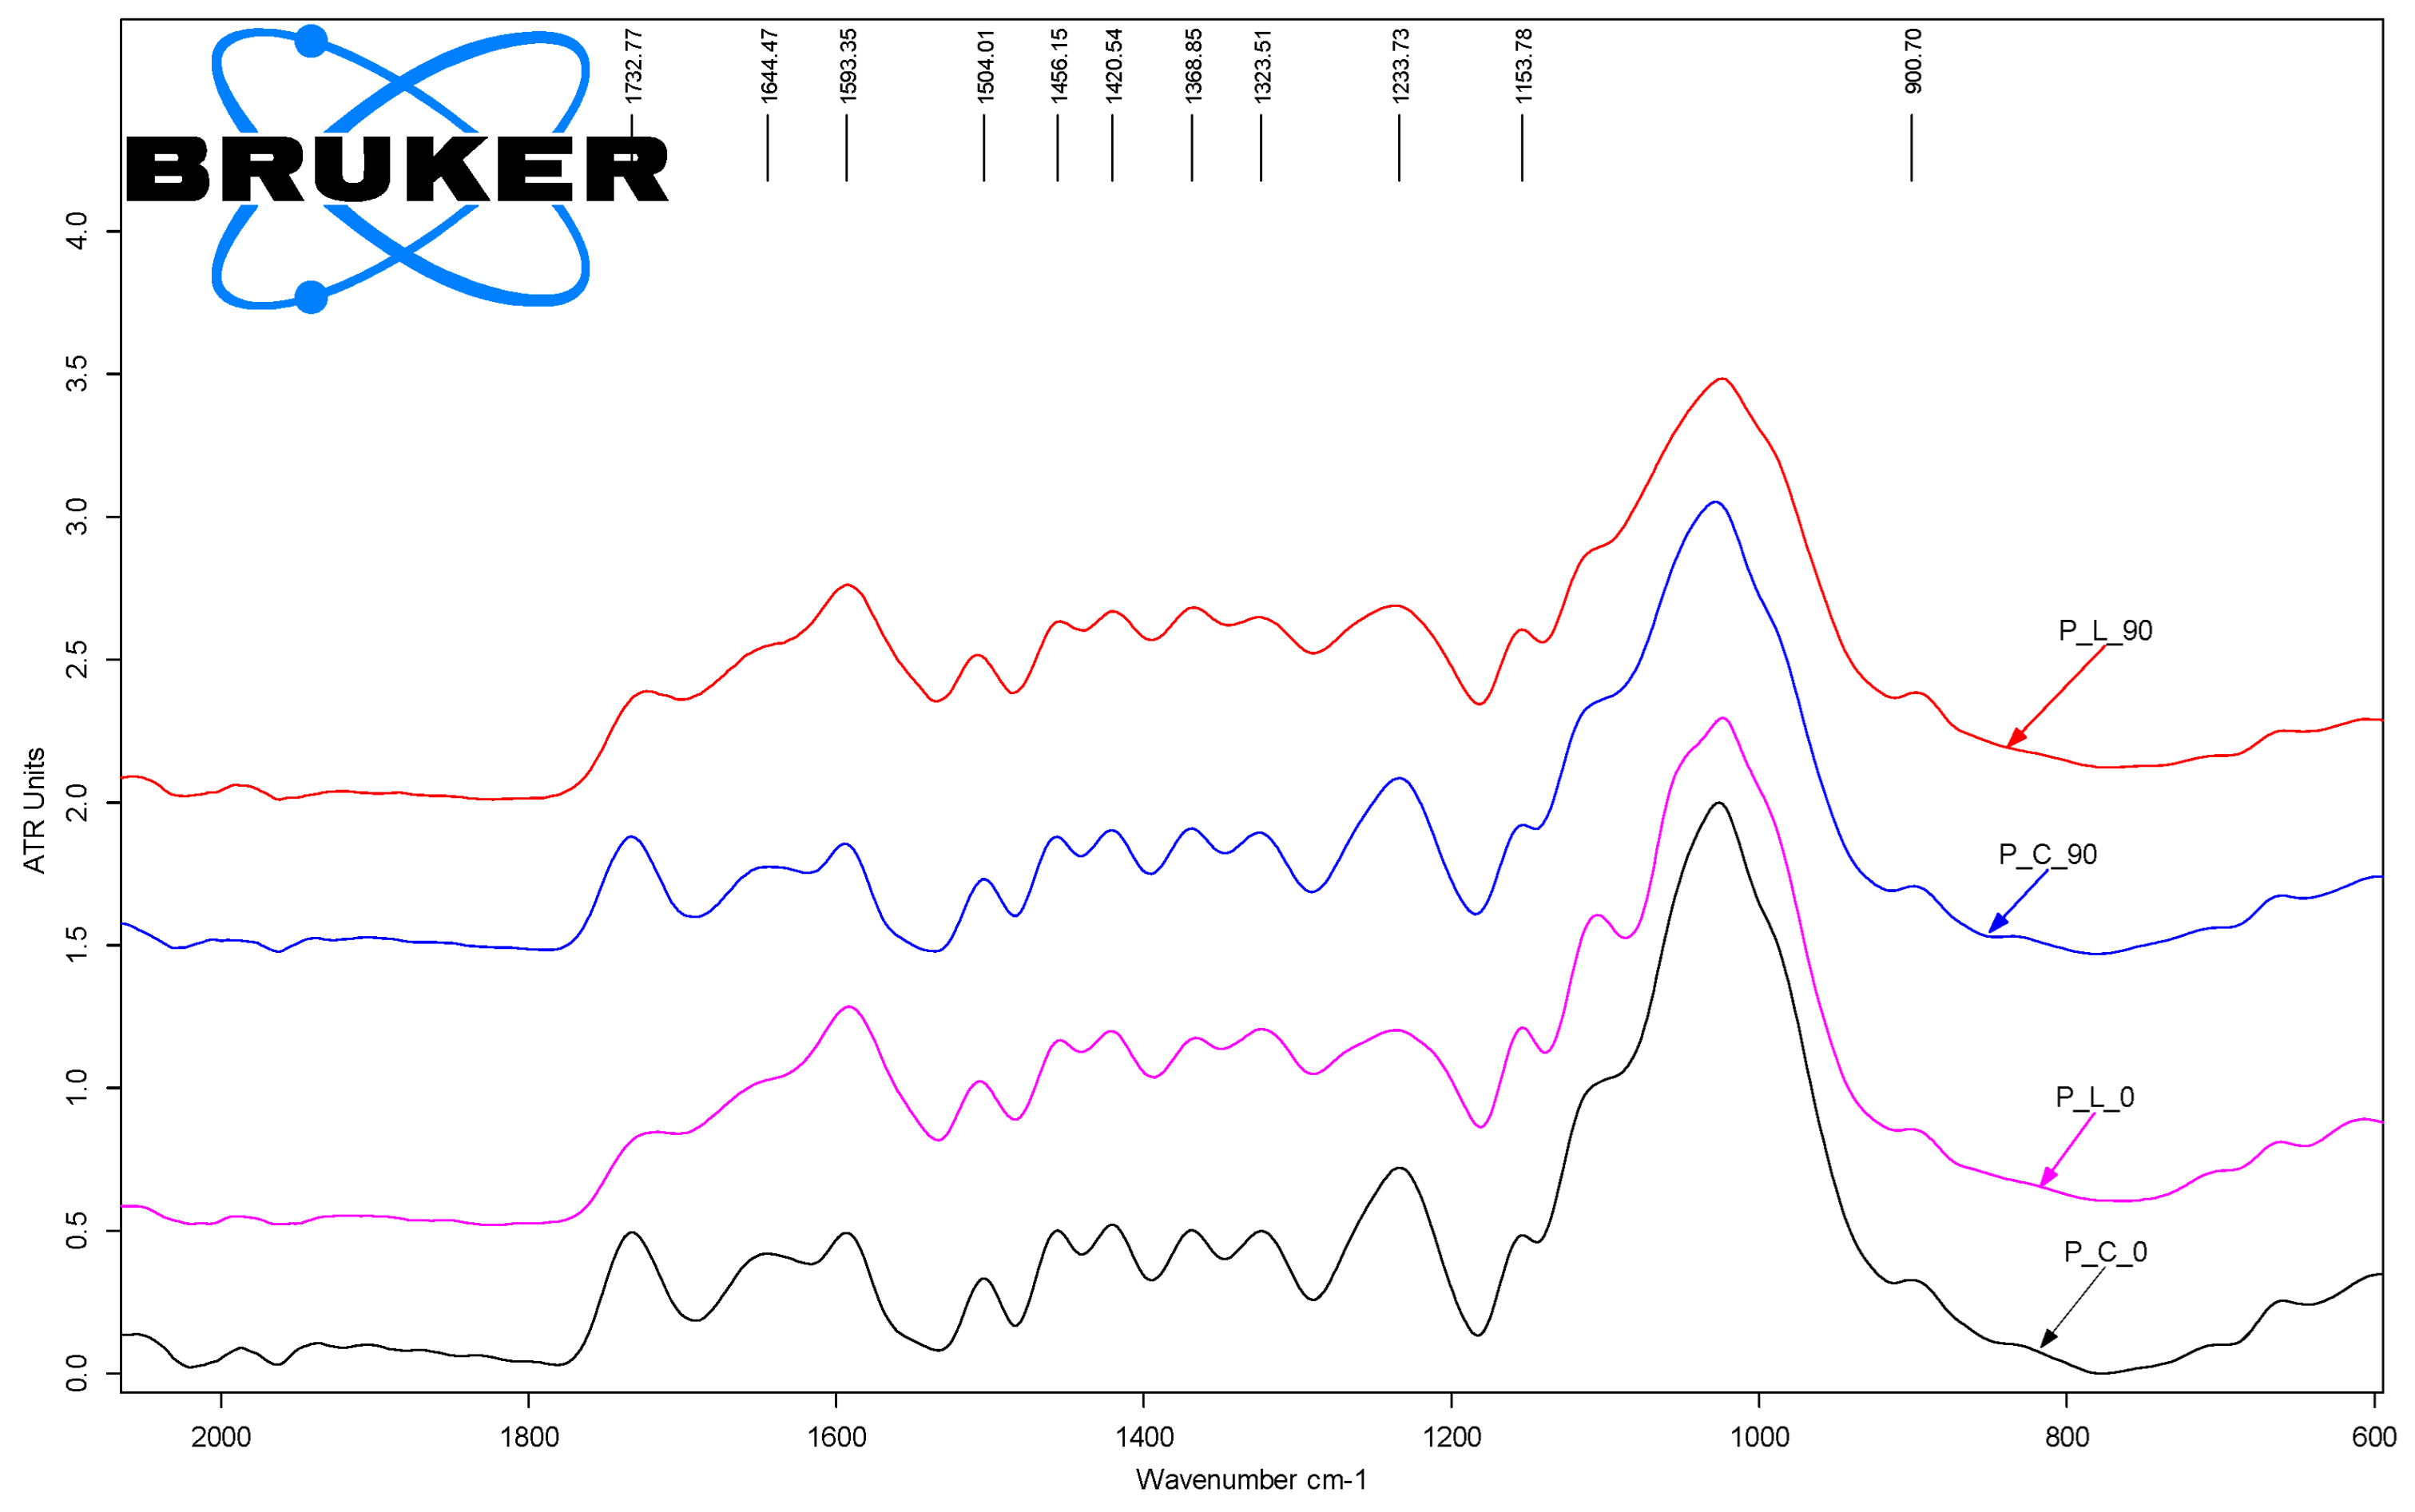
| Absorption Band [cm−1] | Areas (Integration Asolute Values) | Calculated Ratios A Laser /A Control | ||||
|---|---|---|---|---|---|---|
| P_C_0° | P_C_90° | P_L_0° | P_C_90° | P_L_0°/P_C_0° | P_L_90°/P_C_90° | |
| 1732 | 14.93 | 12.82 | 3.80 | 5.69 | 0.26 | 0.44 |
| 1645–1594 | 27.41 | 23.35 | 31.46 | 29.43 | 1.15 | 1.26 |
| 1504 | 4.11 | 3.72 | 3.47 | 3.23 | 0.85 | 0.87 |
| 1369 | 3.06 | 2.71 | 1.65 | 2.06 | 0.54 | 0.76 |
| 1234 | 28.04 | 23.46 | 14.33 | 14.69 | 0.51 | 0.63 |
| 1026 | 211.84 | 174.72 | 173.74 | 140.97 | 0.82 | 0.81 |
| 900 | 1.23 | 1.58 | 0.83 | 1.20 | 0.67 | 0.76 |
Publisher’s Note: MDPI stays neutral with regard to jurisdictional claims in published maps and institutional affiliations. |
© 2022 by the authors. Licensee MDPI, Basel, Switzerland. This article is an open access article distributed under the terms and conditions of the Creative Commons Attribution (CC BY) license (https://creativecommons.org/licenses/by/4.0/).
Share and Cite
Gurău, L.; Coșereanu, C.; Timar, M.C.; Lungu, A.; Condoroţeanu, C.D. Comparative Surface Quality of Maple (Acer pseudoplatanus) Cut through by CNC Routing and by CO2 Laser at Different Angles as Related to the Wood Grain. Coatings 2022, 12, 1982. https://doi.org/10.3390/coatings12121982
Gurău L, Coșereanu C, Timar MC, Lungu A, Condoroţeanu CD. Comparative Surface Quality of Maple (Acer pseudoplatanus) Cut through by CNC Routing and by CO2 Laser at Different Angles as Related to the Wood Grain. Coatings. 2022; 12(12):1982. https://doi.org/10.3390/coatings12121982
Chicago/Turabian StyleGurău, Lidia, Camelia Coșereanu, Maria Cristina Timar, Antonela Lungu, and Cristina Daria Condoroţeanu. 2022. "Comparative Surface Quality of Maple (Acer pseudoplatanus) Cut through by CNC Routing and by CO2 Laser at Different Angles as Related to the Wood Grain" Coatings 12, no. 12: 1982. https://doi.org/10.3390/coatings12121982
APA StyleGurău, L., Coșereanu, C., Timar, M. C., Lungu, A., & Condoroţeanu, C. D. (2022). Comparative Surface Quality of Maple (Acer pseudoplatanus) Cut through by CNC Routing and by CO2 Laser at Different Angles as Related to the Wood Grain. Coatings, 12(12), 1982. https://doi.org/10.3390/coatings12121982