Article

Fatigue Property and Residual Stress Relaxation Behavior of High-Energy Shot Peened Pure Zr

School of Metallurgical Engineering, Xi’an University of Architecture and Technology, Xi’an 710055, China
*
Author to whom correspondence should be addressed.
Coatings 2022, 12(2), 131; https://doi.org/10.3390/coatings12020131
Submission received: 21 December 2021 / Revised: 18 January 2022 / Accepted: 21 January 2022 / Published: 24 January 2022
(This article belongs to the Special Issue Fatigue and Fracture of Structural Materials)

Abstract

:
High-energy shot peening (HESP) was conducted on commercial pure Zr to generate a surface gradient nanostructured layer and compressive residual stress (CRS). The microstructure, residual stress, and fracture morphology were investigated by electron back scattering diffraction (EBSD), scanning electron microscope (SEM), transmission electron microscope (TEM), and X-ray diffraction (XRD), respectively. Tensile fatigue tests were conducted and the fatigue property was presented through S-N curve. By the XRD measurement, the residual stress relaxation and the microstructure evolution on the HESPed surface were studied under different stress amplitudes. The results indicated that the fatigue limit of the HESPed sample was 23% higher than that of the as-received. The relaxation of residual stress was observed during fatigue loading; the initial relaxation rate was fast and the later was slow, accompanied by a similar degree of nanocrystalline coarsening and dislocation density reduction. A linear relationship between the surface residual stress and the number of cycles for the HESPed sample was quantitatively described. The higher the applied stress amplitude was, the faster the residual stress relaxation (RSR) was. The stress amplitude had an important influence on the relaxation rate, the degree of nanocrystals coarsening, and dislocation density. Local plastic deformation caused grain coarsening and dislocation density reduction.

1. Introduction

Owing to its combination of remarkable corrosion resistance, machinability, good mechanical property, and very low neutron absorption cross-section, zirconium (Zr) and its alloys are commonly used as fuel cladding and structural materials in nuclear reactors [1,2,3,4]. The fatigue failure of cladding material fabricated by Zr alloys is mainly caused by vibration generated by the fluid force of components [5]. Most fatigue failures in engineering components initiate from the surface and then propagate into the interior, and the properties of the components’ surface play an important role in their service lifetime [6]. Thus, surface modification has become one of the most attractive approaches to improve fatigue life [7].
Different from laser surface treatment [8], electron beam surface modification [9], and micro-arc oxidation [10], the purpose of surface mechanical treatment technologies such as shot peening, hammering, and cold rolling is to introduce CRS and change the microstructure in the surface layer, and in turn, improve the fatigue life of components. With the development of nanoscience and nanotechnology, surface nanocrystallization of metallic materials can be achieved by surface mechanical treatments such as HESP and surface mechanical grinding treatment [11]. Gradient nanostructures induced by severe plastic deformation in different ways can effectively improve the fatigue properties of metal components. In all the existing surface mechanical treatments, HESP is widely used because of its own characteristics such as cheap, remarkable and efficient strengthening effect, relative simplicity of equipment, and having no limitation of treated component shape [12].
The CRS can significantly improve fatigue performance [13,14]. Zhang et al. studied the fatigue limits of the HESP-edTi–6Al–4V (TC4) alloy and proposed that the synergy effect of surface gradient nanostructure and CRS improved the fatigue limit of the HESP-ed TC4 alloy [15]. During the process of fatigue loading, residual stress will release and redistribute, reducing the improvement on fatigue life. Therefore, it is of great significance to analyze the CRS and its release characteristics during cyclic loading. Saalfeld et al. studied the residual stress stability of deep rolled steel SAE 1045 under high-loading amplitudes. Results showed that the RSR behavior was strongly affected by the cyclic yield strength of material. Furthermore, residual stress stability depended on the stress amplitude [16]. Xie et al. studied the RSR of the peened TC4 surface under cyclic loading, finding that RSR was mainly influenced by the original magnitude, the applied stress, and the cycling numbers [17]. Kim et al. studied the RSR of shot-peened medium-carbon steel under a low-cycle and high-cycle fatigue regime and found stress relaxation rate depended on the applied strain [18]. Maleki et al. studiedthe residual stress relaxation of AISI 1060 steel after shot peening. The results revealed that stress relaxation started at a high rate at the initial stages of loading and gradually increased at higher number of cycles [19].
Most of the researches were focused on the effects of load levels and load modes on the surface RSR of conventionally shot-peened materials. However, there are no studies on the evolution of residual stresses induced by surface nanocrystallization treatment under tensile fatigue loading. In this work, we prepared surface gradient nano-grained pure Zr via HESP. The effect of HESP treatment on the fatigue performance of pure Zr was studied. The RSR of the HESPed samples was studied and compared under different stress amplitudes. The correlations between surface RSR and loading cycles were explored. The evolution of residual stress, dislocation density, and grains size in the surface layer during the fatigue loading was characterized.

2. Materials and Methods

Hot-rolled and annealed commercial pure Zr was used, which contained impurities of 0.08C, 0.25(Fe + Cr), 0.012H, 0.05N and 0.13O (wt.%). The surface of all samples was polished orderly by SiC abrasives down to 2000 grit prior to shot peening processes. HESP (Dt1480, Entai, Shanghai, China) device was applied in this work. The schematic illustration of HESP process is shown in Figure 1. Shot peening was performed by high-pressure gas driving a cast steel (ZG30) ball with a diameter of 0.3 mm. The detailed parameters are as follows: gas pressure ~0.4 MPa, coverage ~100%, spray angle ~85°, and duration ~45 min. Fatigue samples were cut by wire-cut electrical discharge machining (DK7735, Terui, Taizhou, China) according to GB/T 3075-2008 standard, China. The dimensions of fatigue samples are shown in Figure 2 and two sides of the samples are treated by HESP. The tensile fatigue test was performed on a 50 kN electro-hydraulic fatigue machine (Instron 8801, Norwood, MA, USA) with a stress ratio of R = 0.1 and frequency of 10 Hz at room temperature.The fracture morphology was characterized by a scanning electron microscope (Gemini 300, Zeiss, Jena, Germany). To evaluate the stress-life (S-N), at least three samples were tested for each condition to ensure accuracy. The cyclic loading was in the form of a sinusoidal wave and the stress amplitudes are 210 MPa and 320 MPa. Electron back scattering diffraction (Gemini 300, Zeiss) was applied to characterize the microstructure change before and after HESP. The cross-section of the samples for EBSD observation was ground orderly by 400-3000# SiC abrasives, then chemically etched in a solution of 2 mL of HF, 9 mL of HNO3, and 9 mL of C3H6O3 for ~60 s. The characterization of the nano-grained structure was conducted by a transmission electron microscope (JEM-200CX, Jeol, Tokyo, Japan). The samples for TEM were pre-ground to thicknesses of ~50 μm using SiC abrasives, followed by thinning with an electrolytic double-jet thinning instrument, and the volume ratio of the reagent was CH2OH:HClO4 = 1:19. Residual stress analyses were implemented with X-ray diffraction (D8 ADVANCE A25, Bruker, Karlsruhe, Germany) using Cu-Kα radiation (λ = 0.154056 nm) via sin2ψ method. The Cu-kα characteristic X-ray beam diameter was 1 mm and the measurement parameters were as follows: the operation voltage was 30 kV, with 80 mA current; the scanning field was 2 mm × 2 mm; the diffraction peak of 137°; and the characteristic crystal plane was (231). To obtain the in-depth distributions of residual stress, the material was removed layer by layer with an electrolytic polishing instrument (EP-05, Labtt, Shanghai, China) at −20 °C. The volume ratio of the polishing solution was CH2OH:HClO4:C6H14O2 = 3:1:1.
XRD tests of the as-received and the HESPed surface were performed on X-ray diffraction (D8 ADVANCE A25, Bruker, Karlsruhe, Germany) with Cu-Kα radiation (λ = 0.154056 nm). The test was conducted by a scan step of 6° per minute in the 2θ ranging from 20° to 80°. The microstructural features including the crystallite size and microstrain were evaluated according to the Williamson-Hall formula [20]:
βcosθ = Cεsinθ + Kλ/D
where θ is the diffraction angle, λ is the X-ray wavelength, D is the crystallite size, and ε is the microstrain. C and K are constant. β is the broadening of the diffraction peak. An instrumental broadening of ~0.05 obtained by measuring the broadening of a standard silicon sample was used in this work. Thus, the total peak broadening β caused by grain refinement broadening and strain broadening can be obtained. The curve of βcosθ vs. sinθ can be plotted, and the values of D and ε are obtained from the intercept and slope of the fitted lines, respectively.
The dislocation density may be determined from: [21]
ρ = ε(2√3)/Db
where D is the crystallite size, ε is the microstrain and b is the value of the Burgers vector. In this study, only <a> slip is considered, which gives b = 0.3232 nm [22,23].

3. Results and Discussion

3.1. Microstructure and Residual Stress

Figure 3 shows the inverse pole figure (IPF) maps of the cross-section of pure Zr samples before and after USSP treatment. As seen from Figure 3a, the as-received sample exhibits a uniform microstructure and no deformation twinning was observed. The majority of grains are equiaxed with an average grain size of ~20 μm. As seen from Figure 3b, the HESPed sample shows a gradient microstructure with notable grain refinement on the surface layer. The thickness of the significant grain refined layer is more than 40 μm. The top refined region is white and barely resolved by using EBSD, which is due to the nanocrystalline nature and the residual stress. From the depth of 40 μm to the matrix, there is a large number of deformation twinning. Zr alloys possess a hexagonal close-packed structure and deform by dislocation slip; twinning becomes important to accommodate deformation due to the limited number of slip systems. The microstructure evolution from the surface to the matrix is in the sequence of the surface nanocrystalline layer, transition layer (including broken grains and twins), and matrix.
Figure 4 presents the XRD patterns of the as-received and the HESPed at the topmost surface. Compared with the as-received sample, the HESPed sample shows different diffraction characteristics. After HESP treatment, the intensity of (0002), (10 1 ¯ 1 ), ( 11 2 ¯ 0 ), and (10 1 ¯ 3 ) peaks become strong. The peaks of (10 1 ¯ 0 ) and ( 11 2 ¯ 0 ) are reduced greatly. Meanwhile, the peaks’ width of the (0002), (10 1 ¯ 1 ), ( 11 2 ¯ 0 ) and (10 1 ¯ 3 ) are broadened. This result can be attributed to grain refinement, lattice deformation, and micro-strain development. It is well-established that the variations in the full-width half maximum (FWHM) can quantitatively characterize the evolution in microstructure, such as the microstrain and crystallite size [24]. Such a larger FWHM indicates a smaller grain size, and the grain size can be calculated according to the Williamson-Hall formula [20]. The calculated average crystallite size on the HESPed sample surface is ~14.8 nm.
Figure 5 shows the TEM micrograph and the corresponding selected area electron diffraction (SAED) pattern of the HESPed sample near the surface. There is the formation of a large number of equiaxed nanograins with an average size of ~46 nm, and the formation of nanograins is also confirmed by the ring patterns of the SAED produced by random crystallographic orientations. Lots of highly tangled dislocations are observed inside the grains. The TEM results indicate the crystallite size is changed along the depth.
Figure 6 shows the stress distribution along the depth for the HESPed sample. During the shot peening process, the differences in nonreversible plastic deformation between the surface layer and the interior of bulk causes the incompatibility between these two volumes and lead to the creation of residual stress [25]. It can be observed that a significant level of CRS field with a depth of roughly 360 μm is induced by HESP at the sample surface layer. The value of surface CRS is 270 MPa. In addition, the maximum value of CRS is 380 MPa at the subsurface depth of about 107 μm. The maximum CRS is not obtained at the impacted surface but at the subsurface, which is probably owing to the energy transformation during shot peening [15]. The micro-defects on the topmost surface consumed part of the energy and resulted in surface residual stress relaxation. Subsequently, the strain energy was transferred to the deeper region. Due to the strong constraint in the subsurface region, more energy was stored and higher CRS was induced.

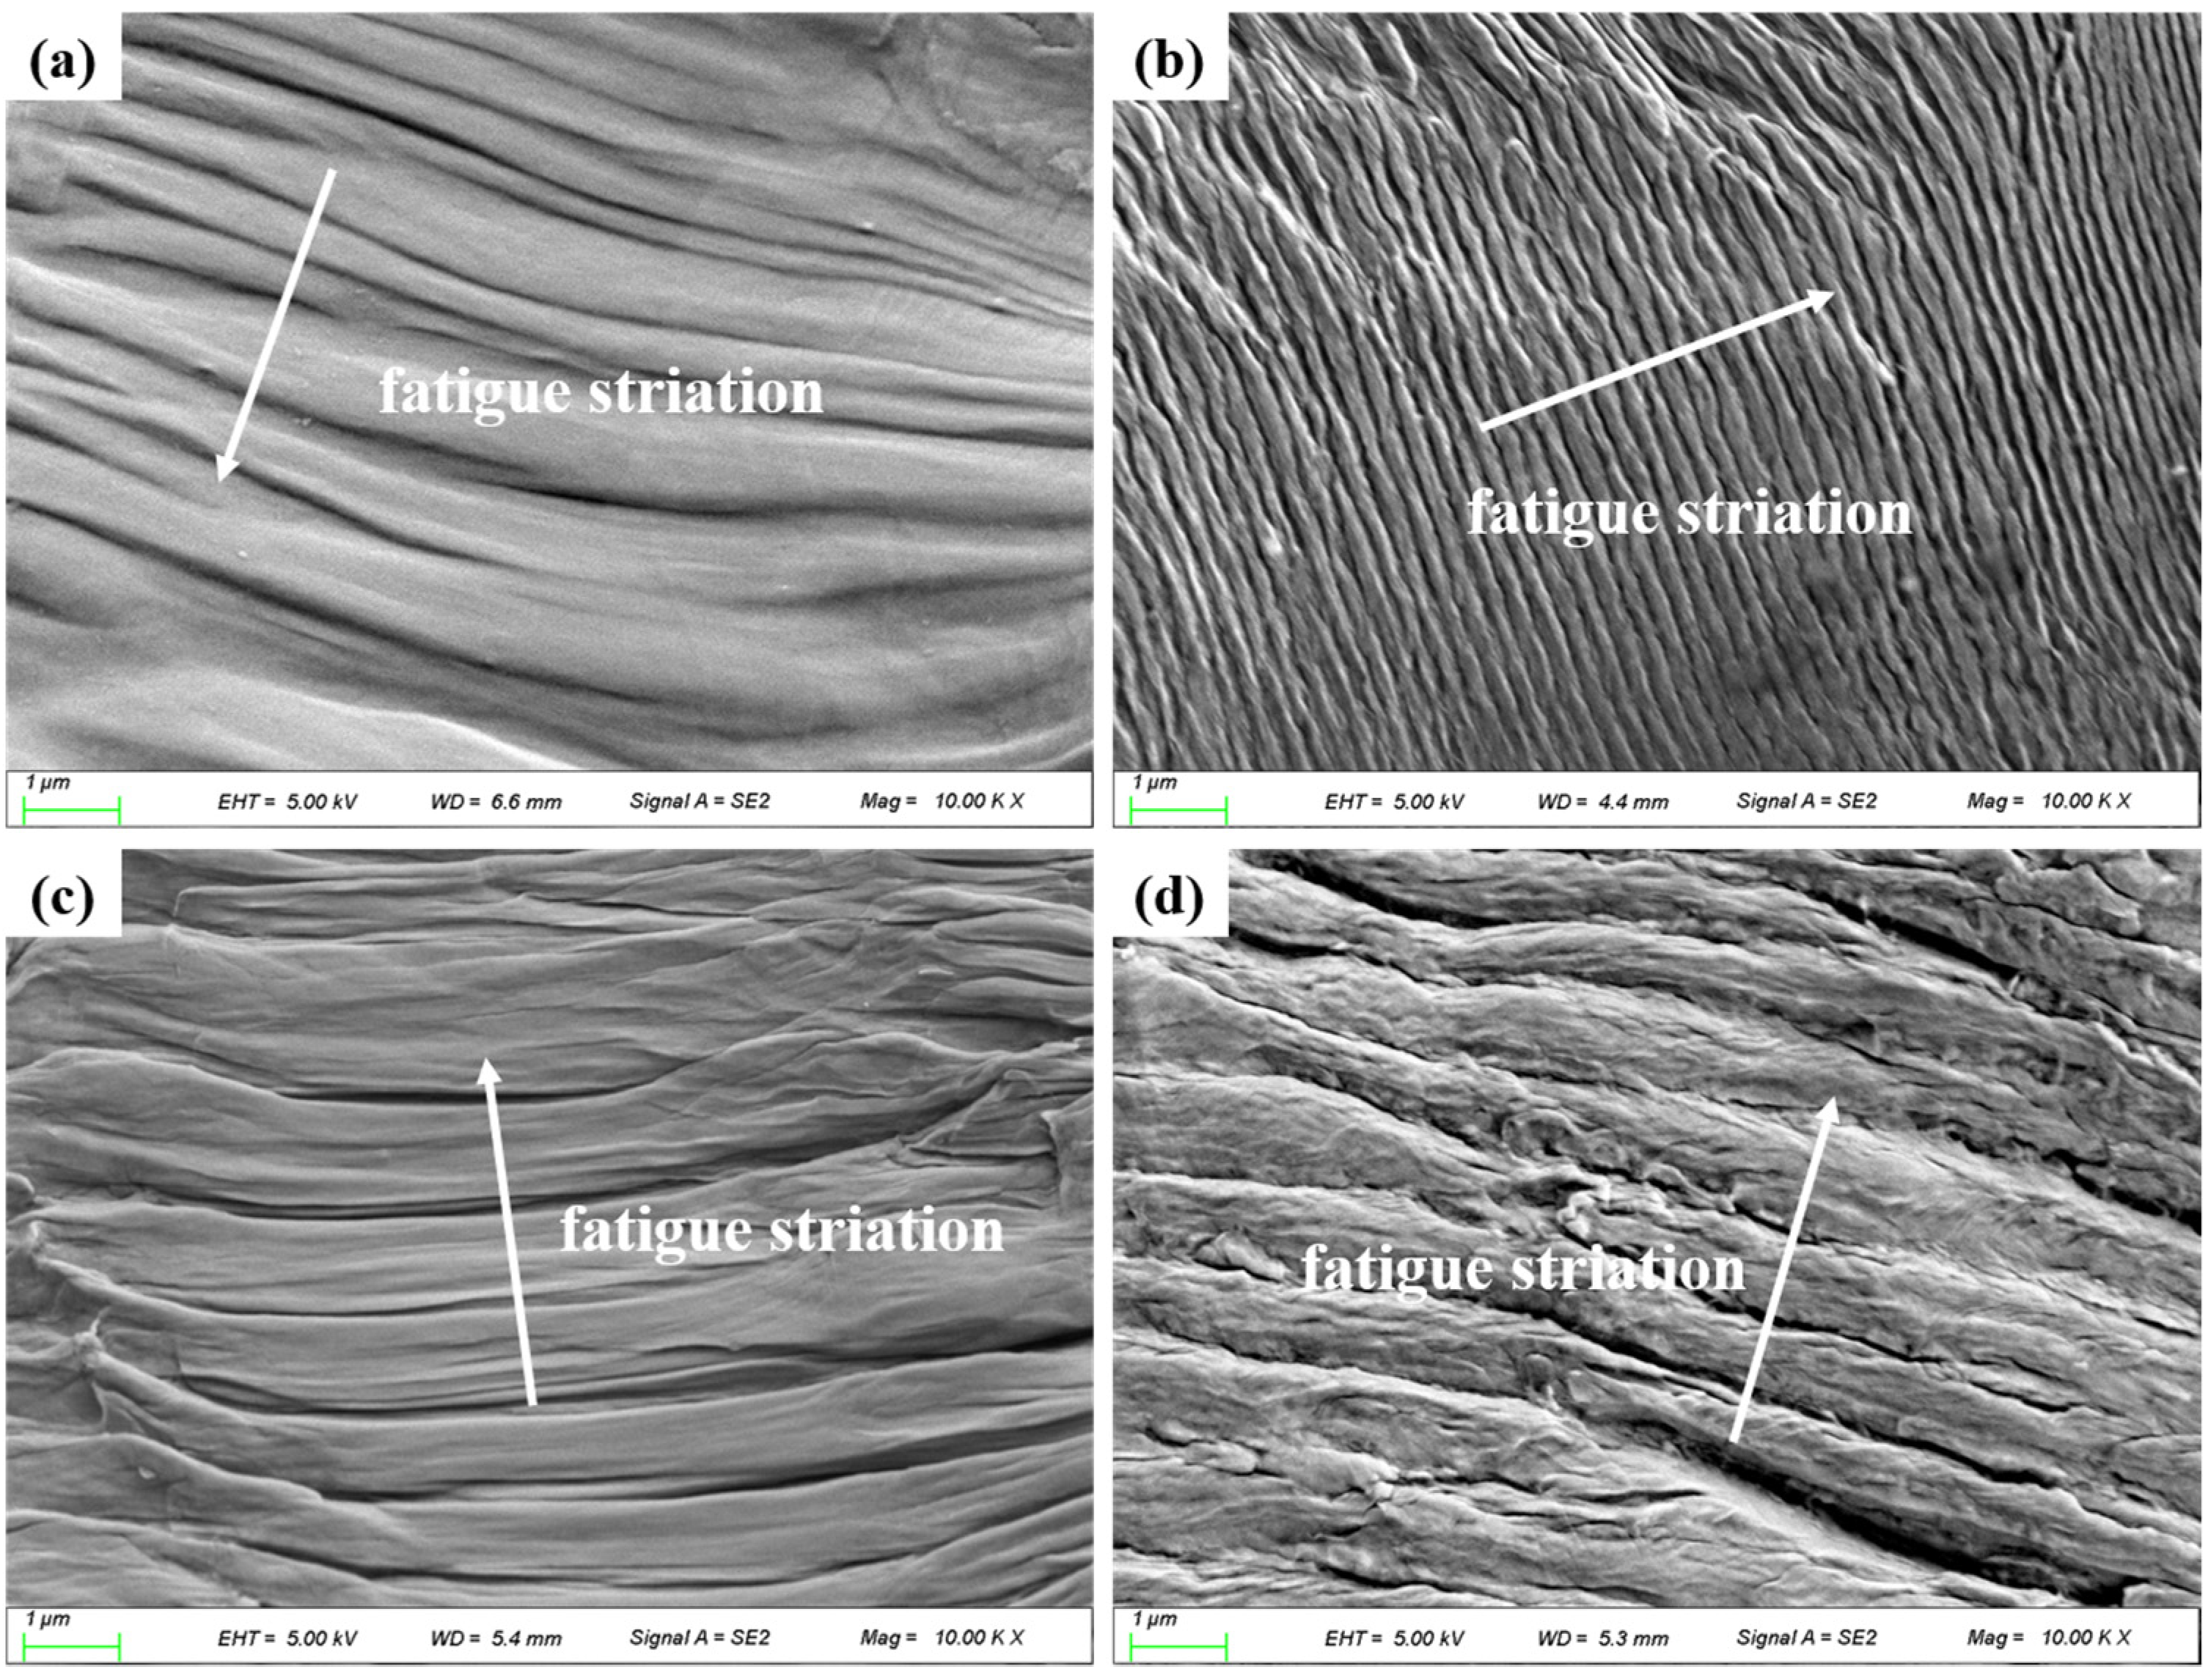
3.2. Fatigue Property

Figure 7 shows the S-N curves of the as-received and the HESPed samples. The fatigue limit of the as-received sample is 166 MPa, whereas that is increased to 220 MPa after HESP treatment, which is 23% higher than the as-received. It suggests that the HESP could improve the fatigue strength of pure Zr. On the one hand, the CRS induced by HESP treatment can offset part of the external load and postpone propagation of the crack. On the other hand, the surface nanolayer has a strong fatigue resistance to plastic deformation. The surface gradient nanostructured layer and work hardening state produced by HESP treatment are helpful to prevent dislocation slip, thereby effectively inhibiting fatigue crack initiation in the top surface [26].
Figure 8 shows the fracture morphologies of the as-received and the HESPed samples. The fatigue fracture shows obvious fluvial morphology. The arrows in the figure indicate the locations of the crack origins. As shown in Figure 8a, the crack initiation position is on the surface of the as-received sample. The micro-defects on the surface of the as-received sample are subjected to fatigue loads, resulting in surface stress concentration and the formation of crack origins. It can be seen from Figure 8b that the crack origin appears on the subsurface of the HESPed sample. This is one of the main characteristics of fatigue damage of surface strengthening metal materials. The reason for this is that the residual compressive stress on the surface introduced by HESP treatment counteracts the fatigue load and moves the maximum effective fatigue stress to the inside subsurface of the sample [15,27].

3.3. Residual Stress Relaxation during Fatigue Loading

The residual stress field (RSF) is usually characterized by four characteristic parameters [28]: the surface residual stress σsrs, the maximum residual stress σmrs, the depth of maximum residual stress Zm, and the depth of RSF Z0. Table 1 gives the characteristic parameters of RSF under different stress amplitudes in tensile fatigue tests. Figure 9 shows the RSF distribution of the HESPed sample under different cycles at stress amplitudes of 210 MPa and 320 MPa, respectively. Compared with the initial value, the residual stress is released in different degrees after different cycle numbers. As can be seen from Table 1, under stress amplitude of 210 MPa, σsrs is decreased by 29.7%, 40.0%, 62.0%, 63.3% and σmrs is decreased by 31.4%, 47.0%, 62.8%, 67.1% at 100, 103, 5 × 10⁵ and 8 × 10⁵ cycles, respectively. As can be seen from Table 1, under stress amplitude of 320 MPa, σsrs is decreased by 58.0%, 80.0%, 84.7% and σmrs is decreased by 69.4%, 71.5%, 77.3% at 100, 103 and 5 × 10⁴ cycles, respectively. As shown in Figure 9a,b, it can be seen that RSR is faster under 320 MPa and the RSR starts with a fast rate in the initial stage for two stress amplitudes, and the relaxation rate gradually decreases and tends to stabilize with the increase of the cycle numbers. The RSR generated by the first 100 cycles is decisive in the whole release process.
It is generally believed that RSR is caused by the local plastic deformation of the material. The deformation induced by cyclic loads destroyed the balance between the stresses during cyclic loading. The cyclic loads promote the plastic flow and thus decrease the value of residual stress [29]. Thus, the residual stress experiences significant relaxation under high stress amplitude. When the sum of the residual stress and applied stresses exceeded the yield condition of the material, the residual stress causes stress relaxation and redistribution. In this study, the applied stresses were close to their yield strength, and it can be considered that different extents of plastic deformation occurred. The higher the applied stress amplitude was, the faster the RSR was.
Figure 10 shows the variation of σsrs with the cycle numbers at different stress amplitudes. Figure 10a shows that σsrs is released with the increase of cycles, and the σsrs relaxation is faster under stress amplitude of 320 MPa. The amount of σsrs relaxation accountable for the total relaxation was 51.6% and 70.8% in the first 100 cycles for stress amplitudes of 210 MPa and 320 MPa, respectively. At the initial stage, the residual stress relaxes drastically which is usually regarded as the process of static loading stress relaxation [30]. The σsrs relaxation process is analyzed in detail after 10 cycles and it can be observed that the σsrs have a linear relationship with the logarithm of the cycle numbers. Figure 10b shows the certain positive correlation between σsrs and the logarithm of cyclic numbers. The linear correlation formula is defined as Equation (3):
σsrs = M·Log10(N) + σ0
where M is the σsrs relaxation rate and σ0 is the σsrs after the first 10 loading cycles. Substituting the data into the linear correlation formula, the equation can be expressed as follows:
σsrs = 22.8Log10(N) − 218.0 (210MPa)
σsrs = 51.4Log10(N) − 209.8 (320MPa)
It can be seen from Equations (4) and (5) that σsrs and the relaxation rate of σsrs are related to the stress amplitudes. The higher the applied stress amplitude is, the more easily the material yields and the faster the relaxation rate of σsrs is. Due to the intensive relaxation of residual stress at the initial stage of cyclic loading, Equations (4) and (5) can only be applied to the stage after the intensive relaxation of residual stress.
Figure 11 shows the fracture morphologies of the samples in the fatigue crack zone stage under different stress amplitudes. The numerous microscopic plastic deformation traces are parallel with each other, as pointed by white arrow in Figure 11. The trace is known as fatigue striation. Figure 11a,b shows the fatigue striations of the as-received and the HESPed specimens under stress amplitude of 210 MPa. The average fatigue striations spaces are 0.51 μm and 0.25 μm, respectively. Figure 11c,d shows the fatigue striations of the as-received and the HESPed specimens under stress amplitude of 320 MPa. The average fatigue striations spaces are 0.97 μm and 0.75 μm, respectively.
The width of fatigue striation space corresponds to the crack propagation rate. The wider the width, the greater the crack propagation rate [31]. The CRS can promote the crack closure effect and reduce fatigue crack growth driving force, thus reducing the crack growth rate [32]. Therefore, the fatigue crack growth rate of the HESPed sample is lower than that of the as-received sample. Compared with Figure 11c,d, the fatigue crack growth rate is faster under the stress amplitude of 320 MPa. The reason for this is that the residual stress is released quickly under high stress amplitude.

3.4. Microstructure Evolution during Residual Stress Relaxation

Using the Williamson-Hall formula [20], we calculated the crystallite size based on XRD results of the HESPed sample under different cyclic numbers. Figure 12 shows the variation of residual stress and grain size in the HESPed surface with cycle numbers under stress amplitudes. Figure 12a shows the crystallite size of the HESPed surface as ~20 nm and ~40 nm after the 10-th cycles and 8 × 10⁵-th cycles, respectively. Figure 12b shows the crystallite size of the HESPed surface as ~40 nm and ~62 nm after 100-th cycles and 5 × 10⁴-th cycles, respectively. For the same stress amplitude, the cyclic loading causes the increase of the crystallite sizes and the σsrs is released. At the same cycle numbers, the larger the stress amplitude applied, the larger the increase in the crystallite size and the extent of stress relaxation.
This fatigue-induced coarsening of nanocrystals on the surface of the HESPed sample is similar to the fatigue-induced crystallite coarsening in nanocrystalline platinum films [33] and grain coarsening in ultrafine-grained copper [34]. The results suggest that local plastic deformation leads to crystallite coarsening. It can be seen from Figure 10 that the nanocrystals coarsening process is accompanied by a similar degree of σsrs relaxation. Jia et al. observed strain-assisted grain growth of the nanograins, which was driven by strain energy and associated with the relaxation of residual stress [35]. Therefore, it is believed that local plastic deformation causes grain coarsening and residual stress relaxation.
Figure 13 illustrates the variation of dislocation density along the depth of the HESPed sample under different cycles and different stress amplitudes. After HESP treatment, high dislocation density is formed in the strengthening layer. As can be seen in Figure 13a,b, the dislocation density decreased rapidly at the 100-th cycles, and then decreased slowly and tended to be stable at the later stage. Compared with the stress amplitude of 210 MPa, the dislocation density decreased more under 320 MPa at the same cyclic number.
The nature of RSR is the gradual release of elastic strain energy in materials through microscopic or local plastic deformation. The reduction in the dislocation density and a change in the dislocation configuration led to the RSR [36]. After the fatigue loading started, the dislocation motion and annihilation caused by the load led to the decrease of dislocation density. It is easier to lead to dislocation movement and annihilation under high stress amplitude. In the process of microplastic deformation, the decrease of dislocation density caused by dislocation movement is the main reason for the relaxation of residual stress.

4. Conclusions

(1)
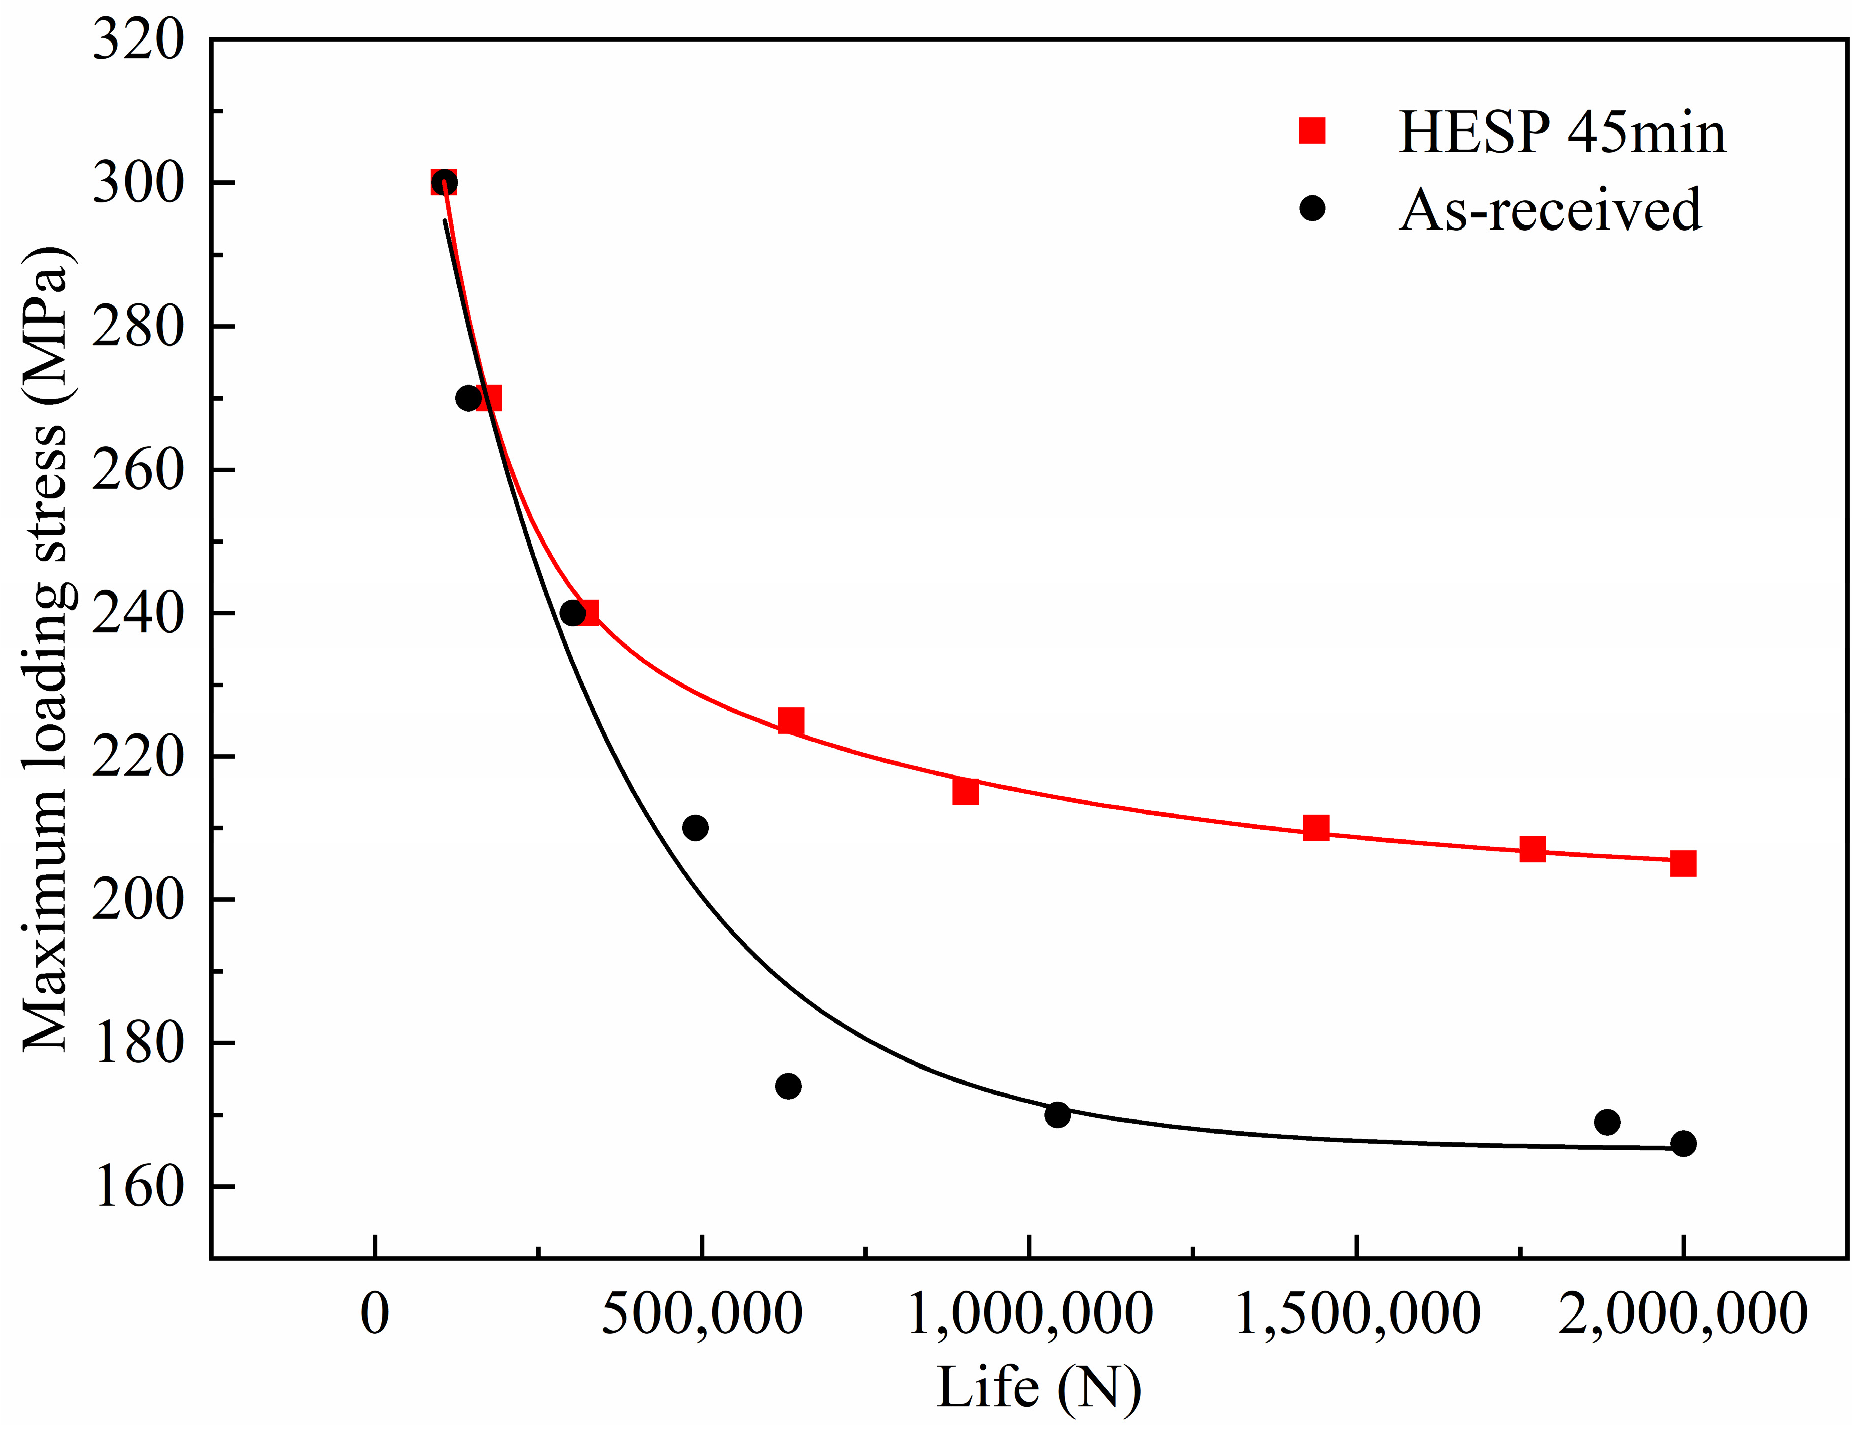
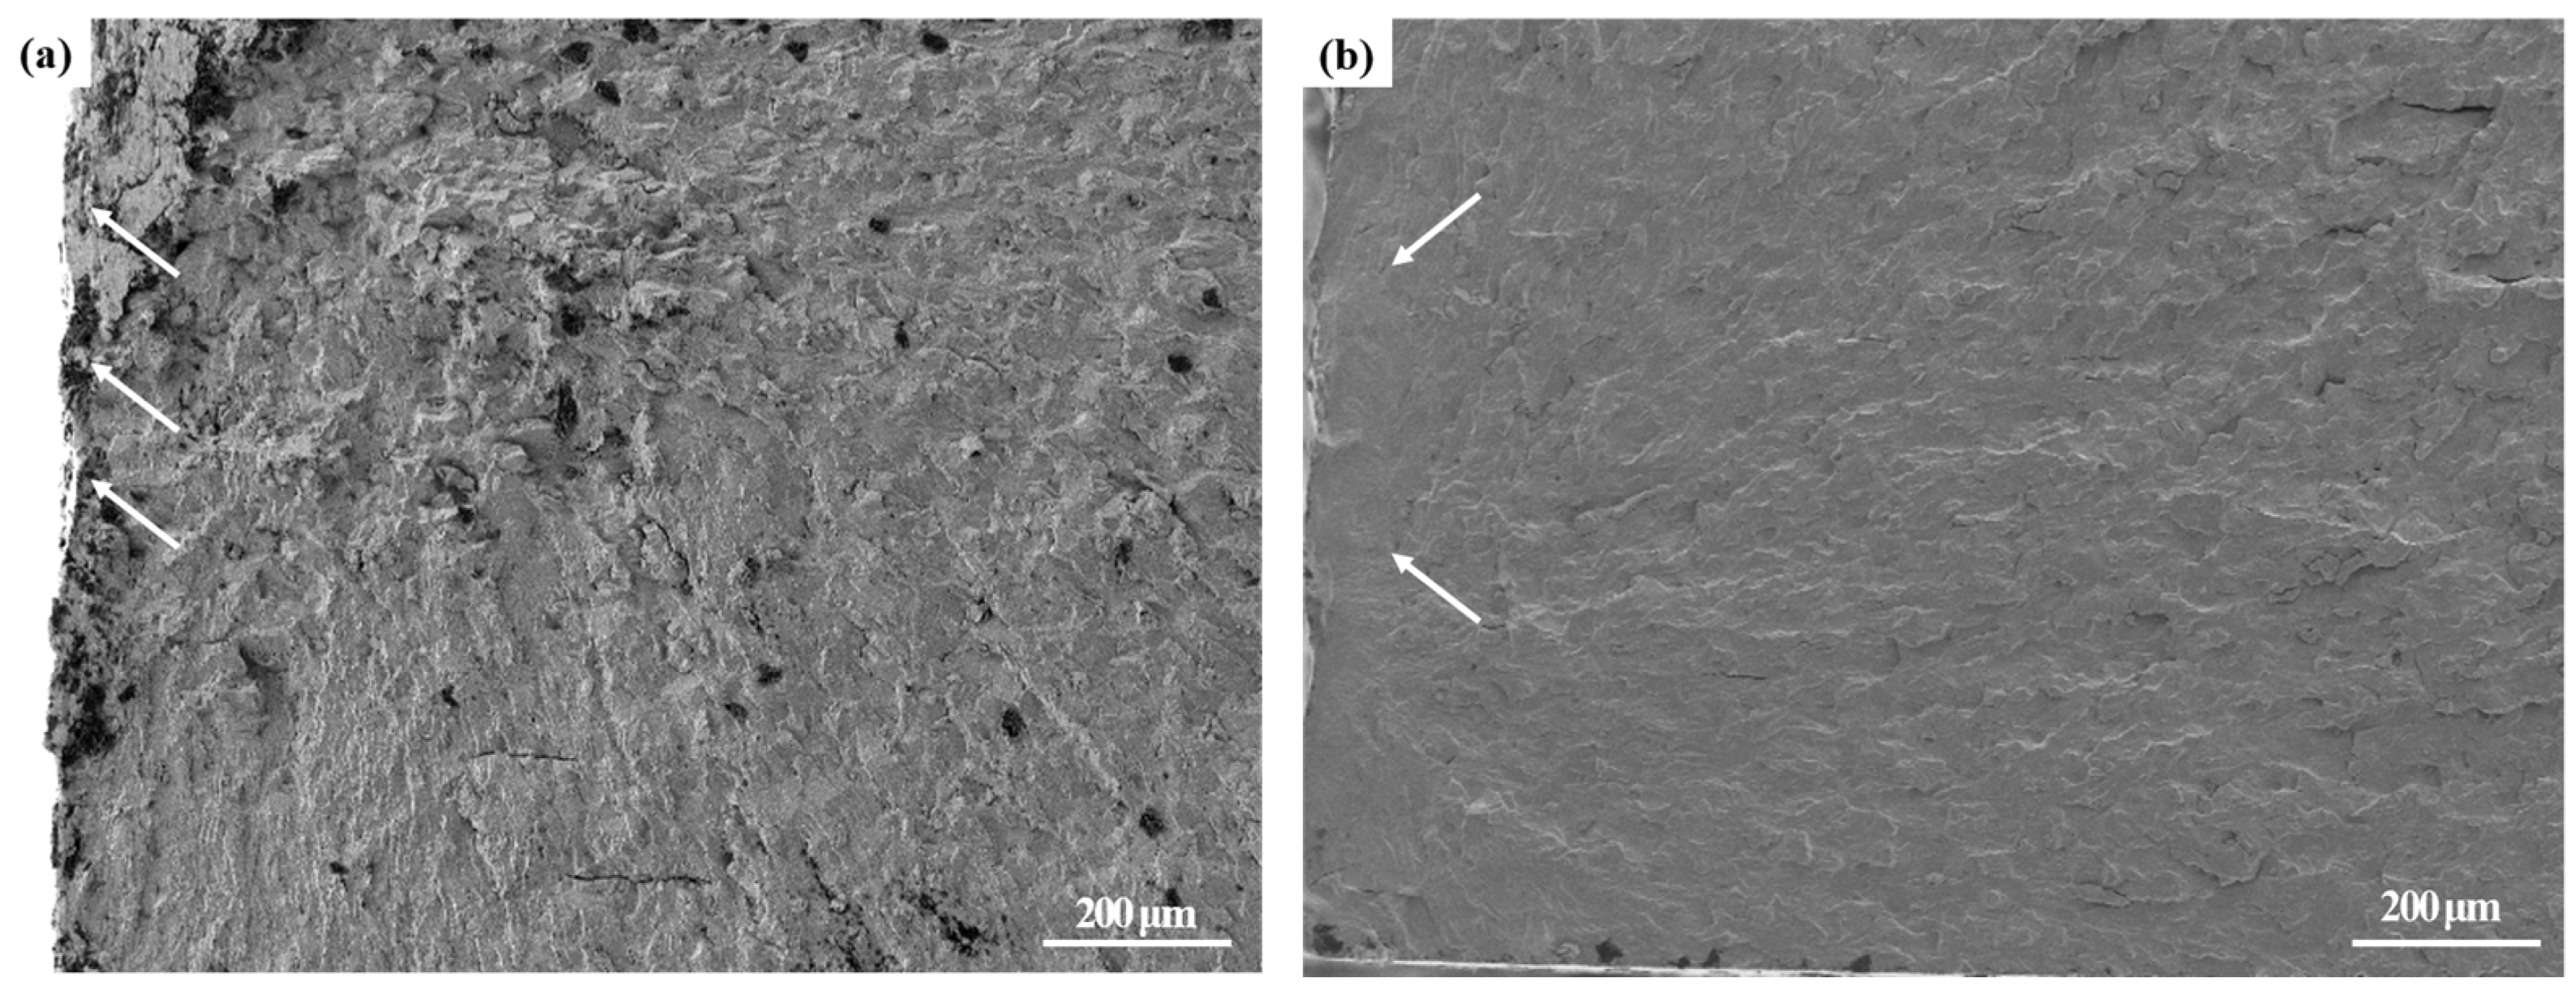
HESP treatment can significantly improve the fatigue strength of pure Zr. The fatigue limit of the HESPed is 205 MPa, which is 23% higher than that of the as-received. The crack origin of the HESPed is transferred to the subsurface layer.
(2)
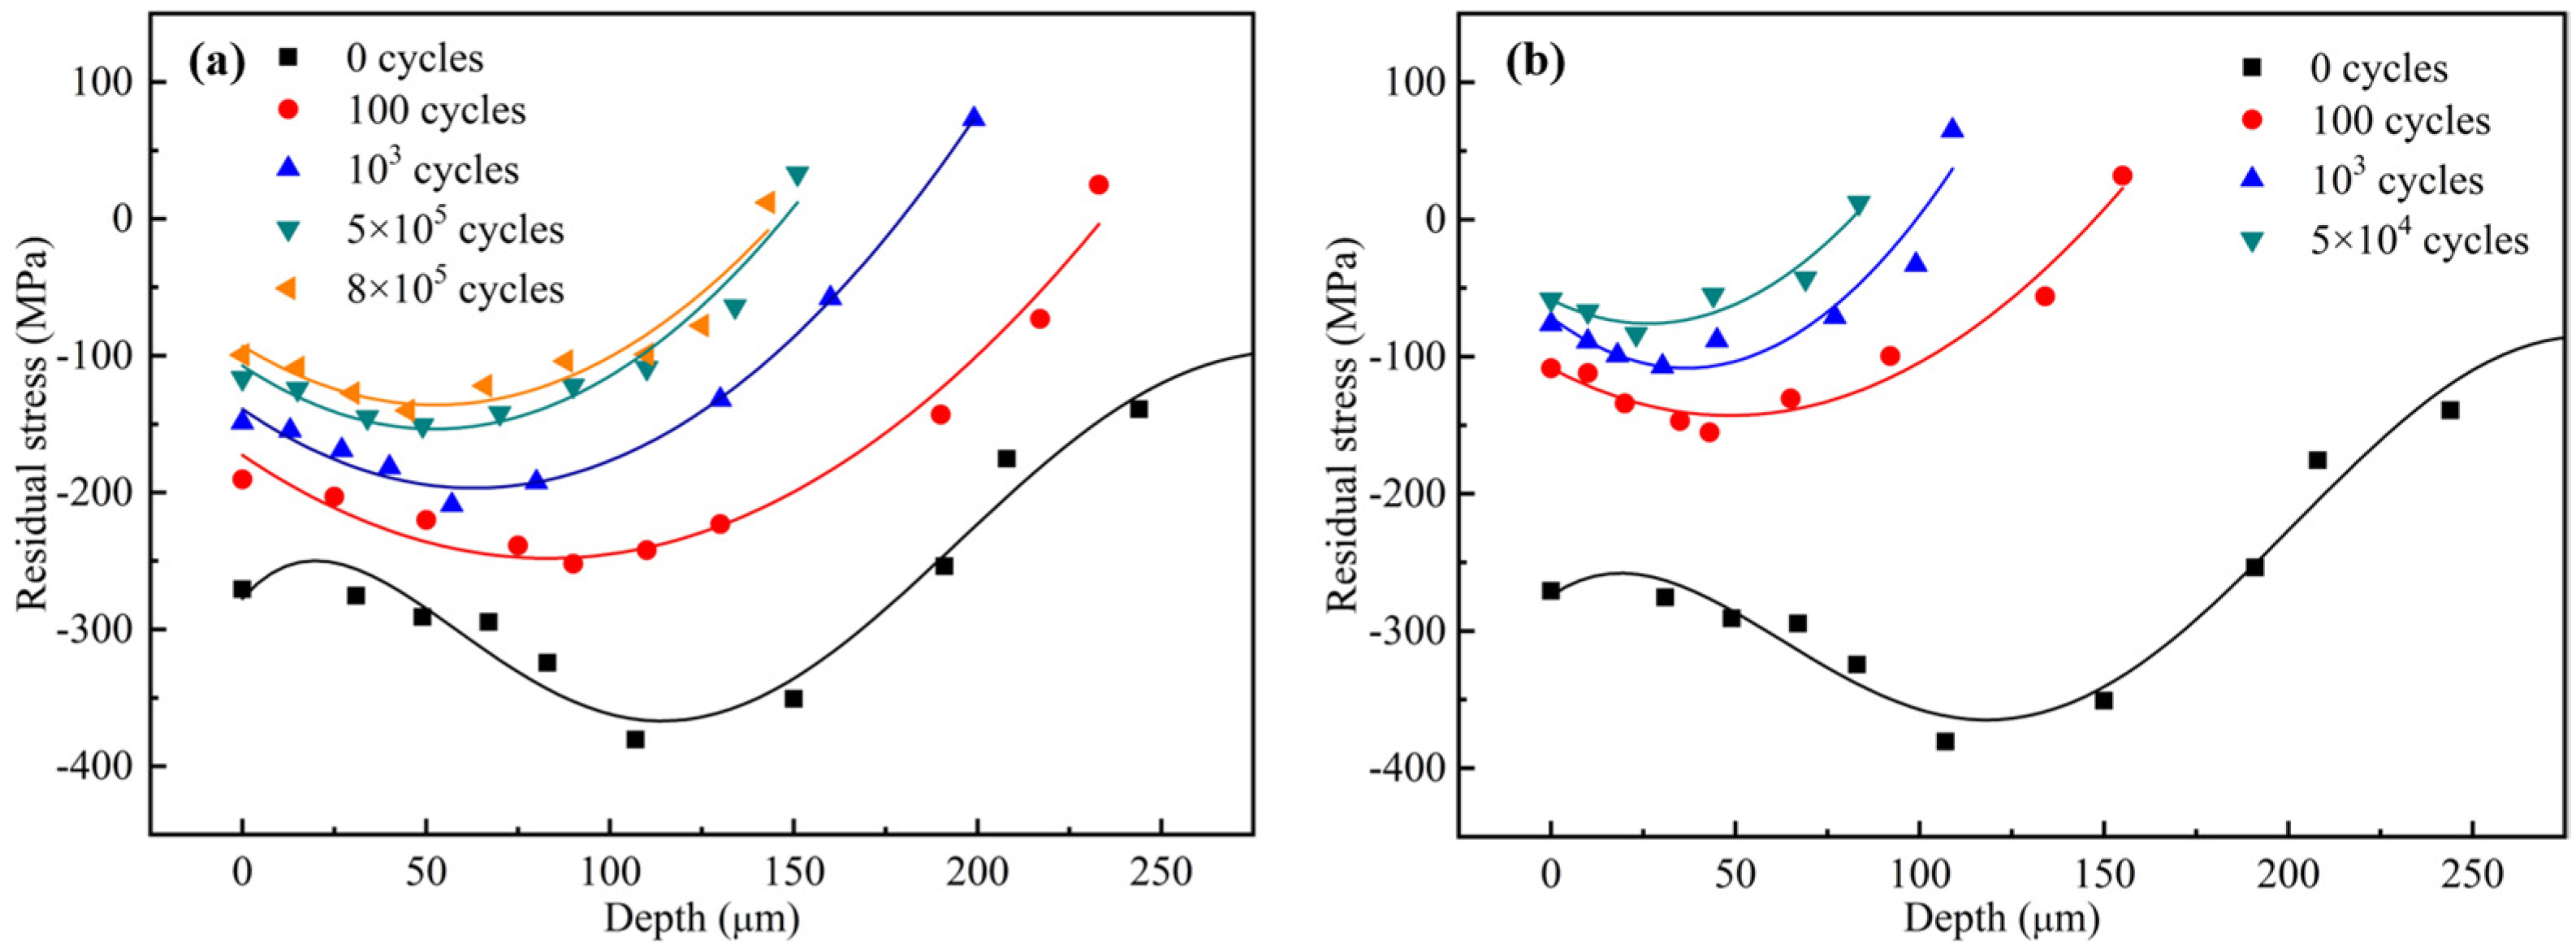
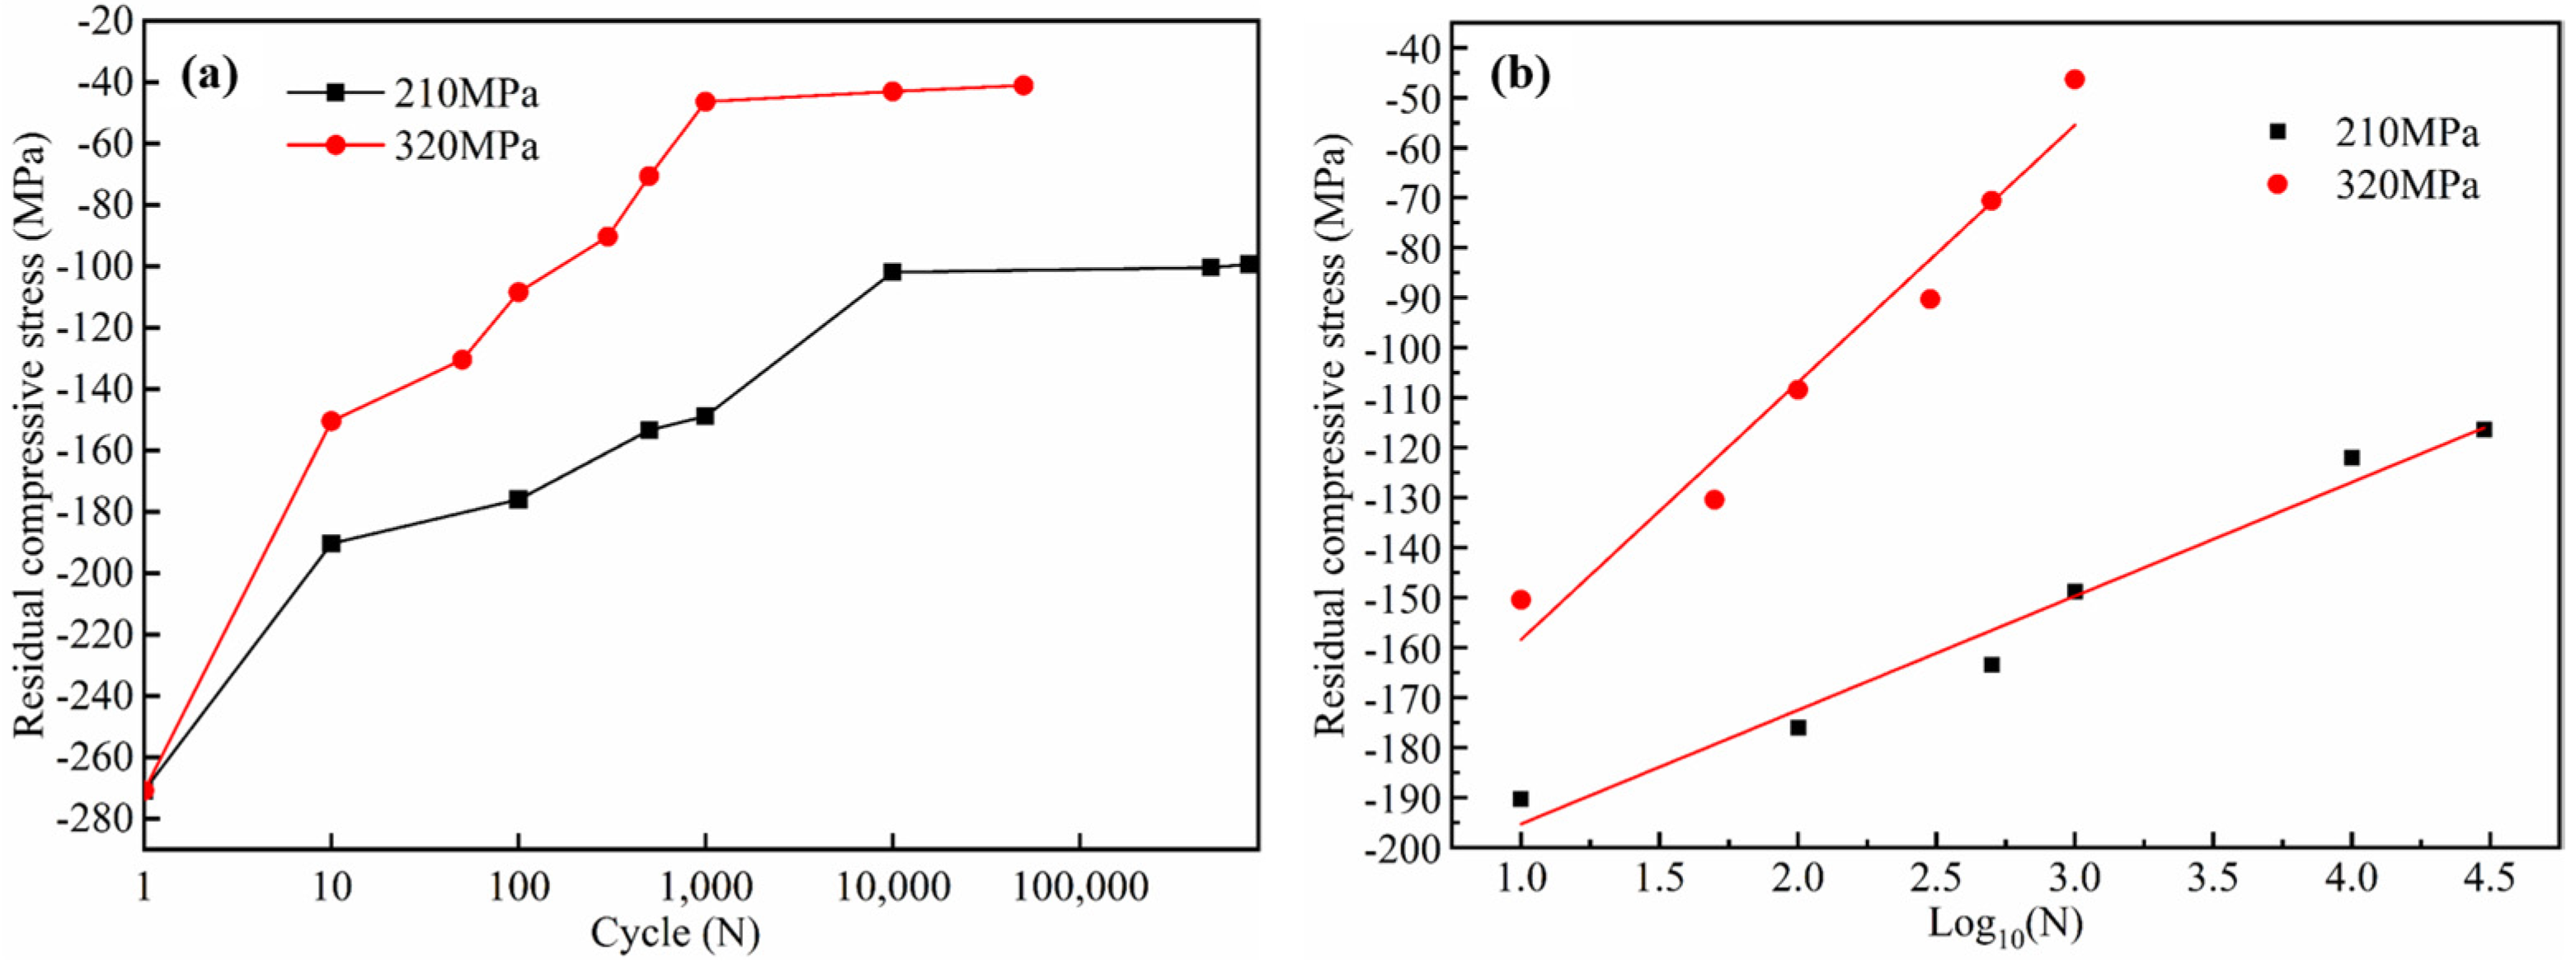
Most of the relaxation of residual stress occurs during the first 100 cycles. The greater the applied stress amplitude, the faster the residual stress is released. A linear correlation between the logarithm of the cycle numbers Log10(N) and the σsrs is established.
(3)
The surface nanocrystals coarsen and the dislocation density decreases during cyclic loading. The greater applied stress amplitudes, the faster the residual stress relaxation, and the more obvious nanocrystal coarsening and dislocation density reduction. Local plastic deformation causes grain coarsening and dislocation density reduction.

Author Contributions

G.X.: Data curation, Formal analysis, Investigation, Writing—original draft. X.Z.: Data curation, Formal analysis, undertaking all experiments, and data analysis. C.Z.: Formal analysis, participate in experimental design and results analysis. W.Z.: Conceptualization, Data curation, Formal analysis, Investigation, Supervision. Y.L.: Writing—review & editing. All authors have read and agreed to the published version of the manuscript.

Funding

This work is supported by the National Natural Science Foundation of China (Grant No.: 51674187), the National Natural Science Foundation of China (Grant No.: 51804241), the Open Research Fund from the State Key Laboratory of Rolling and Automation, Northeastern University (Grant No.: 2016004), the Key Laboratory Research Project of Shaanxi Provincial Department of Education (Grant No.: 17JS065), the Key Industry Chain (Group)-Industrial Field in Shaanxi Province (Grant No.: 2019ZDLGY05-03).

Institutional Review Board Statement

Not applicable.

Informed Consent Statement

Not applicable.

Data Availability Statement

Not applicable.

Conflicts of Interest

The authors declare no conflict of interest.

References

  1. Liu, E.; Zhang, X.; Chen, J.; Luan, B.; Liu, Q.; Li, Z.; Zhou, J. Study on the texture of Zr-Nb and Zr-Sn-Nb alloys. Rare Metal Mat. Eng. 2012, 41, 226–229. [Google Scholar]
  2. Zhang, C.; Yang, J.; Song, G.; Ren, H. Effect of ultrasonic shot peening on tensile-tensile fatigue properties of commercially pure zirconium. Rare Metal Mat. Eng. 2019, 48, 1954–1960. [Google Scholar]
  3. Wang, L.; Zhang, X.; Xue, X.; Wen, H.; Li, Z. Study on the microstructure and texture of zirconium alloy tube. Rare Metal Mat. Eng. 2013, 42, 153–157. [Google Scholar]
  4. Duan, Z.; Yang, H.; Satoh, Y.; Murakami, K.; Kano, S.; Zhao, Z.; Shen, J.; Abe, H. Current status of materials development of nuclear fuel cladding tubes for light water reactors. Nucl. Eng. Des. 2017, 316, 131–150. [Google Scholar] [CrossRef]
  5. Zhang, X.; Zhu, Y.; Ye, L.; Liu, Q.; Li, C.; Qiu, S.; Li, Z. Transmission electron microscopy observations on surface nanocrystallization of zircaloy-4. Rare Metal Mat. Eng. 2009, 38, 506–509. [Google Scholar]
  6. Unal, O.; Varol, R. Almen intensity effect on microstructure and mechanical properties of low carbon steel subjected to severe shot peening. Appl. Surf. Sci. 2014, 290, 40–47. [Google Scholar] [CrossRef]
  7. Wang, R.; Ru, J. Overall evaluation of the effect of residual stress induced by shot peening in the improvement of fatigue fracture resistance for metallic materials. Chin. J. Mech. Eng. 2015, 28, 416–421. [Google Scholar] [CrossRef]
  8. Tang, C.; Stueber, M.; Seifert, H.J.; Steinbrueck, M. Protective coatings on zirconium-based alloys as accident-tolerant fuel (ATF) claddings. Corros Rev. 2017, 35, 141–165. [Google Scholar] [CrossRef]
  9. Chai, L.; Chen, B.; Wang, S.; Zhang, Z.; Murty, K.L. Microstructural, textural and hardness evolution of commercially pure Zr surface-treated by high current pulsed electron beam. Appl. Surf. Sci. 2016, 390, 430–434. [Google Scholar] [CrossRef]
  10. Zhang, D.; Bai, X.; Chen, B.; Liu, F.; Wu, Z. Microarc oxidation of Zircalloy-4. Rare Metal Mat. Eng. 2003, 32, 658–661. [Google Scholar]
  11. Bagherifard, S.; Ghelichi, R.; Guagliano, M. A numerical model of severe shot peening to predict the generation of a nanostructured surface layer of material. Surf. Coat. Tech. 2010, 204, 4081–4090. [Google Scholar] [CrossRef]
  12. Yang, X. Effect of Nanocrystallization in Surface Layer on Fatigue Strength TC4 Titanium Alloy by High Energy Shot Peening. Master’s Thesis, Dalian Jiaotong University, Dalian, China, 2009. (In Chinese). [Google Scholar]
  13. Liu, C.; Liu, D.; Zhang, X.; Liu, D.; Ma, A.; Ao, N.; Xu, X. Improving fatigue performance of Ti-6Al-4V alloy via ultrasonic surface rolling process. J. Mater. Sci. Technol. 2019, 35, 1555–1562. [Google Scholar] [CrossRef]
  14. Webster, G.; Ezeilo, A. Residual stress distributions and their influence on fatigue lifetimes. Int. J. Fatigue 2001, 23, 375–383. [Google Scholar] [CrossRef]
  15. Zhang, C.; Hu, K.; Zheng, M.; Zhu, W.; Song, G. Effect of surface nanocrystallization on fatigue properties of Ti-6Al-4V alloys with bimodal and lamellar structure. Mater. Sci. Eng. A 2021, 813, 141142. [Google Scholar] [CrossRef]
  16. Saalfeld, S.; Oevermann, T.; Niendorf, T.; Scholtes, B. Consequences of deep rolling on the fatigue behavior of steel SAE 1045 at high loading amplitudes. Int. J. Fatigue 2019, 118, 192–201. [Google Scholar] [CrossRef]
  17. Xie, L.; Wen, Y.; Zhan, K.; Wang, L.; Jiang, C.; Ji, V. Characterization on surface mechanical properties of Ti-6Al-4V after shot peening. J. Alloys Compd. 2016, 666, 65–70. [Google Scholar] [CrossRef]
  18. Kim, J.; Cheong, S.; Noguchi, H. Residual stress relaxation and low-and high-cycle fatigue behavior of shot-peened medium-carbon steel. Int. J. Fatigue 2013, 56, 114–122. [Google Scholar] [CrossRef]
  19. Maleki, E.; Farrahi, G.; Kashyzadeh, K.; Unal, O.; Gugaliano, M.; Bagherifard, S. Effects of conventional and severe shot peening on residual stress and fatigue strength of steel AISI 1060 and residual stress relaxation due to fatigue loading: Experimental and numerical simulation. Met. Mater. Int. 2021, 27, 2575–2591. [Google Scholar] [CrossRef]
  20. Williamson, G.; Hall, W. X-ray line broadening from filed aluminium and wolfram. Acta Metall. 1953, 1, 22–31. [Google Scholar] [CrossRef]
  21. Williamson, G.; Smallman, R. Dislocation densities in some annealed and cold-worked metals from measurements on the X-ray debye-scherrer spectrum. Philos Mag. 1956, 1, 34–46. [Google Scholar] [CrossRef]
  22. Dini, G.; Ueji, R.; Najafizadeh, A.; Monir-Vaghefi, M. Flow stress analysis of TWIP steel via the XRD measurement of dislocation density. Mater. Sci. Eng. A 2010, 527, 2759–2763. [Google Scholar] [CrossRef]
  23. Ni, S.; Wang, Y.; Liao, X.; Alhajeri, S.; Li, X.; Zhao, Y.; Lavernia, E.; Ringer, S.; Langdon, T.; Zhu, Y. Grain growth and dislocation density evolution in a nanocrystalline Ni-Fe alloy induced by high-pressure torsion. Scr. Mater. 2011, 64, 327–330. [Google Scholar] [CrossRef]
  24. Keijser, T.; Langford, J.; Mittemeijer, E.; Vogels, A. Use of the Voigt function in a single-line method for the analysis of X-ray diffraction line broadening. J. Appl. Crystallogr. 1982, 15, 308–314. [Google Scholar] [CrossRef]
  25. Wawszczak, R.; Baczmański, A.; Marciszko, M.; Wróbel, M.; Czeppe, T.; Sztwiertnia, K.; Braham, C.; Berent, K. Evolution of microstructure and residual stress during annealing of austenitic and ferritic steels. Mater. Charact. 2016, 112, 238–251. [Google Scholar] [CrossRef] [Green Version]
  26. Zhang, X.; Liu, D.; Tan, H.; Wang, X. Effect of TiN/Ti composite coating and shot peening on fretting fatigue behavior of TC17 alloy at 350 °C. Surf. Coat. Tech. 2009, 203, 2315–2321. [Google Scholar] [CrossRef]
  27. Mahmoudi, A.; Ghasemi, A.; Farrahi, G.; Sherafatnia, K. A comprehensive experimental and numerical study on redistribution of residual stresses by shot peening. Mater Design. 2016, 90, 478–487. [Google Scholar] [CrossRef]
  28. Gao, Y. Residual compressive stress field in TC18 ultra-high strength titanium alloy by shot peening. Rare Metal Mat. Eng. 2004, 33, 1209–1212. [Google Scholar]
  29. Meng, X.; Zhou, J.; Su, C.; Huang, S.; Luo, K.; Sheng, J.; Tan, W. Residual stress relaxation and its effects on the fatigue properties of Ti6Al4V alloy strengthened by warm laser peening. Mater. Sci. Eng. A 2017, 680, 297–304. [Google Scholar] [CrossRef]
  30. Wick, A.; Schulze, V.; Vöhringer, O. Effects of warm peening on fatigue life and relaxation behavior of residual stresses in AISI 4140 steel. Mater. Sci. Eng. A 2000, 293, 191–197. [Google Scholar] [CrossRef]
  31. Ma, Q.; Huang, C. Fracture surface analysis of high-cycle fatigue for Ti-55531 alloy. Chin. J. Nonferrous Met. 2018, 28, 2467–2475. [Google Scholar]
  32. Wang, Y.; Yuan, L.; Zhang, S.; Sun, C.; Wang, W.; Yang, G.; Li, Q.; Wei, Y. The influence of combined gradient structure with residual stress on crack-growth behavior in medium carbon steel. Eng. Fract. Mech. 2019, 209, 369–381. [Google Scholar] [CrossRef] [Green Version]
  33. Meirom, R.; Alsem, D.; Romasco, A.; Clark, T.; Polcawich, R.; Pulskamp, J.; Dubey, M.; Ritchie, R.; Muhlstein, C. Fatigue-induced grain coarsening in nanocrystalline platinum films. Acta Mater. 2011, 59, 1141–1149. [Google Scholar] [CrossRef] [Green Version]
  34. Long, J.; Pan, Q.; Tao, N.; Lu, L. Abnormal grain coarsening in cyclically deformed gradient nanograined Cu. Scr. Mater. 2018, 145, 99–103. [Google Scholar] [CrossRef]
  35. Jia, Y.; Liu, Y.; Huang, J.; Fu, Y.; Zhang, X.; Xin, Y.; Tu, S.; Mao, M.; Yang, F. Fatigue-induced evolution of nanograins and residual stress in the nanostructured surface layer of Ti-6Al-4V. Mater. Sci. Eng. A 2019, 764, 138205. [Google Scholar] [CrossRef]
  36. Zhang, C.; Wang, Y.; Wang, Y.; Li, F.; Xiao, G. Effects of cyclic loading on residual stress field in TC4 after USSP treatment. Rare Metal Mat. Eng. 2016, 45, 2642–2646. [Google Scholar]
Figure 1. Schematic illustration of HESP process.
Coatings 12 00131 g001
Figure 2. Dimensions of the tensile fatigue test sample (mm).
Coatings 12 00131 g002
Figure 3. Inverse pole figure images of (a) as-received; (b) HESPed.
Coatings 12 00131 g003
Figure 4. XRD patterns of as-received and HESPed.
Coatings 12 00131 g004
Figure 5. TEM image of the surface nanocrystalline layer of the HESPed sample.
Coatings 12 00131 g005
Figure 6. Residual stress profile of the HESPed in different depth.
Coatings 12 00131 g006
Figure 7. Residual stress profile of the HESPed in different depth.
Coatings 12 00131 g007
Figure 8. Fatigue fracture morphology of samples. (a) as-received; (b) HESPed.
Coatings 12 00131 g008
Figure 9. RSF distribution of HESPed sample under different cycles and different stress amplitudes in tensile fatigue tests: (a) 210 MPa; (b) 320 MPa.
Coatings 12 00131 g009
Figure 10. Residual stress at the surface vs. number of cycles at different stress amplitudes: (a) normal cycles; (b) logarithm of cycles.
Coatings 12 00131 g010
Figure 11. Fatigue striation of the specimens in crack growth stage under different stress amplitudes: (a) as-received under 210 MPa; (b) HESPed under 210 MPa; (c) as-received under 320 MPa; (d) HESPed under 320 MPa.
Coatings 12 00131 g011
Figure 12. Residual stress and grain size variation with cycle numbers under different stress amplitudes: (a) 210 MPa; (b) 320 MPa.
Coatings 12 00131 g012
Figure 13. Distributions of dislocation density as a function of depth from the top surface under different cycle numbers: (a) 10 MPa; (b) 320 MPa.
Coatings 12 00131 g013
Table 1. RSF characteristic parameters under different stress amplitudes in tensile fatigue tests.
Stress, MPaCycleσsrs, MPaσmrs, MPaZm, μmZ0, μm
2100−270.8−375.6112330
100−190.3−257.880235
103−148.8−199.065175
5 × 10⁵−100.4−139.855148
8 × 10⁵−99.3−123.649130
3200−270.8−375.6112330
100−108.4−115.065149
103−46.2−107.14899
5 × 10⁴−41.4−85.33549
Publisher’s Note: MDPI stays neutral with regard to jurisdictional claims in published maps and institutional affiliations.

