Article

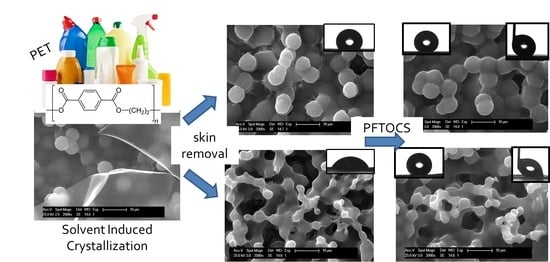
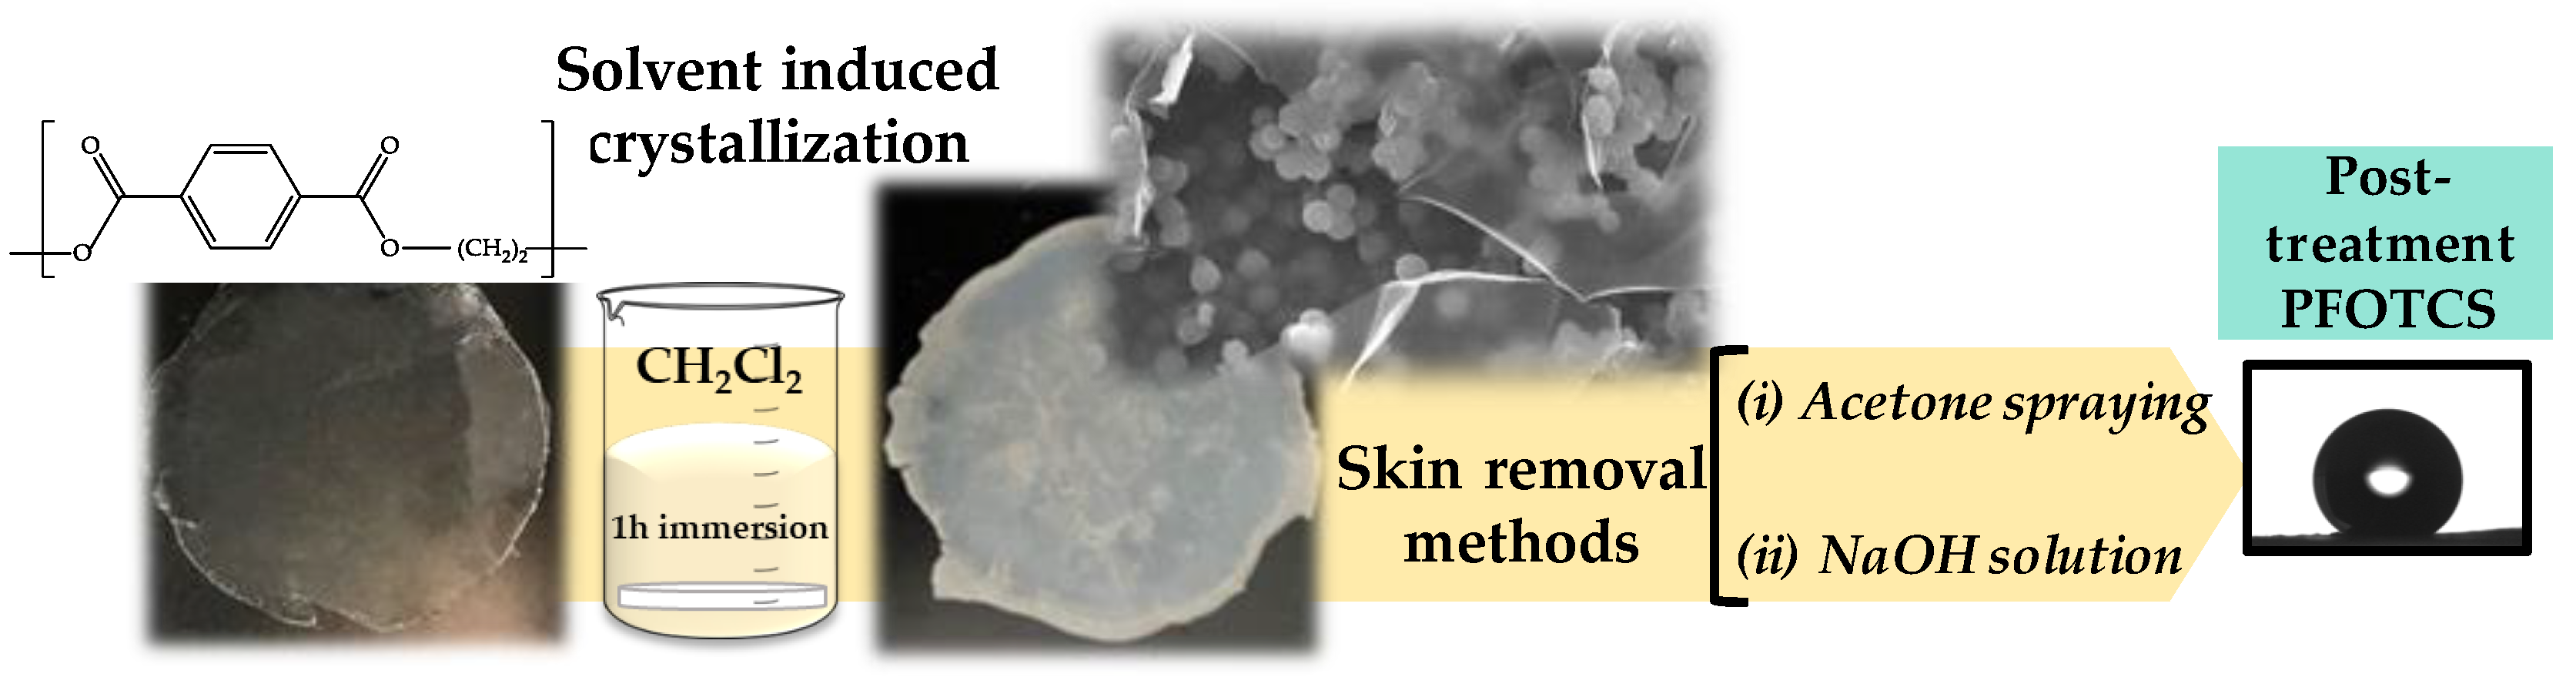
Facile Preparation of Hydrophobic PET Surfaces by Solvent Induced Crystallization

HEMPOL Group, Instituto de Ciencia y Tecnología de Polímeros, Spanish National Research Council (ICTP-CSIC) Calle Juan de la Cierva, 3, 28006 Madrid, Spain
*
Author to whom correspondence should be addressed.
Coatings 2022, 12(2), 137; https://doi.org/10.3390/coatings12020137
Submission received: 22 December 2021 / Revised: 14 January 2022 / Accepted: 17 January 2022 / Published: 24 January 2022
(This article belongs to the Special Issue Superhydrophobic and Superoleophobic Surfaces)

Abstract

:
In this work, Polyethylene terephthalate (PET), one of the most widely consumed polymers, has been used as starting material for the development of non-stick surfaces through a fast, simple and scalable method based on solvent-induced crystallization to generate roughness, followed by a fluorination step. Several solvents were tested, among which dichloromethane was chosen because it gives rise to the formation of a particulate layer with rough topography. This particulate layer was covered by a polymer thin and smooth skin that must be removed to leave the rough layer as surface. The skin has been successfully removed by two strategies based on mechanical and chemical removal, each strategy producing different surface properties. A final treatment with a diluted solution of a fluorinated silane showed that it is possible to obtain PET surfaces with a water contact angle higher than 150° and low water adhesion. The reason behind this behavior is the development of a hierarchical rough profile during the induced polymer crystallization process. These surfaces were characterized by XRD, FTIR and DSC to monitor solvent induced crystallization. Topography was studied by SEM and optical profilometry. Wetting behavior was studied by measuring the contact angles and hysteresis.

Graphical Abstract

1. Introduction

Surface modification of polymer materials is an appealing strategy to manage desirable functionalities, such as water repellency, antiicing, antifogging, antifouling, anticorrosion, and friction reduction, among others [1,2,3,4,5,6]. Surface treatments usually imply either topography or chemical alteration or a combination of both. Several approaches based on bottom-up and top-down methods have been used to develop rough surfaces, whereas chemical modification is commonly done by fluorination and plasma treatments. The most widely known lotus leaf profile to achieve hydrophobicity is based on hierarchical rough structures on the micrometric and nanometric scales. In this sense, one of the most popular strategies is the application of particle coatings, specifically modified silica nanoparticles or all-organic particles [7]. However, in the search of sustainability and scalability, efforts must focus on fabricating mono-materials with inherent non-stick properties as a replacement of added top-layer coatings. In addition, choosing starting materials highly available such as polymers makes sense not only because of the versatility of these materials in terms of properties, but also because the development of non-stick properties in polymeric surfaces fosters the adaptation of these materials to the circular economy objectives. In fact, controlling wetting properties helps optimizing the use of resources and simplifies the rinsing stage previous to recycling by making surfaces self-cleaning.
In this work, Polyethylene terephthalate (PET) films were used as starting material. PET is an extensively used polymer, particularly in packaging and textiles, involving 63% of the plastic used in the European Union [8]. Whereas a wide variety of polymer materials either as particles or films have been used to prepare hydrophobic surfaces [9], PET has rarely been considered probably because of its rather hydrophilic chemical nature. The oldest works found in the literature used PET as a mere substrate for testing technologies to modify the surface of materials. For example, Kim et al. [10] used plasma source ion implantation technique with CF4 gas on PET films reaching a water contact angle, θw, of 118° at most. More recently, Gotoh et al. [11] also used plasma to modify the chemical nature and topography of PET films and, with a sequence of combined treatments, they achieved superhydrophobic surfaces, i.e., θw higher than 150° and hysteresis lower than 10°. Although effective, these treatments are usually limited to small surface areas and difficult to apply to mass-produced items. Moreover, a sequence of etching methods combining ion irradiation and chemical attack has been used by Korolkov et al. [12] to obtain PET membranes that exhibit a certain level of hydrophobicity, enough to produce good results in oil-water emulsion separation. Hot embossing is proposed as an alternative technique that is claimed to be adaptable to large-scale production but also at the microfabrication level [13]. This technique has been applied to PET films to build periodic microstructures that give rise to a significant augmentation of θw without modifying the surface chemistry [14]. Fu et al. [15] achieved PET surfaces showing θw up to 140° and a rose petal-like behavior, which means that these so-treated surfaces show high water adhesion and the water droplets do not roll down even turning the substrate upside down. This water behavior is known as parahydrophobicity and is also interesting for an ample number of applications, including membrane technologies and water harvest and conduction [16]. Another approach that does not rely on external coating and likely overcomes the shortcomings related to the application to large surfaces is the one proposed by Oh et al. [17,18]. These authors prepared superhydrophobic PET surfaces either on dense films or fabrics following a method that includes a first step of a chemical etching by oxygen plasma or NaOH hydrolysis followed by thermal aging. Superhydrophobicity is consequently achieved without any further hydrophobization step. This can be extremely useful with the only limitation of the long aging times (24 h in some cases) and the high dependency that has the crystallinity and, thus, molecular weight and dynamics, on the success of the process.
Recently, we proposed a methodology to prepare hydrophobic surfaces without any external coating and without fluorination or hydrophobization final step [19]. Our method consists of a two-step solvent treatment: swelling and coagulation. Firstly, the sample is immersed for a few seconds in a good solvent of the polymer that causes the swelling of the surface; immediately after, it is immersed into a non-solvent that quenches the swelled polymer morphology giving rise to porous surfaces. The topography can be tuned by varying the immersion times in each solvent. Based on this previous work, we adapted this method to PET surfaces to develop hydrophobic properties on a mono-material using our simple and scalable process. In this case, the crystalline behavior of PET is exploited and crystallization is induced by immersion in a solvent [20]. The aim of the immersion is to allow mobility on the polymer chains by decreasing the glass transition temperature, favoring crystallization while forming a structured morphology at a micrometric scale [21]. These solvent-induced methods have already been employed with other polymers [22,23] but as far as we know, they have not been applied to PET polymer to generate roughness. Finally, a fluorinated silane is used to enhance the hydrophobicity of the surface [24].

2. Materials and Methods

2.1. Materials

Polyethylene terephthalate (PET) bottle grade (intrinsic viscosity (IV) = 0.80 ± 0.02 dL g−1) in pellet form was provided by Caiba (Valencia, Spain). Solvents as dichloromethane (DCM), dimethylformamide (DMF), dimethyl sulfoxide (DMSO), dioxane, acetone and hexane from Sigma-Aldrich (Darmstadt, Germany) have been used without prior purification. An aqueous solution of 20 wt.% NaOH has also been used. For surface modification, a trichloro (1H, 1H, 2H, 2H-perfluorooctyl) silane (PFOTCS), 97% purity, Mw = 481.54 g·mol−1 provided by Sigma-Aldrich has been used.

2.2. Methods

PET films were prepared from pellets by hot compression using a Specac press and Upilex foils as separators at both sides. The material was first melted at 260 °C for 1 min and after that, 150 bar pressure was applied for 3 min. Circular films were obtained with 4 cm of diameter and 120–130 µm of thickness. Two different cooling programs were applied: a fast cooling process (Q-samples) and a controlled temperature process at a cooling rate of about 7/8 °C·min−1 (T-samples). Solvent treatments were performed to generate roughness by induced crystallization. Several solvents were tested to induce PET crystallization; the most suitable results were obtained by immersion in DCM for 1 h and room temperature drying. This treatment gives rise to a particulate topography that is covered by a thin polymer layer or skin, which must be removed to uncover the desirable rough surface. With this aim, a surface washing process was performed following two different protocols: (i) by spraying acetone under pressure or (ii) by immersion in a 20% NaOH solution for 15 min at 80 °C. Finally, the last step of surface fluorination by immersion in PFOTCS hexane solution for 20 min at room temperature was carried out. The concentration of the solution was 10 µL mL−1. Figure 1 summarizes the methodology followed in this work.

2.3. Characterization

Differential scanning calorimetric (DSC) measurements were carried out under dry nitrogen purge with a TA Instruments Q100 calorimeter (TA Instruments, New Castle, DE, USA). About 8 mg of sample were encapsulated in an aluminum pan. The DSC is recorded from room temperature to 280 °C at a rate of 10 °C·min−1.
ATR-FTIR spectra of the PET surfaces were obtained using an FTIR Perkin-Elmer Spectrum-One (PerkinElmer, Waltham, MA, USA), with 4 scans and 4 cm−1 resolution.
Wide-angle X-ray Diffraction (WAXD) patterns were registered in the reflection mode by using a Bruker D8 Advance diffractometer (Bruker Coorporation, Billerica, MA, USA) provided with a PSD Vantec detector. CuKα radiation (λ = 0.154 nm) was used, operating at 40 kV and 40 mA. A step-scanning mode was employed for the detector. The diffraction scans were collected with a 2θ step of 0.024° and 0.5 s per step.
The surface morphology and section of the films were visualized by scanning electron microscopy (SEM) using a Philips XL30 microscope (Philips, Amsterdam, The Netherlands) and a HITACHI S-8000 (Hitachi High-Tech Group, Tokyo, Japan). The samples were coated with a layer of gold-palladium alloy before imaging.
Apparent water contact angles (θw) were measured with Milli-Q grade water by the sessile drop method using a conventional drop shape analysis technique and using a Attension Theta optical tensiometer, (Biolin Scientific, Gothenburg, Sweden). The determination of the contact angle from the captured images is carried out by the Young—Laplace method. The initial water contact angle in static conditions with a 5 μL volume drop is considered to be θw. Reported θw values were the average of at least five measurements in different regions. Standard deviations are included. Water contact hysteresis (Δθw) was estimated by the difference between advancing and receding contact angles measured by dragging a 5-µL water droplet on the surface.
Optical profilometry was used to study the surface topography and to determine the surface roughness parameters by using a Zeta Instrument profilometer model Z-20 (KLA Company, Milpitas, CA, USA). The roughness parameters given in this work are mean values determined from at least 10 images at 50× (265 μm × 199 μm) recorded in each sample. Standard deviations are included. The parameter Sa is the arithmetic average height parameter and it is the most used for general characterization of the surface. Sq represents the standard deviation of the distribution of the surface heights. The parameters Spv corresponds to the maximum peak to valley difference. The average height of the 5 highest peaks and the 5 deepest peaks is taken with the Sz parameter. The kurtosis data, Sku, which gives an idea of the surface homogeneity is also included. This parameter measures the shape of distribution peaks, the value 3 being the one corresponding to a Gaussian distribution. The value of Ssk accounts for the symmetry of the profile on the midline; if the value is negative the roughness has an incoming character, while if it is positive the roughness is outgoing [25].

3. Results and Discussion

Solvent-induced crystallization is highly dependent on the morphology and the molecular weight of the polymer chains and the actual semicrystalline morphology of the surface. Solvent-induced crystallization requires starting samples that are not highly crystalline, for, in that case, there is little space for the tuning of the final crystallization. A survey with different solvents used in the literature to induce crystallization [21,26,27] was done to find the conditions under which topography is generated. In this work, we tested: DCM, DMF, DMSO, dioxane and acetone. With T-samples (slowly cooled from the melt and, thereby, more crystalline than those quenched Q-samples) no solvent was able to generate a rough structure on the surface. The same happened when recycled PET polymers were used instead of virgin PET. This issue can be explained in terms of polymer molecular weight, which is considerably lower for recycled PET [28], which makes the surface crystallinity well developed and higher in this PET grade. Attending to the SEM images shown in Figure S1 of the surfaces after 1 h of immersion of the PET Q-samples in the above-listed solvents, a rough surface is only achieved with DCM. Immersion in the rest of the solvents did not apparently modify the surface of the film or, at least, did not generate a rough profile suitable to give rise to a hydrophobic behavior. Therefore, the following experiments and measurements were done only on DCM treated surfaces.

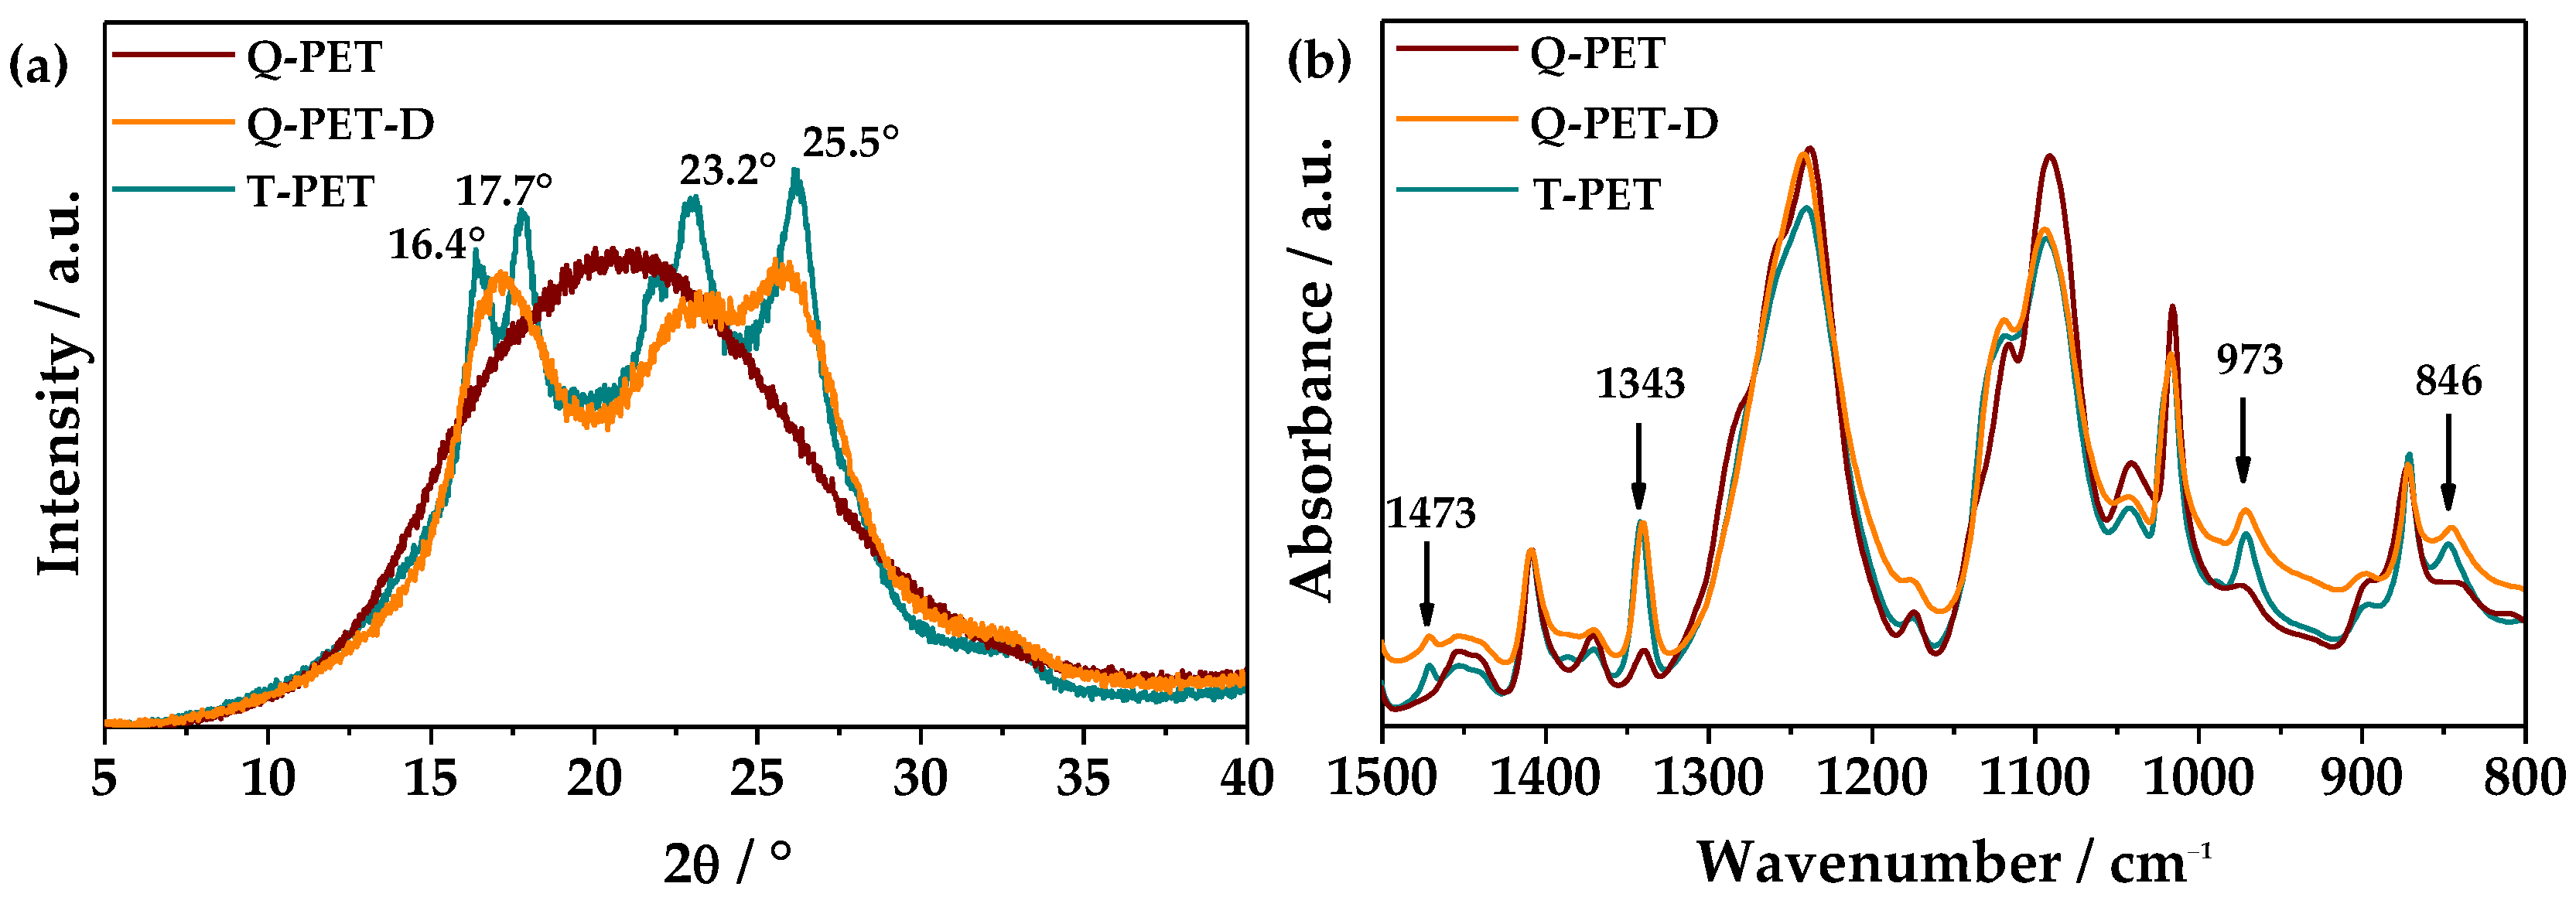
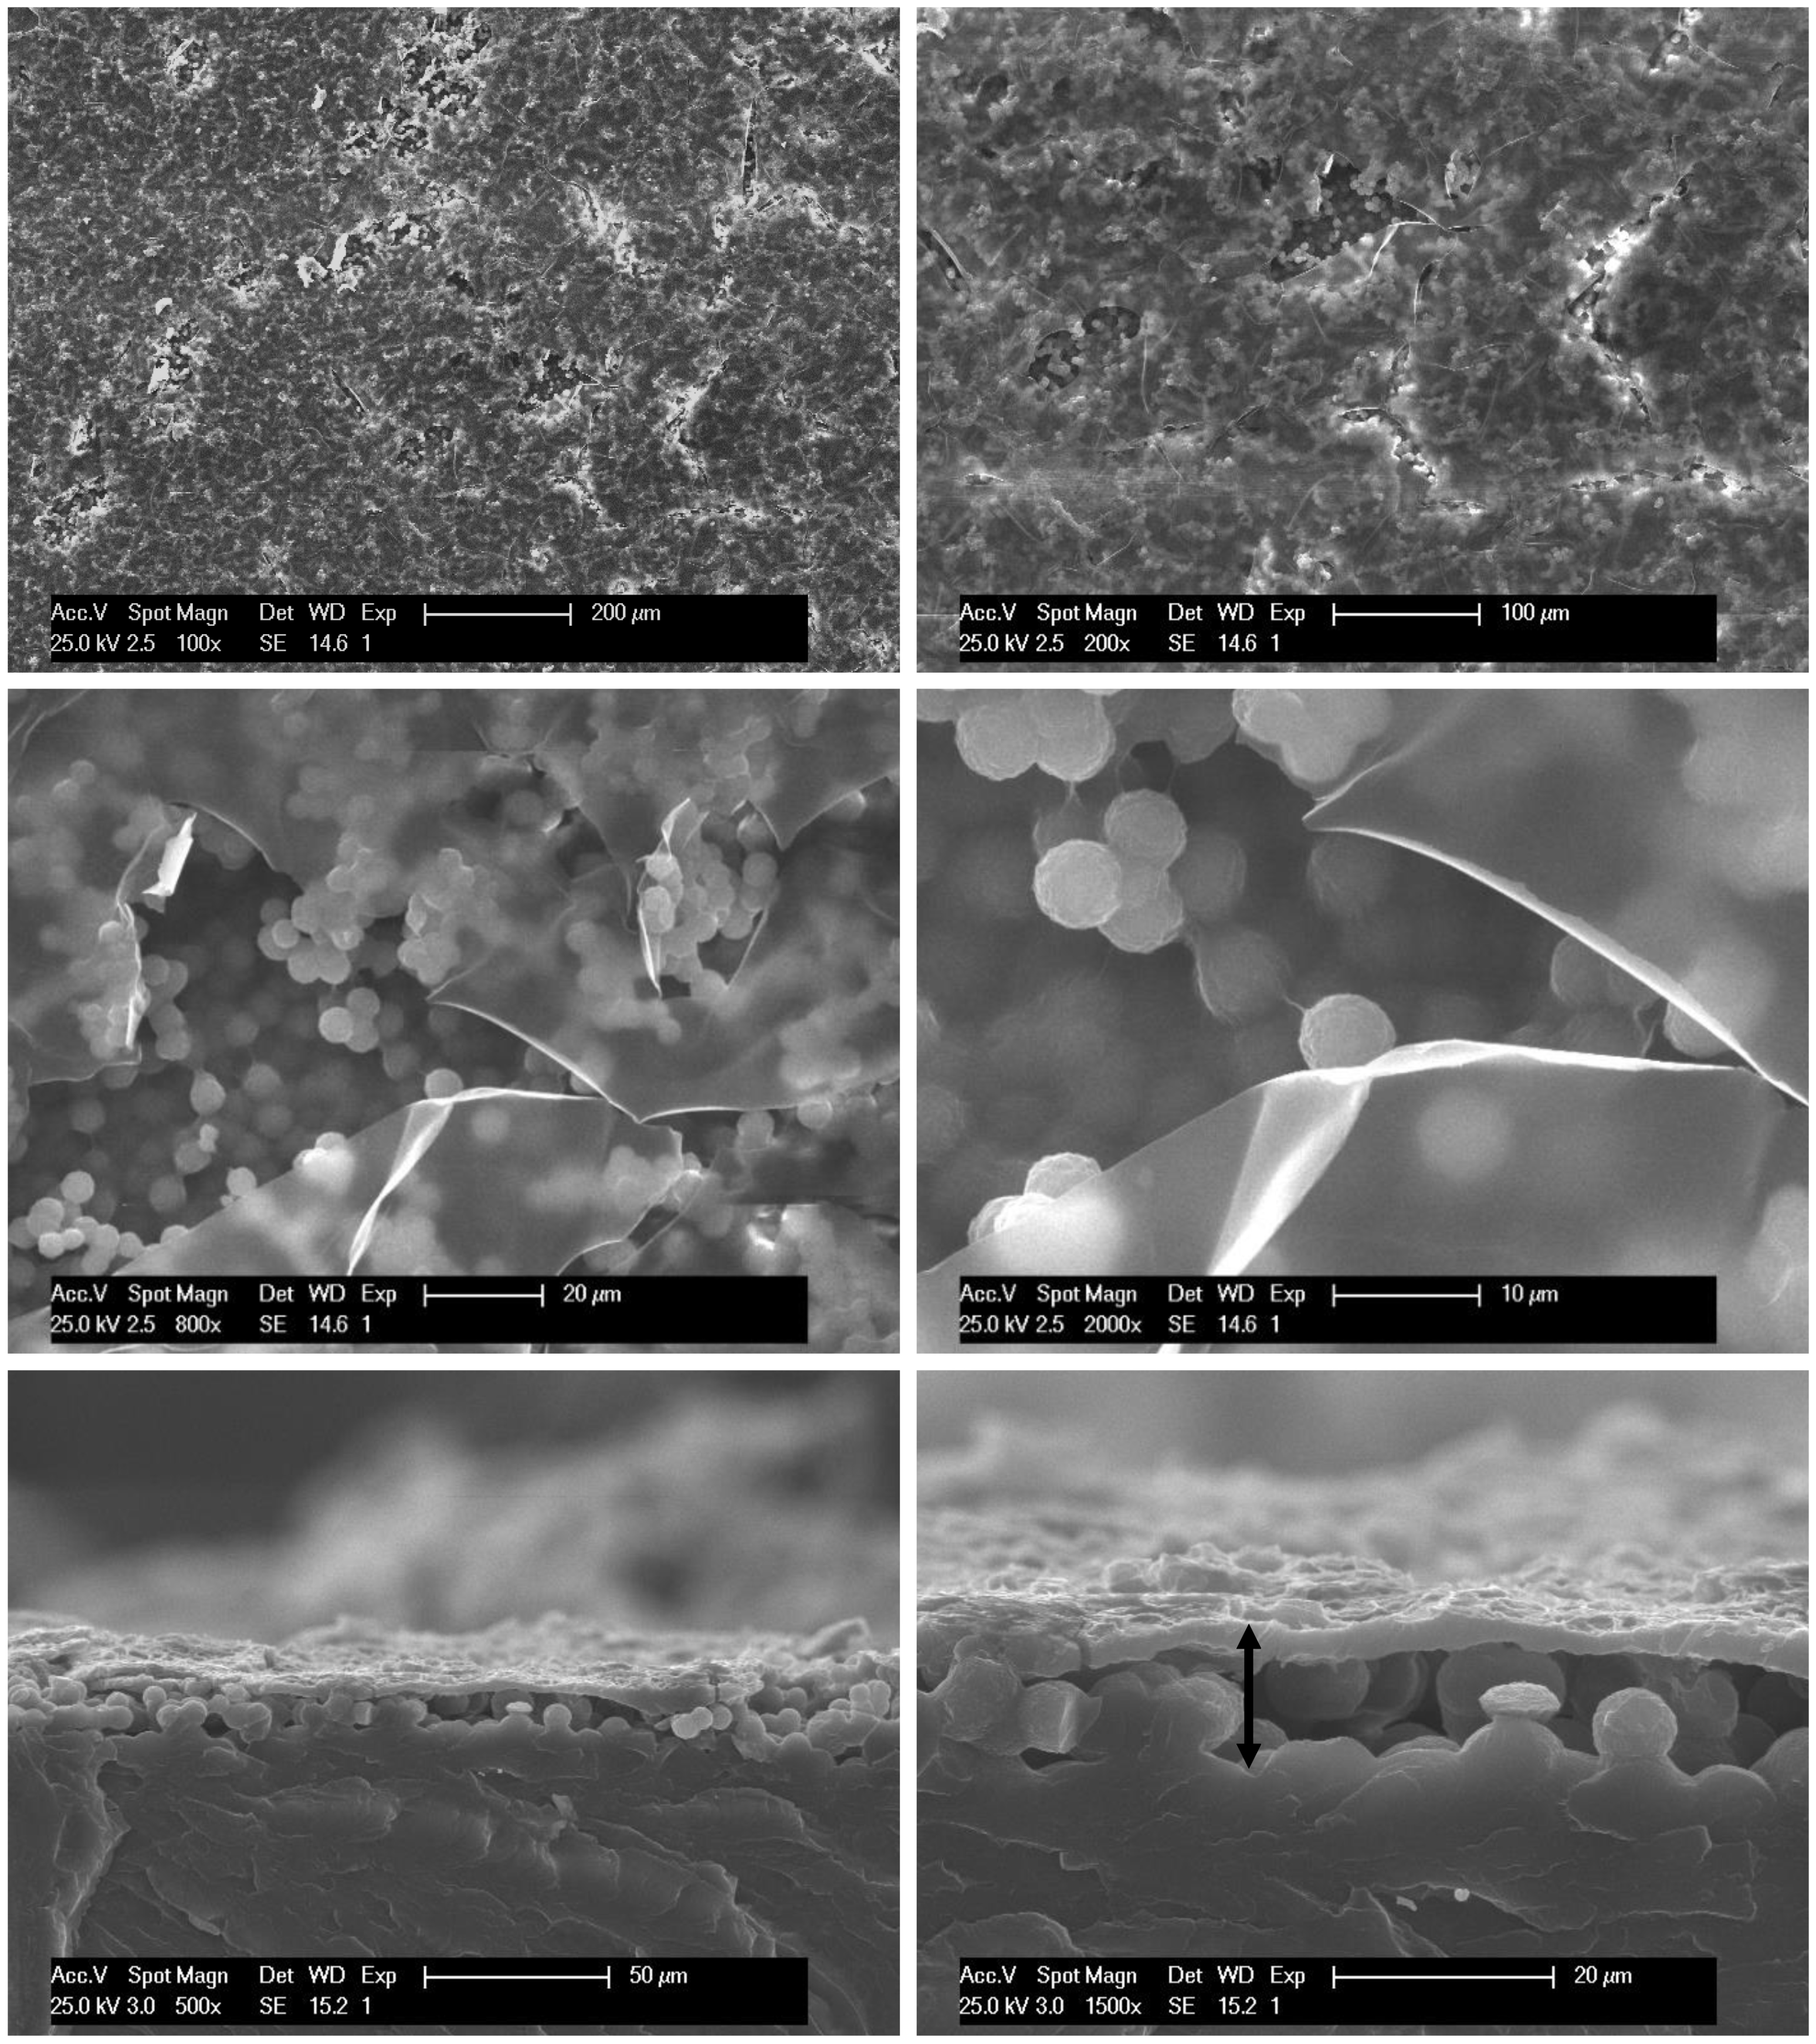
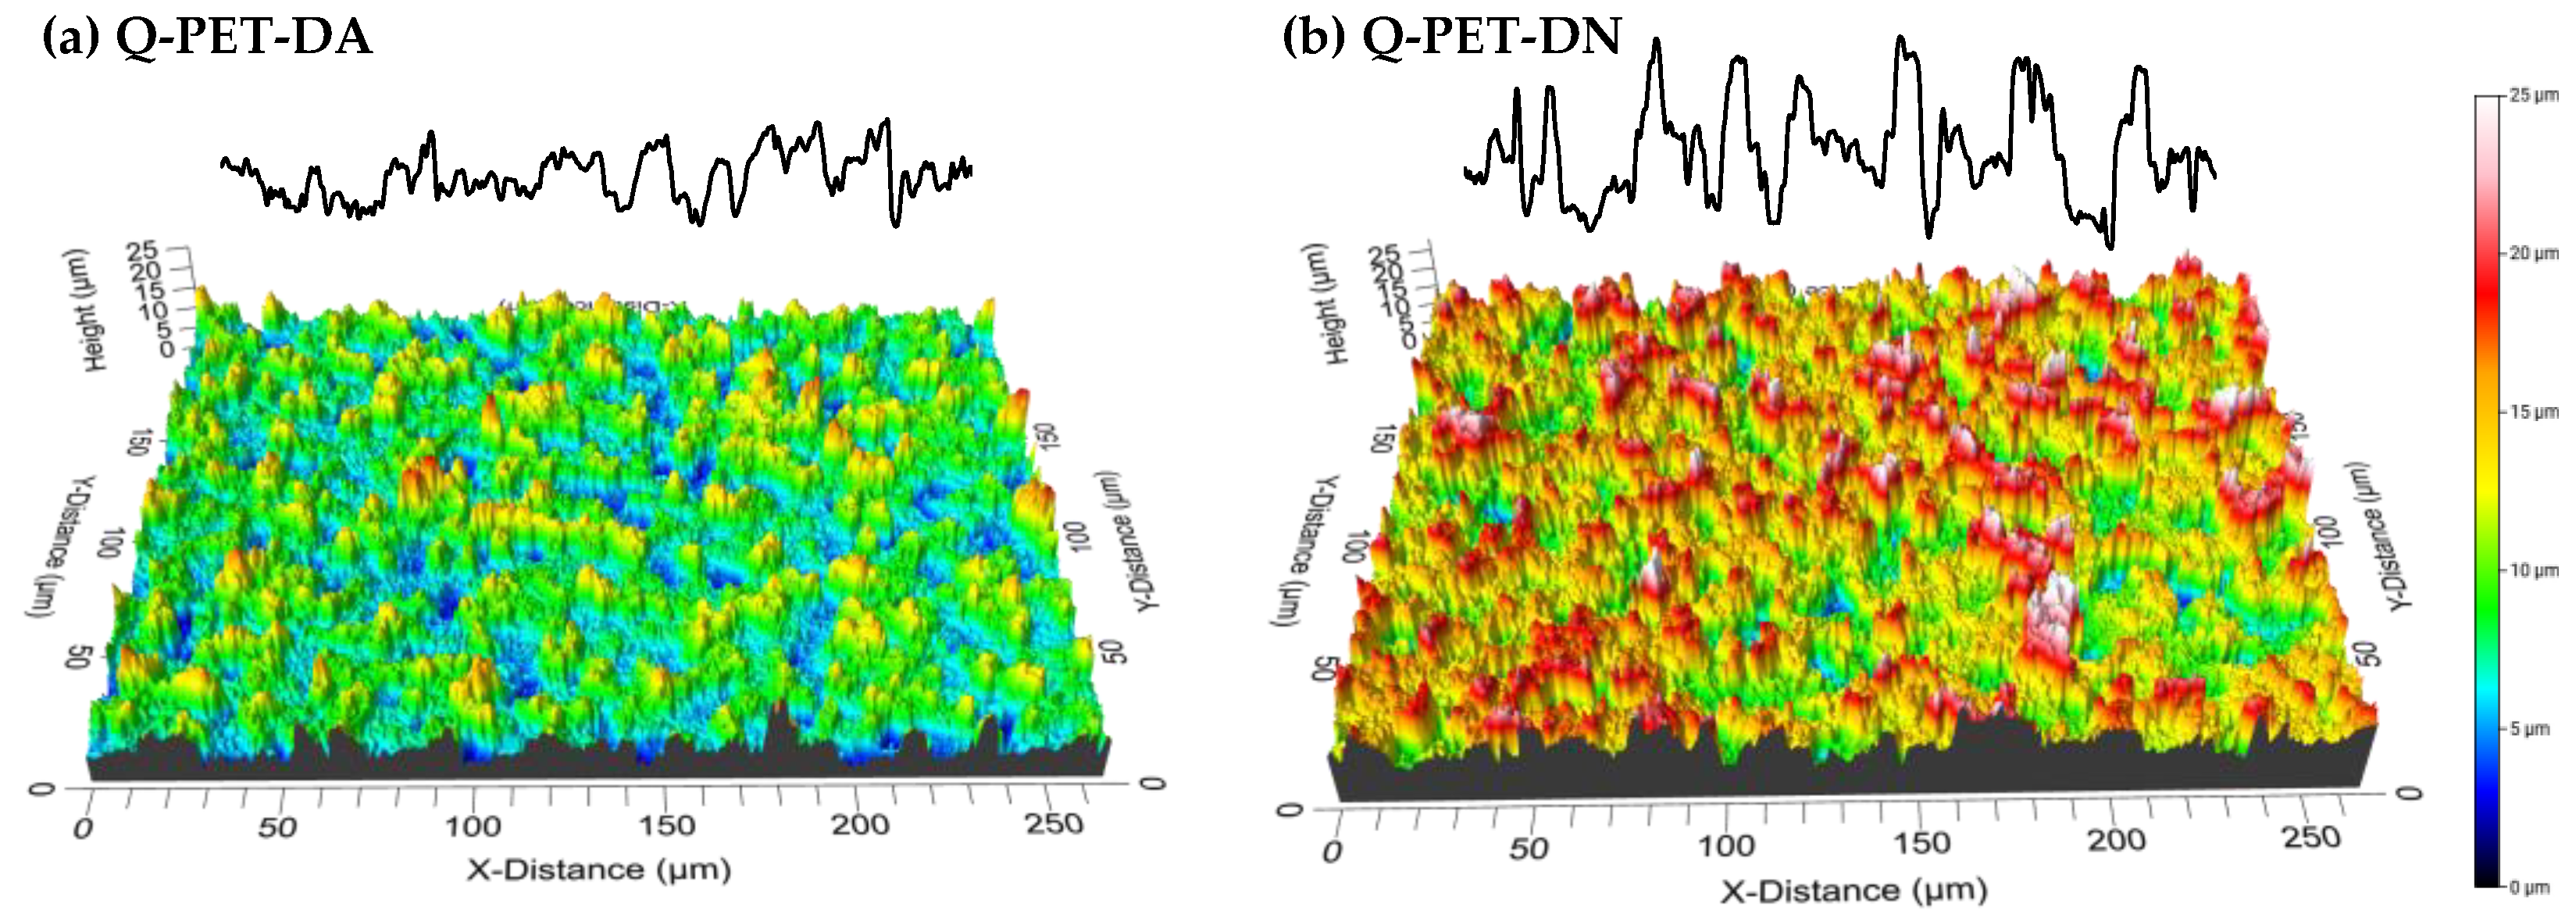
3.1. Roughness Generation by Solvent-Induced PET Crystallization

Figure 2 shows DSC heating curves of PET films before and after immersion in DCM, namely Q-PET and Q-PET-D, respectively. In addition, the sample prepared under slow cooling conditions to boost its crystallization, T-PET, was included to compare the thermal histories.
It is observed that fast cooled sample, Q-PET, displays a cold crystallization peak indicating that the sample crystallizes from the glass upon heating, as usually occurs when the polymer is quenched to an amorphous state [29]. In the T-PET, there was no cold crystallization peak because the film had already crystallized during the slow cooling processing. The cold crystallization is a known phenomenon in semicrystalline polymers that crystallize upon heating if they come from a quenched amorphous state. The quenched amorphous structure from fast-cooled films becomes sufficiently mobile above the glass transition and crystallization occurs. This process occurs because the polymer has been quenched. If the polymer has been left to crystallize, this cold crystallization is not seen, since the polymer is already crystalline. Attending to the DSC trace of the treated sample Q-PET-D, there was no cold crystallization peak, which means that the sample crystallizes during the dichloromethane immersion treatment. In addition, a significant opacification of the film is observed as shown in Figure S2 which also indicates that the sample has crystallized.
Thermal transition enthalpies, cold crystallization (ΔHcc) and melting (ΔHm), calculated by the area above the peaks are listed in Table 1. Crystallinity, Xc, i.e., the crystallinity of the films after the processing and the solvent treatment, was calculated by Equation (1) taking into account the area of the melting endotherms and considering ΔH100 the melting enthalpy of a fully crystalline PET (140 J·g−1) [28].
Xc = 100 × (ΔHm − ΔHcc)/ΔH100
Data in the table indicate that, under Q-processing conditions, the PET film was almost amorphous, whereas, after the solvent treatment, it showed an X cover of a film processed under T-conditions, which is significantly crystalline.
The solvent-induced crystallization is also confirmed by X-ray diffraction and infrared spectroscopy as is shown in Figure 3.
X-ray diffractions display in Figure 3a shows that, as expected, Q-PET does not exhibit diffraction peaks corresponding to crystalline entities, but only the amorphous halo, whereas T-PET shows the characteristic diffractions of crystalline PET [30] located at 16.4°, 17.1°; 23.2° and 25.5°. After the solvent treatment with DCM, Q-PET-D also showed these diffractions, although less defined, probably due to the scattering produced by the rough surface.
Furthermore, the ATR-FTIR spectra of the samples appear in Figure 3b. The T-PET has the characteristic bands of crystallized PET associated with the trans conformation at 1473, 1343, 973 and 846 cm−1 (marked with arrows in the graph). Accordingly, Q-PET-D also displayed these bands, which are missing or less intense in amorphous Q-PET, confirming again the crystallization of PET induced by the immersion in DCM [31,32]. The lower quality of the Q-PET-D spectrum compared to the other two samples also suggests the roughness of the surface.
SEM micrographs of the Q-PET-D surface after immersion in DCM are included in Figure 4.
SEM images of the sample after 1-h immersion in DCM show the occurrence of a particulate structure on the surface. Particles have a homogeneous size of 5–10 µm and are distributed all along the film surface. These particles do not have a smooth surface; instead, a submicrometer roughness is suspected at the highest magnifications. Attending to the section images, it can be concluded that such particle layer has a thickness of about 8–12 µm, whereas the rest of the film remains dense. Interestingly, this particle layer is covered by a thin and continuous layer that is cracked at some points, showing the particles below. The origin of this layer has not been explained yet. A hypothesis is that short and mobile chains diffuse out of the particulate structure and form this skin. In any case, the efforts at this point focused on removing that skin layer in order to leave the particle layer fully exposed.
For the removal of this continuous skin, two procedures were tried. On the one hand, the skin was mechanically removed by pushing it away with acetone spraying at room temperature. This procedure will be named as A in what follows. It is worth mentioning that air spraying was unsuccessfully attempted. On the other hand, the PET skin was dissolved by immersion in a 20% NaOH solution (procedure N). This last treatment might produce a hydrolytic degradation of the polymer leaving OH residual groups at the surface [33]. Both treatments led to the successful removal of the skin, leaving the particle-shaped layer exposed as shown below in the micrographs (both surfaces and sections) of the upper part of Figure 5. However, the chemical treatment with NaOH apparently modifies the morphology of the particles, since they seem smaller and, consequently, more dispersed than before the treatment.
The θw of the surfaces was measured; the results are listed in Table 2. In addition, water droplet pictures are also included in the figure. Note that there are no data for sample Q-PET-D since the fact that the skin layer was cracked at some points made the values vary along the surface. In its turn, flat film Q-PET results are included for the sake of comparison. Interestingly, after the skin removal treatment, the values were very different depending on the removal strategy of the PET skin employed. Apparently, spraying with acetone physically removes the skin with no chemical modification of the surface and θw increases from 72° ± 2° for the Q-PET flat film to 125° ± 3° for Q-PET-DA. This increase is in the same order of magnitude as observed by other authors that generate rough PET surfaces by different methods [13,14].
On the contrary, the immersion in NaOH solution not only dissolved the PET skin but also altered the chemical nature, as expected [33]. Despite the successful removal of the skin and uncovering of the underlying topography, a hydrophilic behavior was found featured by a contact angle of 66 ± 2° or even a total spread of the water droplets on the surface in some areas. This could be explained by the hydrolisis of PET during the NaOH immersion treatment that gives rise to a hydrophilic surface due to the presence of -OH residual groups [34].
Regarding the topography, Table 2 contains the main roughness parameters determined after analyzing the treated PET surfaces by optical profilometry, as explained in the experimental part. The values reported in Table 2 indicate that the skin removal by means of the NaOH protocol, Q-PET-DN, leads to a greater roughness compared to Q-PET-DA. This suggests, as it could also be intuited in the SEM micrographs, that, during the treatment, NaOH not only removes the skin by dissolution but also affects the underlying particulate substrate. Hydrolytic degradation by the effect of NaOH on PET flat foils has been seen to induce a slight increase in surface roughness parameters, which has been explained by the dissolution of hydrolysis reaction products [35]. This sample also is more scattered in all the roughness parameters compared to the sample in which the skin was removed by acetone spraying, Q-PET-DA. In fact, the Q-PET-DA sample showed an outstanding reproducibility of the roughness parameters all along the surface, which is an indicator of homogeneity. On the contrary, all the above-mentioned facts correspond to relative lack of homogeneity of the surfaces after the treatment with NaOH. Moreover, both samples hold low but positive Ssk values, so the surfaces can be defined as protruded, although at a very low extent.
Figure 6 shows an example of three-dimensional images of both surfaces where the more heterogeneous character of Q-PET-DN is suspected.
Importantly, both skin removal treatments produce surfaces with high adhesion to water on which hysteresis values cannot be measured since the droplets remain pinned to the surface, even when turning the samples upside down.

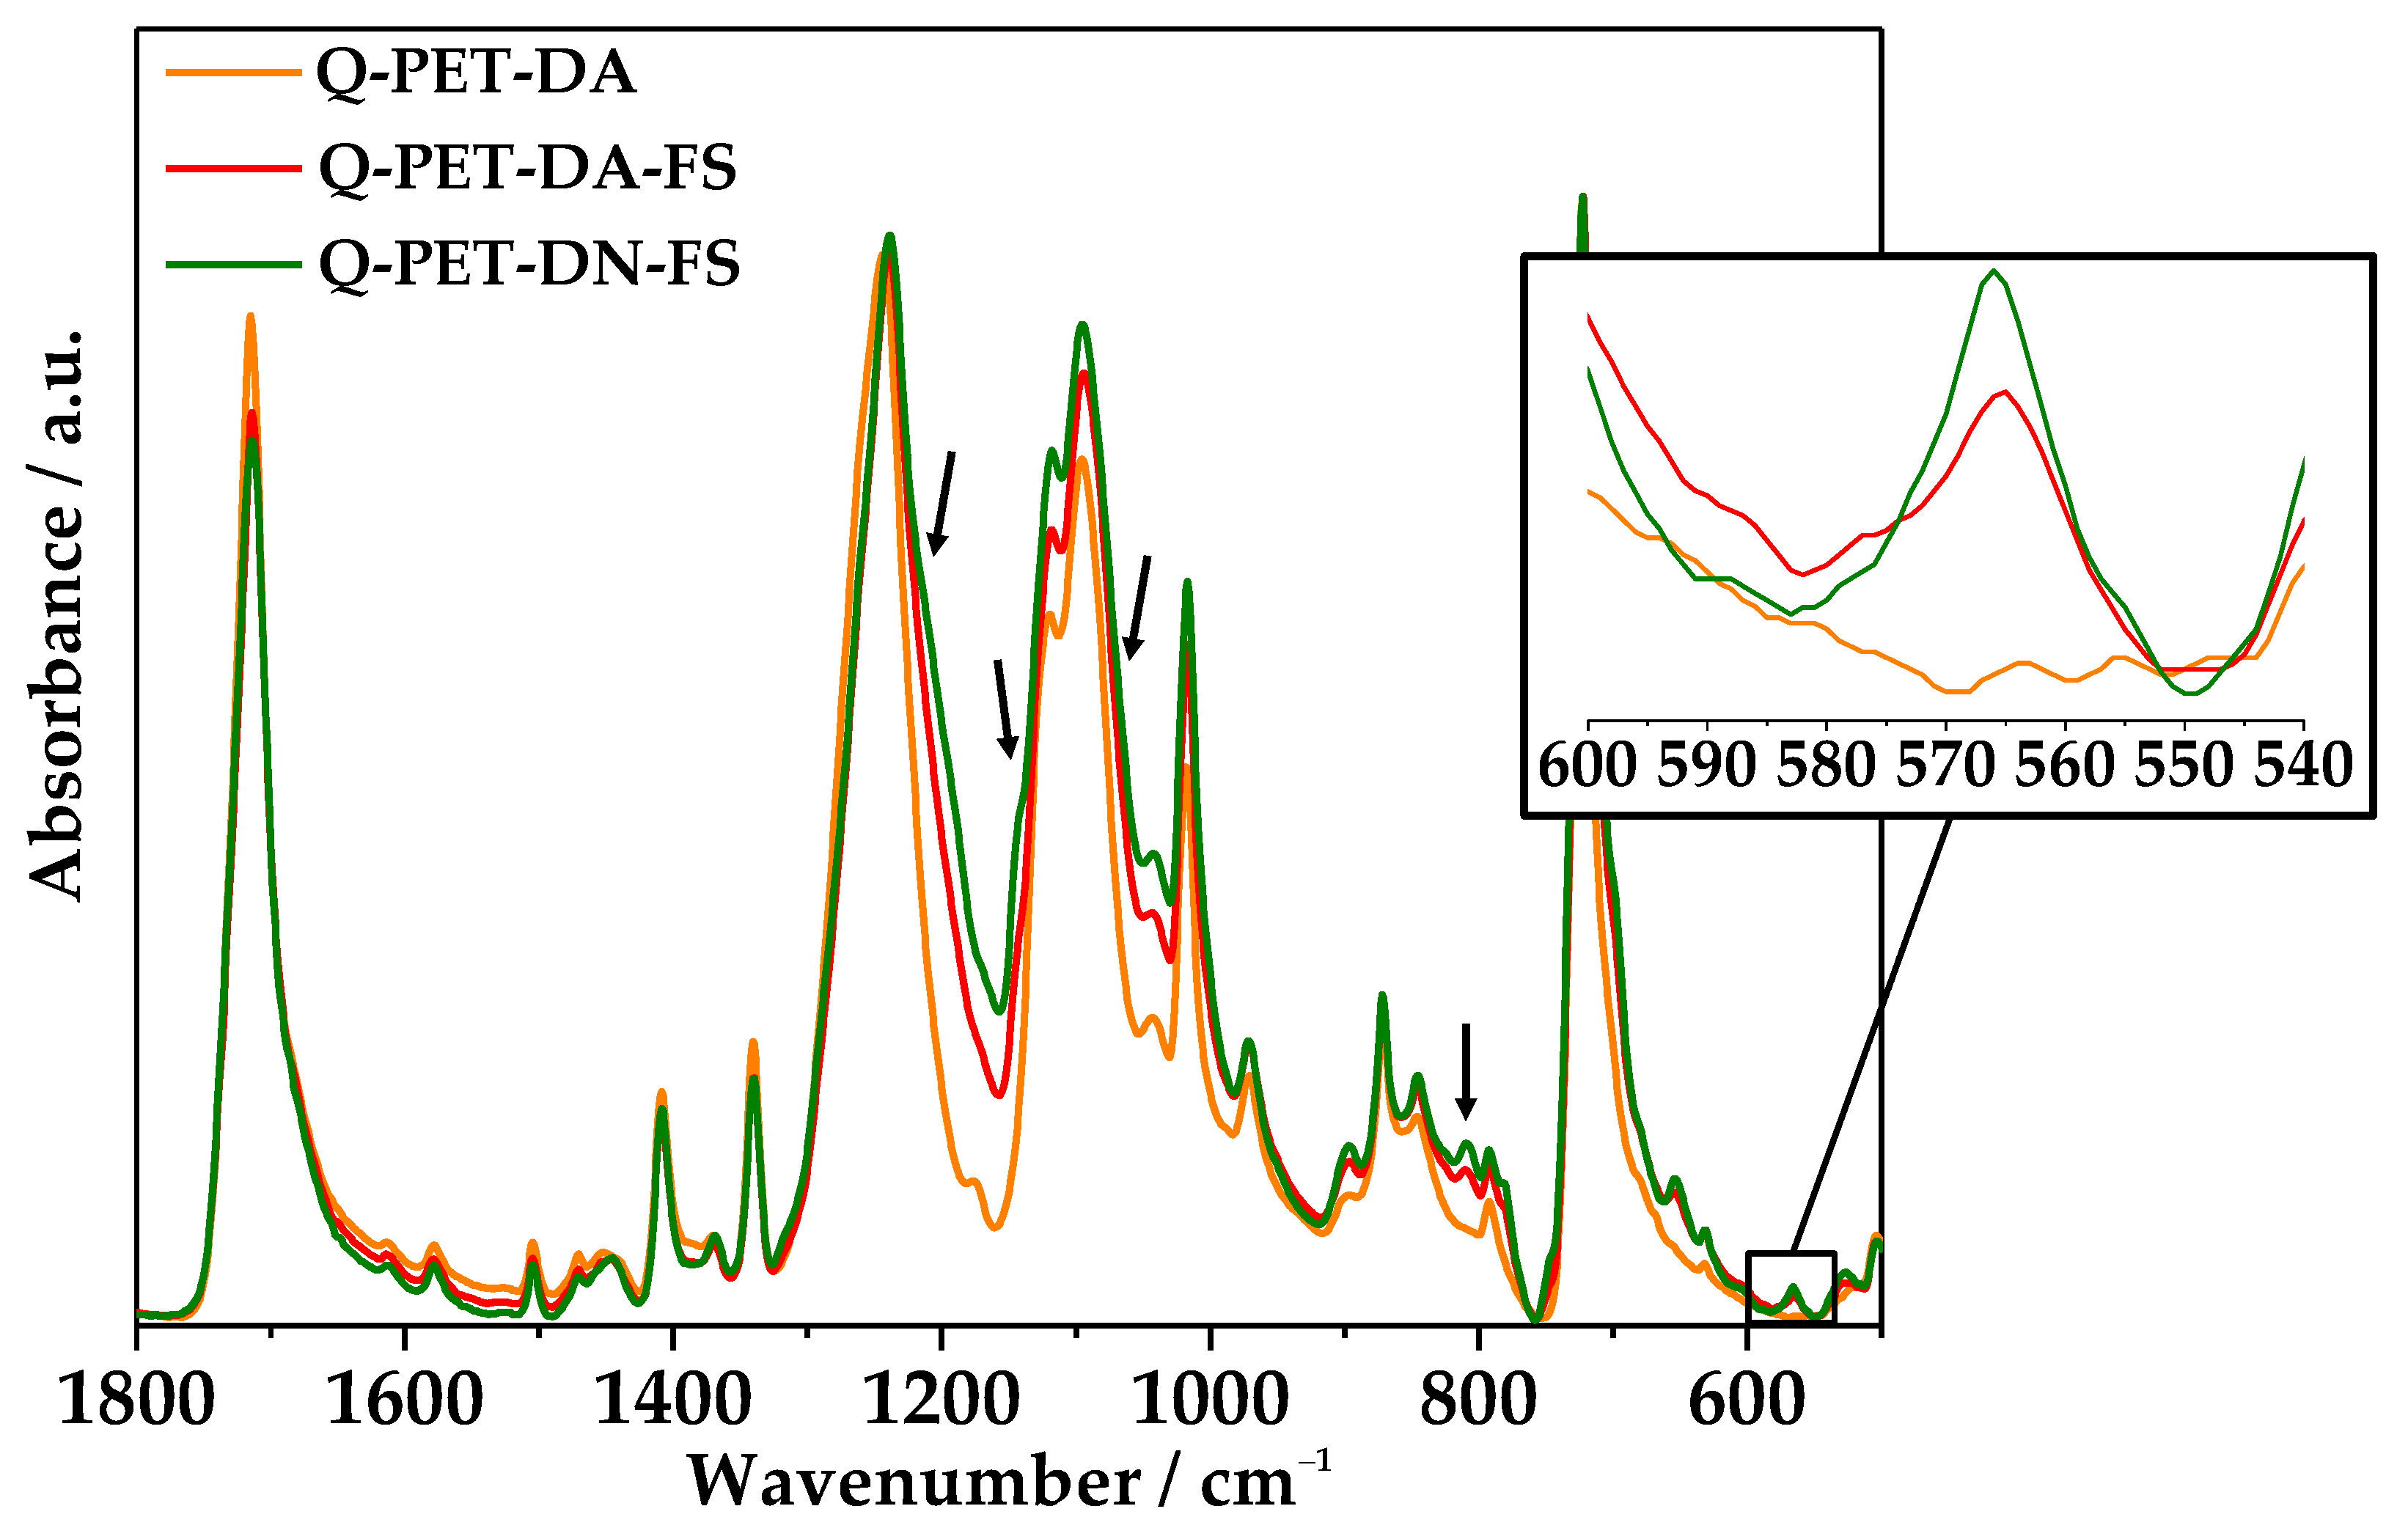
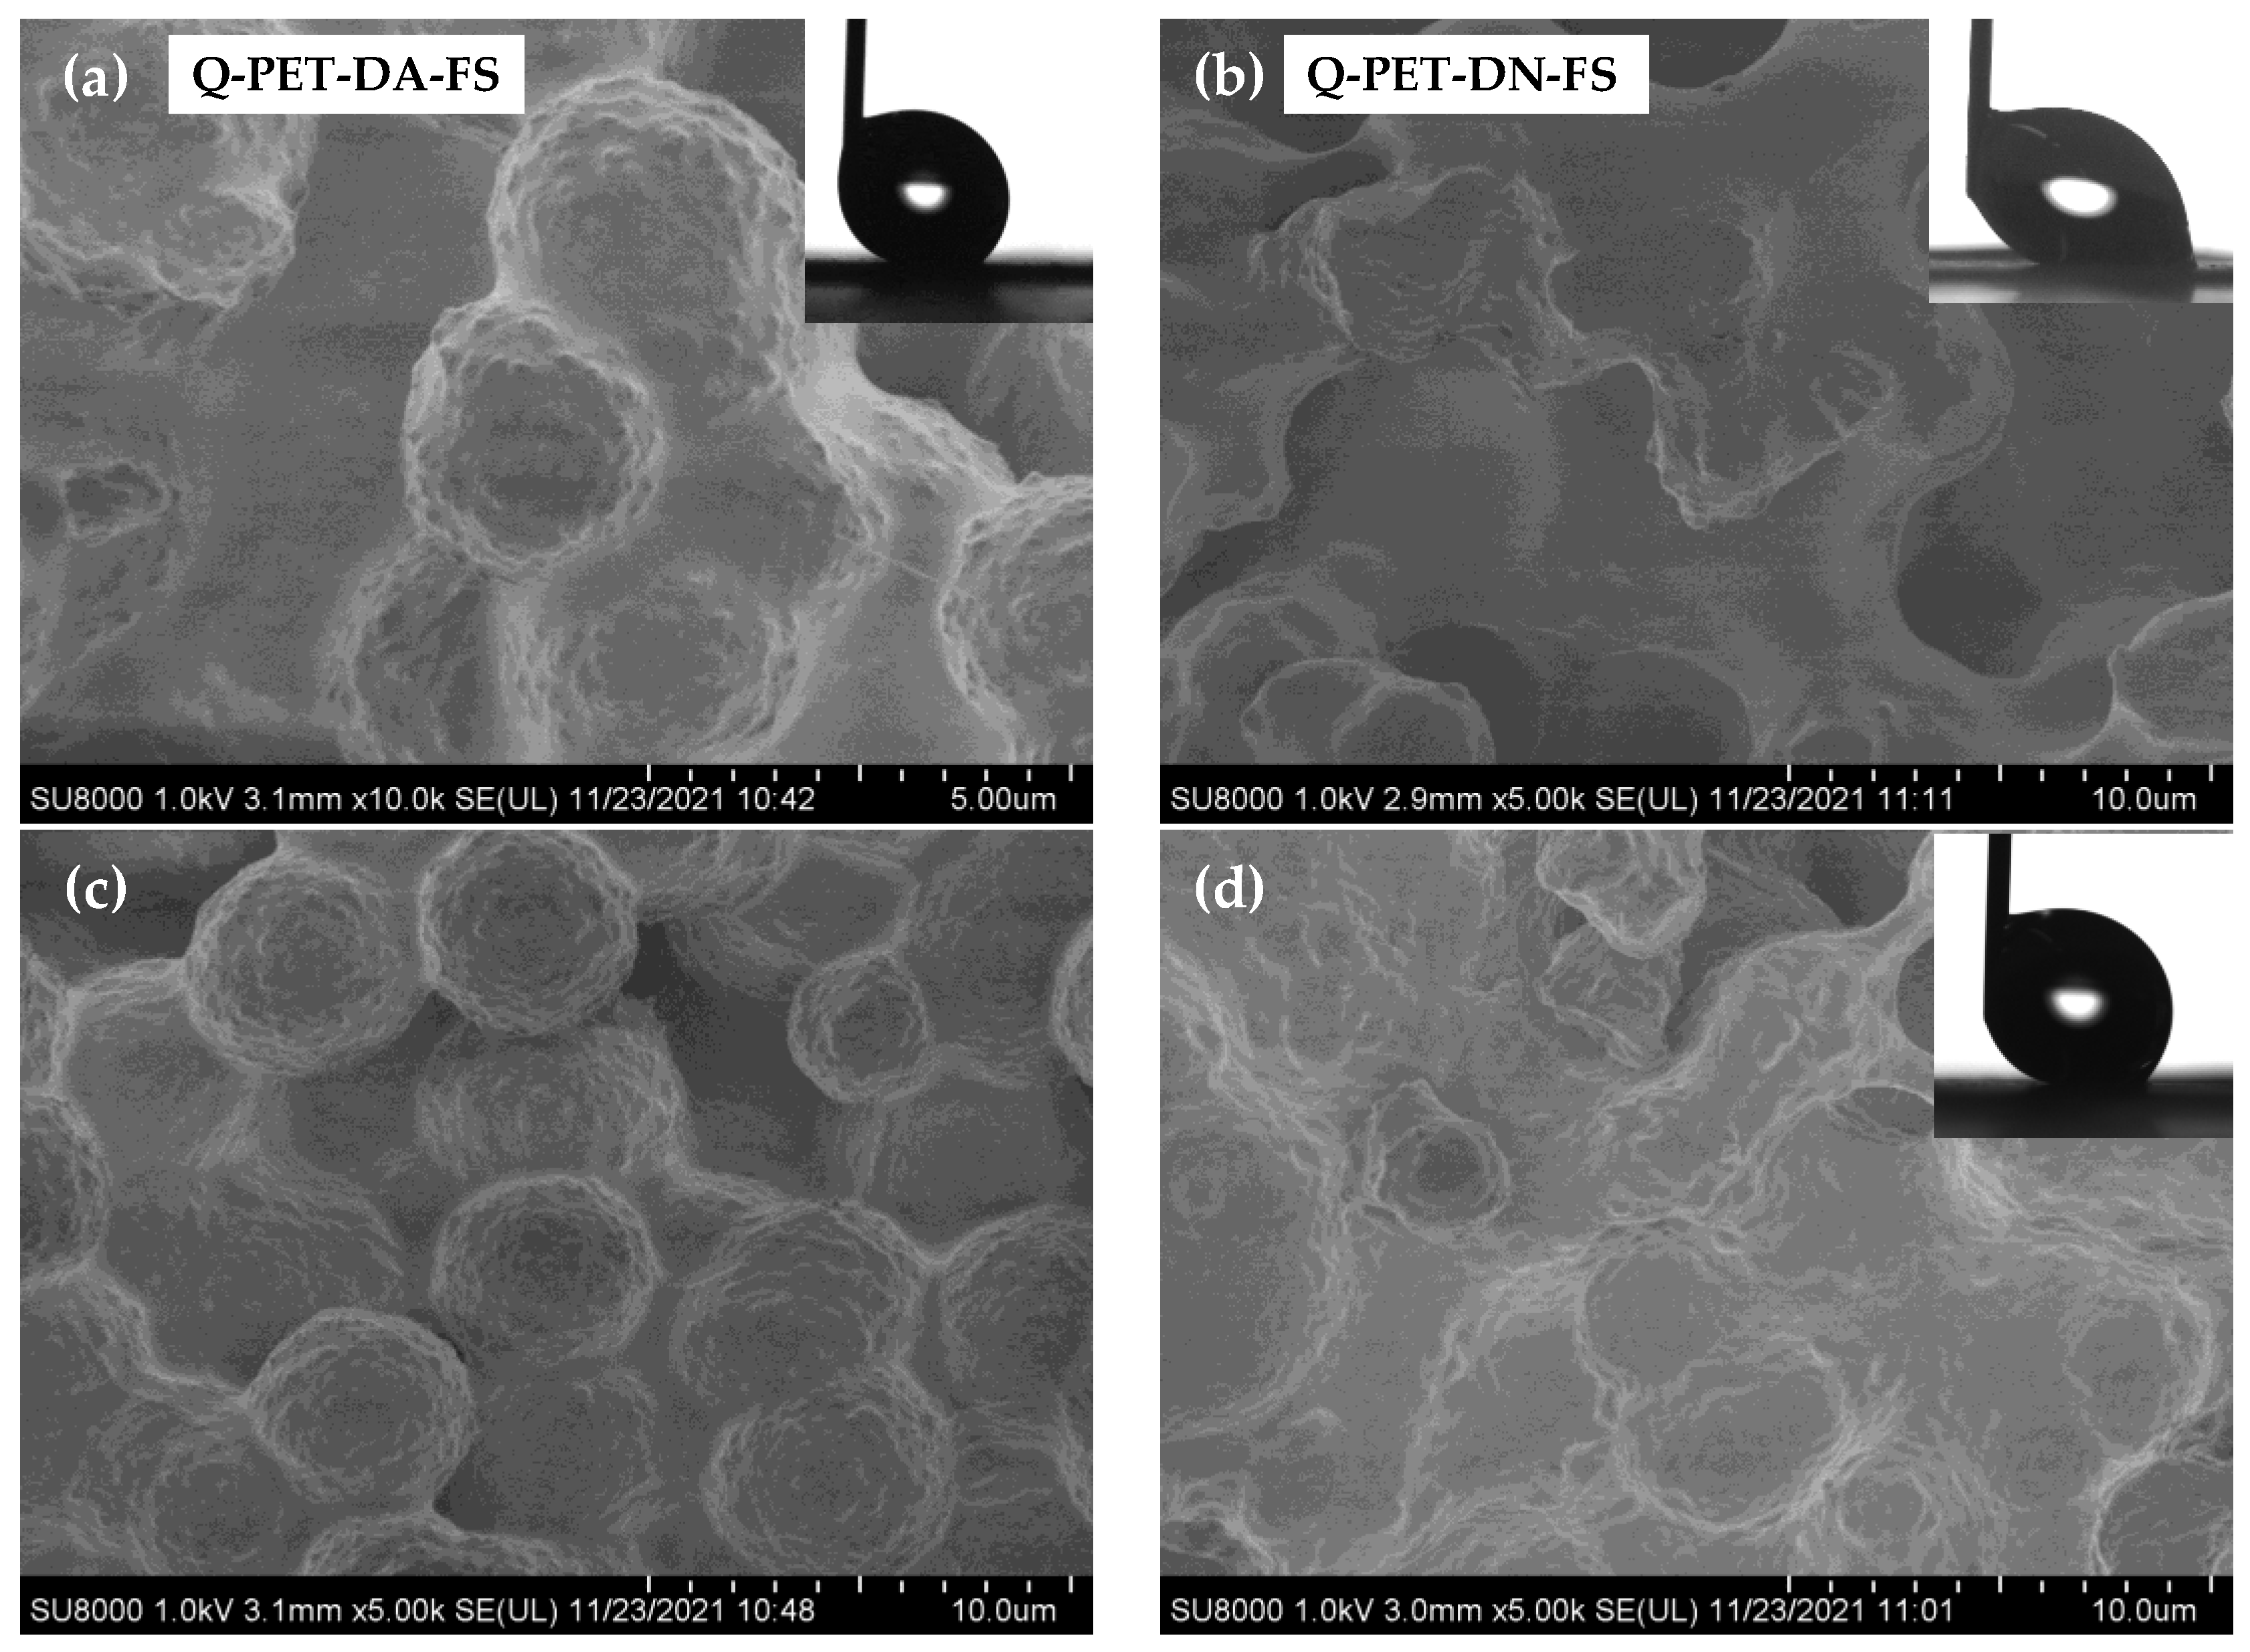
3.2. Chemical Modification by PFOTCS

As described above, the generation of roughness on PET films, without chemical alteration, does not push the hydrophobicity further than a θw value of 125°, in agreement with the literature. Nevertheless, bearing in mind the thermal annealing strategy by Oh et al. [17,18], which produced θw values beyond 125°, thermal annealing of varying duration and temperature were tried on Q-PET-DA and Q-PET-DN. However, in our case, no increase in the θw was observed after these treatments. It goes without saying that the success of the annealing is strongly dependent on the chain molecular dynamics, governed by the molecular weight of the polymer and its semicrystalline morphology, among other factors. This means that every PET polymer used needs different annealing conditions to develop hydrophobic surfaces. In this work, with the raw material employed, we did not find the right conditions for the annealing in order to increase the θw of the surfaces.
Therefore, to improve hydrophobicity, a mild chemical modification was tested using PFOTCS as a fluorinated agent. The samples were immersed for 20 min in a dilute solution of PFOTCS in hexane and dried at ambient temperature afterwards.
The lower part of Figure 5 contains SEM images of the fluorinated surfaces: Q-PET-DA-FS and Q-PET-DN-FS. No remarkable difference in the morphology of the surfaces after the immersion in the PFOTCS solution is seen. In their turn, the mean roughness values in Table 2 suffer only a slight increase in both samples, higher in the case of the surface that came from the NaOH immersion, Q-PET-DN-FS. However, the water behavior is dramatically affected, as can be seen in the water droplet pictures and also in the data in Table 2. Both surfaces showed θw higher than 150°. This demonstrates that the fluorination step has been successful.
Nevertheless, although the incorporation of silane moieties has been indirectly proven by the θw, an FTIR study on the surfaces after fluorination was carried out, which appears in Figure 7. The spectrum of Q-PET-DA is included as a nonfluorinated reference.
Attending to the spectra shown in Figure 7, the bands attributed to the silane moieties, absent in Q-PET-DA, were more intense in the sample, which came from NaOH immersion, namely Q-PET-DN-FS. These bands are marked as arrows in the Figure and correspond to the symmetric stretching of C-F2 at 1188 and 1143 cm−1, the Si-O-Si asymmetric and symmetric stretching at 1074 cm−1 and 809 cm−1, respectively. The 897 cm−1 band is attributed to the Si-OH bond, so it is considered that in both cases there is hydrolyzed and uncondensed silane on the surface. The infrared region between 620 and 540 cm−1 corresponding to modes of vibration of the C-F groups of fluorinated silane was analyzed. In the case of Q-PET-DN-FS (washed with NaOH), the intensity of this band is slightly higher. These facts could indicate higher adsorption of the silane on the surface of this sample, once more reinforcing the hypothesis of the presence of -OH groups on the surface that may favor the adsorption and condensation of the silane.
Therefore, the fluorination step has worked properly on both surfaces, more efficiently on those treated with NaOH, resulting in θw higher than 150°; however, at this point it is important to check if the hysteresis has changed. This would mean that it is also possible to diminish the water adhesion by fluorinating these surfaces. The Δθw values were measured by dragging a 5-µL water droplet on the surface of Q-PET-DA-FS and Q-PET-DN-FS; some pictures are included in Figure 8, together with high-resolution SEM micrographs. The pictures show the moment just before the droplet is detached from the surface, and the difference between the contact angle at the right side (advancing) and that at the left side (receding) is the hysteresis. This is an excellent way to visualize the significance of the hysteresis values in the wetting behavior. The results show that the sample Q-PET-DA-FS exhibits Δθw values varying from 15° to 20°. These values are highly reproducible throughout the surfaces tested. On the contrary, the Δθw values of Q-PET-DN-FS are strongly dependent on the area analyzed. Two different areas and Δ θw measured on them are shown in the right hand of Figure 8. In some regions, Δθw values lower than 20° were obtained, whereas, in other regions, Δθw higher than 70° were found, as shown in the images in Figure 8. This behavior agrees well with the previously reported lack of homogeneity in the roughness parameters of the Q-PET-DN-FS surface.
Trying to gain deeper insight into the different homogeneity of the Q-PET-DA-FS and Q-PET-DN-FS surfaces, high-resolution SEM images were taken in different regions of both. Figure 8 shows some of these images and more of them are included in Figure S3. The SEM images show that the sample Q-PET-DA-FS presents a submicrometer roughness (not evaluable by optical profilometry), which comes from the solvent-induced crystallization and which has remained after the skin removal and fluorination steps. Taking into account that the fluorination step has been successful on both surfaces (even more efficient on Q-PET-DN-FS) and, therefore, the surface chemistry is similar for both; this specific roughness pattern, which characterizes Q-PET-DA-FS in an outstanding homogeneous way, makes this sample highly hydrophobic with low hysteresis. On the contrary, Q-PET-DN-FS exhibits some SEM regions without this submicrometer roughness; it also showed high heterogeneity in the profilometric surface characterization. This is most probably due to the immersion in NaOH, which attacks the topography generated by the solvent-induced crystallization. These smooth areas are likely responsible for the water adhesion and, therefore, the low Δθw values.

4. Conclusions

Summarizing, in this work a first approach has been made to the use of a polymer of high consumption such as PET as a substrate for the preparation of surfaces with repellent properties. The roughness necessary for the appearance of the hydrophobic properties has been generated by means of a simple, fast, and cheap method that involves immersion in a common solvent, and that can be applied independently of the shape and dimensions of the parts. As its only drawback, this method gives rise to the appearance of smooth and thin skin on top of the generated particulate layer, which has not been explained yet. Two different approaches have been tested to successfully remove this skin. One of them, the immersion into NaOH solution dramatically altered not only the chemical nature but also the topography of the surfaces, making them more heterogeneous at both micrometer and submicrometer scales. However, by removing the skin mechanically by spraying, and a subsequent fluorination step, it is possible to obtain surfaces that present θw higher than 150° and low adhesion of the water droplets. The generation of roughness by induced crystallization has proven to be a very promising methodology that could be applied to other semi-crystalline polymers or copolymers to develop microstructured surfaces at large-scale.

Supplementary Materials

The following are available online at www.mdpi.com/article/10.3390/coatings12020137/s1, Figure S1 SEM micrographs of the samples after immersion in different solvents. Figure S2 Images for the PET film after and before the treatment. Figure S3 SEM micrographs of samples Q-PET-DA-FS (up) and Q-PET-DN-FS (down).

Author Contributions

Conceptualization, E.A., A.M.-G. and N.G., methodology, E.A., A.M.-G. and A.H., investigation, E.A., A.M.-G. and A.H., resources, N.G. and P.T.; data curation, E.A. and N.G., writing—original draft preparation, E.A. and N.G. writing—review and editing, P.T. All authors have read and agreed to the published version of the manuscript.

Funding

This research was funded by the Spanish Ministry of Science and Innovation and Universities MAT2016-81001-P and PID2019-109401 GB-I00.

Institutional Review Board Statement

Not applicable.

Informed Consent Statement

Not applicable.

Data Availability Statement

Data sharing is not applicable to this article.

Acknowledgments

E.A. thanks to the Spanish Ministry of Science and Innovation for the FPI Grant BES-2017-080057.

Conflicts of Interest

The authors declare no conflict of interest.

References

  1. Sethi, S.K.; Manik, G. Recent Progress in Super Hydrophobic/Hydrophilic Self-Cleaning Surfaces for Various Industrial Applications: A Review. Polym.—Plast. Technol. Eng. 2018, 57, 1932–1952. [Google Scholar] [CrossRef]
  2. Weng, C.; Wang, F.; Zhou, M.; Yang, D.; Jiang, B. Fabrication of hierarchical polymer surfaces with superhydrophobicity by injection molding from nature and function-oriented design. Appl. Surf. Sci. 2018, 436, 224–233. [Google Scholar] [CrossRef]
  3. Ai, J.; Guo, Z. Biomimetic polymeric superamphiphobic surfaces: Their fabrication and applications. Chem. Commun. 2019, 55, 10820–10843. [Google Scholar] [CrossRef] [PubMed]
  4. Naz, A.; Sattar, R.; Siddiq, M. Polymer membranes for biofouling mitigation: A review. Polym. Technol. Mater. 2019, 58, 1829–1854. [Google Scholar] [CrossRef]
  5. Moustafa, H.; Youssef, A.M.; Darwish, N.A.; Abou-Kandil, A.I. Eco-friendly polymer composites for green packaging: Future vision and challenges. Compos. Part B Eng. 2019, 172, 16–25. [Google Scholar] [CrossRef]
  6. Encinas, N.; Yang, C.Y.; Geyer, F.; Kaltbeitzel, A.; Baumli, P.; Reinholz, J.; Mailänder, V.; Butt, H.J.; Vollmer, D. Submicrometer-Sized Roughness Suppresses Bacteria Adhesion. ACS Appl. Mater. Interfaces 2020, 12, 21192–21200. [Google Scholar] [CrossRef]
  7. Hooda, A.; Goyat, M.S.; Pandey, J.K.; Kumar, A.; Gupta, R. A review on fundamentals, constraints and fabrication techniques of superhydrophobic coatings. Prog. Org. Coat. 2020, 142, 105557. [Google Scholar] [CrossRef]
  8. GMR Plastics Europe; Conversion Market & Strategy GmbH. Plastics—The Facts 2019; Volume 14, p. 35. Available online: https://www.readkong.com/page/plastics-the-facts-2019-an-analysis-of-european-6681489 (accessed on 20 December 2021).
  9. Das, S.; Kumar, S.; Samal, S.K.; Mohanty, S.; Nayak, S.K. A Review on Superhydrophobic Polymer Nanocoatings: Recent Development and Applications. Ind. Eng. Chem. Res. 2018, 57, 2727–2745. [Google Scholar] [CrossRef]
  10. Kim, Y.; Lee, Y.; Han, S.; Kim, K.J. Improvement of hydrophobic properties of polymer surfaces by plasma source ion implantation. Surf. Coat. Technol. 2006, 200, 4763–4769. [Google Scholar] [CrossRef]
  11. Gotoh, K.; Shohbuke, E.; Kobayashi, Y.; Yamada, H. Wettability control of PET surface by plasma-induced polymer film deposition and plasma/UV oxidation in ambient air. Colloids Surf. A Physicochem. Eng. Asp. 2018, 556, 1–10. [Google Scholar] [CrossRef]
  12. Korolkov, I.V.; Narmukhamedova, A.R.; Melnikova, G.B.; Muslimova, I.B.; Yeszhanov, A.B.; Zhatkanbayeva, Z.K.; Chizhik, S.A.; Zdorovets, M.V. Preparation of hydrophobic PET track-etched membranes for separation of oil–water emulsion. Membranes 2021, 11, 637. [Google Scholar] [CrossRef] [PubMed]
  13. Becker, H.; Gärtner, C. Polymer microfabrication technologies for microfluidic systems. Anal. Bioanal. Chem. 2008, 390, 89–111. [Google Scholar] [CrossRef] [PubMed]
  14. Bouchard, F.; Soldera, M.; Baumann, R.; Lasagni, A.F. Hierarchical microtextures embossed on PET from laser-patterned stamps. Materials 2021, 14, 1756. [Google Scholar] [CrossRef] [PubMed]
  15. Fu, Y.; Soldera, M.; Wang, W.; Milles, S.; Deng, K.; Voisiat, B.; Nielsch, K.; Lasagni, A.F. Wettability control of polymeric microstructures replicated from laser-patterned stamps. Sci. Rep. 2020, 10, 22428. [Google Scholar] [CrossRef] [PubMed]
  16. Szczepanski, C.R.; Guittard, F.; Darmanin, T. Recent advances in the study and design of parahydrophobic surfaces: From natural examples to synthetic approaches. Adv. Colloid Interface Sci. 2017, 241, 37–61. [Google Scholar] [CrossRef]
  17. Oh, J.H.; Park, C.H. Robust Fluorine-Free Superhydrophobic PET Fabric Using Alkaline Hydrolysis and Thermal Hydrophobic Aging Process. Macromol. Mater. Eng. 2018, 303, 1700673. [Google Scholar] [CrossRef]
  18. Oh, J.H.; Moon, M.W.; Park, C.H. Effect of crystallinity on the recovery rate of superhydrophobicity in plasma-nanostructured polymers. RSC Adv. 2020, 10, 10939–10948. [Google Scholar] [CrossRef]
  19. Afonso, E.; Martínez-Gómez, A.; Tiemblo, P.; García, N. Industrially viable method for producing all-polymer hydrophobic surfaces apt for slippery liquid-infused substrates. Appl. Surf. Sci. 2021, 535, 147728. [Google Scholar] [CrossRef]
  20. Desai, A.B.; Wilkes, G.L. Solvent-Induced Crystallization of Polyethylene Terephthalate. J. Polym. Sci. Part C Polym. Symp. 1974, 319, 291–319. [Google Scholar] [CrossRef]
  21. Ouyang, H.; Lee, W.H.; Ouyang, W.; Shiue, S.T.; Wu, T.M. Solvent-induced crystallization in poly(ethylene terephthalate) during mass transport: Mechanism and boundary condition. Macromolecules 2004, 37, 7719–7723. [Google Scholar] [CrossRef]
  22. Zhao, N.; Weng, L.; Zhang, X.; Xie, Q.; Zhang, X.; Xu, J. A lotus-leaf-like superhydrophobic surface prepared by solvent-induced crystallization. ChemPhysChem 2006, 7, 824–827. [Google Scholar] [CrossRef] [PubMed]
  23. Gupper, A.; Kazarian, S.G. Study of solvent diffusion and solvent-induced crystallization in syndiotactic polystyrene using FT-IR spectroscopy and imaging. Macromolecules 2005, 38, 2327–2332. [Google Scholar] [CrossRef]
  24. Takashi, N.; Masashi, M.; Katsuhiko, N.; Motonori, M.; Yasukiyo, U. The Lowest Surface Free Energy Based on -CF3 Alignment. Langmuir 1999, 15, 4321–4323. [Google Scholar]
  25. Everson, I.; Bendall, B.; Murray, A. Roughness parameters. CCAMLR Sci. 1999, 6, 117–123. [Google Scholar]
  26. Lawton, E.L.; Cates, D.M. Liquid-induced crystallization of poly(ethylene terephthalate). J. Appl. Polym. Sci. 1969, 13, 899–909. [Google Scholar] [CrossRef]
  27. Jameel, H.; Noether, H.D.; Rebenfeld, L. The effects of orientation and crystallinity on the solvent-induced crystallization of poly(ethylene terephthalate). II. Physical structure and morphology. J. Appl. Polym. Sci. 1982, 27, 773–793. [Google Scholar] [CrossRef]
  28. Badia, J.D.; Strömberg, E.; Karlsson, S.; Ribes-Greus, A. The role of crystalline, mobile amorphous and rigid amorphous fractions in the performance of recycled poly (ethylene terephthalate) (PET). Polym. Degrad. Stab. 2012, 97, 98–107. [Google Scholar] [CrossRef] [Green Version]
  29. Li, G.; Yang, S.L.; Jiang, J.M.; Wu, C.X. Crystallization characteristics of weakly branched poly(ethylene terephthalate). Polymer 2005, 46, 11142–11148. [Google Scholar] [CrossRef]
  30. Kulshreshtha, A.K.; Khan, A.H.; Madan, G.L. X-ray diffraction study of solvent-induced crystallization in polyester filaments. Polymer 1978, 19, 819–823. [Google Scholar] [CrossRef]
  31. Lin, S.B.; Koenig, J.L. Spectroscopic Characterization of Solvent-Induced Crystallization of Pet. J. Polym. Sci. Part A-2 Polym. Phys. 1983, 21, 1539–1558. [Google Scholar] [CrossRef]
  32. Chen, Z.; Hay, J.N.; Jenkins, M.J. FTIR spectroscopic analysis of poly(ethylene terephthalate) on crystallization. Eur. Polym. J. 2012, 48, 1586–1610. [Google Scholar] [CrossRef]
  33. Prorokova, N.P.; Khorev, A.V.; Vavilova, S.Y. Chemical method of surface activation of poly(ethylene terephthalate) fibre materials: Part 1. Study of the modifying effect of sodium hydroxide solutions and products made from quaternary ammonium salts. Fibre Chem. 2009, 41, 158–163. [Google Scholar] [CrossRef]
  34. Anjum, A.S.; Ali, M.; Sun, K.C.; Riaz, R.; Jeong, S.H. Self-assembled nanomanipulation of silica nanoparticles enable mechanochemically robust super hydrophobic and oleophilic textile. J. Colloid Interface Sci. 2020, 563, 62–73. [Google Scholar] [CrossRef] [PubMed]
  35. Škvarla, J.; Luxbacher, T.; Nagy, M.; Sisol, M. Relationship of surface hydrophilicity, charge, and roughness of PET foils stimulated by incipient alkaline hydrolysis. ACS Appl. Mater. Interfaces 2010, 2, 2116–2127. [Google Scholar] [CrossRef]
Figure 1. Methodologic scheme followed in this work to prepare the hydrophobic PET surfaces.
Coatings 12 00137 g001
Figure 2. DSC traces corresponding to a heating cycle of the samples with different thermal treatments: T and Q processing conditions and Q-sample after the solvent immersion treatment (Q-PET-D).
Coatings 12 00137 g002
Figure 3. X-ray Diffraction data (a) and FTIR spectra (b) of T-PET and Q-PET samples before and after (D) the solvent treatment.
Coatings 12 00137 g003
Figure 4. SEM images of Q-PET-D surface at 100×, 200×, 800× and 2000× and section at 500× and 1500× magnification.
Coatings 12 00137 g004
Figure 5. SEM micrographs of the surface and the section of the surfaces after the skin removal treatment: Q-PET-DA (a) and Q-PET-DN (b); and after the PFOTCS modification (down).
Coatings 12 00137 g005
Figure 6. 3D images and profiles obtained by optical profilometry of surfaces where the PET skin was removed by acetone spraying, Q-PET-DA (a), and by NaOH solution, Q-PET-DN (b).
Coatings 12 00137 g006
Figure 7. ATR-FTIR spectra of the surfaces after the fluorination step with PFOTCS. The ATR-FTIR spectrum of Q-PET-DA is included for comparison.
Coatings 12 00137 g007
Figure 8. SEM images of samples Q-PET-DA-FS (a,c) and Q-PET-DN-FS (b,d) on the surface at 5000× (a,b,d) and 10,000× (c) and images visualizing the Δθw values of these surfaces.
Coatings 12 00137 g008
Table 1. DSC enthalpies and crystallization data for Q-PET before and after the treatment (Q-PET-D) and T-PET.
Sample NameΔHcc/J·g−1ΔHm/J·g−1Xc/%
Q-PET33.734.80.8
Q-PET-D042.330.2
T-PET038.327.3
Table 2. Water contact angles, θw, and roughness parameters determined by optical profilometry.
Sample Nameθw/°SaSqSpvSzSskSku
Q-PET72 ± 20.08 ± 0.020.11± 0.022.2 ± 0.51.2 ± 0.30.4 ± 0.25.2 ± 0.9
Q-PET-DA125 ± 32.00 ± 0.022.52 ± 0.0320.0 ± 0.416.7 ± 0.20.49 ± 0.043.3 ± 0.1
Q-PET-DA-FS156 ± 22.2 ± 0.22.8 ± 0.223 ± 216 ± 10.10 ± 0.053.0 ± 0.2
Q-PET-DN66 ± 23.3 ± 0.74.1 ± 0.828 ± 324 ± 30.2 ± 0.12.9 ± 0.3
Q-PET-DN-FS154 ± 24.2 ± 0.45.2 ± 0.532 ± 327 ± 20.3 ± 0.22.6 ± 0.3
Publisher’s Note: MDPI stays neutral with regard to jurisdictional claims in published maps and institutional affiliations.

