Article

Addition of Organic Acids during PEO of Titanium in Alkaline Solution

Department of Chemistry, Materials and Chemical Engineering “G. Natta”, Politecnico di Milano, Via Mancinelli, 7, 20131 Milano, Italy
*
Author to whom correspondence should be addressed.
Coatings 2022, 12(2), 143; https://doi.org/10.3390/coatings12020143
Submission received: 10 December 2021 / Revised: 17 January 2022 / Accepted: 19 January 2022 / Published: 25 January 2022
(This article belongs to the Special Issue Surface Engineering for Corrosion Protection)

Abstract

:
This research study describes recent advances in understanding the effects of the addition of organic acids, such as acetic, lactic, citric and phytic acids, on the process of plasma electrolytic oxidation (PEO) on Ti using an alkaline bath. As the plasma developed over the workpiece is central to determine the particular morphological and structural features of the growing oxide, the focus is then on the inter-relationships between the electrolyte and the resultant plasma regime established. In situ optical emission spectroscopy (OES) allowed us to verify a marked plasma suppression when adding low-molecular-weight anions such as acetates, resulting in short-lived and well-distributed discharges. Conversely, when more bulky anions, such as lactates, citrates and phytates, were considered, a less efficient shielding of the electrode caused the build-up of long-lasting and destructive sparks responsible for the formation of thicker coatings, even >30 µm, at the expense of a higher roughness and loss of compactness. Corrosion resistance was tested electrochemically, according to electrochemical impedance spectroscopy (EIS), and weight losses evidenced the coatings produced in the solution containing acetates to be more suitable for service in H2SO4.

Graphical Abstract

1. Introduction

Titanium and its alloys are characterized by a combination of mechanical properties, such as low density, high strength-to-weight ratio, high biocompatibility, relatively high melting point and excellent corrosion resistance, making these materials suitable for a wide range of applications—to name just a few, space, aerospace, automotive, marine, biomedical, chemical and food industries [1,2]. The great corrosion resistance, effective in a wide range of environments, is due to the presence of a protective titanium oxide film that spontaneously forms on the metal surface when it comes in contact with oxidizing environments. Even if the natural protective layer shows an outstanding chemical stability and adhesion to the substrate, its maximum thickness is limited to ~10 nm, making surface treatments necessary to provide a more effective and reliable protection. One of the most promising electrochemical techniques to achieve this purpose is plasma electrolytic oxidation (PEO), which allows one to increase the oxide thickness well beyond one micron [3,4]. PEO consists in a high-voltage anodic oxidation applied on valve metals such as Al, Mg and Ti, generally in alkaline solutions [5,6], even if, quite recently, PEO on Ti using sulfuric acid was verified to be highly effective for corrosion resistance enhancement [7]. This allowed oxide with thicknesses in the range ~2 ÷ 8 µm to be obtained, showing very good adherence and stability when immersed in strongly acidic solutions, such as 10% v/v H2SO4 at 60 °C, and, in some cases, making it possible to overcome performances of Ti grade 7. This makes the application of such conversion treatments desirable when using Ti in the following applications: (1) metal pickling in hot concentrated sulfuric acid (a common choice adopted during descaling of desalination plants [8]); (2) airplanes experiencing H2SO4 condensation from troposphere and stratosphere; (3) contact with corrosive lithium bromide in refrigerator systems [9]. Given the large part of Ti production employed in case of aerospace-related application, in the present study, oxides were tested for corrosion resistance in a sulfuric acid environment.
Despite the set-up used during PEO being similar to the one used during standard anodizing, the mechanism of oxide growth is totally different. In fact, while, in standard anodizing, the oxide grows according to a continuous migration of ions due to the high field produced inside the dielectric material, in PEO, the metal is mainly oxidized directly inside the plasma. This causes the oxide to grow in thickness as the evaporated titanium oxide molecules condense during plasma cooling. As a result, a PEO oxide is continuously destructed and reconstructed, finding continuous feeding of the metal cation, necessary for oxide formation, directly from the material ejected from substrate evaporation. According to the literature, several attempts have been performed to understand the physics behind the oxidation mechanism in a complex phenomenon such as PEO involving plasma, liquid, vapor, and solid phases. Generally, they can be divided in the following:
  • Models describing the oxidation mechanism: Yerokhin et al. [10] gave an interpretation of Al oxidation as composed by two concomitant reactions, i.e., electrochemical surface oxidation and plasma chemical oxidation with total current density, used during the process and redistributed according to these contributions. Matykina et al. [11], instead, performed sequential PEO treatments over Al in an alkaline solution containing 18O isotope, verifying the reaction site where alumina forms to be localized in the deeper coating region near the barrier layer, thus demonstrating the process to be mainly controlled by the transport of O-species in the inner part of the coating and the formation of ions and radicals according to plasma interactions.
  • Models describing the mechanism of plasma ignition: Hussein et al. [6,12] were among the first to successfully characterize the PEO process on Al, by in situ optical emission spectroscopy (OES). According to their evidence, plasma could be ignited following three mechanisms, a result also confirmed by other independent authors [13]. Type-A: surface plasma, not involving the deeper coating regions, excited in correspondence of small features size, such as defects, leading to electric field amplification beyond water breakdown (~1 MV·cm−1). Type-B: dielectric discharges involving all the coating thickness ignited in correspondence of the metal substrate and modelled according to the electron avalanche theory [14]. Their occurrence could be roughly predicted depending on the oxide band gap (Eg), ~3/2 Eg proportional to the energy necessary to accelerate a valence e creating a cascade effect by impact ionization. Type-C: plasma emission mainly occurring below the surface in correspondence of holes filled with gas and electrolyte.
Plasma modulation is found to be an effective route to control the morphology, structure and composition of the coating. This can be achieved by selecting proper electrical parameters, such as frequency and amount of cathodic polarization, or according to the use of additives, such as organic materials, in the alkaline bath. Those additives are considered to protect the film from violent discharges, as molecules tend to adsorb on the electrode through their functional groups (−OH, −COOH, −NH etc.). It is here shown how this strategy can substantially improve coating features, such as compactness and homogeneity, at the expense of a lower overall oxide thickness. In this way, corrosion resistance, tested in strong acidic solutions, was highly enhanced. This approach is desirable; in fact, based on our experience, Ti oxide coatings produced by PEO using an alkaline bath such as 1 M NaOH + 4 g·L−1 Na2SiO3 are very thick, even >100 µm, but very friable and inhomogeneous, as it is possible to notice in Figure 1.
Despite the large thickness, the oxide was not effective against immersion in 10% v/v H2SO4 at 60 °C, demonstrating a corrosion rate, evaluated during preliminary tests, of ~6.59 mm·year−1. For this reason, this study is focused on the effect of the addition of several organic acids, such as acetic, lactic, citric and phytic acids, paying particular attention to how the PEO process and resultant coating features, such as morphology, structure, and elemental composition, are modified. Among all the organics considered, phytic acid (C6H18O24P6) was selected, as this large molecule is generally adopted as a corrosion inhibitor. It is composed by 24 O atoms, 12 OH and 6 phosphate carboxyl groups responsible for strong chelation with many metal cations, such as Fe, Cu, Ni and Ti [15,16,17]. Zhang et al. [18] added phytic acid (2 ÷ 12 g·L−1) to a basic aqueous solution of 10 g·L−1 NaOH and observed a decrease in solution conductivity and a higher breakdown voltage for a progressively increasing concentration of the organic acid. The same author, in another study [19], compared the use of phytic acid and sodium silicates, during PEO on Mg, finding a better corrosion resistance when using the former substance, as the compound promoted MgO crystal growth and a decreased surface porosity.
Acetic acid (CH3COOH), on the other hand, is a weak organic acid composed by a small molecule where a methyl group is linked to a carboxyl unit. Rashid et al. [20] studied the addition of acetic acid to a solution of H3PO4, during Al anodizing, observing improved corrosion resistance properties, while Selimin et al. [21], anodizing Ti in a solution of 0.9 M acetic acid, verified improved apatite formation. Furthermore, chemicals containing the acetate anion were found to act as efficient sealants involved in the protection of porous PEO coatings formed on Ti [22].
Citric acid (C6H8O7) contains three carboxyl groups connected by a backbone composed of five C atoms. Koczera et al. [23] found benefits when adding a small amount of citric acid (10 g·L−1) to the anodizing bath of Al, attributing a higher coating thickness and quality to inhibition of the dissolution reaction of alumina. Santos et al. [24] found citric acid to favor achievement of the PEO regime on Al and to limit metallic particles incorporation thanks to its complexant ability.
Lactic acid (C3H6O3) is an α-hydroxy acid with one carboxylic and one methyl group characterized by a pKa ~ 3.86. Its main use in the anodization field is related to the synthesis of nanotubular geometries [25,26], where the organic molecule acts as an anodic breakdown retardant, favoring the nanotubes’ thickness and growth rate. However, as lactates tend to be preferentially adsorbed on the electrode surface during the anodic half-cycle, the decrease in the overall charge transfer reaction, responsible for metal oxidation, determines a lower film growth [27]. Despite the use of the above cited additives, in processes involving valve metals such as Al or Mg, to the best of our knowledge, no report regarding PEO on Ti with the following chemicals has been reported.

2. Materials and Methods

Anodization treatments were performed in a basic solution of 1 M NaOH and 4 g·L−1 of Na2SiO3, considering the addition of 5 g·L−1 of the organic acids listed in Table 1. It is possible to notice how both solution conductivity and pH were almost unaffected by the type of organic additive used.
The treatments were performed in a 1 L Pyrex beaker over 10 × 10 × 1.6 mm3 Ti grade 2 (UNS R50400) samples cut by metal shearing. Ti coupons were incorporated into epoxy resin and mechanically polished with silicon carbide papers according to the sequence 100, 320, 600, 800, 1200 and 2400/4000 mesh and alumina particles to obtain a mirror-like surface with roughness down to ~0.8 µm. After polishing, the specimens were sonicated in ethanol for 5 min and washed in deionized water. A cylindrical counter electrode based on an activated titanium net (radius of 50 mm) was placed around the titanium coupon while the solution was stirred using a magnetic anchor rotating at 600 rpm, in order to avoid mass transfer limitations. The pulsed anodization signal was designed according to the fully programmable California Instruments Asterion 751 series AC/DC power source using a duty cycle of 60A%–40C%–7CP% repeated at 1000 Hz, where “A” and “C” stand for anodic and cathodic polarization, while CP indicates the % of cathodic polarization applied with respect to the anodic one. This waveform was selected as it was demonstrated to be particularly useful for corrosion resistance enhancement in our previous paper [7]. Conversion treatments were performed under a potential-controlled regime considering a forming voltage of 90 V reached through a constant ramp, leading to a total treatment time of 320 s. Current and voltage curves, recorded during PEO treatments, were acquired using a Tektronix TBS-1072B-EDU oscilloscope(Tektronix, Beaverton, Oregon).
Morphology was investigated using a Carl Zeiss EVO 50VP SEM (ZEISS, Oberkochen, Germany), equipped with a Bruker X-ray spectrometer for chemical microanalysis (EDS). The crystal structure was characterized by the X-ray diffraction technique (XRD) using a Philips PW3020 goniometer with Cu Kα1 radiation (1.54058 Å).
The composition was studied through glow discharge optical emission spectroscopy (GD-OES) according to a SpectrumA ANALYTIK GDA 750 HR analyzer (Spectruma, Hof, Germany). In situ optical emission spectroscopy (OES) was instead executed using an Ocean Optics S2000 spectrometer equipped with an optical fiber P400-1-UV-VIS, allowing an overall spectral resolution of ~0.3 nm in a window of 300 ÷ 1100 nm to be obtained.
All the electrochemical tests were performed using a Metrohm Autolab PGSTAT, using a standard three-electrode cell with a silver/silver chloride (SSC) reference electrode and an Amel Pt counter electrode. All tests were repeated three times, to confirm the quality of the results, for each PEO solution. Tafel analyses were performed by polarizing the sample at ±250 mV with respect to Ecorr considering a scan rate of 10 mV·min−1. Cyclic voltammetry was scanned between +5 V/SSCsat. and −5 V/SSCsat. at a scan rate of 0.05 V·s−1, starting from −5 V/SSCsat. Electrochemical impedance spectroscopies (EISs) were performed in a frequency window of 105÷10−2 Hz, considering a sinusoidal signal with an amplitude of 10 mVrms, collecting 10 points per decade of frequency.
The corrosion rate was determined by weigh loss tests performed in a free corrosion condition, immersing the coated samples in 10% v/v H2SO4 at 60 °C for 24 h, a solution commonly employed during metal pickling operations [8].

3. Results

3.1. PEO Treatments

Titanium dioxide formation in an alkaline solution may be the result of two concomitant reactions,
Ti4+ + 2O2− → TiO2
Ti4+ +4OH → TiO2 + 2H2O
with O2− and OH coming from water spitting and basicity present at the oxide–electrolyte interface. Those reactions contribute to the formation of a progressively thicker barrier, causing, beyond a certain threshold, anodic breakdown to occur. This extensively contributes to the retention, according to complex plasma and electrochemical reactions, of Si-containing species, such as SiO2.
SiO32− (l) + H2O (l) → plasma → SiO2 (s) + 2OH (l)
SiO32− → SiO2 + 1/2O2 + 2e
The addition of organic molecules can significantly affect the kinetics of the above equations, resulting in peculiar features investigated in the following paragraphs.
For this reason, voltage (V)–time curves are presented in Figure 2 for all PEO treatments. It was possible to see that the use of different organic additives had a strong influence when sparks started to manifest over the electrode surface (~50 V, in present conditions). In particular, abrupt V oscillations were observed when acetic acid (Figure 2a) was added to the alkaline bath, with peaks reaching ~170 V. The opposite holds true in case of phytic acid (Figure 2d), with a V trend very well reproduced, showing almost the absence of strong V surges, confirming the presence of less destructive discharges responsible to induce strong variations of the impedance of the electrochemical cell.
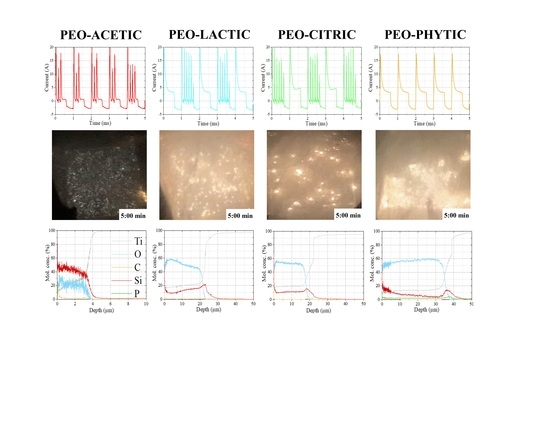
To obtain a deeper insight regarding PEO regime evolution and possible differences among the different solutions tested, current (I)–time plots were collected at 300 s of treatment and are shown in Figure 3 at the millisecond time scale. According to previous V features, apart from an initial capacitive I peak, arising from the charging of the electrical double layer (EDL), only phytic acid (Figure 3d) presented a smooth decay until the I plateau (responsible for oxide growth) was reached and maintained for the entire duration of the anodic half-part of the duty (60%).
Therefore, the absence of I surges is an indication of the higher ionic contribution with respect to the electronic one required to sustain the multitude of sparks. Similarities were instead observed in Figure 3b,c confirming the close trend highlighted in Figure 2b,c, where an intermediate behavior between phytic and acetic acids (the latter probably showing a lower level of ionic current) was established. Interestingly, the trend seemed to correlate not only with the acidity constant of the organic additives used in the present analysis and corresponding to ~1.5 for phytic, ~3.13 for citric, ~3.86 for lactic and ~4.76 for acetic acids [28,29] but also and more importantly with the molecular weight of the organic acids considered to be fully deprotonated in such a high-pH environment.
The integration of the anodic and cathodic I contributions and their ratio R = Q C Q A are very informative to account for the plasma regime present over the electrode. In fact, values > 1 are indicative of “soft plasma” [30,31] control, where the higher amount of cathodic I transmitted to the sample favors the suppression of intense discharges responsible for oxide destruction and loss of protectiveness. However, the R values collected in Table 2 are far from indicative of the occurrence of such phenomenon where a higher amount of transmitted anodic charge was always verified. Two R values were collected in case of PEO-LA and PEO-CI, compatibly with the two different I behaviors observed. A higher amount of anodic I was transmitted when no peak was present, with values tending to the one observed for phytic acid (0.31).

3.2. Oxide Morphology and Composition

The samples’ bulk structure was investigated according to XRD with diffractograms collected in Figure 4.
It was possible to see that all the samples presented both amorphous and crystalline characters with anatase, rutile and low quartz as the main crystal structures. Acetic acid (Figure 3a) promoted a lower coating growth, compared with other solutions, as the Ti metal intensities were substantially higher. Nonetheless, the presence of both TiO2 polymorphs, i.e., anatase and rutile, was detected. On the other hand, if the electrolytic bath was enriched with lactic (Figure 4b) or citric (Figure 4c) acid, rutile was the main phase composing the coating. Moreover, some intensities related to low quartz appeared, confirming a partial transition of amorphous silica to the crystalline form. PEO carried out in phytic acid induced the largest amount of amorphous SiO2 formation according to the broad feature observed in Figure 4d in the 2θ range ~28 ÷ 35°. It is not clear if the lower anatase and rutile reflections were related to a lower overall amount or to a sort of encapsulation effect [32], caused by the SiO2 layer that, generally, disposes in the top portion of the oxide coatings [33,34], thus altering the intensities of the peaks indicative of the underlying phases. Rietveld XRD quantification allowed us to estimate the relative amount of the crystalline phases present in the samples. The results are collected in Table 3.
It is possible to notice how the quantity of low quartz scaled with the I trend previously observed. In fact, phytic acid presenting a relatively smooth I distribution (see Figure 4d) did not allow crystalline SiO2 to stabilize; however, this was enhanced when current surges manifested.
After encapsulation, in epoxy resin, and cutting by metal shearing, sample cross-sections were analyzed by SEM-EDS and the results are highlighted in Figure 5. In agreement with previous observations, advanced by looking at Ti XRD reflections, PEO-AC determined the lower oxide growth (~4.5 µm), while, when using phytic acid as organic additive, a coating of ~32.5 µm developed. Similar I trends resulted in comparable thicknesses for the samples PEO-LA (~19.35 µm) and PEO-CI (~19.53 µm). Morphology was greatly affected by the type of additive used in the electrolytic bath; in fact, when using acetic acid, a coating mainly constituted by agglomerated particles resulted. Two layers composed PEO-LA, PEO-CI and PEO-PH (see Figure 5g,m,s), namely, one in contact with the metal with similar features to PEO-AC and one thick upper region with evidence of densification occurred by the plasma generated during the process. PEO-PH, in particular, appeared quite friable, as part of the coating was often detached during the encapsulation procedure in the epoxy resin.
This was confirmed by looking at the coating weights collected in Section 3.3, where, despite the larger thickness, PEO-PH presented a lower weight gain than both PEO-LA and PEO-CI. The coating growth rates were evaluated, presenting 0.84 µm·min−1 for PEO-AC, 3.63 µm·min−1 for PEO-LA, 3.66 µm·min−1 for PEO-CI and 6.09 µm·min−1 for PEO-PH. These results suggest an important influence of the additive used on the kinetics of growth of the coatings; this aspect is deepened in Section 4.
The EDS analysis over oxide cross-sections allowed us to discern the presence of both elements belonging to the electrolyte (such as Si, Na, O and C, plus P for PEO-PH) and to the substrate (Ti). In particular, Si was found to be very abundant for all the oxides apart from PEO-PH where accumulation in the form of agglomerates resulted. In addition, Na and C were present inside the coating, mainly disposing in the upper oxide portion, sign that these cations were mainly incorporated inside the material during the plasma event. This is particularly true for PEO-AC and PEO-PH, demonstrating a higher C retention even in the deepest region of the coating. The addition of phytic acid, instead, permitted P to accumulate inside the coating, disposing, in particular, at the oxide bottom.
The SEM-EDS analysis confined to the samples’ surfaces (Figure 6) allowed us to distinguish different morphologies depending on the organic additive used.
In particular, when using acetic acid, a porous surface, common [35] to PEO treatments performed in low pH environments [3,7], developed with pore diameters of ~0.98 ± 0.3 µm. The pores’ number was substantially reduced when using lactic (Figure 6 and Figure 7) and citric (Figure 6m, even if their size was markedly increased (~4.64 ± 2.1 µm for PEO-LA and ~18.5 ± 3.4 µm for PEO-CI). Moreover, when using lactic acid, acicular deposits formed over the surface, demonstrating a homogeneous elemental composition with respect to the background. Apart from the sample PEO-AC, large cracks cut the sample surfaces departing from the holes left by discharges, a result compatible with the stress release generated by the abrupt cooling of the melted oxide. A very different morphology was observed when dealing with phytic acid, characterized by roundly shaped agglomerates, sometimes crossed by pores (diameter of ~4.34 ± 1.1 µm) as a result of a spark event.
The presence of these hollow protuberances is indicative of the condensation of a molten oxide with high viscosity and presence of abundant gas evolution exerting high pressure responsible for this hemispherical shape formation [36]. Irrespectively of the organic additive used, Ti, O, Si, Na and C were always present over the electrode surfaces. Ti in particular seemed to concentrate, in the case of PEO-LA, around the central hole highlighted in Figure 6 and Figure 7, while it seemed rather homogeneously distributed over the surface for all the other samples. Similar results manifested when looking at the Si, O and Na signals for PEO-LA, PEO-CI and PEO-PH, indicating that those elements actively participated in the discharge process. It is difficult to draw similar observations for the sample PEO-AC, as the relatively homogeneous morphology did not allow us to separate relevant features from EDS inspection. Interestingly, a relatively high C signal was detected in Figure 6l,r in the case of PEO-LA and PEO-CI near the hole boundaries.
For the elemental quantifications purpose, a GD-OES analysis was performed and the results are displayed in Figure 7, with element quantities expressed as molar concentrations (%).
The thickness values seemed to well agree with the data extracted via SEM, confirming PEO-AC to be the thinner oxide and the addition of phytic to favor the growth of the thickest coating. Looking at the molar concentration of the elements present in the sample PEO-AC (Figure 7a) permitted us to speculate the synthesis of structures different from TiO2 and SiO2, such as titanium silicide. However, as the former phase was not detected by the previous XRD analysis, it should be assumed the formation of an amorphous structure if present. In the case of PEO-LA and PEO-CI, similar elemental profiles were observed to agree with the previous I trend and XRD analysis, highlighting TiO2 polymorphs, amorphous SiO2 and low quartz as the main phases. Interestingly, both PEO-CI and PEO-PH presented a smoother transition of Ti in correspondence of the oxide–metal interface, probably according to the formation of low valence oxide phases localized in the oxide region immediately in contact with the metallic substrate [37]. Apart from the sample PEO-AC, a Si peak denoted accumulation in correspondence of the metal–oxide interfacial region. C content was relatively low in all cases apart from the sample PEO-AC, correlating with previous EDS observations, while the presence of P for the sample PEO-PH was confirmed and enhanced at the coating bottom.
Light emitted during the electrochemical process was analyzed according to in situ OES and collected in the form of spectra as in Figure 8.
The main elements participating in the optical emission events were labeled according to the NIST database [38]. Generally, the most intense lines belonged to Ti, O, C and Si species. Interestingly, in case of PEO-AC, where a less developed spectrum agrees with a lower plasma intensity, Ti I (594.175 nm) was the most intense line, as opposed to other conditions facing Ti II (590.163 nm) as the species responsible for the most relevant optical transition. Apart from PEO-AC, all the treatments produced the transition line Ti IV (at 624.774 nm) related to the Ti3+ species. In addition, neutral carbon (C I) was always detected, while C2+ (C III at 540.836 nm) contribution was registered only when using phytic acid. The same result can be highlighted for Na II, O II and O IV, while O III was present in all treatments apart from PEO-AC.

3.3. Electrochemical Tests

Corrosion resistance was tested in free corrosion conditions in sulfuric acid. Weight losses were then converted into corrosion rates, collected in Table 4, by subtracting the weight of the coating introduced during PEO; this allowed us to limit the analysis to substrate dissolution only.
Despite the lower thickness, acetic acid addition allowed all the other materials to be outperformed by almost one order of magnitude, resulting in a corrosion performance even better than the one registered by Ti grade 7 (C.R. ~0.21 mm·year−1) [39] immersed in the same solution. The corrosion rates presented significant scattering. This can be attributed to the presence of weak spots localized at the samples’ edges determined by the establishment of long-lasting plasma as the result of electric field amplification.
To further investigate the response of the PEO oxides, EIS tests were carried out in the previous solution and the results are plotted in Figure 9 in the form of Nyquist and Bode representations.
Imaginary impedance versus frequency provides a rich source of information of the system under investigation. In fact, being the latter quantity independent of solution resistance, it is possible to extract the characteristic frequency of the process occurring over the electrode surface simply by reading the value in correspondence of the -Z″ peak. The presence of one peak is indicative of a single activation-energy-controlled corrosion reaction and the low relaxation frequency allows us to speculate a reaction controlled by diffusion of charged species inside the porosity of the oxide. As the Ecorr was always anodic with respect to the conduction band of the material (estimated ~ −0.2 V/SSCsat. in present conditions), no oxide reduction was expected to occur during the EIS tests. Higher impedance values were observed in the cases of PEO-PH and PEO-AC, presenting larger semicircle diameters and a lower characteristic frequency, sign that diffusion phenomena occurred in a slower time scale with respect to other samples. Since the slopes of the -Z″ significantly differed from +1 and −1, indicating the presence of distributed processes, a constant phase element was used instead of the capacitor in the Randles circuit (Rs-Rct//CPE) fitting Z spectra, where Rs and Rct are indicative of solution and charge transfer resistance. The results are collected in Table 5.
It is possible to see how PEO-LA and PEO-CI presented considerably lower Rct than the other samples. This could be related to the high degree of crystallinity reflected in the presence of the rutile and anatase domains observed via the XRD analysis. Conversely, PEO-AC and PEO-PH were found to be less crystalline, especially the latter, presenting a higher amorphous character probably favored by the presence of P. This was considered the reason why the substantial Rct reduction. However, even if, from an electrochemical point of view, PEO-PH demonstrated enhanced surface properties, the rough architecture permitted coating debonding to occur quite early, exposing the substrate to the aggressive solution and resulting in high corrosion rates. On the other hand, PEO-AC exhibited both high Rct and debonding resistance to long-time exposure in sulfuric acid at high temperature, indicative of better overall performances in low pH service. The exponent “n” of the constant phase element, used to approximate the capacitive behavior of the system, largely deviated from 1, compatibly with the high dispersion caused by inhomogeneities and surface roughness.
Cyclic voltammetry and Tafel analysis were performed on each PEO solution with the aim of investigating the electrochemical behavior of the metal far from Ecorr. An anodic peak was detected for all the solutions tested, as illustrated in Figure 10a. According to the absence of a cathodic current peak, this wave should correspond to a dissolution phenomenon [40], as predicted by the Pourbaix diagram [41], leading to the formation of titanates.
TiO 2 + 2 NaOH = NaTiO 3 + H 2 O
However, since, after the anodic wave, i stabilized towards low anodic values, sudden repassivation with formation of TiO2 was expected to happen. As the anodic current peak (iaCV) was lower, ~0.004 A·cm−2, in the case of PEO-AC, it was reasonable to assume the adsorption of acetates to control and limit both titanates’ formation and subsequent repassivation, compatibly with the huge anodic Tafel coefficient ba ~3780 mV·decade−1, collected in Table 6, after Tafel analysis. Metal passivation was more efficient when using phytic and lactic acid. This can be demonstrated by the lower cathodic current plateau, ic, observed at very cathodic potentials limiting the kinetics of water reduction. On the other hand, in the presence of acetic acid, ic was substantially higher, sign that, after the anodic cycle, substrate passivation was less effective. Even if these results can be used to justify the overall lower oxide growth, they do not provide explanation for why acetic acid should favor the retention of such a high level of Si inside the material, leading to the speculation about the formation of titanium silicide-like phases. The justification of the latter finding deserves more in-depth studies and will be afforded in future papers.
The two vertical black dotted lines drawn in Figure 10a (line 1 and line 2) are indicative of the potentials at which the two EIS tests were performed for all the solutions used during PEO, i.e., 0.5 V/SSCsat. (Figure 11a) and 1.5 V/SSCsat. (Figure 11b), before and in correspondence of the anodic wave observed during the CV tests. It is possible to see that one-time constant was always present, compatibly with the electrode passivity held at low anodic potentials and reactivity shown at higher voltages.
The considerably higher impedances observed in the case of PEO-AC suggest the stronger tendency of acetates to limit charge transfer reactions at the electrode, while the contrary holds true in the case of phytic acid, favoring anodic reactions to occur. Things were different if performing EIS at 1.5 V/SSCsat, where the markedly lower impedance values and the formation of capacitive arcs, intersecting the real impedance axis, demonstrated higher dissolution currents to flow. The negative imaginary impedance plotted in Figure 11c is very informative about the time scale of the anodic dissolution process occurring over the electrode, with time constant inferable from the maximum of the -Z″ peak. This information, combined with the charge transfer resistance Rct, extractable from the intersection of the arc in Figure 11b with Z′, allows the capacitance C of the system to be calculated as in Equation (6).
f c = 1 2 π R c t C
where f c is the characteristic frequency of the dissolution process. The results are collected in Table 7. After C evaluation, the capacitor equation (Equation (7)) was used to extract the oxide film thickness d, produced according to the anodic polarization, considering a dielectric constant ε, for amorphous TiO2, equal to 13.7 [42], with A corresponding to the geometric area of the sample and ε o to the permittivity of vacuum.
C = ε o ε A d
The thickness values are coherent with the trend highlighted from the SEM analysis of the PEO oxide cross-sections, confirming smaller molecules to be more effective in anodic reactions’ inhibition and consequent film growth.

4. Discussion

Several characterization techniques were applied with the aim of understanding how the addition of different organic additives affect the evolution of the plasma process responsible for the material synthesis. Figure 12 delineates the evolution of the PEO process appearing strongly affected by the different organic acids added to the alkaline bath.
In particular, PEO-AC presented numerous small and homogeneously distributed white discharges very similar to light emissions produced during PEO performed in sulfuric acid electrolyte [3,7,34], where the absence of an orange-like hue accounts for the relatively low thickness of the growing layer. In fact, in all the other cases, orange-like sparks manifested, even in correspondence of 4 min of treatment, as localized spots with lower electrical resistivity. The abrupt I oscillations, visualized in Figure 3a, referred to PEO-AC, combined with the observation of short-lived sparks, allowed us to speculate the presence of processes involving the pinching-off of I. As a consequence, the discharges were not powerful enough to provide the oxidation required to thicken the coating and so to establish the necessary cell resistivity to sustain the dynamic evolution of the process. Consequently, this caused I to flow in the form of surges with a high electronic component contributing to the retention of an abundant number of cations, such as Na, C and Si.
This was confirmed by looking at the OES spectra demonstrating Si to enter the discharge channel with a +1 valence state, while the absence of O2+ lines indicates less oxidative conditions were provided during plasma formation over the PEO-AC sample. The abundant presence of Si can be the result of (1) the presence of type-B sparks creating preferential channels for Si ingress, or (2) the presence of high electric fields, as the result of the considerably thinner coating, enhancing electrophoretic motion of ions. Moreover, the high temperature involved during plasma formation and the presence of a cathodic half-cycle can favor faster kinetics of cathodic reactions, leading to Si formation, such as [43]
SiO2 + 4e → Si +2O2−
while the presence of acetate, found to inhibit most anodic reactions, can compromise the evolution of Equation (4), resulting in higher quantity of silicon species different from silicon dioxide.
A rather different plasma developed when using phytic acid; in fact, after 4:30 min, sparks started to coalesce in extremely large agglomerates, homogeneously covering a large portion of the electrode surface, which is a result, based on our experience, similar to PEO being carried out in NaOH without the use of any organic additive. Moreover, a considerably higher amount of gas can be evidenced from Figure 12p–t, with respect to other conditions and according to the surface morphology previously observed. Reasons behind this observation can be double; on one hand, it is generally expected to have abundant oxygen evolution in presence of soda, particularly when phytates are not efficient in shielding charge transfer, leading to oxidation and parasitic reactions such as the one describing hydroxyl ions losing their electrons at the anode–2OH = O2 + 2H+ + 4e. This situation can be partially avoided by adding small organic molecules (~60.052 g·mol−1), such as acetates, efficiently covering the electrode surface, thus limiting the overall charge transfer. However, phytates possess more than ten times higher molecular weight (~660.029 g·mol−1) than the former anion, posing reasonable concerns regarding their ability to efficiently cover the electrode surface, shielding reactions responsible for gas evolution and for discharge current to flow. As a result, by comparing molecular parameters, the process evolution seems to be affected by the molecular weight of the organic additive, with acetic acid (the smaller molecule) providing the most intense plasma suppression, while phytic acid the least intense one. Secondly, it is worth considering the role of decomposition products of phytic acid according to the high temperatures developed during plasma discharges. It was reported by others [44] that, for T > 380 °C, decarbonation of the phytate is prominent, resulting in CO2 evacuation and dehydration. This observation agrees with the O III-related lines extracted from the OES spectrum, particularly high in intensity and numerous for the sample PEO-PH. As a result, the additional gas evacuated according to previous thermal decomposition can be considered as a booster for plasma ignition and sustainment. Consequently, thickness increased even if the presence of large static long-lived discharges determined the growth of a porous, badly sintered, and low-adherent architecture much more similar to a deposition rather than to a high field growth. Silicates can generally favor the growth of a stable, compact, and uniform oxide layer; however, the negatively charged phytate can strongly chemically adsorb on the metal surface, during the high anodic potential, creating a dense network limiting the adsorption of negative ions such as silicates. This was demonstrated not only according to the low level of Si verified via EDS and GD-OES but also to the less noble Ecorr observed during the Tafel analysis.
This kind of plasma can, in principle, be described as superficial type-A or C in nature; in fact, a lower Ti content was previously evidenced from the EDS analysis results presented in Figure 5t and the GD-OES profile presented in Figure 7d, indicative of a lower tendency of substrate material to be ejected, as, instead, it generally happens in the presence of strong dielectric type-B discharges. However, not all the fragments of the phytate anion seemed to participate to the discharge event, as no P lines were found from the OES and no P appeared over the surface of PEO-PH sample in appreciable amounts. Nonetheless, based on the elemental profile highlighted during the GD-OES analysis and EDS along the coating cross-section, the presence of P, particularly concentrated at the oxide bottom, suggests phytates, or at least the fragments containing P, to take part to the initial oxide growth, probably affecting, in some measure and according to Albella’s theory [45], the subsequent avalanche breakdown phenomenon leading to spark initiation. Similarities arising from the observation of the electrochemical parameters between citric and lactic acids can be used to justify the comparable PEO regime evaluated through visual observation of the process and I trend seen in Figure 3b,c. As a consequence, oxides with comparable thickness, surface morphology and elemental distribution were synthetized. In the case of PEO-LA (see Figure 12g,h), artistic plasma filaments formed following the rise of gas bubble columns, while the slightly more localized and large plasma spots observed in the case of PEO-CI were compatible with the less numerous but larger pores seen in Figure 5m. This was beneficial in terms of corrosion resistance in concentrated sulfuric acid, with the reduction in the corrosion rate (~0.14 mm·year−1) by almost one order of magnitude with respect to PEO-LA (~1.15 mm·year−1).
The EIS analysis revealed surface properties to be highly dependent on the level of crystallinity of the oxides. In fact, Rct was considerably lower in the cases of PEO-LA (13,600 Ω·cm2) and PEO-CI (9,780 Ω·cm2), presenting a high level of anatase and rutile crystallites. On the other hand, PEO-PH denoted a highly disordered character with a high degree of amorphicity, mainly dependent on the presence of P, conferring a high Rct (49,300 Ω·cm2). Apart from charge transfer, even diffusion through the oxide layer porosity can be roughly estimated according to EIS by using Equation (9).
f c = D l 2
where fc has the usual meaning, D is the diffusion coefficient of charged species in the diffusion process along the length l. The results agree with the corrosion rates evaluated through the weight losses, demonstrating diffusion of charged species to be two orders of magnitude lower in the case of PEO-AC (5.06·10−9 cm2·s−1) with respect to PEO-LA (2.40·10−7 cm2·s−1), PEO-CI (2.40·10−7 cm2·s−1) and PEO-PH showing the highest value of 2.64·10−7 cm2·s−1. The numbers clearly demonstrate the diffusion process to mainly occur in the liquid phase, as, generally, solid state diffusion of charged species such as protons in titanium oxide systems attains values ~ 10−12 cm2·s−1 in present experimental conditions [46].

5. Conclusions

Organic additives were found to strongly interfere with the evolution of plasma electrolytic oxidation reactions. In particular, a correlation between the molecular weight of the organic matter used and plasma modulation was established, allowing us to further increase the level of knowledge of PEO technology. To a different extent, depending on the chemical properties of the additive used, coating qualities such as compactness, homogeneity and corrosion resistance were largely improved with respect to PEO treatments performed in an electrolytic bath not containing organic additives. After a detailed process and material characterization, the conclusions below could be drawn.
Acetates strongly affected charge transfer reactions: This contributed to pinch off the anodic current, limiting coating growth and crystallinity. For this reason, well-distributed and penetrating type-B discharges created a preferential path and high electric fields responsible for enhancing a homogeneous Si ingress along all the coating thickness (~4.5 µm). This resulted in a high molar concentration of Si, ~50% of Si, inside the coating, allowing us to speculate the formation of titanium silicide such as species compatibly with a lower presence of O (~20%).
Surface type-A plasma was stimulated upon the addition of phytic acid: Phytates did not compromise charge transfer for reactions involving metal oxidation and gas evolution, but, rather, due to the formation of a dense network, they limited the ingress of bulky anions such as silicates. This caused abundant deposition of a porous material (mainly in the form of Ti oxide), the formation of a thicker coating (~32.5 µm) and a low Si content. A rough architecture was obtained with considerable lack of adhesion between the particles composing the deposit, which, combined with a lower content of Si species (such as SiO2), determined the poorer corrosion resistance verified during long exposure in hot concentrated sulfuric acid.
Intermediate properties between PEO-AC and PEO-PH were observed when using lactates and citrates: The latter anions permitted the growth of thick oxides (~20 µm) with a high level of anatase and rutile and even the presence of low quartz. This, combined with the similar current trends observed during the process, further strengthens the possibility to modulate plasma formation responsible for oxide structure, composition, and morphology, depending on the molecular weight of the organic additives used during the process.
The best corrosion resistance properties were attained when using acetic acid: Despite the relatively low thickness, coatings formed in an alkaline bath containing acetic acid outperformed the other conditions tested, showing a corrosion rate of ~0.06 mm·year−1. Surface properties, investigated in 10% v/v H2SO4 at 60 °C, gave PEO performed with the addition of acetic acid the best resistance to coating debonding after 24 h free corrosion. The EIS tests performed in the same solution indicated the presence of a diffusion-controlled corrosion process. Despite the considerably lower thickness, mass transport in PEO-AC occurred with a similar time scale with respect to PEO-PH, compatibly with the higher compactness when using acetates in the PEO solution. Consequently, the diffusion coefficient evaluated via EIS for PEO-AC (~5.06·10−9 cm2·s−1) presented a magnitude almost two orders lower than the other coatings. The lower charge transfer resistance attained when using lactates and citrates is a consequence of the higher degree of crystallinity imparted to the oxide layers during PEO.

Author Contributions

Conceptualization, L.C. and F.C.; methodology, L.C. and F.C.; writing-original draft preparation, L.C., F.C. and M.O.; writing-review and editing L.C., M.O. and M.P. All authors have read and agreed to the published version of the manuscript.

Funding

This research received no external funding.

Institutional Review Board Statement

Not applicable.

Informed Consent Statement

Not applicable.

Data Availability Statement

The data presented in this study are available on request from the corresponding author.

Conflicts of Interest

The authors declare no conflict of interest.

References

  1. Clyne, T.W.; Troughton, S.C. A review of recent work on discharge characteristics during plasma electrolytic oxidation of various metals. Int. Mater. Rev. 2019, 64, 127–162. [Google Scholar] [CrossRef] [Green Version]
  2. Aliofkhazraei, M.; Macdonald, D.D.; Matykina, E.; Parfenov, E.V.; Egorkin, V.S.; Curran, J.A.; Troughton, S.C.; Sinebryukhov, S.L.; Gnedenkov, S.V.; Lampke, T.; et al. Review of plasma electrolytic oxidation of titanium substrates: Mechanism, properties, applications and limitations. Appl. Surf. Sci. Adv. 2021, 5, 100121. [Google Scholar] [CrossRef]
  3. Casanova, L.; Vicentini, L.; Pedeferri, M.; Ormellese, M. Unipolar plasma electrolytic oxidation: Waveform optimisation for corrosion resistance of commercially pure titanium. Mater. Corros. 2020, 72, 1091–1104. [Google Scholar] [CrossRef]
  4. Jiang, B.L.; Wang, Y.M. Plasma electrolytic oxidation treatment of aluminium and titanium alloys. In Surface Engineering of Light Alloys; Elsevier: Amsterdam, The Netherlands, 2010; pp. 110–154. [Google Scholar] [CrossRef]
  5. Nabavi, H.F.; Aliofkhazraei, M.; Rouhaghdam, A.S. Electrical characteristics and discharge properties of hybrid plasma electrolytic oxidation on titanium. J. Alloys Compd. 2017, 728, 464–475. [Google Scholar] [CrossRef]
  6. Hussein, R.O.; Nie, X.; Northwood, D.O. An investigation of ceramic coating growth mechanisms in plasma electrolytic oxidation (PEO) processing. Electrochim. Acta 2013, 112, 111–119. [Google Scholar] [CrossRef]
  7. Casanova, L.; La Padula, M.; Pedeferri, M.; Diamanti, M.V.; Ormellese, M. An insight into the evolution of corrosion resistant coatings on titanium during bipolar plasma electrolytic oxidation in sulfuric acid. Electrochim. Acta 2021, 379, 138190. [Google Scholar] [CrossRef]
  8. Sastri, V.S. Green Corrosion Inhibitors: Theory and Practice; Winston Revie, R., Ed.; Wiley: Singapore, 2011; ISBN 978-1-118-01543-8. [Google Scholar]
  9. Guinon, J.L.; Garcia-Anton, J.; Perez-Herranz, V.; Lacoste, G. Corrosion of carbon steels, stainless steels, and titanium in aqueous lithium bromide solution. Corrosion 1994, 50, 240–246. [Google Scholar] [CrossRef]
  10. Yerokhin, A.L.; Lyubimov, V.V.; Ashitkov, R.V. Phase formation in ceramic coatings during plasma electrolytic oxidation of aluminium alloys. Ceram. Int. 1998, 24, 1–6. [Google Scholar] [CrossRef]
  11. Matykina, E.; Arrabal, R.; Scurr, D.J.; Baron, A.; Skeldon, P.; Thompson, G.E. Investigation of the mechanism of plasma electrolytic oxidation of aluminium using 18O tracer. Corros. Sci. 2010, 52, 1070–1076. [Google Scholar] [CrossRef]
  12. Hussein, R.O.; Nie, X.; Northwood, D.O.; Yerokhin, A.; Matthews, A. Spectroscopic study of electrolytic plasma and discharging behaviour during the plasma electrolytic oxidation (PEO) process. J. Phys. D Appl. Phys. 2010, 43, 105203. [Google Scholar] [CrossRef]
  13. Jovović, J.; Stojadinović, S.; Šišović, N.M.; Konjević, N. Spectroscopic characterization of plasma during electrolytic oxidation (PEO) of aluminium. Surf. Coat. Technol. 2011, 206, 24–28. [Google Scholar] [CrossRef]
  14. Sparks, M.; Mills, D.L.; Warren, R.; Holstein, T.; Maradudin, A.A.; Sham, L.J.; Loh, E.; King, D.F. Theory of electron-avalanche breakdown in solids. Phys. Rev. B 1981, 24, 3519–3536. [Google Scholar] [CrossRef]
  15. Brown, E.C. Phytic acid: An analytical investigation. Can. J. Chem. 1961, 39, 1290–1297. [Google Scholar] [CrossRef]
  16. Graf, E. Applications of phytic acid. J. Am. Oil Chem. Soc. 1983, 60, 1861–1867. [Google Scholar] [CrossRef]
  17. Zhang, K.; Hu, D.; Deng, S.; Han, M.; Wang, X.; Liu, H.; Liu, Y.; Xie, M. Phytic acid functionalized Fe3O4 nanoparticles loaded with Ti(IV) ions for phosphopeptide enrichment in mass spectrometric analysis. Microchim. Acta 2019, 186, 68. [Google Scholar] [CrossRef]
  18. Zhang, R.F.; Zhang, S.F.; Duo, S.W. Influence of phytic acid concentration on coating properties obtained by MAO treatment on magnesium alloys. Appl. Surf. Sci. 2009, 255, 7893–7897. [Google Scholar] [CrossRef]
  19. Zhang, R.F.; Xiong, G.Y.; Hu, C.Y. Comparison of coating properties obtained by MAO on magnesium alloys in silicate and phytic acid electrolytes. Curr. Appl. Phys. 2010, 10, 255–259. [Google Scholar] [CrossRef]
  20. Rashid, K.H. Effect of Acetic Acid on Electrochemical Behavior of Sealed AA2319-T3 Al-Alloys Anodized in Phosphoric Acid Electrolytes. Al-Khwarizmi Eng. J. 2015, 11, 1–7. [Google Scholar]
  21. Selimin, M.A.; Idris, M.I.; Abdullah, H.Z. Anodic Oxidation of Titanium in Acetic Acid for Biomedical Application. Adv. Mater. Res. 2015, 1125, 455–459. [Google Scholar] [CrossRef] [Green Version]
  22. Casanova, L.; Belotti, N.; Pedeferri, M.P.; Ormellese, M. Sealing of porous titanium oxides produced by plasma electrolytic oxidation. Mater. Corros. 2021, 72, 1894–1898. [Google Scholar] [CrossRef]
  23. Koczera, A.E.; Koczera, A. University of New Hampshire Scholars’ Repository the Effects of Carboxylic Acids in Aluminum Anodizing the Effects of Carboxylic Acids in Aluminum Anodizing. Master’s Thesis, University of New Hampshire, Durham, UK, 2017. [Google Scholar]
  24. Santos, J.S.; Rodrigues, A.; Simon, A.P.; Ferreira, C.H.; Santos, V.A.Q.; Sikora, M.S.; Cruz, N.C.; Mambrini, G.P.; Trivinho-Strixino, F. One-Step Synthesis of Antibacterial Coatings by Plasma Electrolytic Oxidation of Aluminum. Adv. Eng. Mater. 2019, 21. [Google Scholar] [CrossRef]
  25. So, S.; Lee, K.; Schmuki, P. Ultrafast growth of highly ordered anodic TiO2 nanotubes in lactic acid electrolytes. J. Am. Chem. Soc. 2012, 134, 11316–11318. [Google Scholar] [CrossRef] [PubMed]
  26. Alijani, M.; Sopha, H.; Ng, S.; Macak, J.M. High aspect ratio TiO2 nanotube layers obtained in a very short anodization time. Electrochim. Acta 2021, 376, 138080. [Google Scholar] [CrossRef]
  27. Sopha, H.; Spotz, Z.; Michalicka, J.; Hromadko, L.; Bulanek, R.; Wagner, T.; Macak, J.M. Bismuth Oxychloride Nanoplatelets by Breakdown Anodization. ChemElectroChem 2019, 6, 336–341. [Google Scholar] [CrossRef]
  28. Wood, E.J. Data for Biochemical Research (third edition): By R M C Dawson, D C Elliott, W H Elliott and K M Jones, pp 580. Oxford Science Publications, OUP, Oxford, 1986. £35/$59. ISBN 0-19-855358-7. Biochem. Edu. 1987, 15, 97. [Google Scholar] [CrossRef]
  29. Wheeler, C. Chemistry, 8th Edition (by Stephen S. Zumdahl and Susan A. Zumdahl). J. Chem. Educ. 2009, 86, 1273. [Google Scholar]
  30. Kamil, M.P.; Kaseem, M.; Ko, Y.G. Soft plasma electrolysis with complex ions for optimizing electrochemical performance. Sci. Rep. 2017, 7, 44458. [Google Scholar] [CrossRef]
  31. Tsai, D.S.; Chou, C.C. Review of the soft sparking issues in plasma electrolytic oxidation. Metals 2018, 8, 105. [Google Scholar] [CrossRef] [Green Version]
  32. Hanaor, D.A.H.; Sorrell, C.C. Review of the anatase to rutile phase transformation. J. Mater. Sci. 2011, 46, 855–874. [Google Scholar] [CrossRef] [Green Version]
  33. Lugovskoy, A.; Zinigrad, M.; Kossenko, A.; Kazanski, B. Production of ceramic layers on aluminum alloys by plasma electrolytic oxidation in alkaline silicate electrolytes. Appl. Surf. Sci. 2013, 264, 743–747. [Google Scholar] [CrossRef]
  34. Attarzadeh, N.; Ramana, C.V. Plasma electrolytic oxidation ceramic coatings on zirconium (Zr) and zralloys: Part i—Growth mechanisms, microstructure, and chemical composition. Coatings 2021, 11, 634. [Google Scholar] [CrossRef]
  35. Cui, X.; Kim, H.M.; Kawashita, M.; Wang, L.; Xiong, T.; Kokubo, T.; Nakamura, T. Preparation of bioactive titania films on titanium metal via anodic oxidation. Dent. Mater. 2009, 25, 80–86. [Google Scholar] [CrossRef] [PubMed]
  36. Han, J.-X.; Cheng, Y.-L.; Tu, W.-B.; Zhan, T.-Y.; Cheng, Y.-L. The black and white coatings on Ti-6Al-4V alloy or pure titanium by plasma electrolytic oxidation in concentrated silicate electrolyte. Appl. Surf. Sci. 2018, 428, 684–697. [Google Scholar] [CrossRef]
  37. Casanova, L.; Arosio, M.; Taghi Hashemi, M.; Pedeferri, M.; Botton, G.A.; Ormellese, M. A nanoscale investigation on the influence of anodization parameters during plasma electrolytic oxidation of titanium by high-resolution electron energy loss spectroscopy. Appl. Surf. Sci. 2021, 570, 151133. [Google Scholar] [CrossRef]
  38. Ralchenko, Y.; Kramida, A. Development of NIST atomic databases and online tools. Atoms 2020, 8, 56. [Google Scholar] [CrossRef]
  39. Casanova, L.; Gruarin, M.; Pedeferri, M.P.; Ormellese, M. A comparison between corrosion performances of titanium grade 2 and 7 in strong reducing acids. Mater. Corros. 2021, 72, 1506–1517. [Google Scholar] [CrossRef]
  40. Moon, S.; Jeong, C.; Byon, E.; Jeong, Y. Electrochemical Behavior of Titanium in NaOH Solutions. ECS Trans. 2019, 1, 151–156. [Google Scholar] [CrossRef]
  41. De Oliveira, V.M.C.A.; Aguiar, C.; Vazquez, A.M.; Robin, A.L.M.; Barboza, M.J.R. Corrosion behavior analysis of plasma-Assited PVD coated Ti-6Al-4V alloy in 2 M NaOH solution. Mater. Res. 2017, 20, 436–444. [Google Scholar] [CrossRef] [Green Version]
  42. Lee, W.G.; Woo, S.I.; Kim, J.C.; Choi, S.H.; Oh, K.H. Preparation and properties of amorphous TiO2 thin films by plasma enhanced chemical vapor deposition. Thin Solid Films 1994, 237, 105–111. [Google Scholar] [CrossRef]
  43. Jiang, T.; Xu, X.; Chen, G.Z. Silicon prepared by electro-reduction in molten salts as new energy materials. J. Energy Chem. 2020, 47, 46–61. [Google Scholar] [CrossRef]
  44. Daneluti, A.L.M.; Matos, J.d.R. Study of thermal behavior of phytic acid. Braz. J. Pharm. Sci. 2013, 49, 275–283. [Google Scholar] [CrossRef] [Green Version]
  45. Albella, J.M.; Montero, I.; Martinez-Duart, J.M. A theory of avalanche breakdown during anodic oxidation. Electrochim. Acta 1987, 32, 255–258. [Google Scholar] [CrossRef]
  46. Hupfer, A.J.; Monakhov, E.V.; Svensson, B.G.; Chaplygin, I.; Lavrov, E.V. Hydrogen motion in rutile TiO2. Sci. Rep. 2017, 7, 17065. [Google Scholar] [CrossRef] [PubMed] [Green Version]
Figure 1. Optical image of Ti PEO oxide produced in an alkaline solution containing silicates.
Coatings 12 00143 g001
Figure 2. Voltage–time trend of PEO-treated samples in (a) acetic, (b) lactic, (c) citric and (d) phytic acids.
Coatings 12 00143 g002
Figure 3. Current–time curves at the ms time scale of PEO-treated samples in (a) acetic, (b) lactic, (c) citric and (d) phytic acids.
Coatings 12 00143 g003
Figure 4. Diffractograms of (a) PEO-AC, (b) PEO-LA, (c) PEO-CI and (d) PEO-PH.
Coatings 12 00143 g004
Figure 5. SEM-EDS analysis of PEO-AC (from a to f), PEO-LA (from g to l), PEO-CI (from m to r) and PEO-PH (from s to y).
Coatings 12 00143 g005
Figure 6. SEM-EDS analysis of PEO-AC (from a to f), PEO-LA (from g to l), PEO-CI (from m to r) and PEO-PH (from s to x).
Coatings 12 00143 g006
Figure 7. GD-OES profiles of samples PEO-AC (a), PEO-LA (b), PEO-CI (c) and PEO-PH (d).
Coatings 12 00143 g007
Figure 8. Optical emission spectra of samples PEO-AC (a), PEO-LA (b), PEO-CI (c) and PEO-PH (d).
Coatings 12 00143 g008
Figure 9. (a) Nyquist and (b) Bode representations of PEO oxides immersed in 10% v/v sulfuric acid at 60 °C.
Coatings 12 00143 g009
Figure 10. Cyclic voltammetry (a) and potentio-dynamic plot (b) of samples immersed in PEO electrolytes.
Coatings 12 00143 g010
Figure 11. Nyquist representation of Ti samples immersed in PEO solutions tested at (a) 0.5 V/SSCsat., (b) 1.5 V/SSCsat. and (c) relative imaginary impedance.
Coatings 12 00143 g011
Figure 12. Visual observation of the PEO process developed using acetic acid (from a to e), lactic acid (from f to j), citric acid (from o to k) and phytic acid (from p to t).
Coatings 12 00143 g012
Table 1. Sample labels and PEO electrolyte parameters.
LabelBasic SolutionOrganic AdditiveConductivity (µS)pH
PEO-AC1 M NaOH + 4 g·L−1 Na2SiO35 g·L−1 acetic acid127214.0
PEO-LA1 M NaOH + 4 g·L−1 Na2SiO35 g·L−1 lactic acid127414.0
PEO-CI1 M NaOH + 4 g·L−1 Na2SiO35 g·L−1 citric acid127214.0
PEO-PH1 M NaOH + 4 g·L−1 Na2SiO35 g·L−1 phytic acid127314.0
Table 2. R values evaluated according to integration of the anodic and cathodic I contributions of all PEO treatments.
Sample R = Q C Q A
PEO-AC0.56
PEO-LA0.42; 0.34
PEO-CI0.43; 0.23
PEO-PH0.31
Table 3. Rietveld XRD quantification results.
SampleAnatase %Rutile %Low quartz %Rwp
PEO-AC78.5719.871.5610.44
PEO-LA1.2296.851.937.05
PEO-CI1.1198.080.806.96
PEO-PH32.7067.28/8.12
Table 4. Weight-loss test results expressed in the form of corrosion rates (mm·year−1) for Ti coupons immersed in 10% v/v H2SO4 at 60 °C.
SampleCoating Mass (10−4 g)Standard DeviationC.R. (mm·year−1)Standard Deviation
123
PEO-AC8.001.010.000.180.000.10
PEO-LA92.3318.431.991.592.010.24
PEO-CI83.3310.500.120.270.030.12
PEO-PH62.677.573.622.602.330.67
Table 5. Experimental values extracted via EIS tests performed on samples immersed in 10% v/v H2SO4 at 60 °C.
SampleRs (Ω·cm2)Rct (Ω·cm2)Yo (µS·sn)nχ2
PEO-AC0.285283002900.7750.078
PEO-LA0.282136002580.7910.061
PEO-CI0.47597802930.7660.063
PEO-PH0.40349300970.7890.102
Table 6. Electrochemical parameters extracted according to cyclic voltammetry and Tafel analysis performed on Ti grade 2 samples immersed in PEO solutions.
SampleEcorr (mV/SSCsat.)ba (mV·decade−1)bc (mV·decade−1)iaCV (A·cm−2)
PEO-AC−29537803400.004
PEO-LA−3583781720.022
PEO-CI−3794432380.034
PEO-PH−5008802120.014
Table 7. Capacitance C and oxide thickness values d of parameters extracted from Equations (6) and (7).
SampleC (10−6 F·cm−2)d (nm)
PEO-AC14.186
PEO-LA10.2118
PEO-CI9.85123
PEO-PH8.42144
Publisher’s Note: MDPI stays neutral with regard to jurisdictional claims in published maps and institutional affiliations.

