Article

A Study on Impact of Different Surface Treatment Agents on the Durability of Airport Pavement Concrete

1
Aviation Engineering School, Air Force Engineering University, Xi’an 710038, China
2
94381 PLA Troops, Wuyishan 354300, China
*
Author to whom correspondence should be addressed.
Coatings 2022, 12(2), 162; https://doi.org/10.3390/coatings12020162
Submission received: 30 December 2021 / Revised: 24 January 2022 / Accepted: 26 January 2022 / Published: 27 January 2022
(This article belongs to the Special Issue Interface and Surface Modification for Durable Concretes)

Abstract

:
Concrete surface treatment is one of effective methods to increase the durability of concrete. This study chose tetraethyl orthosilicate (TEOS), lithium silicate (Li2SiO3), SiO2 nanoparticles (nano-SiO2) as surface treatment agents, tested their resistance to water penetration, chloride ion penetration, frost, sulfate erosion and abrasion of concrete specimens with different strengths, compared and evaluated the impacts to the durability of concrete by using three surface treatment agents, researched the impact of concrete strength on the surface treatment effects, and analyzed the mechanism of these surface treatment agents in connection with microscopic tests. It was found that all three agents can improve the durability of concrete, of which, the treatment effect from using tetraethyl orthosilicate (TEOS) was the best; however, along with the improvement of concrete strength, its other effects were gradually reinforced except for some small improvement effect in resistance to frost, which means it is an ideal concrete surface treatment agent; for lithium silicate (Li2SiO3), the improvement effect of resistance to frost was the best with little impact on the strength of the concrete, however, the other performance improvement effects were a little bit worse than that of tetraethyl orthosilicate (TEOS), which means it is more suitable for airport pavement with a higher concrete resistance to frost; For SiO2 nanoparticles (Nano-SiO2), the surface treatment effect was extreme limited, not recommended to be solely used for airport pavement with its requirement of high resistance to frost. Upon scanning electron microscope (SEM), X-ray diffraction (XRD), fourier transform infrared radiation (FTIR) and thermo gravimetric analyzer (TGA) tests, the surfaced concrete specimens did not produce any new substances, and the effect of the surface treatment agents was mainly to improve the concrete performance by physical filling, or by filling the cavities with the hydrated calcium silicate gel produced in the chemical reaction. These results may direct the selection of surface treatment agents in airport engineering.

1. Introduction

Concrete is a common building material, and due to sound strength and durability, it is widely applied in buildings, airports and roads [1,2]; in particular, it is used as a load-bearing pavement material for runways, taxiways, and connecting roads at military airports. However, in the interaction with the environment, concrete is damaged, and its function and life are impaired, especially on the surface of concrete pavement at the airport which is affected by aircraft load and unfavorable conditions [3,4]. When the pavement concrete is damaged or peeled off due to physical wear or chemical erosion in the process of use, it will not only endanger the takeoff or landing of aircraft, but also accelerate the intrusion of moisture, ions and other harmful substances, causing more adverse reactions [5,6]. Without preventive measures to delay the deterioration of concrete, it is very likely that serious structural damage or durability problems will occur within a short period of time [7], lowering the overall strength of the concrete and making its performance fail to meet requirements. However, the damage that often occurs on airport pavement is mainly shown as surface damage, without structural damage, and if methods such as reconstruction or overlapped pavement are applied, not only does the cost increase but it also impacts the normal running of the pavement of the airport. Therefore, a surface treatment for the concrete is a cost-saving and practicable measure [8,9].
A method through which concrete surface treatment can be used to avoid or delay structural damage to concrete structures is an extremely important strategy [10,11]. Chemical spray on the concrete surface may effectively seal the surface or block the pores of the surface concrete, enhance the compactness, prevent the infiltration of ambient water and ions, thereby improving durability [12]. Currently, there are mainly three kinds of concrete structure surfacing materials depending on their roles on the concrete surface [13]: (1) the pore infiltrating type; (2) the surface filming type; and (3) the pore sealing type. Among them, the “pore infiltrating type” material may penetrate into the pores of concrete and cover their surface by chemical reactions, but cannot enhance the compactness of the concrete surface, and when the porosity of concrete is low, the protective effect on the concrete structure will be greatly reduced [14]. A surface filming type of material contains organic materials, with good insulation effects but poor resistance to high temperature, which may cover the surface texture of the concrete and reduce friction, increasing the construction difficulties even if aggregates can be sprinkled on epoxy resin as a traffic anti-skid layer [15]. A pore sealing type of material may penetrate by itself or by its active substances into the concrete pores, and react in situ to seal the pores, which is a more effective concrete surfacing material. Therefore, it is very important to select a suitable surface treatment material for the maintenance and repair of airport pavement.
Tetraethyl orthosilicate (also referred to as TEOS) is a silicon organic compound widely used in strengthening and repairing weathered natural stone [16]. Over recent years, as a commonly used precursor for the synthesis of new materials, it has attracted increasing attention; for example, Pigino et al. [17] used TEOS as a surface protective agent for concrete structures, studied the water blocking and related performance of surfaced concrete, and achieved good technical results. TEOS has good permeability and pozzolanic activity, so it can significantly reduce the capillary suction, chloride ion diffusion coefficient and carbonization depth of concrete, and improve the frost resistance, corrosion resistance and abrasion resistance of concrete, performing well in concrete surfacing [18,19]. Nano-SiO2 is a new type of surfacing material. Evgenii M. Shcherban et al. [20] found that nano-SiO2 can improve the strength of lightweight fiber concrete. Barberena et al. [21] added nano-SiO2 and nano-lime to TEOS for cement mortar surfacing, where the addition of nano-lime (20% by volume) can reduce the total porosity but increase the water absorption of the mortar, while the addition of nano-SiO2 can reduce both the porosity and water absorption of mortar. Scarfato et al. [22] mixed nanoparticles into epoxy resin for concrete surfacing, where nano-fillers can improve the water permeability of surface concrete by blocking the pores of the concrete and reducing the diffusion of the polymer matrix. Pan et al. [23,24] systematically studied the effects of sodium silicate (Na2SiO3), sodium fluorosilicate (Na2SiF6), magnesium fluorosilicate (F6H12MgO6Si) and other surfacing materials on concrete performance, finding that the above-mentioned inorganic salt solutions can effectively reduce the carbonization depth, air permeability and water absorption of concrete, while sodium silicate and magnesium fluorosilicate can increase the surface hardness of concrete but have limited impact on the compressive strength of concrete, and sodium fluorosilicate solution can improve the surfacing effects of sodium silicate. Kuang et al. [25] found that Li2SiO3 can make the internal pores of concrete smaller and make the concrete denser, with better surfacing effects than sodium silicate and silane. Moreover, Li2SiO3 sol has higher modulus, higher SiO2 content, and smaller molecules than sodium and potassium, has excellent self-curing properties and water resistance, is not prone to efflorescence problems, so it is considered to be one of the most promising concrete surfacing agents [26].
In all, although TEOS, Li2SiO3 and nano-SiO2 perform well in concrete surface treatment, there is few systemic assessment between these three surfacing agents in terms of improvement effects on concrete performance, and even less research on the applicability of concreted airport pavement, therefore, this study compared and analyzed the impacts on durability of concrete with different strengths by using TEOS, Li2SiO3 and nano-SiO2 through tests of resistance to water penetration test, chloride penetration, frost, sulphate attack, and wearproof, explored the impacts on the concrete strength by using these three surface treatment agents, and researched the mechanism of action by microscopic experiments. Under this basis, a proposal on the applicability by using these three surface treatment agents for airport pavement engineering is raised.

2. Experimental Section
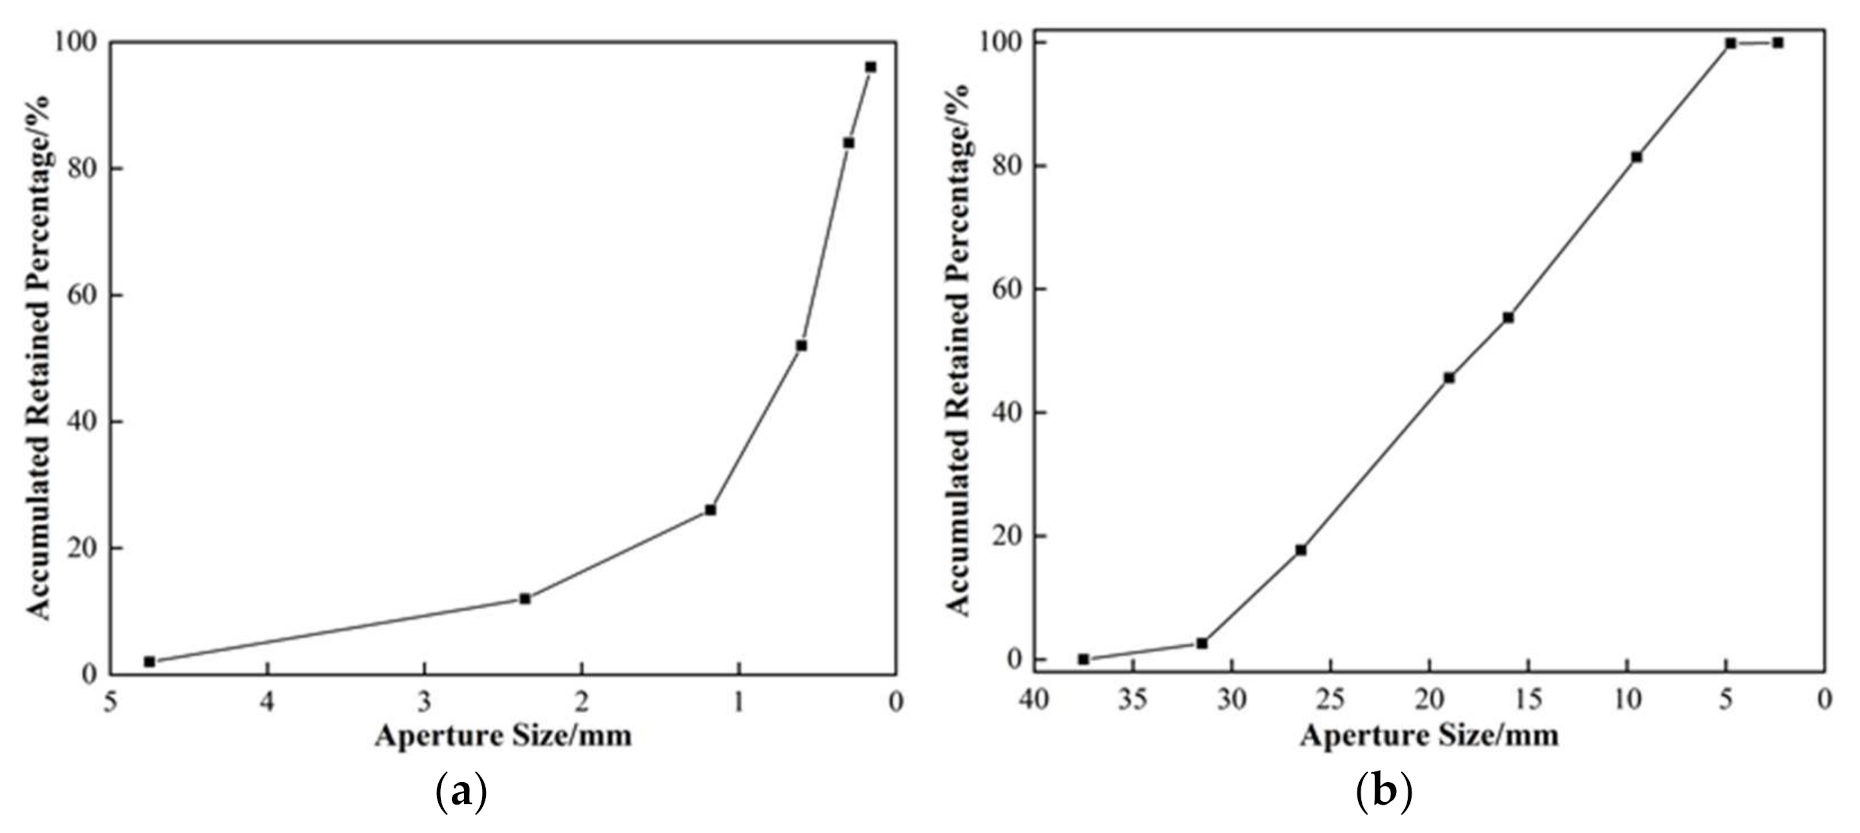
2.1. Materials

In this study, the cement used in the concrete was ordinary Portland cement 42.5 produced by Shaanxi Yaobai Cement Group, Xi’an, China, with specific surface area 344 m2/kg, initial/final set time of 150/260 min, 3 days flexural/crush resistance strength, 4.9/22.2 MPa, 28 days flexural/crush resistance strength, 7.9/48 MPa; the fine aggregate was made of river sand from Bahe River in Shaanxi Province, Xi’an, China, with fineness modulus 2.75, and apparent density 2.69 g/cm3, the river sand was washed and cleaned due to some disadvantages in resistance to penetration and frost while using sand with high silt content, see Figure 1a for grain gradation curve; the coarse aggregate was made of crushed limestone, prepared in the ratio of 1:2:3 in the three particle sizes 5–10mm, 10–20mm and 20–40 mm, see Figure 1b for grain gradation curve; the water reducing agent was the FDN water reducing agent produced by Zhanjiang Additive Factory; and the water was ordinary tap water.
In this study, the TEOS was a product of Shandong Fengpan New Materials Co., Ltd., Taian, China, the Li2SiO3 was the silicone penetration agent (mainly Li2SiO3) produced by Hunan Fenghang New Material Technology Co., Ltd., Changsha, China, and the nano-SiO2 was a product of Shanghai Zhichuang Fine Chemical Co., Ltd., Shanghai, China, with the parameters listed in Table 1, Table 2 and Table 3, where, N = not surfaced, L = surfaced with Li2SiO3, S = surfaced with nano-SiO2.

2.2. Concrete Mix Ratio

Under normal circumstances, the resistance to flexural strength of concrete pavement is often about 5.0–6.0 MPa [27], however, since the early flexural strength of newly built airport concrete and the flexural strength of concrete shoulders may be less than 5.0 MPa, and the flexural strength of the pavement concrete during service may be greater than 6.0 MPa, this study used three types of concrete with different flexural strengths, to reflect the possible situations faced by the surfacing agents during use, adopting the concrete mix ratios listed in Table 4, based on early test results, and numbered the 28 d flexural strengths as W4, W5 and W6 respectively.

2.3. Preparation of Concrete Specimens

The concrete specimens were prepared as per the methods listed in standard for test method of performance on ordinary fresh concrete GB/T 50080-2016 [28], in which the fine aggregate was mixed with dry cement for 30s without adding water at first, then a half of total water volume added to mix for 30s, finally, coarse aggregate added together with remaining water to continuously mix for 2 min. The mixing plant was a single-shaft horizontal mixer. The concrete specimen was poured into the mold after it was discharged and then placed the mold onto a high frequency vibro-stand for vibrating until no big bubbles could be seen on the surface of concrete. After a 24h molding process, the concrete test blocks were stripped and then placed into the standard curing room to be cured for 28 days.

2.4. Concrete Surface Treatment Methods

Based on recommendations from manufacturers of surface treatment agents and in connection with characteristics of different tests, this article used two surface treatment methods including coating and soaking, among them the coating treatment was applied for the resistance to water penetration test and wearproof test and the soaking treatment for the resistance to chloride ion penetration/frost test.
Coating treatment refers to a method to coat and brush the concrete specimen’s surface with brushes, with a coating volume of 300 g/m2 and coating for one time every 10 min, coating for 30 min in total. Soaking treatment refers to a method for putting the concrete specimen into a vessel filled with surface treatment agents, and the liquid level is kept higher than the top of concrete specimens up to 10mm, sustainable for 3 h.

2.5. Methods

2.5.1. Water Penetration Test

Tests were in accordance with the penetration height method listed in the standard for test methods of long-term performance and durability of ordinary concrete GB/T 50082-2009 [29]; truncated cone specimens (φ175 mm × φ185 mm × 150 mm) were used, taken out and dried after curing for 28 days, and the bottom surface (water-bearing surface) dried; the surface painted after drying; cured at T = 20 ± 2 °C, RH = 50% ± 10% indoors for 10 days after painting; and then sealed and molded. Tested after molding; the specimens taken out 24 h later, split and the penetration depth measured, 6 specimens per group, with the equipment SRINK-50 intelligent full-auto concrete impermeability tester manufactured by Beijing Sona Checking and Controlling Technology Co., Ltd., Beijing, China.

2.5.2. Chloride Penetration Resistance Test

Tests were in accordance with the chloride ion flux method under the standard for test methods of long-term performance and durability of ordinary concrete GB/T 50082-2009 [29], cone specimens (φ 100 mm × 50 mm) were used, taken out and dried after maintenance for 28 days; after drying and cooling, soaked in the surfacing agents for 3 h; taken out and dried at T = 20 ± 2 °C, RH = 50% ± 10% indoor conditions for 8 days; put in water and soaked for 2 days to ensure that the concrete was saturated with water; and then the sides of the specimens coated with epoxy resin; after the epoxy resin was cured, the vacuum saturation and electric flux test could be started, 3 specimens per group, with the equipment SRH-type intelligent concrete vacuum saturation machine and PER-6A-type concrete chloride ion electric flux tester manufactured by Beijing Sona Checking and Controlling Technology Co., Ltd., Beijing, China.

2.5.3. Frost Resistance Test

Tests were in accordance with the quick freezing method under the standard for test methods of long-term performance and durability of ordinary concrete GB/T 50082-2009 [29], prism specimens (100 mm × 100 mm × 400 mm) were used; after maintenance for 28 days, specimens were taken out and dried at T = 20 ± 2 °C, RH = 50% ± 10% indoor conditions for 10 days; then soaked in the surfacing agents for 3 h; taken out and continued curing at indoor conditions for 6 days; specimens soaked in the water tank of the standard curing room, and the test started after 4 days of soaking; specimens taken out and examined for apparent observation, quality measurement and dynamic modulus test per 25 cycles; after the test, the specimens were put back into the freeze–thaw machine, and the test equipment was TDR-16-type concrete rapid freeze–thaw testing machine and SRDT-60-type concrete dynamic modulus tester manufactured by Tianjin Gangyuan Test Instrument Factory, Tianjin, China.
Taking the relative dynamic elasticity modulus and mass loss rate as evaluation indicators, we calculated the Pi according to Formula (1), calculated the ΔWni according to Formula (2), and took the arithmetic averages of each group of 3 specimens as the average relative dynamic elasticity modulus P and the average quality loss rate ΔWn. The test was stopped when the P of the specimens dropped to 60% or ΔWn = 5%.
P i = f ni 2 f 0 i 2 × 100
Δ W ni = W 0 i W ni W 0 i × 100
The relative dynamic elasticity modulus of the i-th specimen after Pi-N cycles, %; the fundamental transverse vibration frequency of the i-th specimen after fni-N cycles, Hz; the fundamental transverse vibration frequency of the i-th specimen before the foi- freeze–thaw cycle, Hz; the mass loss rate of the i-th specimen after ΔWni-N cycles, %; the mass of the i-th specimen before the W0i-freeze–thaw cycle, g; the mass of the i-th specimen after Wni-N cycles, g.

2.5.4. Sulfate Corrosion Resistance Test

Tested with the method contained in the standard for test methods of long-term Performance and durability of ordinary concrete GB/T 50082-2009 [29], cube specimens (100 mm × 100 mm × 100 mm) were used, specimens taken out and dried after standard maintenance for 28 days; cooled down at T = 20 ± 2 °C, RH = 50% ± 10% indoor conditions after drying to substantially dry; soaked in surfacing agents for 3 h, after which specimens were taken out, continued curing at indoor conditions for 10 days; and then tested with the test equipment MKS-54B full-auto concrete sulfate dry–wet cycle test machine, manufactured by Beijing Sona Checking and Controlling Technology Co., Ltd., Beijing, China.
Counting the test in cycles, each cycle lasted for one day; the compressive strength of specimens was tested after 15, 30, 60 and 90 cycles. The Kf was calculated according to Formula (3), with 3 specimens per group.
K f = f cn f c 0 × 100
Kf—the compressive strength and corrosion resistance coefficient, %; fcn—the compressive strength of concrete after N dry–wet cycles, MPa; fc0 and fcn: the compressive strength of concrete in the same maintenance age with specimens, MPa.

2.5.5. Wear Resistance Test

Tests with reference to the test method for wear resistance of concrete and its products (ball bearing method) GB/T 16925-1997 [30] were carried out, cube specimens (150 mm × 150 mm × 150 mm) were used; after standard maintenance for 28 days, specimens were put in an oven and dried; the surface painted and kept curing at T = 20 ± 2 °C, RH = 50% ± 10% indoor conditions for 10 days; 5 specimens tested per group, with the test equipment NS-2 ball bearing type abrasion tester manufactured by Beijing Zhongke Donghua Equipment Co., Ltd., Beijing, China.
We calculated the wear resistance of specimens according to Formula (4).
I a = R P
Ia—wear resistance; R—grinding head revolutions, krpm; P—wear depth (final wear depth − initial wear depth), mm.

2.5.6. SEM Test

Scanning electron microscopy (SEM) test carried out with the Nova NanoSEM230 field emission scanning electron microscope manufactured by FEI Company, Hillsboro, OR, USA. After sampling the concrete, metal powder sprayed firstly, where the surfaced specimens were sampled at the position 1 mm below the sprayed surface; a scanning electron microscope was used to observe the microstructure of the concrete specimens before and after surface treatment with different surfacing agents; all photos were taken at the magnification of 20,000 times.

2.5.7. XRD, FTIR and TGA

After wear resistance test, drying and curing specimens were retained in indoor conditions for 30 days; then a steel wheel was used to scrape the surface of the concrete specimens, scraping depth 0–1mm below the surface; collect the concrete powder for XRD, FTIR and TGA tests. Among them, XRD test was carried out with the desktop X-ray powder analyzer manufactured by Bruker Corporation, Karlsruhe, Germany; FTIR test carried out with the Fourier transform infrared spectrometer manufactured by Germany-based Bruker Corporation, Karlsruhe, Germany; and TGA test carried out with the TG/DTA 6300 thermogravimetric analyzer manufactured by Japan-based Seiko Instruments Inc., Chiba, Japan.

3. Results and Discussion

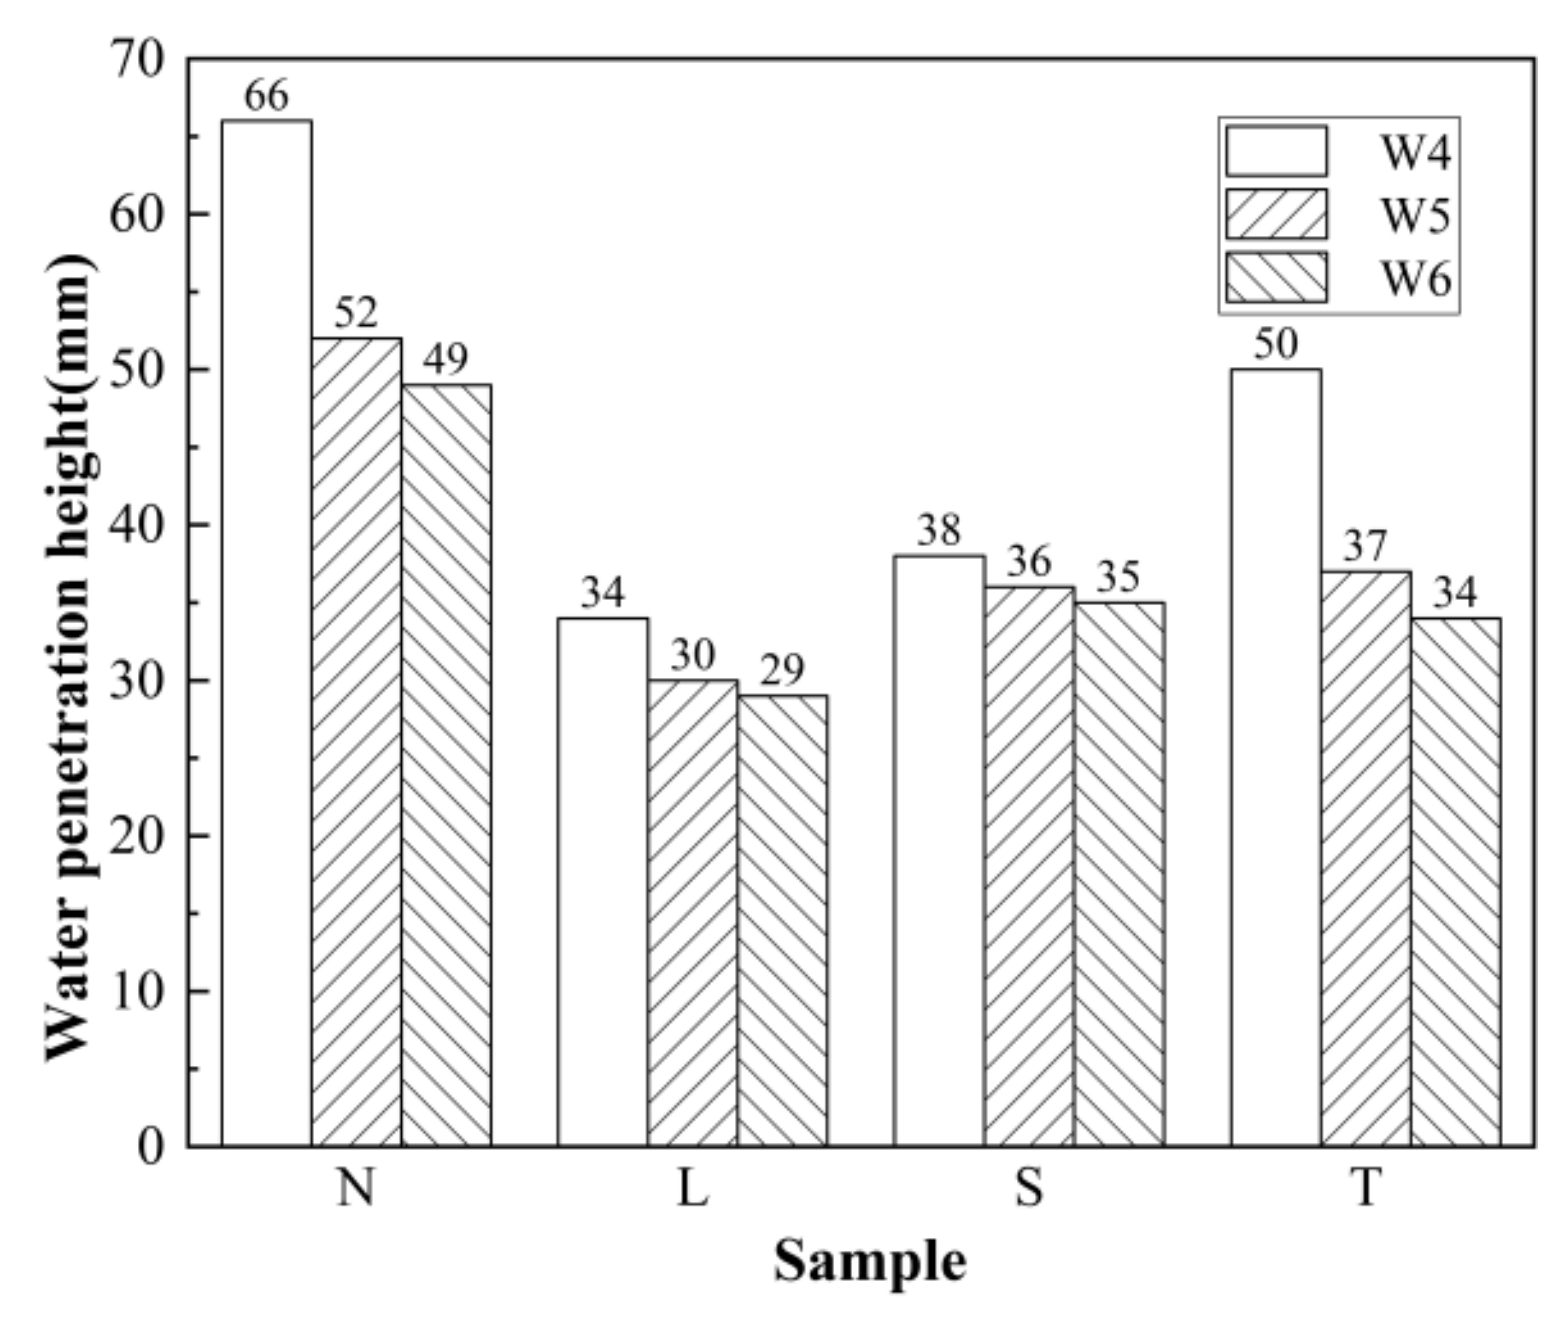
3.1. Water Penetration Test Results and Analysis

3.1.1. Impact of Different Surfacing Agents on the Water Penetration Resistance of Concrete

Figure 2 shows the water penetration height of the concrete before and after surface treatment, and Figure 3 shows the reduction rate of the water penetration height after surface treatment.
It is shown in Figure 2 and Figure 3 that Li2SiO3, nano-SiO2 and TEOS surfacing can effectively increase the concrete’s water penetration resistance. Among them, Li2SiO3 performed the best, with a penetration height of 29–34 mm, and over 40% reduction rate of penetration height; in the case of W5 or W6 concrete, TEOS performed as well as nano-SiO2, with a 34–37 mm penetration height, and around 30% reduction rate of penetration height; but in the case of W4 concrete, nano-SiO2 performed much better than TEOS, for example, the nano-SiO2 penetration height reduction rate reached 2.4%, while TEOS penetration height reduction rate reached only 24.2%. The reason is: the three surfacing agents can block pores and seal cracks in the concrete surface, and in addition, Li2SiO3 can form a transparent film on the test surface, while nano-SiO2 can form a large amount of powdery substance, covering the test surface with less strength than the film formed by Li2SiO3. The closed surface of the film and covering becomes the first barrier against moisture penetration, but the TEOS treatment has no filming effect on the concrete surface, however, because of more powerful penetration capacity while using TEOS, the improvement for resistance to water penetration of concrete is increasingly reinforced.

3.1.2. Water Penetration Resistance of Surfaced Concrete with Different Strengths

It is shown in Figure 2 and Figure 3 that as the concrete strength increased, the penetration heights of all specimens gradually reduced. The penetration heights of Li2SiO3 and nano-SiO2 surfaced specimens were less affected; when the concrete strengths were changing, the penetration heights of the surfaced specimens changed within 5 mm, indicating that the water penetration resistance of Li2SiO3 and nano-SiO2 surfaced concrete was less impacted by the concrete strengths, which might related to the filming of Li2SiO3 and nano-SiO2 on the surface of concrete; the penetration heights of TEOS surfaced concrete specimens were more affected by the concrete strengths, because after coating, the TEOS may have evaporated partially, while some would penetrate into the concrete, and only fill pores with reaction products to improve permeability, so when there are less pores with lower permeability, the same painting process would gain more surfacing effects [31]. Along with increasing concrete strength, the penetration height reduction rates of Li2SiO3 and TEOS surfaced specimens fell gradually, for example, the penetration height reduction rate of Li2SiO3 surfaced specimens fell from 48.5% to 40.8%, while that of nano-SiO2 surfaced specimens fell from 42.4% to 28.6%; in contrast, the penetration height reduction rate of TEOS surfaced specimens increased gradually, rising from 24.2% to 30.6%, just because TEOS mainly reacts with the hydration product portlandite to form a gel embedded in the capillary pores and fine cracks of the concrete; with increasing content of cement paste or reducing pores, the TEOS surfacing effect is enhanced.

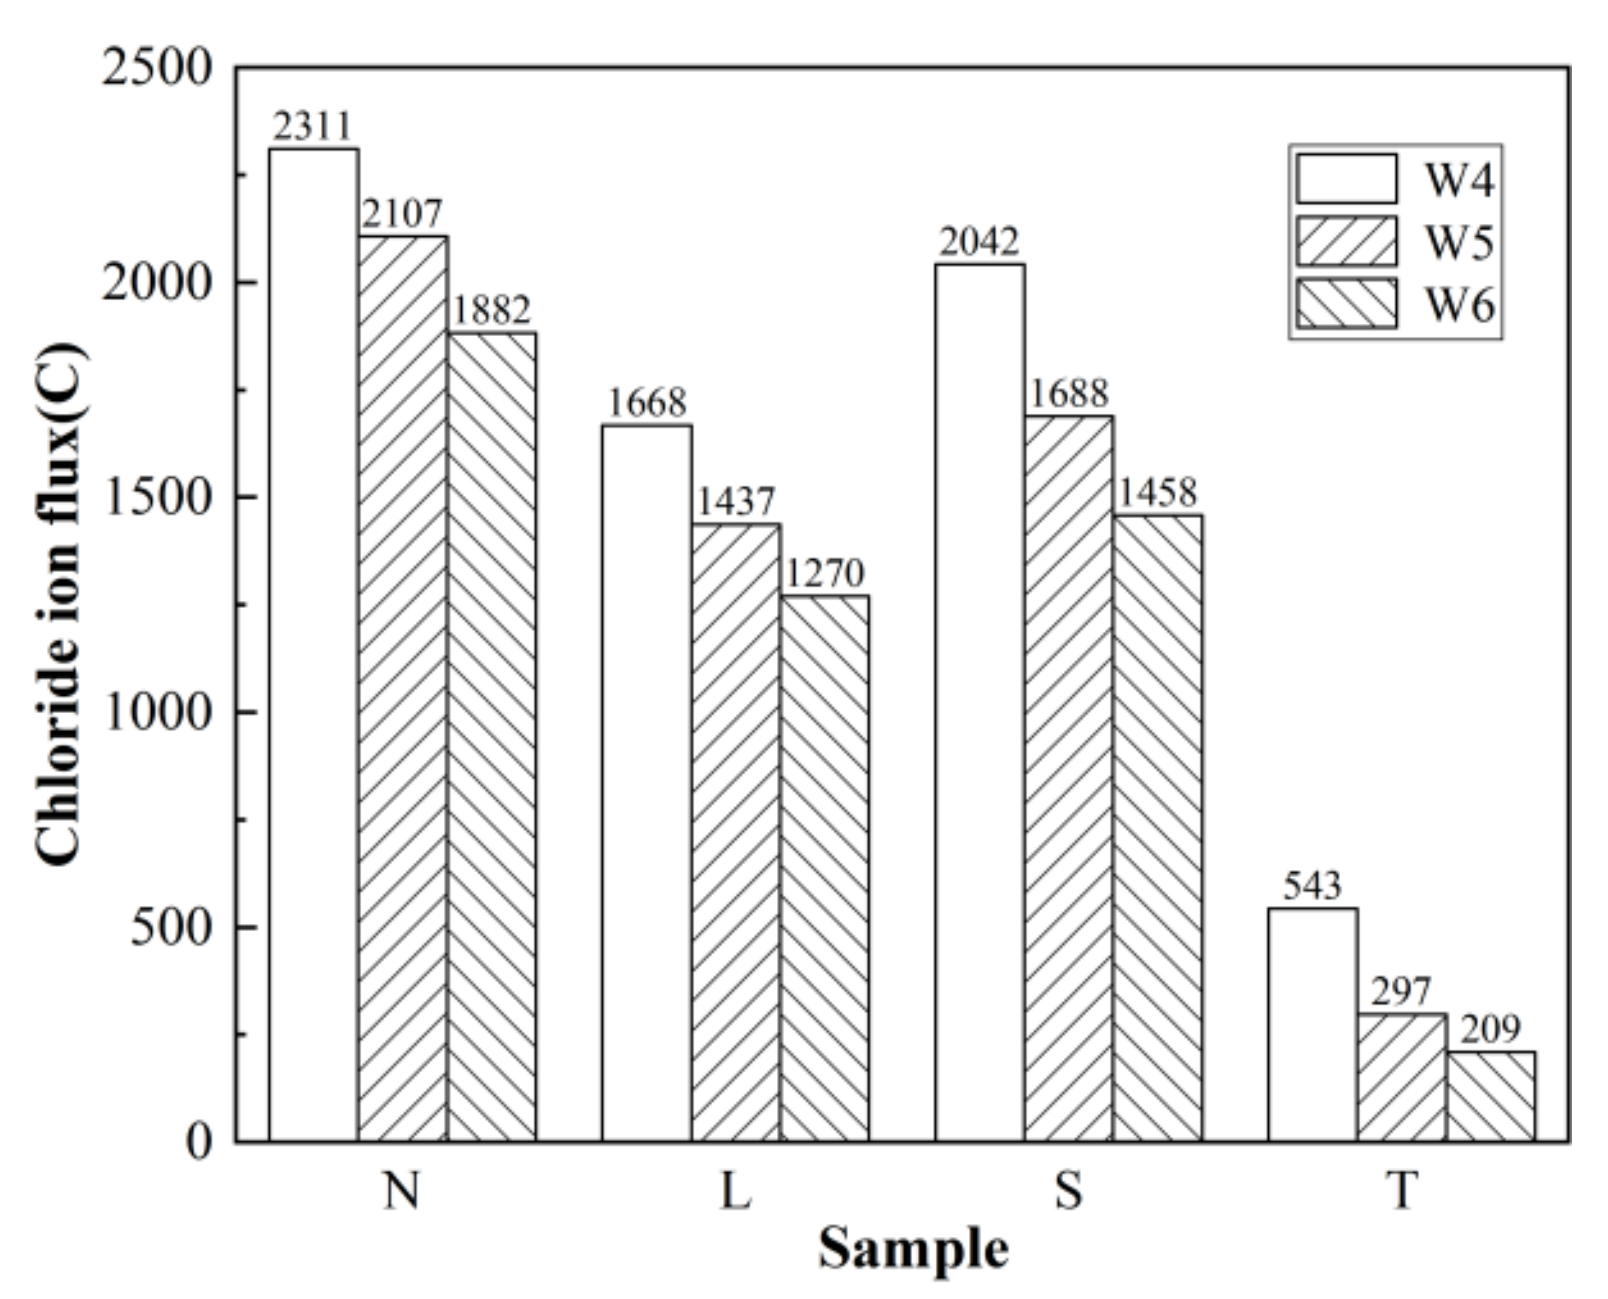
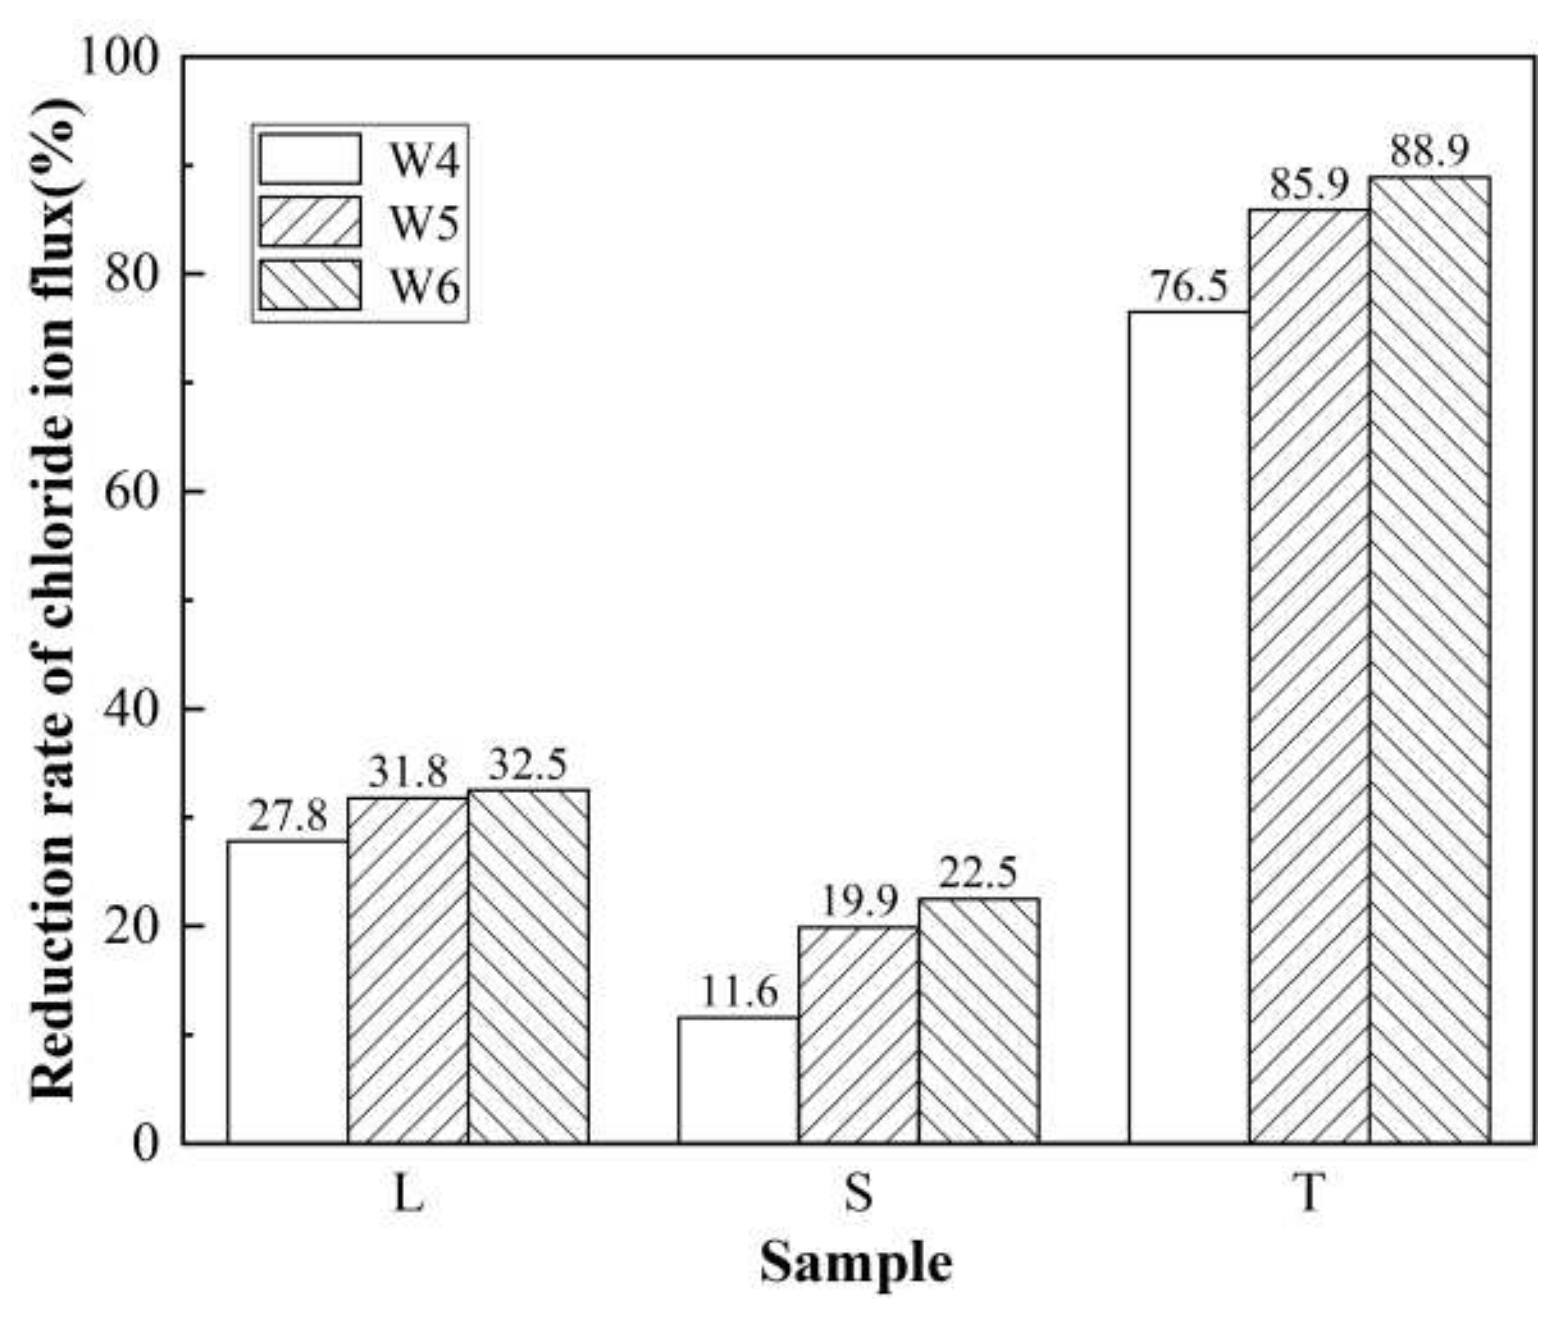
3.2. Rapid Chloride Penetration Test (RCPT) Results and Analysis

The relationship between concrete electric flux and chloride ion penetration is shown in Table 5 [32].

3.2.1. Anti-Chloride Ion Permeability of Concrete after Different Surface Treatments

Figure 4 shows the chloride ion flux of the concrete before and after surface treatment, and Figure 5 shows the reduction rate of the electric flux of concrete after the surface treatment.
It is shown in Figure 4 and Figure 5 that Li2SiO3, nano-SiO2 and TEOS could all effectively improve the anti-chloride ion permeability of concrete. Among them, TEOS performed the best, the 6 h electric fluxes of TEOS surfaced specimens were all less than 550 C, the penetration level was reduced to very low, and the reduction rate of electric flux was higher than 75%, and the highest reached 88.9%. The penetration level of Li2SiO3 surfaced specimens was low, with electric flux reduction rate 27.8–32.8%; the nano-SiO2 surfacing effect was relatively general, only reducing the W5 concrete chloride ion penetration level, and the highest electric flux reduction rate at 6 h was only 22.5%. The reason is: after the concrete is soaked in surfacing agents, the surfacing agents will react with hydration product to form a gel, which blocks the pores and microcracks, thereby reducing the chloride ion permeability of concrete. Compared with nano-SiO2, TEOS and Li2SiO3 performed better in reducing the pores < 100 nm [33], and TEOS treatment increased the contact angle of the concrete surface [34], to form a hydrophobic protective layer on the concrete surface and inner crack/pore surfaces, thus, the TEOS treatment had the most significant effect on reducing the chloride ion permeability of concrete.

3.2.2. Chloride Ion Permeability of Surfaced Concrete with Different Strengths

It is shown in Figure 4 and Figure 5 that, as the concrete strength increased, the chloride ion electric flux of all specimens gradually reduced. The electric flux of Li2SiO3 surfaced W5 and W6 concrete specimens was, respectively, 15.2% and 23.9% lower than that of the Li2SiO3 surfaced W4 concrete specimen; the electric flux of nano-SiO2 surfaced W5 and W6 concrete specimens was, respectively, 21.5% and 28.6% lower than that of the W4 concrete specimen; the electric flux of TEOS surfaced W5 and W6 concrete specimens was, respectively, 45.3% and 61.5% lower than that of W4 concrete specimens. The chloride ion flux reduction rate of the specimens treated with the three surfacing agents all went up with the increasing strengths of concrete, indicating the increased concrete strength may improve the anti-chloride ion permeability because the increase of concrete strength reduces the concrete permeability, weakens the connectivity of the capillary pores, reduces the pores, and thus the effects of the surfacing agents become more outstanding.

3.3. Frost Resistance Test Results and Analysis

During the test, it was found that the maximum mass loss rate ΔWn of concrete specimens calculated according to Formula (2) was much lower than 5%, so P was used as the key indicator for stopping the test.
Figure 6 shows the P curve of concrete before and after surface treatment.
It is shown in Figure 6 that the freeze–thaw damage of concrete increased gradually. When the concrete reached a certain degree of damage, P dropped rapidly, mainly because of increased cycles of freezing and thawing and further the obviously increased extension and connection of inner cracks inside the concrete; this resulted in the reduction of relative elasticity modulus. In the case of W4 concrete, the untreated specimens showed damage in the 75th to 100th freeze–thaw cycles; the Li2SiO3 or nano-SiO2 surfaced specimens showed damage in the 125th to 150th freeze–thaw cycles, while the TEOS surfaced specimens showed damage in the 150th–175th cycle; in the above cycles, the P dropped by more than 10%, indicating the surface treatment prolonged the time for the concrete to reach the mutation point, and the other two groups of concrete also showed similar trends. It is also shown that the difference in the frost resistance of the concrete after different surface treatments is mainly concentrated in the number of cycles when P = 90–100%. In the case of W6 concrete, the untreated specimens experienced 125 freeze–thaw cycles when P fell from 100% to 90%; the Li2SiO3 surfaced specimens experienced 175 freeze–thaw cycles when P fell from 100% to below 90%; the Nano-SiO2-surfaced specimens experienced 150 freeze–thaw cycles when P fell from 100% to below 90%; all specimens experienced 75 freeze–thaw cycles when P fell from below 90% to less than 60%. The other two groups of concrete also showed similar trends. Therefore, it can be considered that the main improvement of the concrete surface treatment is in the stage when P > 90%, where the arrival of the mutation point in the destruction process is delayed, and the relative dynamic elasticity modulus is reduced from 100% to below 90%. Once the concrete is damaged to a certain degree, the improvement effect of the surfacing material will drop sharply or even disappear. That is because when the concrete itself is damaged to a certain extent, the cracks on/in concrete are obviously increased, which means the compact layer under the action of the surface treatment agent is damaged and fallen off, and the protective effects are greatly weakened.

3.3.1. Frost Resistance of Concrete after Different Surface Treatments

Figure 7 shows the frost resistance grade of the concrete before and after surface treatment, and Figure 8 shows the improvement rate of the concrete’s frost resistance grade after surface treatment.
It is shown in Figure 7 that all the three surfacing agents can effectively improve the frost resistance grade of concrete. In the case of W4 concrete, TEOS surface treatment performed the best, while the Li2SiO3 and nano-SiO2 surface treatments performed similarly. Li2SiO3 and nano-SiO2 surface treatments increased the pavement concrete anti-frost grade up to F150, while TEOS increased that up to F175. In the case of W5 concrete, the three surfacing agents performed similarly, increasing the concrete anti-frost grade from F125 to F175; the Li2SiO3 and TEOS surfaced specimens experienced 150 freeze–thaw cycles when P > 80%. In the case of W6 concrete, the Nth specimen experienced 200 freeze–thaw cycles when P fell to 50.7%, and the anti-frost grade reached F175; the improvement effects of the surface treatments in W6 concrete were less than those in W4 and W5 concretes; the improvement effects of Li2SiO3 surface treatment were the most apparent, increasing the anti-frost grade from F175 to F225; while nano-SiO2 and TEOS surface treatments could only increase that to F200. The reason is that surfacing agents can penetrate into the concrete to block the pores on the surface, reduce the pore diameter, reduce the number of less harmful pores, harmful pores and more harmful pores, reduce the water capacity of the concrete, and meanwhile, reduce the water absorption rate of the concrete and the connectivity of the pores, increase the resistance of water migration, and reduce the water absorption volume of the concrete, thereby reducing freezing pressure and improving the frost resistance of the concrete [35,36].

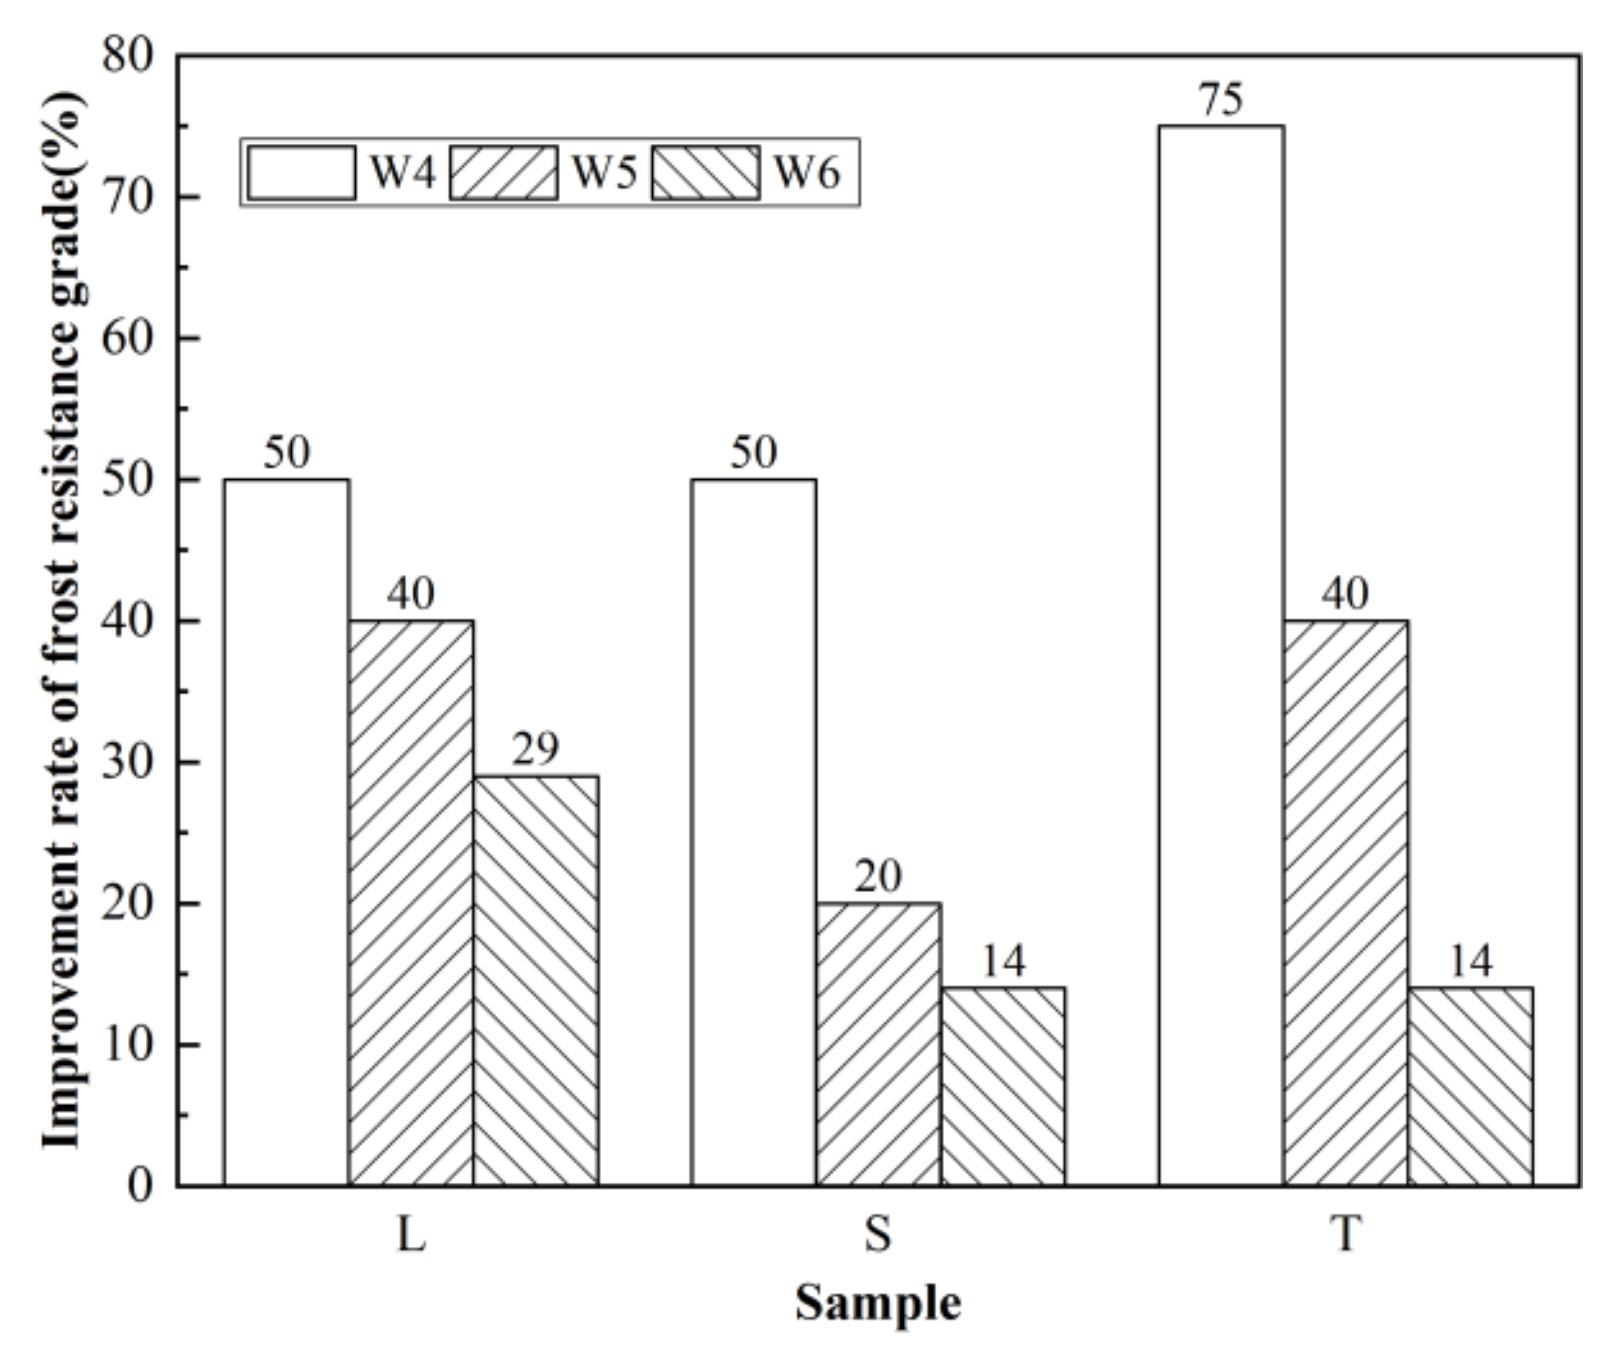
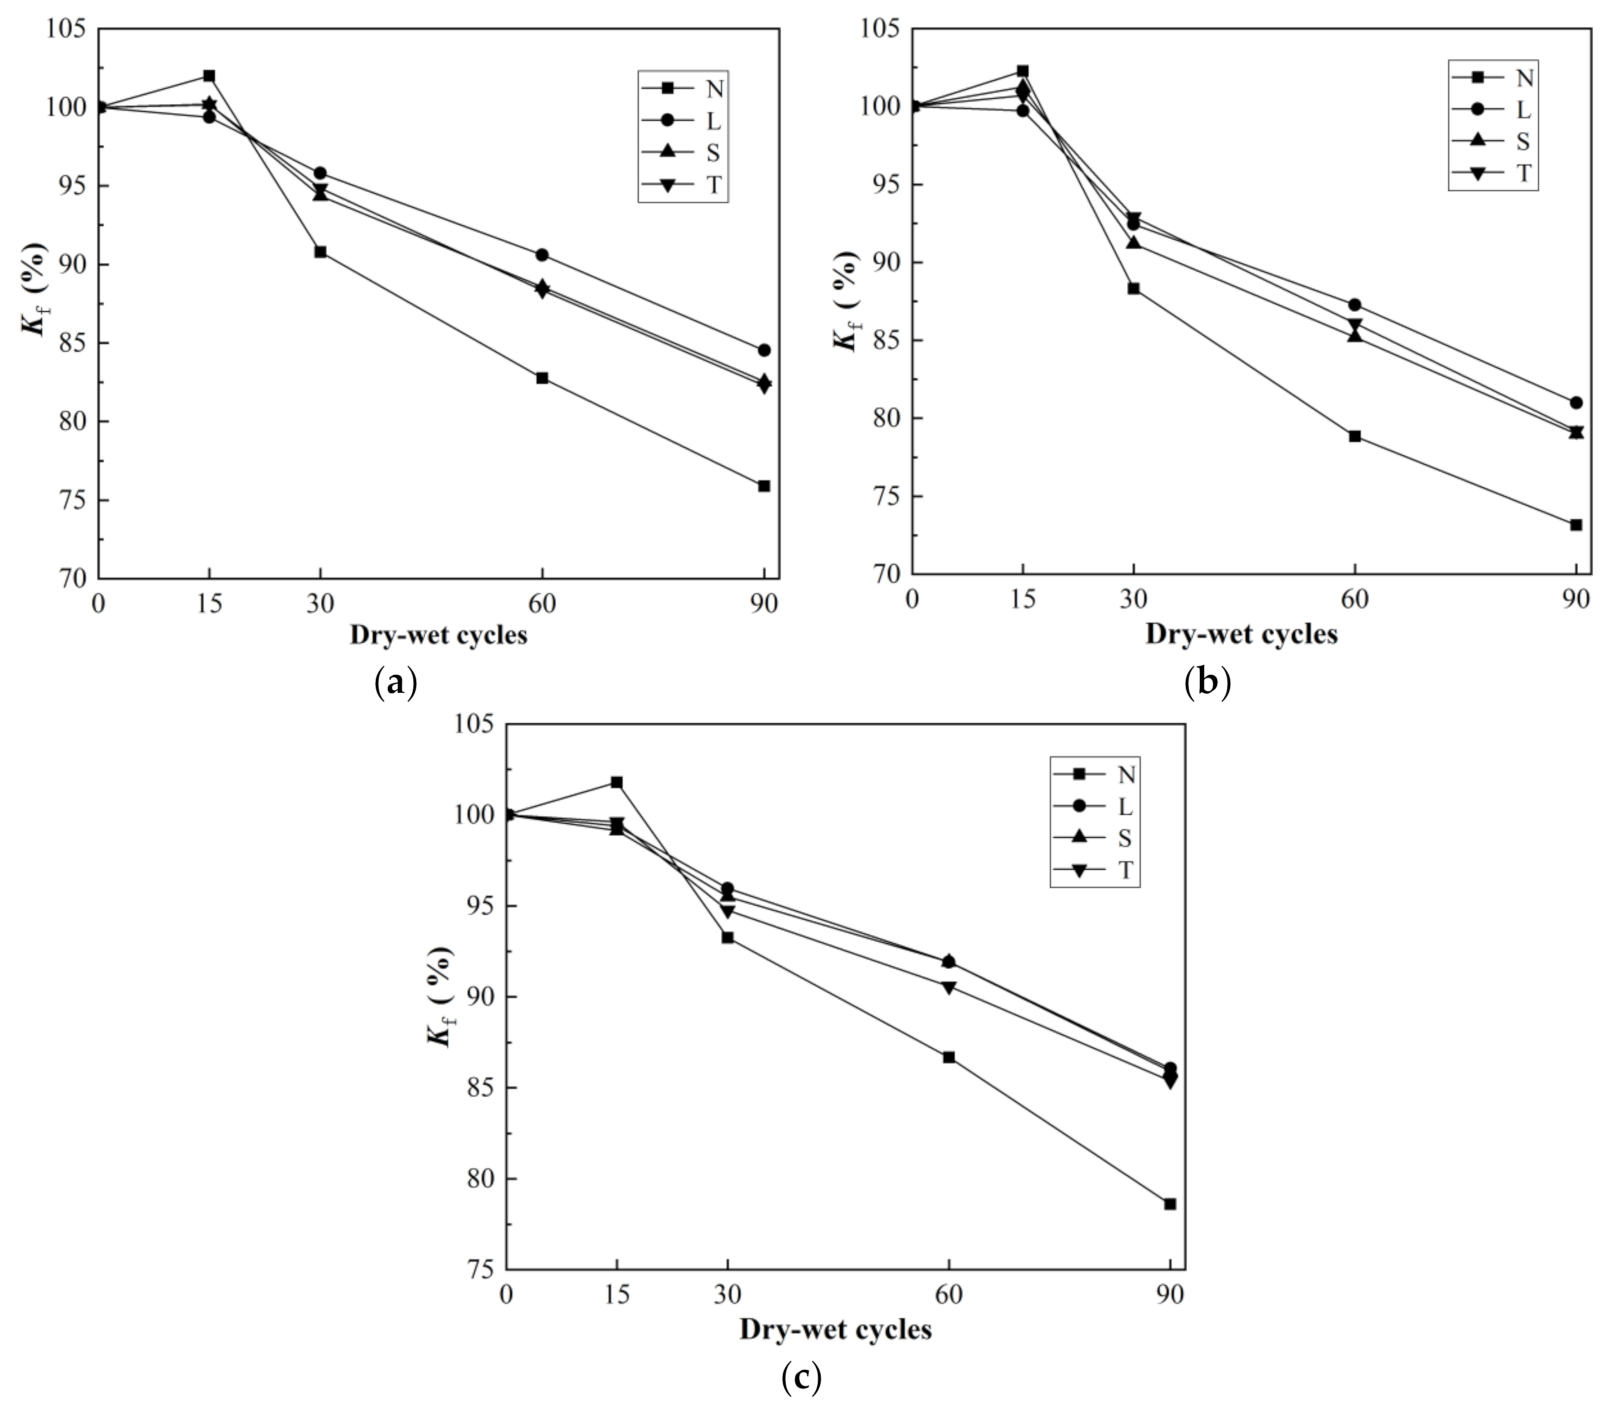
3.3.2. Frost Resistance of Surfaced Concrete with Different Strengths

It is shown in Figure 6 and Figure 7 that as the concrete strength increased, the concrete anti-frost grade increased from F100 to F175. Among the three surfacing agents, Li2SiO3 performed the best, increasing the number of freeze–thaw cycles to 50 cycles; nano-SiO2 performed weakly, increasing the number of freeze–thaw cycles to a mere 25 cycles in the case of higher concrete strength, and so surfaced concrete of lower strength was obviously peeled off in the later period of freeze–thaw; the improvement effects of TEOS surface treatment dropped obviously as the concrete strength went up, where the increase in the number of freeze–thaw cycles fell from 75 cycles to 25 cycles, and the increase rate of anti-frost grade fell from 75% to 14%. The gradual drop of anti-frost grade growth is mainly because surface treatment improves the frost resistance of concrete by improving the pore structure of the concrete and reducing the water absorption rate; as the strength of the concrete increases, the internal structure becomes denser, the porosity decreases, the average pore diameter and the pore spacing decrease, and the permeability decreases, indirectly resulting in the weakening improvement effects of the surface treatments, that is, the improvement effects of increasing the concrete strength is better than that of surfacing agents.

3.4. Sulfate Corrosion Resistance Test Results and Analysis

3.4.1. Sulfate Corrosion Resistance of Concrete after Different Surface Treatments

Figure 9 shows the Kf curve before and after surface treatments.
It is shown in Figure 9 that the Kf of the untreated specimen and W4/W5 surfaced specimens firstly increased and then decreased with the growing number of freeze–thaw cycles, because at the initial stage of the sulfate dry–wet cycle, the sulfate would act as an activator of the hydration reaction, increasing the compressive strength of the concrete. The sulfate resistance effects of surfaced specimens with increasing strength became more obvious in the 15th cycle when Kf < 100%, the microstructure of the concrete became denser, and the crystalline expansive substance produced by the reaction would be more likely to cause cracks and damage. Along with the increasing number of dry–wet cycles, Kf began to drop quickly; in the 90th cycle, the Kf of the Nth specimen (W4 concrete) dropped to 73.1%, while that of the L, S and T specimens was, respectively, 81.0%, 79.0% and 79.2%. In the case of W5 concrete, the Kf of the Nth specimen fell to 75.9%, while that of the L, S and T specimens was, respectively, 84.5%, 82.6% and 82.3%. In the case of W6 concrete, the Kf of control specimen was 78.6%, much higher than that in the case of W4 concrete, while that of the L, S and T specimens was, respectively, 86.1%, 86.1% and 85.4%. It is shown that the three surfacing agents have similar sulfate resistance-improving effects, while Li2SiO3 is slightly better than the other two materials. There are two main reasons for the above described results, (i) all three surface treatment agents can be reacted to Ca(OH)2, by which the inflated products are decreased, led by a decrease of Ca(OH)2, accordingly, the inflated stress from the concrete is decreased so that reduces the damage; (ii) the internal pores and cracks are filled with concrete by reacted products from the surface treatment agents, by which the penetrability of concrete is reduced and the difficulties of sulfate penetration improved so that the surface filming on Li2SiO3 reinforces the obstruction to the sulfate penetration.

3.4.2. Sulfate Corrosion Resistance of Surfaced Concrete with Different Strengths

Figure 10 shows the concrete compressive strength before and after surface treatment, and Figure 11 shows the improvement rate of concrete compressive strength after surface treatment.
It is shown in Figure 10 and Figure 11 that as the concrete strength increased, the sulfate corrosion resistance of the surfaced concrete specimens increased, mainly because the concrete permeability decreased, the pores and cracks were reduced, and the internal structure became denser. In the case of W4 concrete, in 90 dry–wet cycles, the compressive strength of Li2SiO3-, nano-SiO2- and TEOS-surfaced concrete specimens increased from 49.7 to 56.3 MPa, 54.6 and 54.8MPa, respectively, with a growth of 13%, 10% and 10%, respectively; in the case of W5 concrete, the compressive strength of Li2SiO3-, nano-SiO2- and TEOS-surfaced concrete specimens increased from 55.4 to 61.8, 60.7 and 60.1 MPa, respectively, with a growth of 12%, 10% and 9% respectively; in the case of W6 concrete, the compressive strength of Li2SiO3-, nano-SiO2- and TEOS- surfaced concrete specimens increased from 59.3 to 66.1, 65.2 and 64.7 MPa, respectively, with a growth of 11%, 10% and 9%, respectively; it is visible that there was less impact on the concrete strengths due to the improvements of resistance to sulfate attack by using surface treatment agents.

3.5. Wear Resistance Test Results and Analysis

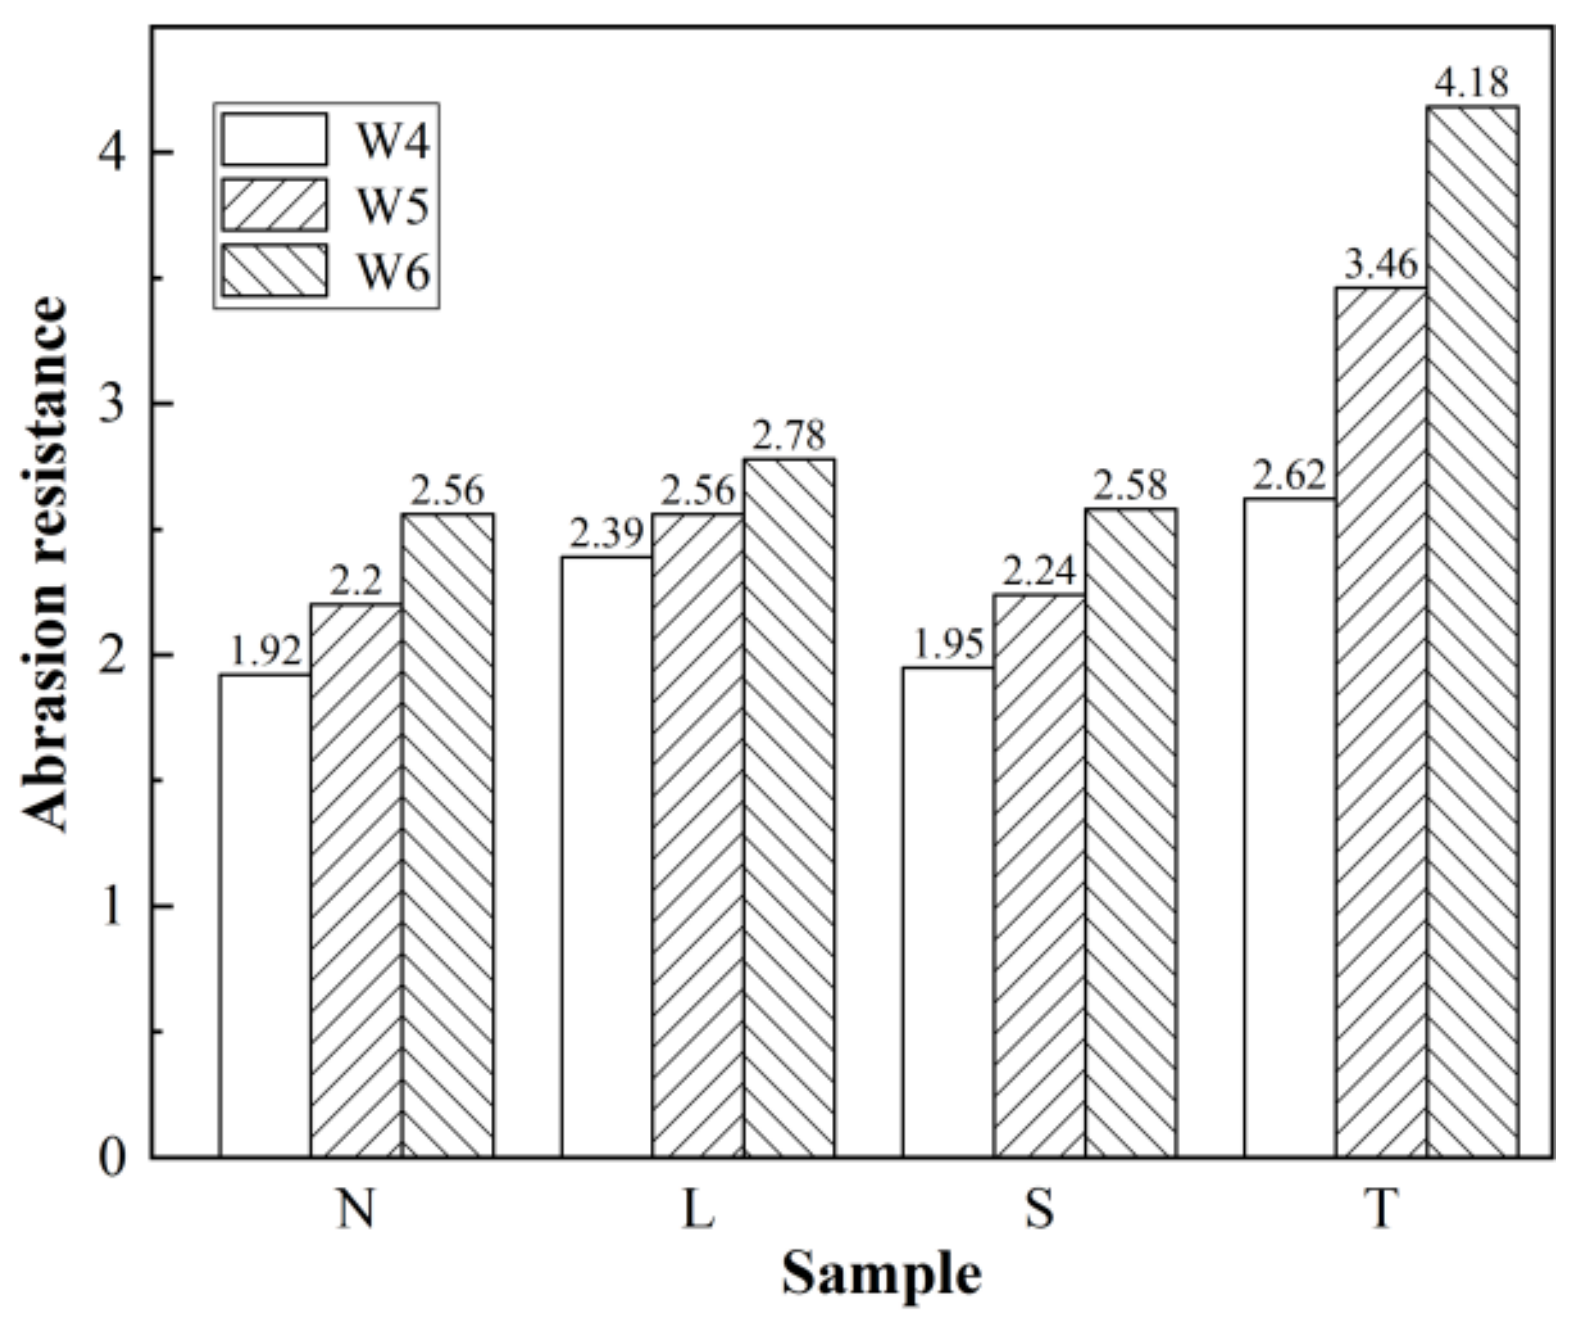
3.5.1. Wear Resistance of Concrete after Different Surface Treatments

Figure 12 shows the growth curve of the abrasion depth of concrete before and after surface treatment, Figure 13 shows the abrasion resistance of concrete before and after surface treatment, and Figure 14 shows the improvement of concrete abrasion resistance after surface treatment.
It is shown in Figure 12 that the wear depth of specimens from the first 1000 revolutions was the largest, reaching 50%–62% of the wear depth at 5000 revolutions, because in the test the specimens were ground against the setting surface of concrete. The surface layer of concrete has poor abrasion resistance, and the bleeding effect increases the water–cement ratio of the concrete surface. The closer to the surface, the higher the porosity.
It is shown in Figure 13 and Figure 14 that the wear resistance of the TEOS surfaced specimens improved most significantly, for example, after TEOS surface treatment, the wear depth of specimens at 5000 revolutions was <1.0 mm, with wear resistance >2.5. The improvement rate of the specimens without surface treatment was also >30%. The wear resistance of Li2SiO3-surfaced specimens was improved by 8.6%–24.5%, the effect was obvious, but in the test, under continuous erosion by water and the wear by the rotor, the Li2SiO3 film formed on the surface of the concrete would peel off; the wear resistance of the nano-SiO2 surfaced concrete specimens were improved by not more than 2%, the effect was not obvious, indicating that TEOS is the most effective in improving concrete wear resistance, followed by Li2SiO3 and nano-SiO2 the worst, that is because, after the surface treatment agents were coated on the surface layer of the concrete, a reaction between the penetrating agents and portlandite took place, which meant that the portlandite with poor structure was converted to hydrated calcium silicate, and at the same time, the reacted products filled the pores and microcracks to enhance the compactness of the surface and thus increase the wear resistance of the concrete [33]; although the nano-SiO2 surface treatment might form a loose film on the surface of concrete, given that the hardness of the film was much lower than that of the concrete itself, the wear resistance was poor, with almost no effect on the wear resistance of the concrete. After painting the concrete surface, the surfacing agents penetrate into the concrete and react with the calcium hydroxide, converting the poorly structured calcium silicate into calcium silicate hydrate.

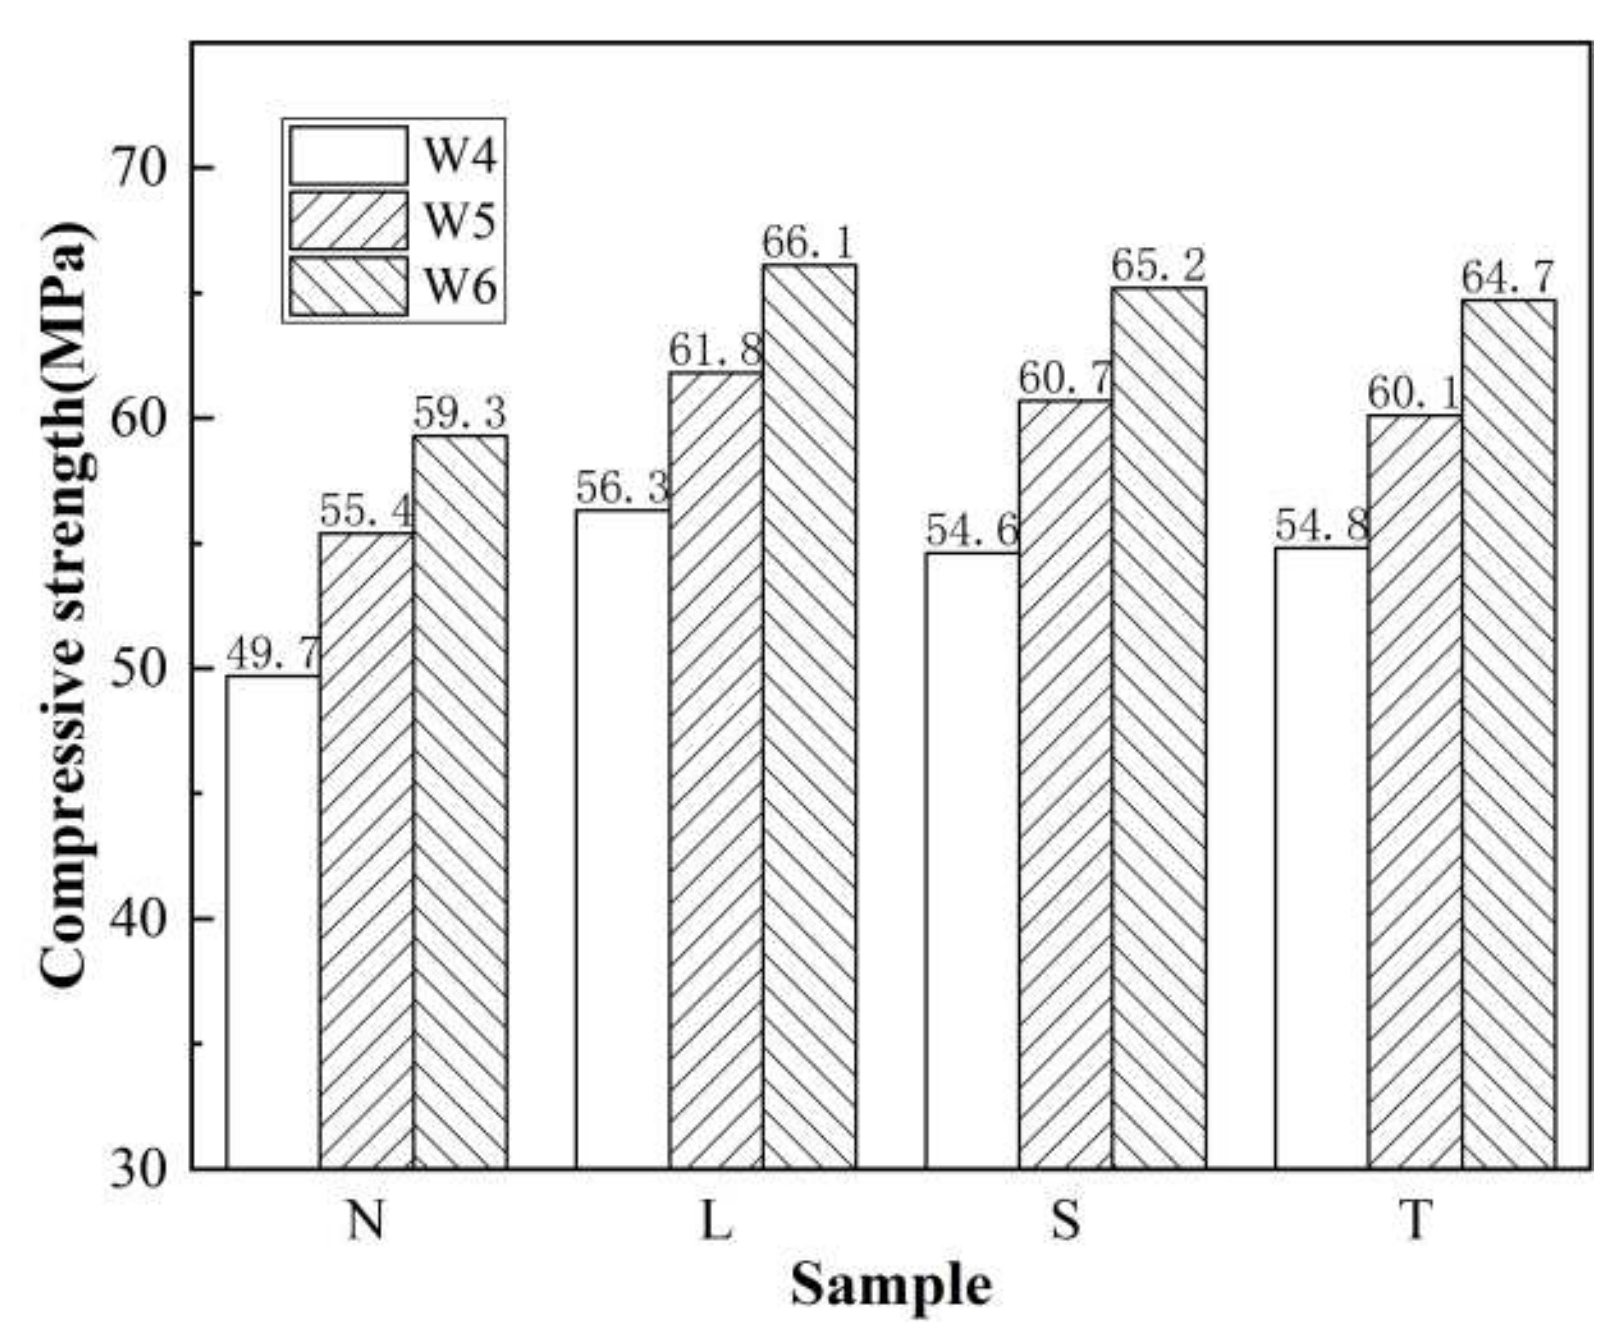
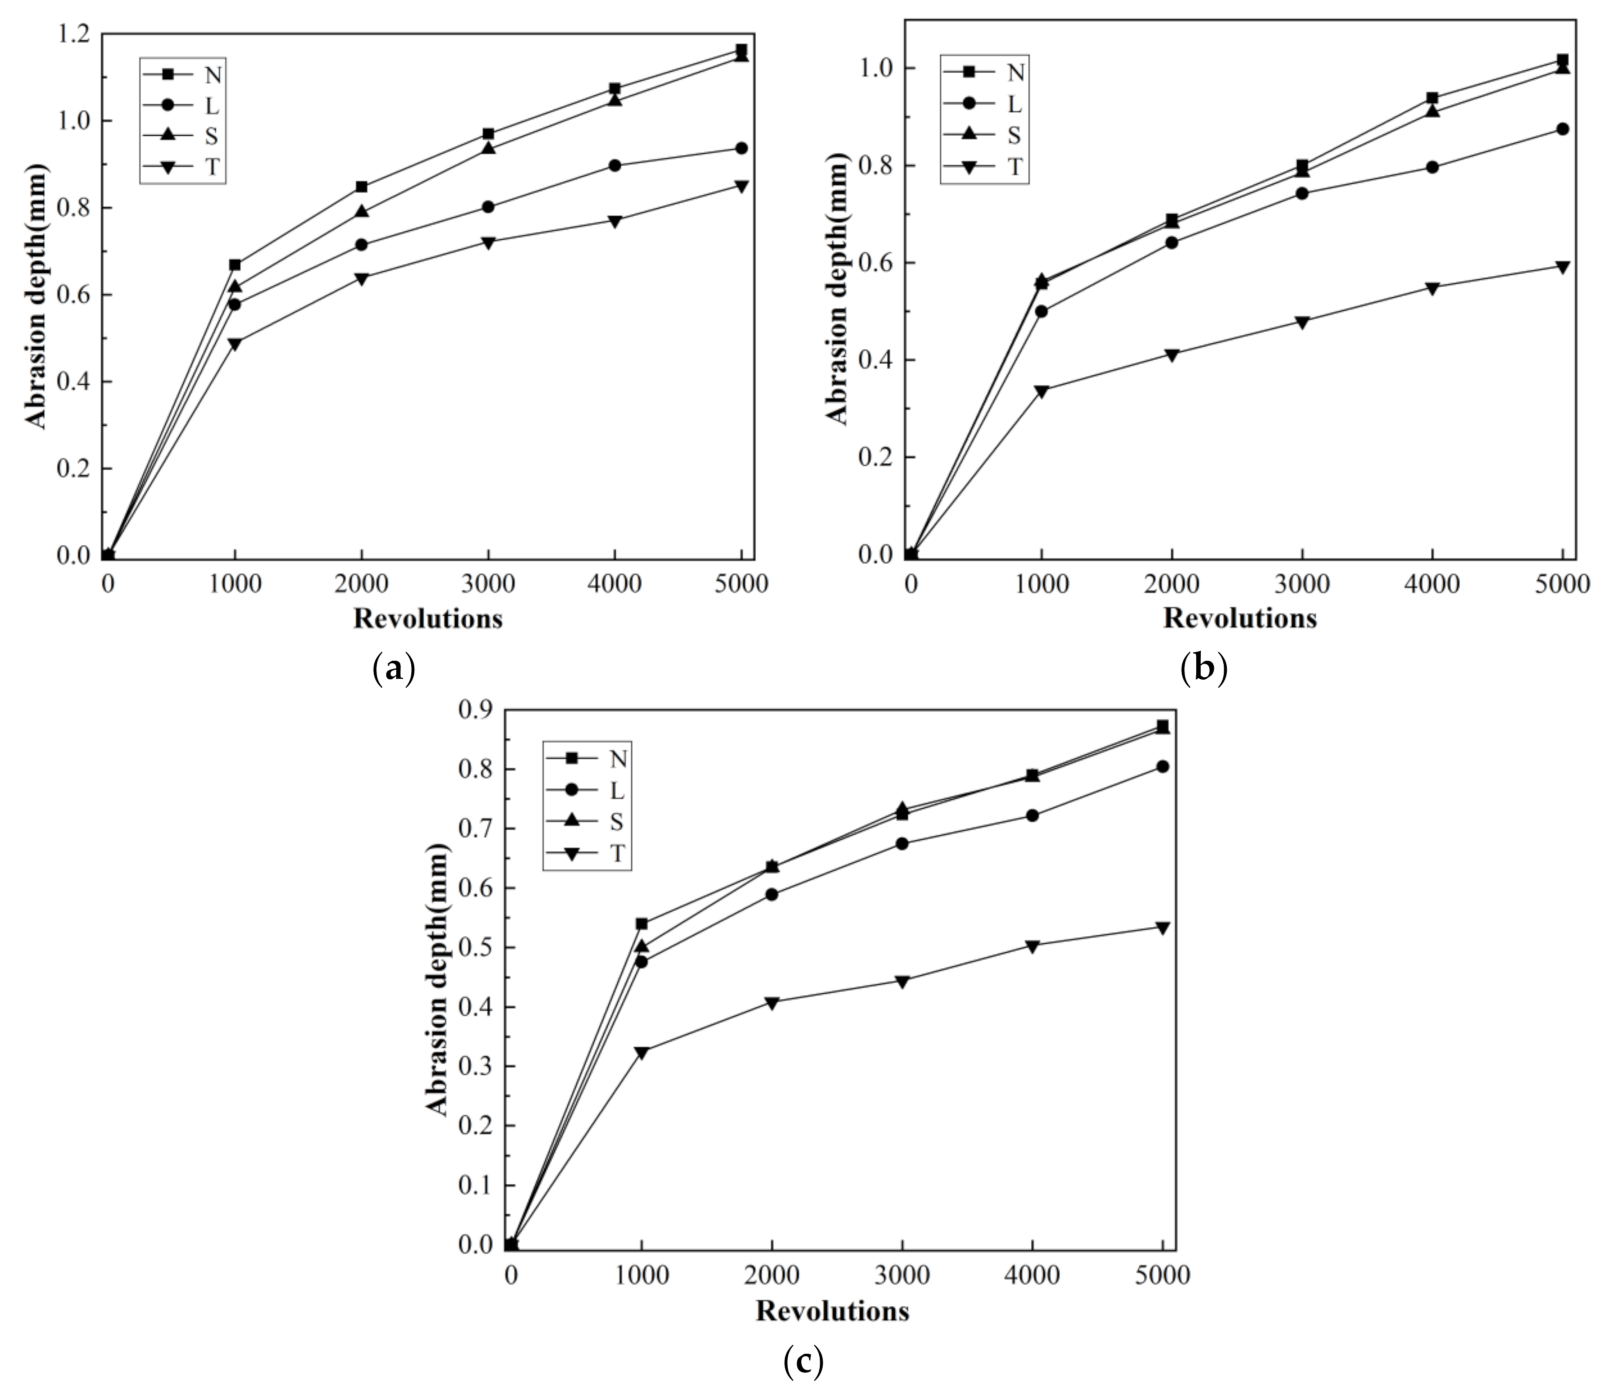
3.5.2. Wear Resistance of Surfaced Concrete with Different Strengths

It is shown in Figure 13 and Figure 14 that as the concrete strength increased, the concrete wear resistance increased significantly. The wear resistance of the untreated W6 concrete specimen was 33.3% higher than that of the untreated W4 concrete specimen, and such an increase rate was even higher than with the Li2SiO3 or nano-SiO2 treatments, mainly because when the concrete water–cement ratio decreases and the strength increases, the porosity of the cement mortar on the surface of the concrete will decrease, and meanwhile the amount of surface cement laitance will also decrease. As the concrete strength increased, the effect of Li2SiO3 treatment on the wear resistance of the concrete gradually decreased; for example, compared with the untreated specimens, the increase rate in wear resistance was 0.47, 0.36 and 0.22, respectively, and the increase rate of wear resistance also changed from the initial 24.5% to 8.6%. In contrast, the improvement effects of the TEOS treatment on the wear resistance of the concrete gradually went up as the concrete strength increased, for example, compared with the untreated specimens, the increase rate in wear resistance was 0.70 and 1.57 and 1.62 respectively, and the increase rate of wear resistance also changed from the initial 36.5% to 63.3%, indicating the TEOS has the potential of improving the wear resistance of higher strength pavement concrete. The nano-SiO2 surface treatment increased the wear resistance of the concrete by merely 0.02–0.04, which is not satisfactory. The main reason is that the penetration action of TEOS is more powerful, which enables a more compact internal structure for the concrete, but the protective effects for the surface membrane layer formed by the action of Li2SiO3 and nano-SiO2 are greatly weakened.

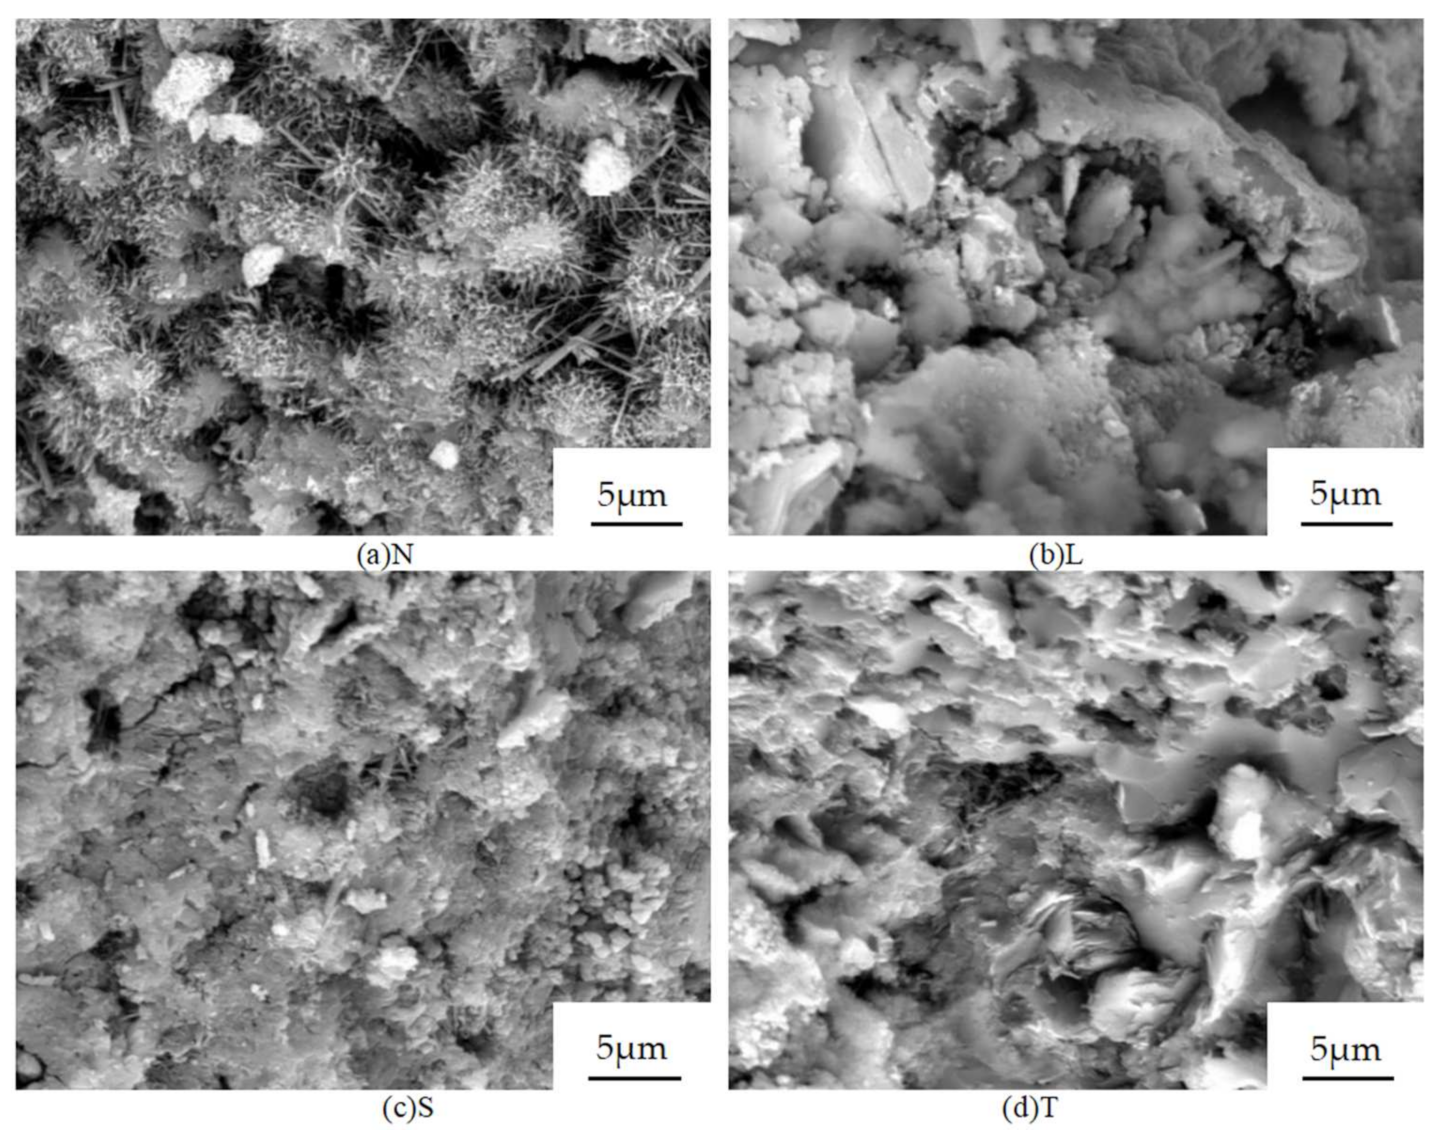
3.6. SEM Test Results and Analysis

Figure 15 shows the microscopic morphology of concrete before and after surface treatment.
Figure 15a shows the microscopic morphology of the untreated concretes, where fibrous calcium silicate hydrate is the main part, the needles, and rods on the surface of calcium silicate hydrate are interlaced with each other, there are many pores, and some prismatic shapes are visible.
Figure 15b shows the Li2SiO3 surfaced specimens, there is almost no obvious needle rod shape, the surface of the test part is covered by flocculent material that is likely calcium silicate hydrate, a product of reaction between lithium silicate and portlandite.
Figure 15c shows the nano-SiO2 surfaced specimens’ rough surface, without flocculent products, and some needle rod-like structures are visible. Figure 15d shows the TEOS surfaced specimens, without obvious needle rod-like structure, mainly composed of interphase sheet-like hydrated calcium silicate, in compact structure. It was analyzed that: (i) compared with untreated specimens, the solid phases of the surfaced specimens are tightly connected, in compact structure, and the pores are reduced; (ii) the surfaced specimens have no obvious portlandite crystals; (iii) the surface of the treated calcium silicate hydrate has obvious needle-like structures, which are interlaced with each other, while there are fewer needle-like structures of calcium silicate hydrate of the surfaced specimens; after Li2SiO3 surface treatment, the calcium silicate hydrate appears flocculent; after TEOS surface treatment, the calcium silicate hydrate becomes plate-shaped; the flocculent product may be related to the mechanism that Li2SiO3 firstly forms insoluble substances and then fills the pores, while the plate-like hydration product may be calcium silicate hydrate at low calcium/silicon ratio, formed by the curing reaction of TEOS.

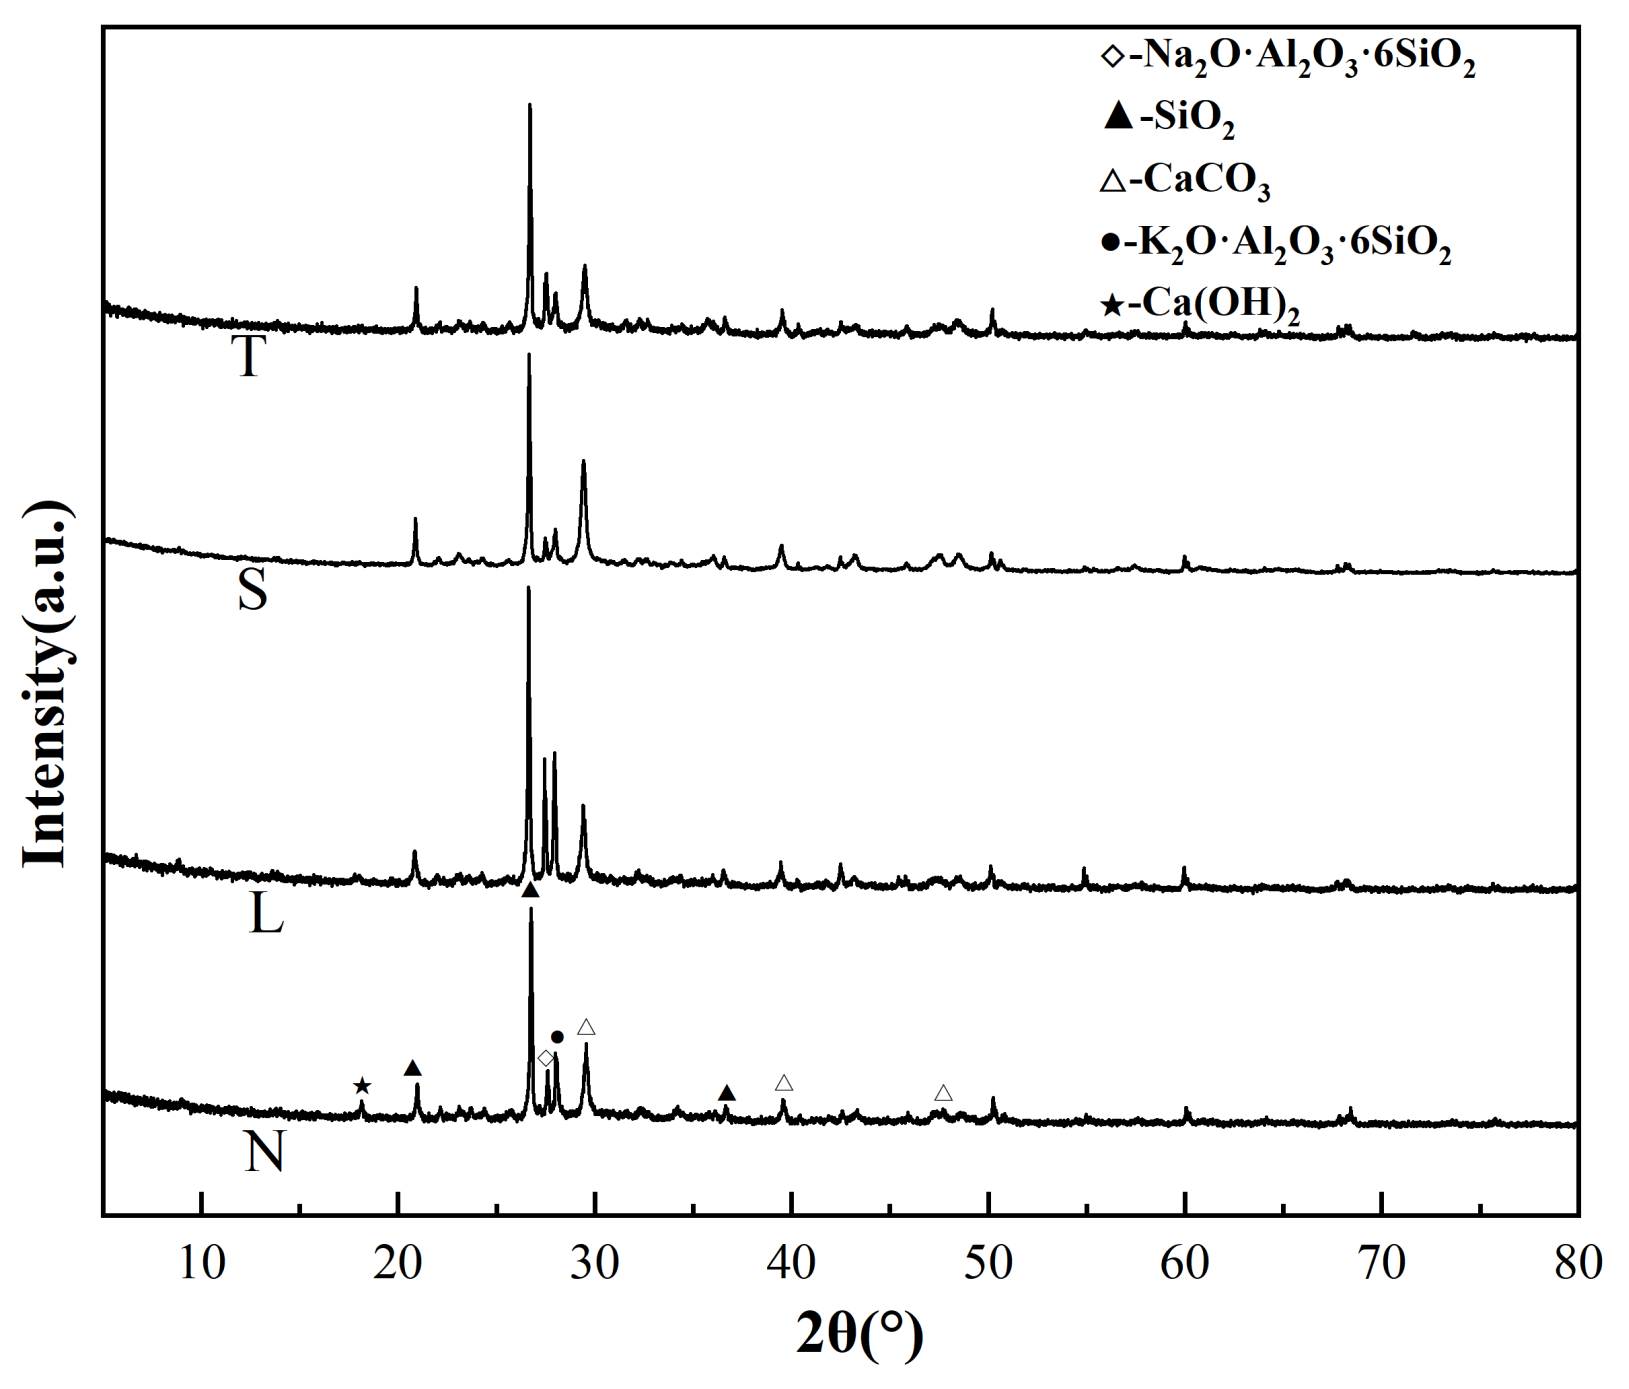
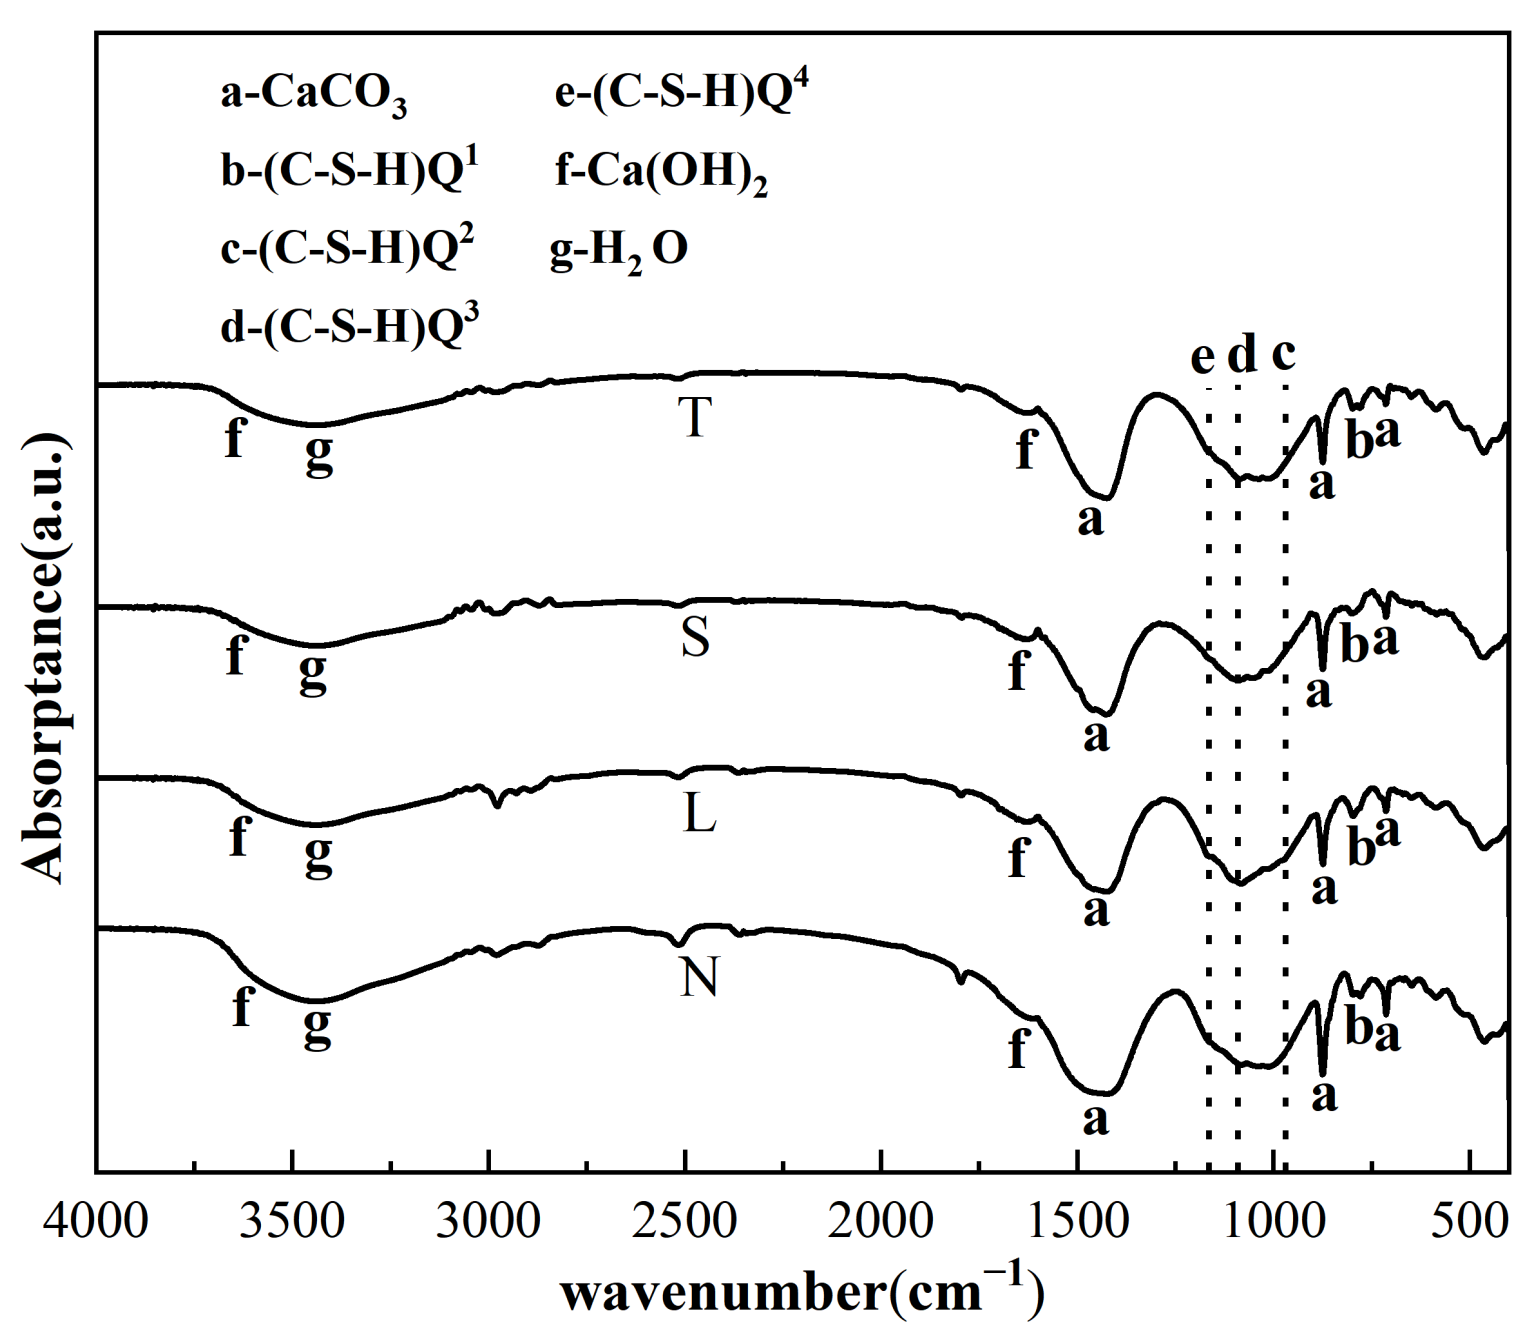
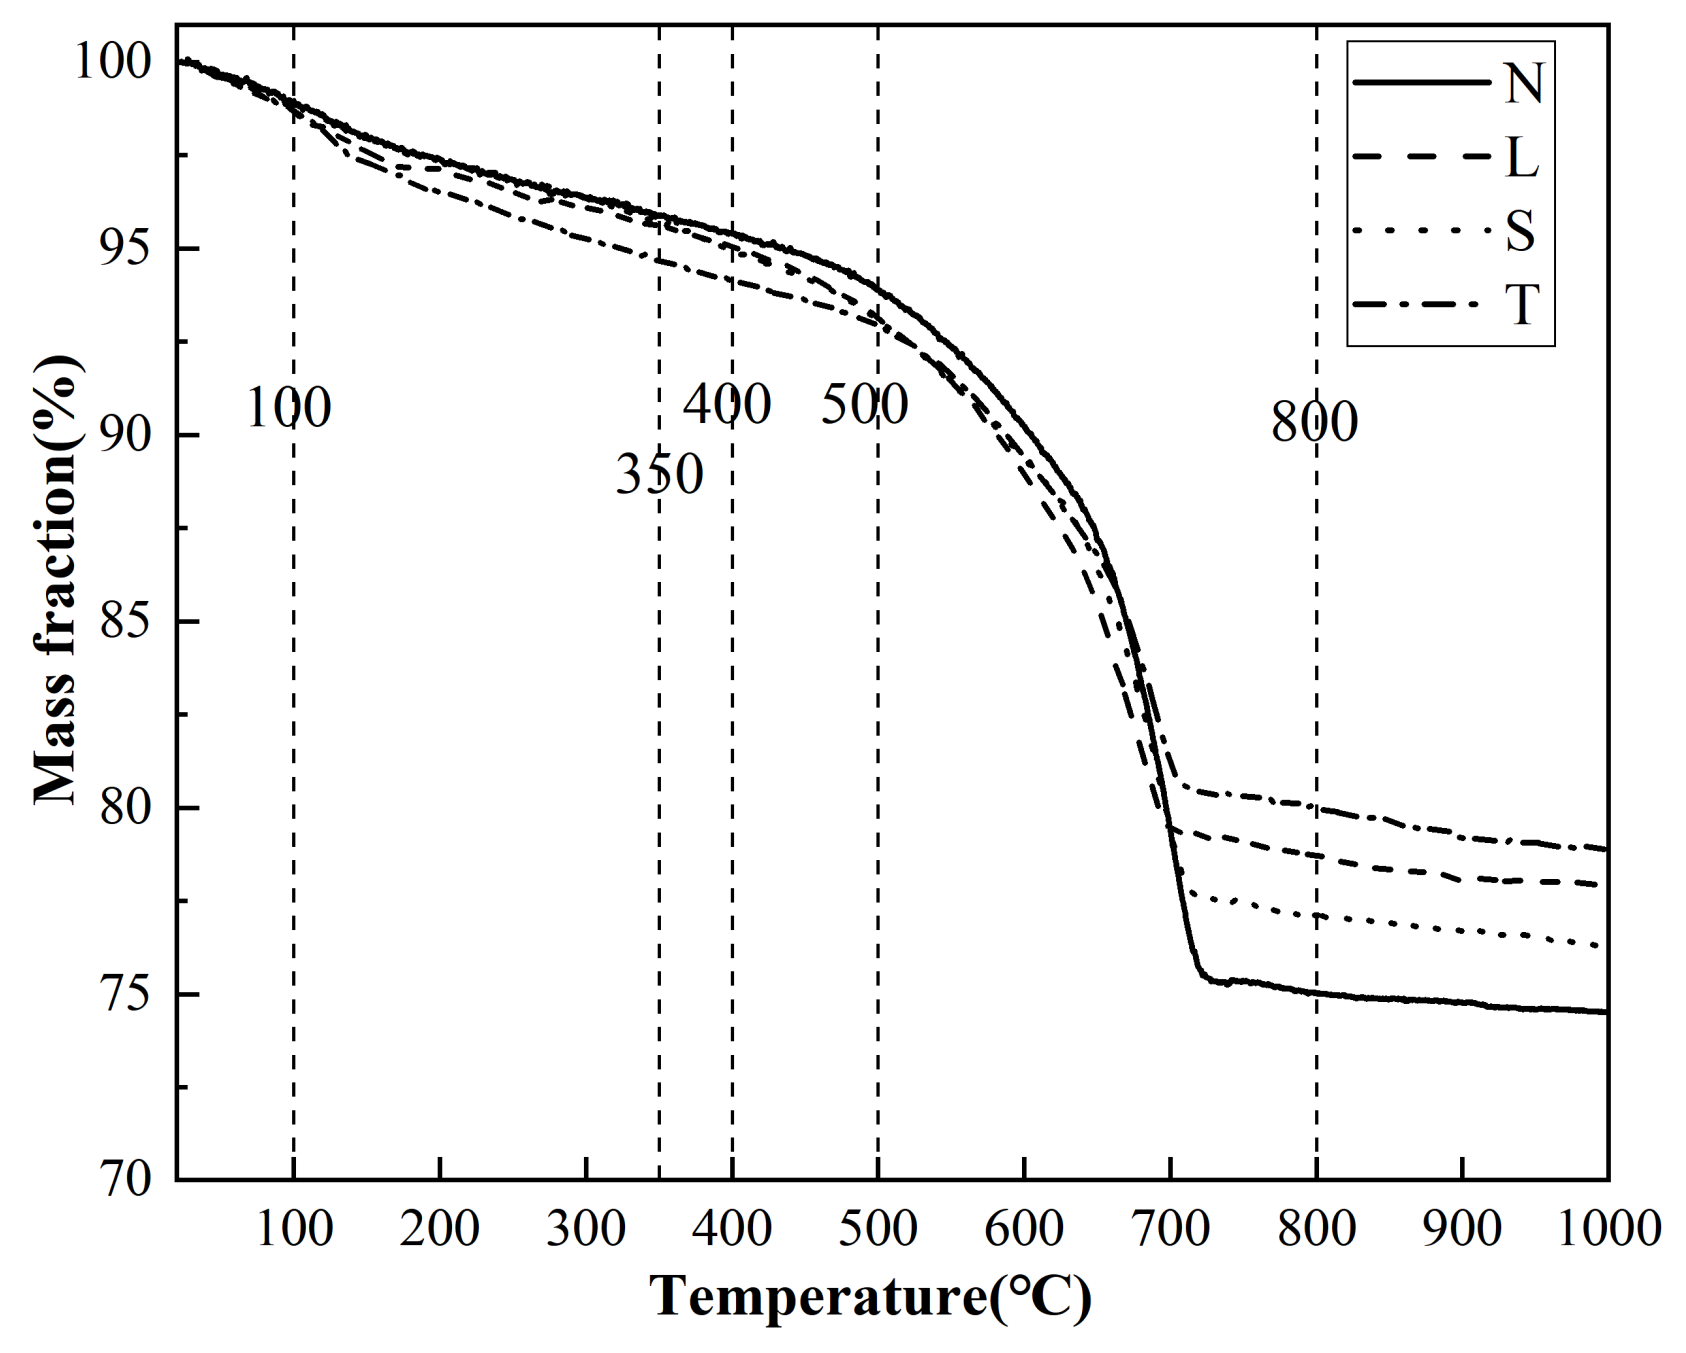
3.7. XRD, FTIR and TGA Test Results and Analysis

Figure 16, Figure 17 and Figure 18 show the XRD, FTIR and TGA test results, respectively.
It is shown in Figure 16 that: (i) the main components of the concrete did not change after surface treatment, and the specimens were mainly quartz, calcium carbonate, feldspar and calcium hydroxide; (ii) the spectrum of the untreated specimens had an obvious characteristic peak of calcium hydroxide near 2θ = 18.1°, the characteristic peak of calcium hydroxide corresponding to the Li2SiO3 surfaced specimens was obviously weakened, while the characteristic peaks of calcium hydroxide on the graphs of the nano-SiO2 and TEOS surfaced specimens disappeared completely, however, the characteristic peaks of SiO2 were obviously reinforced, this indicated that a secondary hydrated reaction between the surface treatment agents and Ca(OH)2 took place and reduced the Ca(OH)2 content in the specimens, generated hydrated calcium silicate and improved its weak structures; (iii) no obvious characteristic peak of calcium silicate hydrate was found in any of the graphs, one reason is that hydrated calcium silicate mainly exists in the form of gel, which has poor crystallinity and is not easy to display; the other reason is that part of the characteristic peaks of hydrated calcium silicate are easy to overlap with other substances such as calcium carbonate [21].
It is shown in Figure 17 that: (i) the CO32− peak intensity of the surfaced specimens was lower than that of the untreated specimens, as detailed in the thermogravimetric analysis; (ii) the O–H stretch peak intensity at 3635 and 1653 cm−1 on the graphs of the surfaced specimens decreased, indicating that the content of portlandite in the concrete decreased after the surface treatment; (iii) the Si–O stretch peak formed at 970–1140 cm−1 of the surfaced specimens changed, that is, as the degree of polymerization of calcium silicate hydrate increased, the Si–O stretch peak shifted to the left (high wave number); the Li2SiO3 and nano-SiO2 surfaced specimens showed obvious left-pointing and right-handedness, indicating that hydrated calcium silicate has a certain degree of polymerization under the action of surface treatment, while the Si–O stretch peak of TEOS surfaced specimens was substantially the same as that of the untreated specimens, perhaps because the TEOS could react with both portlandite and hydrated calcium silicate.
Currently, this study shows that Li2SiO3, nano-SiO2 and TEOS surface treatments mainly change the relative content of hydrated calcium silicate, portlandite, and calcium carbonate in cement hydration products, so the endothermic dehydration temperature of the above substances is summarized in Table 6. It is shown in Figure 18 that, all the specimens began to show rapid mass loss around 500 °C, and the mass was basically constant around 700 °C; in addition, there were tiny steps descending in the TGA curve of Li2SiO3 or TEOS surfaced specimens around 150 °C. Table 6 shows that the 100–350 °C substance content change is mainly affected by the dehydration of the hydrated calcium silicate substance; at 100–350 °C, the change in substance content was mainly affected by the dehydration of hydrated calcium silicate; at 400–500 °C, the mass loss was caused by the dehydration of dellaite (B) and portlandite; at >500 °C, specimens might show decomposition of calcium carbonate and dehydration of dellaite. The following three aspects were considered: (i) XRD and FTIR both show that the specimens contained a considerable amount of calcium carbonate; (ii) the dehydration of dellaite had a smaller change compared with the decomposition of calcium carbonate; (iii) in the test, after 500 °C, there was only one endothermic peak. On the basis of the above analysis and the reference [37], it was determined that the mass change after 500 °C was mainly due to the decomposition of calcium carbonate.

4. Conclusions

This study explores the impacts of TEOS, Li2SiO3 and nano-SiO2 on the durability of airport pavement concrete and the surface treatment effects by using surface treatment agents in connection with concrete strengths, according to all the tests, it is concluded below that:
(1) TEOS can significantly improve the chloride ion permeability resistance and wear resistance of concrete, and also has a positive effect on the water penetration and frost resistance of concrete, although it is slightly inferior to Li2SiO3 and nano-SiO2 in improving the water penetration resistance of concrete; it can also reduce the water penetration height of concrete, along with improvement of concrete strength, its improvement effect can basically reach that of Li2SiO3.
(2) Li2SiO3 can stably improve the concrete performance and performs best to improve concrete water penetration and frost resistance. It can increase the number of freeze–thaw cycles by 50 cycles. It is different from TEOS in terms of improving chloride ion penetration and wear resistance; for example, Li2SiO3 can only reduce the chloride ion penetration of concrete to a low level, and the film formed on the surface of concrete may peel off, reducing the improvement effect.
(3) Nano-SiO2 does not perform well in improving concrete performance, and its surface treatment effect is obviously poorer than the other two agents, with almost no effect on the improvement of the wear resistance of concrete. It has only achieved good results in improving water penetration resistance and sulfate corrosion resistance, it is not recommended solely for surface treatment on airport pavement.
(4) As the strength of concrete increases, the improvement effects of the three surfacing agents gradually increase; the other increasing trends, other than chloride ion penetration resistance, are gradually weakened; the effects of TEOS become stronger, but the trend is reduced except for the TEOS; in terms of improving the frost resistance and wear resistance of concrete, increasing the strength of concrete works better than selecting surfacing agents.
(5) Through SEM, ARD, FTIR and TGA tests, it was found that no new substances are produced after surface treatment, the substance types of the concrete remain unchanged, and the relative content of the substance changes to a certain extent. Surface treatment results in an increase in the content of hydrated calcium silicate or dellaite and a decrease in the content of portlandite and calcium carbonate in the concrete. The SEM test showed that surface treatment makes the concrete microstructure more compact.
In summary, this study compares and analyzes the effectiveness of three surface treatment agents to improve the durability of airport pavement concrete and how they perform is influenced by concrete strength as well as impact effects on its surface treatment. The results are helpful for selecting the appropriate concrete surface treatment agents in airport pavement engineering and facilitating the modification of concrete surfacing agents to better improve the durability of concrete.

Author Contributions

Conceptualization, T.L. and Y.W.; methodology, T.L.; software, H.W.; validation, Y.W.; formal analysis, T.L.; investigation, Y.W.; resources, T.L. and H.W.; data curation, T.L.; writing—original draft preparation, T.L.; writing—review and editing, Y.W.; visualization, T.L. and H.W.; project administration, Y.W. All authors have read and agreed to the published version of the manuscript.

Funding

This research was funded by the National Natural Science Foundation of China, Grant No. 51608526.

Institutional Review Board Statement

Not applicable.

Informed Consent Statement

Not applicable.

Data Availability Statement

Not applicable.

Acknowledgments

The authors express thanks to all members of the laboratory team for their help with the technical support.

Conflicts of Interest

The authors declare no conflict of interest.

References

  1. Zm, A.; Xga, B.; As, C. Mechanical performances and microstructures of metakaolin contained UHPC matrix under steam curing conditions—ScienceDirect. Constr. Build. Mater. 2020, 268, 121112. [Google Scholar]
  2. Wang, L.; Yong, H.; Lu, J.; Shu, C.; Wang, H. influence of coarse aggregate type on the mechanical strengths and durability of cement concrete. Coatings 2021, 11, 1036. [Google Scholar] [CrossRef]
  3. Li, W.; Cai, L.; Wu, Y.; Liu, Q.; Yu, H.; Zhang, C. Assessing recycled pavement concrete mechanical properties under joint action of freezing and fatigue via RSM. Constr. Build. Mater. 2018, 164, 1–11. [Google Scholar] [CrossRef]
  4. Li, S.; Zhang, W.; Liu, J.; Hou, D.; Geng, Y.; Chen, X.; Gao, Y.; Jin, Z.; Yin, B. Protective mechanism of silane on concrete upon marine exposure. Coatings 2019, 9, 558. [Google Scholar] [CrossRef] [Green Version]
  5. Zhang, J. Durability of airport concrete pavement improved by four novel coatings. Adv. Cem. Res. 2018, 31, 214–224. [Google Scholar] [CrossRef]
  6. Safiuddin, M. Concrete damage in field conditions and protective sealer and coating systems. Coatings 2017, 7, 90. [Google Scholar] [CrossRef]
  7. Han, Y.M.; Dong, G.S.; Choi, D.S. Evaluation of the durability of mortar and concrete applied with inorganic coating material and surface treatment system. Constr. Build. Mater. 2007, 21, 362–369. [Google Scholar]
  8. Wang, L.; Shu, C.; Jiao, T.; Han, Y.; Wang, H. Effect of assembly unit of expansive agents on the mechanical performance and durability of cement-based materials. Coatings 2021, 11, 731. [Google Scholar] [CrossRef]
  9. Liu, B.J.; Qin, J.L.; Sun, M.H. Influence of silane-based impregnation agent on the permeability of concretes. KSCE J. Civ. Eng. 2019, 23, 3443–3450. [Google Scholar] [CrossRef]
  10. Li, G.; Dong, L.; Bai, Z.A.; Lei, M.; Du, J.M. Predicting carbonation depth for concrete with organic film coatings combined with ageing effects. Constr. Build. Mater. 2017, 142, 59–65. [Google Scholar] [CrossRef]
  11. Pan, X.; Shi, Z.; Shi, C.; Ling, T.C.; Ning, L. A review on surface treatment for concrete—Part 2: Performance. Constr. Build. Mater. 2017, 133, 81–90. [Google Scholar] [CrossRef] [Green Version]
  12. Pan, X.; Shi, Z.; Shi, C.; Hu, X.; Wu, L. Interactions between inorganic surface treatment agents and matrix of Portland cement-based materials. Constr. Build. Mater. 2016, 113, 721–731. [Google Scholar] [CrossRef] [Green Version]
  13. Medeiros, M.; Helene, P. Surface treatment of reinforced concrete in marine environment: Influence on chloride diffusion coefficient and capillary water absorption. Constr. Build. Mater. 2009, 23, 1476–1484. [Google Scholar] [CrossRef]
  14. Yang, C.C.; Wang, L.C.; Weng, T.L. Using charge passed and total chloride content to assess the effect of penetrating silane sealer on the transport properties of concrete. Mater. Chem. Phys. 2004, 85, 238–244. [Google Scholar] [CrossRef]
  15. Diamanti, M.V.; Brenna, A.; Bolzoni FA BI, O.; Berra, M.; Pastore, T.; Ormellese, M. Effect of polymer modified cementitious coatings on water and chloride permeability in concrete. Constr. Build. Mater. 2013, 49, 720–728. [Google Scholar] [CrossRef]
  16. Adamopoulos, F.G.; Vouvoudi, E.C.; Pavlidou, E.; Achilias, D.S.; Karapanagiotis, I. TEOS-Based superhydrophobic coating for the protection of stone-built cultural heritage. Coatings 2021, 11, 135. [Google Scholar] [CrossRef]
  17. Pigino, B.; Leemann, A.; Franzoni, E.; Lura, P. Ethyl silicate for surface treatment of concrete—Part II: Characteristics and performance. Cem. Concr. Compos. 2011, 34, 313–321. [Google Scholar] [CrossRef]
  18. Sandrolini, F.; Franzoni, E.; Pigino, B. Ethyl silicate for surface treatment of concrete—Part I: Pozzolanic effect of ethyl silicate. Cem. Concr. Compos. 2012, 34, 306–312. [Google Scholar] [CrossRef]
  19. Hou, P.; Zhang, R.; Cai, Y.; Cheng, X.; Shah, S.P. In situ Ca(OH)2 consumption of TEOS on the surface of hardened cement-based materials and its improving effects on the Ca-leaching and sulfate-attack resistivity. Constr. Build. Mater. 2016, 113, 890–896. [Google Scholar] [CrossRef]
  20. Shcherban’, E.M.; Stel’makh, S.A.; Beskopylny, A.; Mailyan, L.R.; Meskhi, B.; Varavka, V. Nanomodification of lightweight fiber reinforced concrete with micro silica and its influence on the constructive quality coefficient. Materials 2021, 14, 7347. [Google Scholar] [CrossRef]
  21. Barberena-Fernández, A.M.; Blanco-Varela, M.T.; Carmona-Quiroga, P.M. Use of nanosilica- or nanolime-additioned TEOS to consolidate cementitious materials in heritage structures: Physical and mechanical properties of mortars. Cem. Concr. Compos. 2018, 95, 271–276. [Google Scholar] [CrossRef]
  22. Scarfato, P.; Maio, L.D.; Fariello, M.L.; Russo, P.; Incarnato, L. Preparation and evaluation of polymer/clay nanocomposite surface treatments for concrete durability enhancement. Cem. Concr. Compos. 2012, 34, 297–305. [Google Scholar] [CrossRef]
  23. Pan, X.Y.; Shi, C.J.; Zhang, J.K.; Jia, L.F.; Lin, M. Effect of inorganic surface treatment on air permeability of cement-based materials. J. Mater. Civ. Eng. 2016, 28, 04015145. [Google Scholar] [CrossRef]
  24. Pan, X.Y.; Shi, C.J.; Zhang, J.K.; Jia, L.F.; Chong, L.L. Effect of inorganic surface treatment on surface hardness and carbonation of cement-based materials. Cem. Concr. Compos. 2018, 90, 218–224. [Google Scholar] [CrossRef]
  25. Kuang, Y.; Takashima, N.; Sakoi, Y.; Zhang, M.; Tsukinaga, Y. Salt scaling resistance and microstructure analysis of fly-ash cement-based concrete treated with different surface penetrants. Mater. Lett. 2021, 297, 129999. [Google Scholar] [CrossRef]
  26. Matijević, E. Chemistry of silica. J. Colloid Interface Sci. 1980, 77, 290–291. [Google Scholar] [CrossRef]
  27. GJB 1112A-2004. Construction and Acceptance Specifications for Flying Area Engineering of the Military Airfield. 2004. Available online: https://www.dugen.com/p-11204.html (accessed on 29 December 2021).
  28. GB/T 50080-2016; Standard for Test Method of Performance on Ordinary Fresh Concrete. China Architecture & Building Press: Beijing, China, 2016.
  29. GB/T 50082-2009; Standard for Test Methods of Long-Term Performance and Durability of Ordinary Concrete. China Architecture & Building Press: Beijing, China, 2009.
  30. GB/T 16925-1997; Test Method for Abrasion Resistance of Concrete and Its Products (Ball Bearing Method). State Bureau of Technical Supervision: Beijing, China, 1997.
  31. Barberena-Fernandez, A.M.; Blanco-Varela, M.T.; Carmona-Quiroga, P.M. Interaction of TEOS with cementitious materials: Chemical and physical effects. Cem. Concr. Compos. 2015, 55, 145–152. [Google Scholar] [CrossRef] [Green Version]
  32. Astm, C. Standard test method for electrical indication of concrete’s ability to resist chloride ion penetration. Annu. Book ASTM Stand. 1997, 4, 639–644. [Google Scholar]
  33. Hou, P.; Xin, C.; Qian, J.; Shah, S.P. Effects and mechanisms of surface treatment of hardened cement-based materials with colloidal nanoSiO2 and its precursor. Constr. Build. Mater. 2014, 53, 66–73. [Google Scholar] [CrossRef]
  34. Franzoni, E.; Pigino, B.; Pistolesi, C. Ethyl silicate for surface protection of concrete: Performance in comparison with other inorganic surface treatments. Cem. Concr. Compos. 2013, 44, 69–76. [Google Scholar] [CrossRef]
  35. Wu, Z.W.; Lian, H.Z. High Performance Concrete; China Railway Publishing House: Beijing, China, 1999. [Google Scholar]
  36. Mehta, P.K.; Monteiro, P. Concrete: Microstructure, properties, and materials. In Concrete: Microstructure, Properties, and Materials; The McGraw-Hill: New York, NY, USA, 2013. [Google Scholar]
  37. Pan, X.; Shi, C.; Hu, X.; Ou, Z. Effects of CO2 surface treatment on strength and permeability of one-day-aged cement mortar. Constr. Build. Mater. 2017, 154, 1087–1095. [Google Scholar] [CrossRef]
Figure 1. Grain gradation curve of (a) fine aggregate, (b) coarse aggregate.
Coatings 12 00162 g001
Figure 2. Water penetration height of the concrete before and after surface treatment.
Coatings 12 00162 g002
Figure 3. Reduction rate of water penetration height after surface treatment.
Coatings 12 00162 g003
Figure 4. Chloride ion flux of the concrete before and after surface treatment.
Coatings 12 00162 g004
Figure 5. Reduction rate of chloride ion flux of concrete after the surface treatment.
Coatings 12 00162 g005
Figure 6. P curve of concrete before and after surface treatment: (a) W4 concrete specimen, (b) W5 concrete specimen, (c) W6 concrete specimen.
Coatings 12 00162 g006
Figure 7. Frost resistance grade of concrete before and after surface treatment.
Coatings 12 00162 g007
Figure 8. Improvement rate of concrete’s frost resistance grade after surface treatment.
Coatings 12 00162 g008
Figure 9. Kf curve before and after surface treatments: (a) W4 concrete specimen, (b) W5 concrete specimen, (c) W6 concrete specimen.
Coatings 12 00162 g009
Figure 10. Concrete compressive strength before and after surface treatment.
Coatings 12 00162 g010
Figure 11. Improvement rate of concrete compressive strength after surface treatment.
Coatings 12 00162 g011
Figure 12. Growth curve of the abrasion depth of concrete before and after surface treatment: (a) W4 concrete specimen, (b) W5 concrete specimen, (c) W6 concrete specimen.
Coatings 12 00162 g012
Figure 13. Abrasion resistance of concrete before and after surface treatment.
Coatings 12 00162 g013
Figure 14. Improvement of concrete abrasion resistance after surface treatment.
Coatings 12 00162 g014
Figure 15. Microscopic morphology of concrete before and after surface treatment (a) N, (b) L, (c) S, (d) T.
Coatings 12 00162 g015
Figure 16. XRD patterns of surface concrete before and after surface treatment.
Coatings 12 00162 g016
Figure 17. FTIR spectra of surface concrete before and after surface treatment.
Coatings 12 00162 g017
Figure 18. TGA curves of concrete before and after surface treatment.
Coatings 12 00162 g018
Table 1. Performance parameters of lithium silicate.
Density/(g/cm3)pHSolid Content/%Viscosity/Pa·sSurface Tension/(mN/m)
1.18 ± 0.0311.0 ± 1.022 ± 2.211.0 ± 1.0≤30.0
Table 2. Performance parameters of nano-SiO2.
Particle Size/nmSolid Content/%Density/(g/cm3)pHAppearance
10 ± 112.5 ± 11.125 ± 0.00711 ± 0.5Semitransparent
Table 3. Performance parameters of tetraethyl orthosilicate.
Silicon Content/%Acidity/ppmViscosity/(CPs/25 °C)Density/(g/mL)VOC/%
40.61405.041.058<3.0
Table 4. Mix proportion and properties of concrete.
TypeCement/(kg/m3)Water/(kg/m3)Fine Aggregate (kg/m3)Coarse Aggregate /(kg/m3)Water Reducing AgentWater Cement RatioVebe Consistometer/sFlexural Strength at 28 d/MPa
W4320140.86221391-0.44224.7
W5330135.363013280.2%0.41225.6
W6330125.461214340.4%0.38286.4
Table 5. Chloride ion penetrability based on charge passed.
Charge Passed (C)>40002000–40001000–2000100–1000<100
Chloride Ion PenetrabilityHighModerateLowVery LowNegligible
Table 6. Endothermic dehydration temperature of different hydration products.
Hydration ProductsChemical FormulaEndothermic Dehydration Temperature (°C)
1.1 nm Tobermorite5CaO·6SiO2·5H2O100–350
Calcium silicate hydrate (B)CaO·SiO2·H2O(B)200–250
Calcium silicate hydrate (B)CaO·SiO2·2H2O(B)100–300
PortlanditeCa(OH)2Around 500
Dellaite (A)2CaO·SiO2·H2O(A)460–480
Dellaite (B)2CaO·SiO2·H2O(B)560–600
Dellaite (C)2CaO·SiO2·H2O(C)740
Publisher’s Note: MDPI stays neutral with regard to jurisdictional claims in published maps and institutional affiliations.

