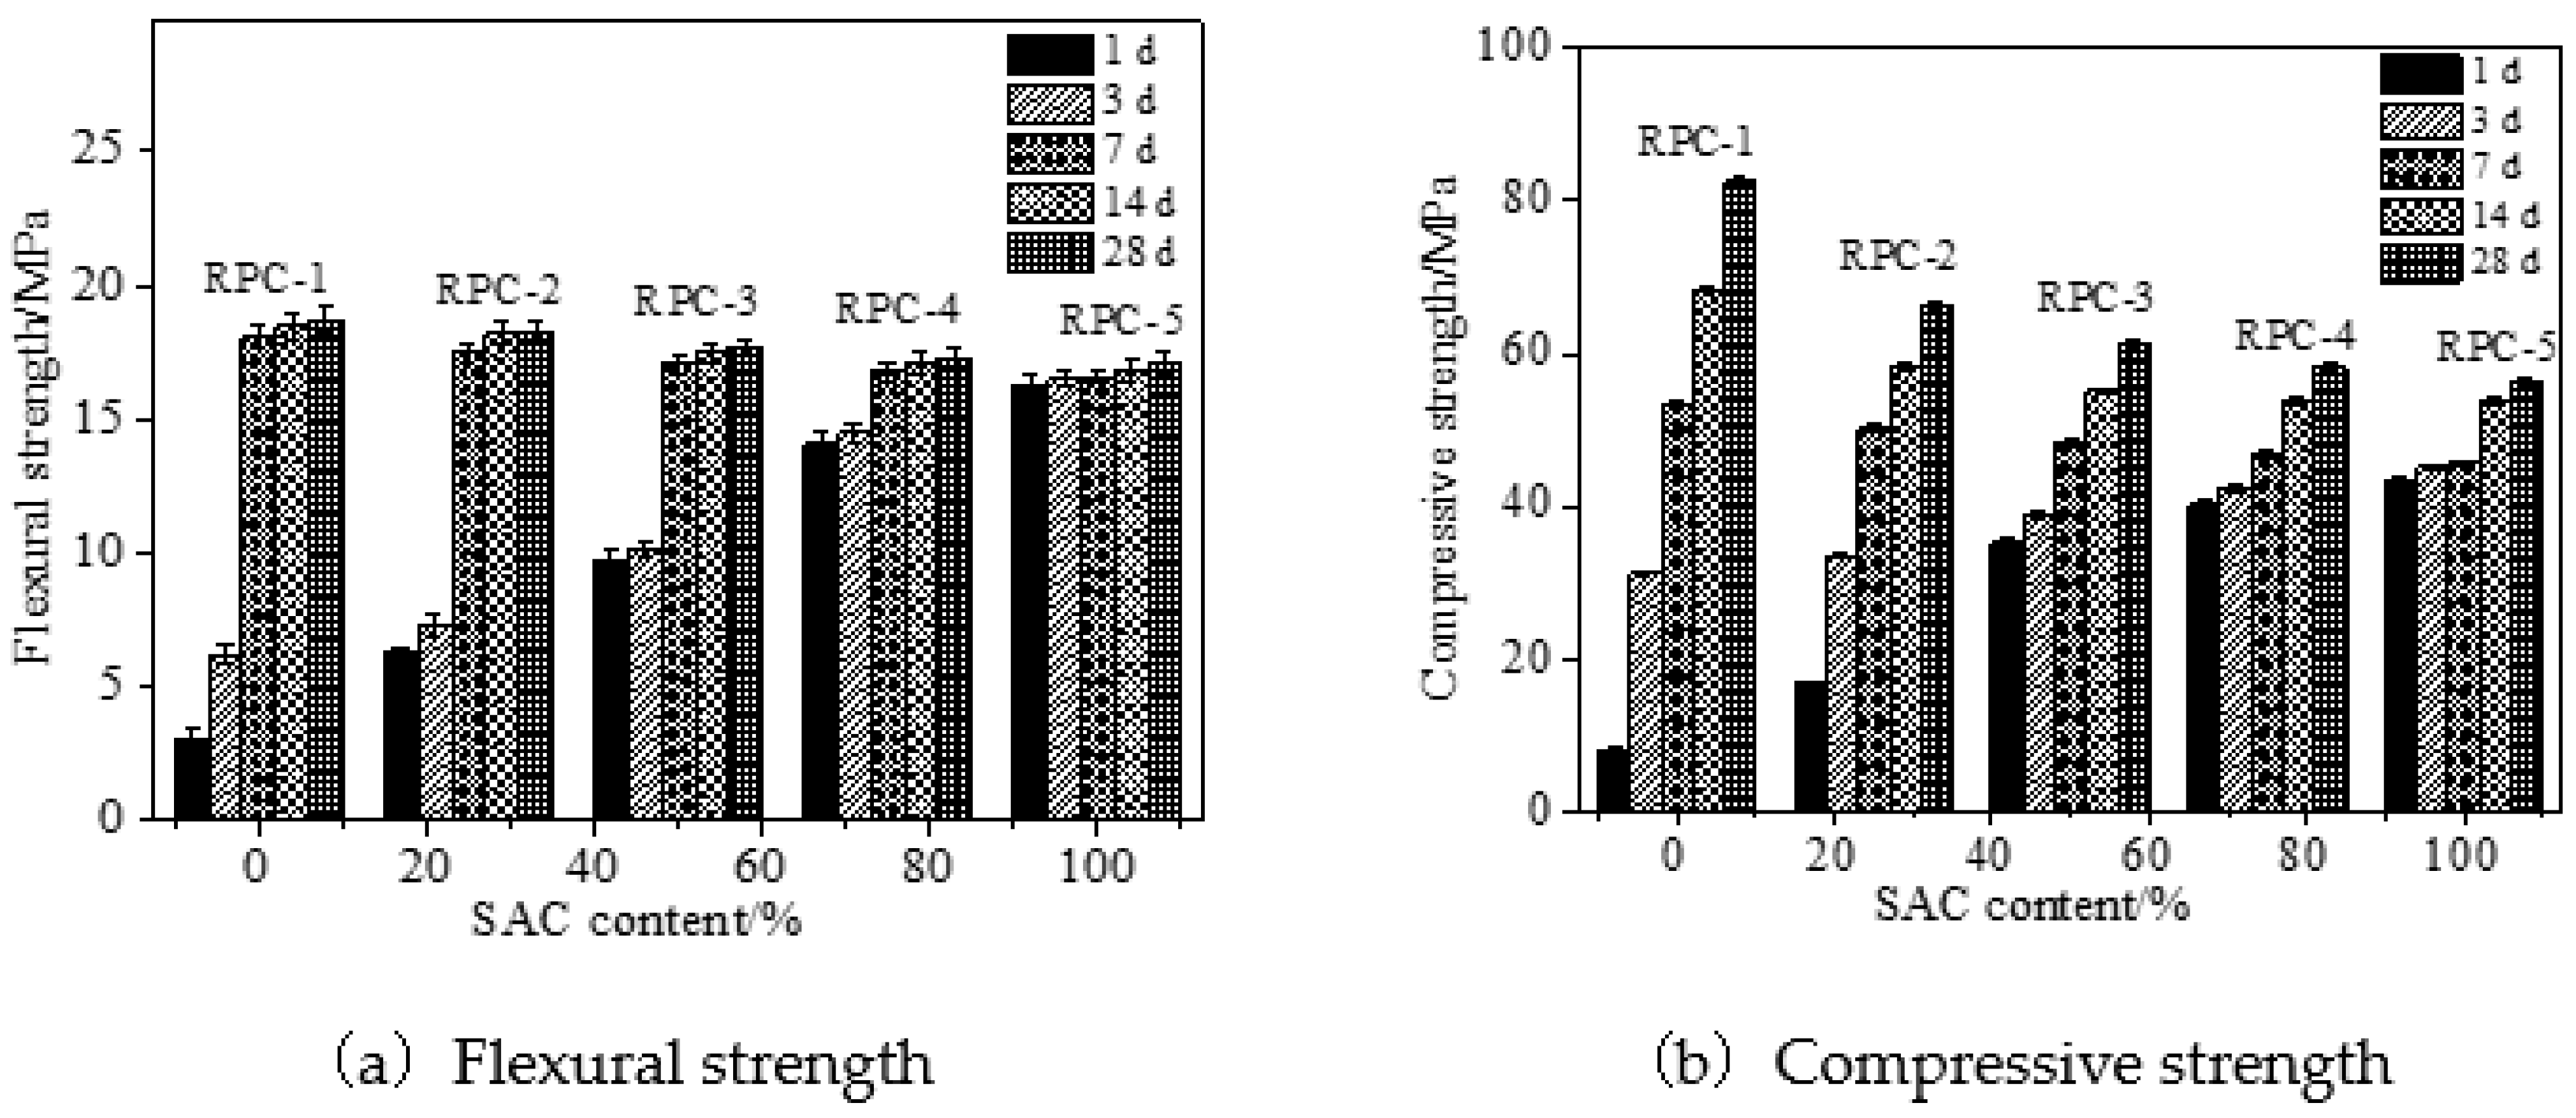
3.1. Mechanical Strength
The mechanical strength (the flexural and compressive strength) of RPC are illustrated in
Figure 3. The cement applied in manufacturing RPC was composed of OPC and SAC. The samples were cured in standard curing environment. It can be obtained from
Figure 3, the mechanical strength increased obviously with the increasing curing age, due to the improvement of cement hydration degree [
27]. The increasing dosage of SAC led to increasing the mechanical strength at low curing age (lower than 7 days). However, the mechanical strength decreased with the increasing content of SAC when the curing age was higher than or equal to 7 days. This was attributed to the fact that the SAC could effectively accelerate the cement hydration speed and improve the mechanical strength. However, when the curing age was higher than or equal to 7 days, the addition of SAC demonstrated negative effect on the mechanical strength of RPC. As reported in other research [
28], OPC with the curing age higher than 7 days showed better performance than SAC. Therefore, the mechanical strength of RPC with OPC at these curing times were better. Comparing the research findings with previous studies, the mechanical strength of RPC with blended cement (OPC and SAC) was lower than the RPC with SAC when the curing age was lower than 3 days. However, when the curing age exceeded 3 days, RPC with blended cement showed better mechanical properties [
21].
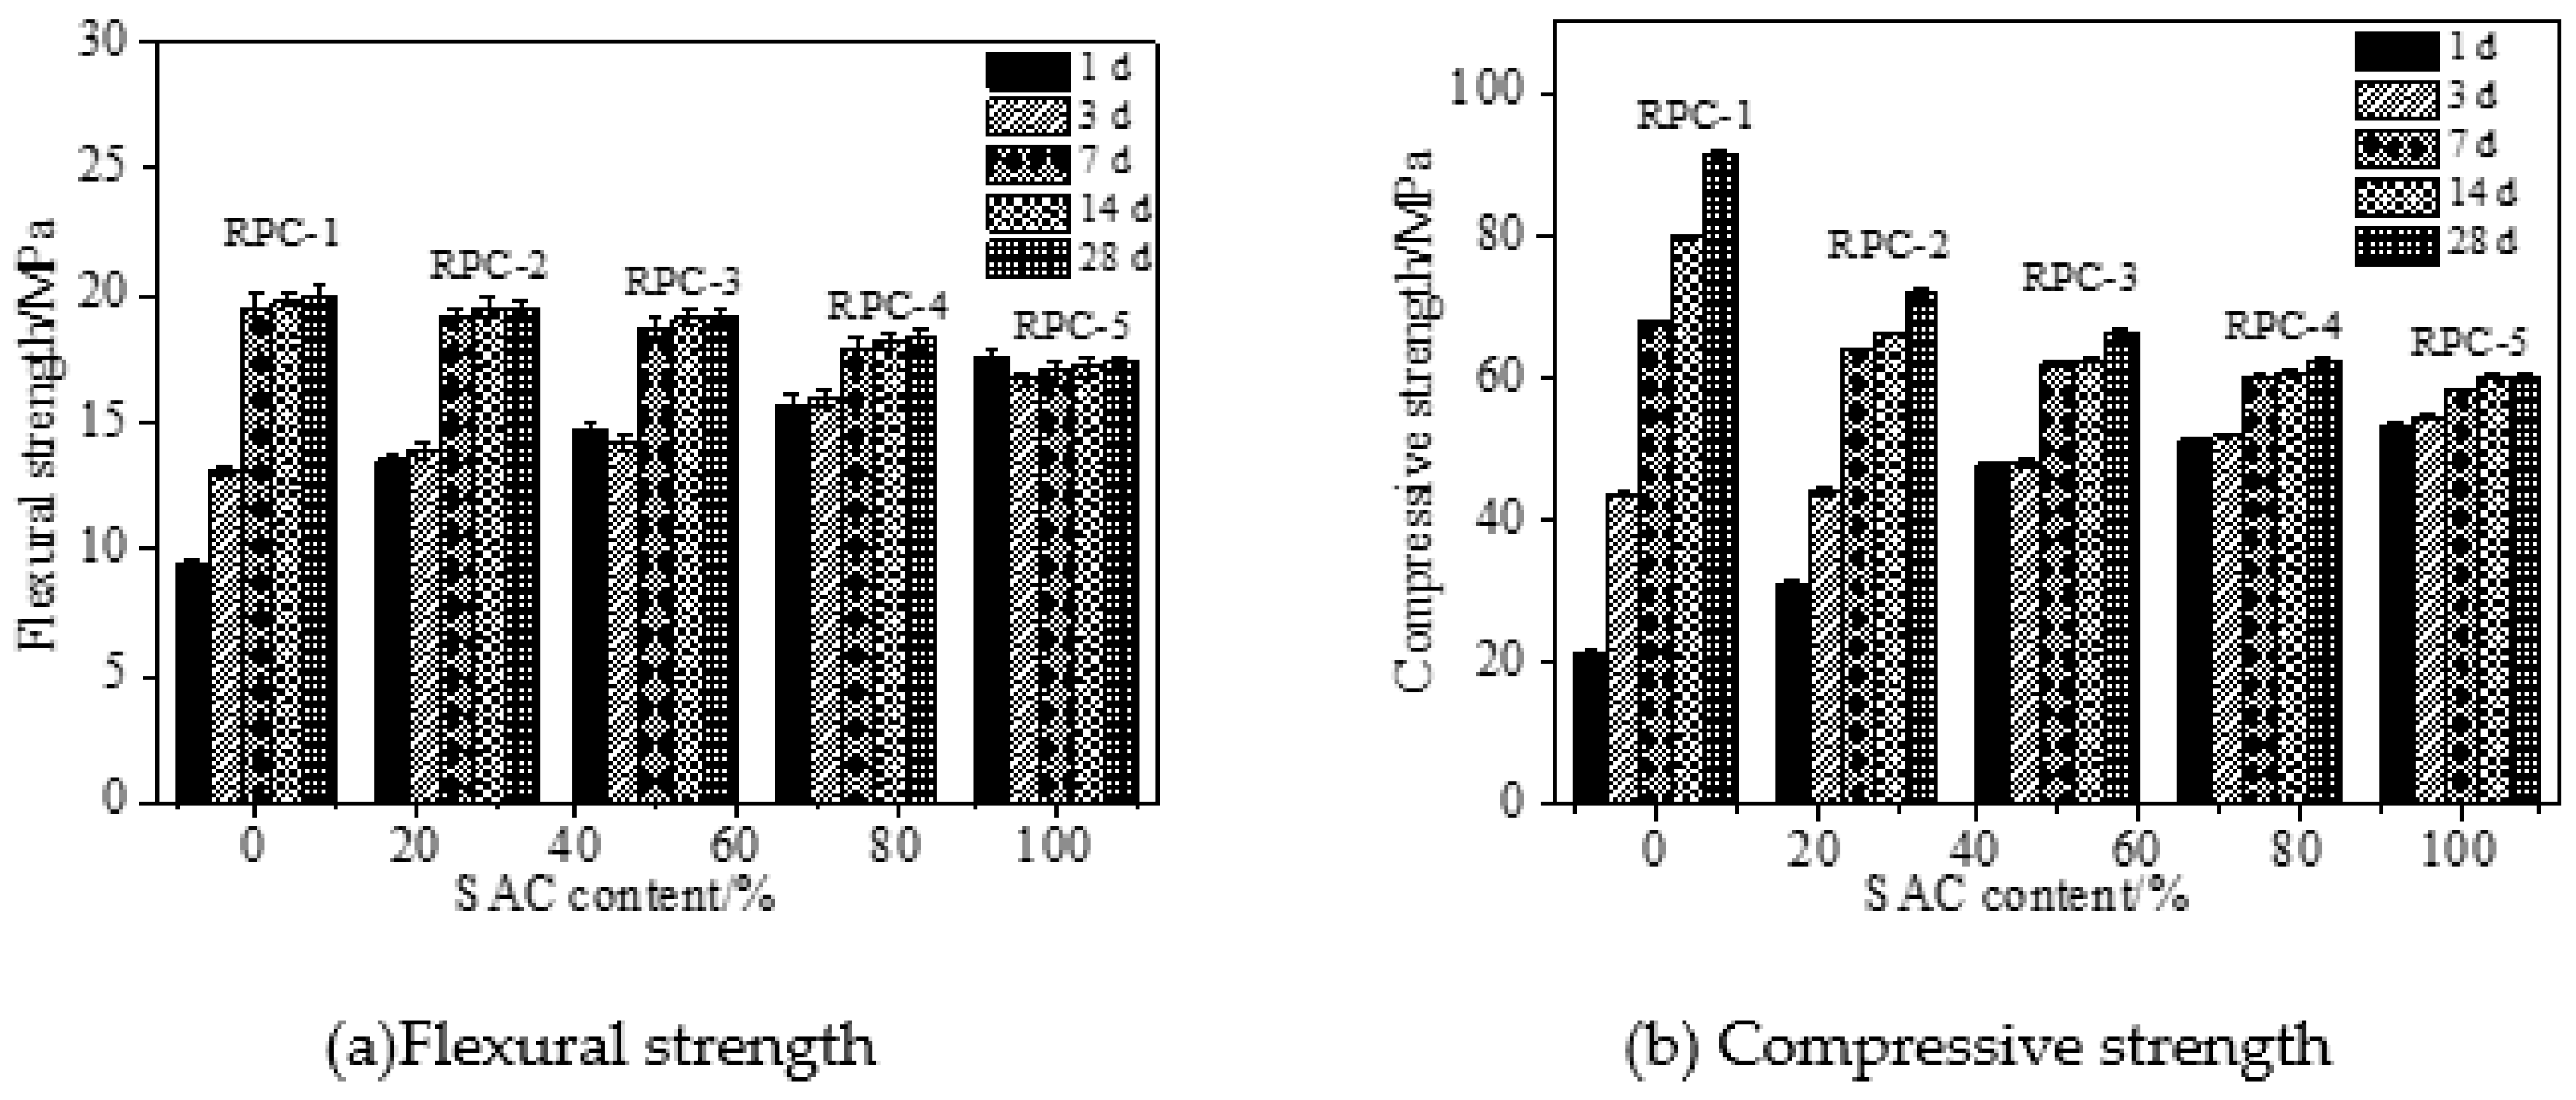
Figure 4 shows the mechanical strength of RPC cured in the carbon dioxide. It can be seen in
Figure 4 that the mechanical strength of RPC increased with the increasing curing time by carbon dioxide. With the same increasing curing time, the mechanical strength of RPC demonstrated the similar law with that of RPC cured in standard curing environment. It can be obtained by comparing
Figure 3 and
Figure 4, the mechanical strength of RPC cured in carbon dioxide was higher than that cured in standard curing environment. This was attributed to the fact that the carbon dioxide reacted with alkaline substances and formed carbonate thus increasing the compactness and reducing the porosity of RPC leading eventually to improving the mechanical strength [
29].
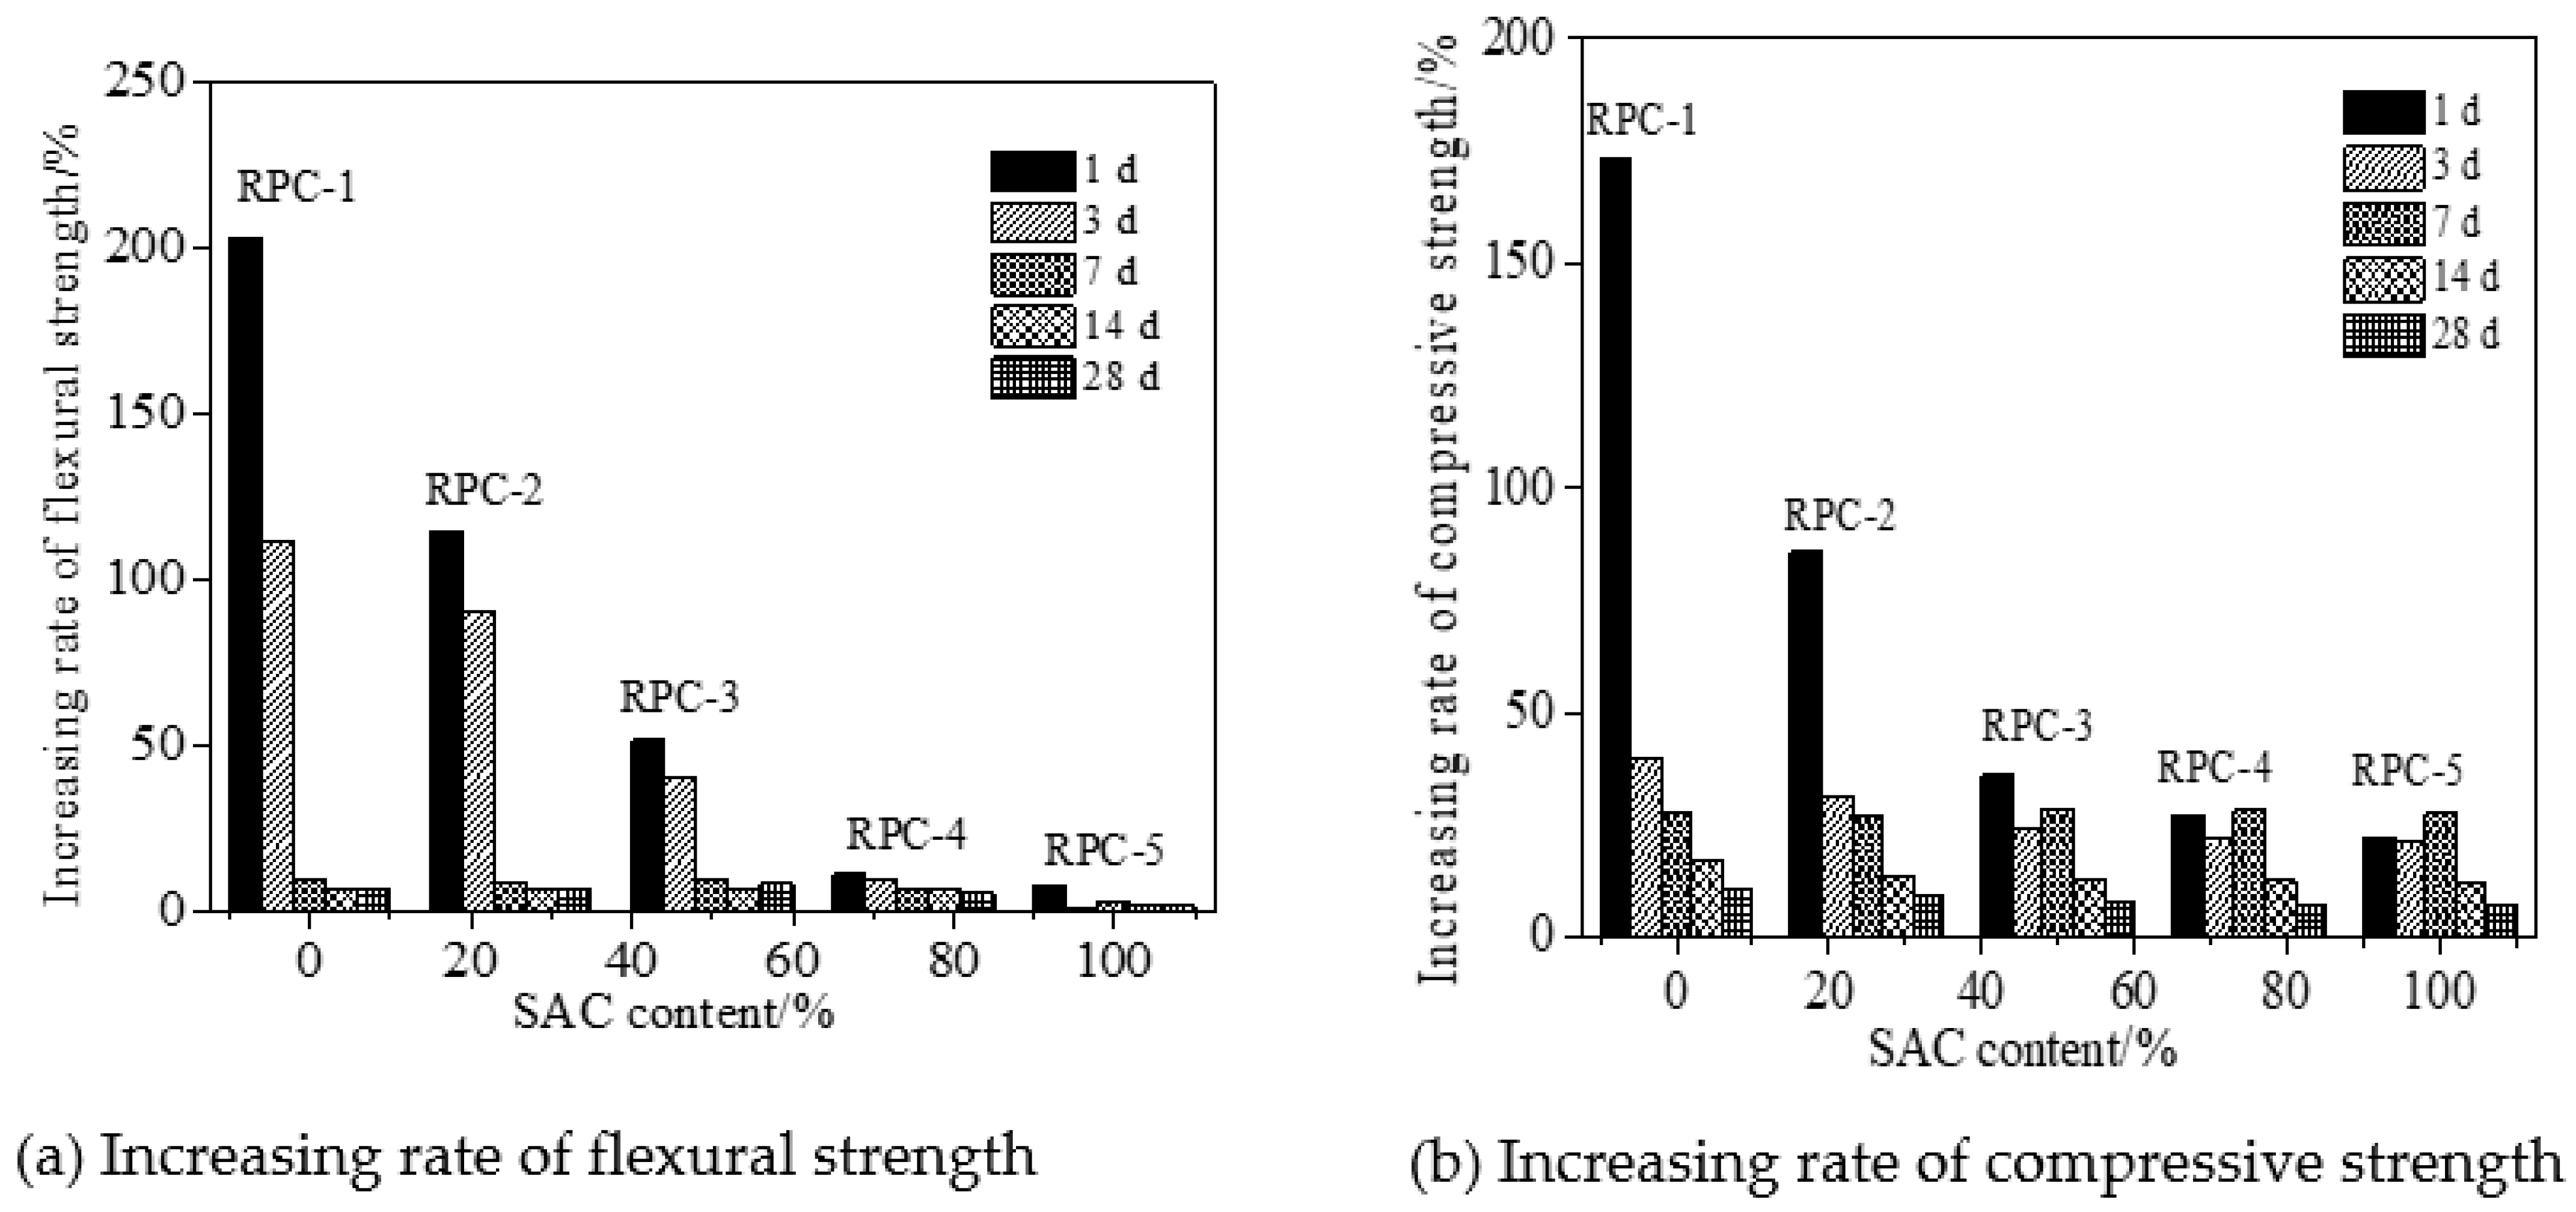
Figure 5 shows the increasing rate of mechanical strength of RPC cured in carbon dioxide compared with the specimens cured in standard curing environment. As obtained from
Figure 5, the increasing rate of mechanical strength of RPC decreased with the curing age and the increasing dosages of SAC. Due to the fact that the alkaline substance of SAC was lower than that of OPC, therefore, the reaction degree of carbon dioxide of RPC with higher dosage of SAC decreased, hence the following mechanical strength was lower. Finally, it can be observed in
Figure 5, that the increasing rate of flexural strength was higher than that of compressive strength. Compared with the standard curing, the carbon dioxide curing could increase the mechanical strength of RPC by 25–213% when the curing age was 1 day. However, when the curing age was equal to or higher than 3 day, the increasing rates were 8.6–112.1%.
3.2. Mechanical Properties of RPC during NaCl Freeze-Thaw Cycles
In this part, the RPC contained 50% SAC and 50% OPC by the mass ratio of the total cement.
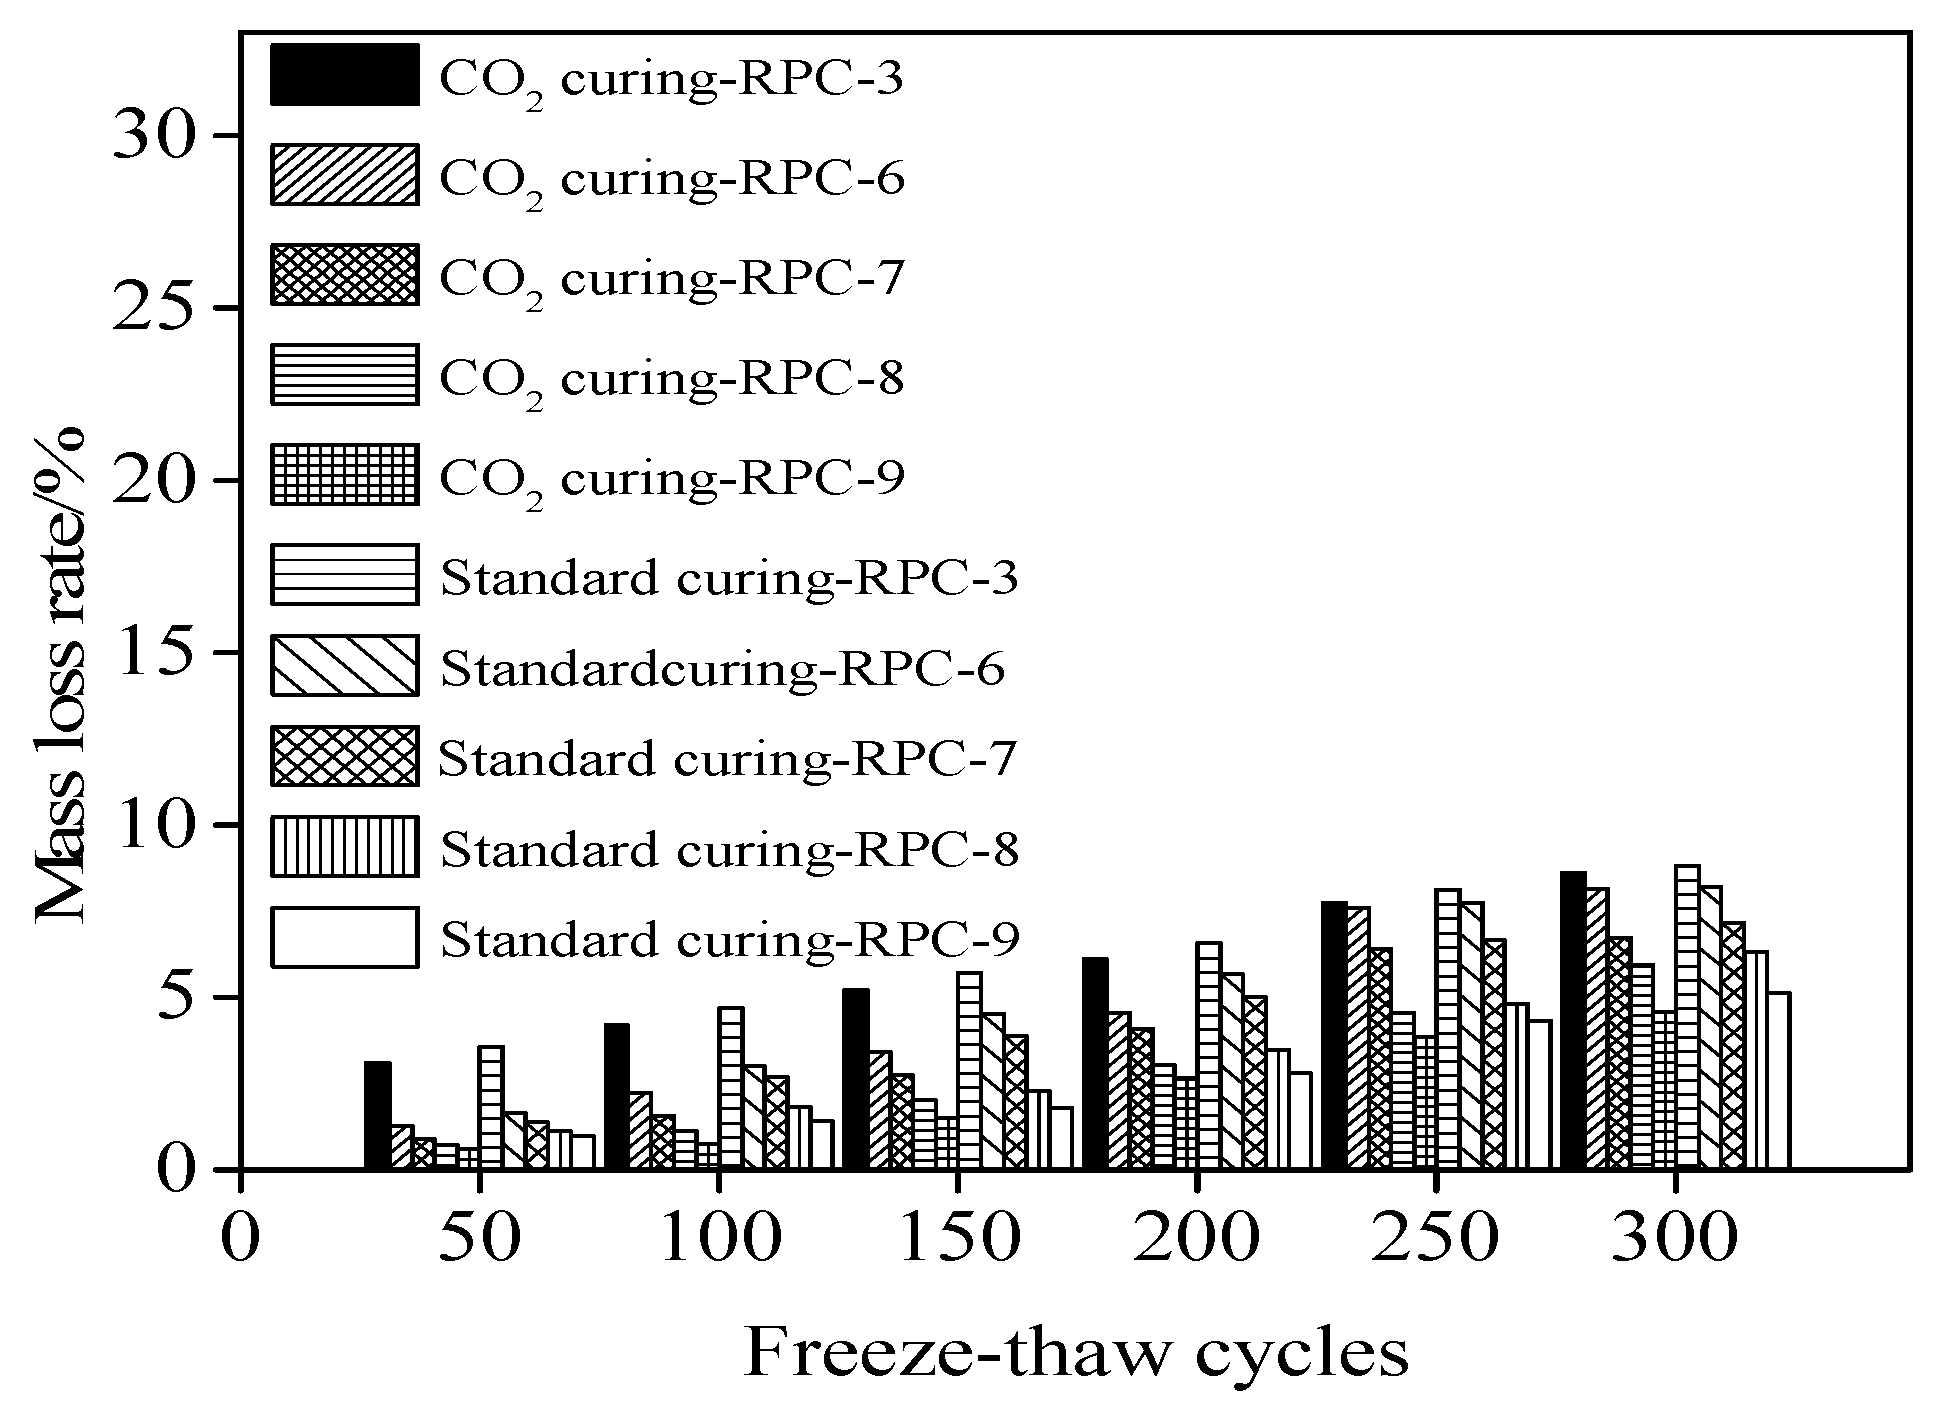
Figure 6 shows the mass loss rate of RPC during NaCl freeze-thaw cycles. As depicted in
Figure 6, the mass loss rate increased with the increasing number of NaCl freeze-thaw cycles due to the fact that the frost heaving stress could induce the inner cracks of RPC resulting in increasing the spalling on the surface of RPC and decreasing the following mass. As observed from
Figure 6, the mass loss rate decreased by the increasing dosage of polypropylene fibers due to the limited cracks propagation of RPC, thus decreasing the mass loss of RPC. Moreover, the carbon dioxide curing could reduce the mass loss due to the fact that the carbon dioxide curing could improve the porosity of RPC thus limiting the expansion of inner cracks during NaCl freeze-thaw cycles [
30].
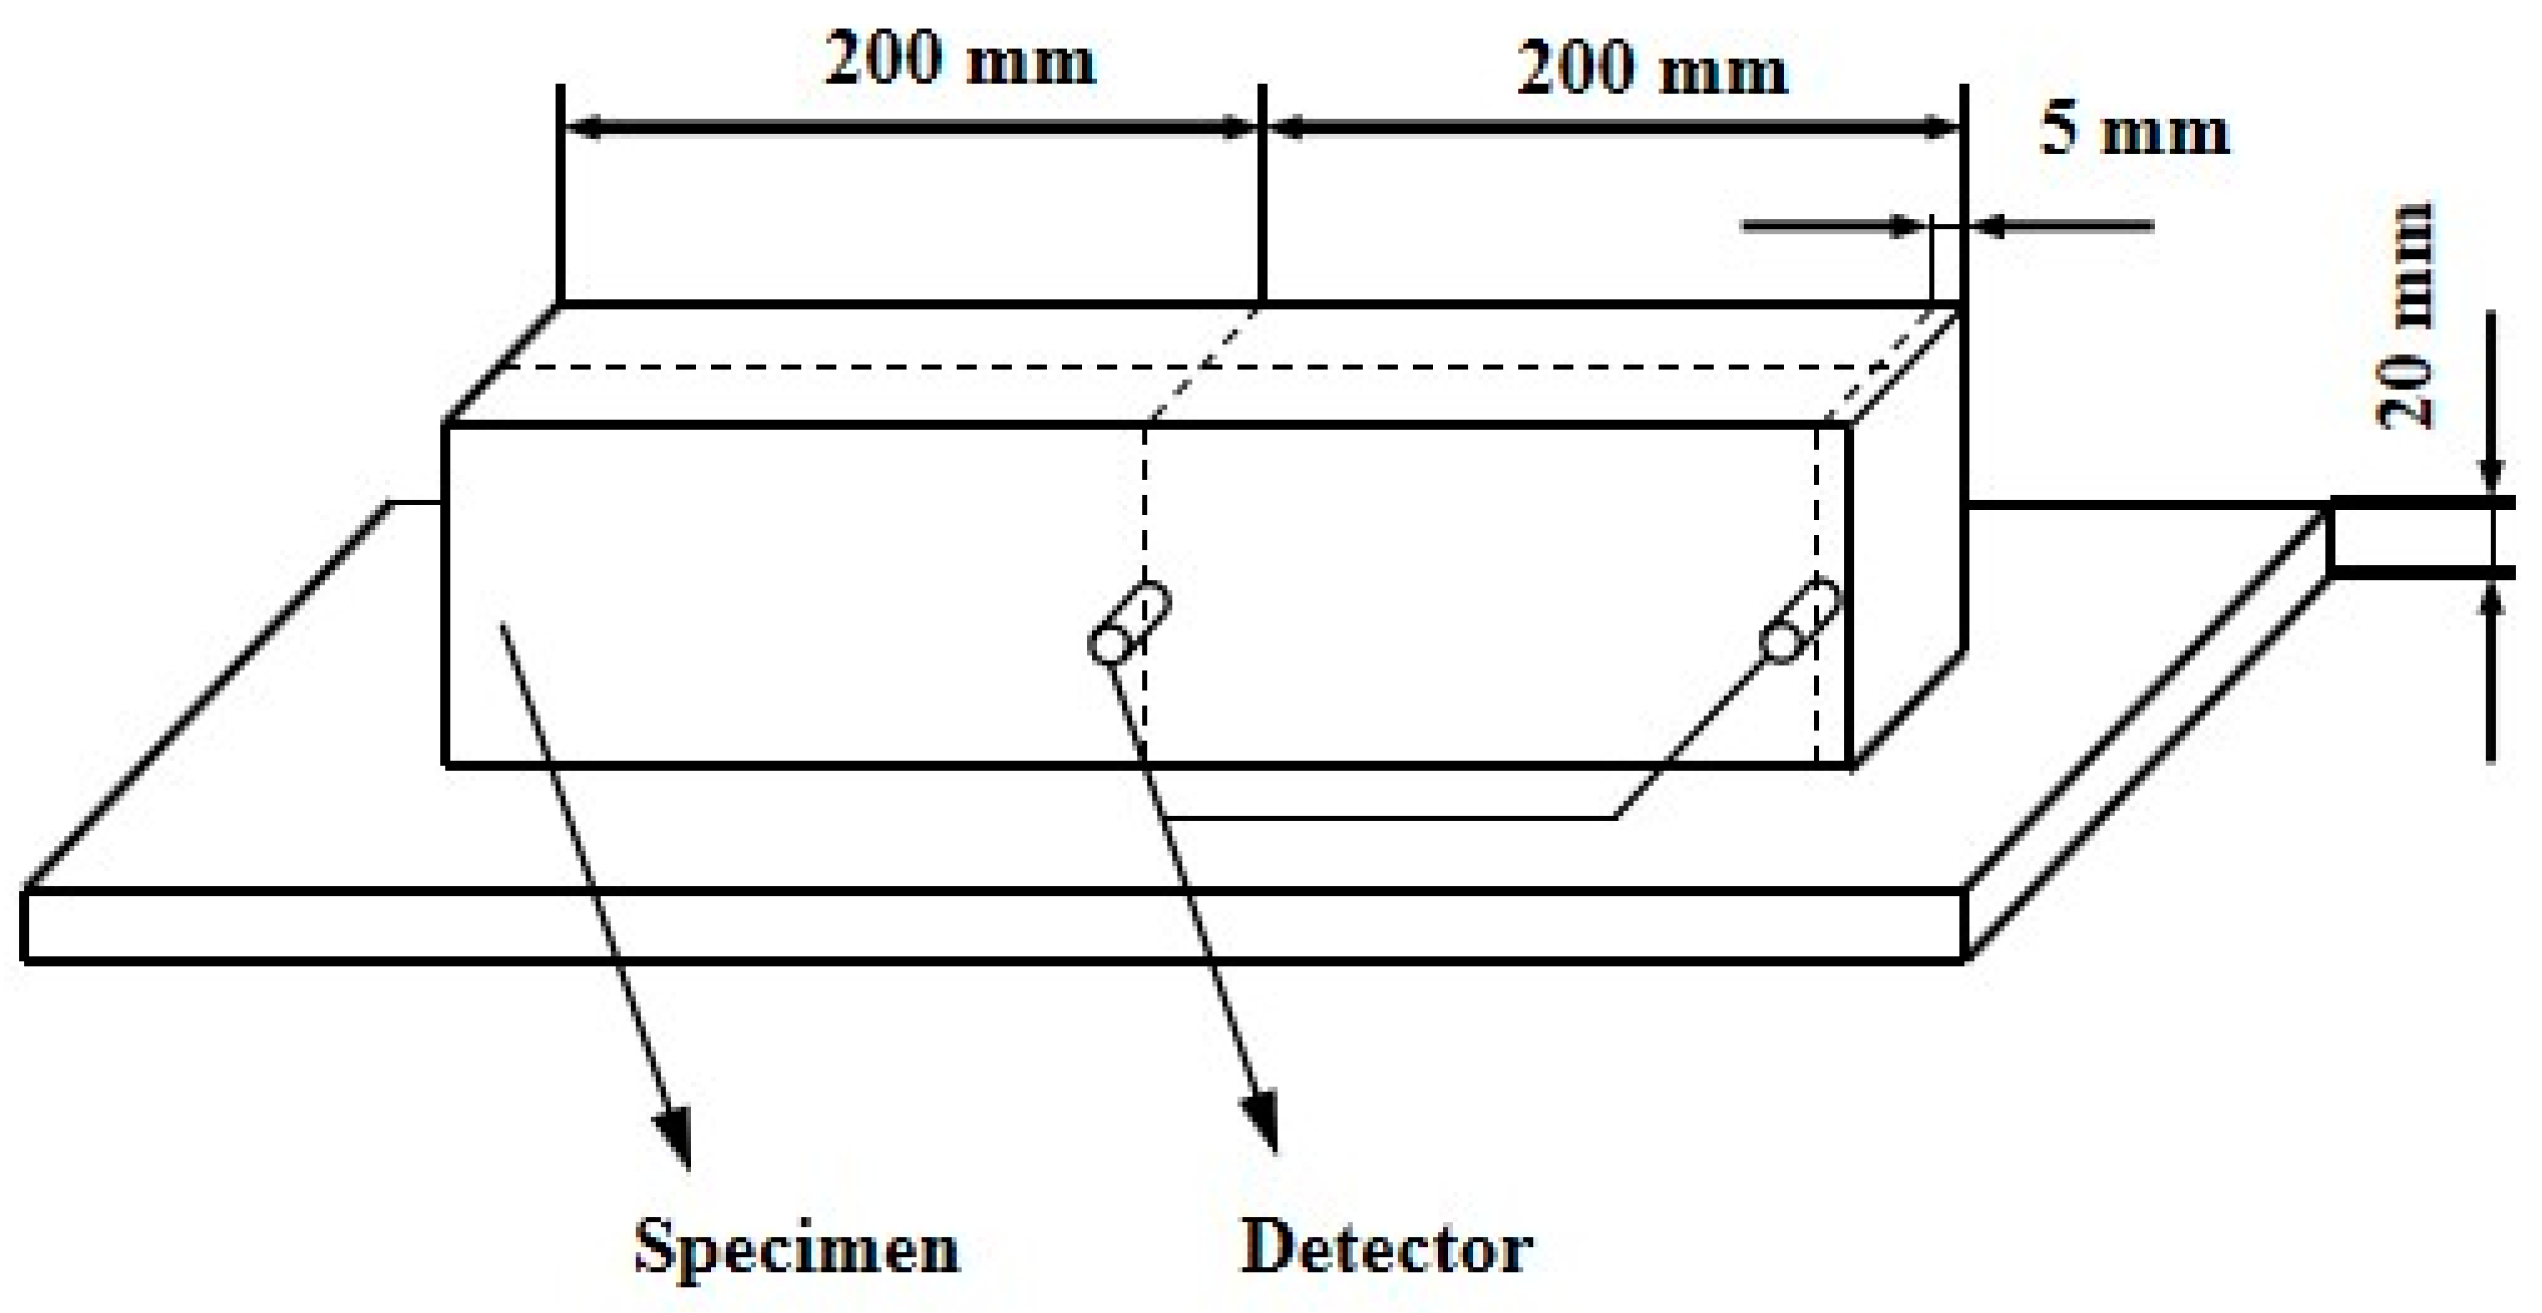
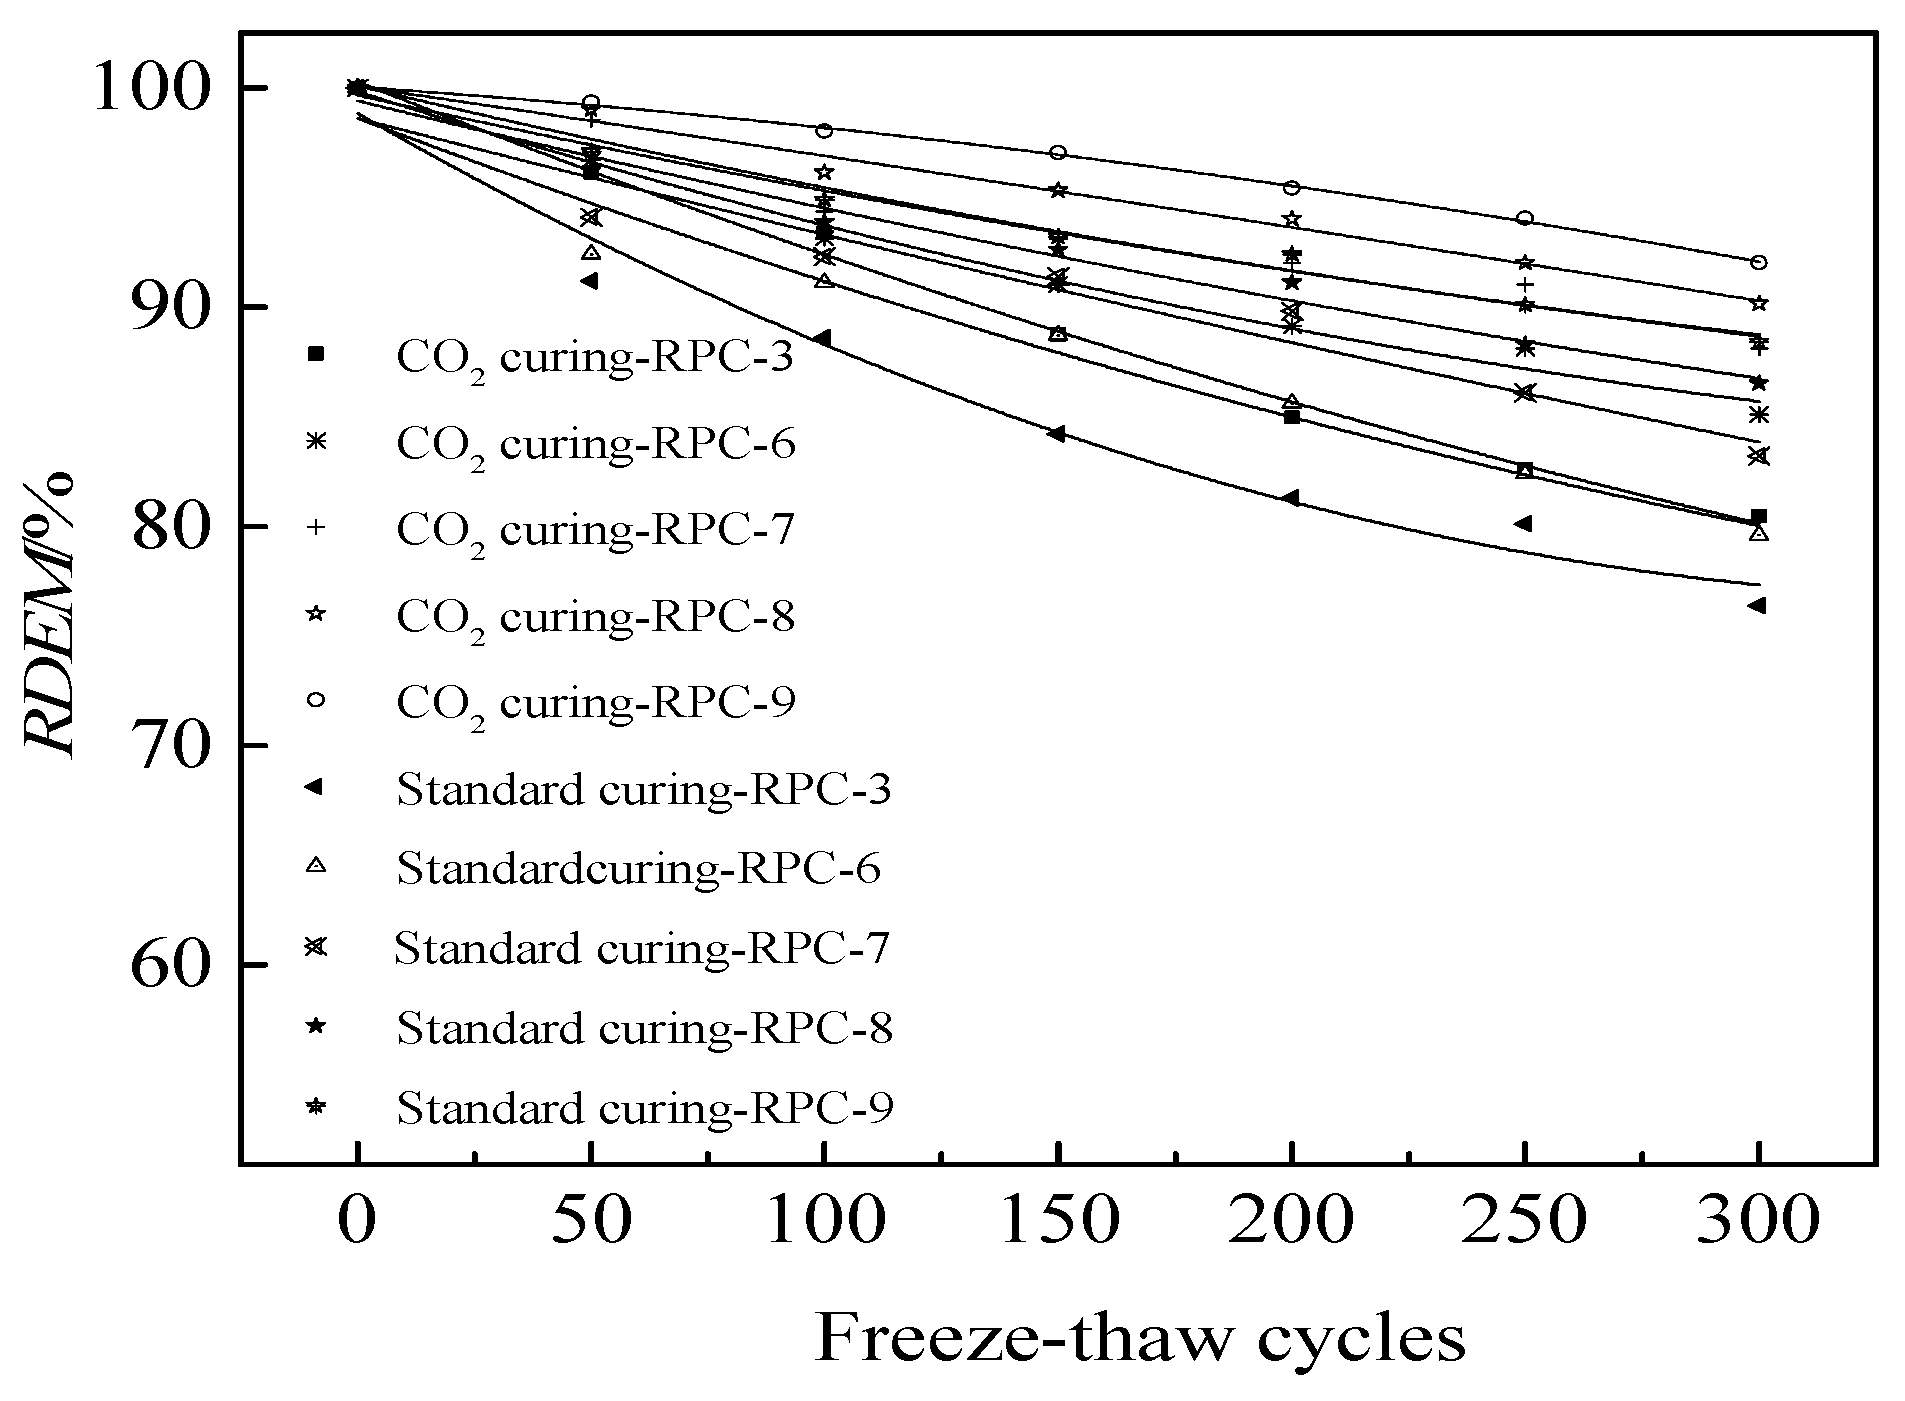
The relative dynamic modulus of elasticity of RPC during NaCl freeze-thaw cycles is shown in figure. As illustrated in
Figure 7, the relative dynamic modulus of elasticity decreased in the form of quadratic function with the increasing number of NaCl freeze-thaw cycles. This was attributed to the fact that the NaCl freeze–thaw cycles could accelerate the crack propagation of RPC, thus hindering the transmission of sound and decreasing the relative dynamic modulus of elasticity [
31,
32]. As shown in
Figure 7, the increasing dosages of polypropylene fibers demonstrated a positive effect on the relative dynamic modulus of elasticity due to the limiting effect of polypropylene fibers on crack propagation. Therefore, the relative dynamic modulus of elasticity increased with the increasing content of polypropylene fibers. Furthermore, the carbon dioxide curing could increase the relative dynamic modulus of elasticity during NaCl freeze-thaw cycles [
33].
Table 5 shows the fitting results of the RDEM and the number of freeze-thaw cycles (N). It can be deduced from
Table 5 that the fitting degree of the fitting equations was higher than 0.92 indicating the accuracy of fitting equation.
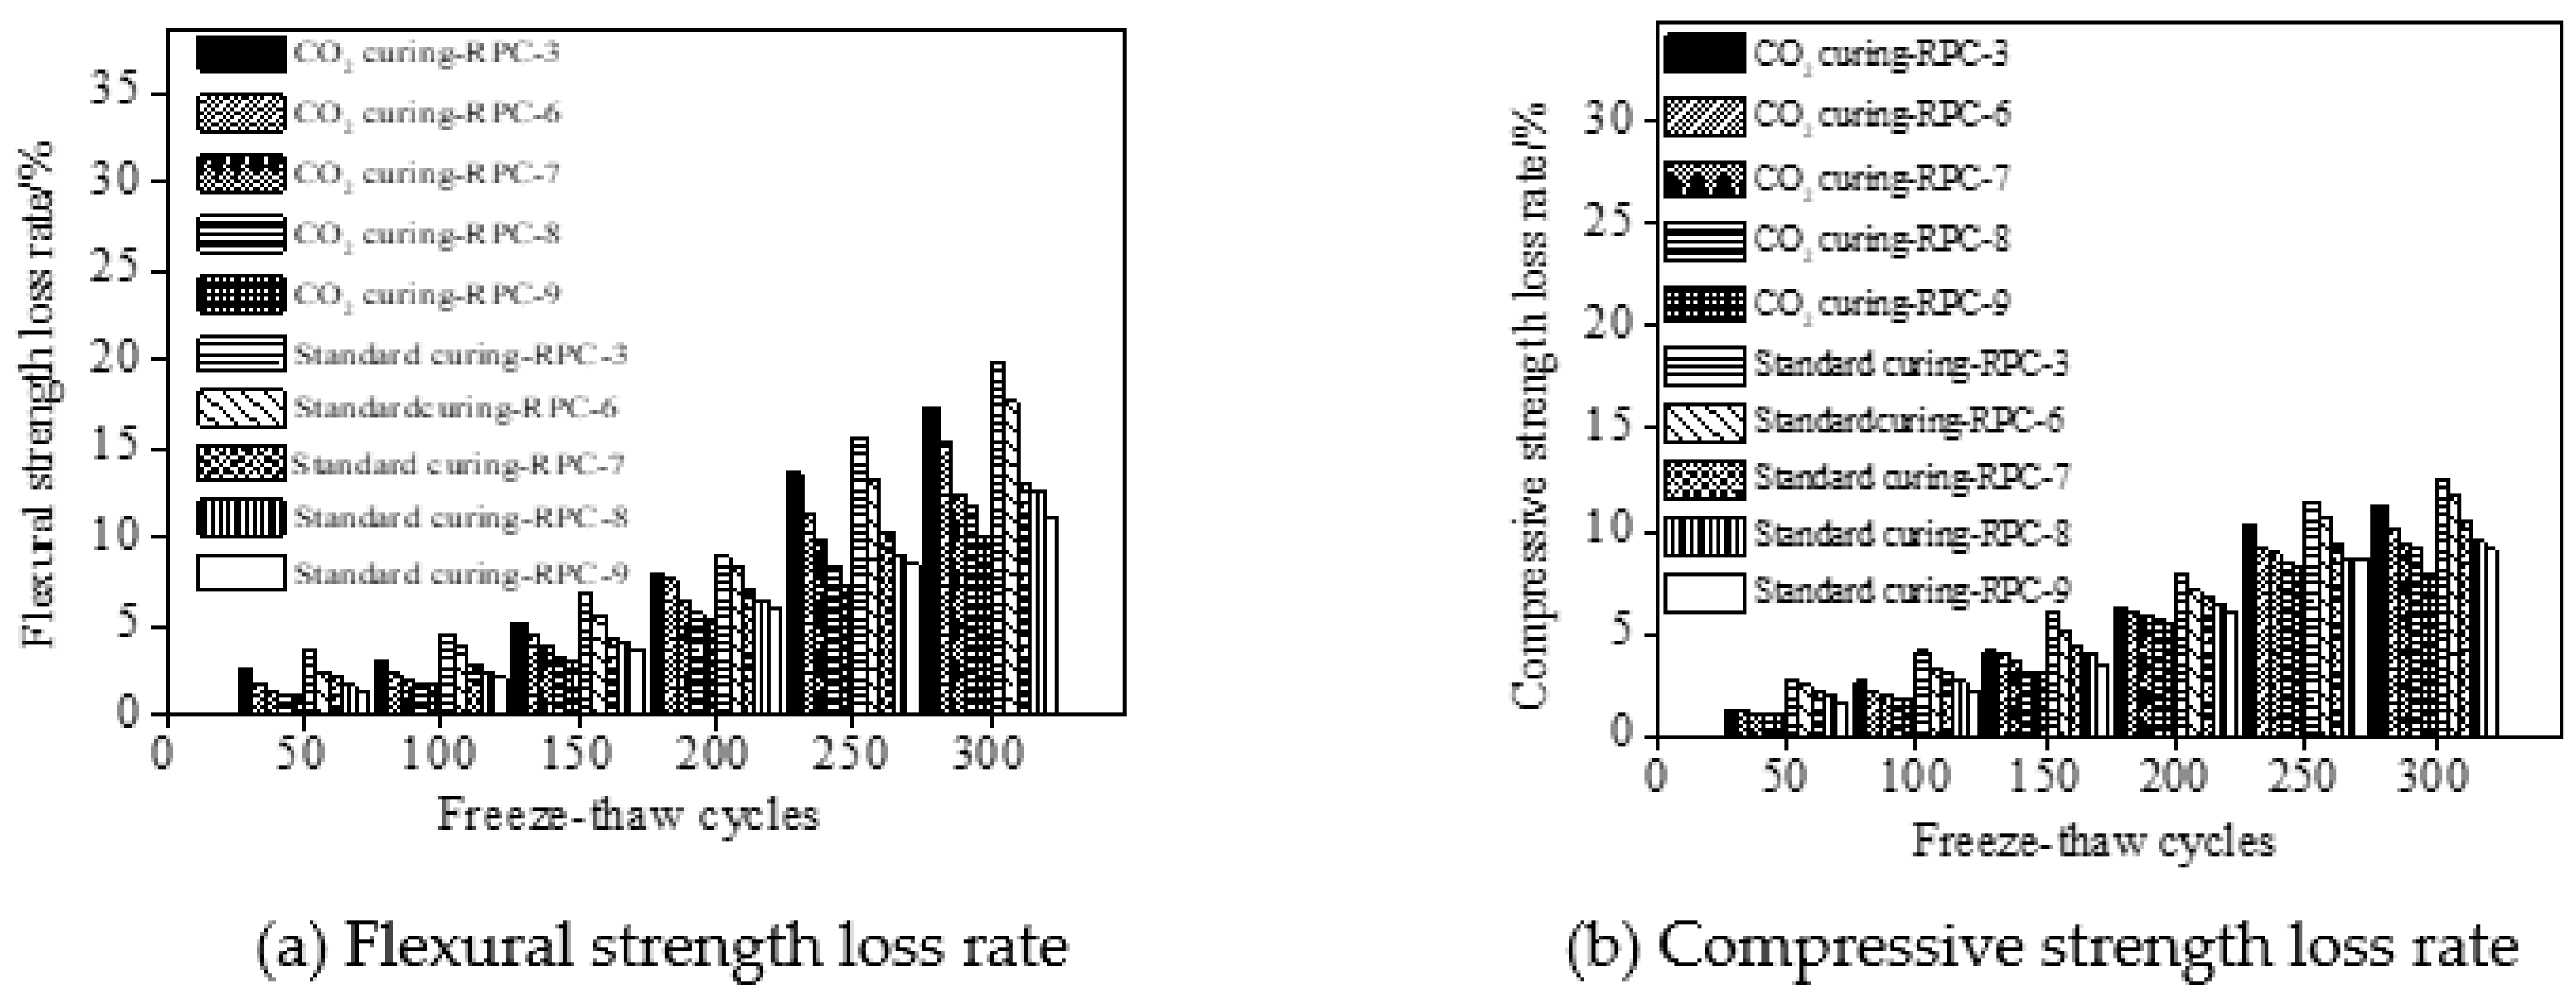
Figure 8 shows the flexural and compressive strength loss rate of RPC. As depicted from
Figure 8, the mechanical strength loss rate decreased with the increasing number of NaCl freeze-thaw cycles and carbon dioxide curing. Moreover, the carbon dioxide curing on RPC led to decreasing the mechanical strength loss rate of RPC, due to the fact that the internal pores of RPC were filled by the carbonation products leading to improvement of the following mechanical performances [
34]. Moreover, the flexural strength loss rate was higher than that of the compressive strength loss rate.
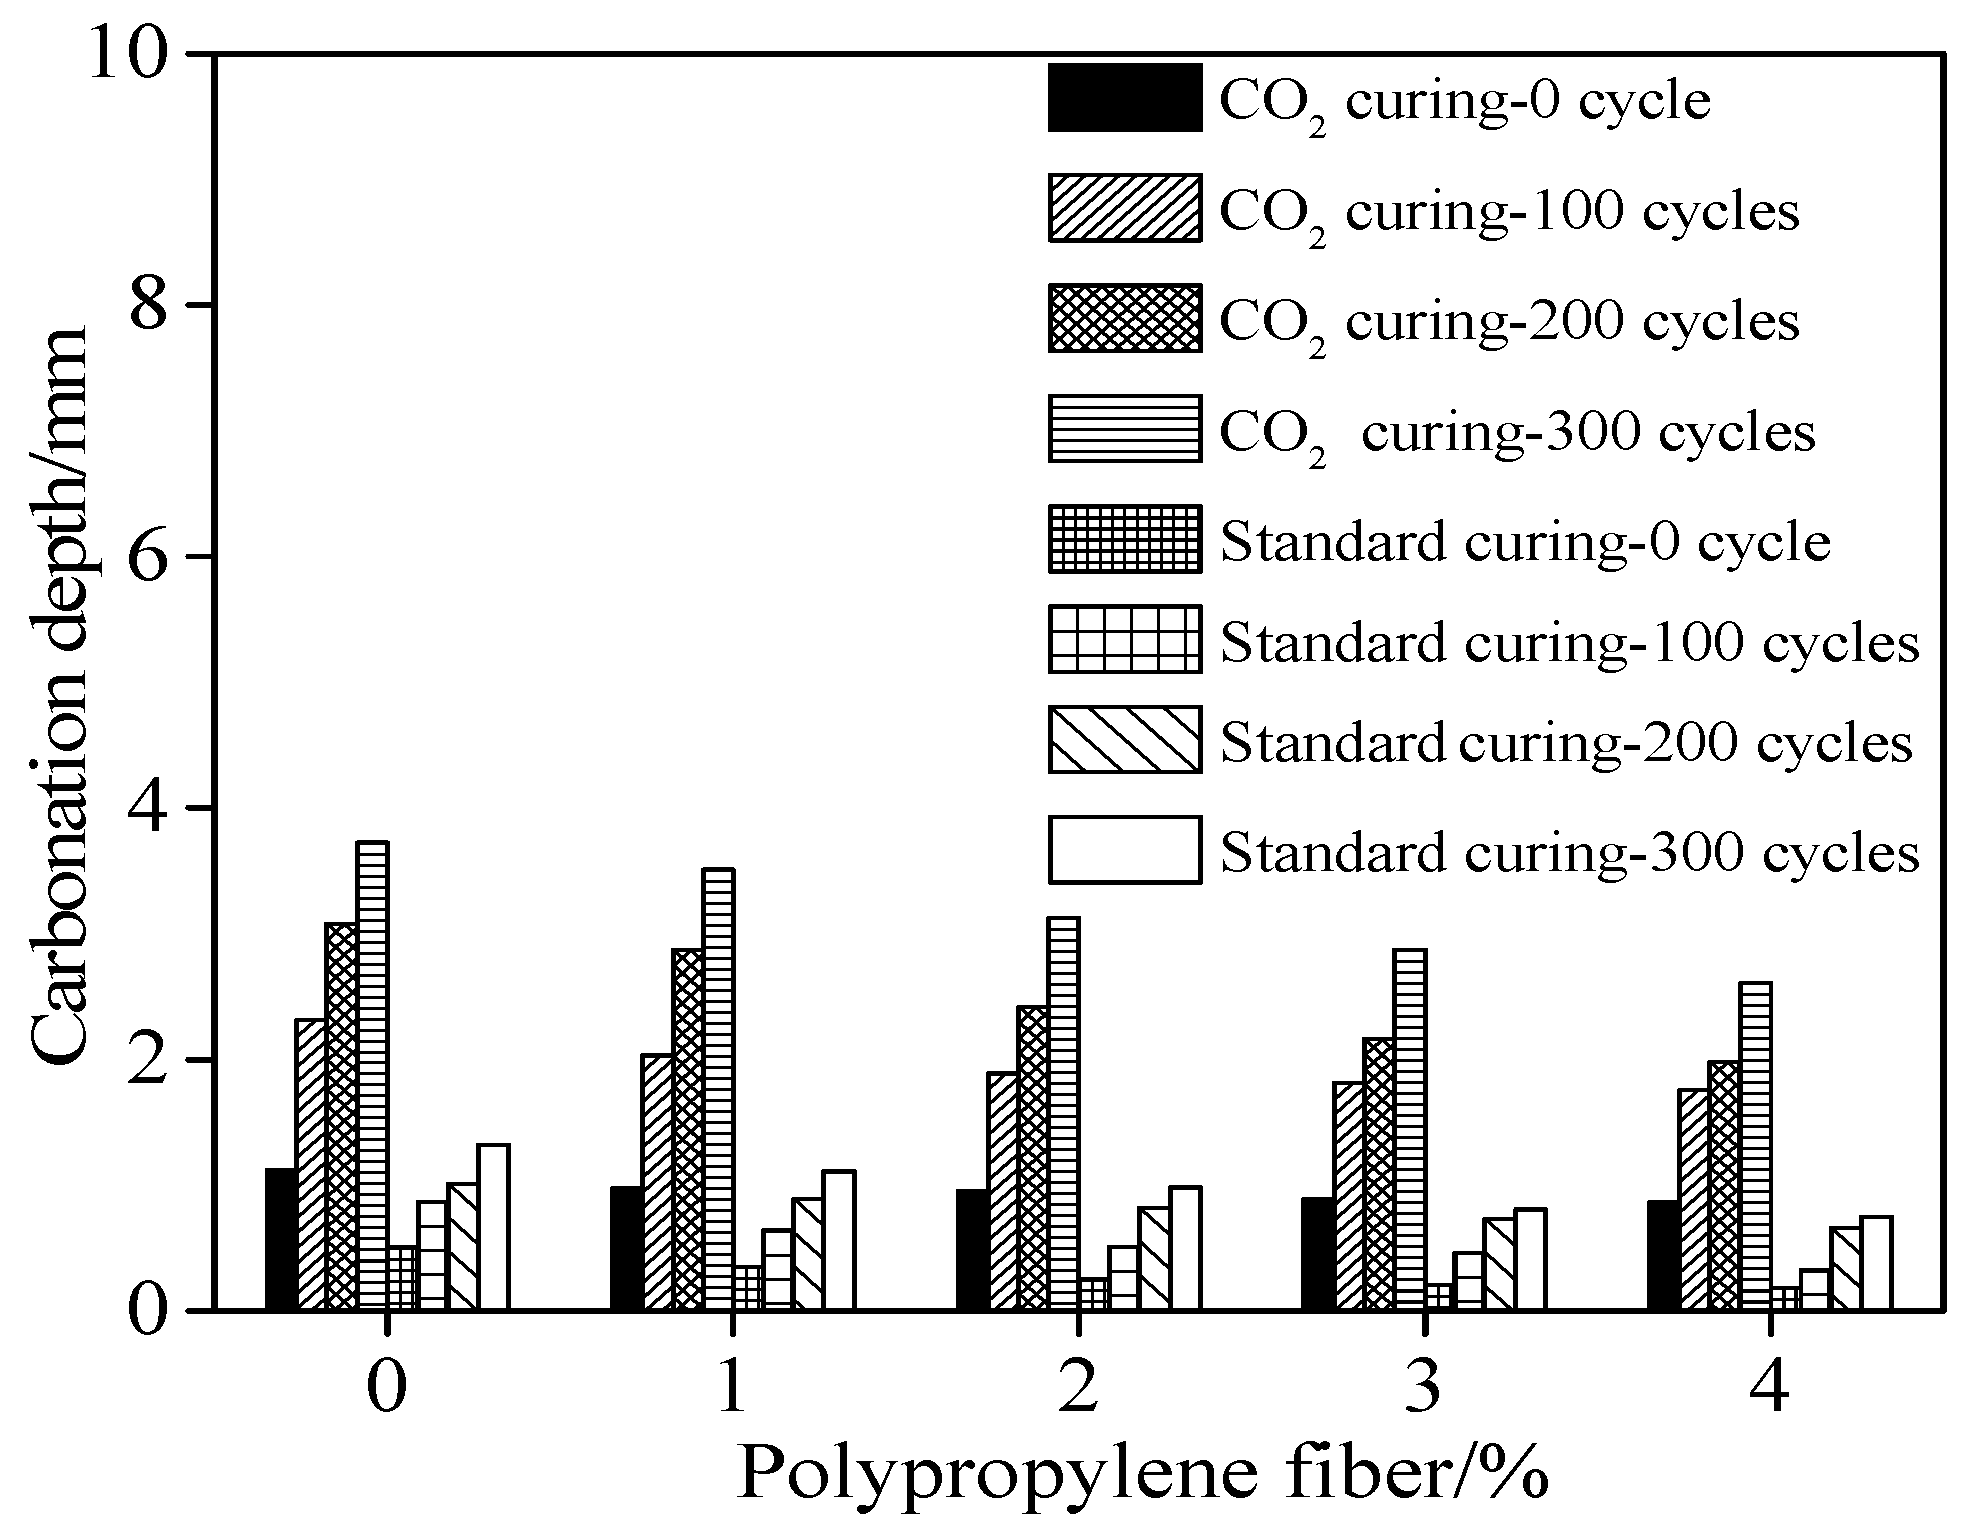
Figure 9 shows the carbonation depth of RPC during NaCl freeze-thaw cycles. RPC-3, RPC-6, RPC-7, RPC-8 and RPC-9 corresponding to polypropylene fibers of 1%, 2%, 3% and 4% by the volume of RPC were selected. It can be observed from
Figure 9, the carbonation depth of RPC increased with the increasing number of NaCl freeze-thaw cycles and carbon dioxide curing. This was attributed to the fact that the NaCl freeze-thaw cycles could lead to accelerated propagation of internal cracks. Therefore, more internal alkaline substances reacted with carbon dioxide leading to increase in the carbonation depth [
35]. Moreover, the carbon dioxide reacted with alkaline substances thus resulting in the carbonation degree and increasing the carbonation depth [
36]. Additionally, the increasing dosages of polypropylene fiber could limit internal crack extension and propagation, thus decreasing the carbonation depth of RPC [
24].
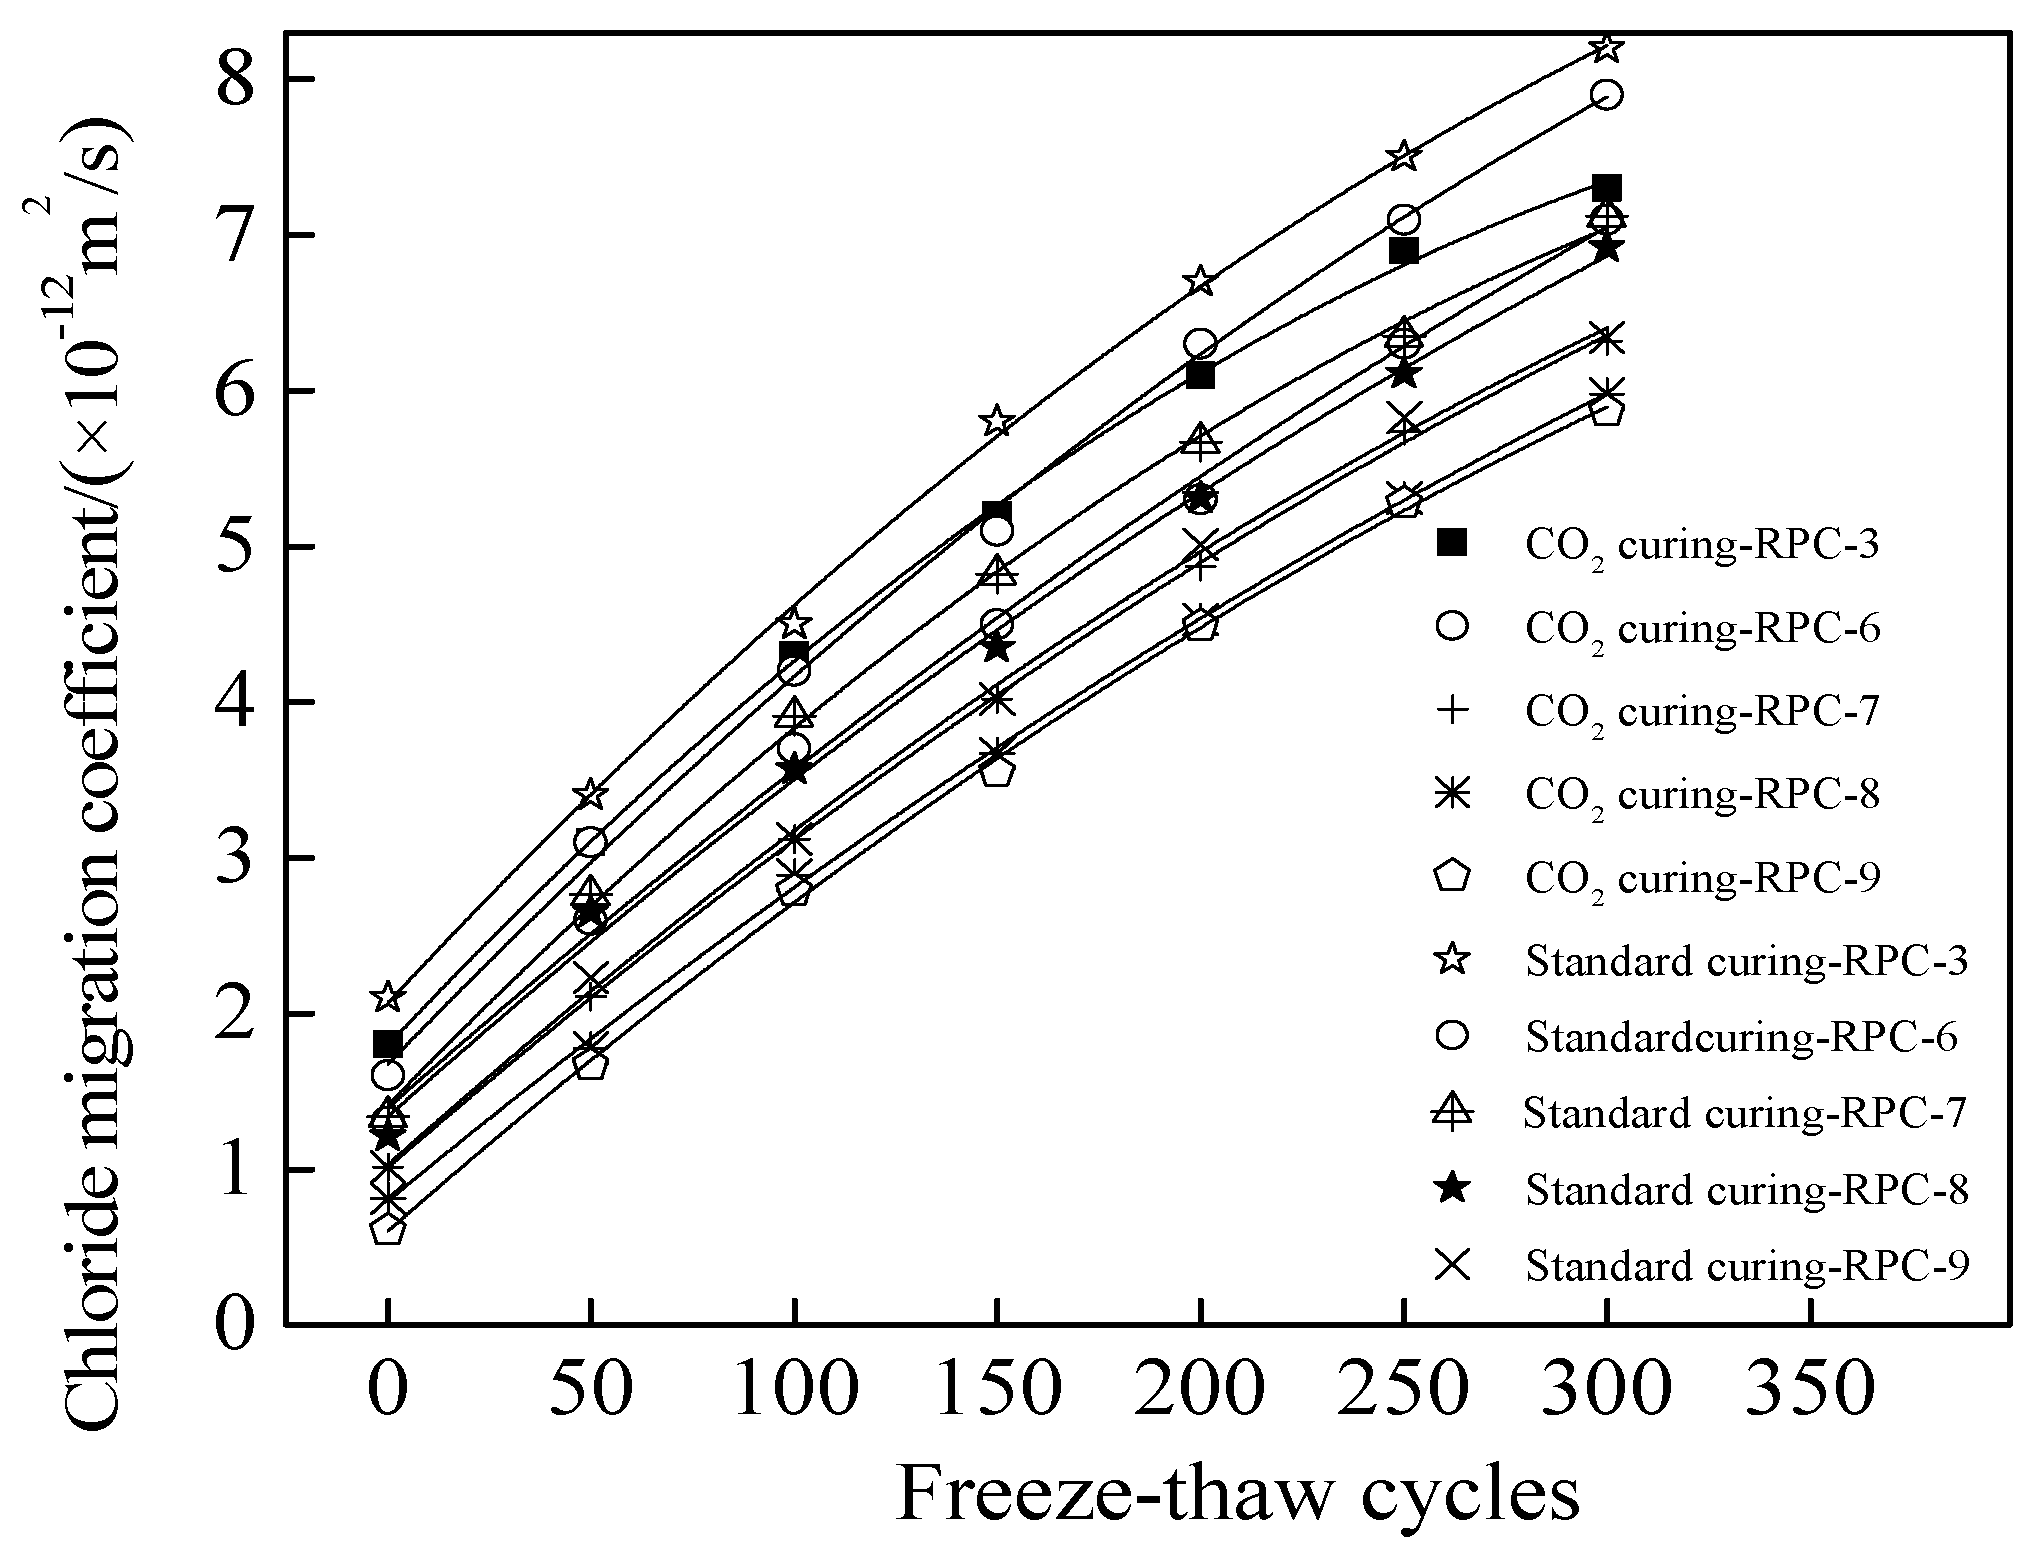
Figure 10 shows the chloride migration coefficient (CMC) of RPC cured in the standard curing environment and carbon dioxide curing environment respectively. The CMC was determined per 50 NaCl freeze-thaw cycles. As illustrated in
Figure 10, the CMC increased in the form of quadratic function with the number of NaCl freeze-thaw cycles. This was attributed to the fact that the NaCl freeze-thaw cycles could accelerate crack propagation of inner RPC, thus speeding up the migration of chloride ions, leading eventually to increase in the CMC of RPC [
37]. As depicted in
Figure 10, the CMC was decreased by the increasing dosages of polypropylene fibers due to the fact that the cracks propagation is restricted by polypropylene fibers thus preventing the migration of chloride ions and decreasing the CMC [
24]. Furthermore, the CMC was reduced by carbon dioxide curing due to the reduced pore volume and pore size [
38].
Table 6 shows the fitting results of the CMC and the number of freeze-thaw cycles (N). As
Table 6 shows, the fitting degrees of all curves were 0.99, confirming the accuracy of the fitting functions. Comparing the researching results in this study and Ref [
20], the NaCl freeze-thaw resistance of RPC with assembly unit of SAC and OPC was better than RPC with SAC. Moreover, RPC showed better NaCl freeze-thaw resistance when cured in the carbon dioxide than cured in standard curing environment.
3.3. Microscopic Analysis
The blank RPC with 50% SAC and 50% OPC by the mass ratio of the total cement were used for the determination of microcosmic performance experiments. The mixing proportions of the microscopic experiments correspond to RPC-3. As the major product of concrete after carbonation is the formation of calcium carbonate, scanning electron microscopy (SEM) was adopted to investigate the microstructure of RPC after carbonation.
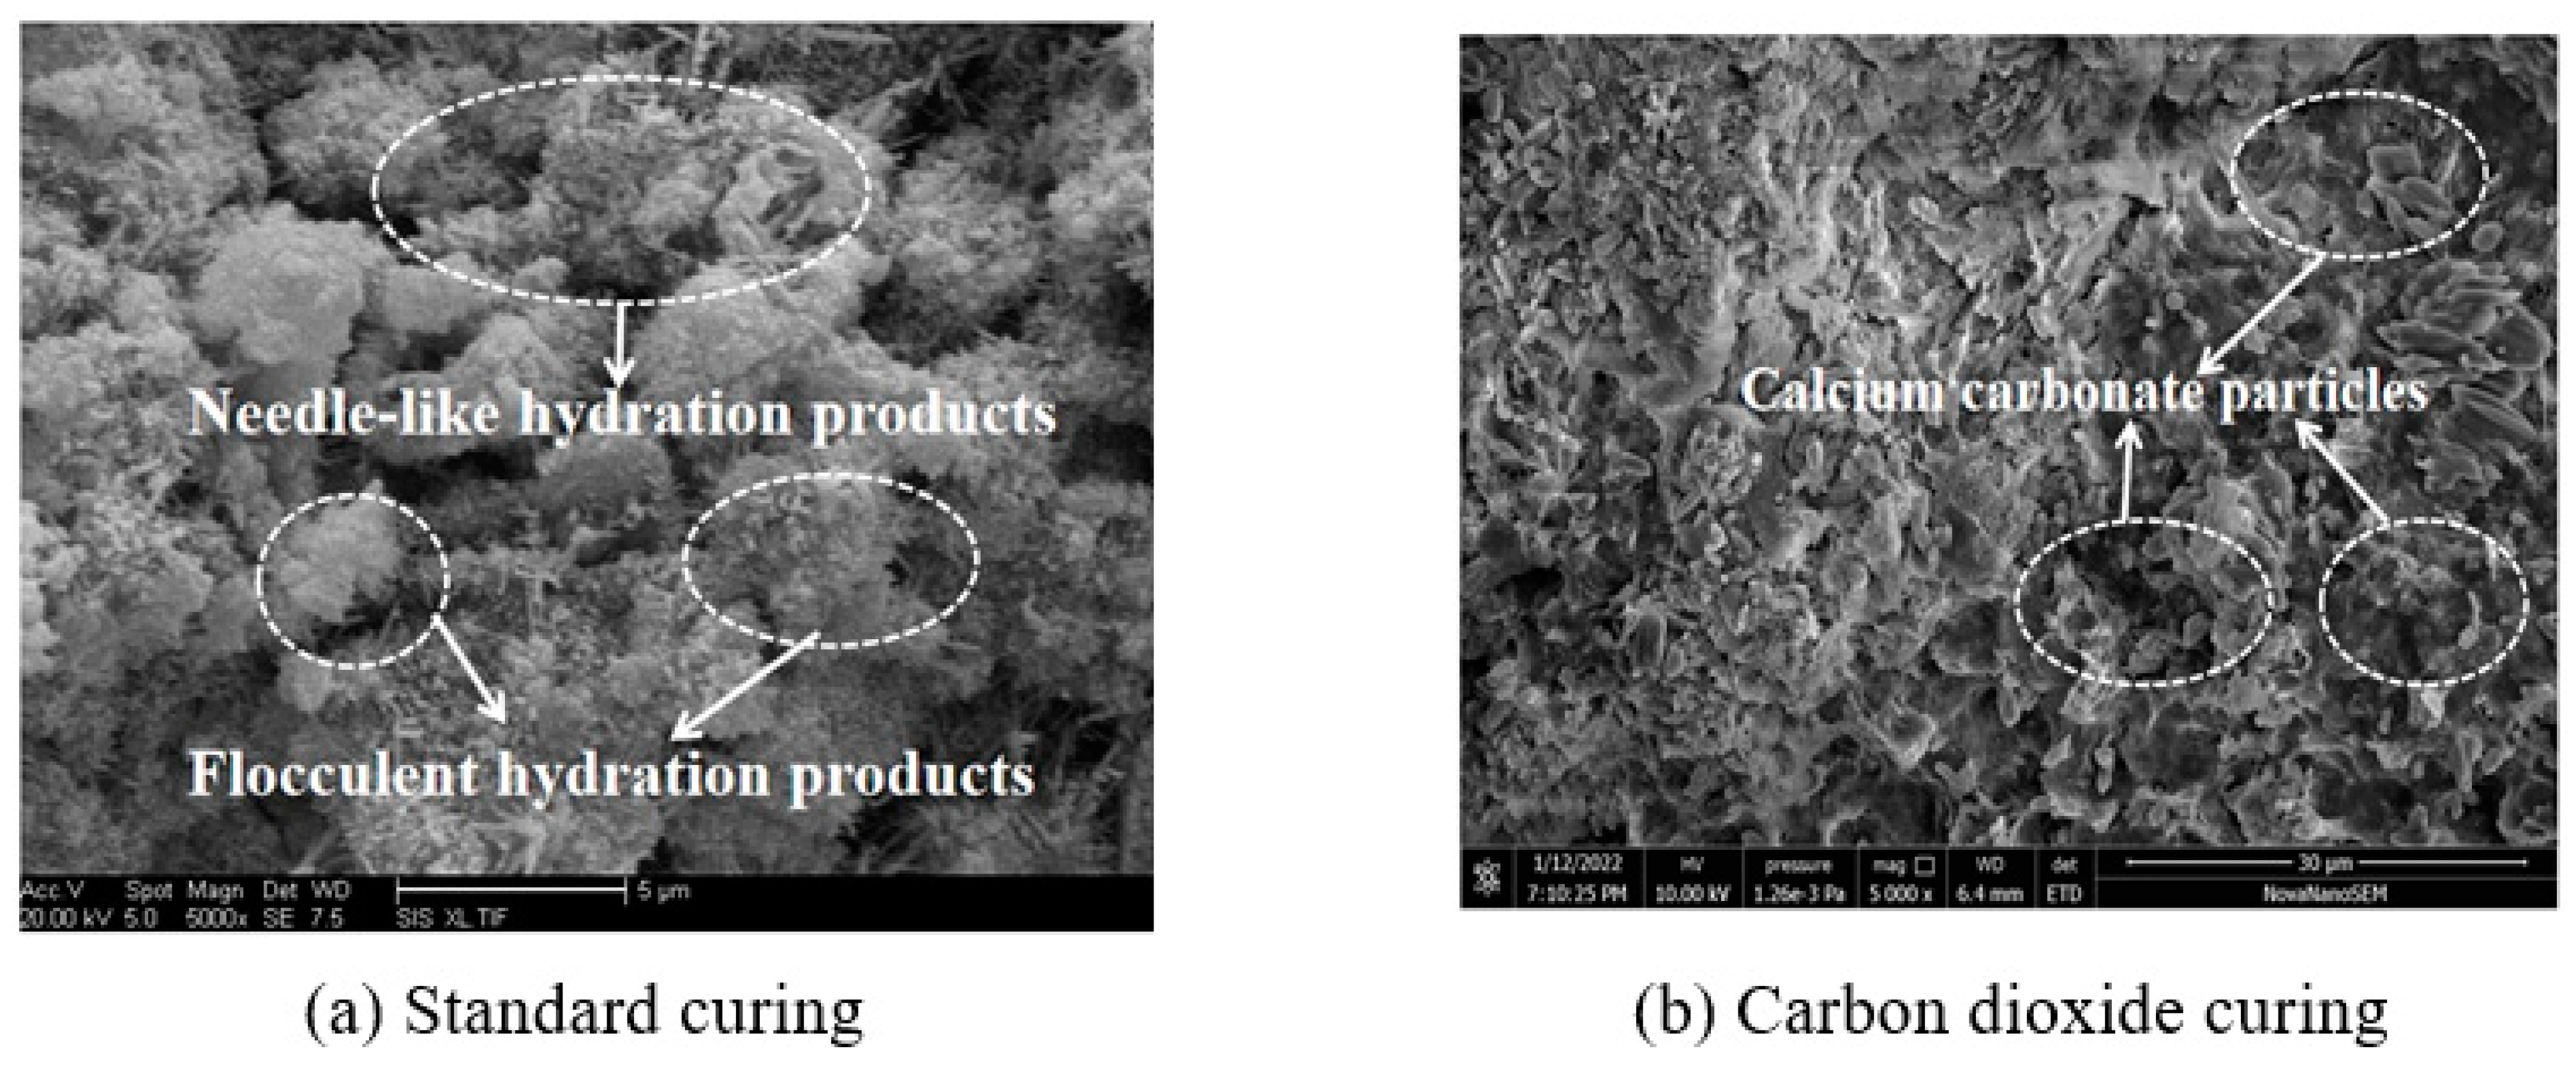
Figure 11 shows the SEM photos of blank RPC cured in standard curing environment and carbon dioxide curing environment for 28 days. As shown in
Figure 11, the microstructure of blank RPC after standard curing mainly comprised of needlelike and flocculent hydration products. After carbonation curing, RPC exhibited remarkable differences in the microstructure. Specifically, the needlelike structures almost vanished, and the small particles deposited on the cement matrix were belonging to the formation of calcium carbonate particles. Since the carbon dioxide reacts with calcium hydroxide in concrete to form calcium carbonate when the specimens were cured in carbon dioxide environment, the formation and growth of calcium carbonate will result in forming dense structures inside the concrete [
1,
2]. Therefore, the pore structure was modified after carbonation curing. This phenomenon reflects that the RPC cured in carbon dioxide will exhibit a more compact microstructure and higher mechanical strength.
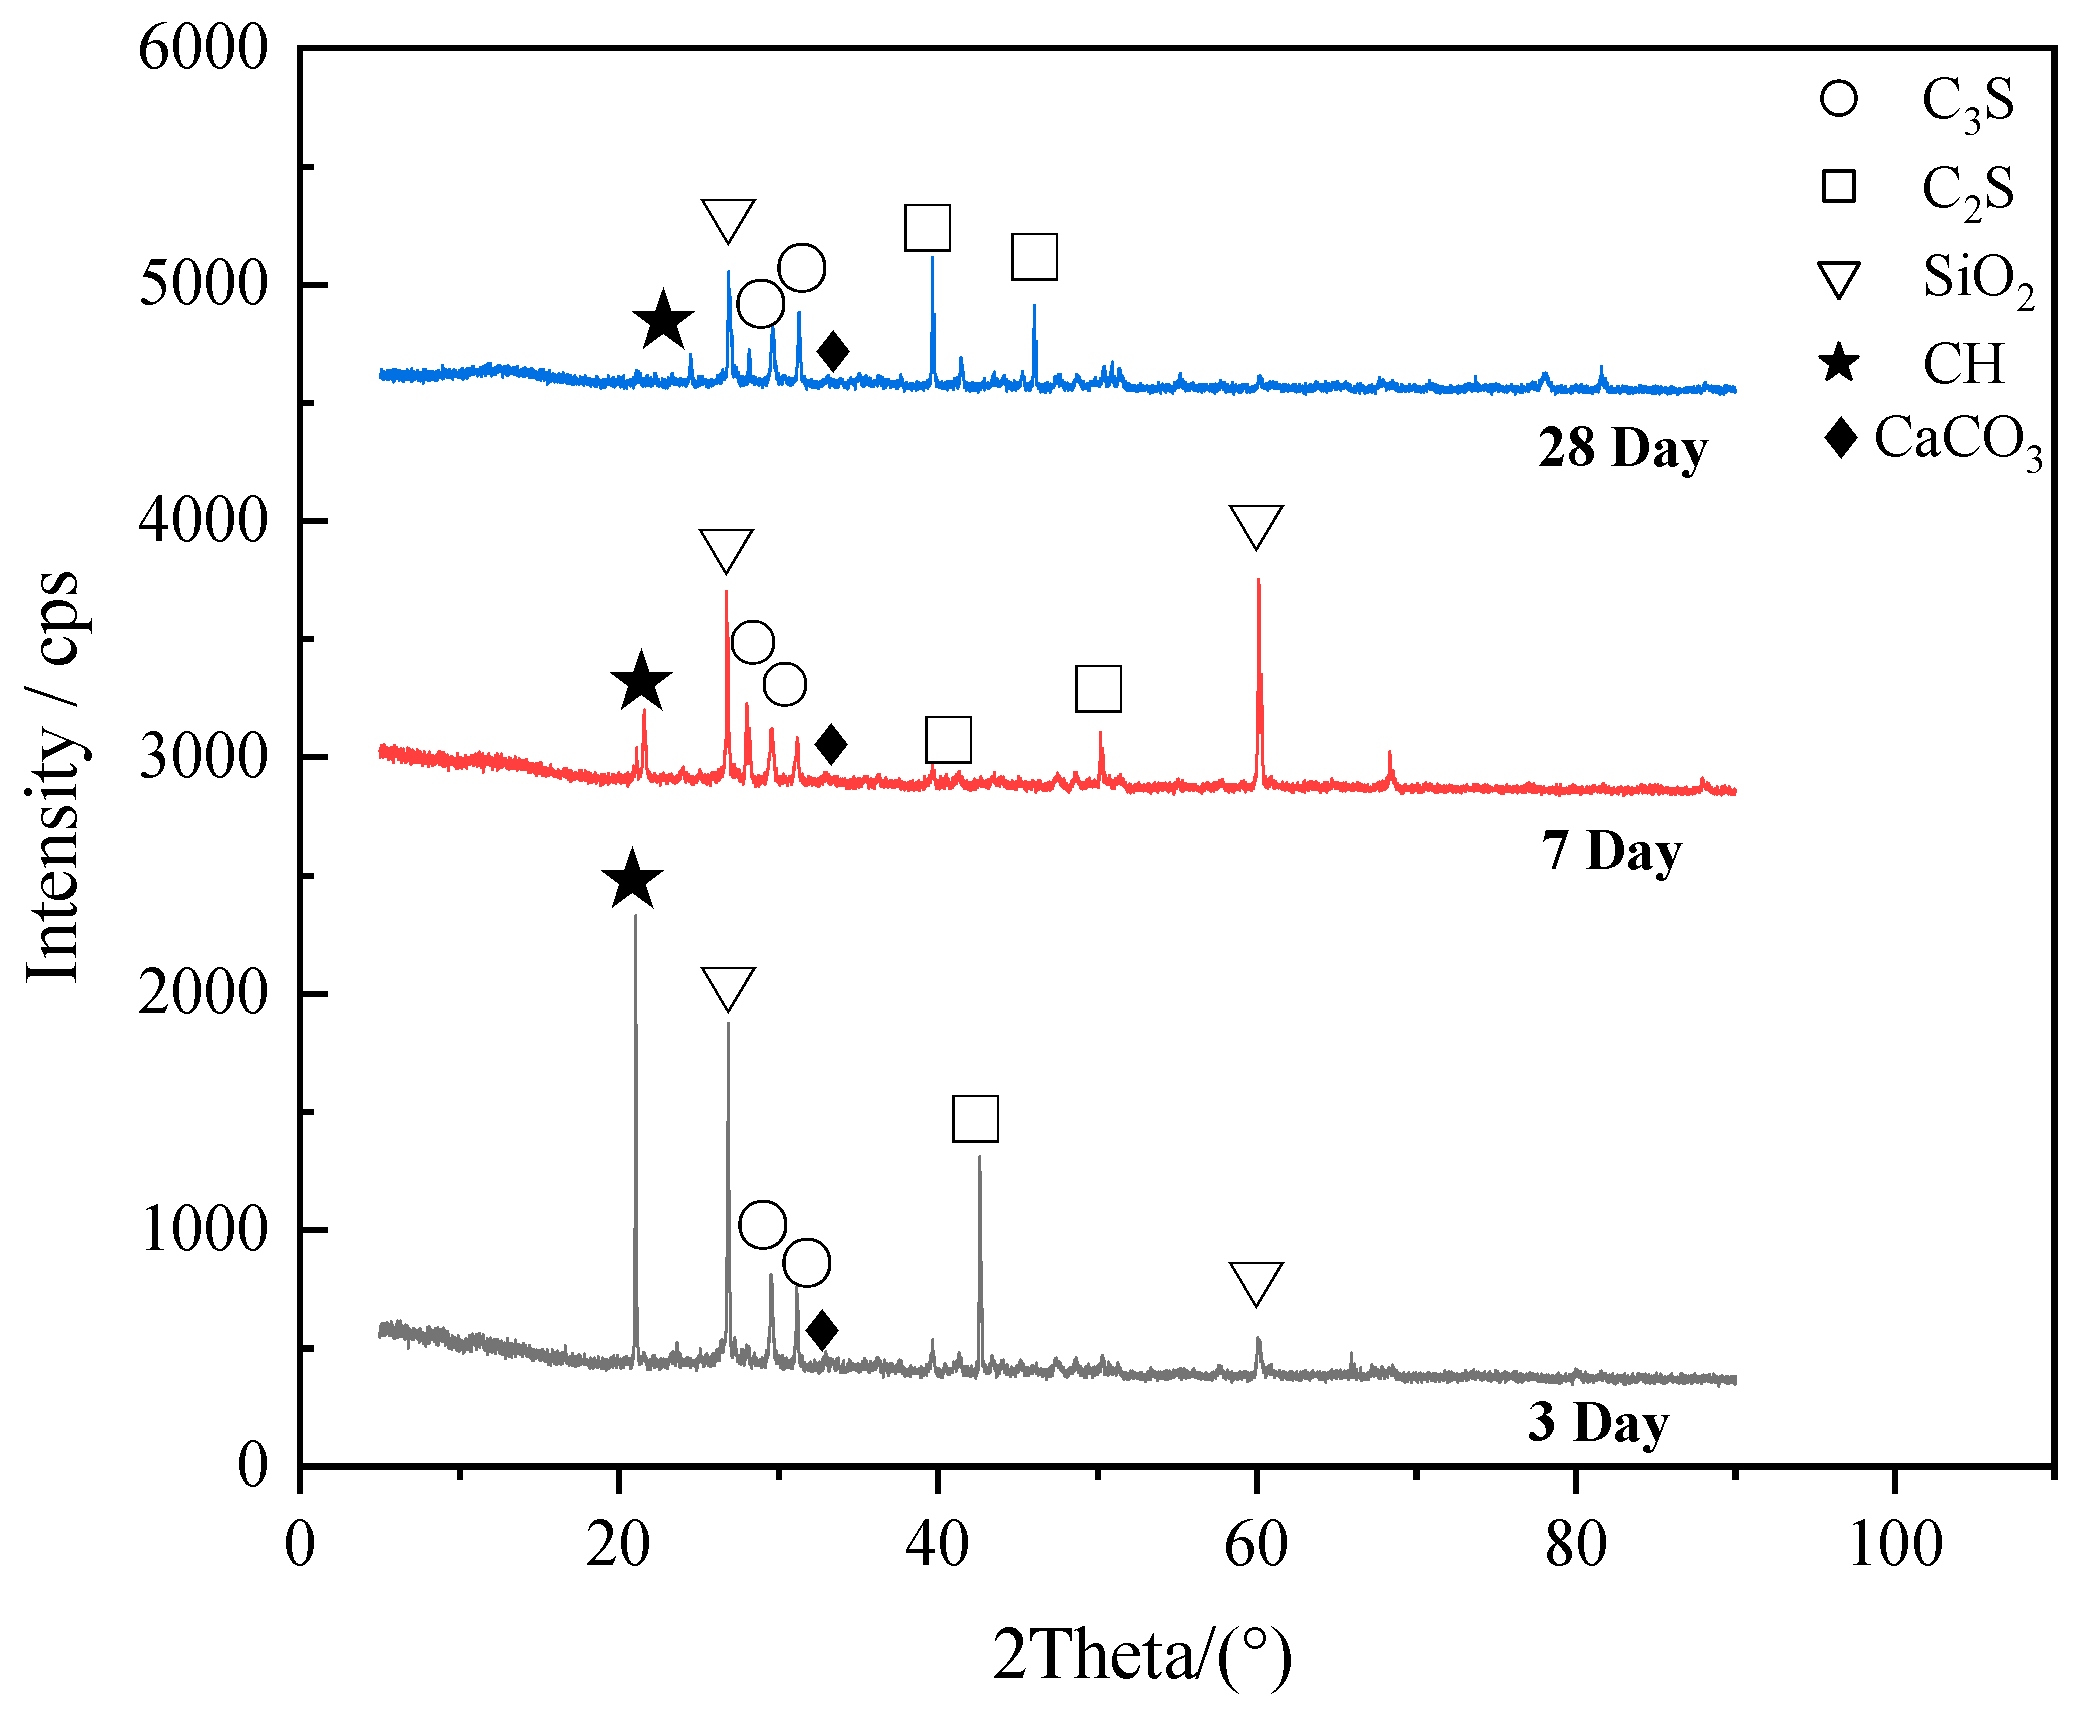
The X-ray diffraction (XRD) pattern photos of blank RPC specimens cured in carbon dioxide for 1 day, 3 days and 28 days respectively were shown in
Figure 12. As shown in
Figure 12, the diffraction peaks of 3CaO·SiO
2 (C
3S), 2CaO·SiO
2 (C
2S), cristobalite (SiO
2), Ca(OH)
2(CH) and CaCO
3 can be found in the curves. When the carbon dioxide curing time increased from 1 day to 3 days, the diffraction peaks Ca(OH)
2 decreased obviously due to the fact that the carbon dioxide reacted with the inner Ca(OH)
2 of RPC and then CaCO
3 formed [
11]. This confirmed the result that when the carbon dioxide curing time increased from 1 day to 3 days, the strength of RPC increased rapidly. However, when the carbon dioxide curing time increased from 3 days to 28 days, small decline occurred to the diffraction peaks height of Ca(OH)
2 due to the fact that most carbonization of RPC accomplished within 3 days. Therefore, the mechanical strength of RPC increased slowly when the carbon dioxide curing time increased from 3 days to 28 days.


