Article

Surface and Tribological Properties of Oxide Films on Aluminium Alloy through Fly-Ash Reinforcement

by
Noor Ayuma Mat Tahir
1,
Shahira Liza
1,*,
Kanao Fukuda
1,
Syazwani Mohamad
1,
Mohd Zakir Fathi Hashimi
1,
Mohd Saifulnizam Mohd Yunus
1,
Yazid Yaakob
2 and
Intan Sharhida Othman
3
1
Tribology and Precision Machining i-Kohza (TriPreM), Mechanical Precision Engineering Department, Malaysia-Japan International Institute of Technology (MJIIT), Universiti Teknologi Malaysia, Kuala Lumpur 54100, Malaysia
2
Department of Physics, Faculty of Science, University of Putra Malaysia, Serdang 43400, Malaysia
3
Advanced Manufacturing Centre, Faculty of Manufacturing Engineering, Technical University of Malaysia of Malacca (UTeM), Hang Tuah Jaya, Durian Tunggal 76100, Malaysia
*
Author to whom correspondence should be addressed.
Coatings 2022, 12(2), 256; https://doi.org/10.3390/coatings12020256
Submission received: 18 December 2021 / Revised: 4 February 2022 / Accepted: 10 February 2022 / Published: 15 February 2022
(This article belongs to the Special Issue Advanced Surface Treatments for Wear Resistance)

Abstract

:
Hard anodizing has proven to be a helpful surface treatment for aluminium alloy and typically accompanied by the growth of a porous and highly flawed oxide layer. The presence of pores on the oxide surface can be taken as an advantage in improving the surface properties. Fly-ash particles are high in SiO2 and Al2O3 content and can be utilized as inexpensive strengthening particles, which can increase the wear resistance and microhardness of composite material. It was noticed that limited research had been carried out in utilizing fly-ash as reinforcement on composite oxide coating as a wear resistance candidate. Thus, this study focused on reinforcing fly-ash on oxide coating and investigating its tribological performance. The composite oxide coating was grown on AA2017 aluminium alloy through anodizing process. To understand the effect of anodizing time and fly-ash content, the parameters were varied from 5–60 min and 0–50 g/L, respectively. The findings suggested that 60 min of anodizing time provides the highest thickness and surface roughness at 35 µm and 6.5 µm, respectively. Interestingly, composite oxide coating with 50 g/L fly-ash provides the highest coating thickness but has the lowest roughness at 52 μm and 8.2 μm, respectively. The composite oxide coatings are observed to reduce friction only for a limited time, despite their potential in significantly reducing the wear rate. The wear mechanism observed was adhesion, micro-crack, and delamination. The findings of this study are believed to provide insight on the potential of fly-ash to be a reinforcement for wear-reduction materials.

1. Introduction

The service conditions in industries keep on expanding and have particular demands nowadays. For most industries, the corrosion protection system needs to perform at relatively high temperatures and protect the components against chemical substances such as water, fuel, hydraulic fluid, lubricant, coolant, and others besides acting as a physical barrier to prevent galvanic coupling and corrosion. Regardless, the protection system needs to retain its performance for an extended period. Besides corrosion, working components are also susceptible to other failure factors such as fretting. Fretting fatigue is a failure phenomenon due to cyclic loading and sliding of a contacted part simultaneously. Fretting fatigue could lead to decreasing components’ life cycle drastically. In one study, it was explained that fretting causes a reduction of life cycles of components through prematurely initiating the crack formation and propagation within the contact area [1].
A standard corrosion protection system such as anodizing comprises a multilayered system consisting of a porous oxide and reinforcement layer (topcoat). The illustration of a typical corrosion protection system is shown in Figure 1. Clad metal substrates are sometimes utilized to improve the corrosion protection mechanism, with the clad layer functioning as a sacrificial anode [2]. Anodizing is widely used in the manufacturing process as a surface-modification technique, particularly for aluminium alloys, not only to reduce corrosion but also to improve surface properties by increasing the hardness and wear-resistance [3] and allowing postprocesses improvement for aesthetic purposes (decoration) [4]. Anodizing can be divided into Type I—chromic acid anodizing, Type II—sulphuric acid (color) anodizing, and Type III—hard (hard coat) anodizing. Other less common types are phosphoric acid, and titanium anodize. Hard anodizing provides better abrasion resistance and mechanical performance of the oxide layer, almost a prerequisite in advanced structural applications such as military, aviation, transportation, machinery, and others [4]. Due to the flexibility and relatively low cost of the process, there are many endeavours in accentuating this process, such as adding reinforcement, modification of the process (two-stage anodizing), and manipulating current feed (pulse) [3,4,5]. These modifications allow surface characteristics changes such as surface roughness, hardness, and enhance the corrosion resistance performance.
Similar to anodizing, plasma electrolytic oxidation (PEO), also known as micro-arc oxidation, was also used to produce a hard coating [6,7,8,9]. The difference between these processes with anodizing is that PEO employs an exceptionally high voltage, with some studies reaching up to 1000 V. However, this process able to produce a thick oxide layer for a short time. Despite the impressive short fabrication time, there are some problems in this process that need improvement, as it associates with high temperature due to rapid ion movement during the process. Thus, complex temperature monitoring and controlling processes are needed compared to anodizing.
Hard anodized films are frequently used in a sliding system that protects the component against low-stress abrasion in mechanical components. This is despite the superior mechanical properties shown by aluminium alloys, such as low cost, lightweight, and high reliability. In addition, not all aluminium alloys accept hard anodize films equally well. Hard anodize coatings on alloys such as 2XXX, 6XXX, and 7XXX series with high copper or silicon content tend to be porous and soft [1,4]. From previous research conducted, the major challenge encountered during the anodizing process is achieving aluminium alloy heterogeneity, especially for heat-treated alloys. Increasing defects due to intermetallic elements affect the coating properties, which eventually increases the risk of failure [10]. The difference in current distribution between the alloy matrix and the intermetallic element also invites critical flaws such as uneven growth of oxide layer, which sometimes entrap unoxidized metal particles inside the coating [11]. Other issues have been reported that are connected to intermetallic precipitates in locations that promote the oxygen evolution process, a parasitic reaction that reduces the faradic effectiveness of the treatment, and deterioration of the interfacial adhesion of the oxide layer [10,12,13].
In tribology applications, it has been reported that a hard, compact oxide is able to decrease the coefficient of friction (due to reduction of contact area), wear rate (due to high hardness), and increase the tribo-corrosive performance [3,14,15]. Despite the promising potential shown as a friction- and wear-reduction solution, there are limitations of anodizing processes, such as high surface roughness due to the formation of the pores. To solve this problem, previous researchers introduced reinforcing agents such as polytetrafluoroethylene (PTFE), graphite, and reduced graphene oxide (rGO) nanoparticles on the oxide growth surface [3,16,17,18,19]. Hard particles that are mainly made up of nonmetal components and traditional ceramic materials such as SiC, TiO2, and Al2O3 also have been recorded to enhance properties, including hardness, lubrication, antiwear, and corrosion resistance [20,21,22].
Incorporating different reinforcing particles to the base electrolyte offers the opportunity to form their corresponding oxides in the film to develop multifunctional properties. However, the expensive cost of these ceramic particles has limited their widespread application. As an alternative, lower-cost or recycled reinforcement materials should be employed to reduce the price of composite films. The usage of waste materials such as fly-ash, which is the fine residue derived from the combustion process of coal in an electrical generating plant as an ideal waste, would be priceless waste while at the same time assisting in minimizing pollution. Fly-ash has the potential as ceramic reinforcement, where the previous study was able to highlight the improvement of mechanical, tribological, and corrosion properties of composite reinforcing fly-ash [23,24,25,26,27].
It has been recorded that silicon-carbide-reinforced fly-ash is able to increase the microhardness of the base alloy (AA7075) up to 241.10 HV with 12 vol.% of fly-ash reinforcement. The increase of hardness was believed to be due to the load-bearing capacities of the composite, which increased as the fly-ash content increased. From the ANOVA analysis presented, the authors highlighted that vol.% is the most effective way to increase the composites’ microhardness. In addition, their ANOVA analysis also indicates that the interaction between vol.% and hybrid ratios between the elements had the most significant effect on the microhardness [27].
It has been proven that reinforcement of fly-ash particles in aluminium composite is able to reduce the bulk density without compromising the hardness and strength of the matrix material. A previous study shows that overall bulk density of AA6063 reinforced with fly-ash decreased as the fly-ash content increased. This was believed due to the density of fly-ash being lower than AA6063. Interestingly, despite the increase in porosity in the composite structure, the compressive strength is significantly increased. This was explained by other research that it might be due to the strain-hardening effects from matrix alloy and mixture rule of composites strengthening [28].
Therefore, fly-ash particles have tremendous potential to be utilized as inexpensive and easily obtainable particles that can improve surface properties, microhardness, and reduce the density of a composite material. Even though numerous researchers are investigating the potentials of composite oxide coating with reinforcing agents, there was a lack of knowledge on fly-ash as composite oxide coating, despite its vast potential, such as durability in sliding conditions. In this study, a composite oxide coating containing fly-ash is grown using anodizing method on AA2017-T4 aluminium alloy. This study aims to clarify the film’s growth at different anodizing times and investigate the role of fly-ash as wear-resistant and its durability performance under dry sliding conditions.

2. Materials and Methods

2.1. Materials Preparation

The substrate used in this study was aluminium alloy AA2017-T4 with 25 mm diameter purchased from Misumi Malaysia Sdn. Bhd. The substrate was cut 4 mm thick and drilled with a 4 mm hole. The 25 mm diameter × 4 mm aluminium alloy was then ground using 120 to 2000 grits silicon carbide (SiC) paper and 4000 grits diamond paper. Then, the substrate was polished using 6 µm to 1 µm diamond paste to achieve a mirror surface finished with acceptable surface roughness, Ra ≤0.08 µm. The substrate was then cleaned using an ultrasonic bath for 10 min and rinsed with deionized water. The chemical composition and mechanical strength of the AA2017 alloy are shown in Table 1 and Table 2, respectively.
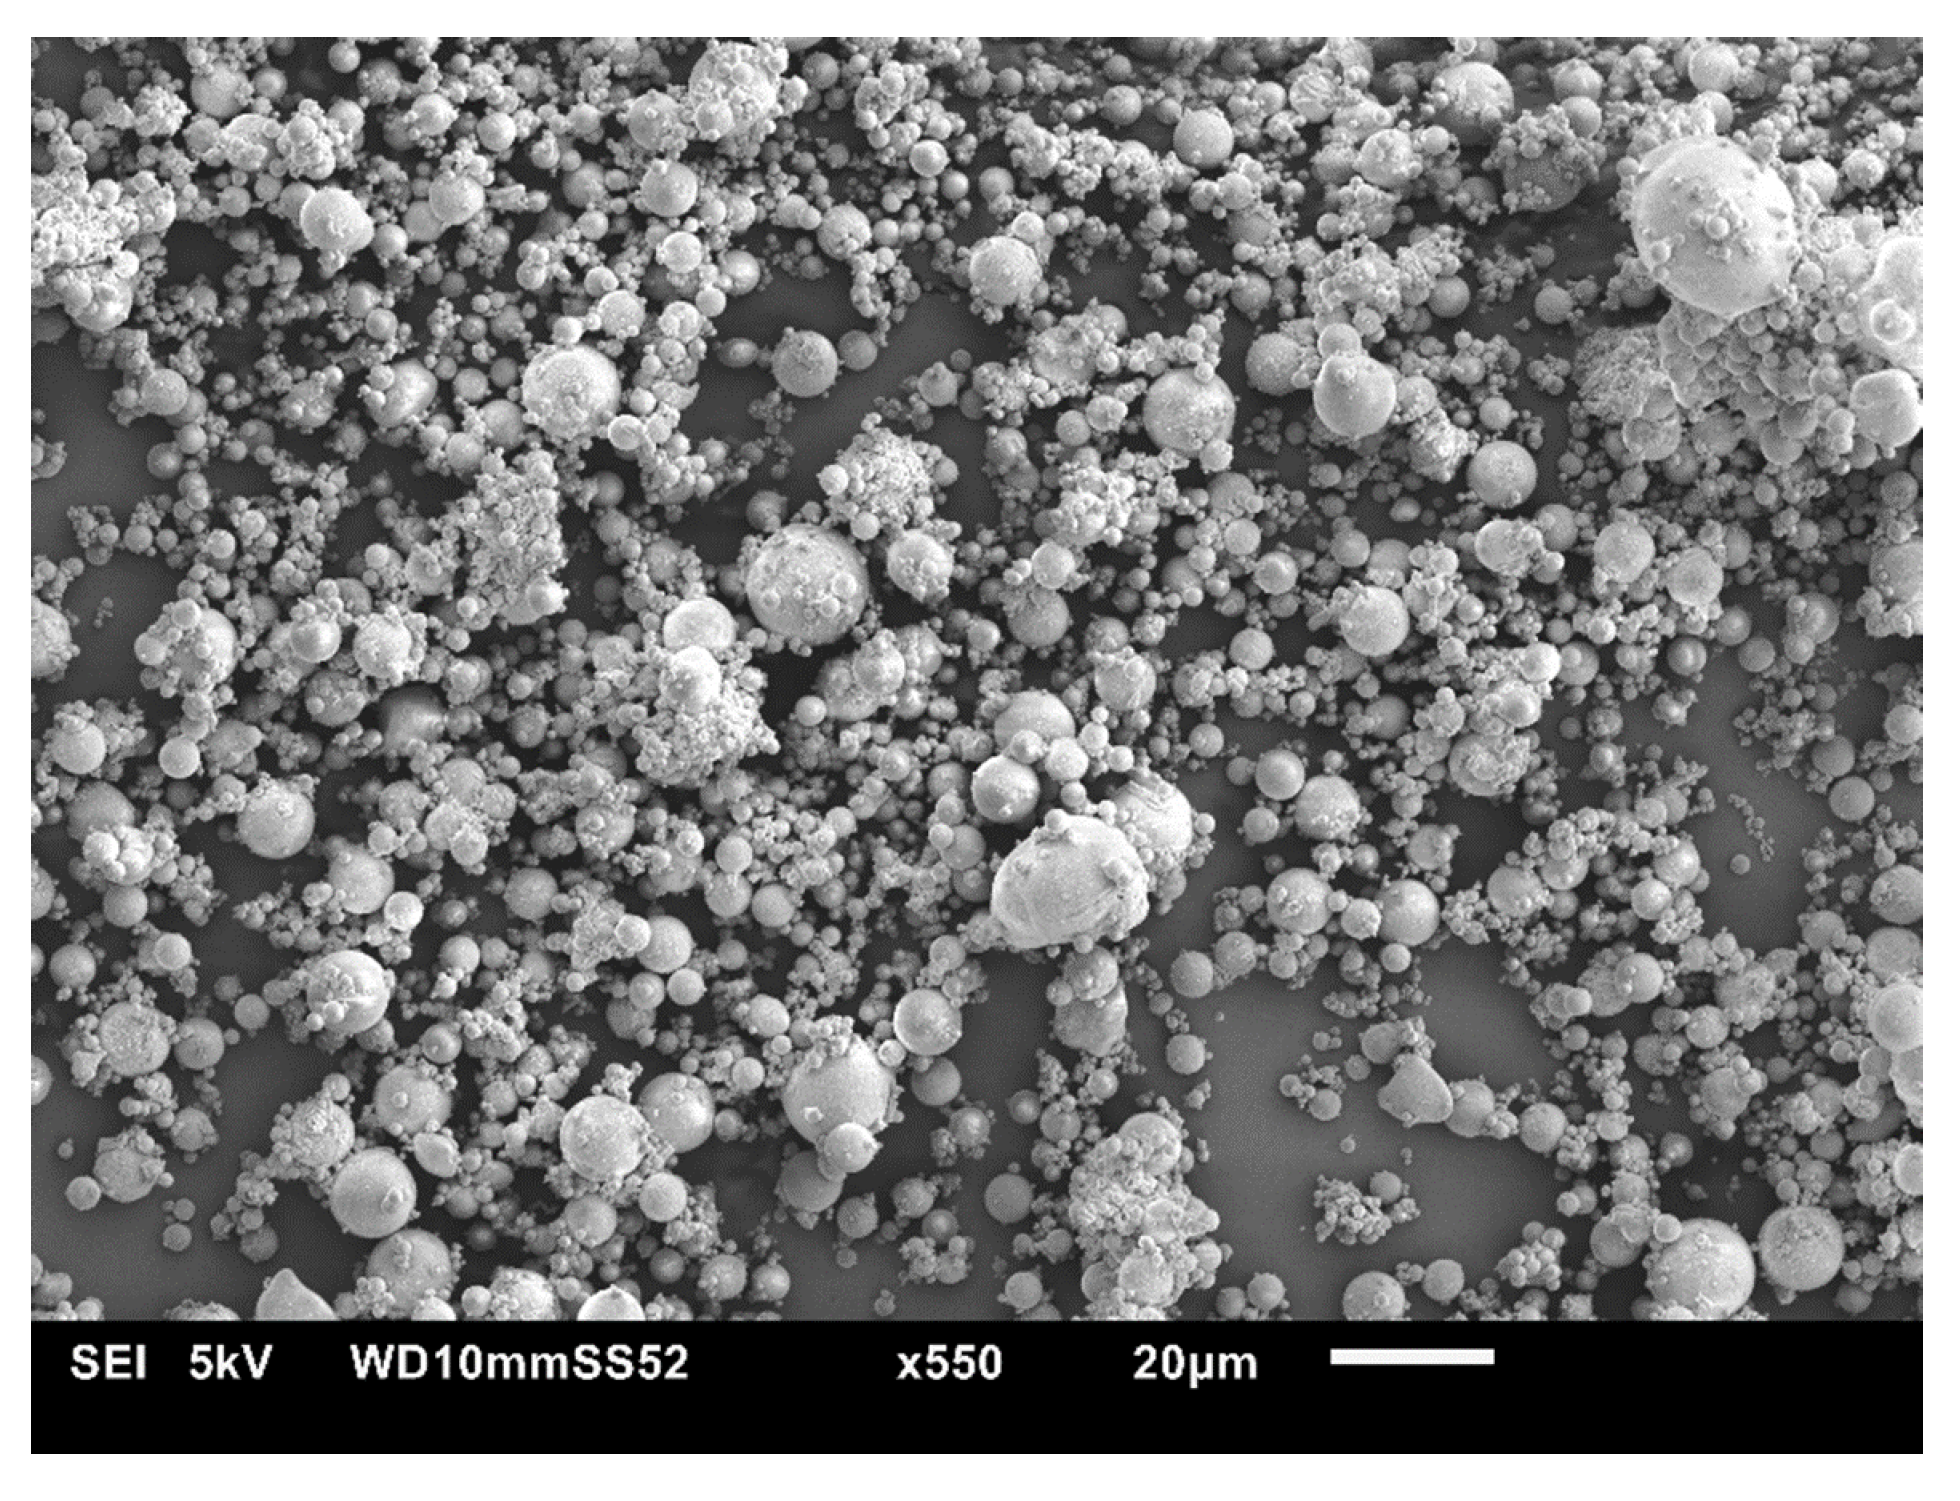
The fly-ash (reinforcement) used in this study was obtained from YTL Sdn. Bhd (M)–Manjung Power Plant (Perak, Malaysia). Since the fly-ash obtained was in powdered form, the fly-ash was pressed on carbon tape first before being analysed using Energy Dispersive X-ray Spectroscopy (EDX, Oxford Instruments NanoAnalysis Plc., Abingdon, UK) The chemical composition of fly-ash used is shown in Table 3. The Scanning Electron Microscope (SEM, JEOL Ltd., Tokyo, Japan) image of as-received fly-ash powder is shown in Figure 2. Several batches of SEM images of the fly-ash were taken. By using free software “imageJ”, the SEM image was analysed. From the analysis, the maximum fly-ash particulate size was 24 ± 3 μm. Fly-ash particulates were mixed into 20 mL/L of ethanol and stirred by a magnetic stirrer for 20 min to ensure that all the flakes were well drenched and dispersed in the electrolytic solution before being used in the anodizing process.

2.2. Hard Anodizing Process

The hard anodizing was performed using a direct current (DC) power supply (TNI-UTM, Saharoongroj Co., Ltd., Bangkok, Thailand). As the electrolyte, 20 wt.% diluted sulphuric acid (H2SO4) was used; meanwhile, 30 mm × 60 mm copper plate was used as the cathode. The hard anodizing process was carried out at a constant current density of 15 A/dm2 and fluctuant voltage at ± 15 V. The initial temperature of the electrolyte was kept at the ambient condition (24 °C of temperature and 55% of relative humidity). A magnetic stirrer was used to maintain uniform ion concentration and reduce the localized heat build. Besides that, the electrolyte temperature changes were measured using an IR-750 infrared thermometer. The schematic diagram of the anodizing setup process is shown in Figure 3. The formation fabrication and analysis were divided into Phase 1 and Phase 2, as shown in Table 4. The fly-ash content was maximized to 50 g/L due to its natural behaviour, which compromised the viscosity and dispersion of the electrolyte. Lastly, anodized samples were dried in ambient conditions before being analysed.

2.3. Hard Oxide Coating Characterization

The surface morphology and elemental compositions of the coated aluminium samples were examined by using scanning electron microscopy (SEM) JSM-6010PLUS/LA (JEOL Ltd., Tokyo, Japan) equipped with energy-dispersive spectroscopy X-ray (EDX) (Oxford Instruments NanoAnalysis Plc., Abingdon, UK). The thickness of the hard oxide coating was measured through the cross-sectional area of the sample through the image taken by using SEM. The sample was cut using a precision saw then broken to eliminate shear on the coating area. The hardness of oxide coating was evaluated by using microhardness tester HMV-Micro Vickers Hardness (Shimadzu Corporation, Kyoto, Japan) at 245.2 mN loading and 10 s duration following the ASTM E384–Standard Test Method for Micro-indentation Hardness of Materials. The surface topography such as surface roughness was analysed using 3D optical profiler ZeGage™ (ZYGO Corporation and Ultra Precision Technology Division of AMETEK Inc., Wallingford, CT, USA). Ra is the most common surface roughness used to measure a flat surface. Ra is the arithmetical mean deviation of the assessed profile.
The samples tribological characterization was evaluated using a ball-on-disk sliding tester by referring to ASTM G99 with an applied load of 1 N and a speed of 30 rpm under dry-sliding conditions. The oxide coating on AA2017 alloy acted as a disk and a silicon nitride (Si3N4) ball with a diameter of 8 mm was the counterpart. The wear track was set to be 20 mm diameter and for 1800 rotations. The coefficient of friction (COF) was recorded continuously against sliding time. Meanwhile, the wear rate (k) was calculated based on Archard’s equation, where the total wear volume (mm3) was divided against the applied load (N) and sliding distance (m). Since the wear volume is too small to be measured using an analytical balance, a 3D optical profiler was used to determine the worn area and then calculated into wear volume. The element transfer of the tribo-film and self-lubricating mechanism was determined using SEM and EDX.

3. Results and Discussion

3.1. Effect of Anodizing Time

3.1.1. The effect of Anodizing Time on Voltage Behaviour and Growth Mechanism

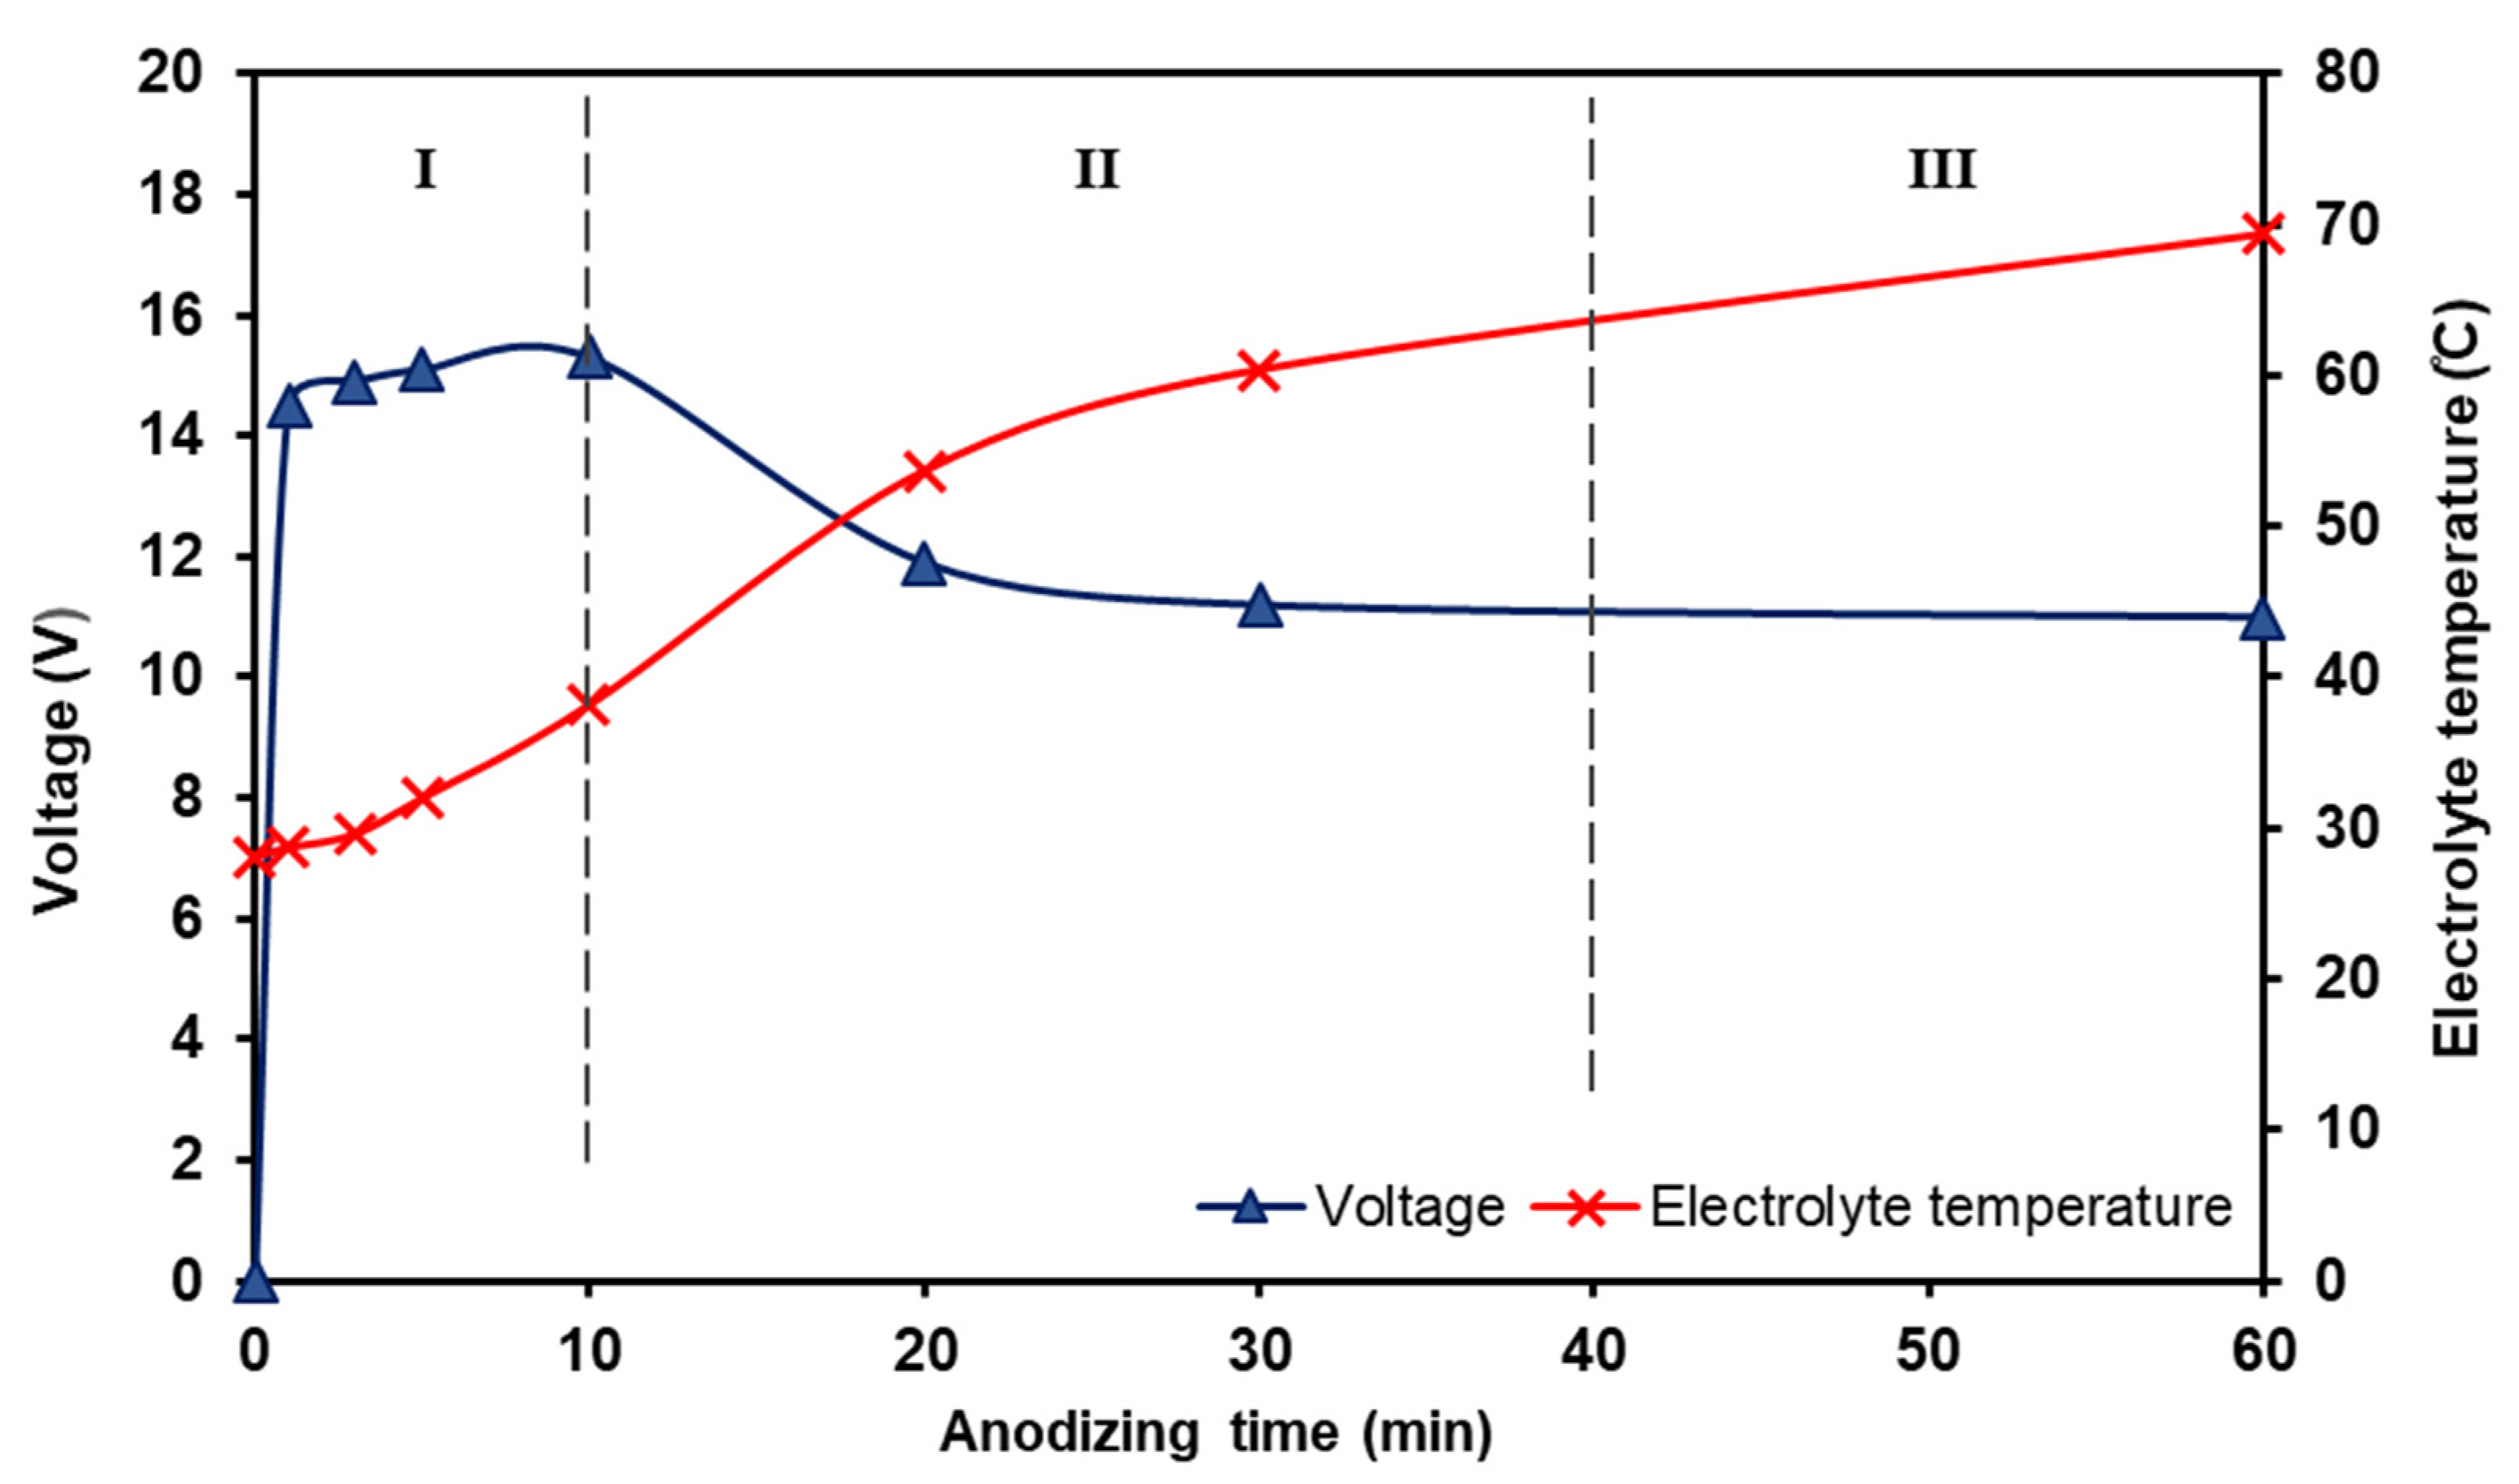
The effect of voltage behaviour on anodizing time is presented in Figure 4. The anodizing process was fixed at a current density of 15 A/dm2 with 20 wt.% of diluted H2SO4. The initial temperature for the process was 24.2 °C. In the beginning, the voltage and temperature showed a slight increase pattern as the time increased. However, when it passed 5 min, the temperature started to increase rapidly. At 10 min, it can be seen that the temperature kept increasing at the same rate. Interestingly at this point, the voltage started to decrease. Regardless, approaching the 60 min mark, the temperature kept rising while the voltage kept decreasing with 70 °C and 9.8 V for temperature and voltage recorded, respectively. The increase in temperature can be attributed to the increase in the extent of the ionization process. With the rise in the electrolyte temperature, a predominance of a chemical anodic dissolution occurs, promoting the efficiency of anodization, leading to the oxide layer’s formation on the AA2017 alloy surface [3]. Undoubtedly, this highlights the need for a cooling system to maintain the anodizing process below 30 °C. Controlling the anodizing temperature is vital as the increasing temperature leads to decreasing surface hardness and thickness due to the higher dissolving power of the electrolyte [1,29].
It was also found that the addition of reinforcement into the system requires a specific time to homogenize with the electrolyte completely. Accordingly, the addition of graphite in the electrolyte is not fully dispersed during 10 min of anodizing time due to its aggregation behaviour [3]. Based on the analysis in Figure 4, it was deducted that after 10 min of constant 200 rpm stirring process, the fly-ash had fully dispersed throughout the electrolyte due to the voltage decreasing after 10 min. The increase of viscosity also can be seen as one of the contributing factors to the drastic increase in temperature. This is because the closely packed atom of fly-ash allows the heat to be trapped within the system.
The growth mechanisms of the oxide film are illustrated in Figure 5. The presence of fly-ash during the anodizing process causes the entrapment of fly-ash inside the pores and crates. Under constant-current conditions, it was explained that the oxide growth rate is proportional to the applied current density and constant based on the ideal theory of Faraday’s law (as in Phase I) [30]. Despite the fact that, ideally, the potential should be increasing with the thickness of the growing barrier oxide, it is hard to be proven in reality. This is because the evolution of potential deviates as it increases with anodizing time. As the growth time increase, the escape of Al3+ from Al alloy creates more opportunities for oxide growth. The rapid formation of oxide layers creates un-uniformed pore formation due to the simultaneous migration of ions (escape of Al3+ and capture of OH/O2−). Such rapid and spontaneous migration had created growth instabilities which caused entrapment of free O2− between the Aluminium oxides formed (Al2O3) (as shown in Phase II). These instabilities caused a slight increase in resistance which slightly lowered the voltage. The presence of fly-ash particles during the formation of the pores allowed the entrapment of small fly-ash particles inside the pores. In Phase III, the voltage was almost constant throughout the phase due to the saturation of fly-ash presence in oxide layers. The fly-ash started to agglomerate together and fill the pits and pores. Larger pores started to merge and form crates on the oxide film surface.
The diffusion of fly-ash particles into the pores is called self-diffusion [3]. The fly-ash particles undergo self-diffusion during the anodizing process, where they move from a higher concentration region to a lower concentration region near the anode surface. A study by previous researchers discussed that electrical force between anodizing cells attracts the fly-ash particles toward the anode and promotes particle incorporation during solidification [26,27]. This phenomenon is called the electrophoresis effect. Besides that, mechanical entrapment could occur during the anodizing process. There are two possible occurrences during the anodizing process: entrapment during the solidification of the oxide film and entrapment inside the pores during constant film growth. Other researchers had discussed similar mechanisms with different reinforcement agents. They explained that large particles commonly surge into pores and crates on the surface, where smaller particles are entrapped into nanosized pores [3,30,31,32,33].

3.1.2. The Effect of Anodizing Time on Surface Morphology

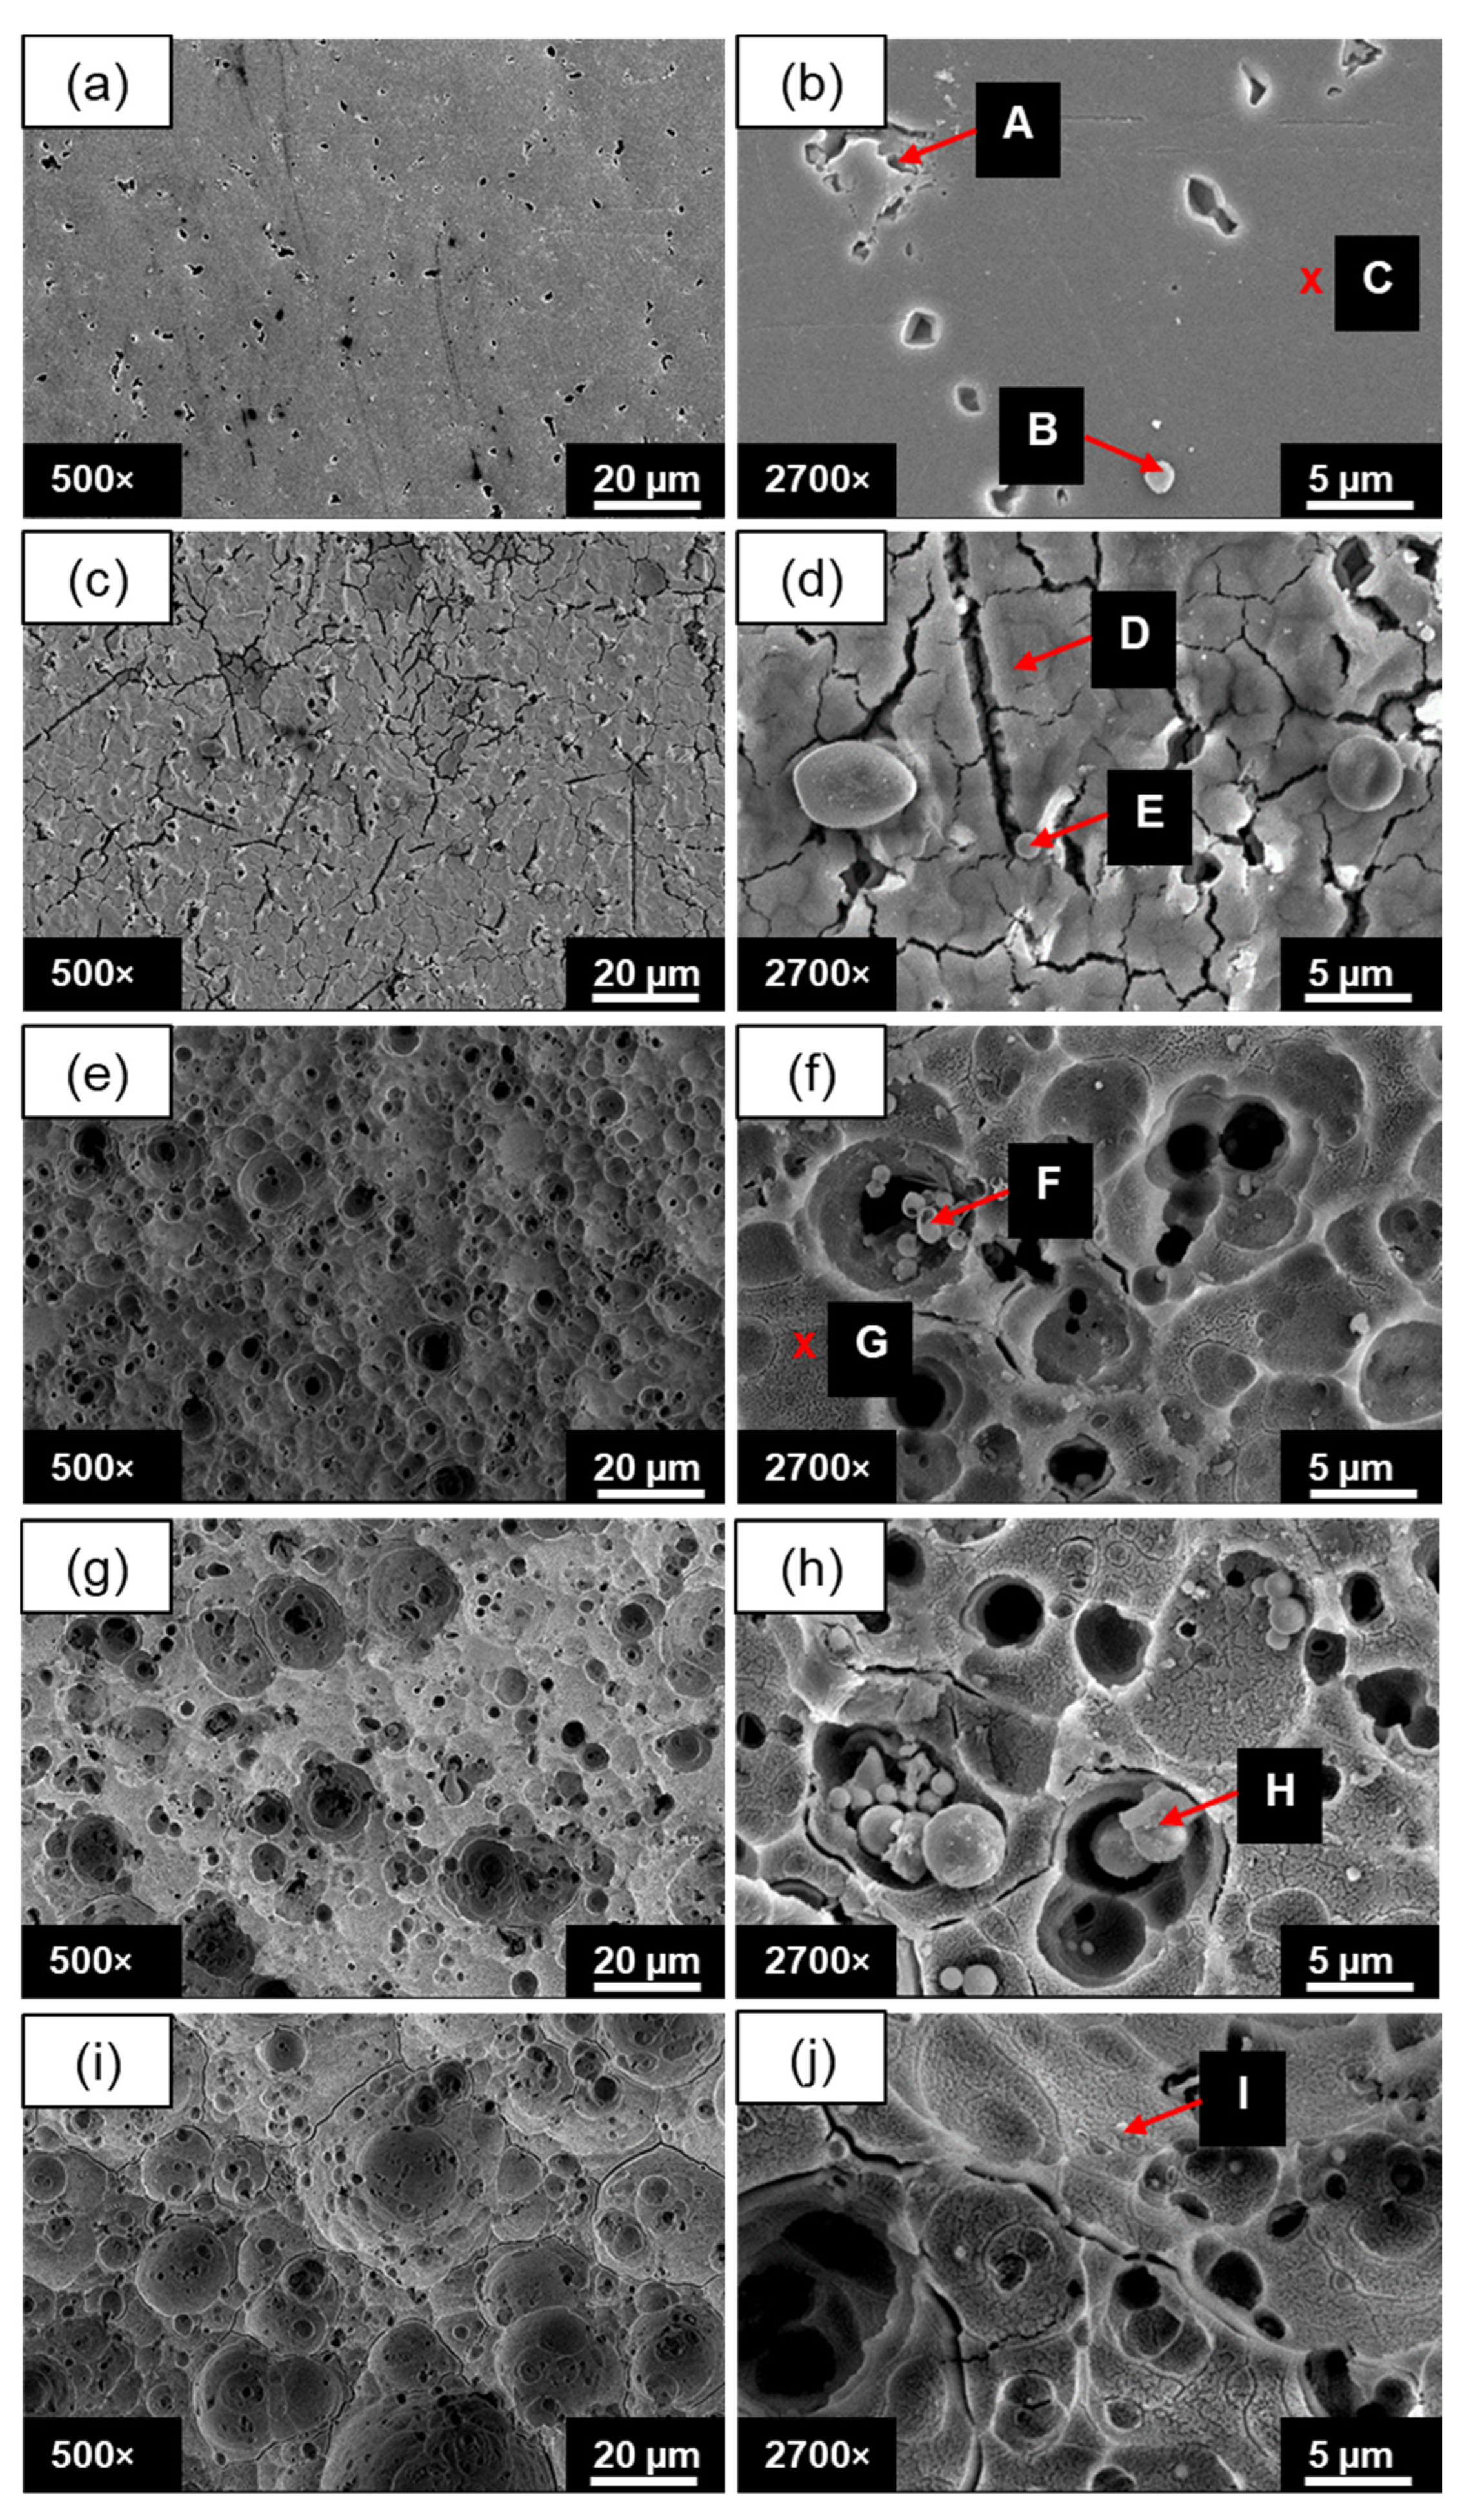
Figure 6 shows the surface morphologies of composite oxide films formed in H2SO4 electrolyte with fly-ash addition. At 5 min, the surface of the Al alloy was not fully covered with a layer of oxide film uniformly, where lots of scratches on the Al alloy surface are visible in Figure 6a,b. At 10 min, the surface of Al alloy started to be covered with a layer of oxide film almost uniformly (Figure 6c). Several micropores are visible. However, many cracks are formed on the surface (Figure 6d). The formation of cracks was believed due to the internal stress on the oxide coating surface. It was reported that internal stress could be referring to the forces created in the layer as a result of the crystallization process and sometimes as a result of co-deposition of heteroatoms [33]. During this process, the surface becomes more brittle and possesses high internal stress. It can be seen that Figure 6e,f show that at 20 min, the oxide layer started to thicken where there was a distinct number of pores visible. The pores were seen to be much more prominent at 30 min. After 60 min, the surface was completely covered with dense composite films. The presence of fly-ash particles in the anodized oxide film were confirmed with chemical composition results, as shown in Table 5.
From Table 5, it can be seen that point A and C shows bare surface of Al sample with no coating formed. The only element found on the surface are Al and O. Points C, E, and G (where the surface was clean with no agglomeration particles) were dominated by the Al element (48.9–50.9%). Point F and H showing agglomeration of sphere particles inside crates and pores were dominated by O, Si, Fe, and a small percentage of Mg element. With proof of this element, it indicates that the fly-ash had penetrated into the oxide pores and agglomerated together, filling the pores. Interestingly, point I shows a small fraction of spherical particles that have been embedded on the surface, with indicators of 65.31% and 27.15% of O and Si elements, respectively. It confirmed that the fly-ash particles had surged into the film. This finding was correlated with earlier research wherein their study, the graphite particles embedded and filled the pores of the oxide layer [3].
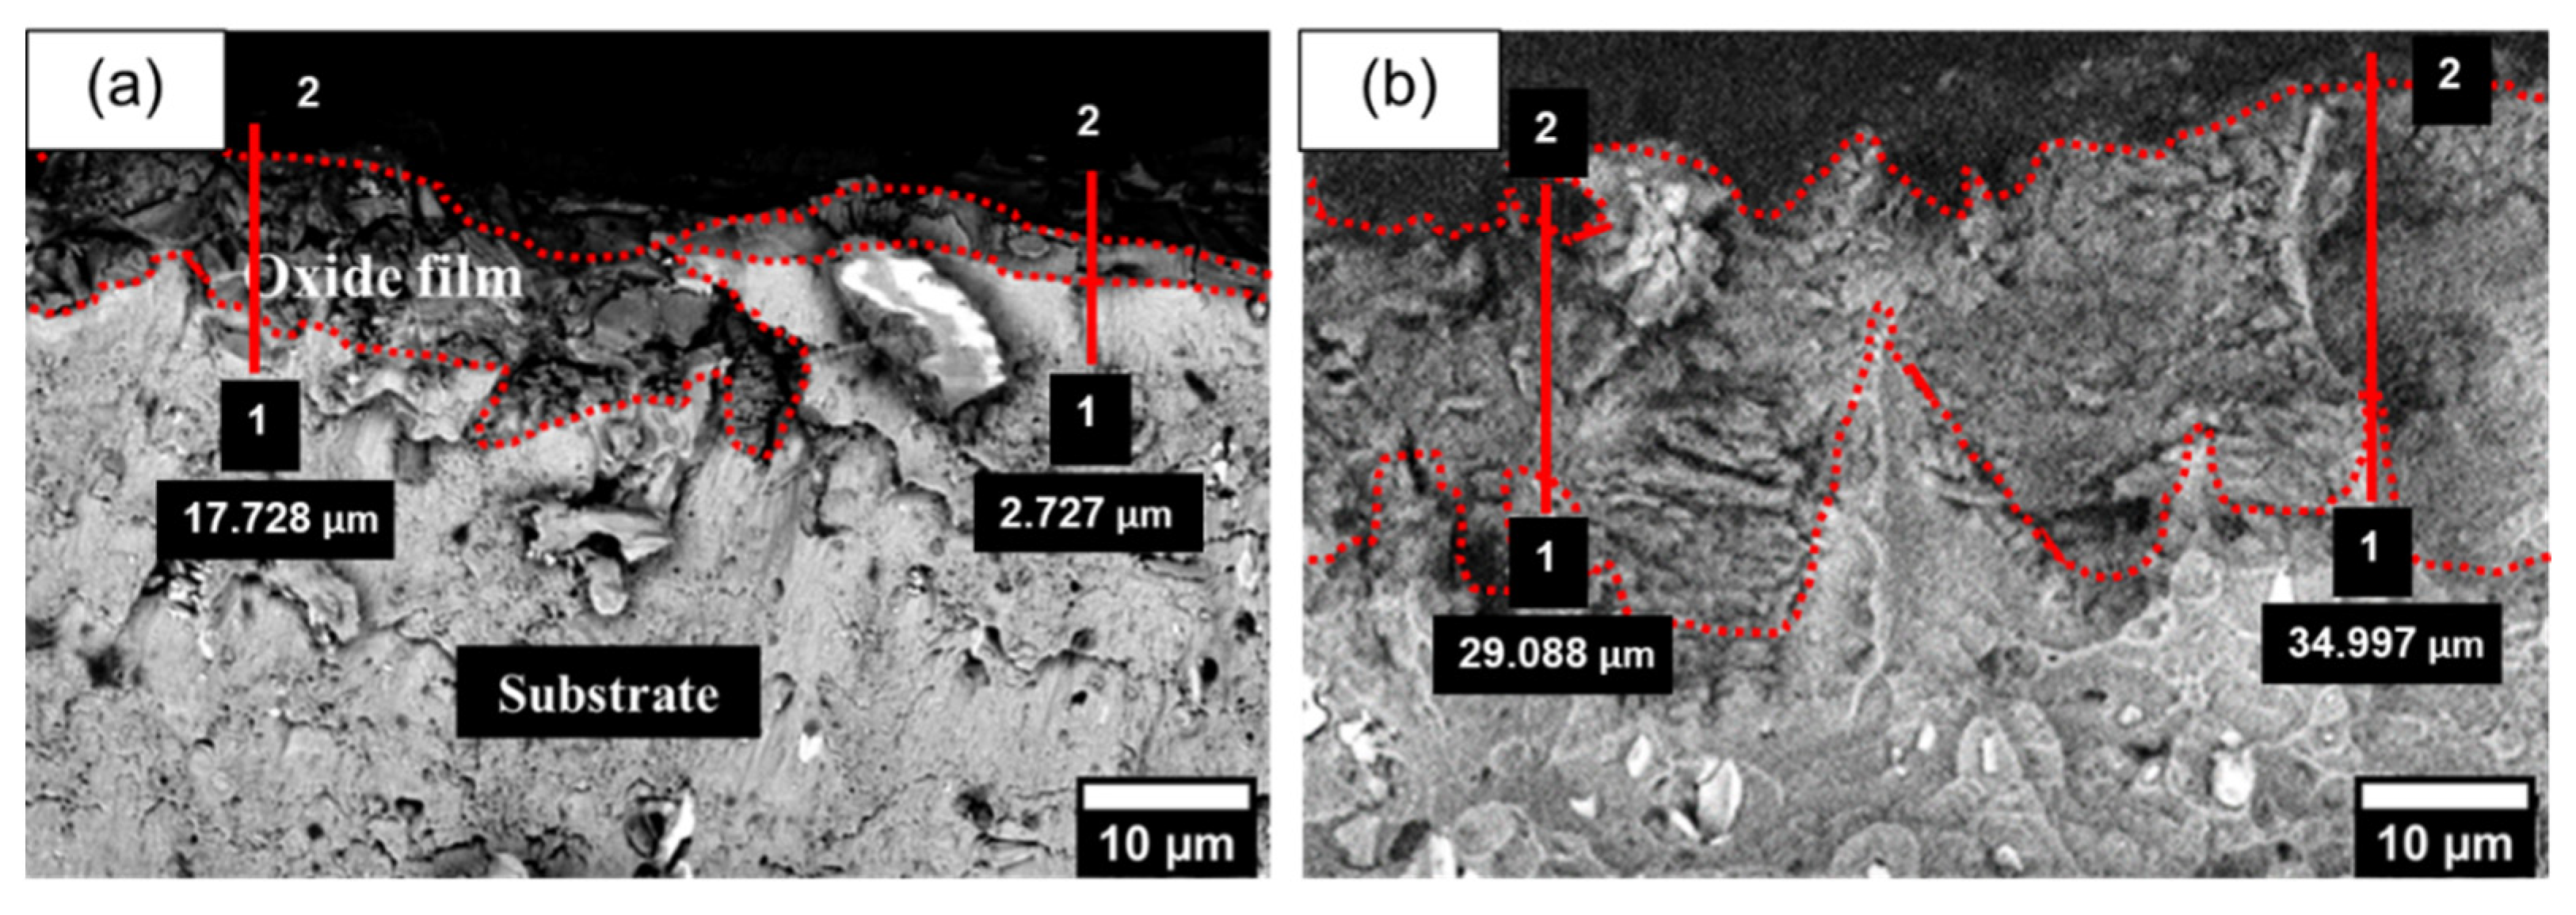
Figure 7 shows the cross section of the anodized Al at 5 min and 60 min of anodizing time. The coating thickness was estimated based on the image’s colour contra and element analysis. The coating thickness for 60 min is between 29–35 µm, higher than 5 min with 3-18 µm. The same findings have been recorded by an earlier researcher where they grew composite oxide coating with the growth rate of 0.54 µm/min, which produced around 32.4 µm of total thickness at 60 min of anodizing process [3].

3.1.3. The Effect of Anodizing Time on Surface Topographies

Figure 8 shows three-dimensional images of composite oxide films reinforced with 30 g/L of fly-ash particles formed at different anodizing times. The profile consists of crests and troughs, which are indicated based on different colour regions arranged from red, orange, yellow, green, to blue. The blue region is the lowest (trough), and the red region is the highest (crest). The as-received aluminium surface is shown in Figure 8a, and the anodized surface is shown in Figure 8b–f. Figure 8b shows the initial stage of anodizing (5 min), where there are many peaks (bums) that can be seen on the aluminium surface, which indicates the oxide layer started to grow. With a longer anodizing time, the growth of the oxide film increased gradually until the 60th min, where the surface was almost filled with a grown oxide layer. Besides the appearance of pores, there were irregular shape marks such as crates are observed on the composite film’s surface.
The surface roughness obtained from the morphological analysis is shown in Figure 9. Overall, the surface roughness of the composite oxide layer increased as the anodizing time increased. The surface roughness of the oxide coating at 60 min reached around ±6.5 µm. At 60 min of anodizing time, the pores formed on the surface started to grow larger, with the average width and the depth of pores being 45.5 and 15.0 µm, respectively. The highest width and depth of the pores for 60 min composite oxide surface were 80.2 and 30.1 µm, respectively. The dimension and number of pores in 60 min composite oxide film are reasonably most significant compared to the other surface, indicating that the anodizing time had played an essential role in impacting the pore dimension of the composite oxide film. The increment of the number of pores and nonuniform oxide film surface had gradually increased the surface roughness at 60 min. This was due to the region on the film surface between the smooth surface with pores and the graphite material as asperities. These findings correlate with previous research where 60 min of anodizing time was sufficient to form a fully covered and thick oxide film [3,16].

3.2. Effect of Fly-Ash Content

3.2.1. The Effect of Fly-Ash Content on Surface Morphology

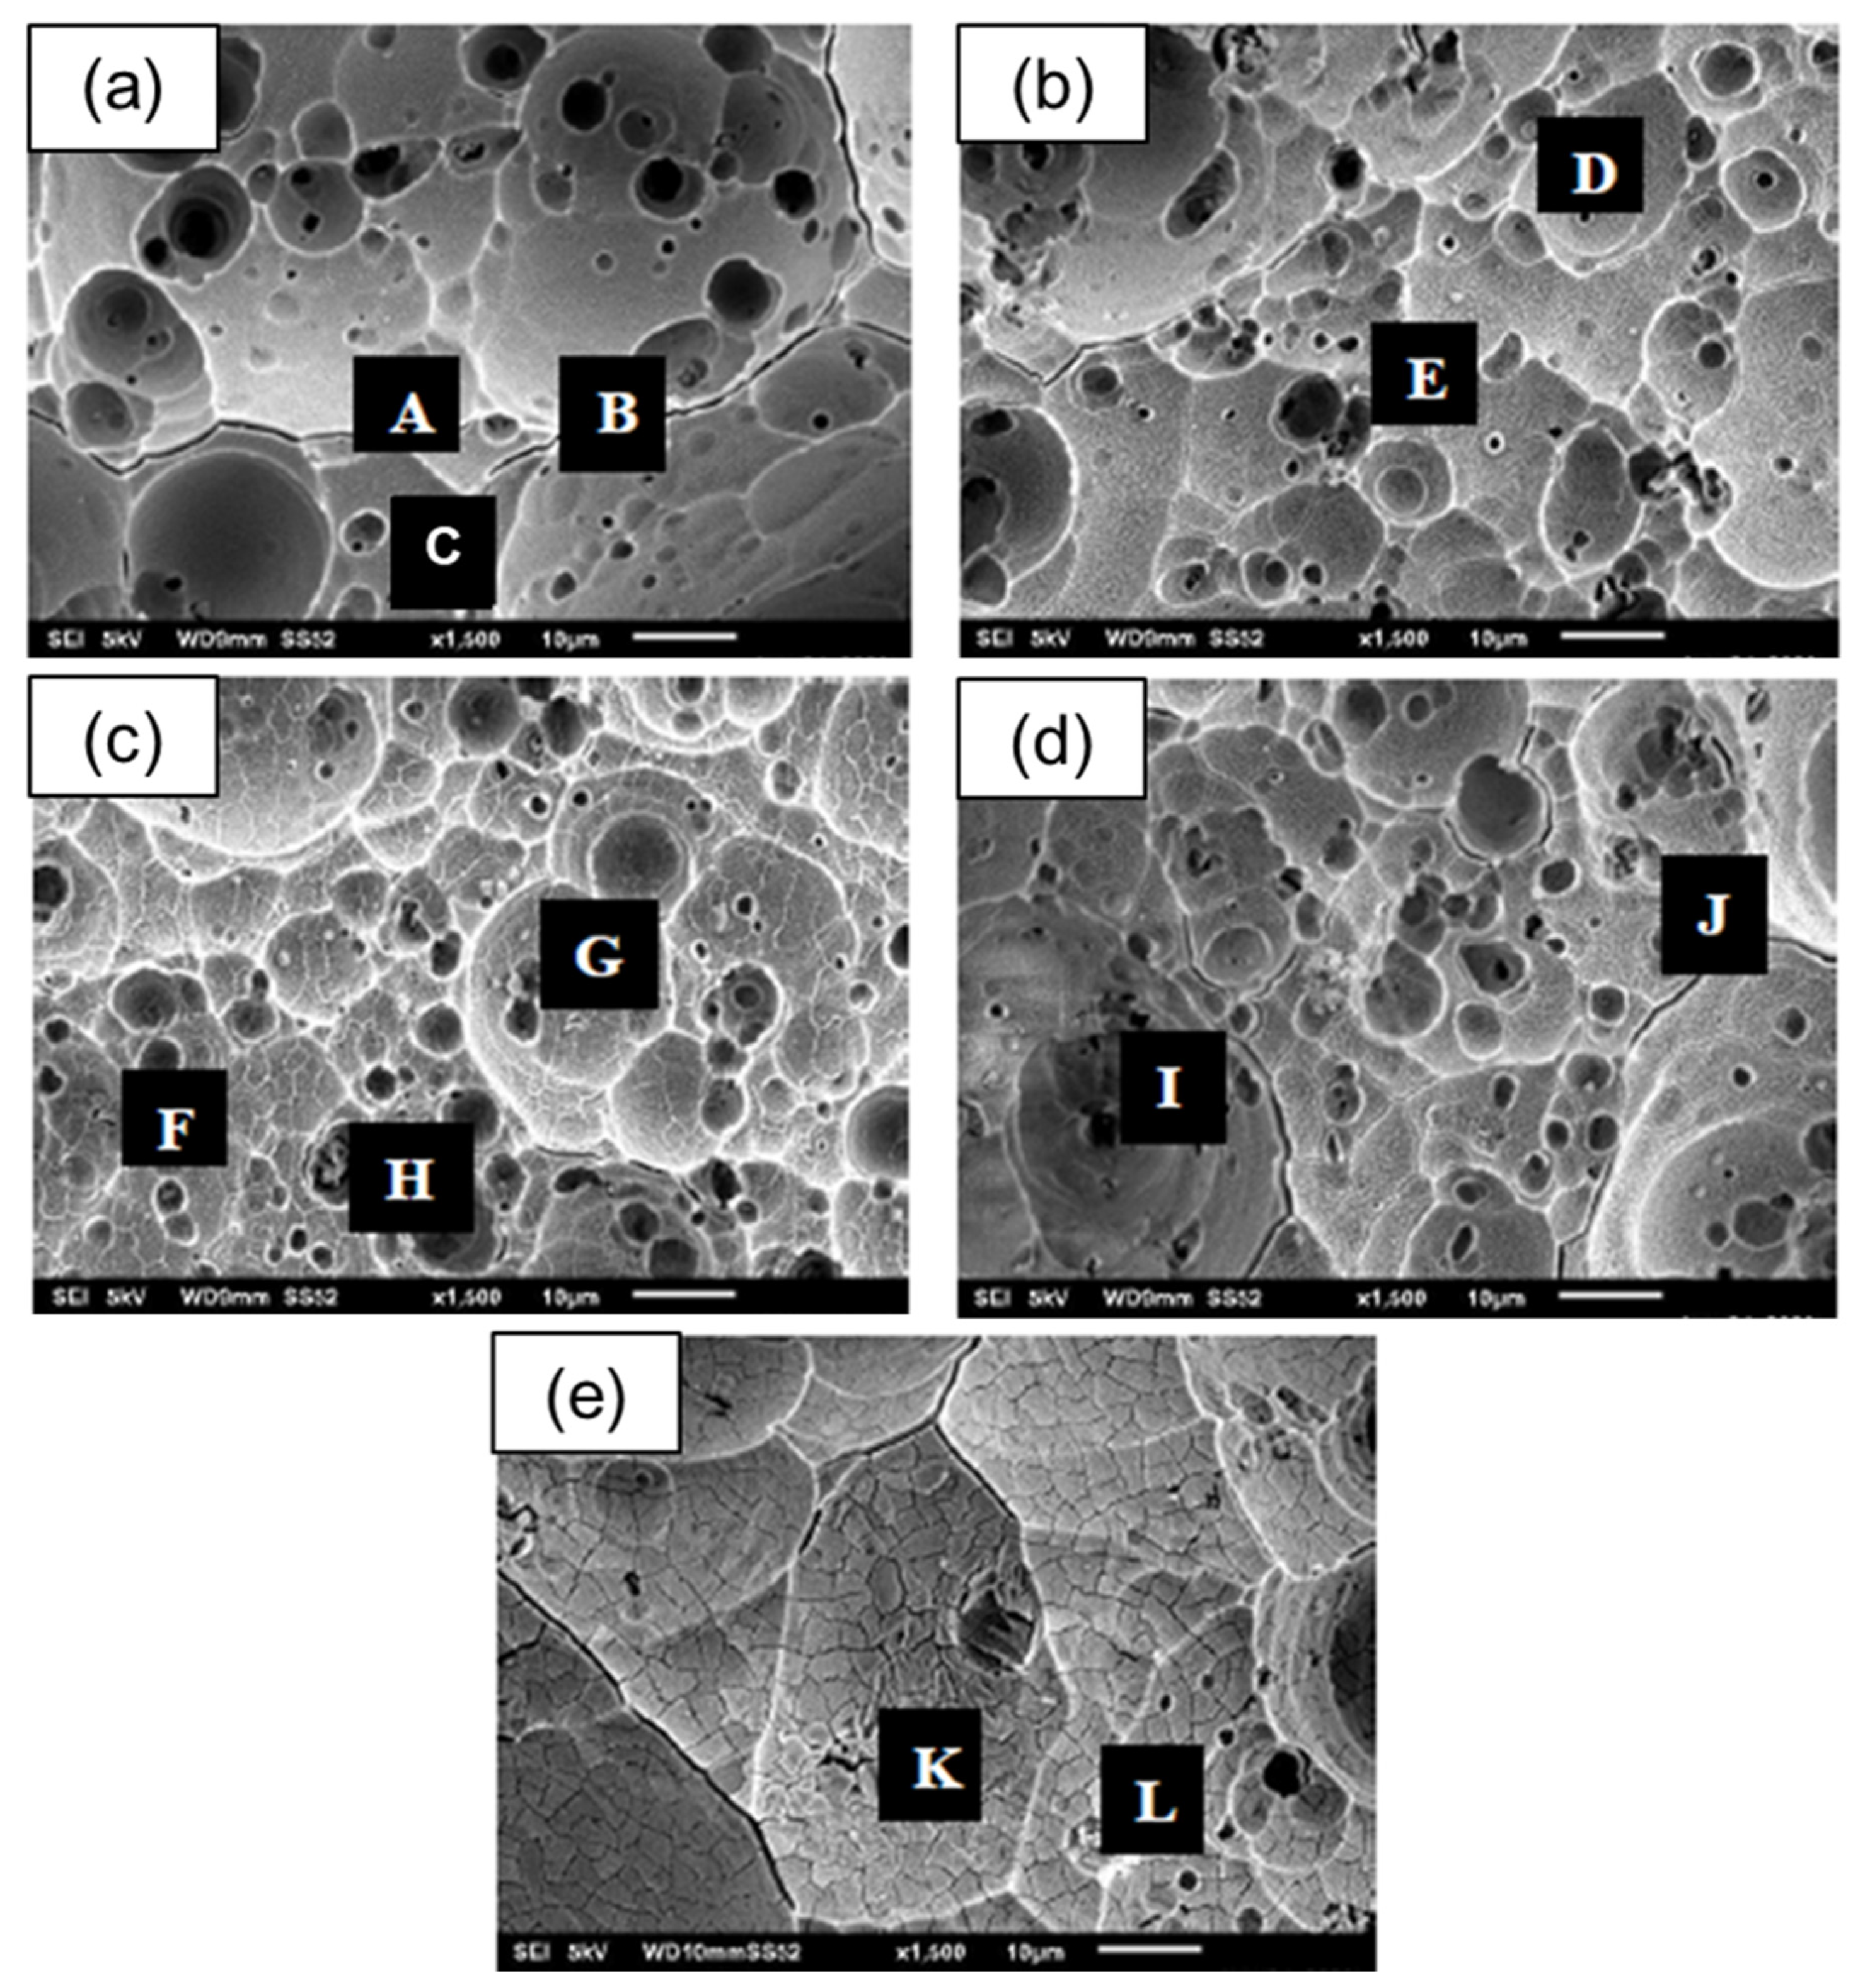
Figure 10 shows the oxide film on aluminium alloy anodized for 60 min at different fly-ash content compositions. Different fly-ash content ranging from 0–50 g/L shows an interesting pattern where the anodized surface presented a lesser number of micropores as the fly-ash content increased. However, with 50 g/L fly-ash content, there were still some micropores present. By closely looking at the surfaces, the sizes and depth of the micropores also decreased as the fly-ash content increased. It was believed that the fly-ash particles were adsorbed and embedded into the pores that had been formed during the growth of oxide film. The presence of fly-ash particles in oxide film anodized at 60 min were confirmed with chemical composition results, as shown in Table 6.
From Table 6, it can be seen that points A, B, and C (Figure 10a) had no silicon particles, whereas the rest of the points (D to L) contained silicon particles. The presence of silicon particles, among others, shows that the fly-ash particles had embedded on the oxide layer.
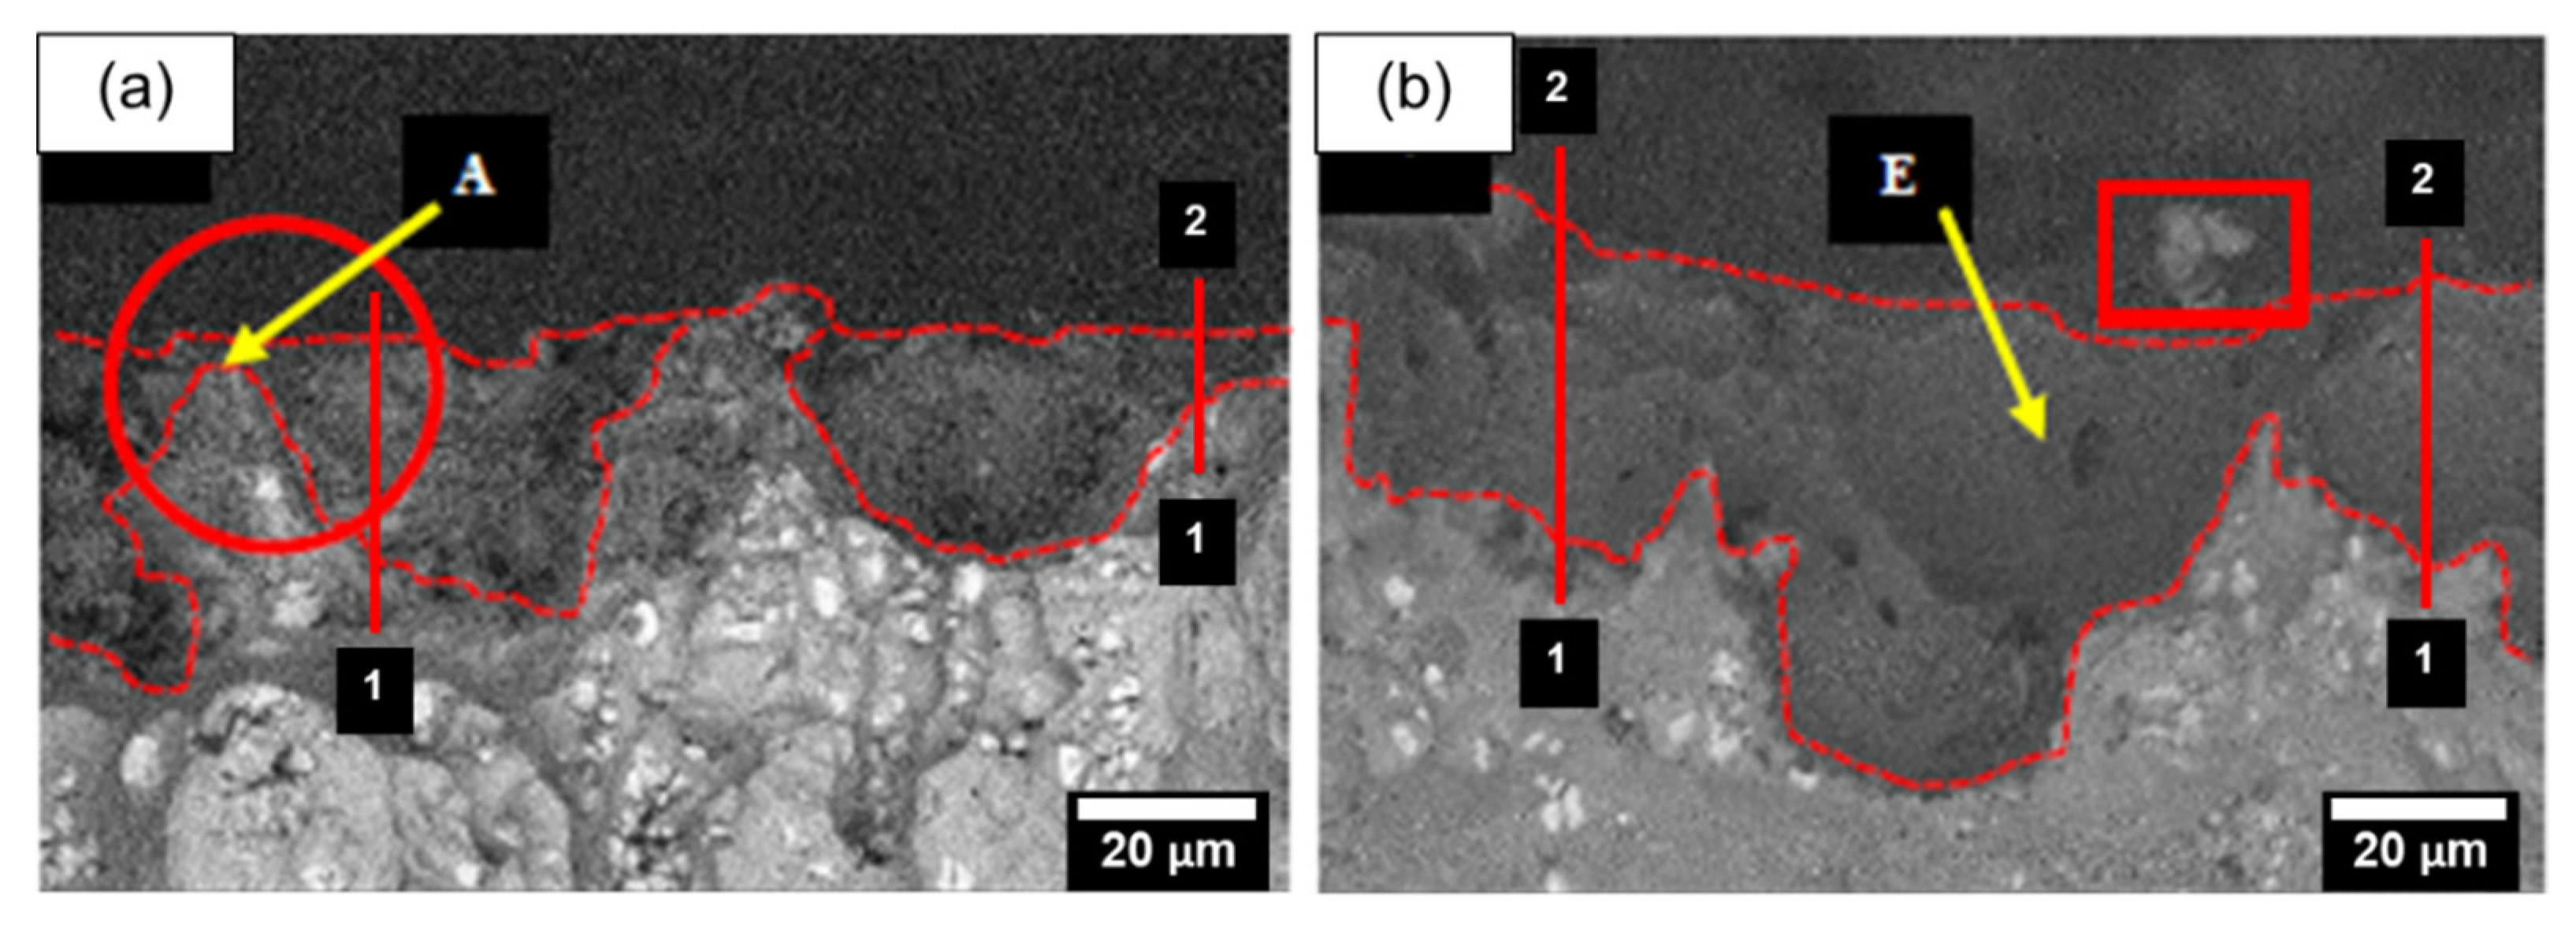
Figure 11 shows the cross section of the anodized Al alloy for 0 to 50 g/L fly-ash content. Point A shows no traces of Si element while point E shows traces of Si element. This indicates that the fly-ash had embedded into the oxide coating during the anodizing process. The coating thickness was estimated based on the colour contra and element analysis. It is observed that a significant thickness increases as the fly-ash content increases. The coating thickness for the 0 g/L surface (Figure 11a) was between 13–16 μm, whereas the thickness for the 50 g/L surface (Figure 11e) was roughly between 36–52 μm. The EDX analysis confirmed that the oxide formed at the subsurface label A (slightly bright) was an intermetallic compound with copper elements. In contrast, the region marked with label E was the fly-ash as the EDX analysis presented with silicon.

3.2.2. The Effect of Fly-Ash Content on Surface Topography

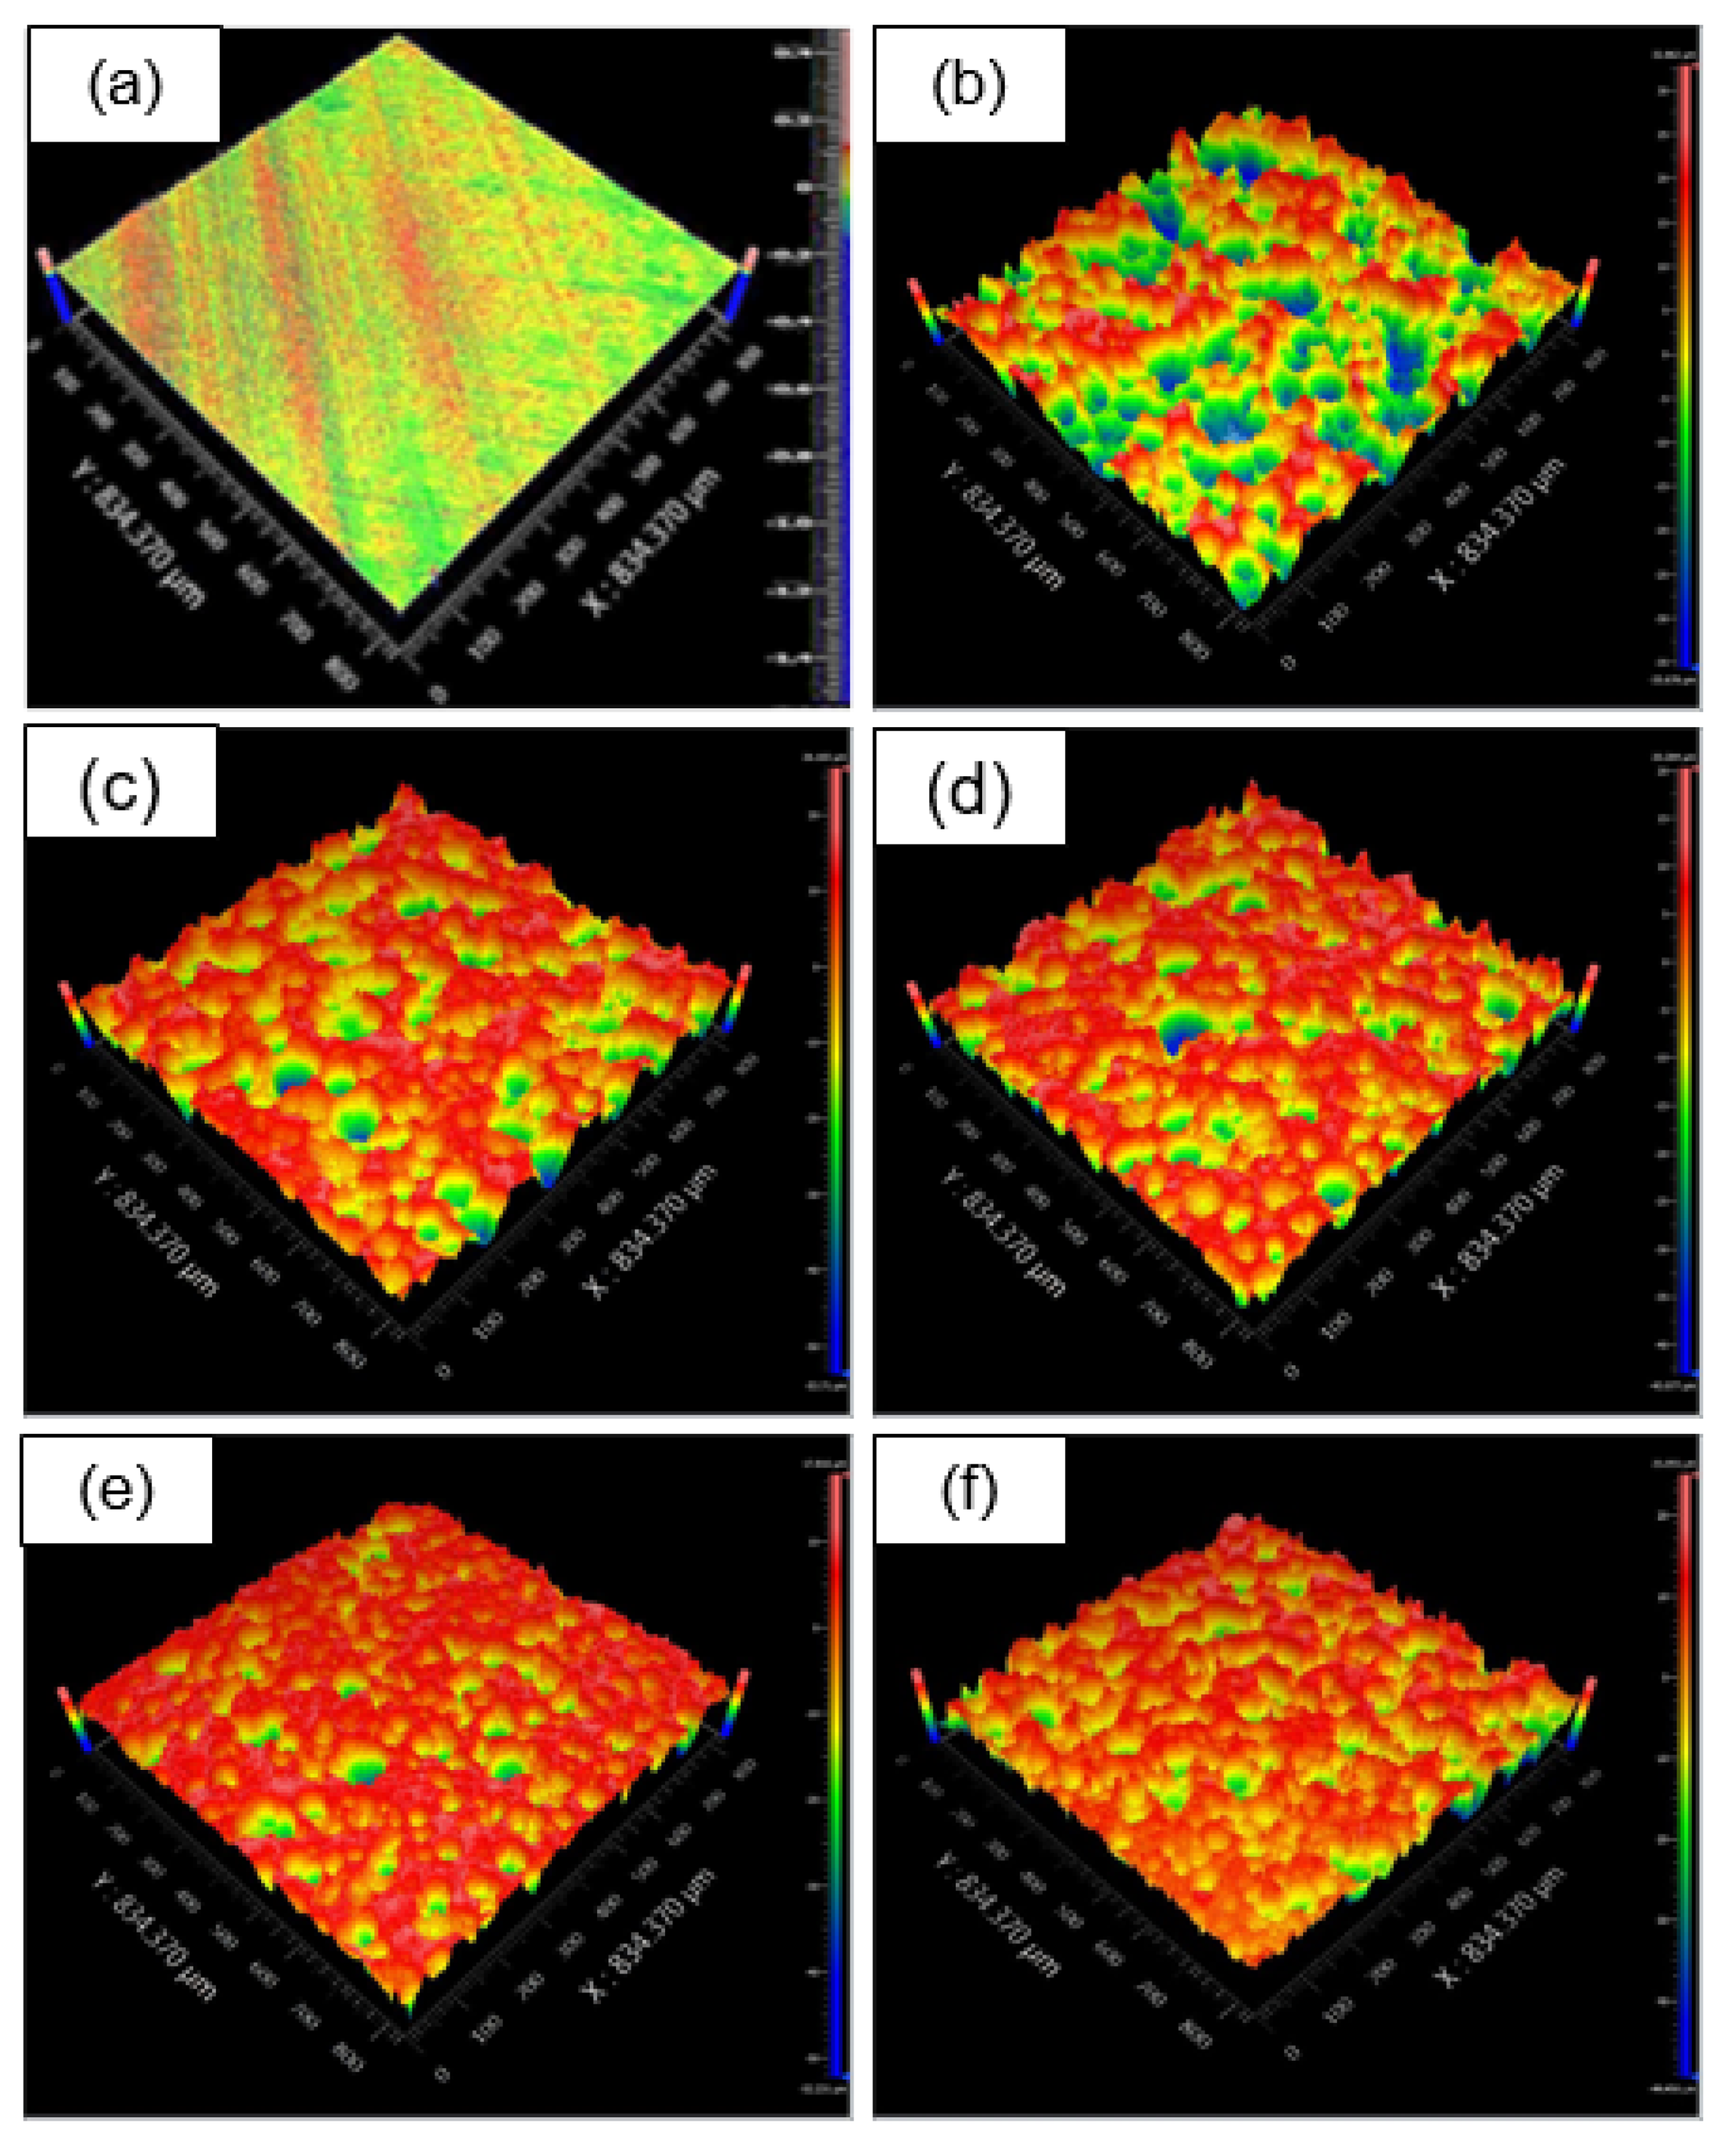
Figure 12 shows three-dimensional images of as-received Al alloy and composite oxide films reinforced with different fly-ash compositions at 60 min of anodizing time. The profile consists of crests and troughs, which are indicated based on different colour regions arranged from red, orange, yellow, green, to blue. The blue region was the lowest (trough), and the red region was the highest (crest). Figure 12a shows the as-received Al surface, while the anodized surfaces are shown in Figure 12b–f. Figure 12b shows the composite oxide surface for 1 g/L fly-ash, where many irregularities can be seen on the surface, indicating insufficient reinforcement to fill the pores and crates. With increasing fly-ash content, the pores were filled more. Starting at 30 g/L, the fly-ash reduced the number of pores and had smoother surfaces.
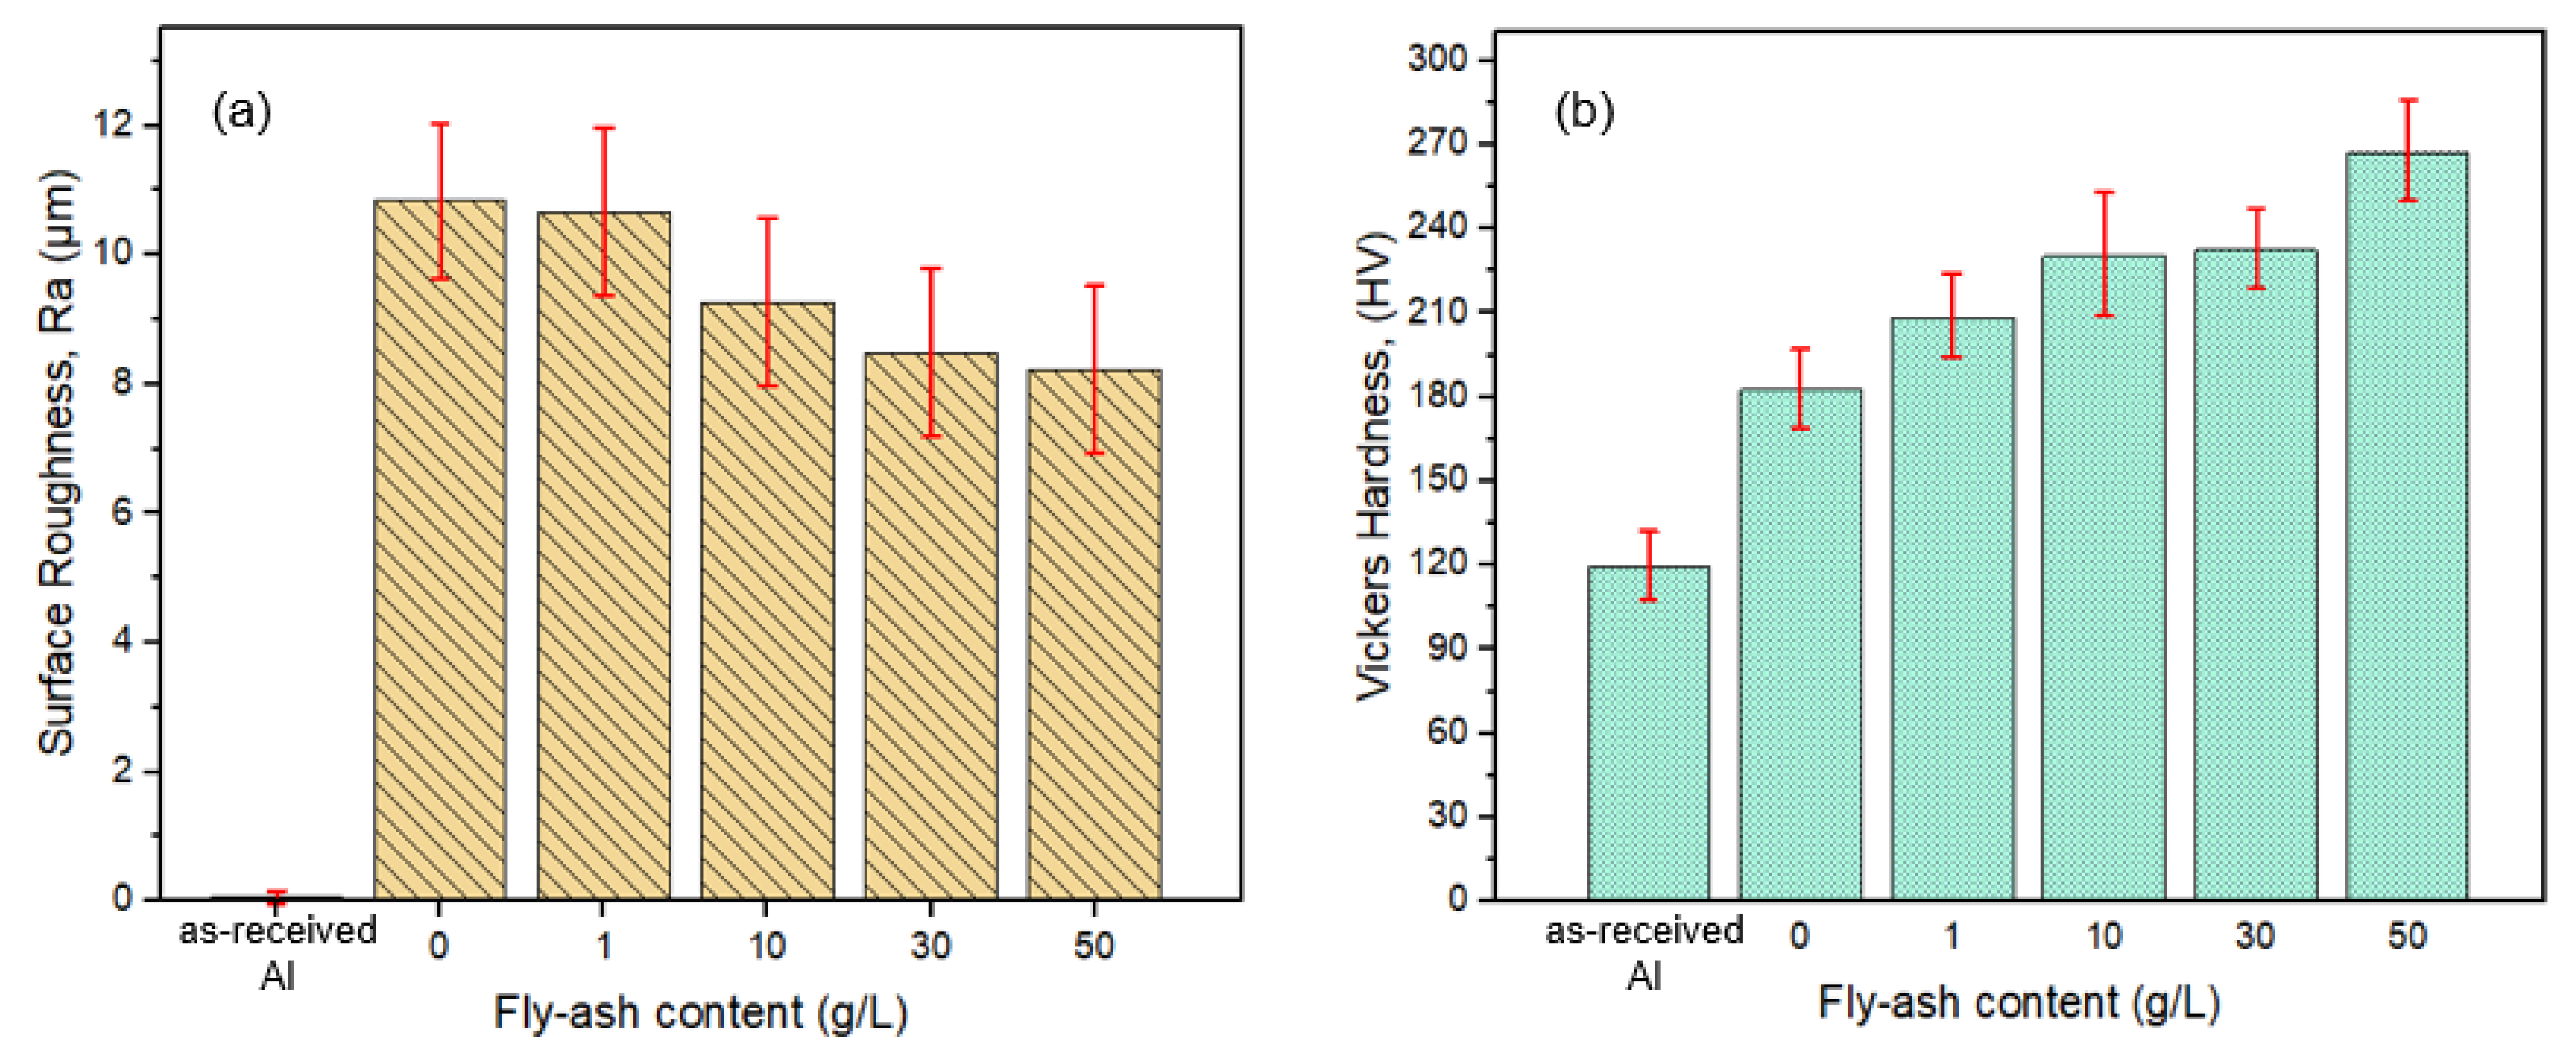
It was found that the surface roughness of oxide film without fly ash addition (0 g/L) was 10.1 μm; meanwhile, the surface roughness of composite oxide film with 50 g/L fly-ash decreased to 8.2 μm. It was believed that the fly-ash particles had filled the pores, hence reducing the depth of the pores and crates, making the surface smoother. Although there was a slight increase of surface roughness for 1 g/L fly-ash, the small amount of fly-ash added might not be adequate to fill the gaps as the fly-ash particles are randomly sized. It was believed that only a smaller fly-ash could fill the pores while the large-sized fly-ash remained on the solution. The surface roughness comparison obtained is shown in Figure 13a.
Hardness analysis on the as-received Al alloy and the composite oxide coating is shown in Figure 13b. The graph shows that the anodized layer has higher hardness compared to the as-received surface. Among the composite oxide surfaces, it can be seen that the increase of the fly-ash content led to the increase of hardness. The highest hardness observed was the surface with 50 g/L fly-ash with 268.2 HV followed by 30 g/L with 232.4 HV. The increase of hardness trend was discussed by Mohamad et al., where the increase of hardness on the oxide coating was due to the densification of the oxide film [3]. The incorporation of fly-ash in the composite oxide film led to the hardness increment with help of the presence of alumina and silica, which are the main suspects to be the contributing factor to increase the hardness of the composite oxide. This finding was under agreement with others, where the presence of fly-ash indeed increased the hardness of the surface [25,34]. Interestingly, another researcher also shows the same increasing pattern where the hardness was directly proportional to the fly-ash content [34].

3.3. Tribological Properties of the Composite Oxide Film

The composite oxide layer was then tested for the dry-sliding test using a ball-on-disc tribometer. The coefficient of friction (COF) taken was plotted against the number of rotations, as shown in Figure 14. The as-received Al and other oxide coatings were tested at an applied load of 1 N and speed of 30 rpm against a silicon nitride (Si3N4) ball with a diameter of 8 mm as the counterpart.
The as-received aluminium alloy was observed to have the highest COF (approximately 0.6) among all the samples. It was also observed that the introduction of oxide film coating could temporarily reduce the COF. At the initial stage, the COF of the oxide coatings (except 0 g/L) were relatively low and started to increase after several rotations. In this case, the addition of 50 g/L fly-ash was able to prolong the low COF up to the 150th rotation compared to the 85th rotation for 30 g/L and the 26th rotation for 10 g/L. The same pattern was observed by other researchers on hard anodizing coating performance, where the coating could last for a certain period before the COF increases [3,14,35]. It was believed that initially, the loose reinforcement on the surface and pores provided lower contact pressure due to third-body contact. The fly-ash particles are generally spherical, avoiding stress concentration, enduring the applied loads, and thus reducing the contact area [25]. However, the reinforcement was removed from the surface due to tangential force, causing the contact to become two-body contact after some rotations. Thus, the high hardness of the oxide increases the coefficient of friction.
Before the destruction of the oxide film, it can be observed that 50 g/L oxide film exhibited higher COF than the neat oxide film. Many fly-ash particles might come in contact under the sliding system and these particles began to agglomerate with each other, thus increasing the COF. However, overall the COF of oxide film coating with 50 g/L of fly-ash was found to be lowest (0.5) throughout the sliding process (until the 1800th sliding rotations) as compared to the COF of the as-received aluminium alloy (0.6). In this study, the oxide film coating with 50 g/L of fly-ash was very effective in decreasing the friction of the aluminium alloy, which may be attributed to the high hardness of oxide film.
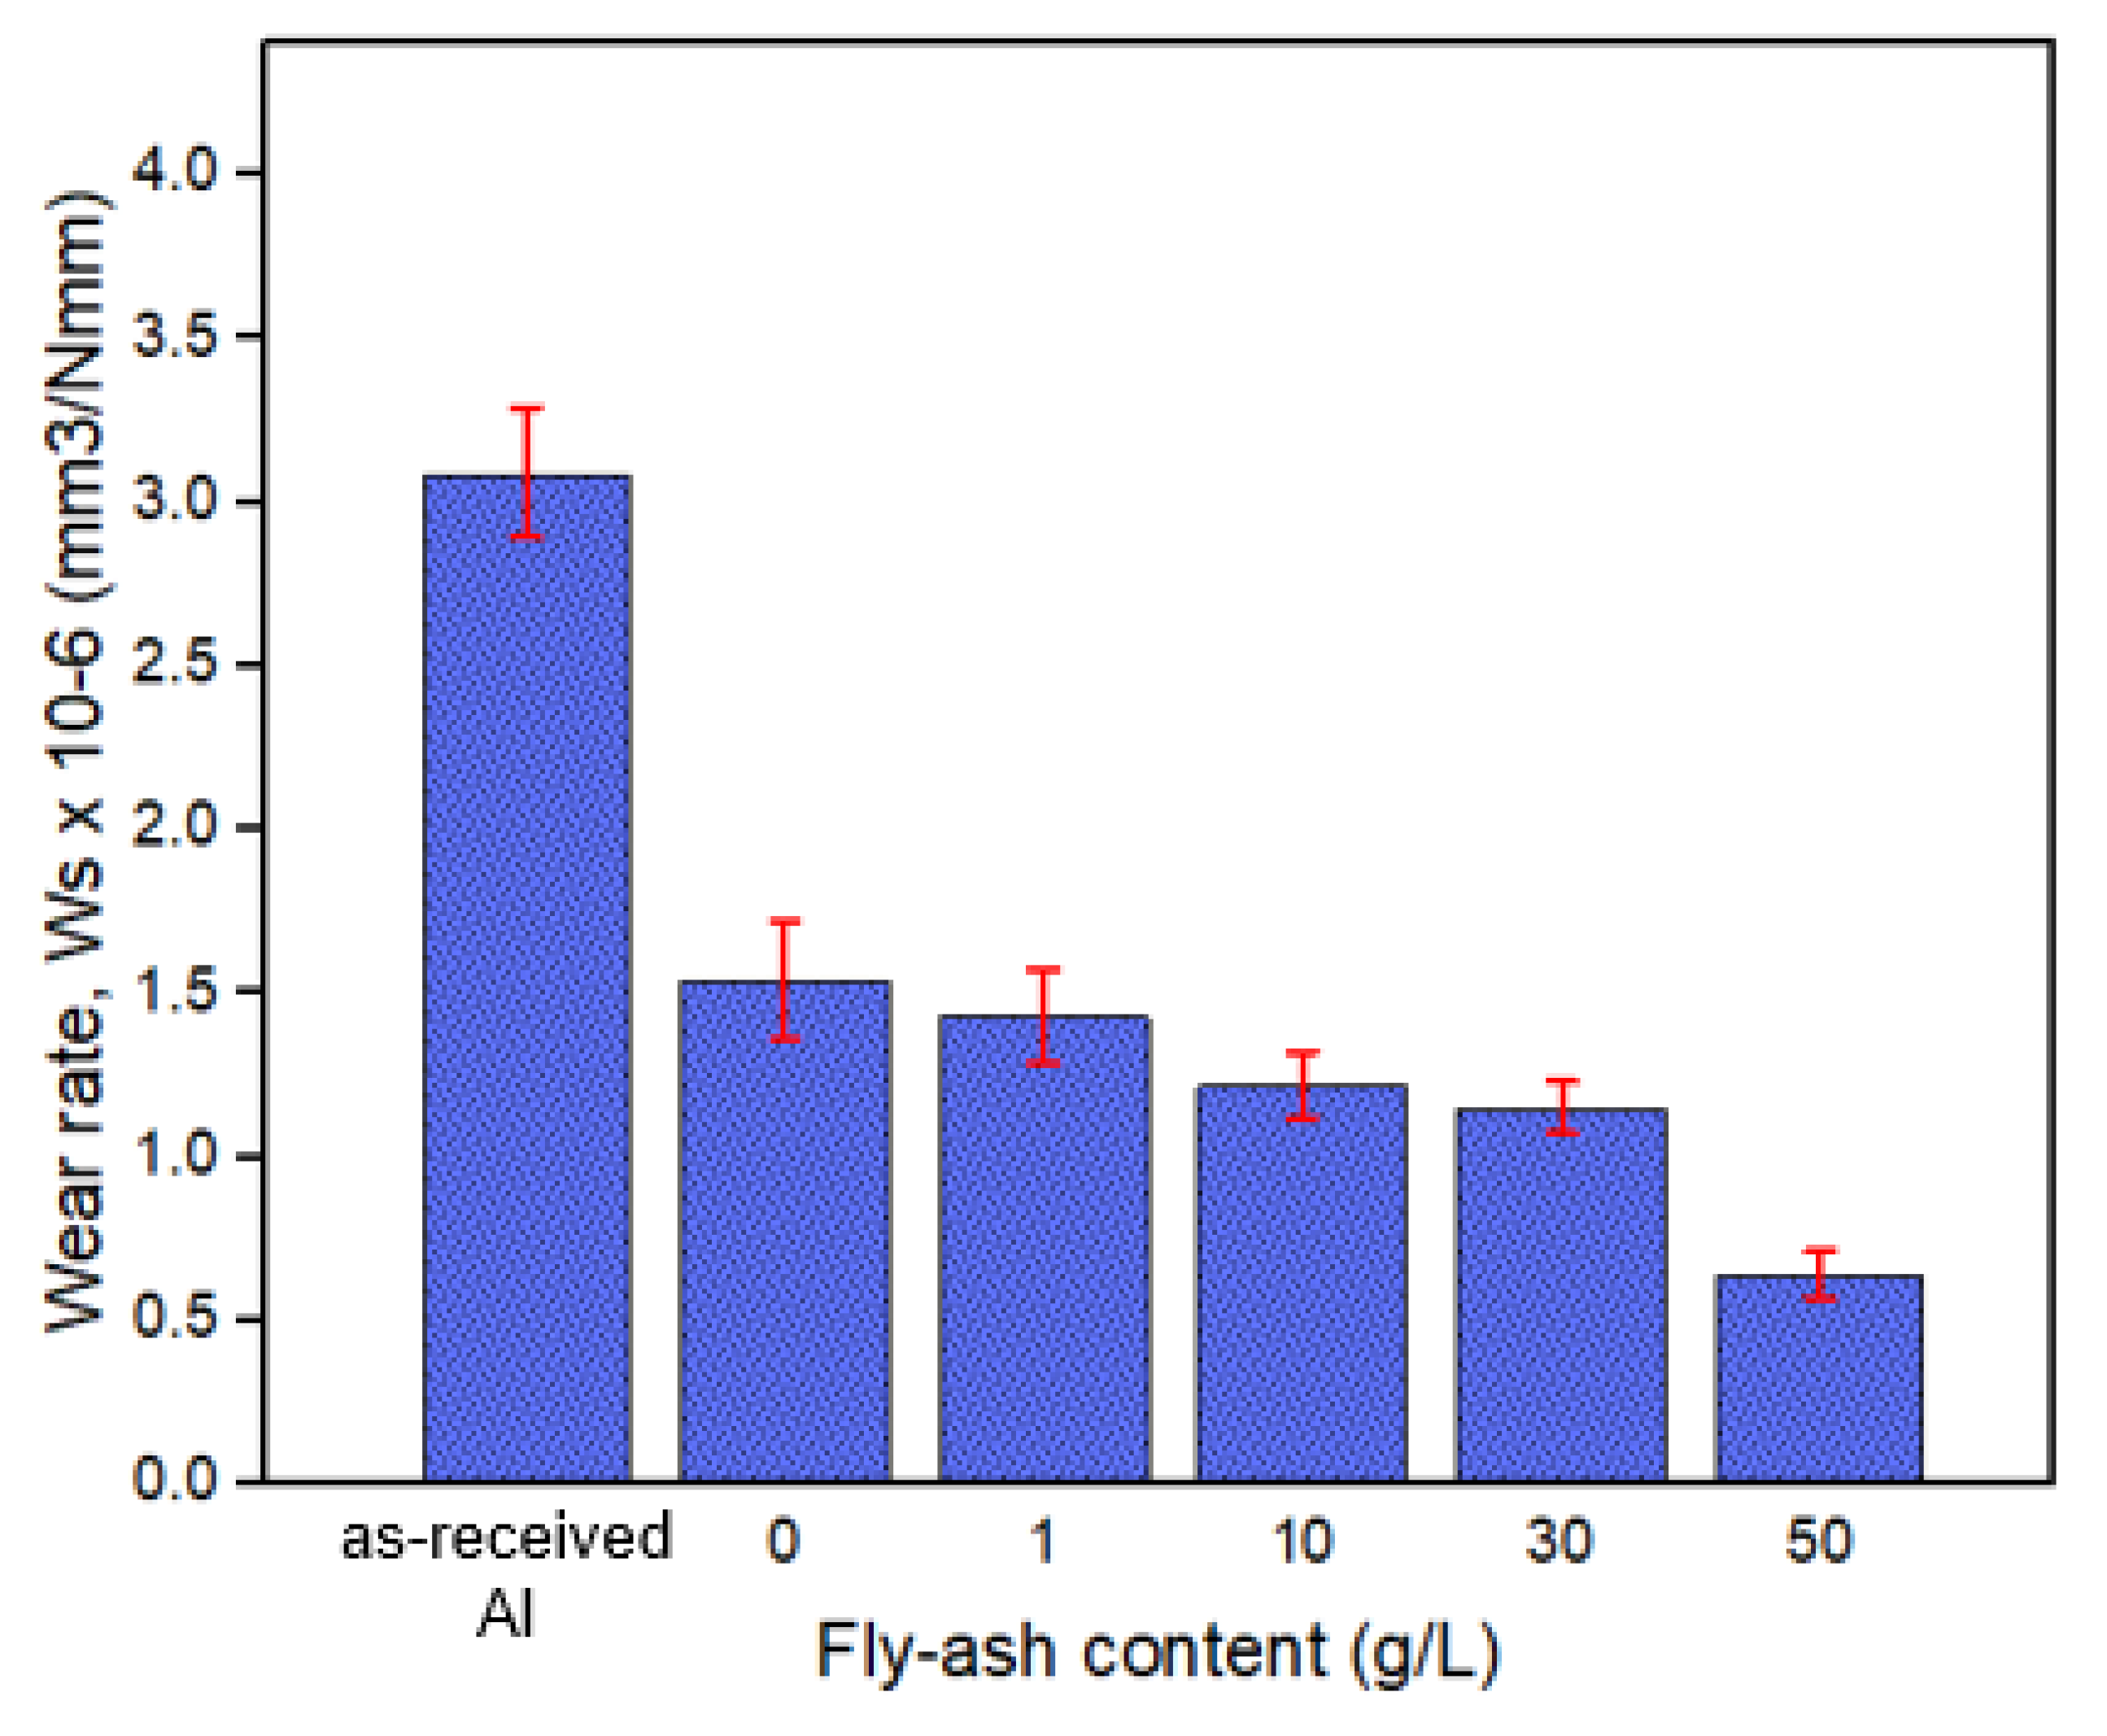
The wear rate of the as-received and composite oxide aluminium over different content of fly-ash particles is shown in Figure 15. It can be seen that wear rates of oxide films reinforced with fly-ash particles were much lower compared to the as-received and neat oxide films (0 g/L). The trend also shows that the wear rate decreased as the fly-ash content increased. By comparing the wear rate reduction, it can be seen that the presence of an oxide layer from anodizing process could reduce it up to 50.2%. With at least 1 g/L fly-ash added during the anodizing process, the wear rate had reduced almost 53.7%, with a 3.5% improvement compared to the neat oxide layer (0 g/L). The 50 g/L of fly-ash composite oxide surface present around 0.64 × 10⁻⁶ mm3/Nmm, which is a decrease of 79.3% compared with the as-received aluminium and 28.8% improvement from the neat oxide layer (0 g/L). These findings agree with earlier research, where the addition of reinforcement on oxide coating can increase hardness and thus reduce the wear rate [3].
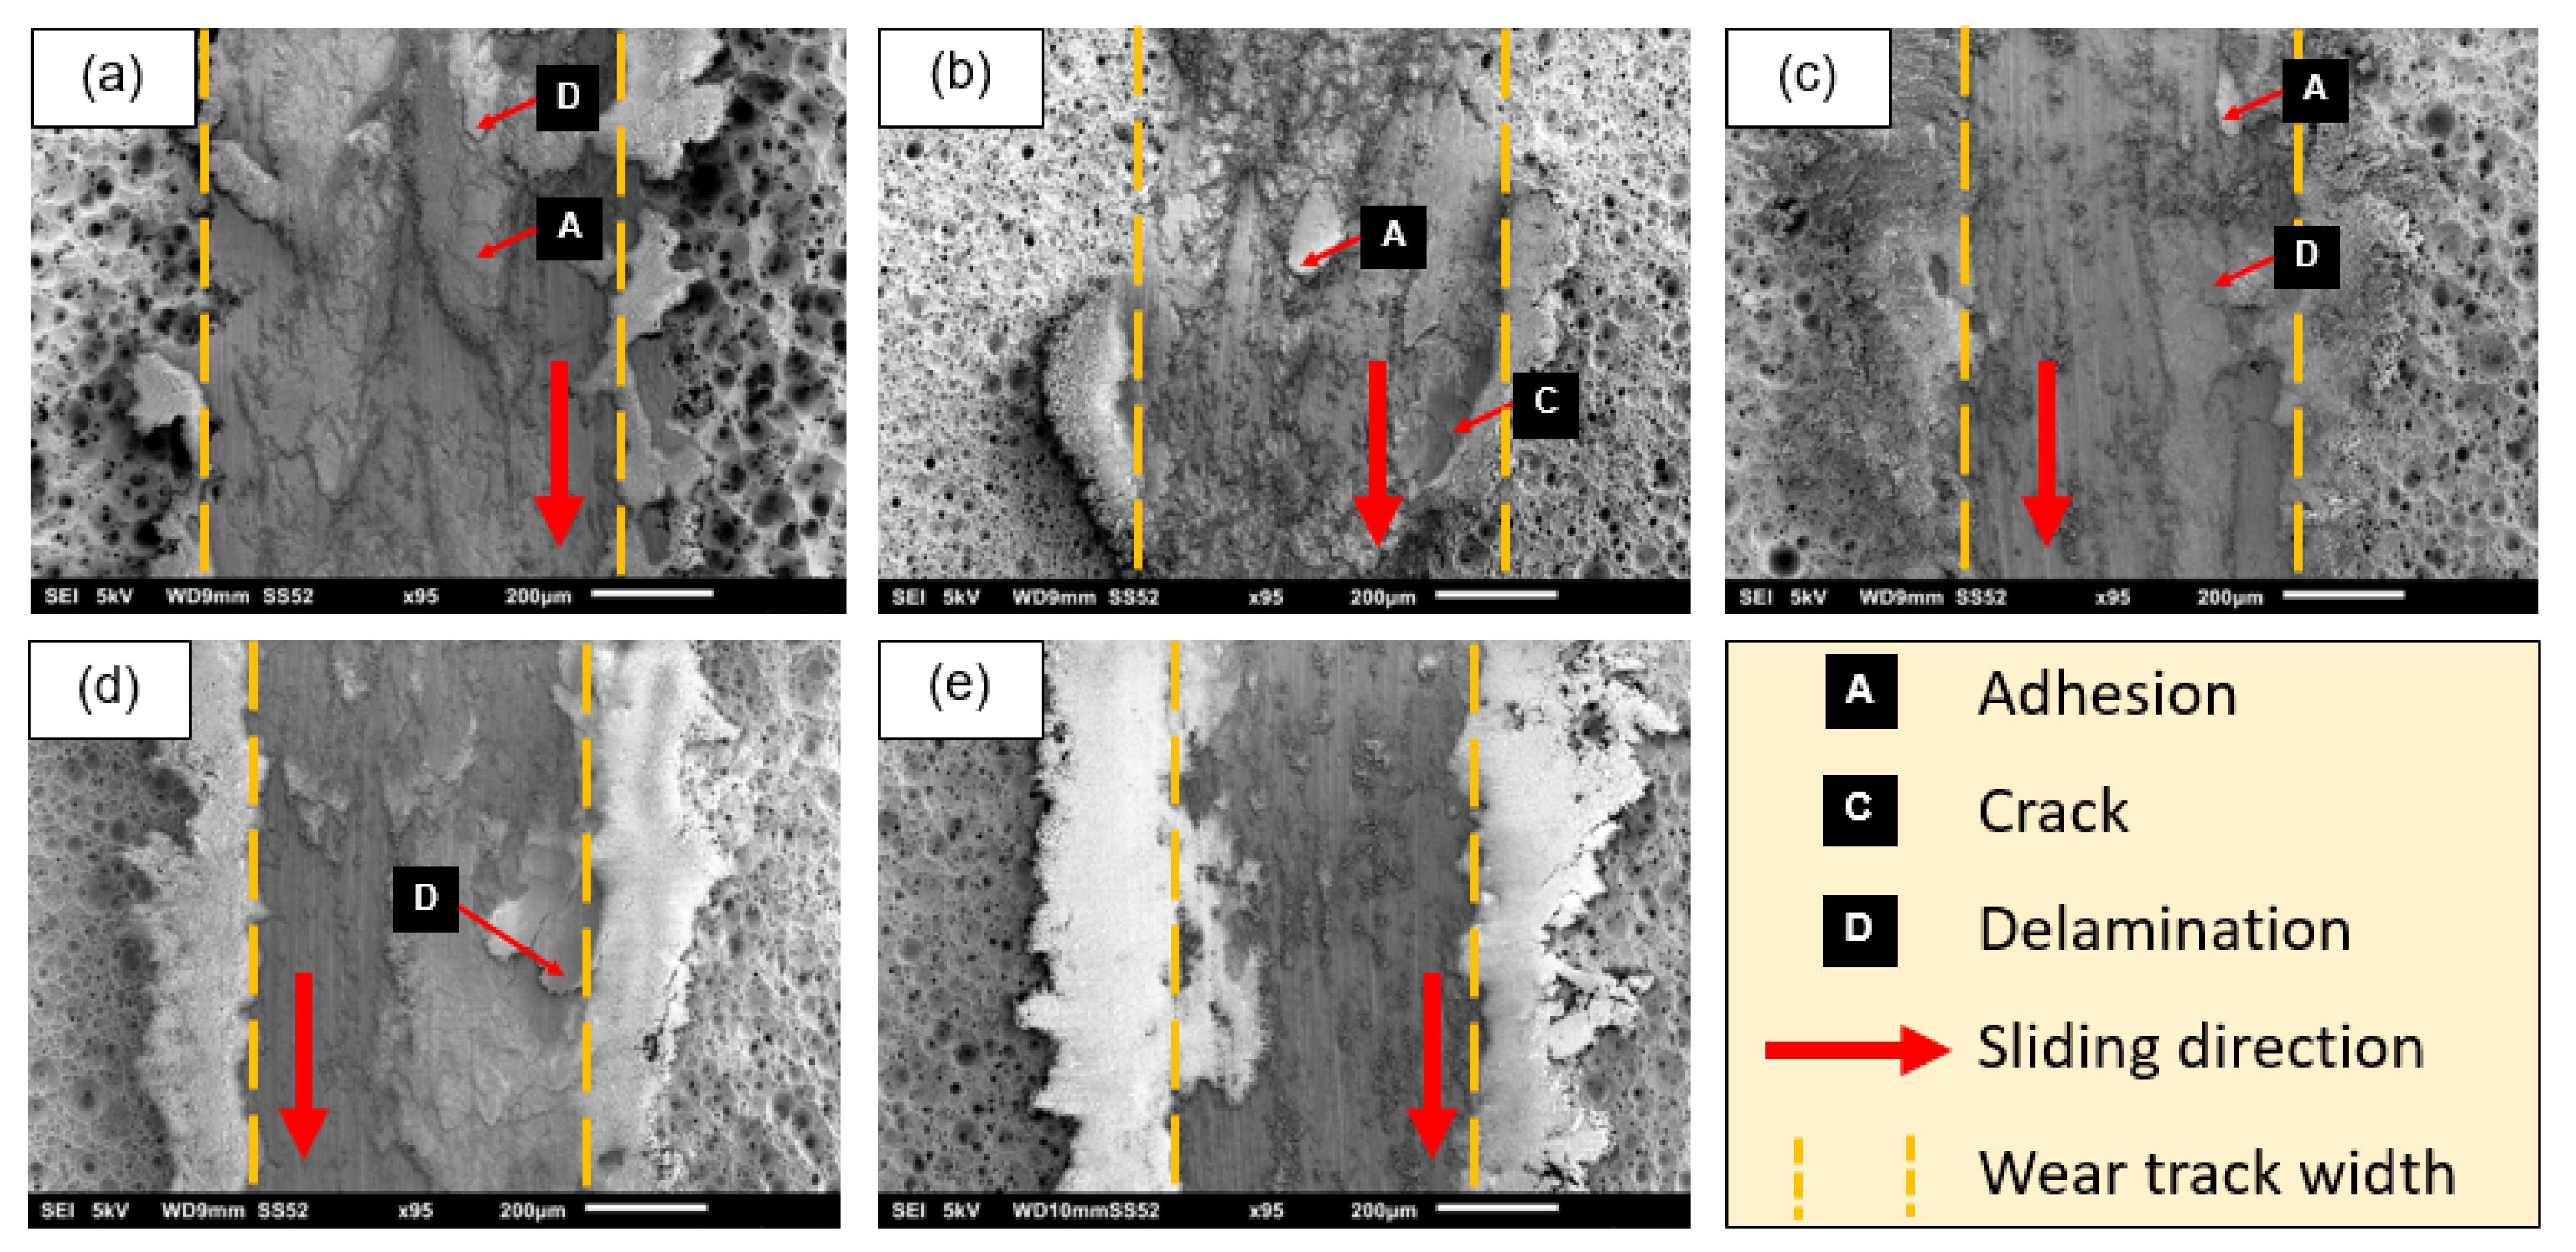
Despite the high number of improvements recorded, the composite oxide layer was observed to be destroyed rapidly after the 1800th rotation, as shown in SEM image analysis Figure 16. Based on the SEM analysis, it is evident that the wear track was narrowest at 50 g/L of fly-ash composite coating. As expected, the sample without fly-ash addition (0 g/L) hds the biggest wear track, followed by 1, 10 and 30 g/L of fly-ash. These findings agree with the wear rate found in Figure 15, where the surface with 50 g/L fly-ash content had the lowest wear rate. These findings are attributed to the hardness of fly-ash, where it indirectly increased the surface hardness as it is embedded on the oxide. These findings concurred with previous research where they found that the increase of reinforcement content in oxide coating increases the hardness and decreases the wear [3,25,36].
Besides that, the SEM image also discloses several types of wear mechanisms such as adhesion, crack, and delamination. Adhesion and delamination traces were present on the surface, which were believed to be present because the oxide layer broke and stuck between the contacted surfaces. Besides oxide coating with 0 g/L of fly-ash, adhesion was also presented at 1 and 10 g/L of composite oxide coating worn surfaces. In addition, microcracks were also present on the 1 g/L composite oxide surface. Interestingly, there was no sign of adhesion, delamination, or cracks on the 50 g/L composite oxide surface. This finding correlates with the data found in Figure 16, where the composite oxide coating of 50 g/L had the lowest wear rate. Nevertheless, the COF for all composite oxide coatings were almost the same.

4. Conclusions

The composite oxide coating film was successfully synthesized on aluminium alloy AA2017-T4 through anodizing process. The influence of anodizing time and fly-ash content of the composite oxide surfaces was studied, and the findings are as follows.
As the anodizing time increased, the voltage decreased while the temperature increased. Starting at the 10th min, the electrolyte’s temperature exceeded 30 ℃, with the highest temperature recorded being 70 ℃ at 60 min. These findings highlight that the voltage and temperature change throughout the anodizing process. It is highly recommended that the system be constantly monitored and controlled with a controlled system such as a cooling bath and/or others.
The findings suggested that the longer the anodizing time, the thicker the oxide coating is. With 60 min of anodizing time producing the thickest coating among other anodizing time, it was also observed that the surface was completely covered with dense composite films, which proves that the fly-ash was able to enter the pores and produce higher surface roughness.
It was confirmed that the fly-ash volume content significantly impacted the composite oxide coating. The addition of fly-ash also increased the coating thickness and hardness. Specifically, 50 g/L of fly-ash sample showed the highest coating thickness of 52 μm and hardness of 268.2 HV.
Performance-wise, the coefficient of friction between the uncoated (as-received), oxide coating without fly-ash (0 g/L), and composite oxide coating with fly-ash were almost the same after the 1000th rotation. However, the addition of fly-ash was able to reduce the coefficient drastically at the early stage (below 150 rotation) with less than 0.06. Interestingly, due to its high hardness, the wear rate for 50 g/L was the lowest among all surfaces, with 79.3% improvement compared with the uncoated and 28.8% improvement from the neat oxide layer (0 g/L).

Author Contributions

Conceptualization, S.L., Y.Y. and I.S.O.; methodology, S.L. and S.M.; formal analysis, S.L., K.F., M.Z.F.H. and M.S.M.Y.; investigation, N.A.M.T. and S.L.; writing N.A.M.T. and S.L.; supervision, S.L. All authors have read and agreed to the published version of the manuscript.

Funding

This research was funded by Universiti Teknologi Malaysia, Malaysia, through the Post-Doctoral Fellowship Scheme (PDRU Grant number: Q.K130000.21A2.05E39) and JICA Fund Program 2021 under Technical Cooperation Project for Enhancement of Malaysia-Japan International Institute of Technology: R.K130000.7343.4B694.

Institutional Review Board Statement

Not applicable.

Informed Consent Statement

Not applicable.

Data Availability Statement

Data is contained within the article.

Acknowledgments

The authors acknowledge the support provided by the Tribology and Precision Machining i-Kohza (TriPreM) for the facilities and equipment provided.

Conflicts of Interest

The authors declare no conflict of interest.

References

  1. Zalnezhad, E.; Sarhan, A.A.D.; Hamdi, M. Investigating the effects of hard anodizing parameters on surface hardness of hard anodized aerospace AL7075-T6 alloy using fuzzy logic approach for fretting fatigue application. Int. J. Adv. Manuf. Technol. 2013, 68, 453–464. [Google Scholar] [CrossRef]
  2. Martínez-Viademonte, M.P.; Abrahami, S.T.; Hack, T.; Burchardt, M.; Terryn, H. A Review on Anodizing of Aerospace Aluminum Alloys for Corrosion Protection. Coatings 2020, 10, 1106. [Google Scholar] [CrossRef]
  3. Mohamad, S.; Liza, S.; Yaakob, Y. Technology strengthening of the mechanical and tribological properties of composite oxide film formed on aluminum alloy with the addition of graphite. Surf. Coat. Technol. 2020, 403, 126435. [Google Scholar] [CrossRef]
  4. Bononi, M.; Giovanardi, R.; Bozza, A. Pulsed current hard anodizing of heat treated aluminum alloys: Frequency and current amplitude influence. Surf. Coat. Technol. 2016, 307, 861–870. [Google Scholar] [CrossRef]
  5. Ossowska, A.; Zieliński, A.; Olive, J.-M.; Wojtowicz, A.; Szweda, P. Influence of Two-Stage Anodization on Properties of the Oxide Coatings on the Ti–13Nb–13Zr Alloy. Coatings 2020, 10, 707. [Google Scholar] [CrossRef]
  6. Aydogan, D.T.; Muhaffel, F.; Acar, O.K.; Topcuoglu, E.N.; Kulekci, H.G.; Kose, G.T.; Baydogan, M.; Cimenoglu, H. Surface modification of Ti6Al4V by micro-arc oxidation in AgC2H3O2-containing electrolyte. Surf. Innov. 2018, 6, 277–285. [Google Scholar] [CrossRef]
  7. Ghorbanian, B.; Tajally, M.; Khoie, S.M.M.; Tavakoli, H. Corrosion behavior of MoS2-incorporated PEO coatings prepared on Al alloy. Surf. Innov. 2020, 8. [Google Scholar] [CrossRef]
  8. Attarzadeh, N.; Ramana, C.V. Plasma electrolytic oxidation ceramic coatings on zirconium (Zr) and Zr alloy: Part I—Growth mechanisms, microstructure, and chemical composure. Composites 2021, 11, 634. [Google Scholar]
  9. Malinovschi, V.; Marin, A.H.; Ducu, C.; Moga, S.; Andrei, V.; Coaca, E.; Craciun, V.; Lungu, M.; Lungu, C.P. Improvement of Mechanical and Corrosion Properties of Commercially Pure Titanium Using Alumina PEO Coatings. Coatings 2021, 12, 29. [Google Scholar] [CrossRef]
  10. Bozza, A.; Giovanardi, R.; Manfredini, T.; Mattioli, P. Pulsed current effect on hard anodizing process of 7075-T6 aluminium alloy. Surf. Coat. Technol. 2015, 270, 139–144. [Google Scholar] [CrossRef]
  11. Fratila-Apachitei, L.; Terryn, H.; Skeldon, P.; Thompson, G.; Duszczyk, J.; Katgerman, L. Influence of substrate microstructure on the growth of anodic oxide layers. Electrochim. Acta 2003, 49, 1127–1140. [Google Scholar] [CrossRef]
  12. Saenz de Miera, M.; Curioni, M.; Skeldon, P.; Thompson, G.E. The behaviour of second phase particles dur-ing anodizing of aluminium alloys. Corros. Sci. 2010, 52, 2489–2497. [Google Scholar] [CrossRef]
  13. Iglesias-Rubianes, L.; Garcia-Vergara, S.J.; Skeldon, P.; Thompson, G.E.; Ferguson, J.; Beneke, M. Cyclic oxidation processes during anodizing of Al-Cu alloys. Electrochim. Acta 2007, 52, 7148–7157. [Google Scholar] [CrossRef]
  14. Santecchia, E.; Cabibbo, M.; Hamouda, A.M.S.; Musharavati, F.; Popelka, A.; Spigarelli, S. Dry Sliding Tribological Properties of a Hard Anodized AA6082 Aluminum Alloy. Metals 2020, 10, 207. [Google Scholar] [CrossRef] [Green Version]
  15. Mehdizade, M.; Soltanieh, M.; Eivani, A.R. Investigation of anodizing time and pulse voltage modes on the corrosion behavior of nanostructured anodic layer in commercial pure aluminum. Surf. Coat. Technol. 2018, 358, 741–752. [Google Scholar] [CrossRef]
  16. Wu, L.; Wen, C.; Zhang, G.; Liu, J.; Ma, K. Influence of anodizing time on morphology, structure and tribological properties of composite anodic films on titanium alloy. Vacuum 2016, 140, 176–184. [Google Scholar] [CrossRef]
  17. Arun, S.; Hariprasad, S.; Saikiran, A.; Ravisankar, B.; Parfenov, E.V.; Mukaeva, V.R.; Rameshbabu, N. The effect of graphite particle size on the corrosion and wear behaviour of the PEO-EPD coating fabricated on commercially pure zirconium. Surf. Coat. Technol. 2019, 363, 301–313. [Google Scholar]
  18. Bordbar-Khiabani, A.; Ebrahimi, S.; Yarmand, B. Highly corrosion protection proper-ties of plasma electrolytic oxidized titanium using rGO nanosheets. Appl. Surf. Sci. 2019, 486, 153–165. [Google Scholar] [CrossRef]
  19. Aydin, F.; Ayday, A.; Turan, M.E.; Zengin, H. ROle of graphene additive on wear and electrochemical corrosion behaviour of plasma electrolytic oxidation (PEO) coatings on Mg–MWCNT nanocomposite. Surf. Eng. 2019, 36, 791–799. [Google Scholar] [CrossRef]
  20. Chen, S.; Kang, C.; Wang, J.; Liu, C.; Sun, K. Synthesis of anodizing composite films containing superfine Al2O3 and PTFE particles on Al alloys. Appl. Surf. Sci. 2010, 256, 6518–6525. [Google Scholar] [CrossRef]
  21. Jin, R.; Fan, H.; Liu, Y.; Ma, W.; Lu, H.; Yang, P.; Ma, W. Formation Mechanism of Lotus-root-shaped Nanostructure during Two-step Anodization. Electrochim. Acta 2016, 188, 421–427. [Google Scholar] [CrossRef]
  22. Chen, S.; Liao, M.; Yang, P.; Yan, S.; Jin, R.; Zhu, X. Simulation of anodizing current–time curves and the morphology evolution of TiO2 nanotubes obtained in phosphoric electrolytes. RSC Adv. 2016, 6, 84309–84318. [Google Scholar] [CrossRef]
  23. Razzaq, A.M.; Majid, D.L.; Ishak, M.R.; Basheer, U.M. Mathematical Modeling and Analysis of Tribological Properties of AA6063 Aluminum Alloy Reinforced with Fly Ash by Using Response Surface Methodology. Crystals 2020, 10, 403. [Google Scholar] [CrossRef]
  24. Magibalan, S. Wear Behaviour of Aluminium Alloy 8011 with 4% Fly Ash Composites by Using Sensitivity Analysis. Alum. In Aluminium Alloys and Composites; IntechOpen: London, UK, 2020; Chapter 7. [Google Scholar]
  25. Niraj, N.; Pandey, K.M.; Dey, A. Tribological behaviour of Magnesium Metal Matrix Composites reinforced with fly ash cenosphere. Mater. Today Proc. 2018, 5, 20138–20144. [Google Scholar] [CrossRef]
  26. Sharma, V.K.; Singh, R.; Chaudhary, R. Effect of flyash particles with aluminium melt on the wear of aluminium metal matrix composites. Eng. Sci. Technol. Int. J. 2017, 20, 1318–1323. [Google Scholar] [CrossRef]
  27. Patil, N.A.; Pedapati, S.R.; Mamat, O.; Lubis, A.M.H.S. Effect of SiC/fly ash reinforcement on surface properties of aluminium 7075 hybrid composites. Coatings 2020, 10, 541. [Google Scholar] [CrossRef]
  28. Razzaq, A.M.; Majid, D.L.A.A.; Ishak, M.R.; Uday, M.B. Microstructural characterization of fly ash particulate reinforced AA6063 aluminium alloy for aerospace applications. IOP Conf. Ser. Mater. Sci. Eng. 2017, 270, 12028. [Google Scholar] [CrossRef] [Green Version]
  29. Shahzad, M.; Chaussumier, M.; Chieragatti, R.; Mabru, C.; Rezai-Aria, F. Surface characterization and in-fluence of anodizing process on fatigue life of Al 7050 alloy. Mater. Des. 2011, 32, 3328–3335. [Google Scholar] [CrossRef] [Green Version]
  30. Lee, W.; Park, S.-J. Porous Anodic Aluminum Oxide: Anodization and Templated Synthesis of Functional Nanostructures. Chem. Rev. 2014, 114, 7487–7556. [Google Scholar] [CrossRef]
  31. Lv, G.-H.; Chen, H.; Gu, W.C.; Li, L.; Niu, E.W.; Zhang, X.H.; Yang, S.Z. Effects of graphite additives in electrolytes on the microstructure and corrosion resistance of Alumina PEO coatings. Curr. Appl. Phys. 2009, 9, 324–328. [Google Scholar] [CrossRef]
  32. Mu, M.; Zhou, X.; Xiao, Q.; Liang, J.; Hou, X. Preparation and tribological properties of self-lubricating TiO2 /graphite composite coating on Ti6Al4V alloy. Appl. Surf. Sci. 2012, 258, 8570–8576. [Google Scholar] [CrossRef]
  33. Chen, Y.; Lu, X.; Blawert, C.; Zheludkevich, M.L.; Zhang, T.; Wang, F. Formation of self-lubricating PEO coating via in-situ incorporation of PTFE particles. Surf. Coat. Technol. 2018, 337, 379–388. [Google Scholar] [CrossRef]
  34. Kumar, K.A.R.; Balamurugan, K.; Gnanaraj, D. Hardness, tribology and microstructural studies on Aluminium-flyash metal matrix composites. J. Sci. Ind. Res. 2015, 74, 165–170. [Google Scholar]
  35. Wojciechowski, J.; Baraniak, M.; Pernak, J.; Lota, G. Nickel coatings electrodeposited from watts type baths containing quaternary ammonium sulphate salts. Int. J. Electrochem. Sci. 2017, 12, 3350–3360. [Google Scholar] [CrossRef]
  36. Shokouhfar, M.; Allahkaram, S.R. Effect of incorporation of nanoparticles with different composition on wear and corrosion behavior of ceramic coatings developed on pure titanium by micro arc oxidation. Surf. Coat. Technol. 2017, 309, 767–778. [Google Scholar] [CrossRef]
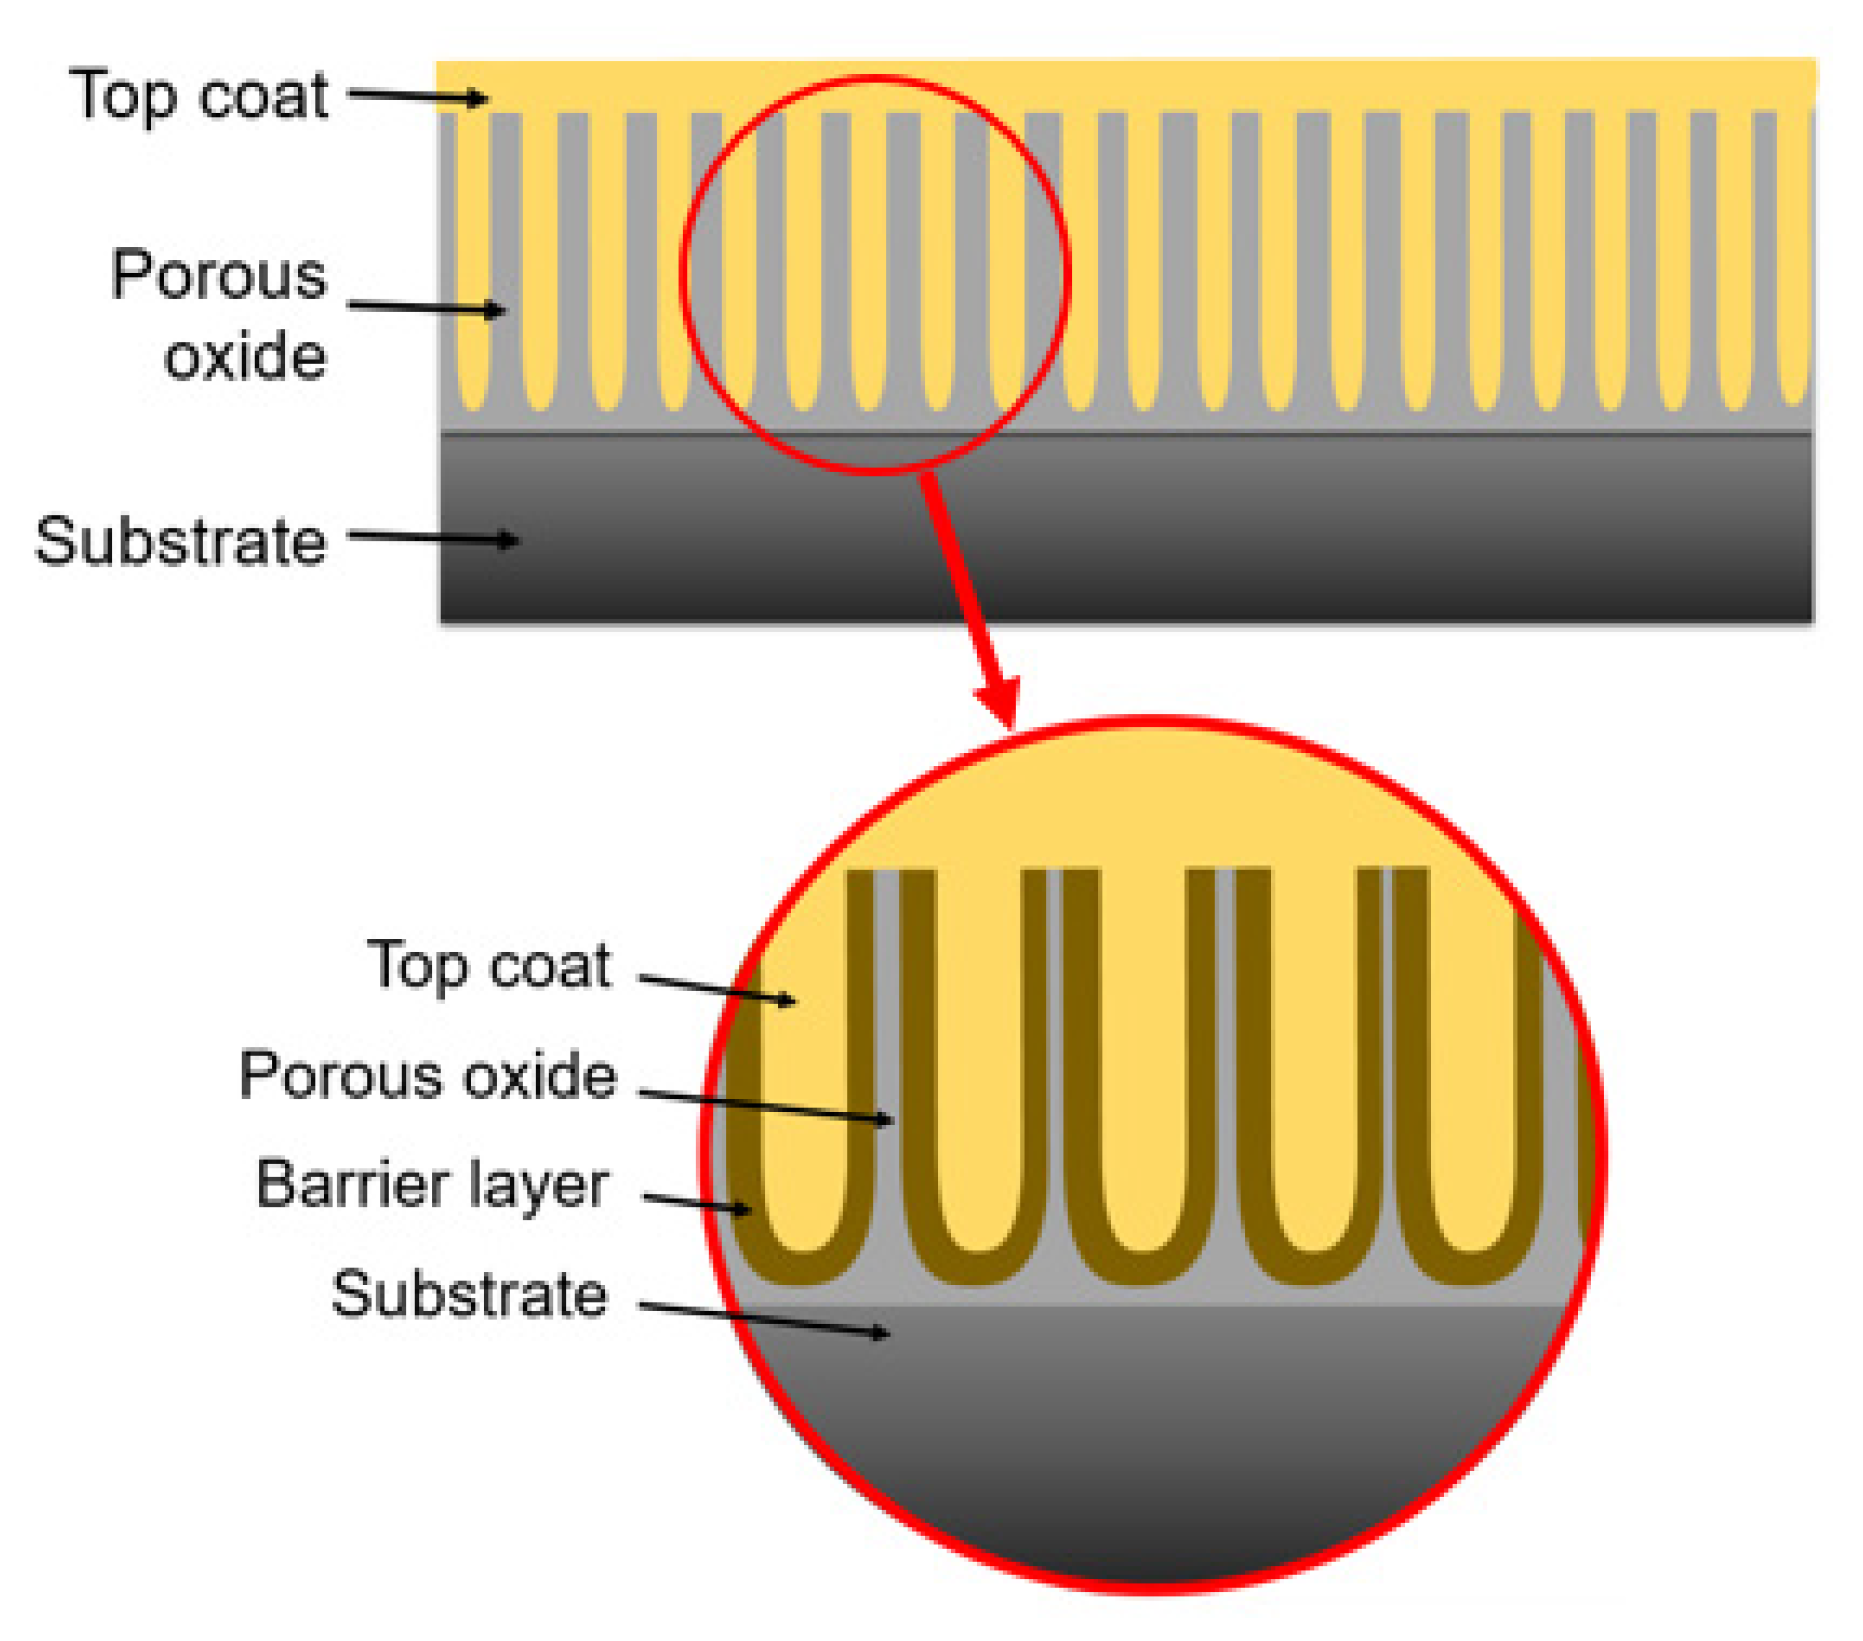
Figure 1. Illustration of typical corrosion protection system.
Coatings 12 00256 g001
Figure 2. SEM image of the as-received fly-ash.
Coatings 12 00256 g002
Figure 3. Schematic diagram of the hard anodizing set-up.
Coatings 12 00256 g003
Figure 4. Voltage and electrolyte temperature against time during anodizing.
Coatings 12 00256 g004
Figure 5. Growth mechanisms of oxide film formation with and without fly-ash.
Coatings 12 00256 g005
Figure 6. Surface morphologies of 1 g/L fly-ash composite oxide coating at (a,b) 5 min, (c,d) 10 min, (e,f) 20 min, (g,h) 30 min and (i,j) 60 min anodizing time.
Coatings 12 00256 g006
Figure 7. Cross section of composite oxide coating at (a) 5 min and (b) 60 min.
Coatings 12 00256 g007
Figure 8. Three-dimensional topography for (a) as-received aluminium alloy, (b) 5 min, (c) 10 min, (d) 20 min, (e) 30 min, and (f) 60 min of anodizing.
Coatings 12 00256 g008
Figure 9. Surface roughness of composite oxide coating at 5 to 60 min of anodizing time.
Coatings 12 00256 g009
Figure 10. Surface morphologies of composite oxide films at different fly-ash contents (at 60 min anodizing time): (a) 0 g/L, (b) 1 g/L, (c) 10 g/L, (d) 30 g/L and (e) 50 g/L.
Coatings 12 00256 g010
Figure 11. Cross-section of composite oxide coating for (a) 0 g/L and (b) 50 g/L.
Coatings 12 00256 g011
Figure 12. 3D images surface profiles of composite oxide films with different fly-ash contents: (a) as-received aluminium, (b) 0 g/L, (c) 1 g/L, (d) 10 g/L, (e) 30 g/L and (f) 50 g/L.
Coatings 12 00256 g012
Figure 13. (a) Surface roughness and (b) micro-hardness of the as-received and composite oxide-coated samples.
Coatings 12 00256 g013
Figure 14. Coefficient of friction for as-received and composite oxide coated aluminium alloy.
Coatings 12 00256 g014
Figure 15. Wear rate of as-received and anodized aluminium with different fly-ash contents.
Coatings 12 00256 g015
Figure 16. SEM analysis on wear track for (a) 0 g/L, (b) 1 g/L, (c) 10 g/L, (d) 30 g/L, and (e) 50 g/L of fly-ash.
Coatings 12 00256 g016
Table 1. Chemical composition of AA2017 alloy based on EDX analysis.
ElementComposition (%)
Al93.9
Cu3.96
Mn0.62
Mg0.58
Si0.53
Fe0.19
others0.22
Table 2. Mechanical properties of AA2017 alloy (obtained from supplier).
PropertiesValue
Tensile strength427 MPa
Yield strength276 MPa
Elongation22%
Hardness119 HV
Table 3. Chemical composition of fly-ash based on EDX analysis.
ElementComposition (%)
SiO244.1
Al2O319.1
CaO13.5
Fe2O312.4
MgO4.7
Na2O2.9
K2O1.4
SO31.0
others0.9
Table 4. Anodizing parameters.
PropertiesPhase 1Phase 2
CathodeAA2017
AnodeCopper sheet
Electrolyte20% H2SO4
Voltage (V)15
Current (A)2.0
Time (min)5, 10, 20, 30, 6060
Fly-ash content (g/L)10, 1, 10, 30, 50
Table 5. Chemical compositions of the composite oxide films containing 30 g/L fly-ash formed with different anodizing times.
PointWeight %
AlOSiFeMgNaK
A28.3251.6820.00----
B16.4734.28-37.6311.62--
C50.9049.10-----
D14.9639.2420.3321.451.69-2.32
E50.1849.82-----
F16.7233.941.4641.276.62--
G48.9251.08-----
H12.4740.6744.24-2.62--
I7.5365.3127.15----
Table 6. Chemical composition of fly-ash oxide films at different fly-ash contents.
PointWeight %
AlOCSi
A25.4653.6220.92-
B39.9940.0619.95-
C49.5043.986.52-
D26.5449.3818.6612.47
E23.0654.1110.3612.47
F-10.1021.8668.04
G11.0429.3721.8237.76
H15.1915.9911.6257.21
I32.5251.4812.673.33
J14.7640.5132.6112.13
K62.4312.908.058.79
L4.8624.9524.036.86
Publisher’s Note: MDPI stays neutral with regard to jurisdictional claims in published maps and institutional affiliations.