Article

Study on Phonon Localization in Silicon Film by Molecular Dynamics

School of Energy and Engineering, Harbin Institute of Technology, Harbin 150001, China
*
Author to whom correspondence should be addressed.
Coatings 2022, 12(4), 422; https://doi.org/10.3390/coatings12040422
Submission received: 24 February 2022 / Revised: 15 March 2022 / Accepted: 18 March 2022 / Published: 22 March 2022
(This article belongs to the Special Issue Semiconductor Thin Films: Fabrication, Properties and Applications)

Abstract

:
In recent years, nanoscale thermal cloaks have received extensive attention from researchers. Amorphization, perforation, and concave are commonly used methods for building nanoscale thermal cloaks. However, the comparison of the three methods and the effect of different structural proportions on phonon localization have not been found. Therefore, in this paper, an asymmetrical structure is constructed to study the influence of different structure proportions on phonon localization by amorphization, perforation, and concave silicon film. We first calculated the phonon density of states (PDOS) and the mode participation rate (MPR). To quantitatively explore its influence on phonon localization, we proposed the concept of the degree of phonon localization (DPL) and explored the influence of center and edge effects on phonon localization. We found that for different processing methods, the degree of phonon localization increased with the increase in the processing regions. Compared to the edge, the center had a stronger influence on phonon localization, and the higher the degree of disorder, the stronger the phonon localization. Our research can guide the construction of a nanoscale thermal cloak.

1. Introduction

Researchers have realized the manipulation and regulation of heat flux with the help of transformation thermotics [1] and thermal metamaterials. They have designed a thermal cloak [2,3,4,5,6,7,8,9], thermal rotator [8,10], thermal concentrator [11,12], thermal camouflage [7,13,14,15,16,17,18,19,20,21], thermal illusion [22,23,24,25], encrypted thermal printing [26], and so forth, and conducted experimental verification. Due to the miniaturization of electronic equipment and the damage to electronic equipment caused by high heat flux density, it is particularly important to study nanoscale heat flux control. Phonons are the carriers of heat transfer at the nanoscale and have the characteristics of wave–particle duality. At the nanoscale, thermal diodes [27,28,29,30], phonon Hall effect [31], and thermal rectifiers [32] have been designed. Nanoscale thermal cloaks have also been greatly developed. Ye et al. [33] designed a chemically functionalized thermal cloak based on graphene. Liu et al. [34] used the “melting–quenching” technique to transform crystalline silicon into amorphous silicon to build a thermal cloak. Choe et al. [35] designed an ion irradiation platform and observed the phenomenon of cloaking experimentally. In our previous research, we used the perforation [36] and concave [37] methods to build a thermal cloak and used phonon localization theory to explain its cloaking mechanism. A thermal cloak can protect the objects inside the functional region from the disturbance of the external temperature field. The thermal cloaking phenomenon occurs due to the reduced thermal conductivity of the functional region, hindering the transfer of heat flux, and the reason for the reduced thermal conductivity is due to the phonon localization in the functional region. Therefore, it is of great significance to study phonon localization in order to build a high-performance thermal cloak.
In addition, phonon localization theory also has important applications in other fields. In the related research on graphene, with the help of phonon localization theory, Loh et al. [38] found that phonon localization mainly affects long-wave and high-frequency modes, and Wang et al. [32] confirmed that graphene nanoribbons (GNR) are compared to bulk graphene with stronger phonon localization. Jiang et al. [39] found that the strong localization of low-frequency phonons induced by the backward short thermal contact resulted in obvious temperature transitions. Lu et al. [40] found that the intercalation caused by the hybrid mode has a local nature. In the study of heterostructures, with the help of phonon localization theory, Liang et al. [41] explored the internal mechanism of abnormal interfacial thermal conductance (ITC) changes at the interface of graphene and hexagonal boron nitride, and Wu et al. [42] explored the thermal conductivity of the semi-defect graphene/hexagonal boron nitride in-plane heterostructure interface based on topological defects. It was found that the phonon coupling on both sides of the interface and the phonon localization effect of the heterostructure determines the two keys of the heterostructure ITC factor. In other areas, Zhou et al. [43] used non-equilibrium molecular dynamics simulations to investigate the effect of antisite substitution on thermal conductivity and found that localization is the main cause of thermal conductivity reduction when the defect concentration is low; when the defect concentration is high, the main cause is phonon-defect scattering in all phonon modes.
The above-mentioned research has mainly focused on the phonon localization in different materials and the phonon localization of different interfaces, and no research was found on the influence of different structure ratios on the mode participation rate. Graphene, silicon carbide, and silicon film thermal cloaks were designed. Compared to the first two, silicon film is the most used in constructing thermal cloaks due to its application in electronic devices, so it was chosen for this study to investigate. To better understand the phonon localization phenomenon produced by the three structures, which can guide the development of nanoscale thermal cloak. In this study, to reduce the amount of calculation, we constructed an asymmetric structure to explore the influence of amorphous, perforated, and concave structures on phonon localization. First, we calculated the PDOS and MPR. Then, to quantitatively evaluate its impact on phonon localization, we proposed the concept of the degree of phonon localization (DPL). Finally, we explored the influence of the center and edge effects.

2. Theory and Methods

We used LAMMPS (version 3 March 2020) [44] to perform non-equilibrium molecular dynamics (NEMD) simulations. To perform molecular dynamics simulations, we needed to specify a potential to describe the interaction between atoms. In this study, we used the Tersoff potential that was optimized in 2016 [45], as follows:
E = i E i = 1 2 i j f C ( r i j ) [ f R ( r i j ) + b i j f A ( r i j ) ]
where E is the total energy, r is the atomic distance, fR is the repellent potential, fA is the attractive potential, fC is the cutoff potential, and b is the atomic bond order.
To reduce the computational effort, we built an asymmetric structure using crystalline silicon and divided the computational domain into the form of a nine-pattern grid, which was labeled according to the symmetry principle, as shown in Figure 1. The lattice constant of silicon is 5.431 Å, which is 20, 20, and 2 silicon unit cells (UC) in the x, y, and z directions, respectively. The nine-pattern grid region was processed by three methods, amorphization, perforation, and concave, but only one method was included in each calculation. Each block was 2 UC in length and width and was divided according to symmetry, with the center block 1 as a group, 2–5 as a group, and 6–9 as a group. The Nose–Hoover thermostats were used [46], as follows:
d d t p i = F i γ p i
d d t γ = 1 τ 2 [ T ( t ) T 0 1 ]
T ( t ) = 2 3 N k B i p i 2 2 m i
where p is the momentum, m is the mass, F is the force, i is the atomic label, and γ is the dynamics parameter, which was introduced by Hoover. τ is the relaxation time of the thermostat; in our simulation, τ = 100 ps. kB is the Boltzmann constant and N is the total number of atoms in the thermostat.
At the beginning of the simulation, all the atomic velocities were set to the corresponding values at 300 K, which obey the Maxwell–Boltzmann distribution. The time step was set at 1 fs. The periodic boundary was used in all three directions. First, the whole system was relaxed in the canonical (NVT) ensemble for 1000 ps. Next, the energy of the initial configuration was minimized. The minimization was stopped when all the components of force on atoms were less than 10−3 eV/Å. We referred to Ref. [47] to amorphize the crystalline silicon. The whole process includes heating, melting, and quenching. The temperature was first heated from 300 to 4000 K, and then maintained at 4000 K for a period to melt, and finally, quenched to 300 K quickly, at which time the crystalline silicon was transformed into amorphous silicon. The temperature variation of the functional region during the process is shown in Figure 2. We selected a typical processing scheme and presented the processed model, as shown in Figure 3. Finally, the whole system performed the energy minimization again, and in the micro-canonical (NVE) ensemble was simulated for 1000 ps.
To measure the influence of different structural proportions on phonon localization, the nine-pattern grid region was selected as the calculation domain, and the PDOS was first calculated. The PDOS can be described as follows:
PDOS ( ω ) = 1 N 2 π e i ω t j = 1 N v j ( 0 ) v j ( t ) d t
where j is the atomic label, ω is the phonon frequency, v is the atomic velocity vector, and N is the total number of atoms.
In addition, we further calculated the MPR [38,41], as follows:
MPR ( ω ) = 1 N [ i PDOS i ( ω ) 2 ] 2 i PDOS i ( ω ) 4
where PDOSi(ω) is the ith local phonon density of states based on Equation (5) and N is the total number of atoms in the computational domain.
To quantify the effect of the percentage of different structures on phonon localization, we calculated the average mode participation rate and its standard deviation. In addition, we defined a new index, the degree of phonon localization (DPL), which can be described as follows:
DPL = 1 N ( i N MPR i ( ω ) MPR ( ω ) ¯ ) 2 + MPR ( ω ) ¯
where MPRi(ω) is the mode participation ratio according to Equation (6), MPR ( ω ) ¯ is the average mode participation ratio, and N is the total number of calculated frequency points. The specific calculation process is shown in Figure 4.

3. Results and Discussions

Amorphization, perforation, and concave are three commonly used methods for building nanoscale thermal cloaks. In this section, we investigated the effects of varying the central and edge region amorphous structures, perforations, and concave percentages on phonon localization, respectively. A total of 10 simulations were performed for each method for the central region effect, and 13 simulations were performed for each method for the edge region effect.

3.1. Central Region Impact

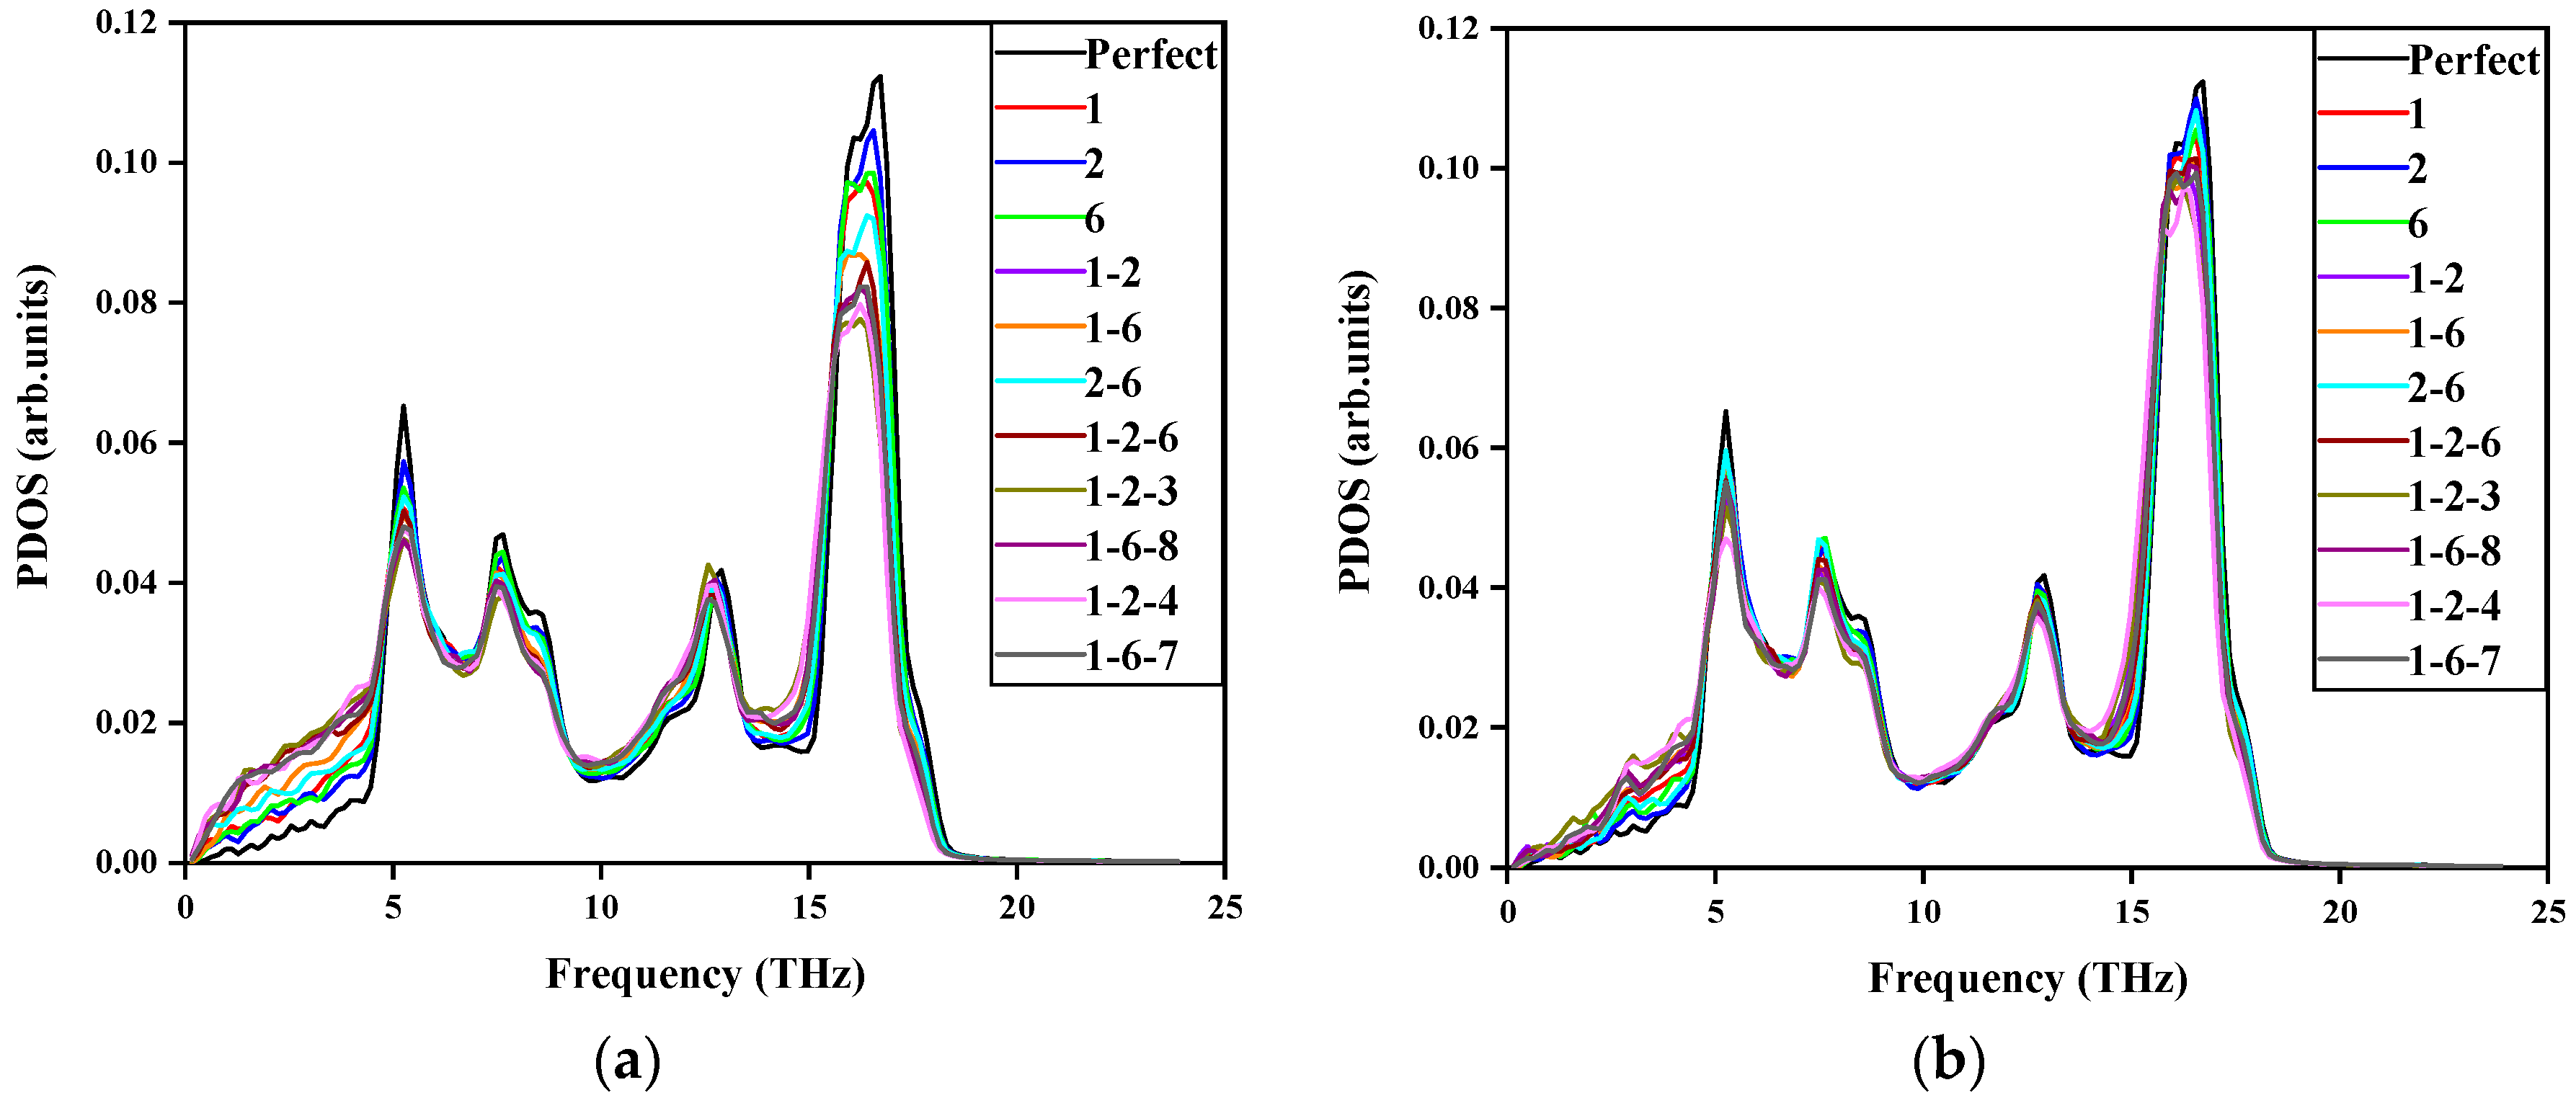
The PDOS distribution is shown in Figure 5. When the nine-grid area was entirely crystal, there was a strong and a weak peak at a low frequency of 5.5 THz and a high frequency of 17 THz respectively, which is in line with the previous research [48]. When the nine-pattern grid region was partially recessed, perforated, and amorphous, both the low-frequency peak and the high-frequency peak were reduced.
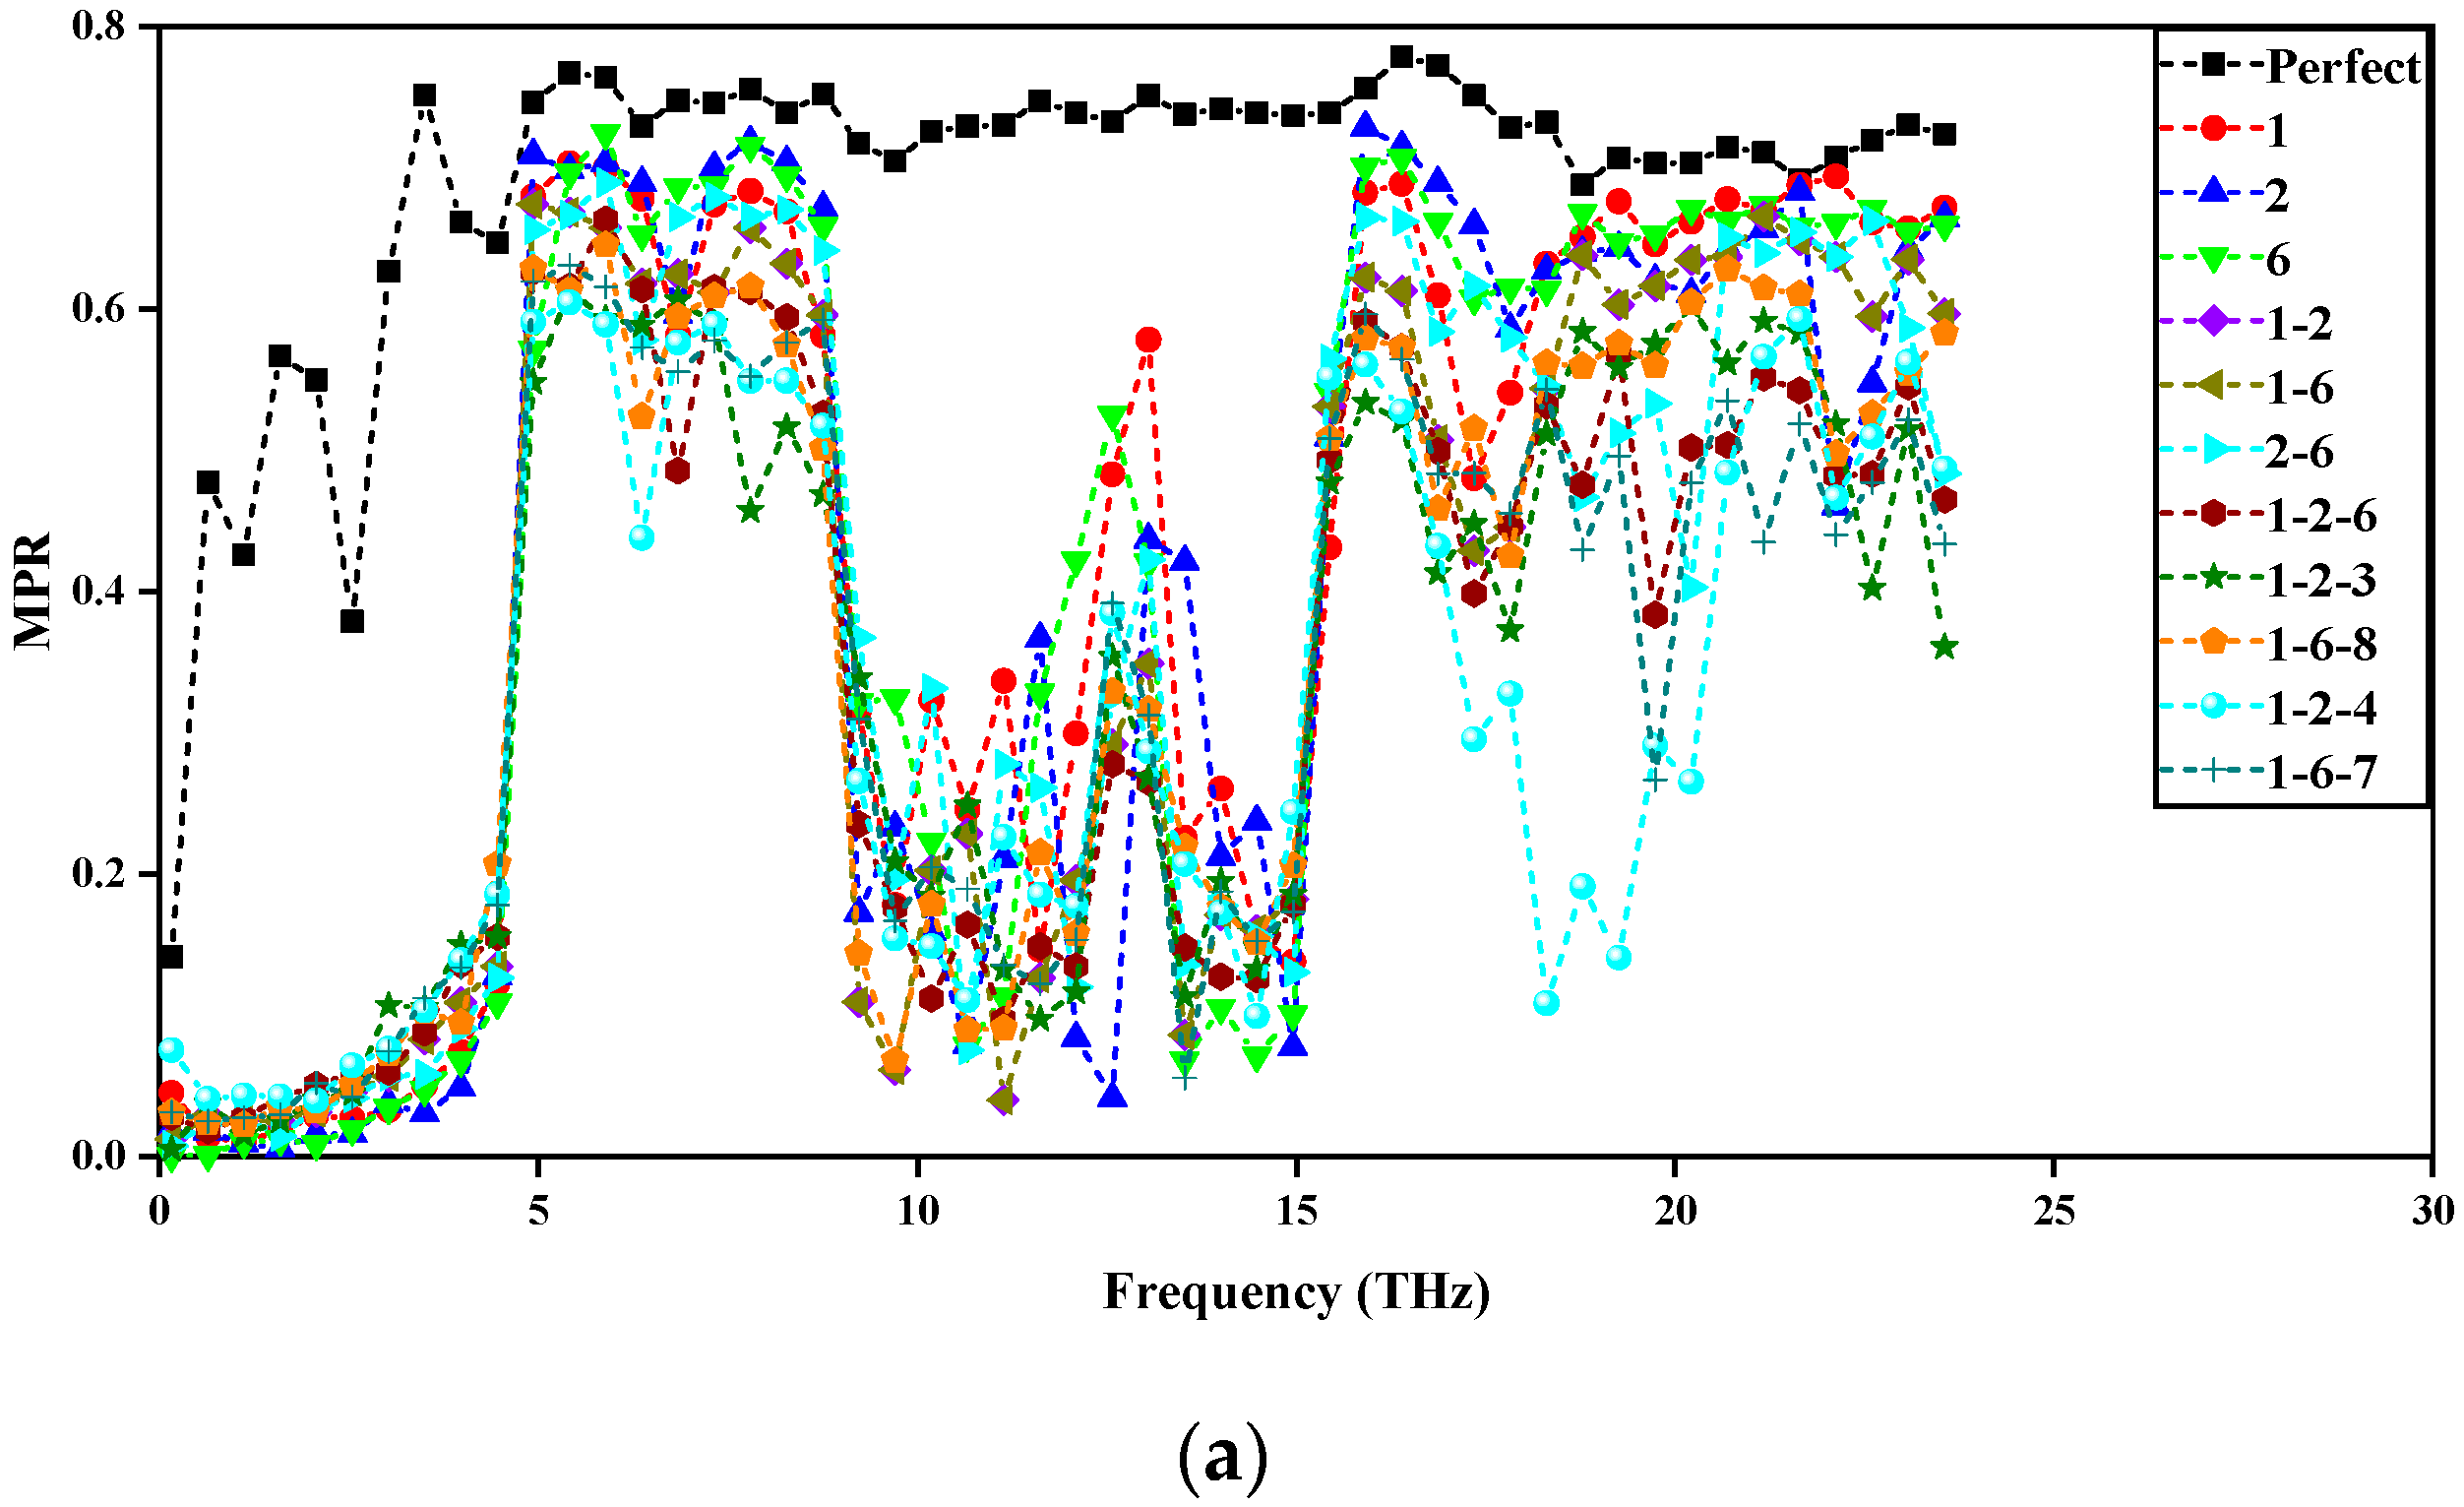
To distinguish the difference of the PDOS, we calculated the MPR, and the calculation result is shown in Figure 6. Compared to the crystal, the MPRs of all other structures were significantly lower. For crystals, the highest MPR was above 0.6, indicating that these phonon modes were decentralized. The MPR of the remaining structures was mostly lower than 0.6, which indicates phonon localization [49]. For partial concave, perforation, and amorphization, the MPR of amorphization was the smallest, followed by concave, and the MPR of perforations was the largest. This shows that compared to concave and perforation, amorphization produced the strongest phonon localization.
To better distinguish the phonon localization effect produced by different regions, we further calculated the degree of phonon localization (DPL). The calculation results are shown in Table 1. The smaller the MPR, the stronger the phonon localization and the smaller the thermal conductivity; a smaller standard deviation indicates that the MPR was more evenly distributed around the mean, so the smaller the DPL, the stronger the overall phonon localization. When the selected calculation blocks were equal, the amorphous structure had the greatest effect on phonon localization, the concave the second, and the perforation the smallest. With the increase in the number of selected small blocks, the overall trend of the DPL decreased. When the number of selected small blocks was equal, the more disorderly the arrangement of small blocks, and the smaller the DPL. The main reason is that amorphous surfaces are rougher than crystalline surfaces, and the rough surface produces phonon scattering, which ultimately reduces the mean free path of phonons. According to phonon wave interference theory [50], concave or perforation make each scattering point constitute a finite discontinuity in the host material, leading to a redistribution of phonon frequencies due to their induced interference with phonon waves, which in turn, affects the PDOS and, thus, the MPR.

3.2. Edge Region Impact

Similarly, we first calculated the PDOS, and the calculation results are shown in Figure 7. Compared to all crystals, after amorphization, perforation, and concave structure, the peaks at the low and high frequencies were reduced.
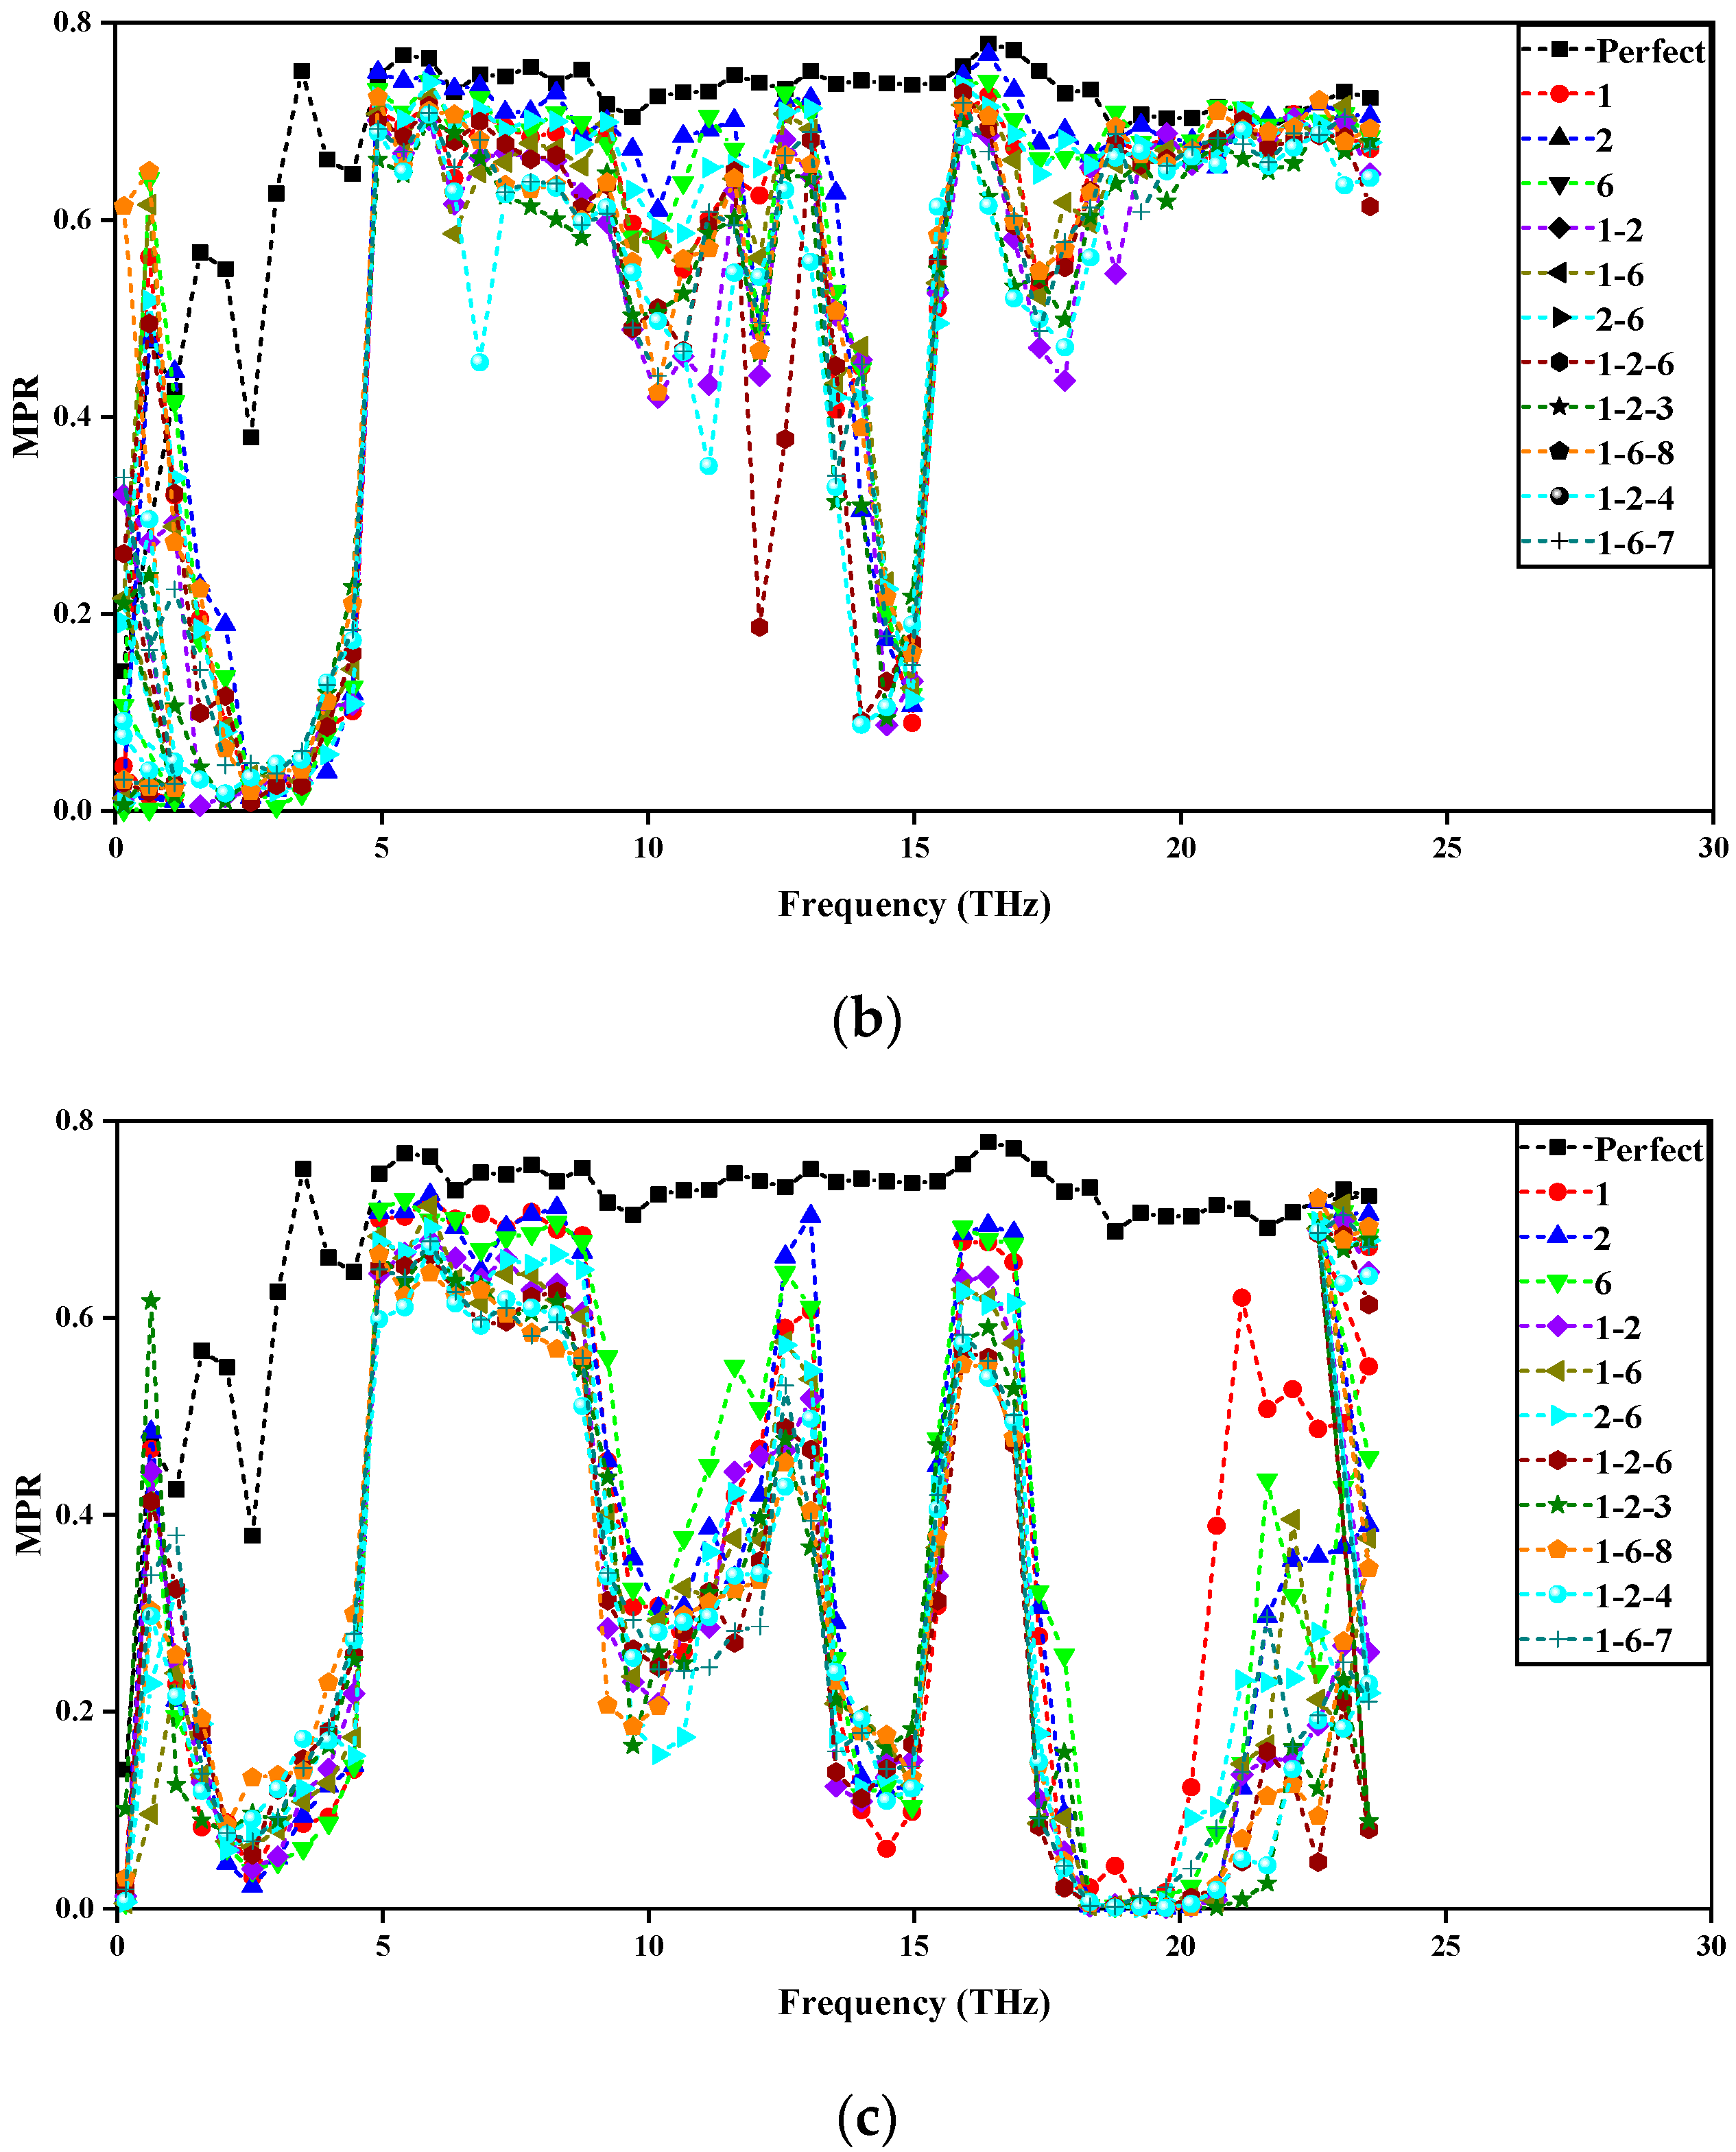
The results of the MPR calculation are shown in Figure 8. Similar to the center region, in the edge region, compared to the crystal, the MPRs of all other structures were reduced, and the MPR of amorphization was the smallest, followed by the concave, and the perforation was the largest. The conclusions are the same as the central region; compared to concave and perforation, the amorphization produced the strongest phonon localization.
Similarly, to study the phonon localization effect of different areas in the edge region, we calculated the degree of phonon localization (DPL). The calculation results are shown in Table 2. The conclusions are roughly the same as the central region. The DPL decreased as the number of small blocks increased. When the number of selected small blocks was equal, the more disordered the arrangement of small blocks, and the smaller the DPL.

3.3. Central/Edge Region Impact

To compare the effects of the central and edge regions on phonon localization, we calculated the average degree of phonon localization ( DPL ¯ ), as shown in Table 3.
With the increase in the number of blocks, the phonon localization was enhanced in the center and edge of the three methods; for all three methods, the amorphous produced the strongest phonon localization, the concave was the second strongest, and the perforation was the weakest. The center produced stronger phonon localization compared to the edge. This can be explained by phonon wave interference theory; the edge will prevent the transmission of phonon waves outside the computational domain to the computational domain, while the center will affect the transmission of phonon waves within the computational domain, and the impact produced at this time is greater, so the center produces stronger phonon localization compared to the edge.

3.4. Guidance for the Construction of Thermal Cloaks

For the thermal cloak, as a typical heat flux control device, the goal of the construction is to reduce the thermal conductivity of the functional region so that the heat flux bypasses the functional region while minimizing the disturbance of the external temperature field. Common construction methods include amorphization, perforation, and concave. This study compares the degrees of phonon localization of silicon films after these three methods and can provide a reference for the construction of a thermal cloak. For example, to obtain a thermal cloak with the best cloaking performance, the functional regions can all be amorphized. If the existence of a thermal cloak is to minimize the disturbance of the external temperature field, the functional regions could all be perforated. If we wanted to ensure both cloaking performance and a small disturbance of the thermal cloak to the external temperature field, we can combine the three methods and rationalize the different methods to deal with the different regions.

4. Conclusions

In summary, to study the effects of amorphization, perforation, and concave on phonon localization, we constructed an asymmetrical structure with nine-pattern grid regions. We divided the nine-pattern grid region according to the center and edge and calculated the PDOS, MPR, and DPL. For the central or edge region, as the number of small blocks increased, the PDOS peaked and the MPR decreased after the three methods were processed, which means that the phonon localization was enhanced. In addition, among the three methods, the phonon localization produced by amorphization was the strongest, followed by concave, and perforation was the weakest. Finally, by calculating the average degree of phonon localization (DPL), we explored the influence of the center and the edge on phonon localization. We found that, compared to the edge region, the central region produced stronger phonon localization, and the greater the degree of disorder, the greater the phonon localization. Since amorphization, perforation, and concave are universal methods, the phonon localization will be enhanced by these three methods, so the influence of different structural ratios on the phonon localization shown in the paper can be extended to other materials. Our research can provide guidance for the construction of a nanoscale thermal cloak.

Author Contributions

Conceptualization, J.Z. and H.Z.; methodology, J.Z.; software, J.Z.; validation, J.Z., Q.W. and W.S.; data curation, Q.W. and D.Z.; writing—original draft preparation, J.Z.; visualization, W.S. and D.Z.; supervision, H.Z. All authors have read and agreed to the published version of the manuscript.

Funding

This research was funded by the National Natural Science Foundation of China, Grant No. 51776050.

Institutional Review Board Statement

Not applicable.

Informed Consent Statement

Not applicable.

Data Availability Statement

The data presented in this study are available in this article.

Conflicts of Interest

The authors declare no conflict of interest.

References

  1. Fan, C.Z.; Gao, Y.; Huang, J.P. Shaped graded materials with an apparent negative thermal conductivity. Appl. Phys. Lett. 2008, 92, 251907. [Google Scholar] [CrossRef]
  2. Nguyen, D.M.; Xu, H.G.; Zhang, Y.M.; Zhang, B.L. Active thermal cloak. Appl. Phys. Lett. 2015, 107, 121901. [Google Scholar] [CrossRef]
  3. Han, T.C.; Bai, X.; Gao, D.L.; Thong, J.T.L.; Li, B.W.; Qiu, C.W. Experimental Demonstration of a Bilayer Thermal Cloak. Phys. Rev. Lett. 2014, 112, 054302. [Google Scholar] [CrossRef] [PubMed] [Green Version]
  4. Han, T.C.; Zhao, J.J.; Yuan, T.; Lei, D.Y.; Li, B.W.; Qiu, C.W. Theoretical realization of an ultra-efficient thermal-energy harvesting cell made of natural materials. Energy Environ. Sci. 2013, 6, 3537–3541. [Google Scholar] [CrossRef] [Green Version]
  5. Shen, X.Y.; Li, Y.; Jiang, C.R.; Ni, Y.S.; Huang, J.P. Thermal cloak-concentrator. Appl. Phys. Lett. 2016, 109, 031907. [Google Scholar] [CrossRef] [Green Version]
  6. Xu, H.Y.; Shi, X.H.; Gao, F.; Sun, H.D.; Zhang, B.L. Ultrathin three-dimensional thermal cloak. Phys. Rev. Lett. 2014, 112, 054301. [Google Scholar] [CrossRef]
  7. Yang, T.Z.; Bai, X.; Gao, D.L.; Wu, L.Z.; Li, B.W.; Thong, J.T.L.; Qiu, C.W. Invisible Sensors: Simultaneous Sensing and Camouflaging in Multiphysical Fields. Adv. Mater. 2015, 27, 7752–7758. [Google Scholar] [CrossRef] [Green Version]
  8. Zhou, L.L.; Huang, S.Y.; Wang, M.; Hu, R.; Luo, X.B. While rotating while cloaking. Phys. Lett. A 2019, 383, 759–763. [Google Scholar] [CrossRef]
  9. Zhu, Z.; Ren, X.C.; Sha, W.; Xiao, M.; Hu, R.; Luo, X.B. Inverse design of rotating metadevice for adaptive thermal cloaking. Int. J. Heat Mass Transf. 2021, 176, 121417. [Google Scholar] [CrossRef]
  10. Guenneau, S.; Amra, C. Anisotropic conductivity rotates heat fluxes in transient regimes. Opt. Express 2013, 21, 6578–6583. [Google Scholar] [CrossRef]
  11. Hu, R.; Wei, X.L.; Hu, J.Y.; Luo, X.B. Local heating realization by reverse thermal cloak. Sci. Rep. 2014, 4, 3600. [Google Scholar] [CrossRef] [Green Version]
  12. Yang, F.B.; Tian, B.Y.; Xu, L.J.; Huang, J.P. Experimental demonstration of thermal chameleonlike rotators with transformation-invariant metamaterials. Phys. Rev. Appl. 2020, 14, 054024. [Google Scholar] [CrossRef]
  13. Han, T.C.; Bai, X.; Thong, J.T.L.; Li, B.W.; Qiu, C.W. Full Control and Manipulation of Heat Signatures: Cloaking, Camouflage and Thermal Metamaterials. Adv. Mater. 2014, 26, 1731–1734. [Google Scholar] [CrossRef] [PubMed]
  14. Li, Y.; Bai, X.; Yang, T.Z.; Luo, H.L.; Qiu, C.W. Structured thermal surface for radiative camouflage. Nat. Commun. 2018, 9, 273. [Google Scholar] [CrossRef] [PubMed] [Green Version]
  15. Liu, Y.D.; Song, J.L.; Zhao, W.X.; Ren, X.C.; Cheng, Q.; Luo, X.B.; Fang, N.X.; Hu, R. Dynamic thermal camouflage via a liquid-crystal-based radiative metasurface. Nanophotonics 2020, 9, 855–863. [Google Scholar] [CrossRef] [Green Version]
  16. Qu, Y.R.; Li, Q.; Cai, L.; Pan, M.Y.; Ghosh, P.; Du, K.K.; Qiu, M. Thermal camouflage based on the phase-changing mate-rial GST. Light Sci. Appl. 2018, 7, 26. [Google Scholar] [CrossRef]
  17. Wang, J.; Bi, Y.Q.; Hou, Q.W. Three-dimensional illusion thermal device for location camouflage. Sci. Rep. 2017, 7, 7541. [Google Scholar] [CrossRef] [Green Version]
  18. Xu, L.J.; Wang, R.Z.; Huang, J.P. Camouflage thermotics: A cavity without disturbing heat signatures outside. J. Appl. Phys. 2018, 123, 245111. [Google Scholar] [CrossRef]
  19. Yang, T.Z.; Su, Y.S.; Xu, W.K.; Yang, X.D. Transient thermal camouflage and heat signature control. Appl. Phys. Lett. 2016, 109, 121905. [Google Scholar] [CrossRef]
  20. Song, J.L.; Huang, S.Y.; Ma, Y.P.; Cheng, Q.; Hu, R.; Luo, X.B. Radiative metasurface for thermal camouflage, illusion and messaging. Opt. Express 2020, 28, 875–885. [Google Scholar] [CrossRef]
  21. Hu, R.; Wang, X.; Liu, Y.D.; Song, J.L.; Luo, X.B.; Wu, J.Q.; Qiu, C.W. Thermal camouflaging metamaterials. Mater. Today 2021, 45, 120–141. [Google Scholar] [CrossRef]
  22. Alwakil, A.; Zerrad, M.; Bellieud, M.; Amra, C. Inverse heat mimicking of given objects. Sci. Rep. 2017, 7, 43288. [Google Scholar] [CrossRef] [PubMed]
  23. Hu, R.; Zhou, S.L.; Li, Y.; Lei, D.Y.; Luo, X.B.; Qiu, C.W. Illusion Thermotics. Adv. Mater. 2018, 30, 1707237. [Google Scholar] [CrossRef]
  24. Zhou, S.L.; Hu, R.; Luo, X.B. Thermal illusion with twinborn-like heat signatures. Int. J. Heat Mass Transf. 2018, 127, 607–613. [Google Scholar] [CrossRef]
  25. Zhu, N.Q.; Shen, X.Y.; Huang, J.P. Converting the patterns of local heat flux via thermal illusion device. AIP Adv. 2015, 5, 053401. [Google Scholar] [CrossRef]
  26. Hu, R.; Huang, S.Y.; Wang, M.; Luo, X.B.; Shiomi, J.; Qiu, C.W. Encrypted Thermal Printing with Regionalization Transformation. Adv. Mater. 2019, 31, 1807849. [Google Scholar] [CrossRef]
  27. Hu, J.N.; Ruan, X.L.; Chen, Y.P. Molecular Dynamics Study of Thermal Rectification in Graphene Nanoribbons. Int. J. Thermophys. 2012, 33, 986–991. [Google Scholar] [CrossRef]
  28. Li, Y.; Shen, X.Y.; Wu, Z.H.; Huang, J.Y.; Chen, Y.X.; Ni, Y.S.; Huang, J.P. Temperature-dependent transformation thermotics: From switchable thermal cloaks to macroscopic thermal diodes. Phys. Rev. Lett. 2015, 115, 195503. [Google Scholar] [CrossRef]
  29. Tian, H.; Xie, D.; Yang, Y.; Ren, T.L.; Zhang, G.; Wang, Y.F.; Zhou, C.J.; Peng, P.G.; Wang, L.G.; Liu, L.T. A Novel Solid-State Thermal Rectifier Based on Reduced Graphene Oxide. Sci. Rep. 2012, 2, 523. [Google Scholar] [CrossRef]
  30. Wang, S.; Cottrill, A.L.; Kunai, Y.; Toland, A.R.; Liu, P.W.; Wang, W.J.; Strano, M.S. Microscale solid-state thermal diodes enabling ambient temperature thermal circuits for energy applications. Phys. Chem. Chem. Phys. 2017, 19, 13172–13181. [Google Scholar] [CrossRef]
  31. Qin, T.; Zhou, J.H.; Shi, J.R. Berry curvature and the phonon Hall effect. Phys. Rev. B 2012, 86, 104305. [Google Scholar] [CrossRef] [Green Version]
  32. Wang, Y.; Vallabhaneni, A.; Hu, J.N.; Qiu, B.; Chen, Y.P.; Ruan, X.L. Phonon Lateral Confinement Enables Thermal Rectification in Asymmetric Single-Material Nanostructures. Nano Lett. 2014, 14, 592–596. [Google Scholar] [CrossRef] [Green Version]
  33. Ye, Z.Q.; Cao, B.Y. Nanoscale thermal cloaking in graphene via chemical functionalization. Phys. Chem. Chem. Phys. 2016, 18, 32952–32961. [Google Scholar] [CrossRef] [PubMed]
  34. Liu, Y.D.; Cheng, Y.H.; Hu, R.; Luo, X.B. Nanoscale thermal cloaking by in-situ annealing silicon membrane. Phys. Lett. A 2019, 383, 2296–2301. [Google Scholar] [CrossRef]
  35. Choe, H.S.; Prabhakar, R.; Wehmeyer, G.; Allen, F.; Lee, W.; Jin, L.; Li, Y.; Yang, P.D.; Qiu, C.W.; Dames, C.; et al. Ion Write Microthermotics: Programing Thermal Metamaterials at the Microscale. Nano Lett. 2019, 19, 3830–3837. [Google Scholar] [CrossRef] [PubMed] [Green Version]
  36. Zhang, J.; Zhang, H.C.; Li, Y.Y.; Zhang, D.; Wang, H.M. Numerical analysis on nanoscale thermal cloak in three-dimensional silicon film with circular cavities. Numer. Heat TR A-Appl. 2022, 81, 1–14. [Google Scholar] [CrossRef]
  37. Zhang, J.; Zhang, H.C.; Wang, H.M.; Xu, C.Z.; Wang, Q. Performance prediction of nanoscale thermal cloak by molecular dynamics. Appl. Phys. A-Mater. 2021, 127, 790. [Google Scholar] [CrossRef]
  38. Loh, G.C.; Teo, E.H.T.; Tay, B.K. Phononic and structural response to strain in wurtzite-gallium nitride nanowires. J. Appl. Phys. 2012, 111, 103506. [Google Scholar] [CrossRef]
  39. Jiang, P.F.; Hu, S.Q.; Ouyang, Y.L.; Ren, W.J.; Ren, C.Q.; Zhang, Z.W.; Chen, J. Remarkable thermal rectification in pristine and symmetric monolayer graphene enabled by asymmetric thermal contact. J. Appl. Phys. 2020, 127, 235101. [Google Scholar] [CrossRef]
  40. Lu, S.; Ouyang, Y.L.; Yu, C.Q.; Jiang, P.F.; He, J.; Chen, J. Tunable phononic thermal transport in two-dimensional C6CaC6 via guest atom intercalation. J. Appl. Phys. 2021, 129, 225106. [Google Scholar] [CrossRef]
  41. Liang, T.; Zhou, M.; Zhang, P.; Yuan, P.; Yang, D.G. Multilayer in-plane graphene/hexagonal boron nitride heterostructures: Insights into the interfacial thermal transport properties. Int. J. Heat Mass Transf. 2020, 151, 119395. [Google Scholar] [CrossRef]
  42. Wu, X.; Han, Q. Thermal transport in pristine and defective two-dimensional polyaniline (C3N). Int. J. Heat Mass Transf. 2021, 173, 121235. [Google Scholar] [CrossRef]
  43. Zhou, M.; Liang, T.; Wu, B.Y.; Liu, J.J.; Zhang, P. Phonon transport in antisite-substituted hexagonal boron nitride nanosheets: A molecular dynamics study. J. Appl. Phys. 2020, 128, 234304. [Google Scholar] [CrossRef]
  44. Plimpton, S. Fast Parallel Algorithms for Short-Range Molecular Dynamics. J. Comput. Phys. 1995, 117, 1–19. [Google Scholar] [CrossRef] [Green Version]
  45. Tersoff, J. Modeling solid-state chemistry: Interatomic potentials for multicomponent systems. Phys. Rev. B. 1989, 39, 5566–5568. [Google Scholar] [CrossRef]
  46. Berendsen, H.J.C.; Postma, J.P.M.; van Gunsteren, W.F.; DiNola, A.; Haak, J.R. Molecular dynamics with coupling to an external bath. J. Chem. Phys. 1984, 81, 3684–3690. [Google Scholar] [CrossRef] [Green Version]
  47. Yang, L.N.; Latour, B.; Minnich, A.J. Phonon transmission at crystalline-amorphous interfaces studied using mode-resolved atomistic Green’s functions. Phys. Rev. B. 2018, 97, 205306. [Google Scholar] [CrossRef] [Green Version]
  48. Li, H.P.; Zhang, R.Q. Anomalous effect of hydrogenation on phonon thermal conductivity in thin silicon nanowires. EPL 2014, 105, 56003. [Google Scholar] [CrossRef]
  49. Ma, D.K.; Ding, H.R.; Meng, H.; Feng, L.; Wu, Y.; Shiomi, J.; Yang, N. Nano-cross-junction effect on phonon transport in silicon nanowire cages. Phys. Rev. B 2016, 94, 165434. [Google Scholar] [CrossRef] [Green Version]
  50. Banerjee, D.; Vizuete, O.; Ranjan, H.; Pal, S.; Zhang, Z.B. The control of thermal conductivity through coherent and incoherent phonon scattering in 2-dimensional phononic crystals by incorporating elements of self-similarity. Appl. Phys. Lett. 2019, 115, 213903. [Google Scholar] [CrossRef]
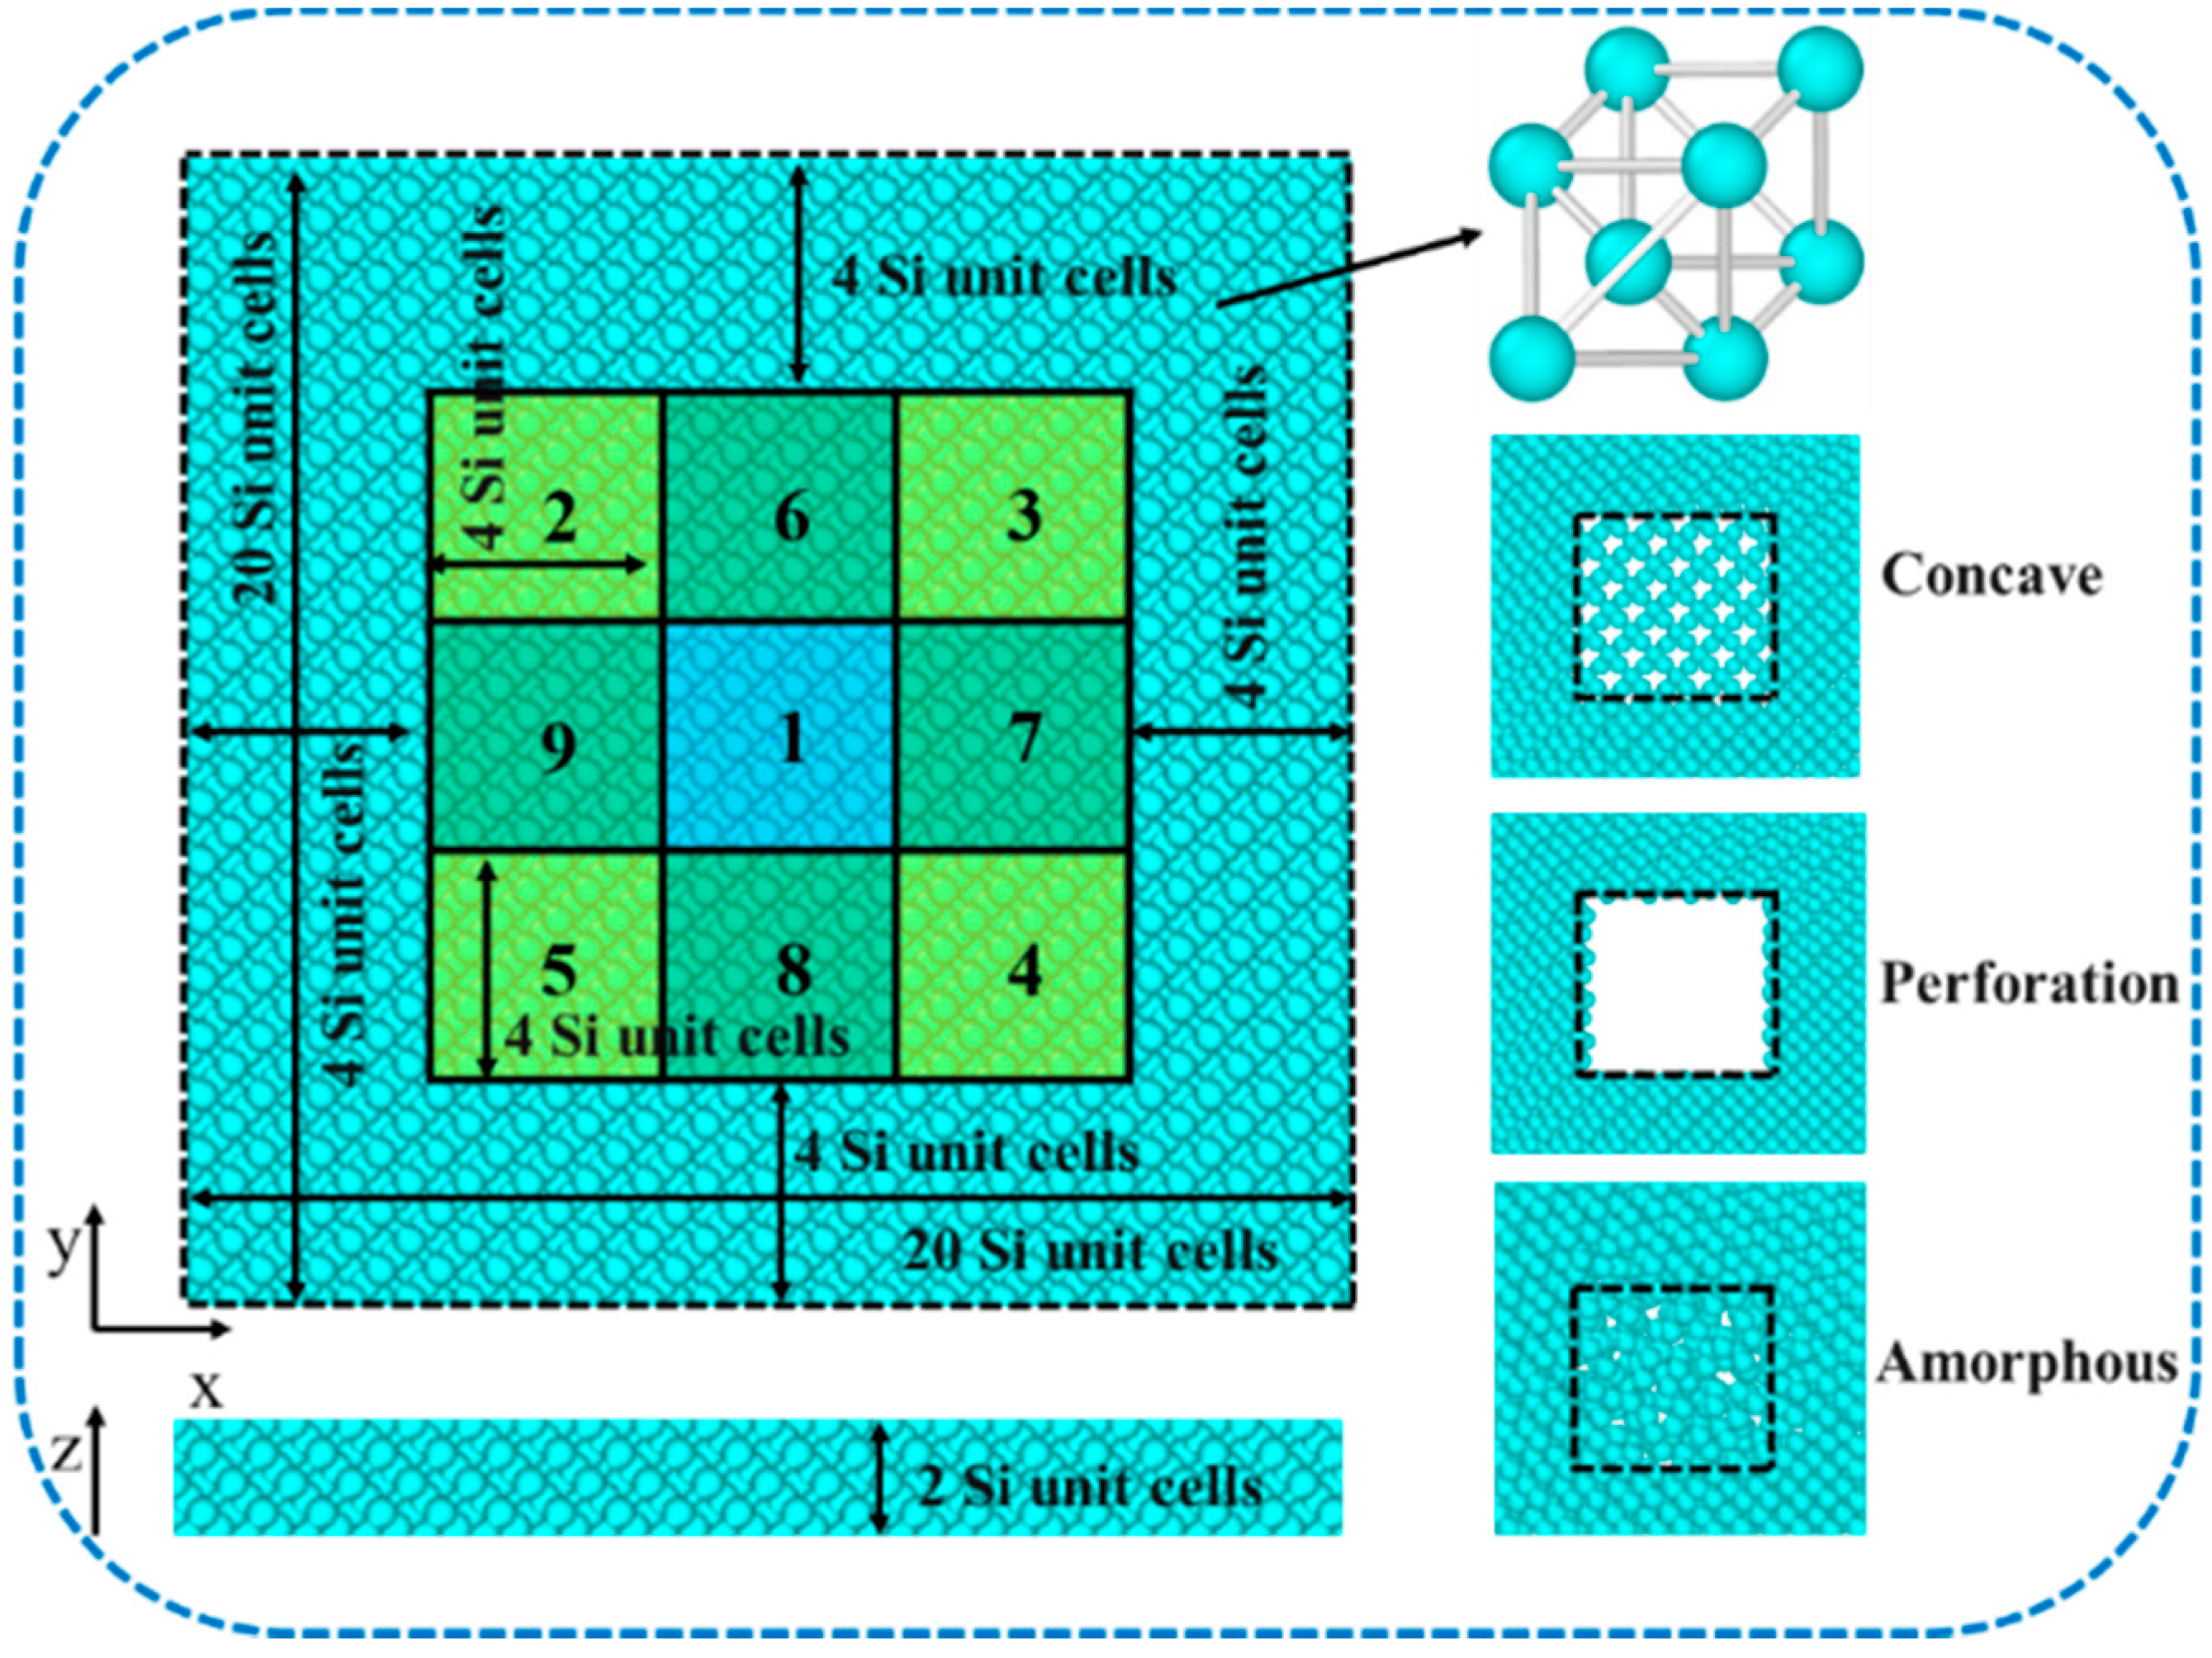
Figure 1. Schematic diagram of the calculation model.
Coatings 12 00422 g001
Figure 2. Temperature variation during annealing in the cloaking region.
Coatings 12 00422 g002
Figure 3. The processed model (2-3-4): (a) perforation; (b) concave; (c) amorphous.
Coatings 12 00422 g003
Figure 4. Calculation flow chart.
Coatings 12 00422 g004
Figure 5. PDOS: (a) concave; (b) perforation; (c) amorphous. The numbers represent small block labels.
Coatings 12 00422 g005aCoatings 12 00422 g005b
Figure 6. MPR: (a) concave; (b) perforation; (c) amorphous. The numbers represent small block labels. The calculation results are discrete frequency points. To better display the results, the frequency points are connected by dotted lines.
Coatings 12 00422 g006aCoatings 12 00422 g006b
Figure 7. PDOS: (a) concave; (b) perforation; (c) amorphous. The numbers represent small block labels.
Coatings 12 00422 g007
Figure 8. MPR: (a) concave; (b) perforation; (c) amorphous. The numbers represent small block labels. The calculation results are discrete frequency points. To better display the results, the frequency points are connected by dotted lines.
Coatings 12 00422 g008
Table 1. MPR ( ω ) ¯ and DPL in the same region with different structures.
Calculation
Region
MPR ( ω ) ¯ DPL
ConcavePerforationAmorphousConcavePerforationAmorphous
0-0.7020.272-0.9840.497
10.4350.5330.3640.6910.7860.626
1-20.3860.4940.2930.6390.7280.561
1-60.3860.5330.2990.6390.7750.566
2-60.4040.5470.3110.6510.8070.570
1-2-60.3430.5010.2770.5760.7430.542
1-2-30.3520.4860.2960.5730.7130.565
1-2-40.3220.4700.2780.5500.6990.541
1-6-70.3440.5040.2860.5670.7320.538
1-6-80.3690.5300.2830.6030.7640.538
Table 2. MPR ( ω ) ¯ and DPL in the same region with different structures.
Calculation
Region
MPR ( ω ) ¯ DPL
ConcavePerforationAmorphousConcavePerforationAmorphous
20.4190.5610.3540.6880.8310.613
60.4290.5540.3890.7040.8170.624
2-60.4040.5470.3060.6510.8070.583
2-70.3850.5190.2940.6340.7590.562
2-30.4120.5390.3280.6540.7860.581
2-40.4120.5420.3160.6540.7890.570
2-3-60.3710.5530.2970.6060.8110.558
2-6-70.3700.4700.2750.6030.6960.544
2-6-40.3700.5300.2830.6020.7660.555
2-3-70.3650.5100.2900.5920.7440.539
2-3-40.2870.5010.2700.5420.7180.543
2-7-80.3520.4950.2820.5680.7150.539
2-8-50.3590.5230.2880.5890.7550.550
Table 3. DPL ¯ at the center and edge when the selected number of blocks by different methods is equal.
Number of BlocksConcavePerforationAmorphous
CenterEdgeCenterEdgeCenterEdge
10.6910.6960.7860.8240.6260.619
20.6430.6480.7700.7850.5660.574
30.5740.5860.7300.7440.5450.547
Publisher’s Note: MDPI stays neutral with regard to jurisdictional claims in published maps and institutional affiliations.