Article

Mesoscale Simulation and Evaluation of the Mechanical Properties of Ceramic Seal Coatings

1
School of Materials Science and Engineering, Northeastern University, Shenyang 110819, China
2
BGRIMM Technology Group, Beijing 100160, China
3
China Iron & Steel Research Institute Group, Beijing 100081, China
4
Xi’an SIMU Intelligent Technology Co., Ltd., Xi’an 710000, China
*
Author to whom correspondence should be addressed.
Coatings 2022, 12(4), 438; https://doi.org/10.3390/coatings12040438
Submission received: 27 February 2022 / Revised: 20 March 2022 / Accepted: 23 March 2022 / Published: 24 March 2022

Abstract

:
Microstructure feature extraction and performance simulations of a Yttria-Stabilized Zirconia (YSZ) abradable coating applied in the high-pressure turbines of aero-engines, with a service temperature over 1000 °C were conducted. The finite element method (FEM) numerical models of the abradability, bonding strength, and thermal shock resistance of the YSZ coating were established. The effects of porosity and pore diameter on the properties of the coating were obtained through simulations and calculations. The results indicated that the abradability, bonding strength, and thermal shock resistance of the coating were jointly determined by porosity and pore diameter. With the porosity increasing from 5% to 50%, the bonding strength of the coating decreased gradually, but the abradability and thermal shock resistance of the coating were significantly improved, especially when the porosity was above 20%. With the pore diameter increased from 0.5 μm to 1.5 μm, the abradability, bonding strength, and thermal shock resistance of the coating increased initially, and then decreased. An evaluation function using the normalized weighting strategy was proposed to characterize the comprehensive properties of the coating. The results of the evaluation showed the optimal abradability, bonding strength, and thermal shock resistance of the coating were obtained under a combination of 25% porosity and 1 μm pore diameter. This study may provide guidance for design optimization, and an improvement in the microstructure and properties of coatings in future research.

1. Introduction

The development of aero-engines towards higher thrust, and thrust-weight ratios has caused the turbine inlet temperature to exceed 1000 °C. Thus, it is challenging to apply abradable seal coatings to high-pressure turbines to meet such high-temperature application requirements. Due to their poor high-temperature oxidation resistance, metal-based seal coatings face severe problems, such as sinter hardening and peeling off [1,2,3]. Ceramic seal coatings have been selected as the primary technical solution for the outer rings of high-pressure turbines [4,5,6]. The ceramic seal coating is composed of pores and ceramic phases. A considerable number of pores ensure effective abradability of the coating, while the ceramic phase provides the other required properties of high melting point, phase stability, oxidation, and corrosion resistance. Yttria-Stabilized Zirconia (YSZ) ceramic is the preferred material for abradable coatings due to its low thermal conductivity, low thermal expansion coefficient, and high melting point, as well as its excellent comprehensive mechanical properties [7]. Some studies have reported the preparation and characterization of YSZ coatings [8,9,10,11,12,13,14,15]. Atmospheric plasma spraying (APS) is one of the promising methods of preparing YSZ coating. The porosity and pore size of the coating can be flexibly changed by adjusting the process parameters of APS (such as spraying power, current, and spraying distance), which affects the performance of the YSZ coating. However, the ceramic phase in the coating has the same crystal structure, which does not depend on the spraying conditions. X-ray diffraction analysis and Raman spectrum show that the coating is mainly composed of tetragonal zirconia, which is stabilized by yttria, and the thermal cycle does not seem to affect the phase composition of the coating [13,14,15,16,17].
Due to the progress in numerical simulation techniques in recent years, many researchers have used them to investigate seal coating. Through the analog simulation of seal-coating scraping procedures by a blade, the effects of rotational frequency and other factors on the wear performance of a coating were analyzed [18]. The blade dynamics and abradable behavior during contact with a stator were captured by establishing a wear mechanism for abradable coatings, and carrying out full-scale parametric simulations [19]. Jiang simulated the wear behavior of coatings during cutting and showed that the contact force between a lathe tool and coating was a key research index of this process for analyzing the wear behavior of the tool during cutting [20]. A finite element model (FEM) comprehensively integrating the particle morphology, distribution, fracture, matrix deformation, failure, and particle-matrix debonding was developed by Wu to simulate material fracture caused by stretching-induced crack formation, and propagation [21]. Moreover, Li used Python and a FEM to simulate the repeating unit cell of a composite microstructure with random fibers and irregular voids to analyze the effect of irregular voids on the tensile strength [22]. Limarga used thermal cycling tests and finite element computations to investigate the residual stress distribution in plasma-sprayed zirconia thermal barrier coatings, and pointed out that a sudden drop in the coating’s surface temperature led to large tensile stress at the surface [23].
Previous research mainly focused on the preparation technologies and properties of the coatings, while few works conducted a comprehensive study for the correlation of the pore structure of the coating with its mechanical behaviors. Numerical models can be used to investigate the structures and properties of seal coatings. By predicting a coating’s performance, certain guidelines can be obtained to design pore structures, which may help regulate and improve a composite’s properties, and reduce time consumption and relevant costs. In this article, a mesoscale pore structure model was built for YSZ coatings with different pore characteristics based on the FEM. Simulations were also employed to explore the effects of porosity and pore diameter on the coating’s abradability, bonding strength, and thermal shock resistance. Furthermore, an evaluation function was proposed to study the comprehensive properties of ceramic coatings to determine the optimal mesostructure of the coating.

2. Model Construction and Analysis

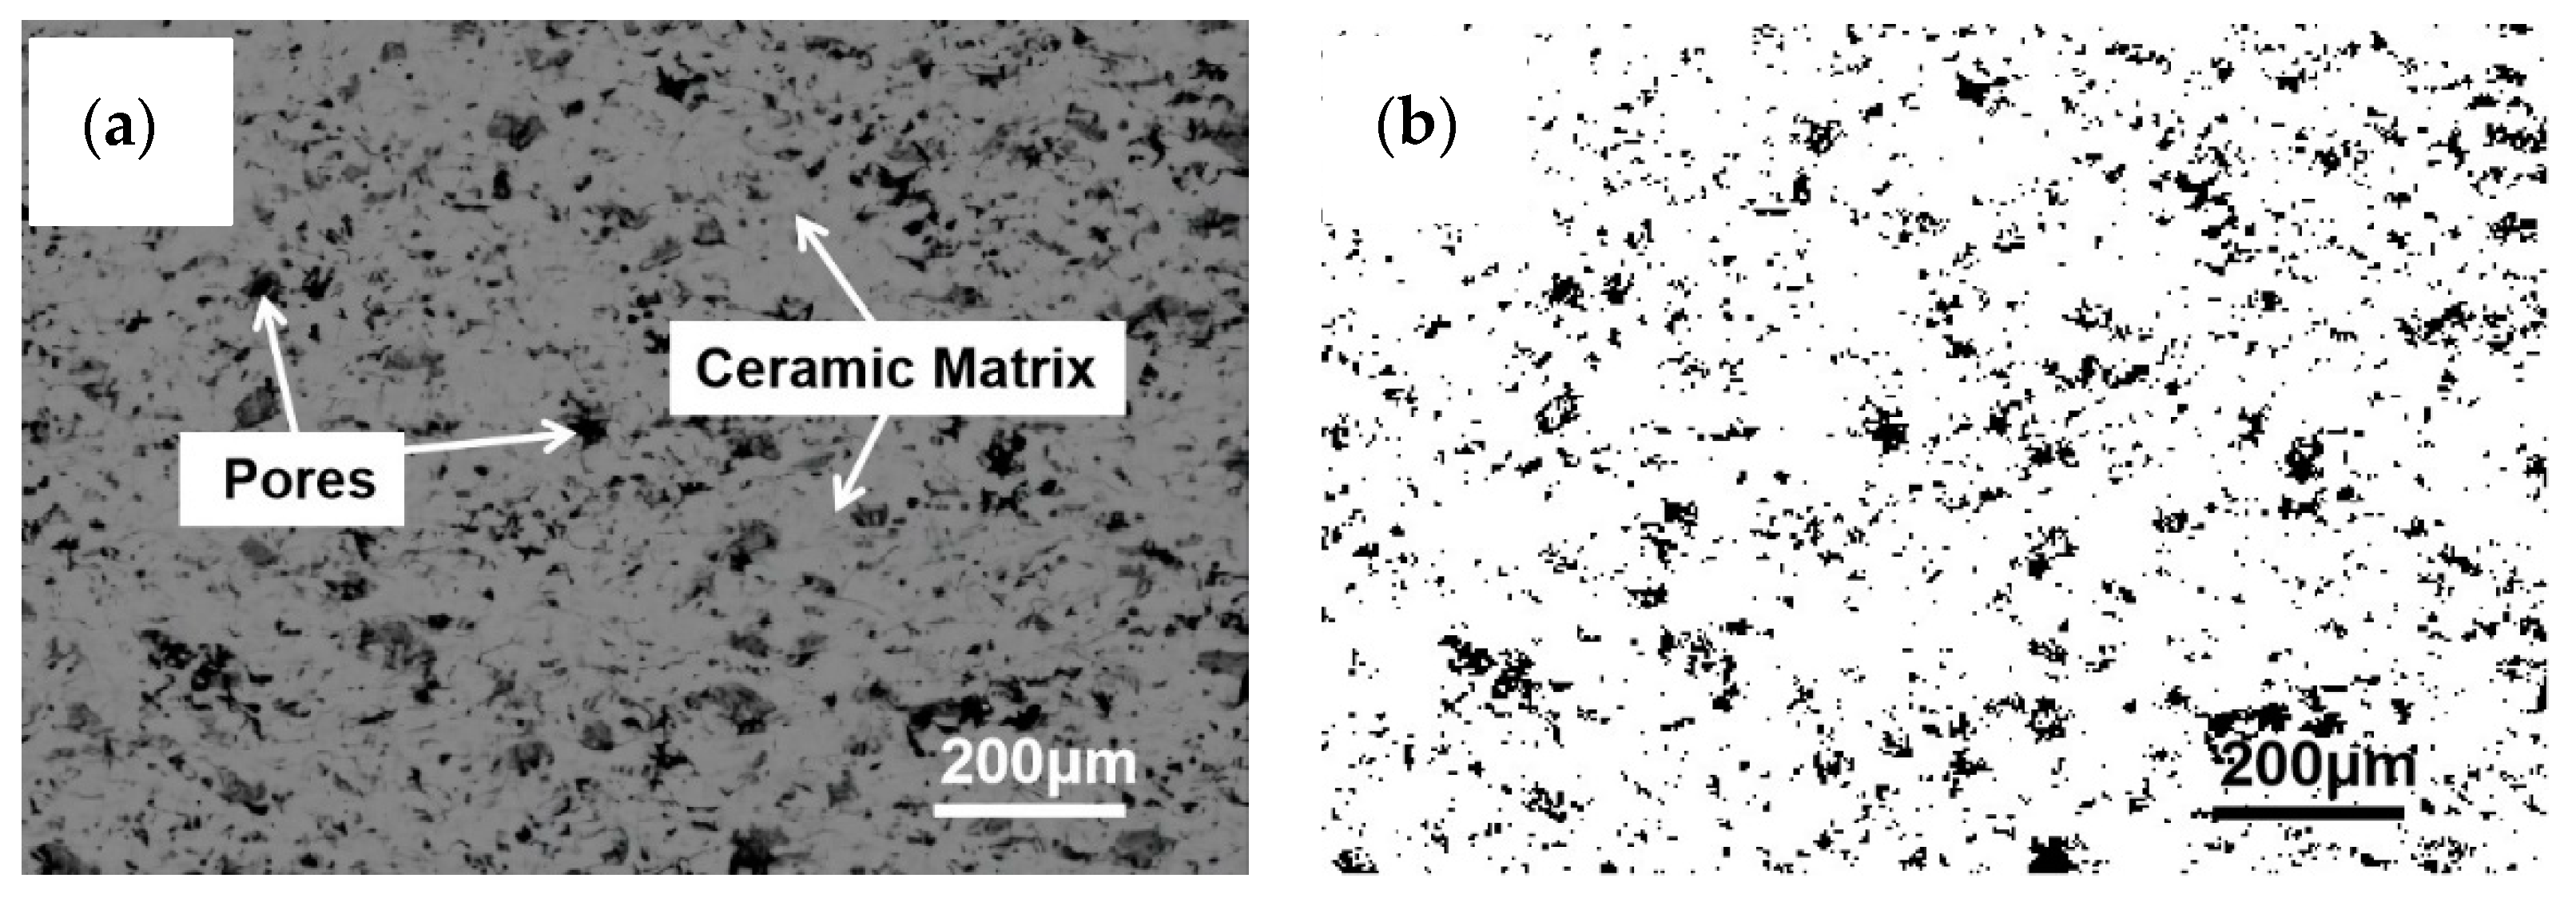
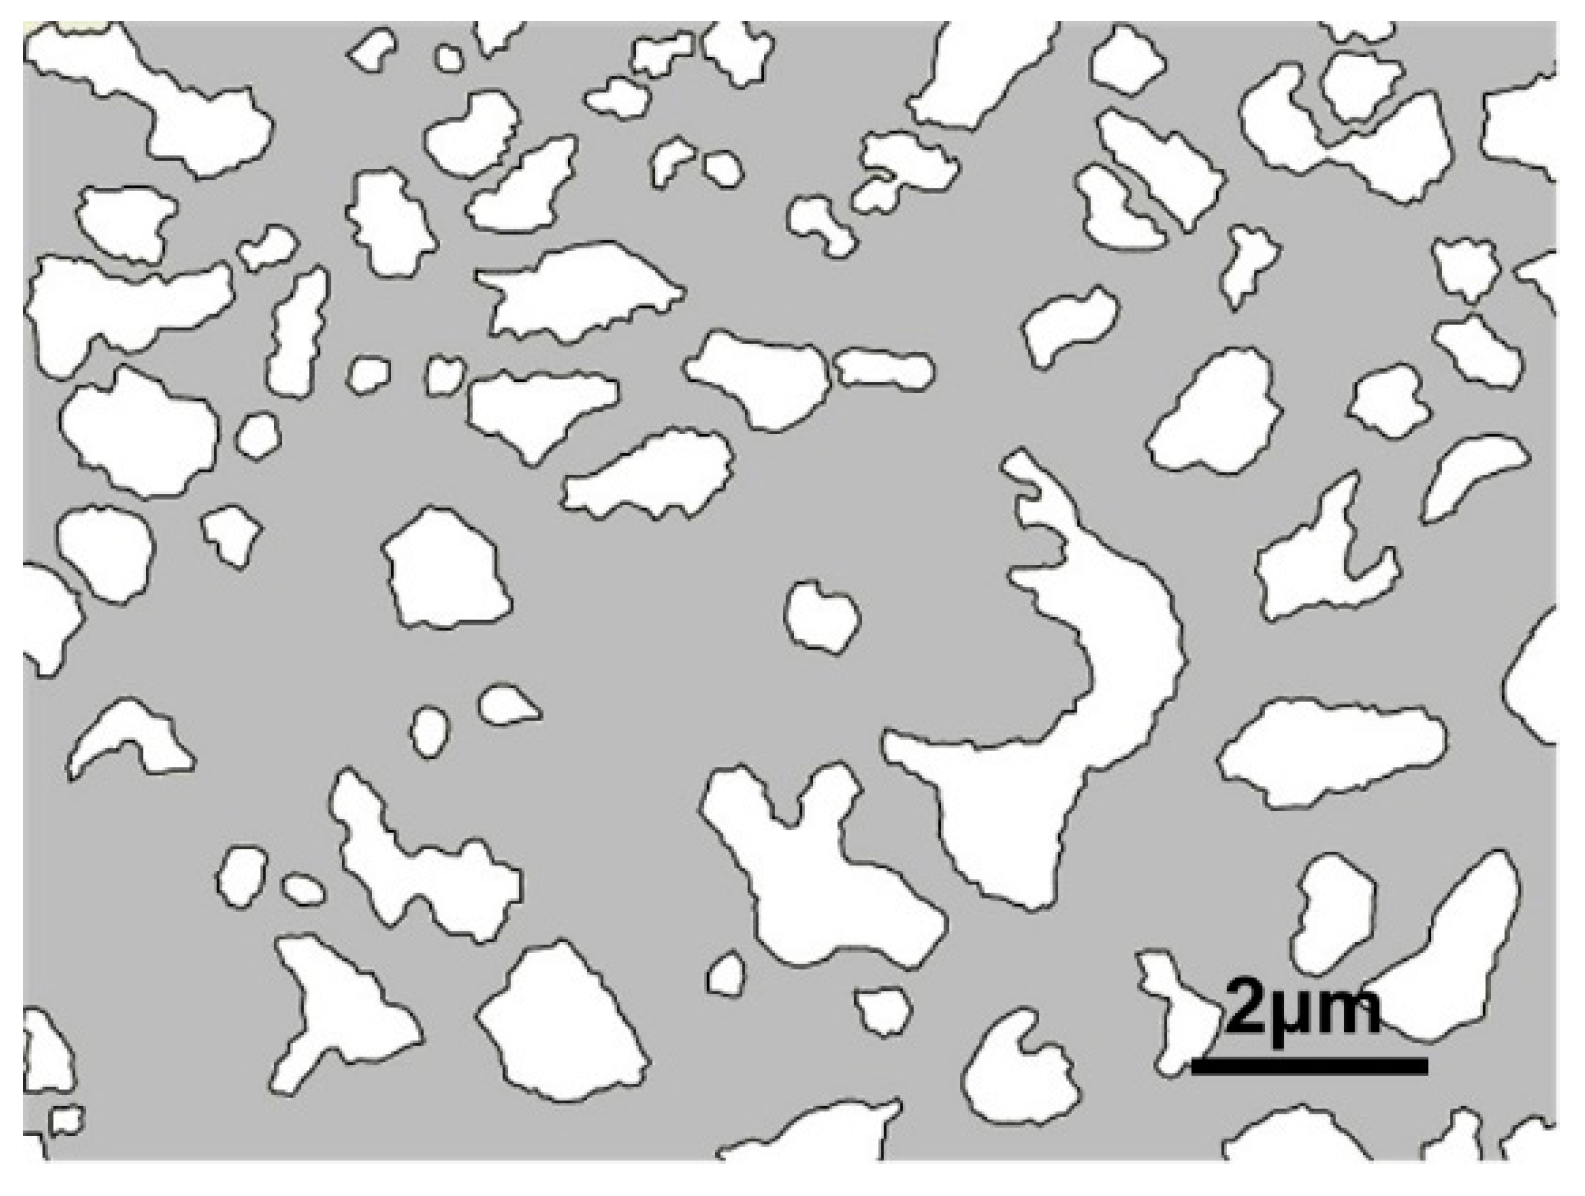
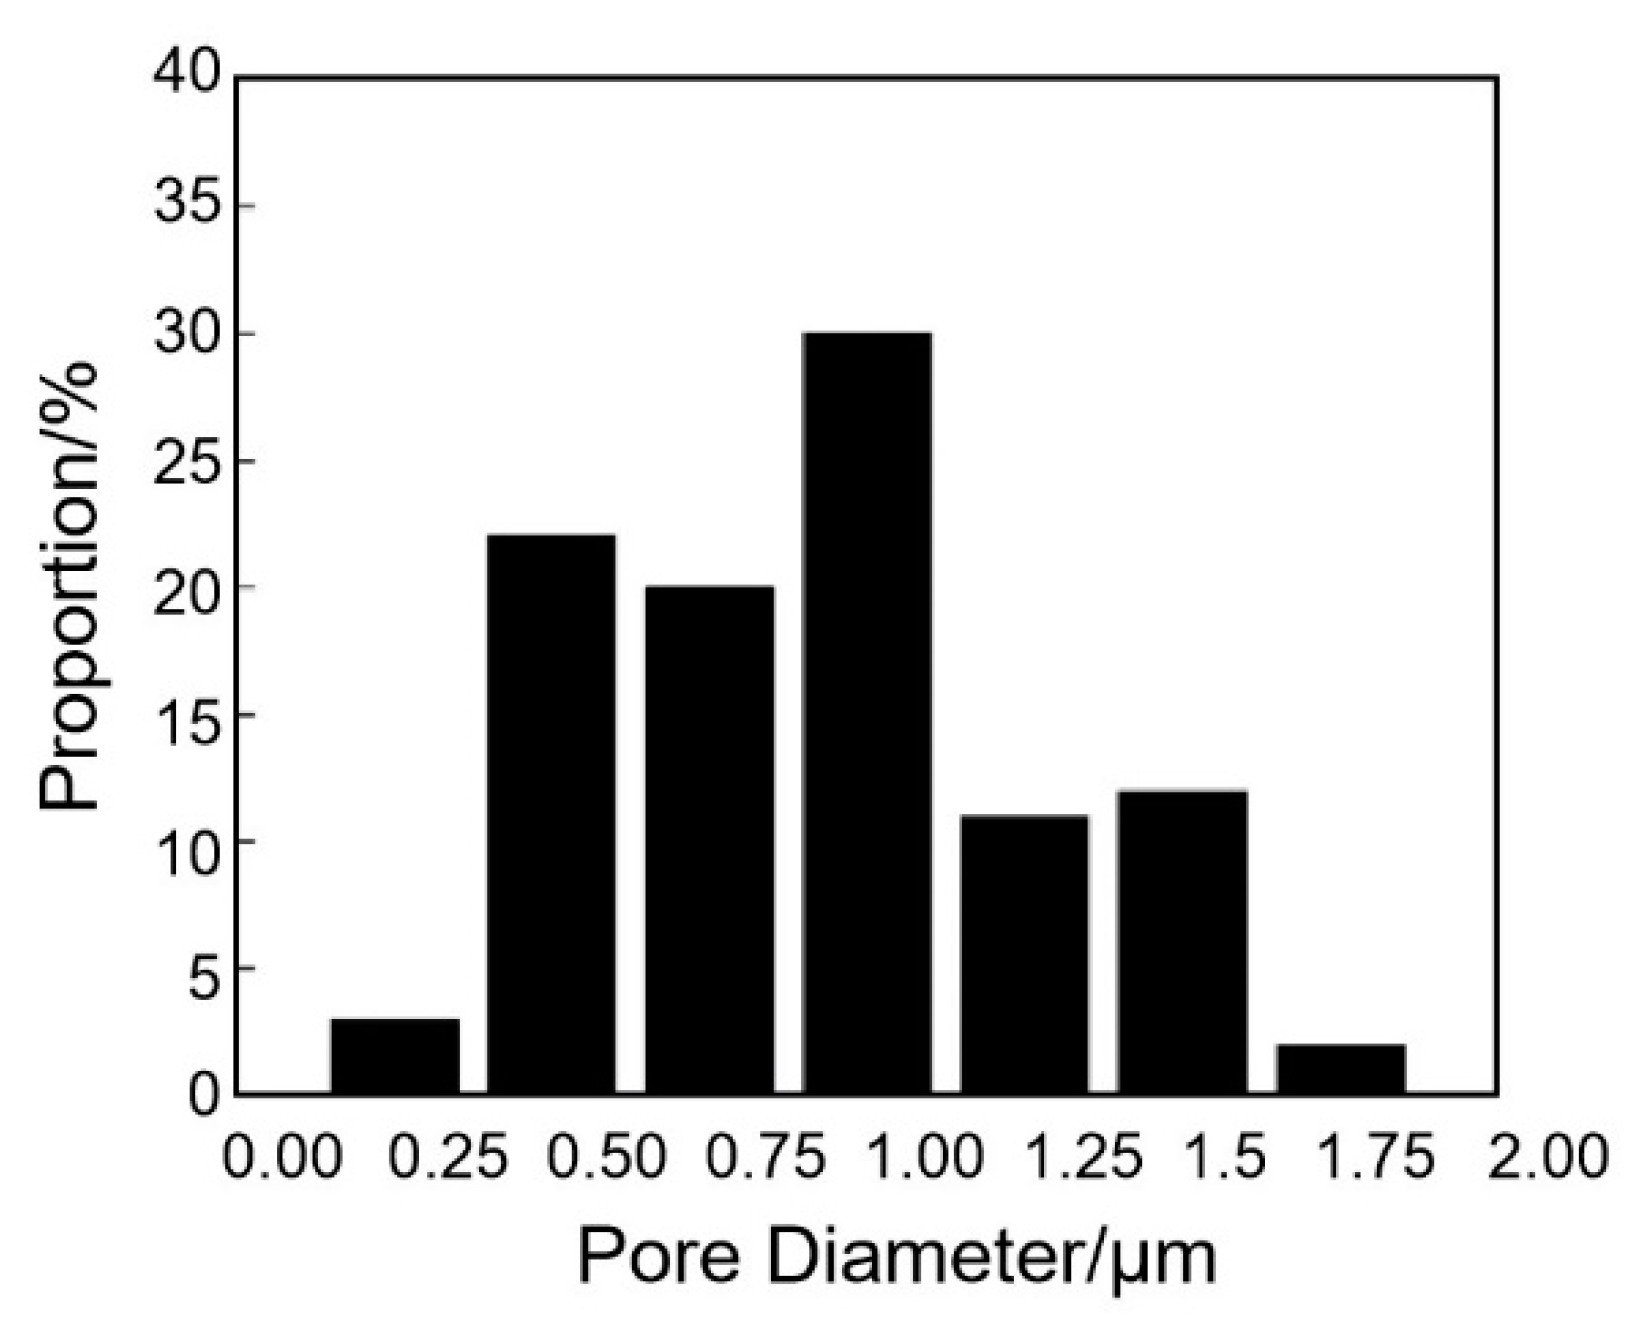
2.1. Pore Characteristic Parameter Acquisition

To determine simulated work conditions that conform to an actual process, experiments were carried out to prepare YSZ ceramic coating samples. A bonding layer was deposited on the surface of the IN738 (Jiangsu Longda super alloy Aviation Material Co., Ltd., Wuxi, China) substrate by low-pressure plasma spraying. The samples were heat-treated under vacuum at 1050 °C for 2 h and then at 25 °C for 2 h. Subsequently, the bonding layer surface was sandblasted to enhance its roughness and further reinforce its interface adhesion. Finally, YSZ ceramic surface layers with different pore structures were prepared by high-energy plasma spraying. The key spraying parameters for each layer of coating are listed in Table 1.
The pore structures of the YSZ coatings were characterized using scanning electron microscopy (SEM; Quanta 600; FEI, Hillsboro, OR, USA). The typical structure of the YSZ coating is shown in Figure 1a. Then, the porosity and pore diameters of the coatings were calculated and analyzed by using a software Image J (National Institutes of Health, V1.8.0, Bethesda, MD, USA). The contrast of SEM images was enhanced by Binarization (Figure 1b). Through edge extraction, the pore contours were acquired, as shown in Figure 2. Porosity is defined as the volume fraction of pore in the coating. Considering the coating is thin, porosity is calculated by the average area fraction value of pore on the coating cross-section in the SEM image. The pore diameter was obtained by the equivalent circle diameter (ECD) method, which transformed irregular pores into regular circles with an equivalent area. Then, the diameter of these circles was quantitatively obtained. About 8–10 fields of view were chosen randomly at 100× magnification of each coating sample, and the calculated values were averaged.
More than 60 YSZ coating samples were prepared by adjusting spraying parameters. Then, the porosity and pore diameters of the coatings were calculated and analyzed. Statistics on porosity and pore diameters of the prepared samples are given in Figure 3 and Figure 4. Based on the above results, the ranges of pore diameters and porosity under the simulated work conditions were determined to be 0.5–1.5 μm and 5%–50%, respectively. So, eleven combinations of different porosities and pore sizes as input conditions were evaluated by simulated work, as listed in Table 2. The simulation results are used to explore the effect of porosity or pore size on the properties of the coating.

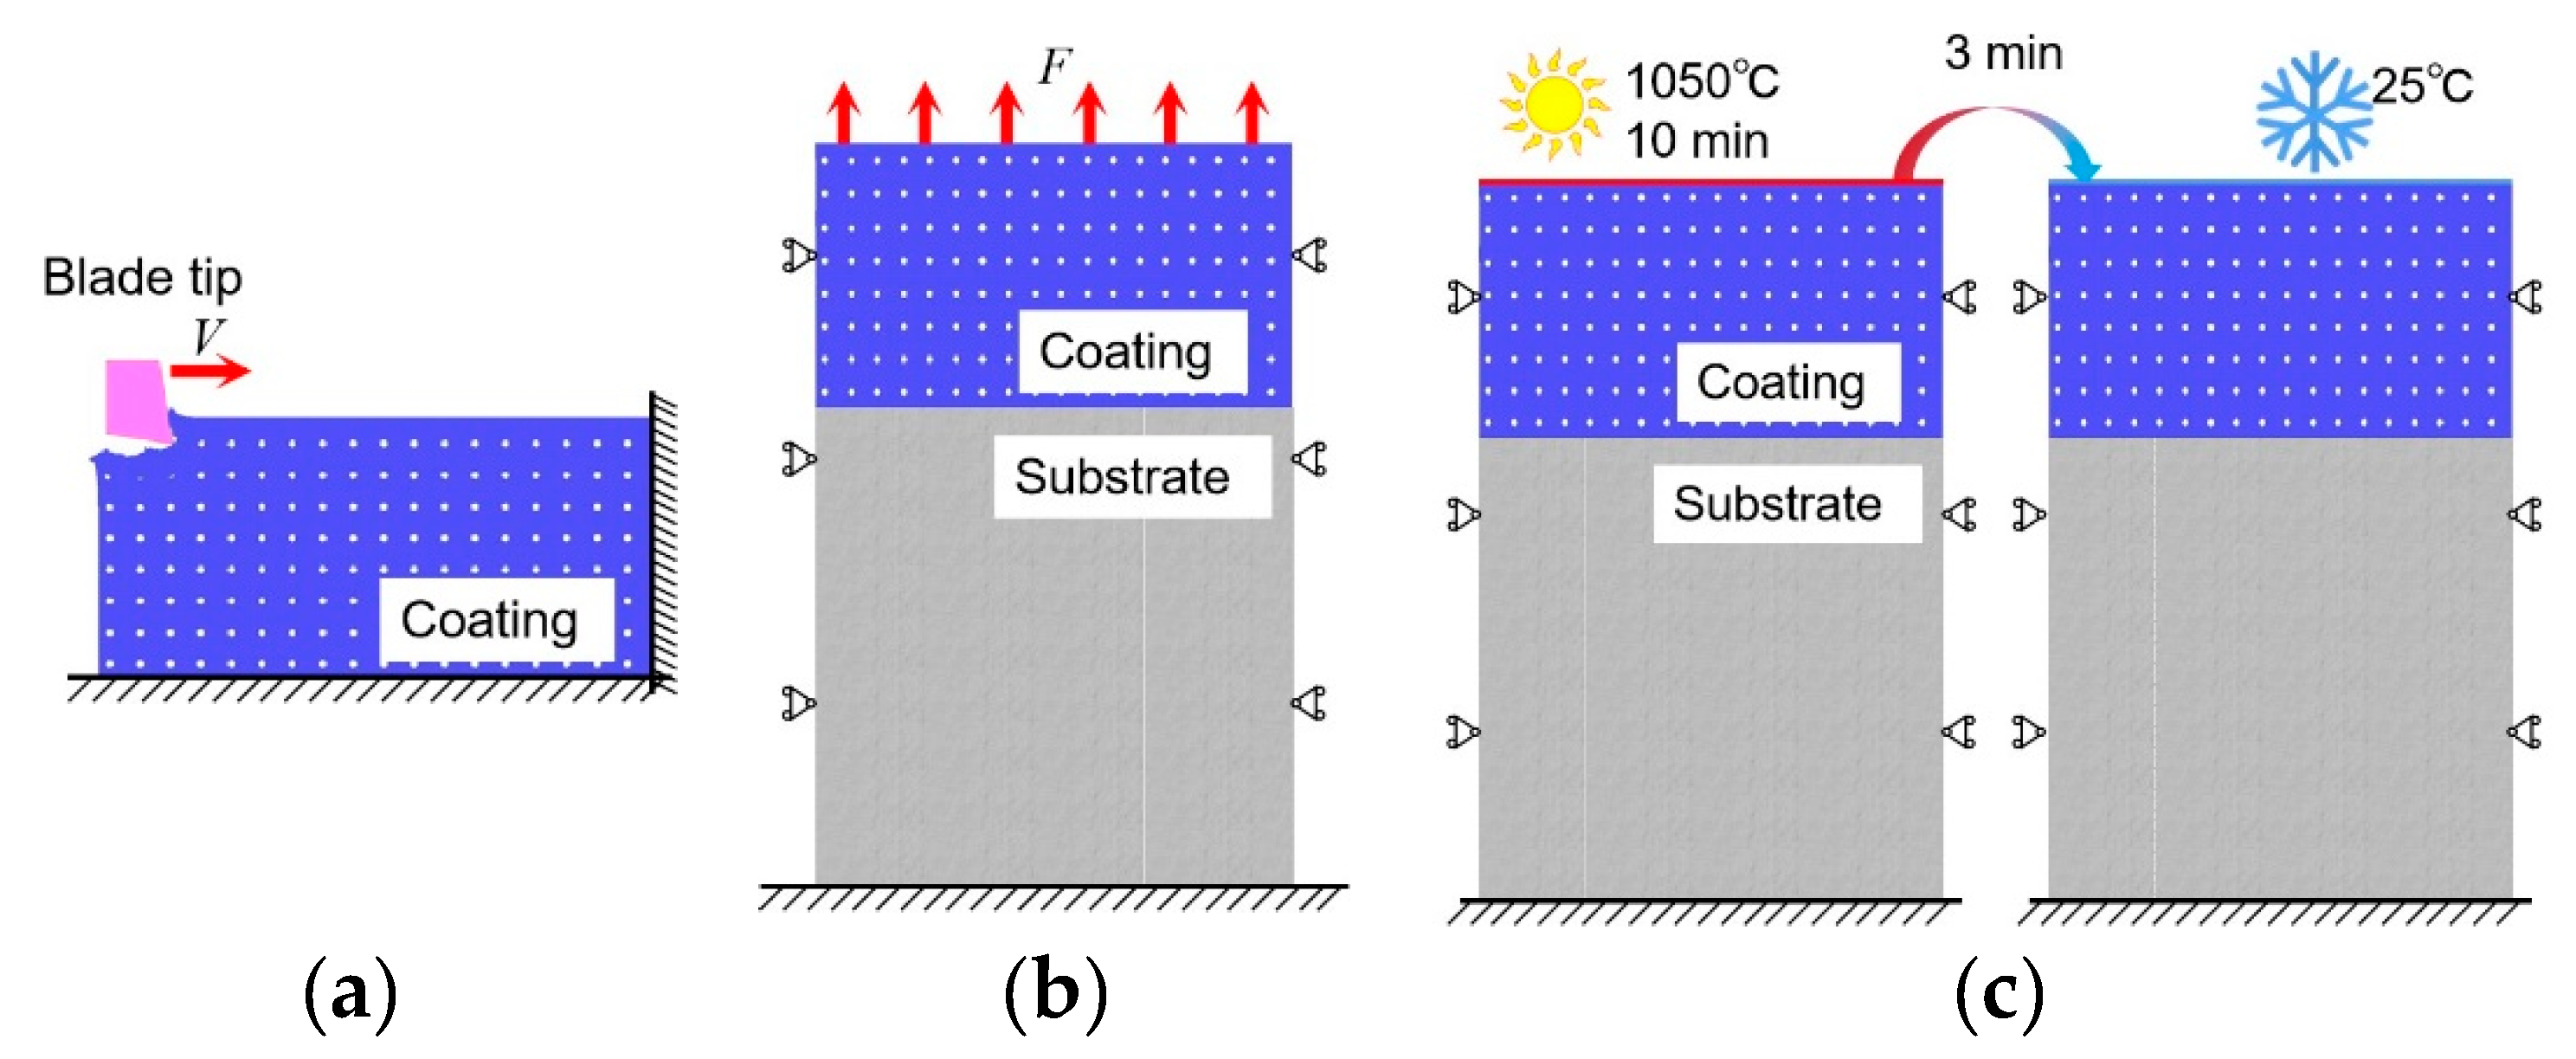
2.2. Finite Element Method-Based Numerical Model Building

FEM-based numerical models were built to investigate the abradability, bonding strength, and thermal shock resistance of the YSZ coatings. The boundary conditions of the models were set up according to the experimental test conditions of the above properties. The abradability of the sealing coating was used to evaluate the difficulty of scraping it with a blade. The contact force of the blade-scraping coating was calculated to reflect the abradability. Due to the wear scar with a very small curvature caused by the large-radius blade tip of an aero-engine, plane scraping was adopted to simulate an abradability test. The fracture strength of the coating during the static tensile test was defined as the bonding strength. The thermal residual stress at the interface between the coating and substrate after single thermal cycling was used to reflect the thermal shock resistance of the coatings.
To simplify the numerical model, three universal assumptions were applied: (i) pore structure uniformity; (ii) continuity of materials and isotropy of the same material; and (iii) periodic boundary conditions. Key parameters for the three simulation models are summarized in Table 3. Schematic diagrams of the simulation processes are shown in Figure 5. The verification of grid independence is required before calculation. In this study, the rough mesh is used firstly for calculation, then the mesh is refined; finally, the solution is solved to verify the effect of the mesh on the results. The maximum grid size is selected to fulfill the calculation accuracy and efficiency requirements. The material parameter values used in the simulation model considered the influence of temperature and are shown in Table 4 [24]. In addition, an evaluation function to study the comprehensive performance of the porous YSZ coating was established to determine the optimal porosity and pore diameter.

2.3. Simulation Model Validation

The validity of the models was checked to ensure they reflected the actual work conditions, and produced correct predictions. Coatings with porosity around 20% and pore diameters approaching 1 μm were prepared in the laboratory and then utilized to test the abradability and tensile bonding strength. The abradability tests were carried out on a high-speed scraping test rig (BKV-HVT300/800; BGRIMM, Beijing, China) [25,26]. A 3-axis force sensor is mounted to the specimen stage to record the scraping contact force on the coating. Tensile tests were used to measure the bonding strength of the coatings by a static tensile testing machine (WDW-100A; KaiDe, Jinan, China). Roughly ground coatings were bonded to butt samples using a solid adhesive (FM-1000; SOLVAY, Havre de Grace, MD, USA), and the adhered sample surfaces were grit-blasted in advance [27]. The results are listed in Table 5. The difference between the simulated data and experimental data was within 10%, showing that the simulation models accurately predicted the properties of the coating.

3. Numerical Results and Discussion

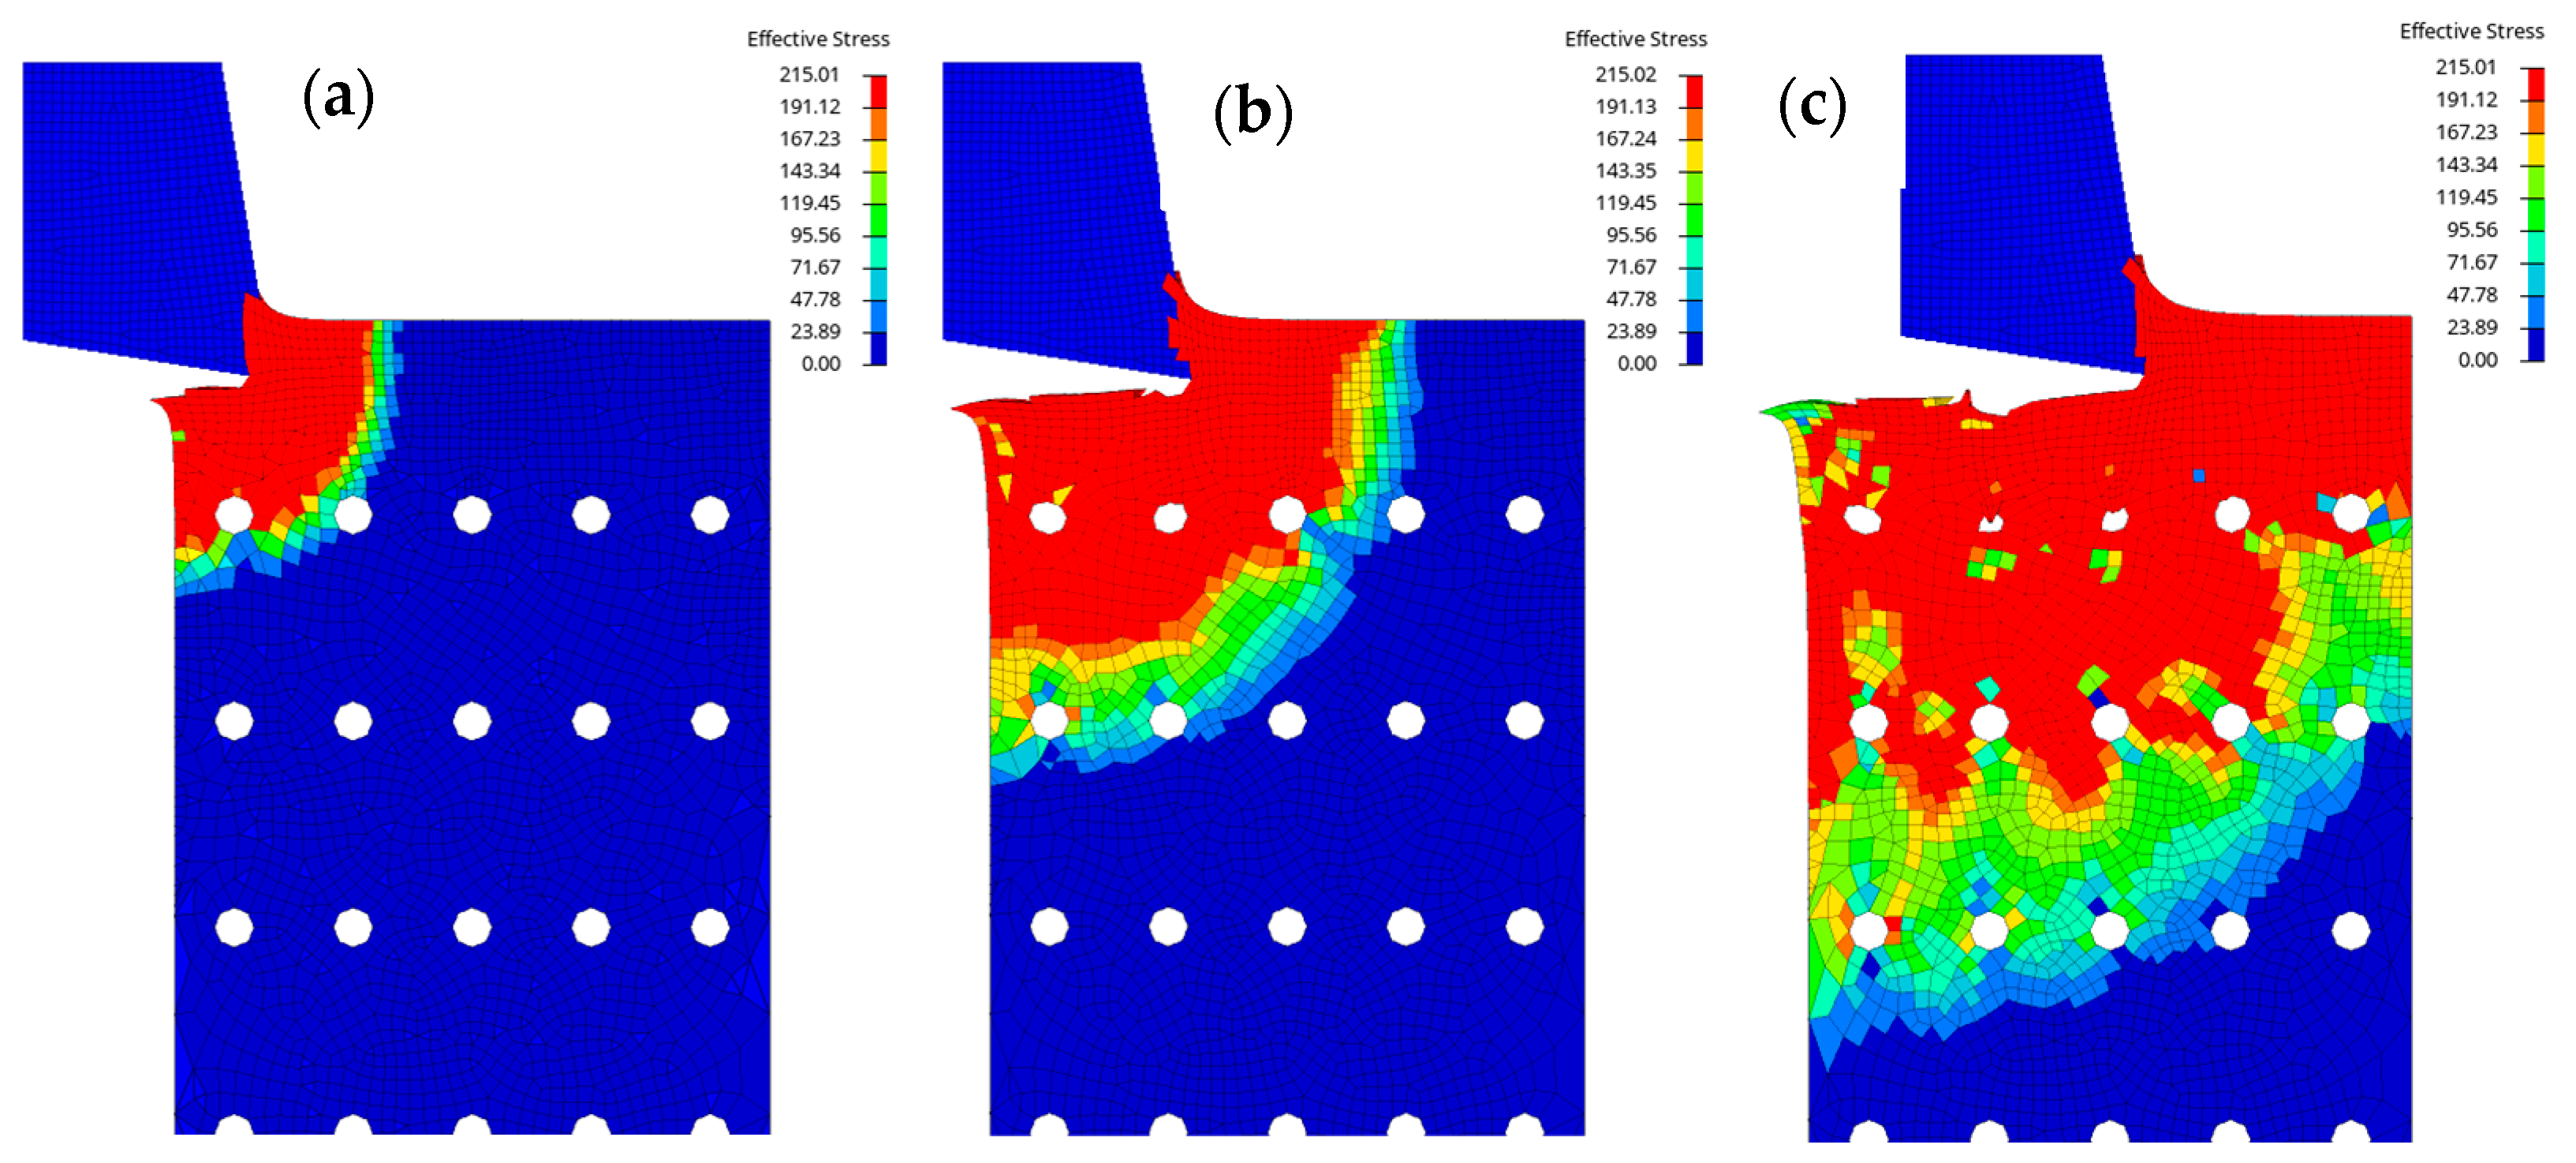
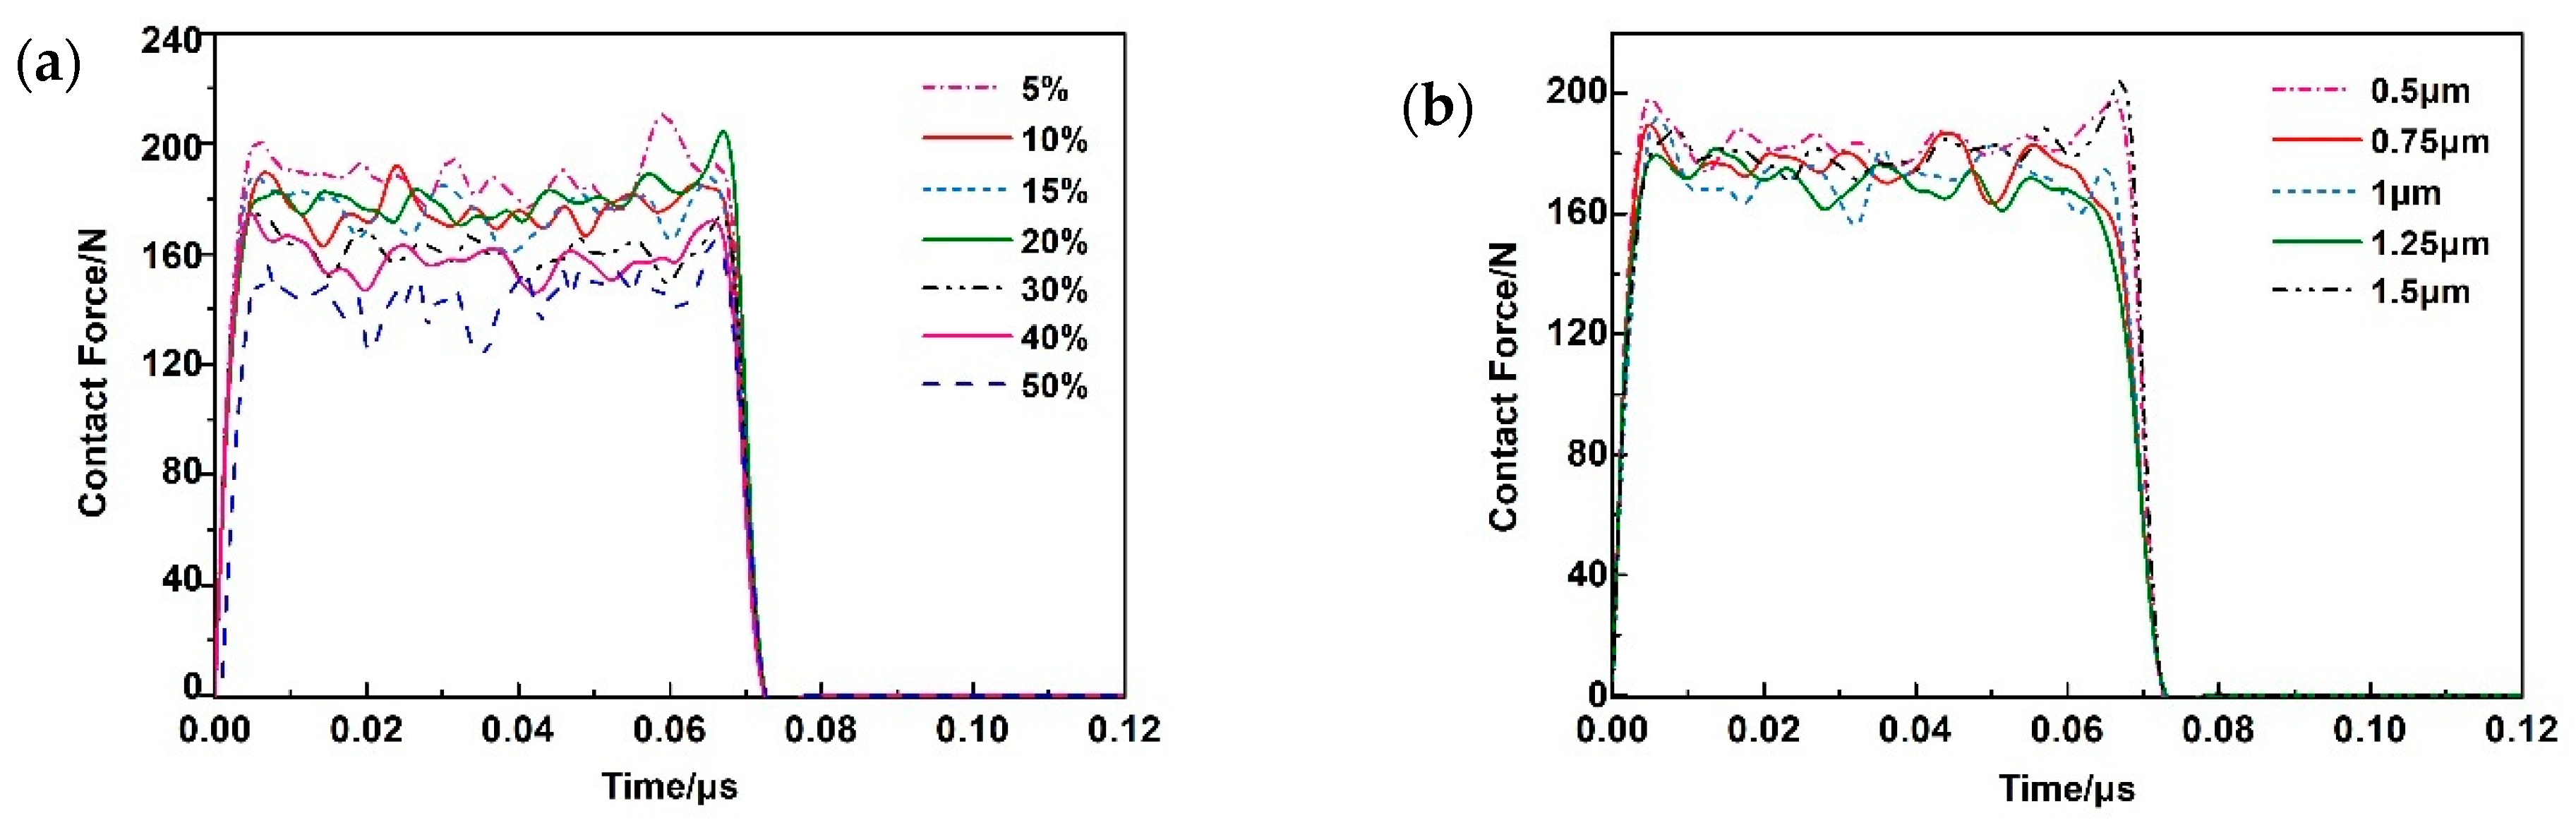
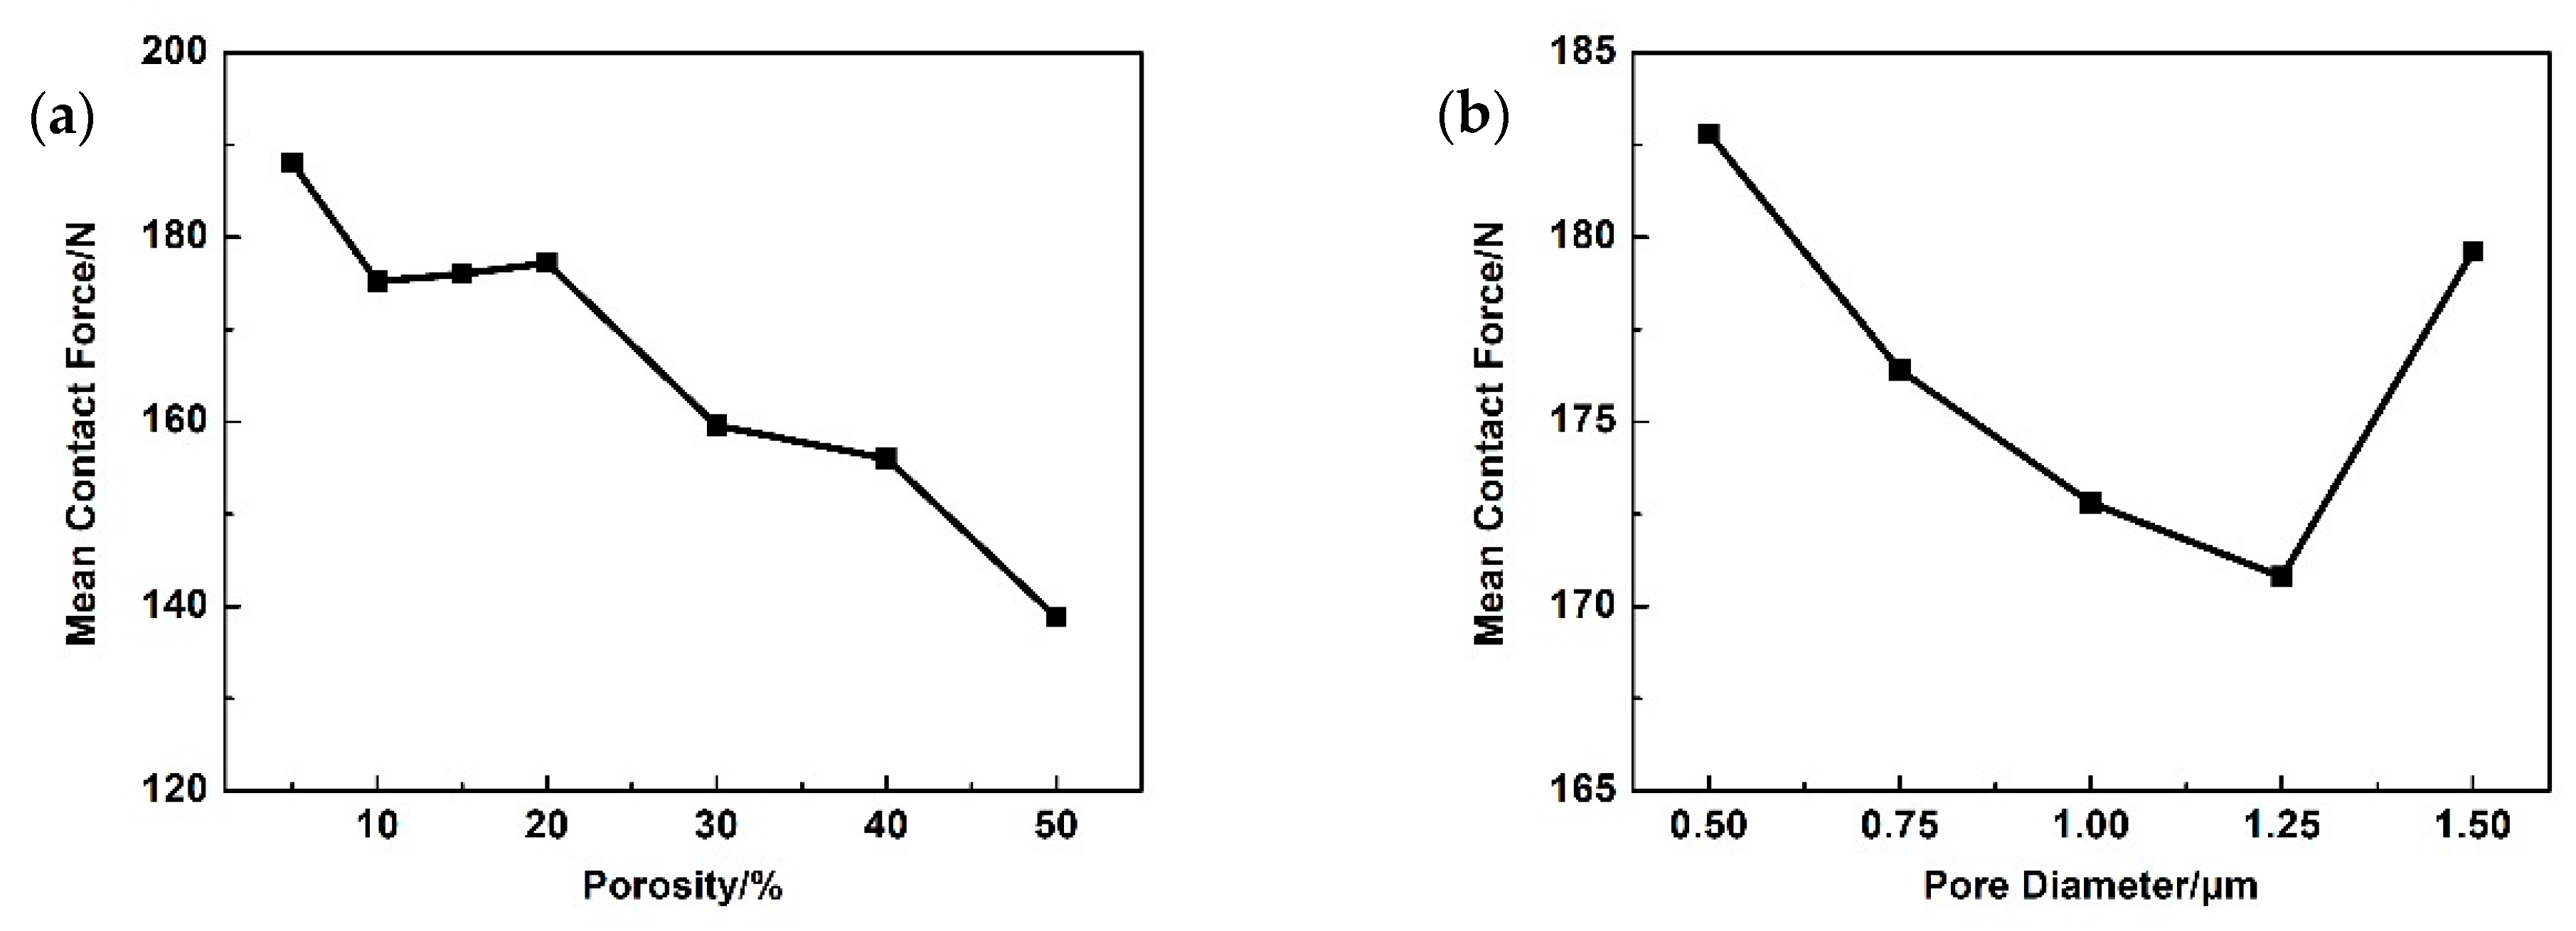
3.1. Abradability and Scraping Process Simulation

The large contact force between the coating and blade during scraping indicates that the coating was difficult to scrape, and the blade tip was easily damaged, which reflects the poor abradability of the coating. Therefore, the scraping contact force was chosen as the simulation calculation index to characterize the abradability of the coating. The scraping processes for the coatings with different porosities and pore diameters were simulated. Figure 6 is a cloud map of the stress distribution of the coating at different times during the scraping process. The coating failed at the scraping position due to a combination of compressive stress, and shear stress as the blade proceeded. From the scraping position, the stress gradually extended forward and downward along the moving direction of the blade. The pores absorbed deformation energy, and effectively released the stress concentration so that the stress near the pores was significantly lower than that in the high-stress region in red [28].
Figure 7a shows curves of the scraping contact force versus scraping time for the coatings with a 1.5 μm pore diameter and different porosities. The scraping process can be divided into three stages: t = 0–0.01 μs is the initial stage of scraping, during which the contact force increases rapidly; t = 0.01–0.06 μs is the stable scraping stage, during which the scraping force fluctuates slightly; after t = 0.06 μs, the scraping process is complete, and the scraping force drops sharply to zero. The curves of scraping contact force versus time for the coatings with 20% porosity but different pore sizes are exhibited in Figure 7b. The curves show the same variation trend as those shown in Figure 7a. Therefore, the stable scraping stage in the range of t = 0.01–0.06 μs was selected, and the mean contact force in this stage was statistically analyzed.
Figure 8a displays the relationship between the mean scraping contact force and porosity when the pore diameter was set to 1.5 μm. As the porosity increased, the inter-pore distance decreased, and the mean scraping contact force declined from 188 N at 5% porosity to 139 N, when the porosity reached 50%. In the range of 10–20% porosity, the curve showed a plateau, which was caused by the balance between the beneficial effect of more pores, and the detrimental effect of a reduction in pore spacing. When the porosity exceeded 20%, the stress release effect of pores was dominant, and the scraping contact force continued to decrease, indicating that the abradability of the coating was improved. This is consistent with the experimental results of Sporer [5] and Bardi [9]. Figure 8b shows the variation of the mean scraping contact force versus pore diameter at 20% porosity. As the pore diameter increased, the mean scraping contact force initially declined and then increased. The maximum and minimum mean contact force were 183 N (0.5 μm pore diameter) and 171 N (1.25 μm pore diameter) respectively, which indicates that the abradability of the coating was the best at 1.25 μm pore diameter. The higher pore size helped absorb deformation energy and release stress, which reduced the scraping contact force. However, when the pore size was greater than 1.25 μm, there were fewer pores, which reduced the stress-release effect and increased the scraping contact force instead. Brinkiene et al. obtained similar conclusions in their work [29]. Therefore, it can be concluded that variations in the abradability of the coating were jointly determined by the pore size, number, and spacing, but the porosity played the dominant role.

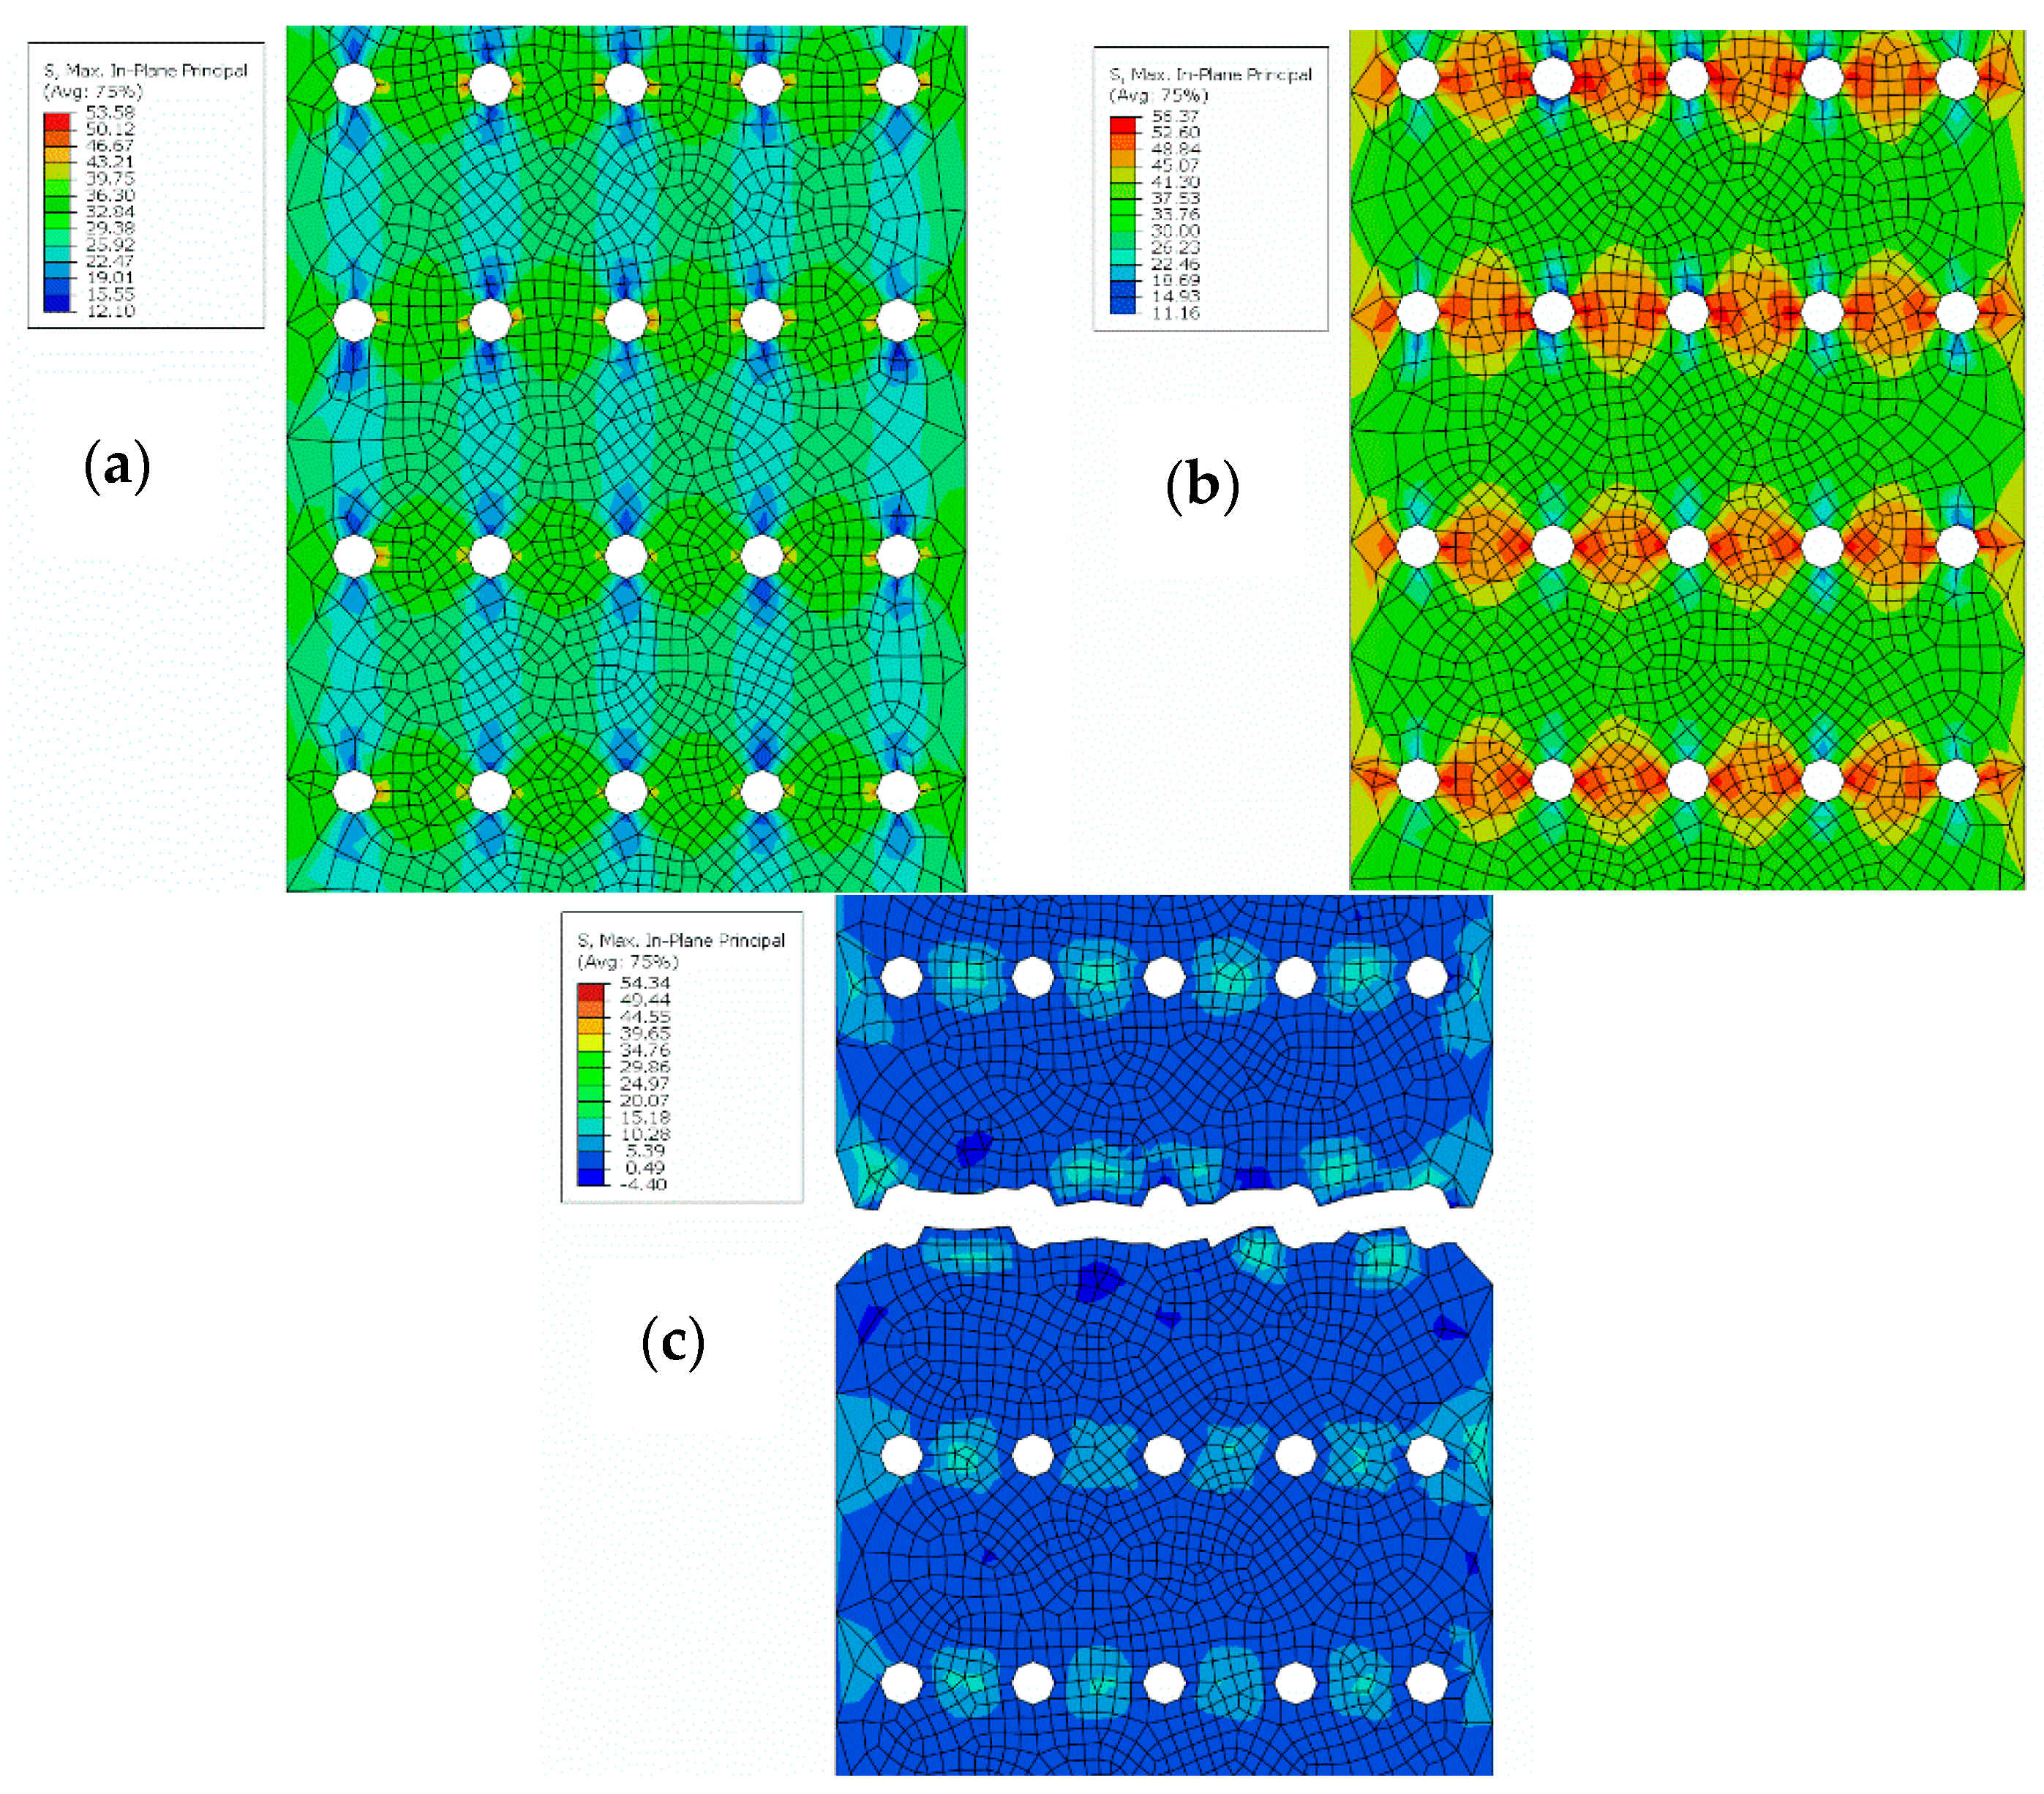
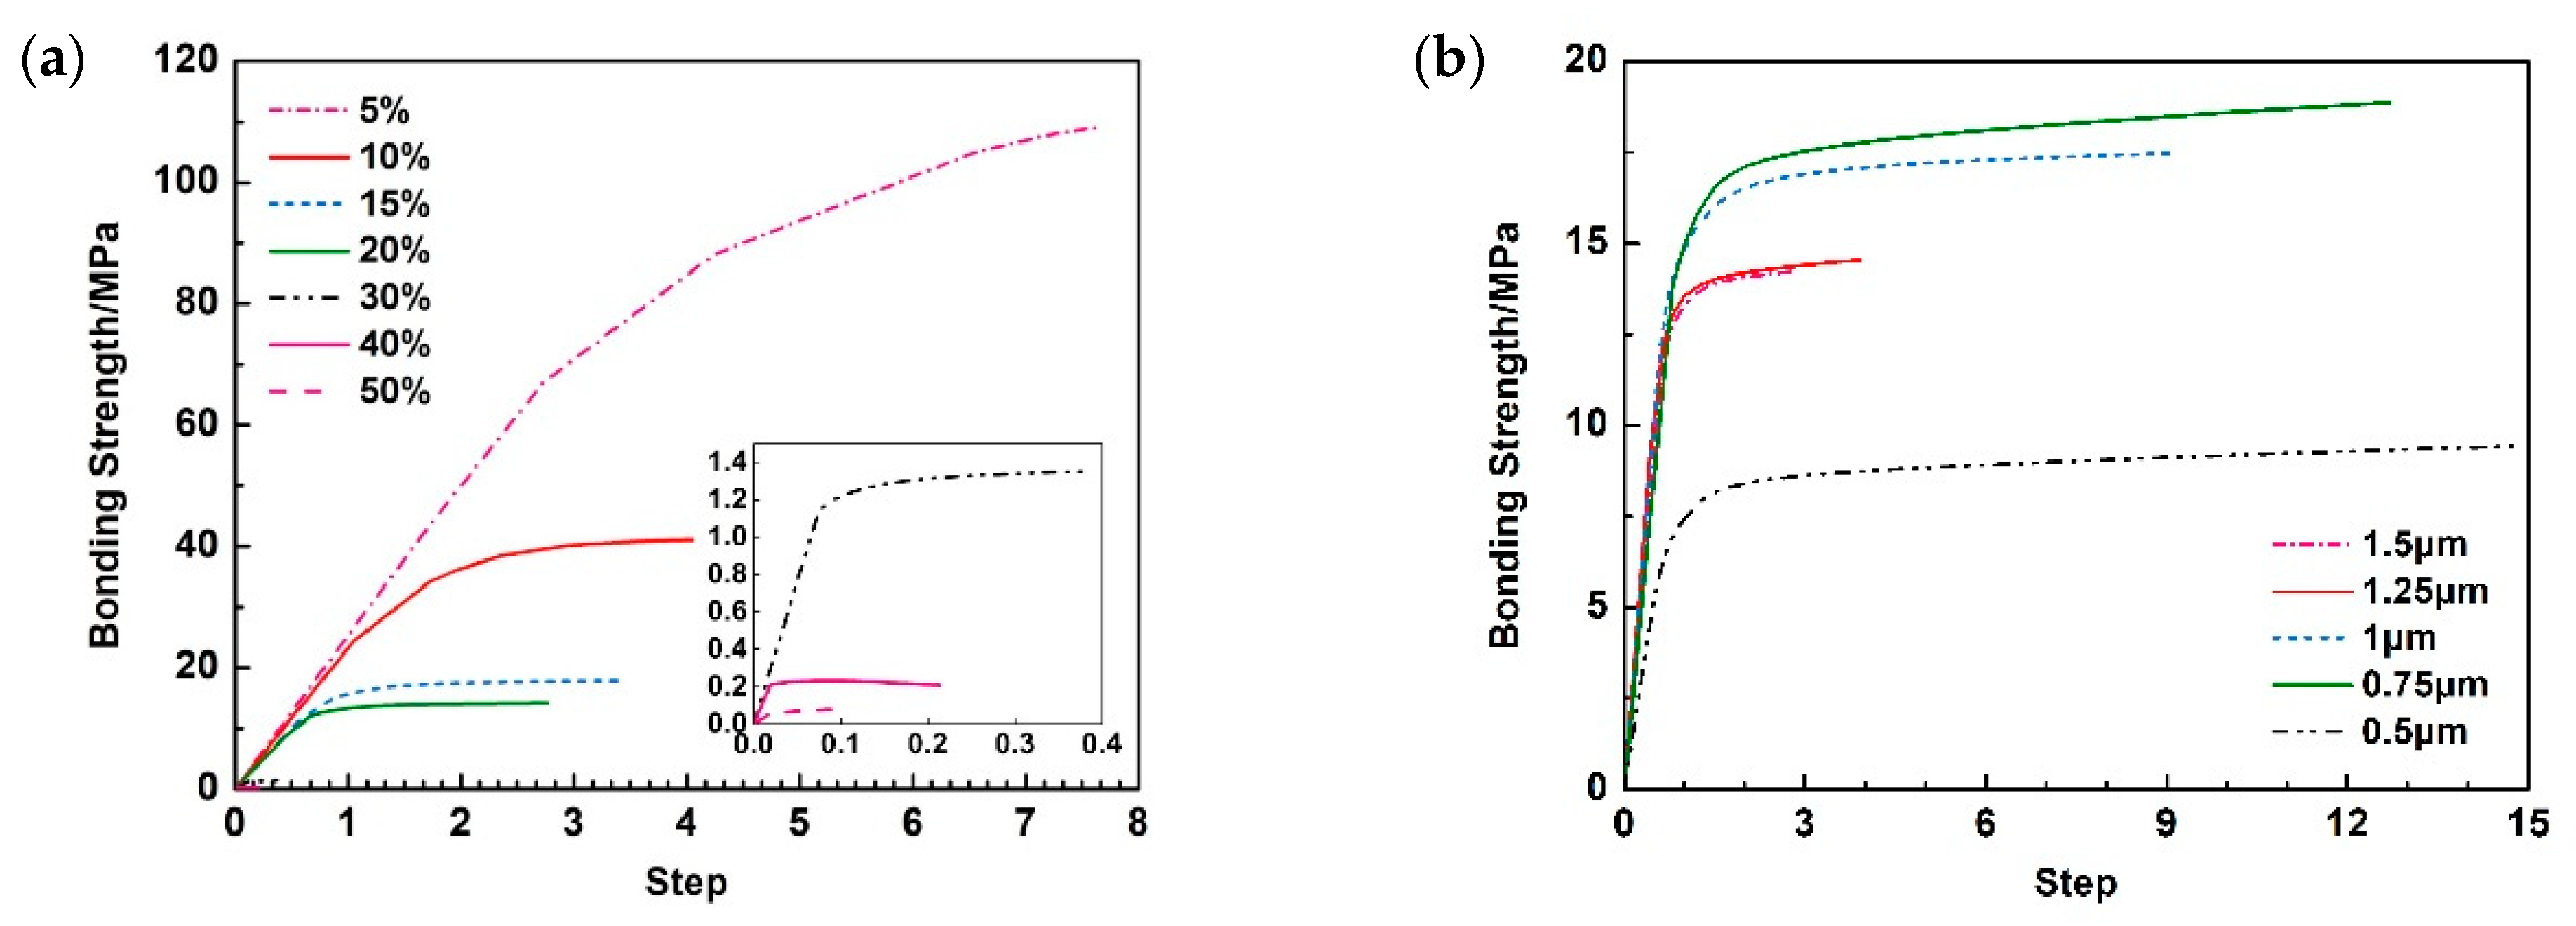
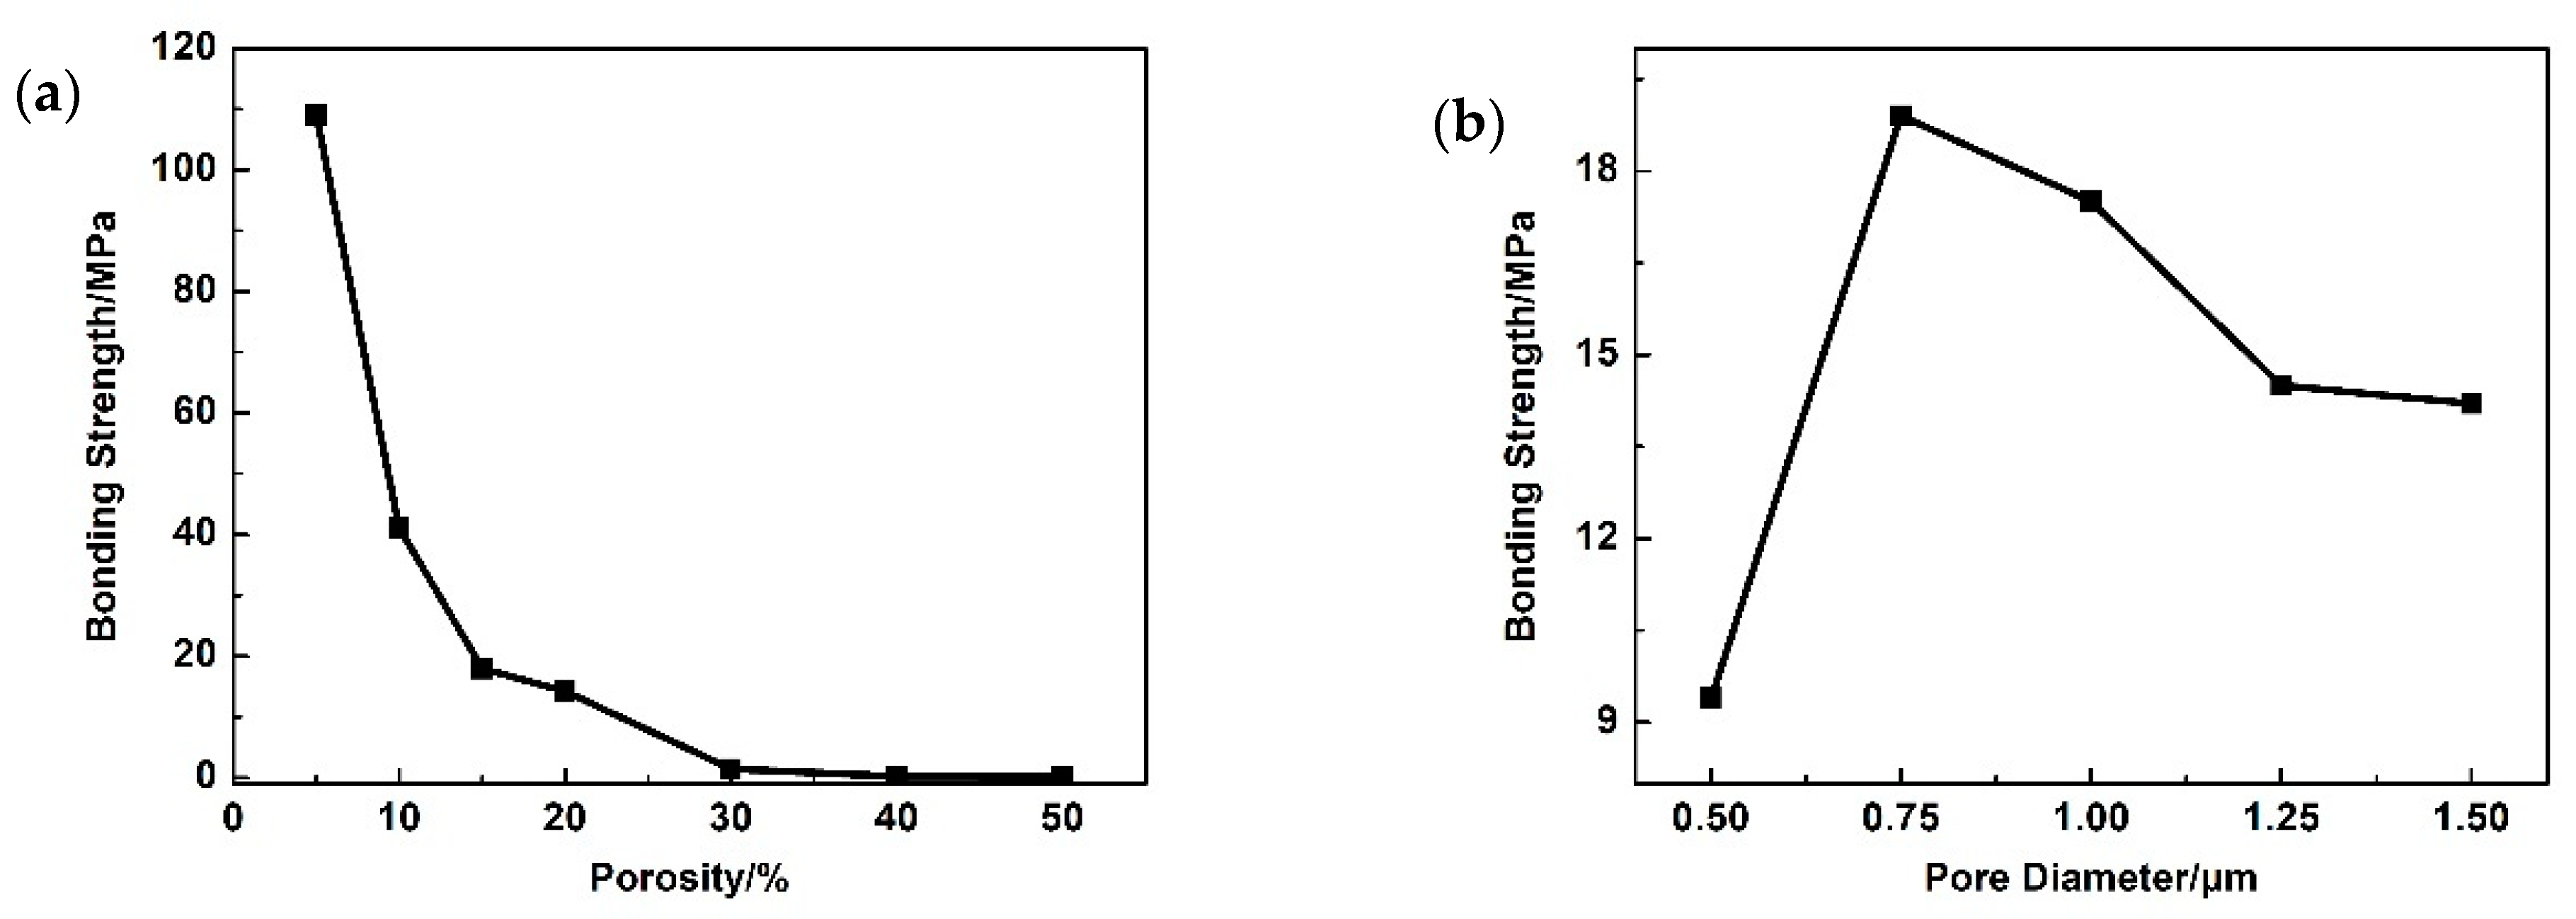
3.2. Bonding Strength and Tensile Test Simulation

The bonding strength is a basic property of coatings, and it is usually tested by static tensile tests at room temperature. The tensile tests of coatings under different porosity values and pore diameters were simulated in this article. Figure 9 is a stress distribution cloud map for coatings in different tensile test times. In the initial stage, there was a tensile stress concentration area on both sides of the pore, with a value of about 5 MPa, as shown in Figure 9a. As the load was continuously applied, the stress interaction between the transverse holes increased, and significantly increased the stress concentration. The average stress in the transverse tensile stress concentration area was about 55 MPa, as shown in Figure 9b. When loading was continued, the transverse development of the tensile stress zone connected the pores, and ran through the whole plane, resulting in the macro-fracture of the specimen parallel to the coating surface, i.e., transverse fracture. The ultimate tensile strength at the end of loading was taken as the bonding strength of the coating, as shown in Figure 9c.
The curves showing variations in the tensile strength versus loading step and those showing the coating bonding strength versus porosity and pore diameter are shown in Figure 10 and Figure 11, respectively. Figure 10a and Figure 11a show that the tensile bonding strength of the coating decreased rapidly upon increasing the porosity. The tensile bonding strength was 109 MPa at 5% porosity, but it was only 1.4 MPa at 30% porosity—a difference of more than 100 MPa. For brittle porous materials, the tensile strength is closely related to Young’s modulus, where coatings with a high Young’s modulus have better tensile strength. The findings of Khor [30] revealed that Young’s modulus E and porosity p satisfied the following equation:
E = E 0   e b p
where E0 is Young’s modulus in a dense state, p is the porosity, and b is a constant. Young’s modulus declines as the porosity increases, which coincides with the results in Figure 10a. Therefore, the coating stiffness degradation may decrease the tensile strength.
In Figure 10b and Figure 11b, the bonding strength of coatings increased initially and then decreased as the pore diameter increased, showing a variation of 10 MPa. When the pore diameter was 0.5 μm, the bonding strength of the coating reached its minimum value of 9.4 MPa. The bonding strength reached its peak of 18.9 MPa when the pore diameter was 0.75 μm. When the pore diameter was greater than 0.75 μm, the tensile bond strength decreased slowly upon increasing the pore size. Combined with the non-monotonic variation in the abradability with the porosity and pore diameter (as depicted in Section 3.1), there was a similar relationship between the porosity and pore diameter versus tensile strength. The uniformly-distributed small pores hindered the connection and penetration of microcracks to form larger ones, which shortened the effective crack length, and improved resistance against unstable crack propagation. Thus, the coating showed an increase in its tensile bond strength within the 0.5–0.75 μm pore diameter range. On the contrary, the matrix integrity was severely damaged in the case of large pore diameters, which decreased the crack propagation resistance. Therefore, the bonding strength declined when the pore diameter was greater than 0.75 μm.

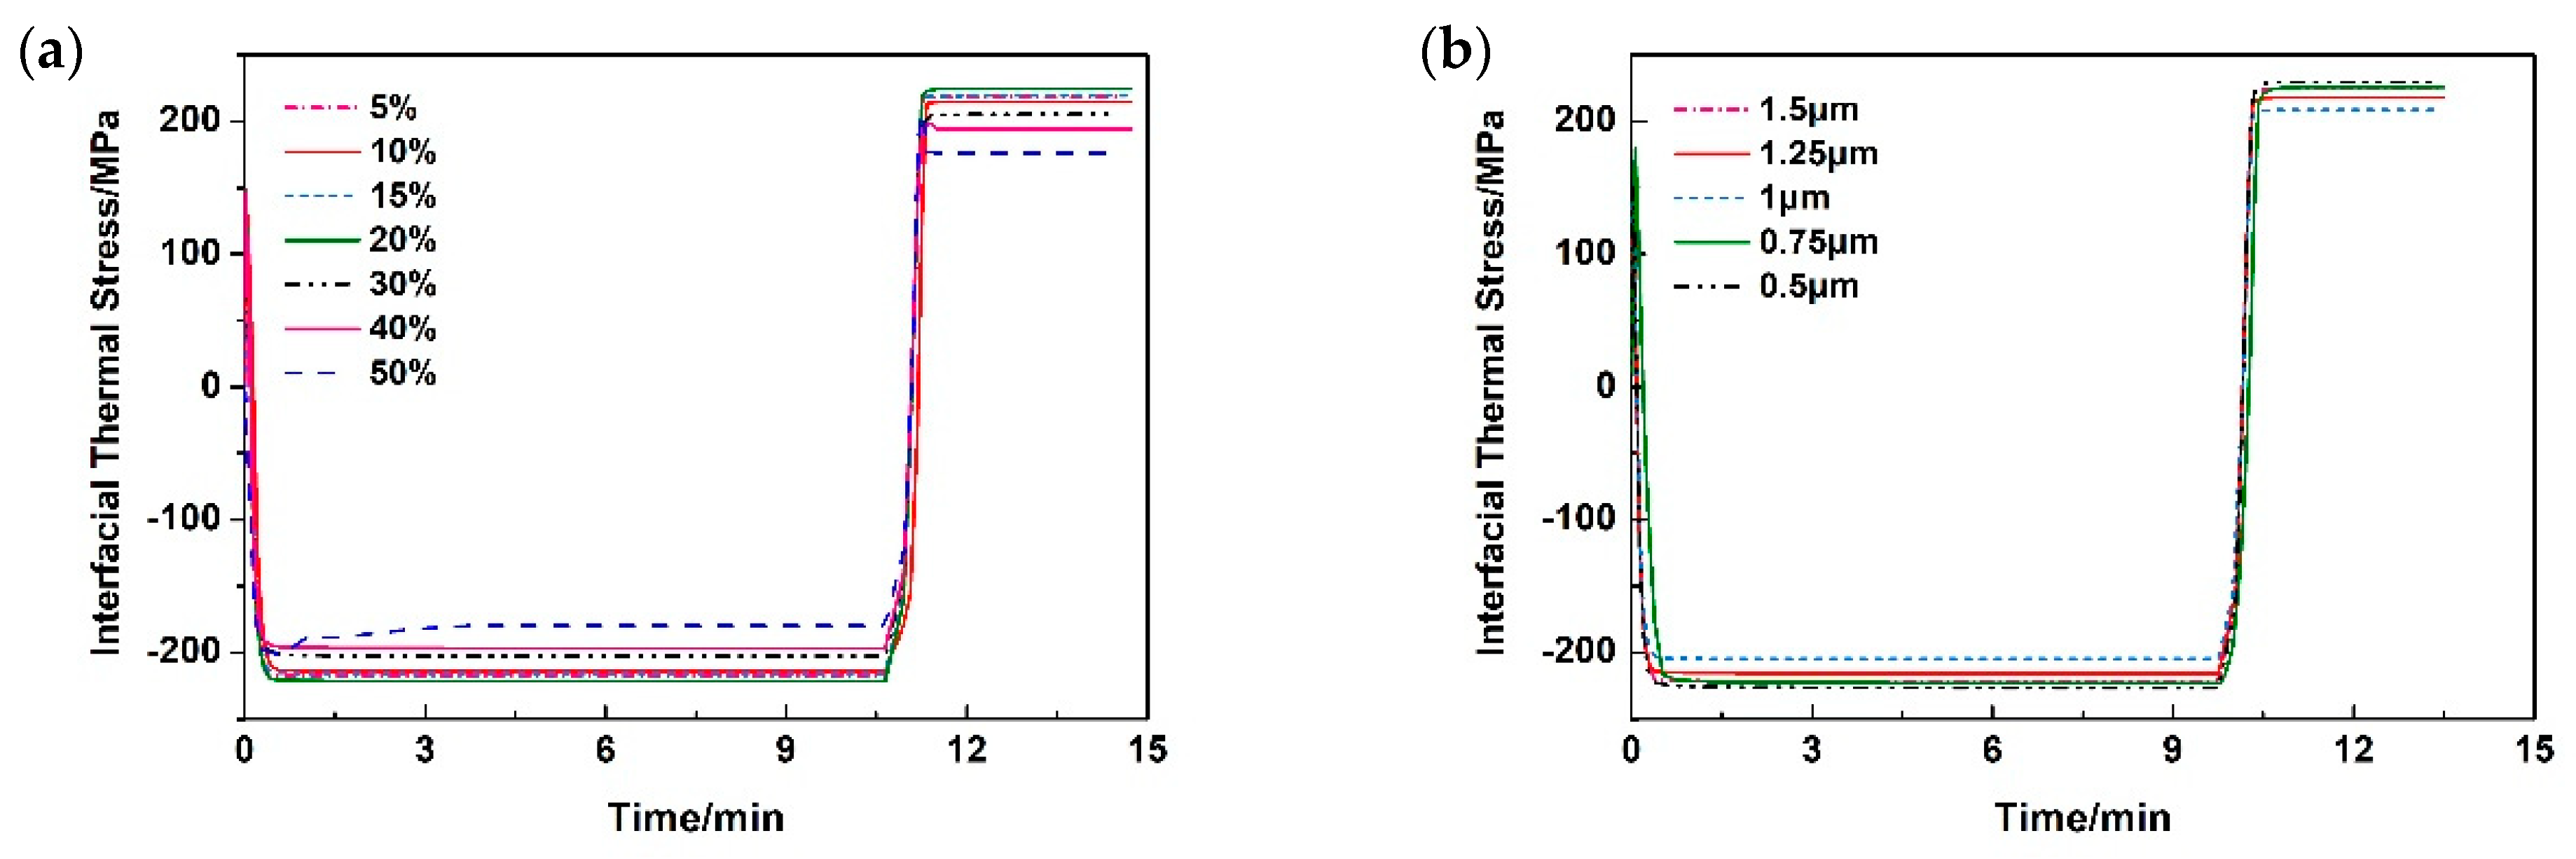
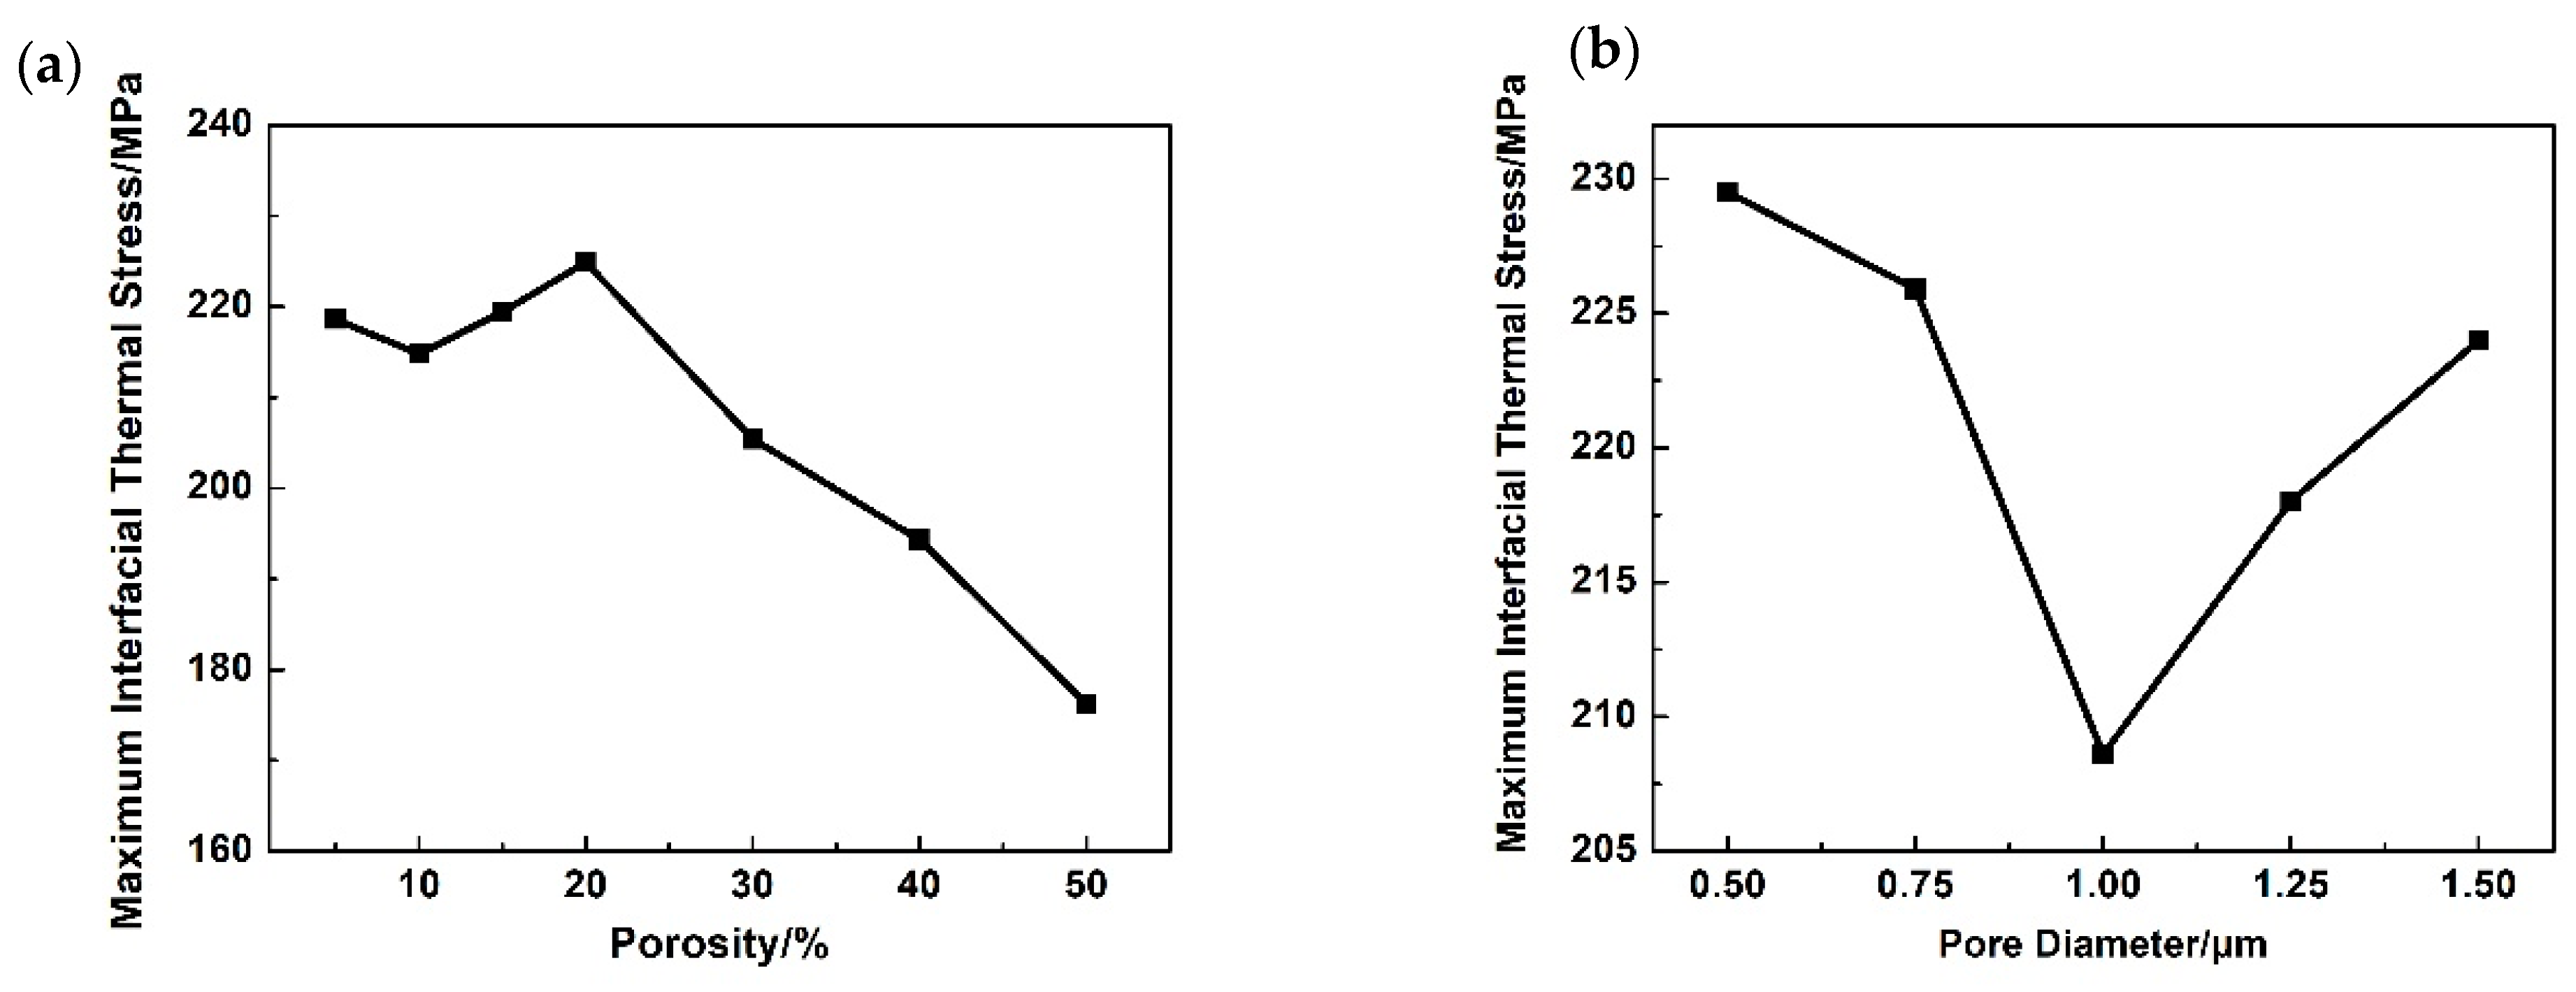
3.3. Thermal Shock Resistance and Thermal Cycling Process Simulation

Thermal shock resistance is the ability of a coating to withstand changes due to thermal cycling inside an engine without undergoing cracking and peeling failure. It is the embodiment of the strength of the coating during service. The root cause of coating thermal cycle failure is the accumulation of thermal stress and residual stress. Therefore, a simulation method was used to investigate the thermal stress at the coating-substrate interface, after thermal cycling. Furthermore, the thermal stress was used as an index to reflect the thermal shock resistance of the coating, and to evaluate the effects of porosity and pore diameter on the thermal shock resistance.
Figure 12a shows the curves of interfacial thermal stress versus time at a pore diameter of 1.5 μm, but with different porosities. The coating-matrix interface was mainly controlled by compressive stress at 1050 °C. After sitting for 10 min, the coating was rapidly cooled to room temperature within 3 min. The abrupt temperature change led to a sharp reversal of the interfacial compressive stress into tensile stress, but the absolute value remained at the same level. Because of the good resistance to compression but poor ability to resist tensile stress, the coating was most likely to fail at this stage. Figure 12b shows the variation in the interfacial thermal stress over time at 20% porosity, and different pore sizes. The variation of interfacial thermal stress with time was the same as in Figure 12a. In this article, the absolute value of the maximum stress at the interface was selected for statistical analysis, and the results are shown in Figure 13.
Figure 13a shows the variation curve of the maximum interfacial stress with porosity under the condition of a 1.5 μm pore size. When the porosity was below 20%, the peak values of the interfacial thermal stress ranged from 214 to 224 MPa. When it was greater than 20%, the maximum interfacial thermal stress began to decline gradually and reached 176 MPa when the porosity was 50%. Under this condition, the optimal thermal shock resistance was achieved [14,31]. Figure 13b displays the curve of the maximum interfacial stress versus pore diameter at 20% porosity. The maximum interfacial thermal stress initially declined and then increased as the pore diameter rose. More specifically, as pore diameter increased, the interfacial thermal stress reached its minimum of approximately 209 MPa when the pore diameter was 1 μm. This was 10% lower than the peak value of 230 MPa at a 0.5 μm pore diameter. Thus, it can be inferred that porosity was the dominant factor affecting the thermal shock resistance, which is similar to the effect of porosity on the abradability of the coating. The thermal shock resistance of the coating was jointly determined by the pore size, quantity, and spacing, because these factors affected the stress transfer and distribution in the coating structure. The difference is that variations in the pore parameters also affected the heat conduction in the coating and affected the transfer and accumulation of thermal stress in the coating [15,32].

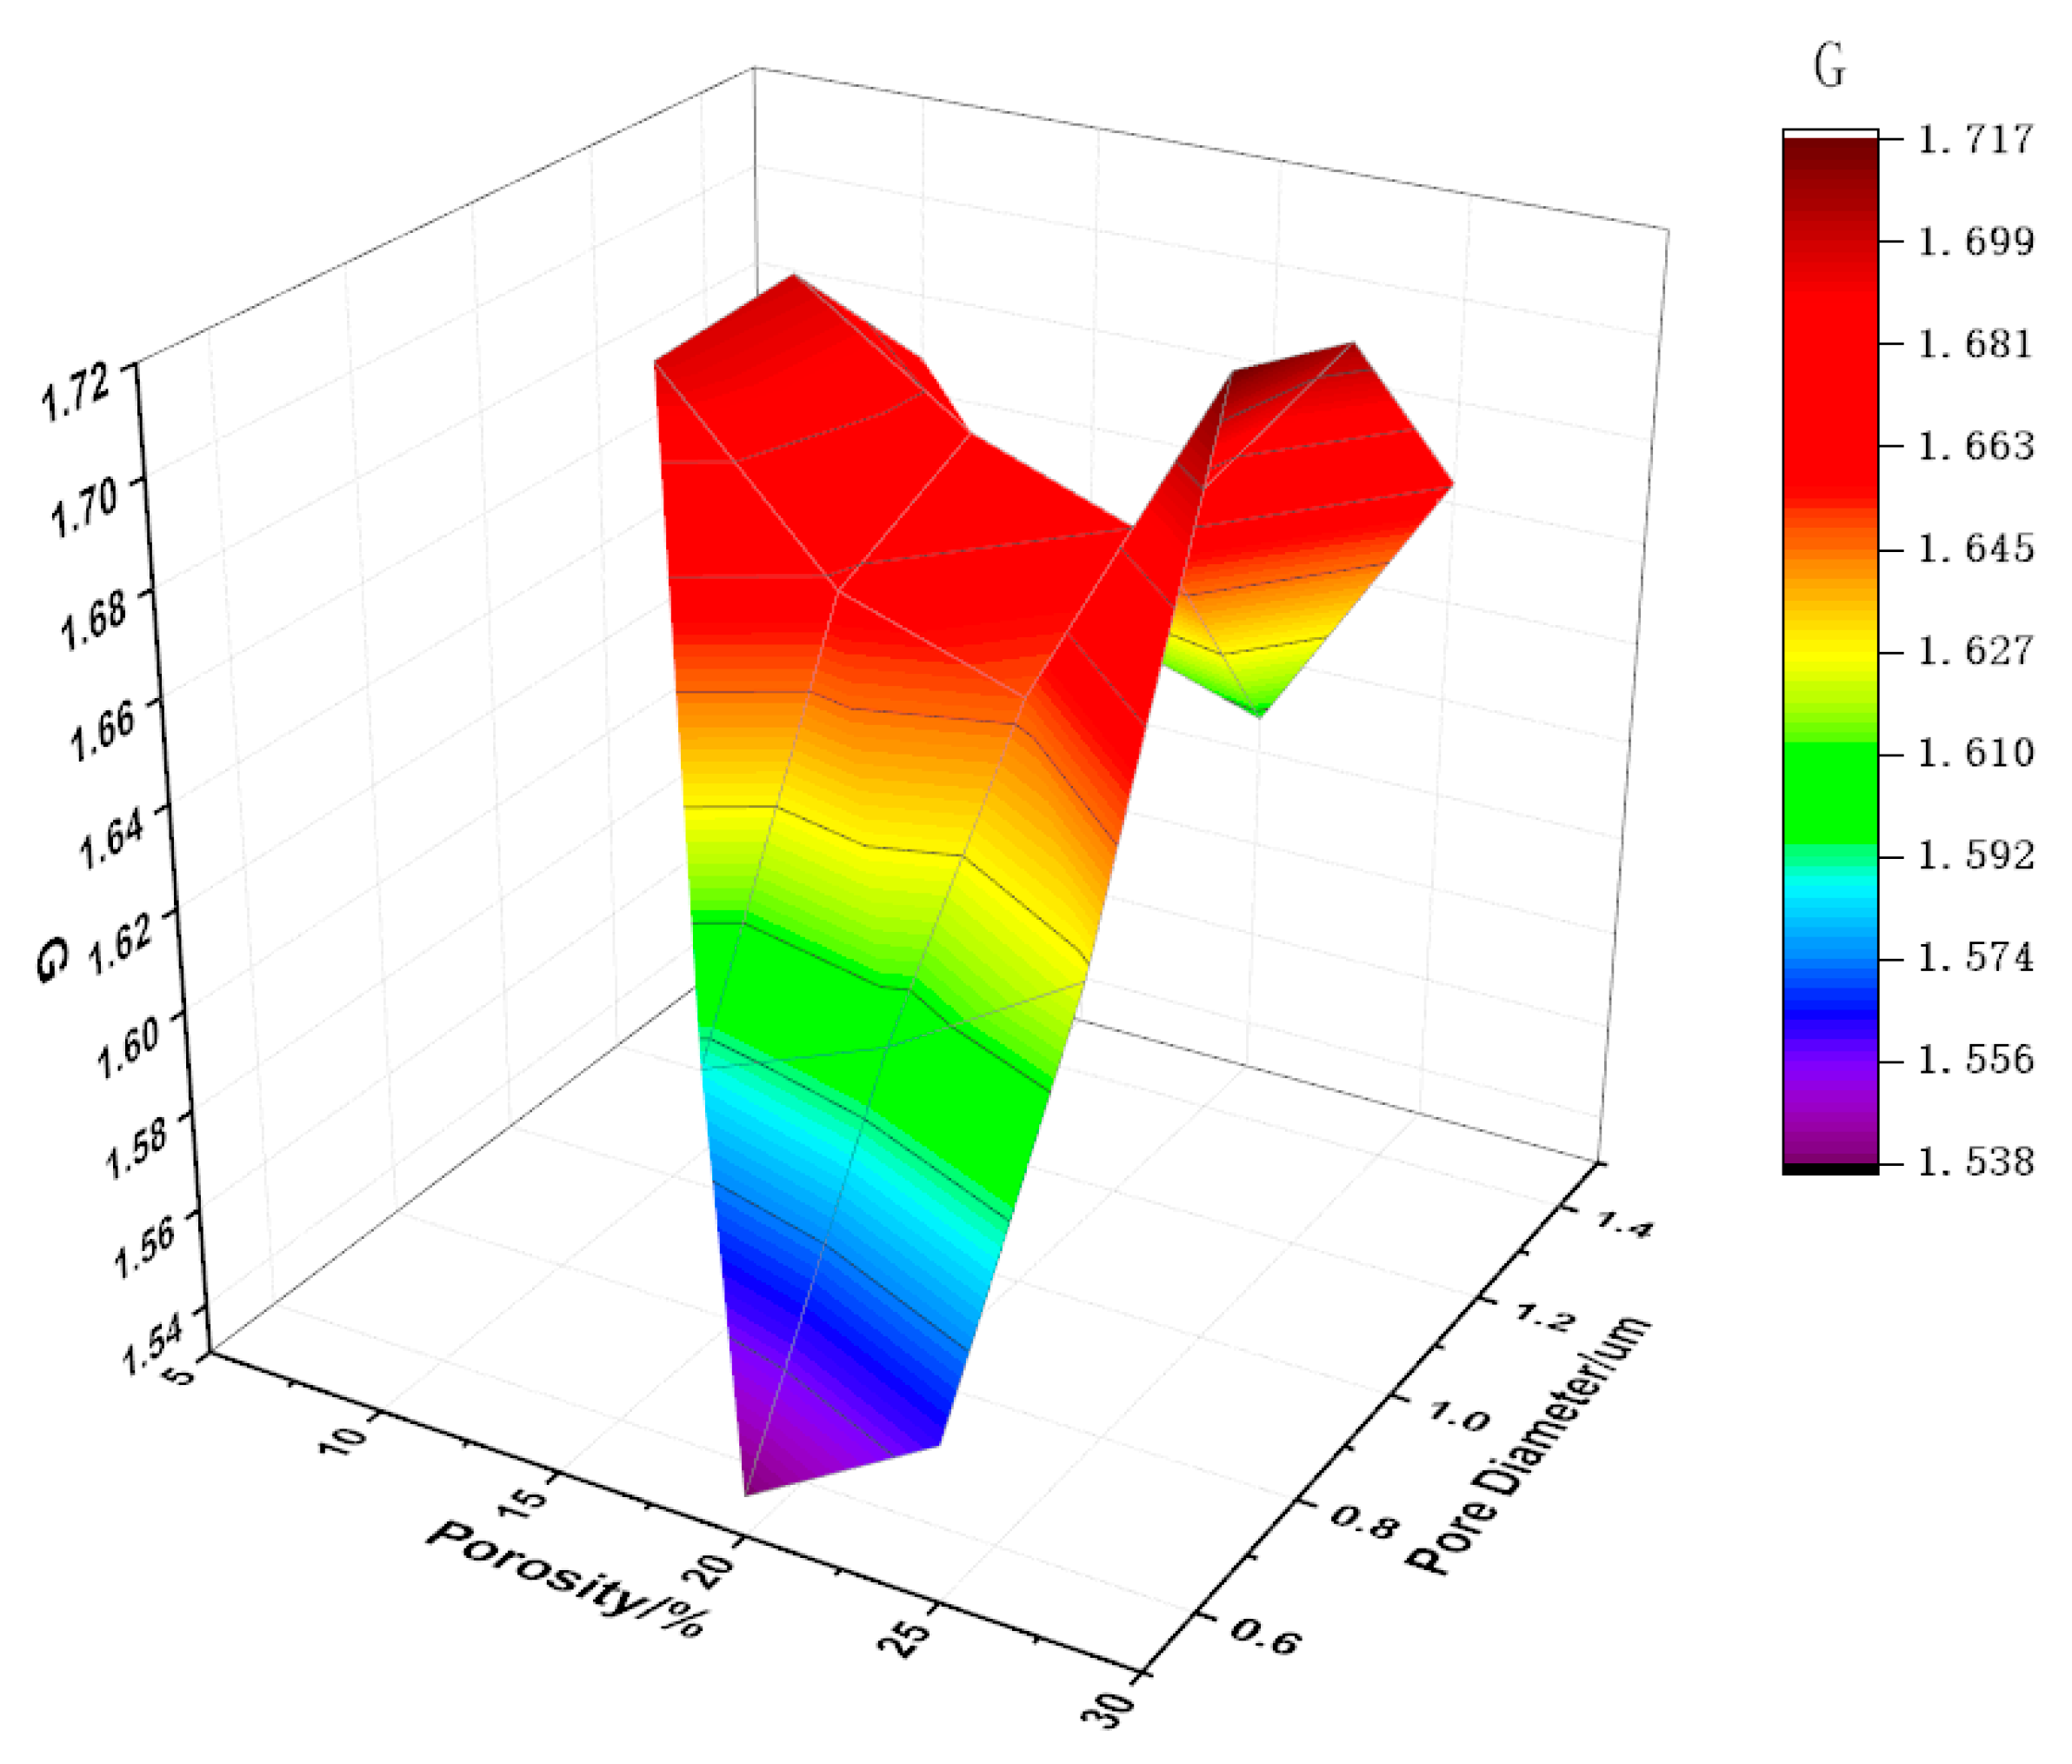
3.4. Comprehensive Performance Evaluation

As mentioned above, the sealing coating should match the abradability and strength characteristics. Therefore, the fitting function shown in Equation (2) was used to evaluate the comprehensive performance of the sealing coating.
G = f A × A b r + f D × D u r
where G represents the objective function; fA and fD are the weight coefficients of abradability and strength; Abr is the abradability of the coating; Dur is the strength of the coating, which are depicted in Equations (3) and (4).
A b r = F t m i n F t
D u r = f s σ s σ s m a x + f t σ t m i n σ t
where σ s is the tensile bonding strength during stretching, MPa; σ t is the interfacial thermal stress during thermal cycling, MPa; Ft is the contact force between the blade-tip and the coating during scraping, N; fs and ft are weight coefficients of the tensile properties and thermal shock resistance.
When the porosity exceeded 30%, the coatings could not meet relevant application requirements due to their excessively low bonding strength. Therefore, the porosity selected for this study was defined at 5–30%, and pore diameters at 0.5–1.5 μm. Different porosity values and pore diameters were combined in the working condition array, and the abradability, tensile bonding strength, and thermal cycle simulations were carried out for each combination. The simulation results in Figure 14 show that the minimum contact force, maximum bonding strength, and minimum thermal stress were 164.8 N, 120.5 MPa, and 198 MPa, respectively.
Long-term experimental and practical experiences proved that abradability of coatings may be dramatically worse in the case of F t       200   N , and the structure may pose a safety risk if σ s 5   MPa . Therefore, data points in this range should be removed during comprehensive performance evaluations. After calculating the results for the remaining work conditions (as listed in Figure 15), the function reached its peak value of G m a x = 1.717 under the combination of a 25% porosity and 1 μm pore diameter. In future experimental studies, an emphasis should be placed on investigating the comprehensive performance of samples with a porosity of around 25%, and pore diameter close to 1 μm. These interesting results may provide a guide for the design optimization, and improvement of the microstructure and properties of coatings in future research.

4. Conclusions

In this article, the abradability, bonding strength, and thermal shock resistance of a YSZ abradable coating applied in the high-pressure turbines of aero-engines were studied by the finite element method numerical simulation and calculation. The following results were obtained.
(1) The bonding strength of the coating decreased gradually upon increasing the porosity from 5% to 50%. The abradability and thermal shock resistance of the coating were significantly improved when the porosity was above 20%. Porosity was the dominant factor affecting the abradability, bonding strength, and thermal shock resistance of the coating.
(2) The abradability, bonding strength, and thermal shock resistance of the coating increased initially and then decreased as the pore diameter increased from 0.5 μm to 1.5 μm. The performance of the coating could be improved by adjusting the pore size while keeping the porosity constant.
(3) The optimal comprehensive performance of the abradability, bonding strength, and thermal shock resistance of the coating were determined to be a combination of 25% porosity and 1 μm pore diameter according to an evaluation using the normalized weighting strategy.

Author Contributions

Conceptualization, X.C. and Y.Y.; methodology, X.C.and J.L.; software, X.C., S.D. and X.Z.; validation, X.C., J.L. and X.L.; formal analysis, Y.Y.; investigation, X.C.; resources, J.L.; data curation, X.C., S.D. and X.Z.; writing—original draft preparation, X.C.; writing—review and editing, X.C.; visualization, D.G.; supervision, D.Z.; project administration, D.G.; funding acquisition, D.Z. All authors have read and agreed to the published version of the manuscript.

Funding

This study was financially supported by the National Key R&D Program of China (No. 2018YFB2002000) and National Science and Technology Major Project (2017-Vll-0012-0109).

Institutional Review Board Statement

Not applicable.

Informed Consent Statement

Not applicable.

Data Availability Statement

Not applicable.

Conflicts of Interest

The authors declare no conflict of interest.

References

  1. Ye, X.; Tan, J.; Song, H.; Zhang, Q. Study Advances of Blade Tip Coatings for Aero-Engine. Mater. Prot. 2018, 2, 87–94. [Google Scholar] [CrossRef]
  2. Rajendran, R. Gas Turbine Coatings—An Overview. Eng. Fail. Anal. 2012, 26, 355–369. [Google Scholar] [CrossRef]
  3. Sporer, D.; Wilson, S.; Giovannetti, I.; Refke, A.; Giannozzi, M. On the potential of metal and ceramic based abradables in turbine seal applications. In Proceedings of the 36th Turbomachinery Symposium, Colorado Springs, CO, USA, 22–26 August 2007; pp. 79–86. Available online: https://www.researchgate.net/publication/284088243_On_the_potential_of_metal_and_ceramic_based_abradables_in_turbine_seal_applications (accessed on 27 February 2022).
  4. Bartsch, M.; Baufeld, B.; Dalkiliç, S.; Mircea, I. Testing and Characterization of Ceramic Thermal Barrier Coatings. Mater. Sci. Forum. 2005, 492–493, 3–8. [Google Scholar] [CrossRef]
  5. Sporer, D.; Wilson, S.; Dorfman, M. Ceramics for Abradable Shroud Seal Applications. In Advanced Ceramic Coatings and Interfaces IV; Zhu, D., Lin, H.T., Singh, D., Salem, J., Eds.; John Wiley & Sons: Hoboken, NJ, USA, 2009; pp. 39–54. [Google Scholar]
  6. Zhao, M.; Zhang, L.X.; Pan, W. Properties of Yttria-Stabilized-Zirconia Based Ceramic Composite Abradable Coatings. Key Eng. Mater. 2012, 512–515, 1551–1554. [Google Scholar] [CrossRef]
  7. Carpio, P.; Salvador, M.D.; Benavente, R.; Miranda, M.; Borrell, A.; Sánchez, E. Impact of feedstock nature on thermal conductivity of YSZ thermal barrier coatings obtained by plasma spraying. J. Ceram. Sci. Technol. 2016, 7, 307–312. [Google Scholar] [CrossRef]
  8. Aussavy, D.; Bolot, R.; Montavon, G.; Peyraut, F.; Szyndelman, G.; Gurt-Santanach, J.; Selezneff, S. YSZ-Polyester Abradable Coatings Manufactured by APS. J. Therm. Spray Technol. 2016, 25, 252–263. [Google Scholar] [CrossRef]
  9. Bardi, U.; Giolli, C.; Scrivani, A.; Rizzi, G.; Borgioli, F.; Fossati, A.; Partes, K.; Seefeld, T.; Sporer, D.; Refke, A. Development and investigation on new composite and ceramic coatings as possible abradable seals. J. Therm. Spray Technol. 2008, 17, 805–811. [Google Scholar] [CrossRef]
  10. Sporer, D.; Dorfman, M.; Xie, L.; Refke, A.; Giovannetti, I.; Giannozzi, M. Processing and Properties of Advanced Ceramic Abradable Coatings. In Proceedings of the International Thermal Spray Conference and Exposition, Beijing, China, 14–16 May 2007; pp. 143–148. [Google Scholar]
  11. Ren, X.; Guo, S.; Zhao, M.; Pan, W.; Ren, X.; Guo, S.; Zhao, M.; Pan, W. Thermal conductivity and mechanical properties of YSZ/LaPO4 composites. J. Mater. Sci. 2014, 49, 2243–2251. [Google Scholar] [CrossRef]
  12. Kim, S.H.; Sekino, T.; Kusunose, T.; Hirvonen, A.T. Thermal properties and microstructure of zirconia/monazite-type LaPO4 composites for powder preparation methods. Mater. Sci. Forum 2007, 544–545, 909–912. [Google Scholar] [CrossRef]
  13. Scrivani, A.; Rizzi, G.; Berndt, C.C. Enhanced Thick Thermal Barrier Coatings that Exhibit Varying Porosity. Mater. Sci. Eng. A 2008, 476, 1–7. [Google Scholar] [CrossRef]
  14. Scrivani, A.; Rizzi, G.; Bardi, U.; Giolli, C.; Miranda, M.M.; Ciattini, S.; Fossati, A.; Borgioli, F. Thermal Fatigue Behavior of Thick and Porous Thermal Barrier Coatings Systems. J. Therm. Spray Technol. 2007, 16, 816–821. [Google Scholar] [CrossRef]
  15. MForoushani, M.H.; Shamanian, M.; Salehi, M.; Davar, F. Porosity analysis and oxidation behavior of plasma sprayed YSZ and YSZ/LaPO4 abradable thermal barrier coatings. Ceram. Int. 2016, 42, 15868–15875. [Google Scholar] [CrossRef]
  16. Kavaliauskas, Z.; Kėželis, R.; Milieška, M.; Marcinauskas, L.; Valinčius, V.; Aikas, M.; Uscila, R.; Baltušnikas, A.; Žunda, A. Influence of different plasma spraying methods on the physical properties of YSZ coatings. Surf. Interfaces 2021, 24, 101120. [Google Scholar] [CrossRef]
  17. Wang, J.; Bai, L.; Ma, F.; Wan, S.; Yi, G.; Sun, J.; Tian, X.; Yang, Z. Evaluation of microstructure evolution of thermal barrier YSZ coating after thermal exposure. Ceram. Int. 2022, 48, 6681–6690. [Google Scholar] [CrossRef]
  18. Batailly, A.; Legrand, M.; Millecamps, A.; Garcin, F. Numerical-experimental comparison in the simulation of rotor/stator interaction through blade-tip/abradable coating contact. J. Eng. Gas Turbines Power 2012, 134, 082504-1-11. [Google Scholar] [CrossRef]
  19. Berthoul, B.; Batailly, A.; Stainier, L.; Legrand, M.; Cartraud, P. Phenomenological modeling of abradable wear in turbomachines. Mech. Syst. Signal Process. 2018, 98, 770–785. [Google Scholar] [CrossRef] [Green Version]
  20. Jiang, H.W.; Ren, Z.W.; Chen, W.Z.; Zou, Z.F. Simulation research on wear of optimum design coated carbide turning tools. Mach. Tool Hydraul. 2021, 49, 141–145. [Google Scholar] [CrossRef]
  21. Wu, Q.; Xu, W.; Zhang, L. Microstructure-based model of fracture of particulate reinforced metal matrix composites. Compos. Part B 2019, 163, 384–392. [Google Scholar] [CrossRef]
  22. Li, B.; Zhao, M.Y.; Wan, X.P. Influence of irregular-void on transverse tensile mechanical properties of composites. Acta Mater. Compos. Sin. 2019, 36, 356–361. [Google Scholar] [CrossRef]
  23. Limarga, A.M.; Vaßen, R.; Clarke, D.R. Stress Distributions in Plasma-Sprayed Thermal Barrier Coatings Under Thermal Cycling in a Temperature Gradient. J. Appl. Mech. 2011, 78, 011003-1-9. [Google Scholar] [CrossRef]
  24. Torkashvand, K.; Poursaeidi, E.; Ghazanfarian, J. Experimental and Numerical Study of Thermal Conductivity of Plasma-Sprayed Thermal Barrier Coatings with Random Distributions of Pores. Appl. Therm. Eng. 2018, 137, 494–503. [Google Scholar] [CrossRef]
  25. Liu, J.; Yu, Y.; Liu, T.; Cheng, X.; Shen, J.; Li, C. The Influence of Composition and Microstructure on the Abradability of Aluminum-Based Abradable Coatings. J. Therm. Spray Technol. 2017, 26, 1095–1103. [Google Scholar]
  26. Lu, Q.Y.; Shen, J.; Yu, Y.G.; Ren, X.J.; Xuan, H.J.; Liu, T. Progress on Facilities and Methodology to Evaluate Abradable Seal Coatings. Adv. Mater. Res. 2013, 690–693, 1992–1998. [Google Scholar] [CrossRef]
  27. Cheng, X.; Yu, Y.; Zhang, D.; Liu, T.; Liu, J.; Shen, J. Preparation and Performance of an Abradable NiCrFeAlBN-YSZ-NiCrAl Layered Seal Coating for Aircraft Engines. J. Therm. Spray Technol. 2020, 29, 1804–1814. [Google Scholar] [CrossRef]
  28. Gao, P.; Zeng, S.; Jin, C.; Zhang, B.; Chen, B.; Yang, Z.; Guo, Y.; Liang, M.; Li, J.; Wang, W.; et al. Mechanical Properties of Multi-Sized Porous Thermal Barrier Coatings at Micro and Nano Scales after Long-Term Service at High Temperature. Coatings 2022, 12, 165. [Google Scholar] [CrossRef]
  29. Brinkiene, K.; Kezelis, R.; Brinkiene, K.; Kezelis, R. Correlations between processing parameters and microstructure for YSZ films produced by plasma spray technique. J. Eur. Ceram. Soc. 2004, 24, 1095–1099. [Google Scholar] [CrossRef]
  30. Khor, K.; Gu, Y.; Dong, Z.; Khor, K.; Gu, Y.; Dong, Z. Mechanical behavior of plasma sprayed functionally graded YSZ/NiCoCrAlY composite coatings. Surf. Coat. Technol. 2001, 139, 200–206. [Google Scholar] [CrossRef]
  31. Steffens, H.D.; Babiak, Z.; Gramlich, M. Some Aspects of Thick Thermal Barrier Coating Lifetime Prolongation. J. Therm. Spray Technol. 1999, 8, 517–522. [Google Scholar] [CrossRef]
  32. Gao, P.-H.; Zeng, S.-C.; Jin, C.; Zhang, B.; Chen, B.-Y.; Yang, Z.; Guo, Y.-C.; Liang, M.-X.; Li, J.-P.; Li, Q.-P.; et al. Thermal Conductivity of Multi-Sized Porous Thermal Barrier Coatings at Micro and Nano Scales after Long-Term Service at High Temperatures. Coatings 2021, 11, 1183. [Google Scholar] [CrossRef]
Figure 1. SEM image of the YSZ coating: (a) original, (b) Binarized.
Coatings 12 00438 g001
Figure 2. Schematic diagram of the pore profile.
Coatings 12 00438 g002
Figure 3. Porosity distribution for the YSZ coating samples.
Coatings 12 00438 g003
Figure 4. Pore diameter distribution for the YSZ coating samples.
Coatings 12 00438 g004
Figure 5. Schematic diagram of the simulation processes: (a) abradability and scraping process simulation, (b) bonding strength and tensile test simulation, (c) thermal shock resistance and thermal cycling process simulation.
Coatings 12 00438 g005
Figure 6. Stress distribution cloud map for the coating at different scraping times, (a) t = 0.008 μs, (b) t = 0.01 μs, and (c) t = 0.012 μs.
Coatings 12 00438 g006
Figure 7. Curves of the scraping contact force with scraping time: (a) 1.5 μm pore diameter, (b) 20% porosity.
Coatings 12 00438 g007
Figure 8. Plot of mean scraping contact force variation with porosity and pore diameters: (a) 1.5 μm pore diameter, (b) 20% porosity.
Coatings 12 00438 g008
Figure 9. Stress distribution cloud map for coatings in different test times: (a) initial stage, (b) stretching stage, (c) fracturing stage.
Coatings 12 00438 g009
Figure 10. Curves of tensile strength versus loading steps: (a) 1.5 μm pore diameter, (b) 20% porosity.
Coatings 12 00438 g010
Figure 11. Plot of bonding strength versus porosity and pore diameter: (a) 1.5 μm pore diameter, (b) 20% porosity.
Coatings 12 00438 g011
Figure 12. Curves of interfacial thermal stress versus time: (a) 1.5 μm pore diameter, (b) 20% porosity.
Coatings 12 00438 g012
Figure 13. Plot of maximum interface stress versus porosity and pore diameter: (a) 1.5 μm pore diameter, (b) 20% porosity.
Coatings 12 00438 g013
Figure 14. Simulation results of the coating properties under different work conditions.
Coatings 12 00438 g014
Figure 15. Evaluation results of comprehensive performance calculated by the function.
Coatings 12 00438 g015
Table 1. Technological parameters of thermal spraying.
CoatingTechnologyArgon Flow Rate/slpmHydrogen Flow Rate/slpmPowder Feed Rate/g/minPower/kwSpray Distance/mmVacuum/mbar
MCrAlYLow-pressure plasma spraying100~10510~1210070~75380~42015~35
YSZHigh energy plasma spraying50~5512~1620050~60110~130/
Table 2. Porosities and pore diameters of the YSZ coating for evaluation by simulated work.
Porosity5%10%15%20%30%40%50%
Pore
Diameter
0.5 μm//////
0.75 μm//////
1 μm//////
1.25 μm//////
1.5 μm
● selected porosities and pore diameters as input conditions.
Table 3. Description of the FEM simulation models.
Simulation TypeSoftware Geometry SizeBoundary ConditionsCalculation Terminating Criteria
AbradabilityLS-DYNA
(ANSYS)
25 μm × 10 μmThe bottom and the side faces were immobilized; the blade-tip penetrated the coating surface (depth: 0.3 μm) to scrape the coating surface at a velocity of 350 m/s.Blade displacement > 25 μm
Bonding strengthABAQUSCoating: 30 μm × 1.5 mm
Substrate:
30 μm × 3 mm
The substrate bottom was immobilized and a tensile load is applied to the coating surface. Moreover, the initial load was set at 0 N and then gradually increased until tensile failure occurred in the model.σmax > σb, σb = 215 MPa (in Table 4)
Thermal shock resistanceThe model experienced heat preservation for 10 min at an external environment temperature of 1050 °C and then cooled down to 25 °C within 3 min. The thermal load was applied to the surface of the coating.t > 15 min
Table 4. Physical and mechanical property parameters of the matrix and the coating.
MaterialT
(°C)
E
(GPa)
νσb
(MPa)
Ρ
(kg/m3)
α
(ppm/°C)
λ
(W/m·K)
C
(J/kg·K)
IN-738262020.3953850011.448.72428
65016581714.4419.66594
80015678915.1622.28636
90015055515.6424.03675
100014434416.1225.78727
YSZ25500.25215510010.000.70479
5009.64445
100010.34445
Table 5. Data comparison for simulation and experimental results.
TypeIndexExperimental DataSimulation DataError
AbradabilityThe contact force of the blade-scraping coating164.8 N176 N6.3%
Bonding strengthTensile fracture strength13.8 MPa14.2 MPa3.1%
Publisher’s Note: MDPI stays neutral with regard to jurisdictional claims in published maps and institutional affiliations.

