Abstract
Although it is a consensus in academic circles that regulation works will change a channel’s shape, the quantitative relationship between the finite control boundary and the channel’s shape parameters is still unclear. In this study, a flume model test was carried out, and the evolution of channel’s shape under different engineering densities was qualitatively analyzed. Based on the construction of river regulation works and measured hydrological data of the wandering channel in the lower Yellow River from 1960 to 2014, the channel shape parameters (bending coefficient, swing range of the main streamline and river facies coefficient) of the wandering channel in different periods were calculated, and the variation in the channel shape parameters with the density of regulation works in different periods was analyzed. The results showed that the river regime cannot be effectively controlled with less dense regulation works; in this case, the regulation works have little impact on the channel’s morphology. With an increase in the density of regulation works, the evolution of channel morphology was obviously different. Specifically, the river bending coefficient increased as a whole from 1.14 in 1949–1960 to 1.32 in 2011–2014, indicating that the regulation works have had an obvious restraining and improving effect on the river’s morphology. The swing range of the main stream obviously decreased, with an average value of about 500 m; the river facies coefficient decreased dramatically from 20~88 before 1960 to 15 in 2014, and the channel morphology has developed with a tendency to be narrow and deep. The research showed that a finite control boundary can significantly improve the channel’s shape, limit the wandering characteristics of the river reach to a certain extent, stabilize the main stream and control the river’s regime.
1. Introduction
Before channel regulation in the lower Yellow River, the water’s surface was wide, the sandbars in the river were dotted, the branches crisscrossed, the river regime was scattered and the main stream swung greatly and quickly. The rapid evolution of the river regime made the dikes in the lower Yellow River burst frequently, and the flood control pressure was huge. In order to control floods on both banks in the lower Yellow River and to ensure the safety of people’s lives and property in the beach area, in the 1950s, regulation projects were built in the meandering reach below Taochengpu in the lower Yellow River. After their success, regulation was extended to the intermediate reach between Gaocun and Taochengpu in the 1960s, which achieved great success. Based on the experience of regulating the meandering and intermediate reach, and with continuous optimization and improvements in the principles of river regulation, in the 1980s, the wandering channel above Gaocun in the lower Yellow River became the focus of governance [1]. During the “National Projects of the Eighth Five-Year Plan” period, the Yellow River regulation workers analyzed the laws of the evolution of the wandering river channel in the lower Yellow River and put forward the “slightly curved regulation scheme” [2,3]. After the implementation of the scheme, the swing range of the main stream and boundary of the wandering river channel were significantly reduced, and the river regime of most river sections was initially controlled, which protected the embankment’s safety and relieved the downstream flood control pressure to a certain extent. Since 2006 especially, the process of river regulation has been accelerated, the density of regulation works has increased significantly, and the “wide, shallow, scattered and chaotic” channel shape has been further improved. In the past few years, the water and sediment conditions in the lower Yellow River have changed, and the strong wandering characteristics of the wandering river reach have made the evolution of the section shape of the wandering river more complex.
For a long time, researchers have carried out considerably research on the change in cross-section shape in the lower Yellow River, and have pointed out that the water and sediment conditions and river boundary conditions have an important impact on the evolution of the river section’s shape. In terms of the influence of the incoming water and sediment conditions on the evolution of river section morphology, based on the method of theoretical analysis, the correlations of the river section’s morphology with water and sediment factors have been studied. It is considered that the quantity of water is the main factor affecting the section’s morphology [4], and the mechanism of evolution of the river section’s morphology under different water and sediment conditions has been discussed [5,6]. Based on data on the water and sediment and the measured large section, the process of change [7] and the adjustment law [8,9] of the river’s section shape in different periods and under different water and sediment conditions have been analyzed. The response relationship between variation in the water and sediment, and the parameters of the river section in the Yellow River were also analyzed [10], and the process of change in the river section’s shape in the lower Yellow River and its response relationship with incoming water were discussed [11]. In terms of the influence of river boundary conditions on the evolution of the river’s morphology, the influence of river boundary conditions on section morphology was qualitatively studied by a physical model test [12,13]. In terms of the evolution of the channel shape parameters, the temporal and spatial variation laws and process of adjustment of the channel shape parameters in the lower Yellow River in different periods have been analyzed by means of measured data, theoretical derivations and physical model tests [14,15], and a theoretical system of adjusting the channel’s cross-section shape has been preliminarily established [16]. In recent years, due to the abnormal changes in the global and local climate, the annual precipitation in the Yellow River Basin has changed [17,18,19,20,21,22]. Specifically, extreme precipitation in the Yellow River Basin has tended to increase [23] (such as the 7.20 rainstorm in Zhengzhou City, Henan Province, China in 2021), which directly affects the temporal and spatial distribution of water and sediment in the lower Yellow River [24], which poses a great threat to flood control in the lower Yellow River (for example, the autumn flood of the Yellow River in 2021 caused by extreme precipitation was the most severe flood in the Yellow River Basin in recent decades).
Yuan et al. [25] proposed a quick analysis of the silt sediment, and the trends of variations in the fluvial facies in small-scale river reaches, but this is limited to only a single water and sediment condition. Wang et al. [26] analyzed changes in the main-channel geometry of the lower Yellow River before and after the operation of the Xiaolangdi Reservoir. This research showed that the cross-sectional geomorphic coefficient was mainly related to discharge and the suspended sediment concentration, and the correlations of the cross-sectional geomorphic coefficient with discharge and the suspended sediment concentration were obviously different in different river sections. Xie et al. [27] combined the morphological indices extracted from remote sensing images with hydrological and geomorphological field measurements, and qualitatively analyzed the evolution of the channel morphology of the Yellow River over the last 60 years. The analysis identified that the width of the wandering belt changed at the highest degree of correspondence between the width/depth ratio of the main channel, and variations in both are related most closely to the average flow discharge and to the sediment concentration during the flood seasons.
The research described above shows that different incoming water and sediment and river boundary conditions play a very important role in the evolution of river channel morphology. However, most of the current results are based on these two aspects in analyses of the evolution of the downstream river morphology in the Yellow River. Occasionally, the impact of channel regulation works on the evolution of river morphology has also been qualitatively described through experimental means [28], and there is still a lack of quantitative research on the morphological evolution of the channels under the action of regulation works in the lower Yellow River in different periods. Taking the wandering river in the lower Yellow River as the research object in this article, based on a model test (qualitative research) and measured data (quantitative research), the impact of the finite control boundary on the river’s morphology was systematically and comprehensively analyzed. First, the regulation process and project density of the wandering reach in the lower Yellow River from 1960 to 2014 were systematically counted, based on the long series of measured hydrological data (1960–2014) of the wandering reach in the lower Yellow River. The river shape parameters such as the river bending coefficient, the swing range of the main streamline and the river facies coefficient were quantitatively calculated, and the long-term evolution process of river shape in the downstream wandering reach under the action of a finite control boundary was analyzed. It should be noted that the finite control boundary here refers to river regulation works undertaken in different periods, which will be described later. article paper provides a certain basis for understanding and expanding the riverbed evolution laws of a wandering river. The research results have important theoretical significance and practical value for river regulation.
2. Materials and Methods
2.1. Study Object
2.1.1. Study Area
According to the characteristics of different river sections, the downstream channel in the lower Yellow River can be divided into the wandering reach, the transitional reach and the meandering reach (Figure 1). Of these, the wandering channel is located above Gaocun and is 299 km long, with a longitudinal gradient of 0.172~0.265‰. The river is relatively straight, the height difference between the beach and channel is small, the beach land is broad, the river flow is scattered, the section is wide and shallow, the width of the main channel is about 3~5 km and the main stream is uncertain. The river channel is severely scoured and silted, the river regime is strongly wandering, the section shape changes frequently, and the variation range of the river facies coefficient is large. The Gaocun–Taochengpu reach is a transitional reach, with a length of 165 km. The difference in elevation between the beach and channel is relatively greater, the flat beach channel is somewhat narrowed, the position of the main channel of the river is relatively fixed, and the wandering of the river is weakened. Taochengpu–Lijin is a meandering reach with a length of 318 km. The river channel of this reach is narrow and deep, and the height difference between the beach and trough is large. Of these reaches, the wandering channel in the lower Yellow River has frequently burst in historical periods, and thus, this has been the key reach for flood control in the Yellow River and was the key research object in this paper.
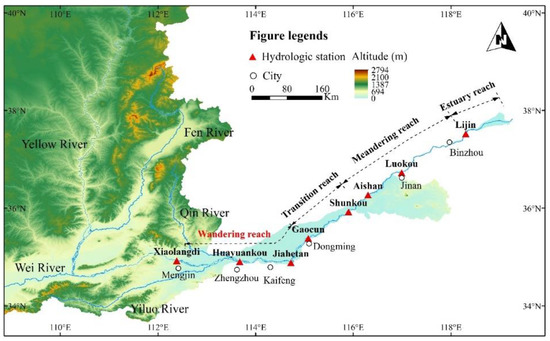
Figure 1.
Schematic diagram of the lower Yellow River.
2.1.2. Finite Control Boundary
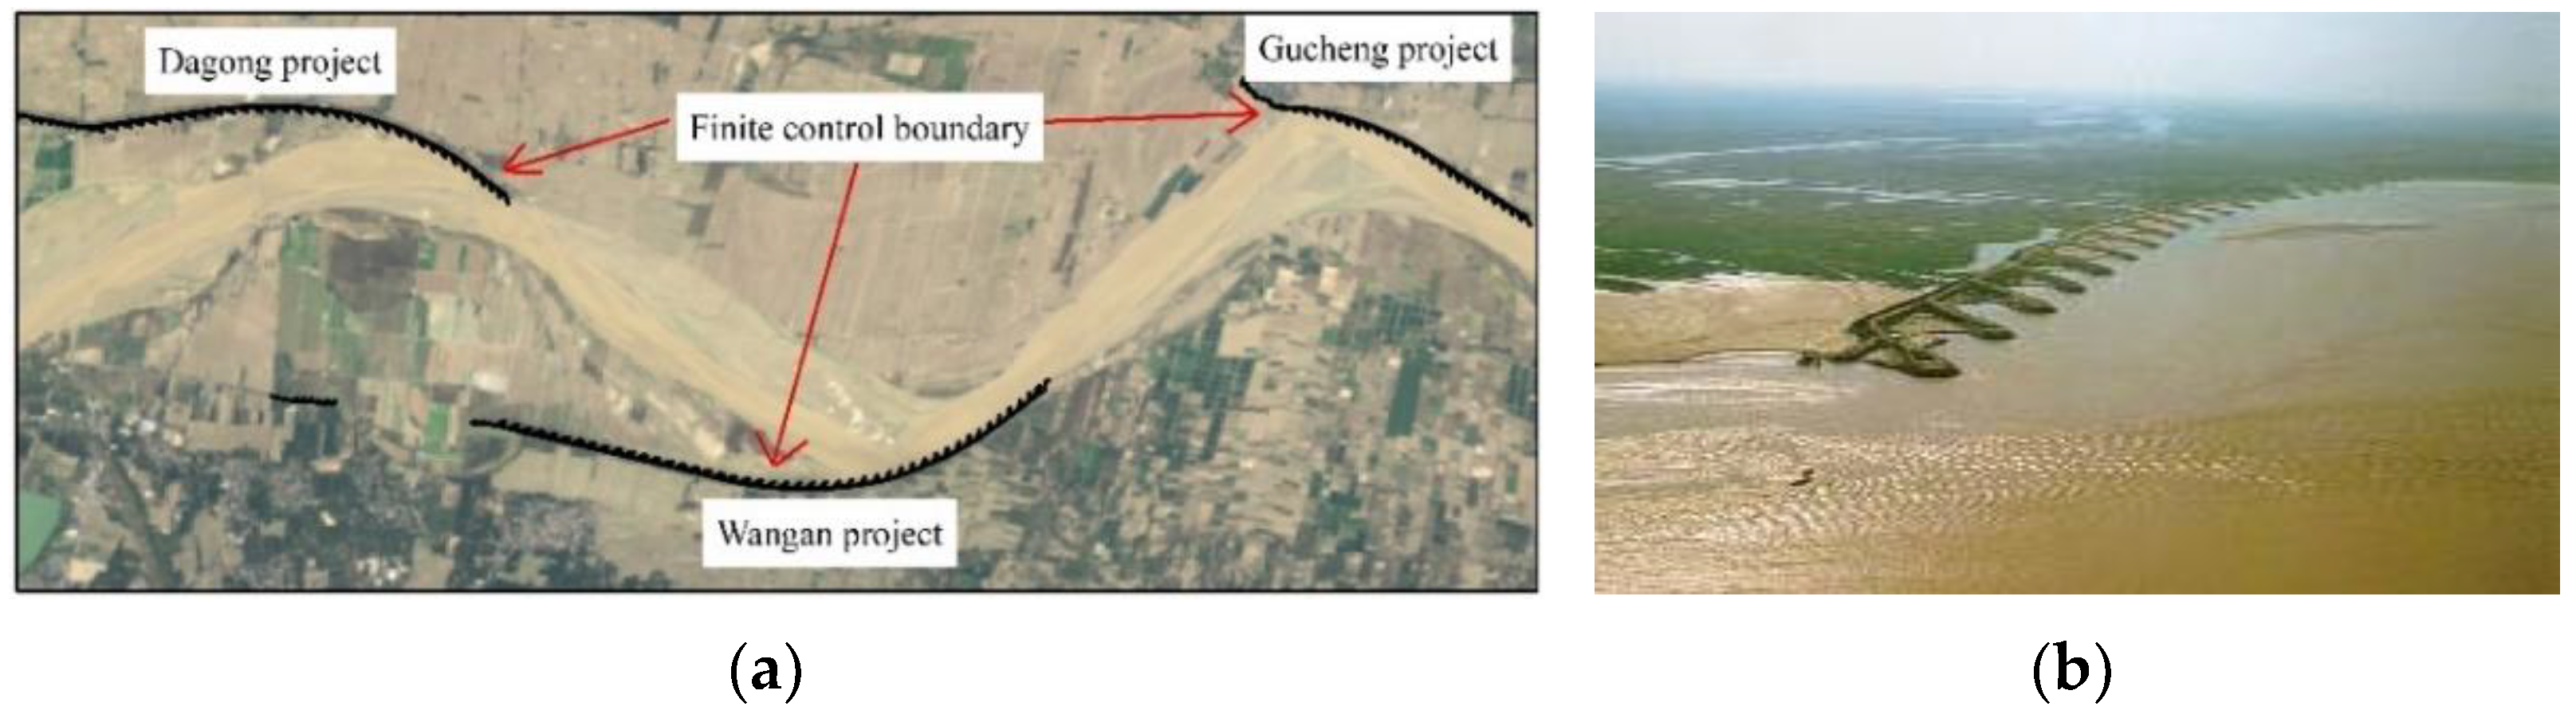
In order to meet people’s demand for water resources and a continuous increase in land area, China’s rivers have changed significantly in the past 60 years. With the continuous construction of dams, the water and sediment process of the river has changed greatly. At the same time, more attention should be paid to the fact that with the enhancement of river development and utilization in the last decade, according to the laws of evolution of a wandering natural river channel, some river regulation projects have been built alternately on the concave bank of the river channel, which can transport flood and sediment during large floods and maintain the stability of the river regime in small and medium floods. The original natural (or relatively weakly constrained) river boundary has gradually evolved into a soft and hard boundary composed of river regulation works and natural riverbanks. This boundary is different from the natural channels formed solely by water and sediment movement or channels that have been completely constructed by artificial works, but the river channel has a finite control boundary (Figure 2).

Figure 2.
River channel with a finite control boundary: (a) Local reach in the lower Yellow River; (b) river regulation project in the lower Yellow River.
2.2. Methods
2.2.1. Model Test
(1) Model Setup
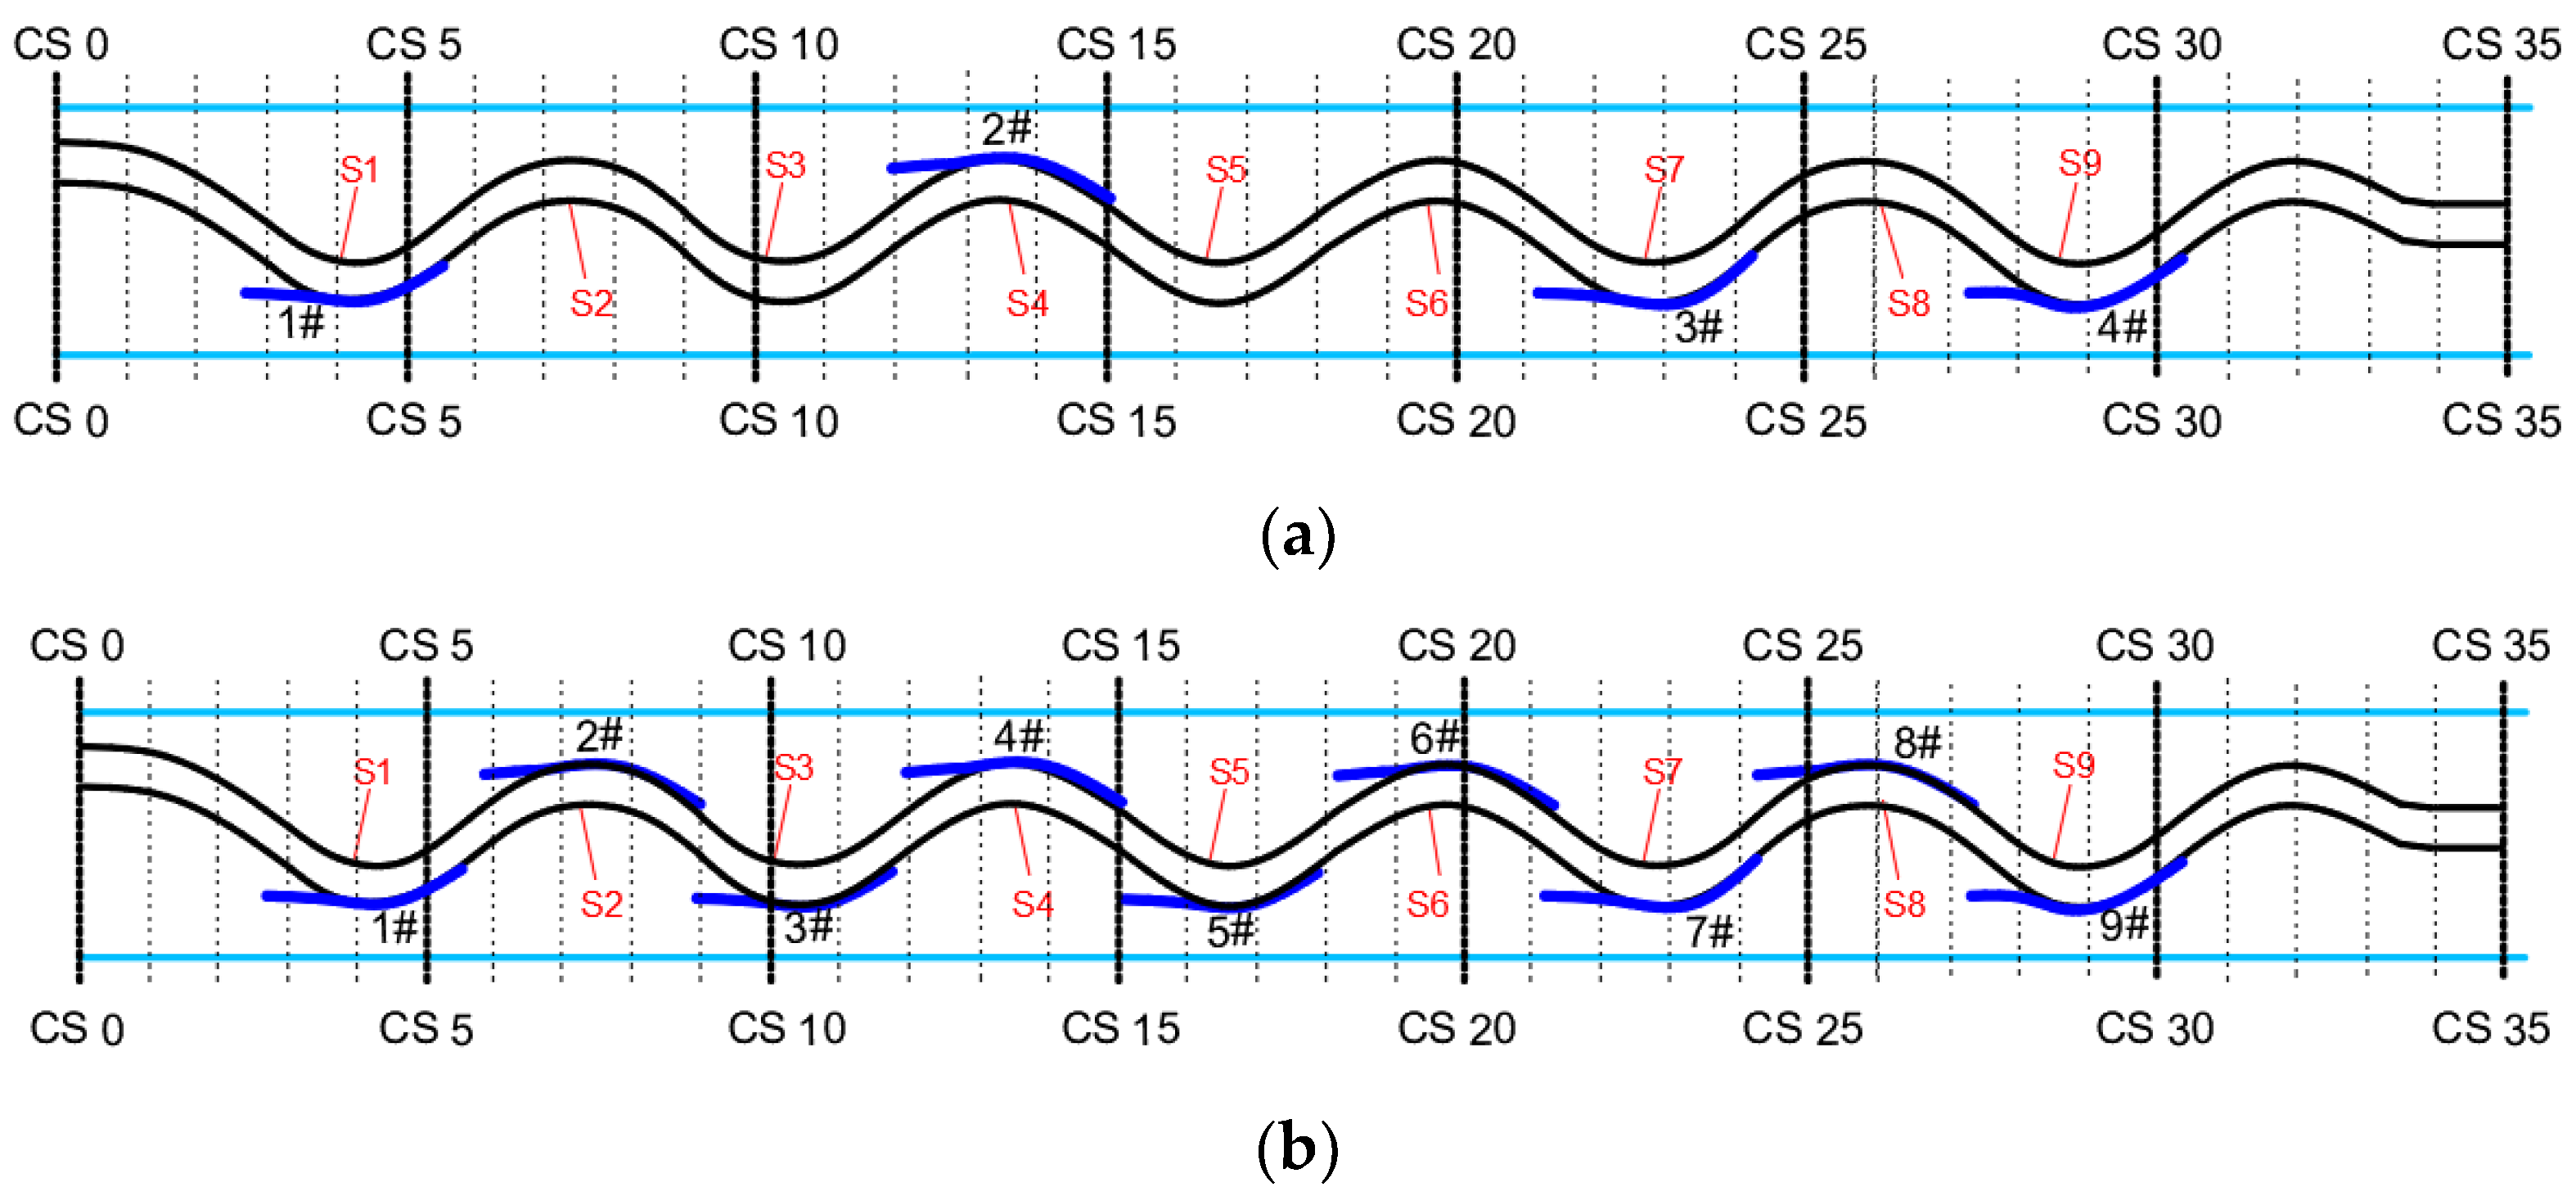
In order to study the effect of finite control boundaries with different constraint intensities of on the river channel’s morphology, experiments on the evolution of river channel morphology with different engineering constraints were carried out. The experimental flume was 40 m long and 3.5 m wide, the horizontal scale of the model was 1:1500 and the vertical scale was 1:120. The model sand was fly ash, and the riverbed gradient was 0.2‰. With different engineering densities taken as the test parameters, model tests under the constraint of multiple groups of regulation works were designed. The tests were divided into two groups, namely tests with four works and tests with nine works, and the corresponding engineering densities were 41% and 75%, respectively. The specific layout of the river training works is shown in Figure 3.
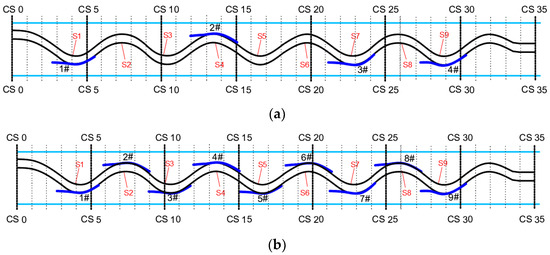
Figure 3.
Scheme of the model test layout: S1 to S9 represent river bends. (a) Four regulation works: 1#~4#, respectively, refer to Project 1, Project 2, Project 3 and Project 4. (b) Nine regulation works: 1#~9#, respectively, refer to Project 1, Project 2, Project 3, Project 4, Project 5, Project 6, Project 7, Project 8 and Project 9.
(2) Water and sediment conditions
After the operation of the Xiaolangdi Reservoir, there has been a continuous small flow process in the lower Yellow River, and the flow at Huayuankou Station is basically maintained below 1000 m3/s outside the flood season. During the period of water and sediment regulation, there is a flood peak flow of about 4200 m3/s. After water and sediment regulation, there is a flood peak flow of about 2600 m3/s in the flood season. Therefore, in line with the flow process of Huayuankou Station, and keeping the annual water volume basically the same as the average water volume of Huayuankou Station in recent years, the model test determined the three groups of water and sediment sequences as shown in Table 1.

Table 1.
Water and sediment levels in model tests under different engineering densities.
2.2.2. Calculation of the Prototype’s Data
(1) Density of River Regulation Works
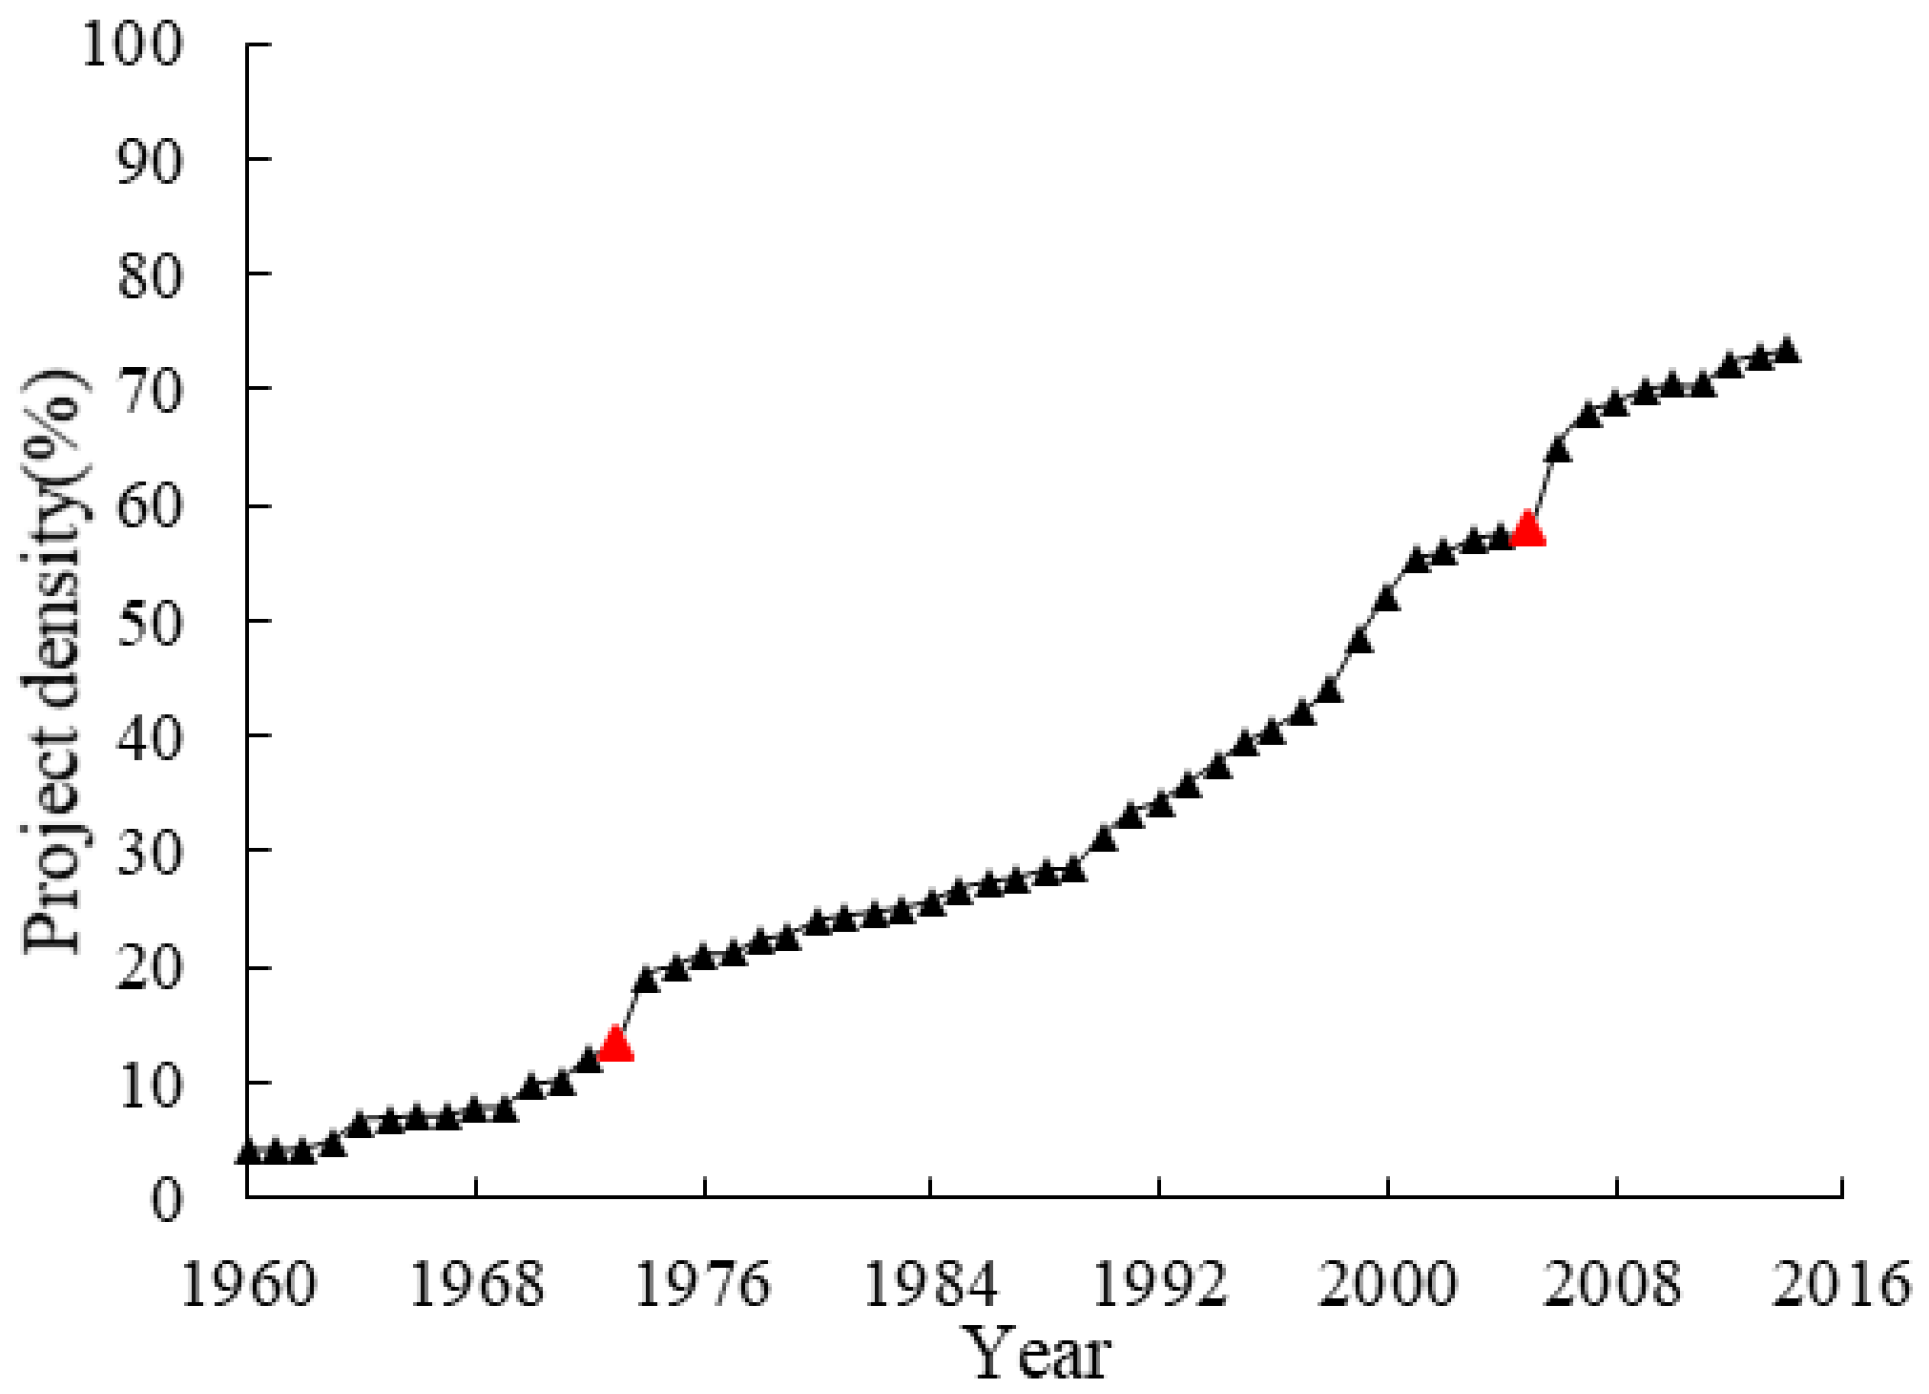
In order to better reflect the construction of wandering channel works, the density of river regulation work was defined as the ratio of the total length of regulation works built in the wandering channel to the length of the river channel. This index reflects the extent to which the river regulation works can restrain the river regime of this reach. The specific process of construction and reconstruction in Baihe–Gaocun reach of the wandering reach in the lower Yellow River is collected. The collected data were sorted according to the year, and the change in the river regulation project densities of this reach from 1960 to 2014 were charted (Figure 4). Here, the river regulation works only include control works that restrict the river regime, excluding the works easily damaged. As can be seen from Figure 4, the engineering densities of this river section are increasing year by year. Through a combination of the inflection point of the change curve in the figure and the actual situation of the river training projects in the lower Yellow River, the construction projects can be roughly divided into three periods, namely 1960–1973, 1974–2005 and 2006–2014. Among these, the period from 1974 to 2005 was the most intensive construction period of wandering channel control projects, and the project density increased from 16% in 1974 to 55% in 2005, with an increase of about 244%. Since 2005, due to the strong artificial constraints on the river channel, most of the river regulation works have involved the reconstruction and expansion of existing projects. By 2014, the density of wandering channel control works reached about 75% [29]. It should be noted that after 2014, the existing control works have been repaired and reinforced according to the location of accidents in the river channel, and few large-scale projects will be built. Therefore, the density of regulation works has changed little after 2014. Therefore, the time range in this article is 1960–2014.
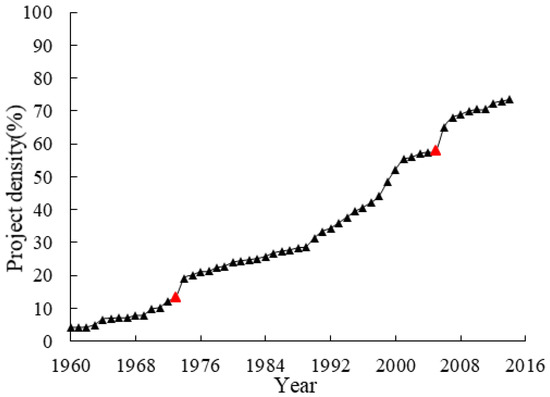
Figure 4.
Density of wandering river regulation works in the lower Yellow River from1960 to 2014.
(2) Method of calculating the channel shape parameters
The channel shape includes two aspects: plane shape and section shape. Generally, the plane shape of the river is expressed by the bending coefficient of the river, and the swing range of the main streamline also reflects the evolution of the river on the plane to a certain extent. The river section shape is expressed by the river facies coefficient.
(A) Bending coefficient
The bending coefficient of the river indicates the bending degree of the river, and its change reflects the change in the main stream length. The bending coefficient of the river is equal to the ratio of the actual length of the reach to the straight-line length of the reach, which can be expressed by the following equation:
where K is the bending coefficient, L is the actual length of the reach (in km) and l is the straight-line length of the reach (in km). The river bending coefficients of the wandering channel in the lower Yellow River were calculated from 1949 to 2014 in this study.
K = L/l
(B) Main streamline swing range.
The data of each typical section in the wandering reach of the lower Yellow River (Tiexie–Gaocun) since 1960 were systematically collected, including 53 sections from 1960 to 1997 and 148 sections from 1998 to 2014. The main streamline swing range is expressed by the absolute value of the difference between the abscissa distance corresponding to the thalweg point of the main streamline before the flood season and the abscissa distance corresponding to the thalweg point of the main streamline after the flood season every year, as shown in the following equation:
where MS represents the swing range of main streamline (in km), abs represents the absolute value of a certain value, Sa represents the abscissa value corresponding to the thalweg point of the main streamline of a section before the flood season (in km) and Sb represents the abscissa value corresponding to the thalweg point of the main streamline after the flood season (in km).
MS = abs(Sa − Sb)
(C) River facies coefficient
The river facies coefficient is the main parameter representing the cross-section shape of the river channel. The changes in the cross-section shape of each river reach before and after river regulation are different. It is expressed by the following formula:
where ξ represents the river facies coefficient, B is the bankfull channel width (in m) and H is the bankfull channel depth (in m). The bankfull channel width and the bankfull channel depth of typical sections in the wandering reach of the lower Yellow River from 1960 to 2014 were systematically collected, and the river facies coefficient was calculated by Formula (3).
3. Results
3.1. Model Test Results
The evolution of channel shape evolution under different engineering constraints is was studied by the flume model test.
3.1.1. Four Projects
(1) Section shape change
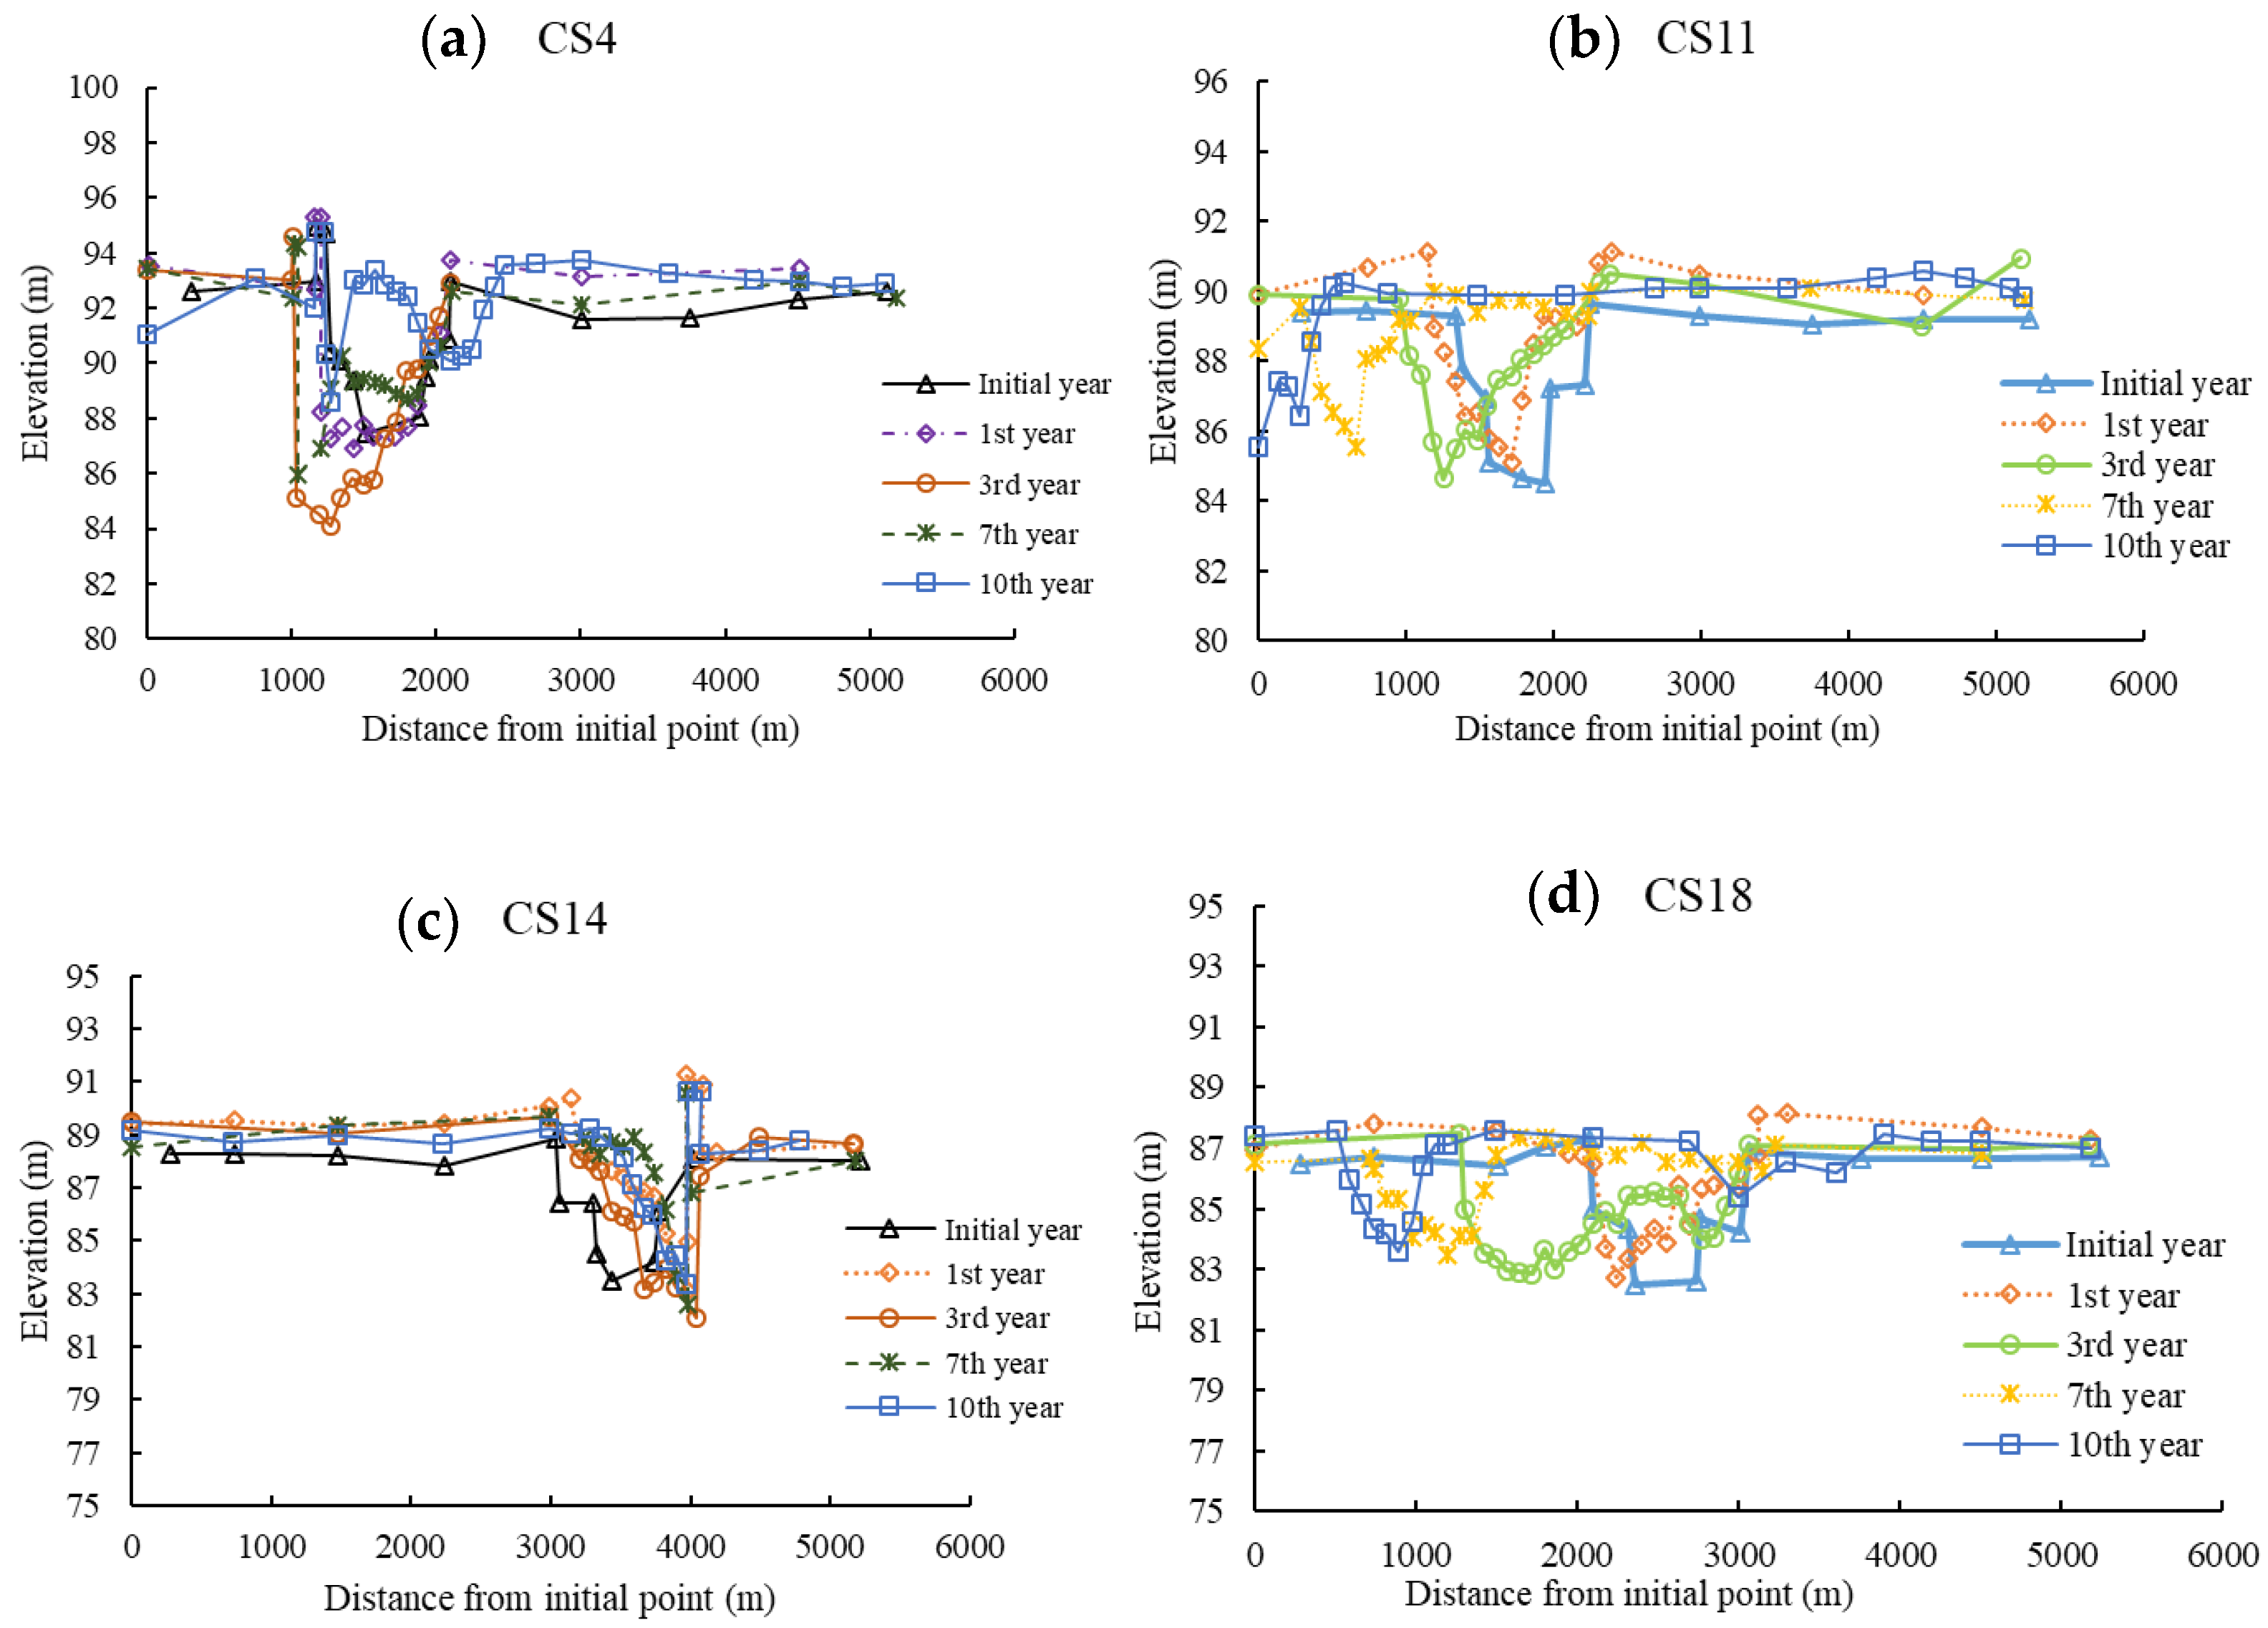
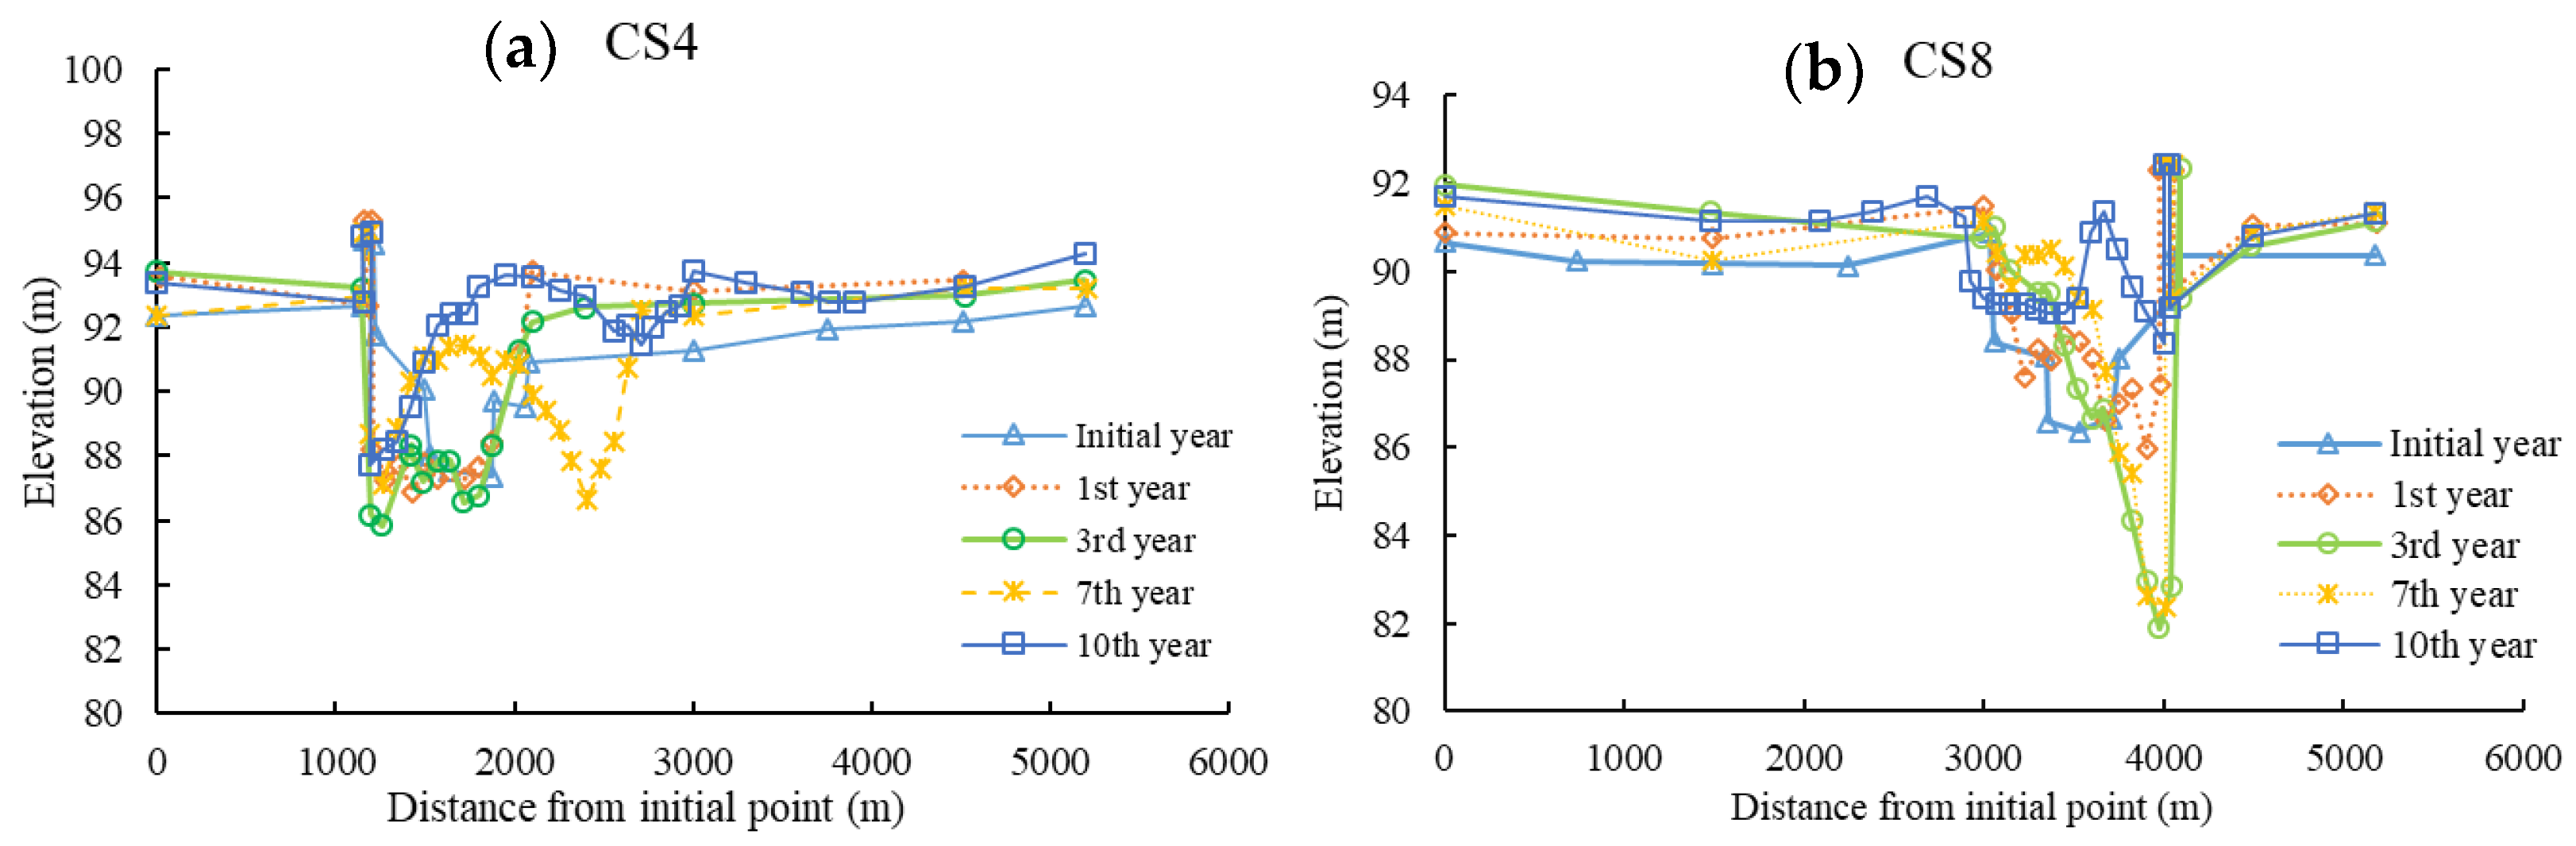
The controlling effect of four projects on the river regime was relatively poor, and the river’s morphology altered frequently and violently. When the clear water sequence was released, each section of the main channel was scoured, the water depth increased and the section shape developed to become narrow and deep. After changing the water and sediment conditions and increasing the sediment concentration, the riverbed silted up and rose, and the shape of the river section gradually changed from narrow and deep to wide and shallow. Sections CS11 and CS18 at the top of the bend were not constrained by the project, and river channel siltation at these points was more serious. With a small sediment concentration, the main streamline of this reach began to swing laterally near the side wall of the flume. When the sediment concentration continued to increase, the flow continued to brush downwards near the side wall, ultimately forming a deformed river regime. Sections CS4 and CS14 had no obvious morphological changes due to the engineering constraints (Figure 5).
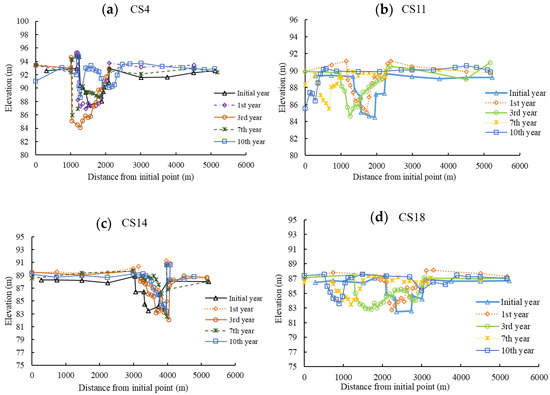
Figure 5.
Graphs of different section shapes with four projects: (a–d) respectively show CS4 section, CS11 section, CS14 section and CS18 section morphological adjustment in different years.
(2) Changes in the width–depth ratio
Table 2 and Table 3 show the changes in the morphological parameters of nine typical sections of the test reach. It can be seen that for the sections constrained by the project, the width–depth ratio gradually decreased during clear water scouring. After a continuous increase in the sediment concentration, the river channel gradually silted up and the width–depth ratio increased again. For the curved section not controlled by the project, the shape altered rapidly, the width–depth ratio became larger and the shape of the section changed rapidly.
Table 2.
Statistics of the bend section shape parameters constrained by four projects.
Table 3.
Statistics of the bend section shape parameters unconstrained by the four projects.
(3) Swing of the thalweg point of the section
Table 4 shows the annual swing distances of the thalweg point of a typical section with four engineering projects. It can be seen that the thalweg of each section in this group of tests swung frequently. For sections that were not subject to engineering constraints, such as Sections CS8, CS11, CS18 and CS20, the single maximum swing was more than 400 m, and under conditions a low sediment concentration, the section swung near the side wall of the flume.
Table 4.
Swing distance of each section year by year with four river training projects (unit: m).
3.1.2. Nine Projects
(1) Changes in section shape
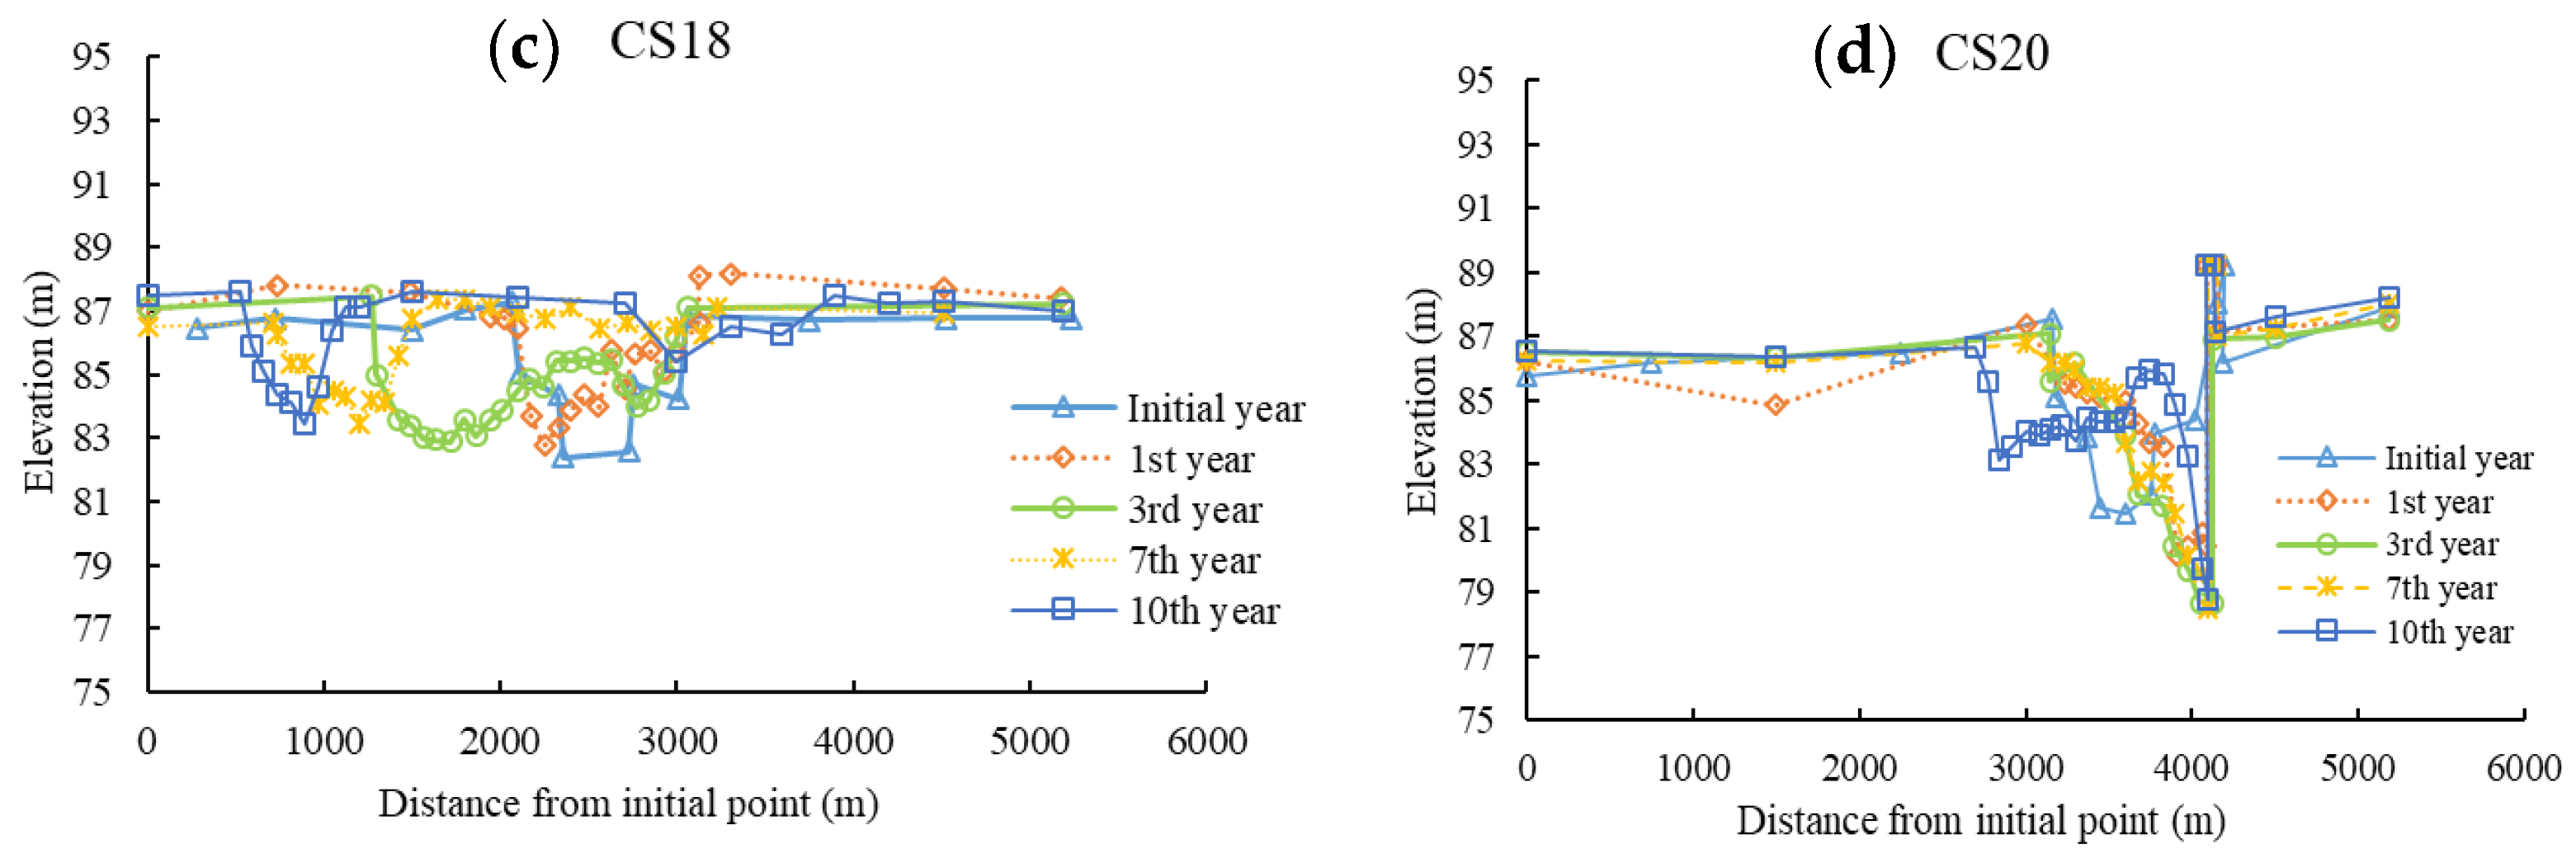
The group of nine projects had good control on the river channel. When the water and sediment conditions changed, the river sections’ shape did not change significantly, and the regularity was relatively consistent. When the clear water sequence was released, each section of the main channel was scoured, the water depth increased and the section shape tended to be narrow and deep. After a change in the water and sediment conditions and an increase in the sediment concentration, the main channel silted up to a certain extent and the average elevation of the riverbed increased but the change in the overall section shape was not obvious. However, even if some bends were constrained by the project, their section shape was altered to a certain extent with an increase in the sediment concentration (Figure 6).
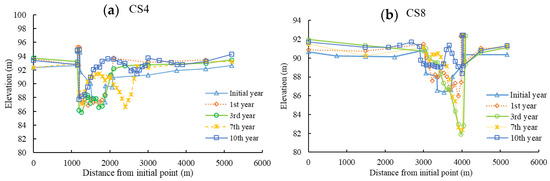
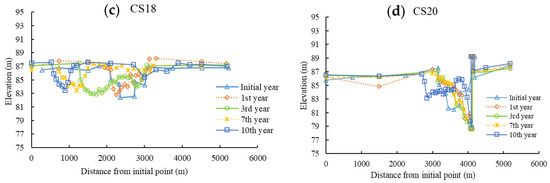
Figure 6.
Graphs of different section shapes (nine projects): (a–d) respectively show CS4 section, CS8 section, CS16 section and CS20 section morphological adjustment in different years.
(2) Changes in the width–depth ratio
Table 5 shows the changes in morphological parameters of four typical sections in the test reach with nine projects. It can be seen that all sections were well constrained by the projects. Although the width–depth ratio first decreased and then increased with an increase in the sediment concentration, the overall value changed little and the regularity was very consistent, indicating that the stability of the river channel was good at this time.
Table 5.
Statistics of the bend section shape parameters constrained by nine projects.
(3) Swing of the thalweg point of the section
Table 6 shows the annual swing distance of thalweg point of typical sections in the tests with nine regulation works. It can be seen that due to the increase in the density of river regulation works, the river channel was subject to strong artificial constraint, as the annual swing amplitude of each section was lower than that of the test with four projects, and the river channel was relatively stable as a whole.
Table 6.
Swing distance of each section year by year with nine river training projects (unit: m).
3.2. Evolution of the Morphological Parameters of the Natural River Channel
The model test was used to qualitatively examine the evolution of the river channel’s morphology under constraint by different engineering densities. The measured natural data were used to quantitatively calculate the evolution of river channel morphology with the increase in the regulation engineering densities in different periods.
3.2.1. River Bending Coefficient
Table 7 shows the main streamline bending coefficient of the wandering channel from 1949 to 2014, and Figure 7 shows the process of these changes and the corresponding changes in the engineering density in different periods.
Table 7.
Bending coefficient of main streamline in the wandering reach from 1949 to 2014.
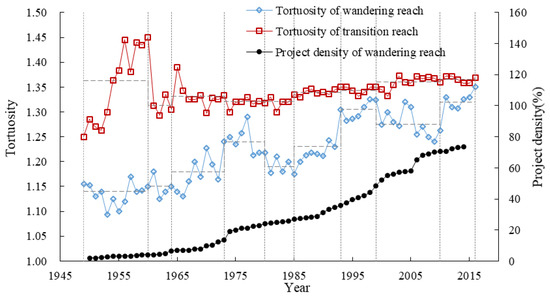
Figure 7.
Variation in the bending coefficient and engineering density in different periods in the wandering reach.
It can be seen from Figure 7 and Table 7 that before 1960, the characteristics of the wandering section in the lower Yellow River were particularly obvious. Except for some projects in the section from Jiubao to Dongbatou, there were no engineering constraints in other sections during this period. From 1960 to 1964, the bending coefficient decreased sharply, which was due to the operation of the Sanmenxia Reservoir, and the relationship between water and sediment was still good during this period. After the open discharge of the Sanmenxia Reservoir, the river regime began to wander again, and the engineering density was inadequate during this period. Before 1994, the engineering density along the wandering channel in the lower Yellow River was only about 25–35%, and the channel’s bending coefficient was still small in this period. After 2006, the engineering density increased significantly, and the bending coefficient increased gradually and became close to that of the transitional reach.
To sum up, the effect of the finite control boundary (river training projects) on the bending coefficient was that the bending coefficient of the wandering channel increased as the project density increased. The bending coefficient decreased in two periods, i.e., 1981–1985 with abundant incoming water and 2000–2010 with sediment retention by the Xiaolangdi Reservoir. The bending coefficient of the wandering reach was only 1.14 from 1949 to 1960 and increased to 1.32 from 2011 to 2014, which indicated that with an increase in river regulation works, the main stream has been gradually controlled, the characteristics of rapid change and straightness have changed, and the river shape has some of the characteristics of a meandering river.
3.2.2. Main Streamline Swing Range
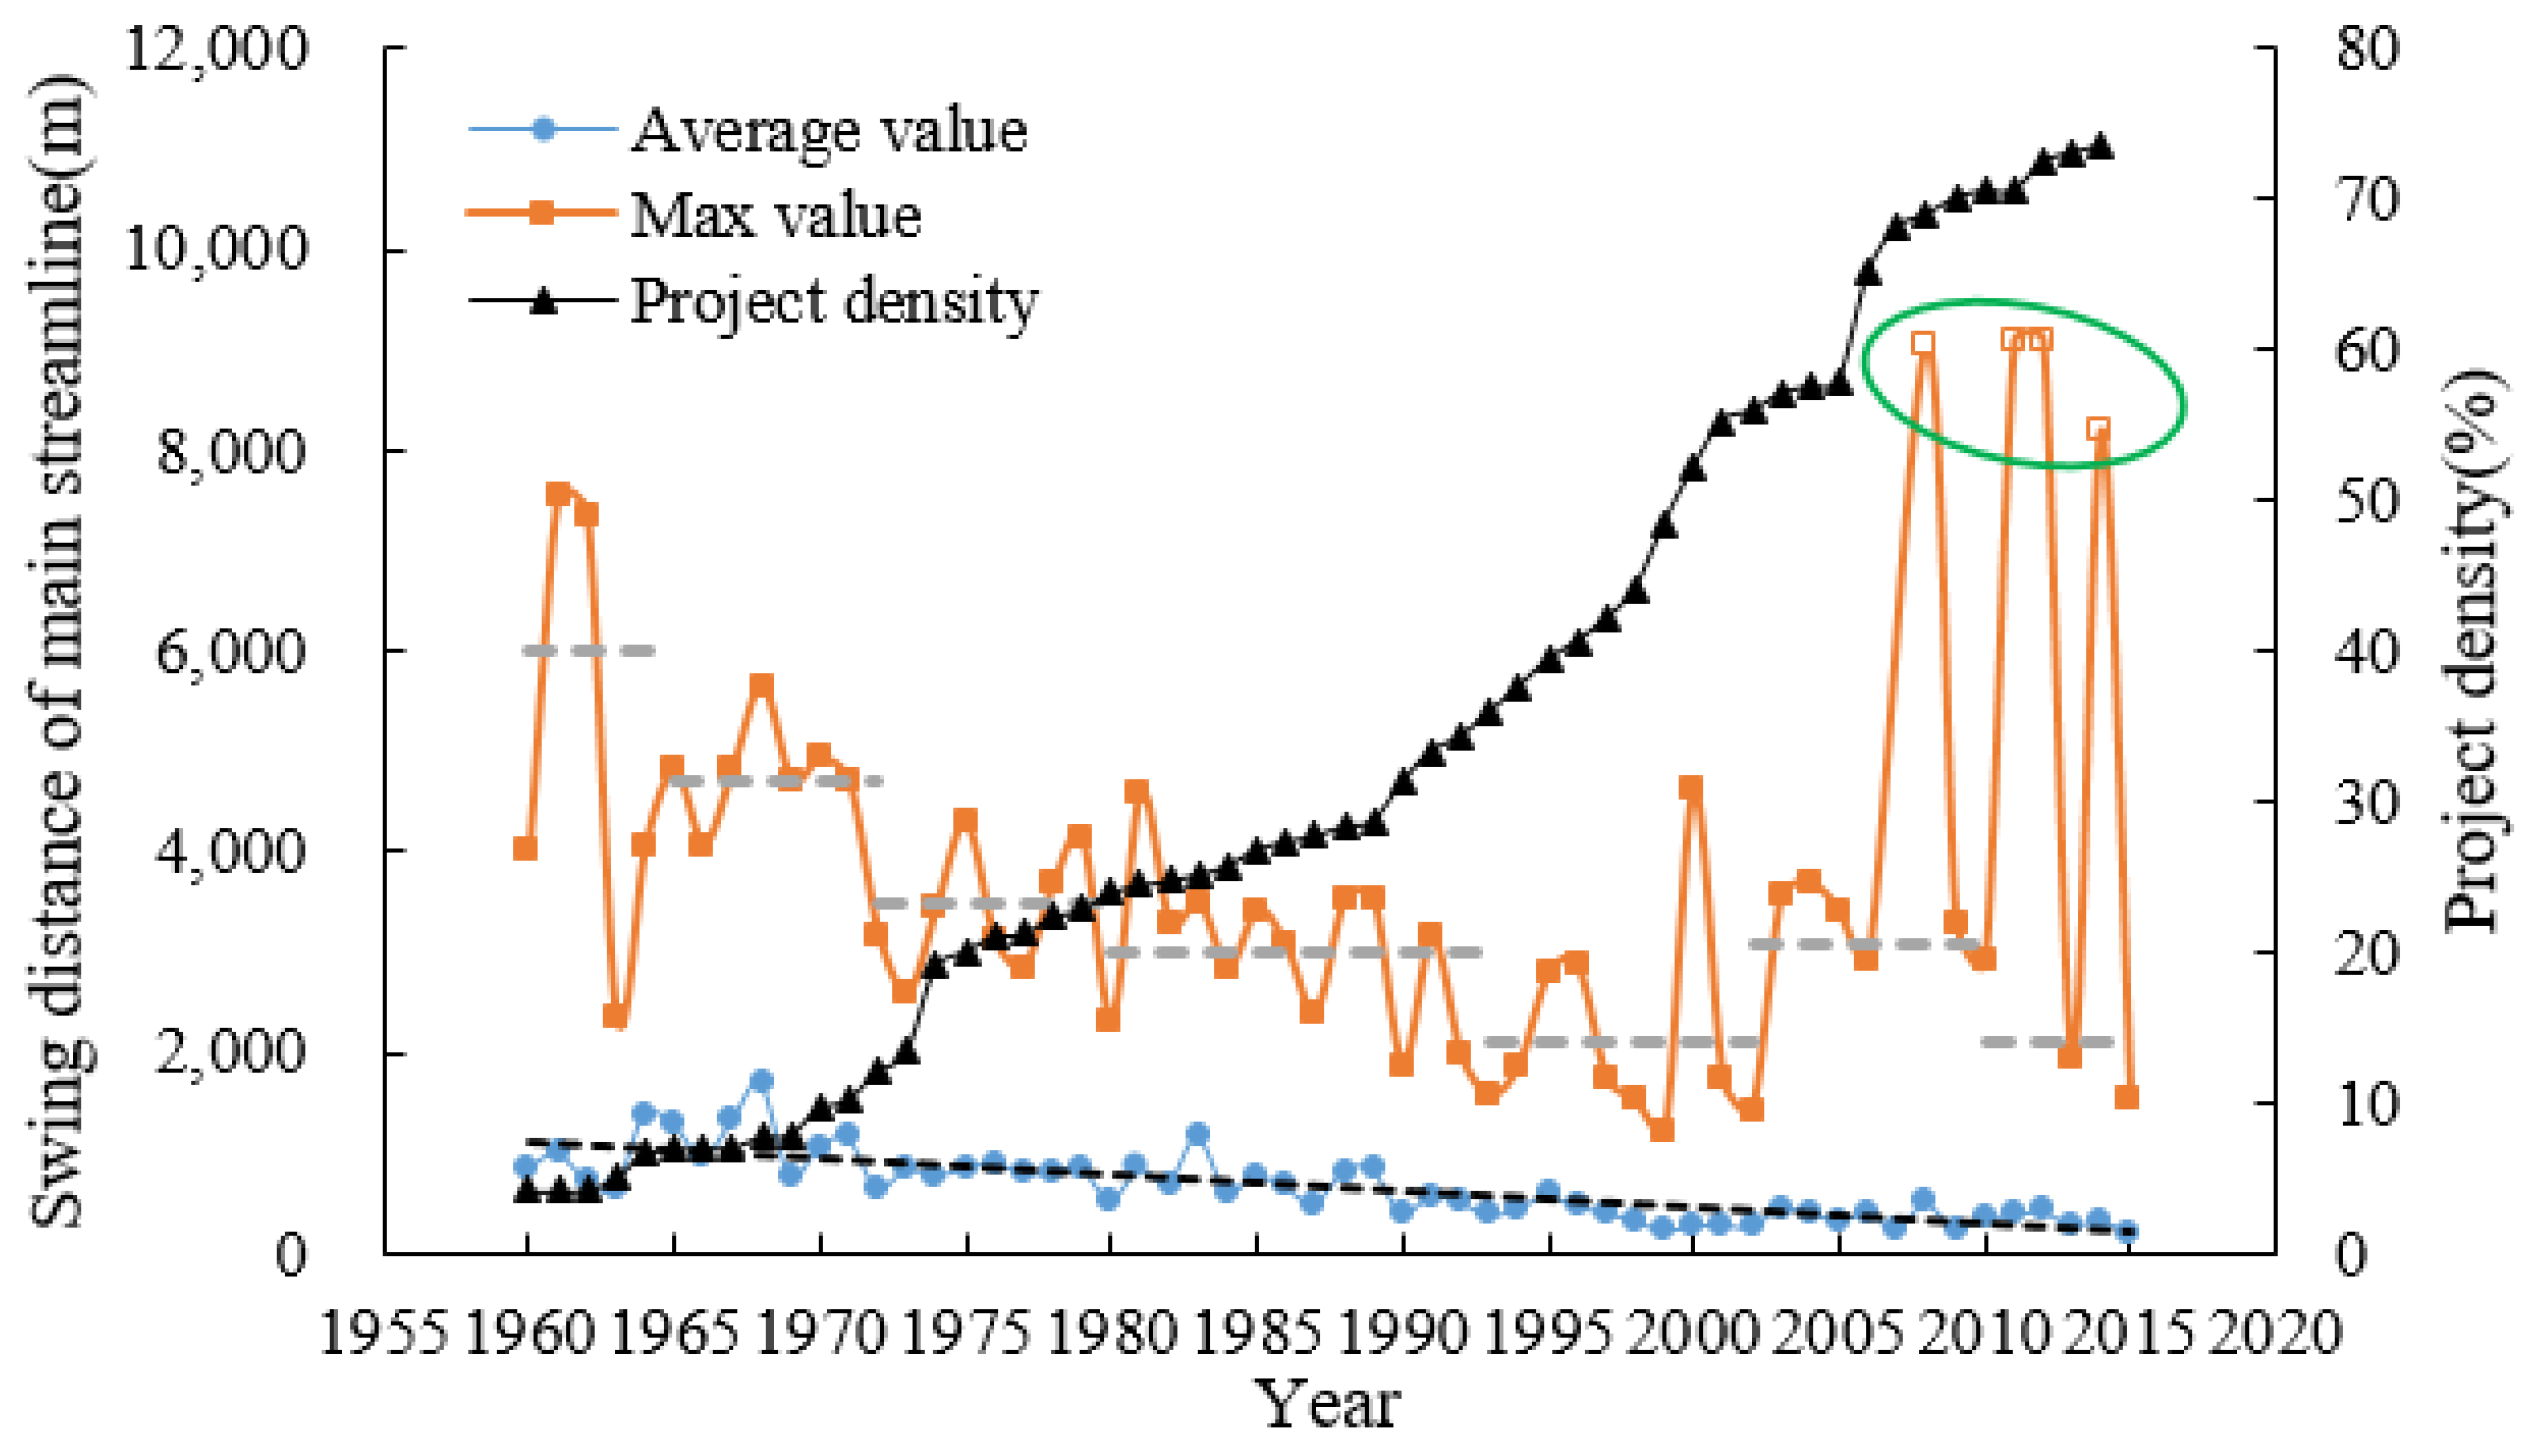
Figure 8 shows the swing of the main streamline in the Tiexie–Gaocun sections in the wandering reach from 1960 to 2014. On the whole, with an increase in the engineering density, the swing distance of main streamline showed a decreasing trend. The maximum swing distance of the main streamline can reflect the real situation of the annual river regime’s swing to a certain extent, and the average swing distance of the main streamline can reflect the overall change in the river regime. With an increase in the engineering density, the maximum swing distance of the main streamline generally decreased. From 2003 to 2006, the swing distance of the main streamline increased, mainly due to the development of distorted river bends such as those at Dagong and O’tan in recent years, resulting in an unstable river regime. In 2008, 2011, 2012 and 2014, the swing range of the main streamline increased suddenly and greatly, which was also due to the formation of distorted river bends at Kaiyi–Zhaogou, Peiyu–Dayulan, Dong’an–Taohuayu, Taohuayu–Huayuankou, Sanguanmiao–Weitan and other river sections, which had a great impact on the river regime.

Figure 8.
Swing distance of the main streamline in a wandering reach (Tiexie–Gaocun) from 1960 to 2014.
According to this analysis, the river regulation projects’ densities have reached a scale in recent years that has good control on the river regime of the wandering reach downstream, although some reaches have shown that the mainstream swing is still large under the control of high project densities. An analysis of the river regime map shows that this is mainly caused by abnormal bends in the river reach. Therefore, in the next step, certain engineering measures should be taken to further standardize the river regime according to the abnormal river bend phenomenon in the typical river sections to make the river regime close to the planned regulation line and achieve the purpose of stabilizing the mainstream.
3.2.3. River Facies Coefficient
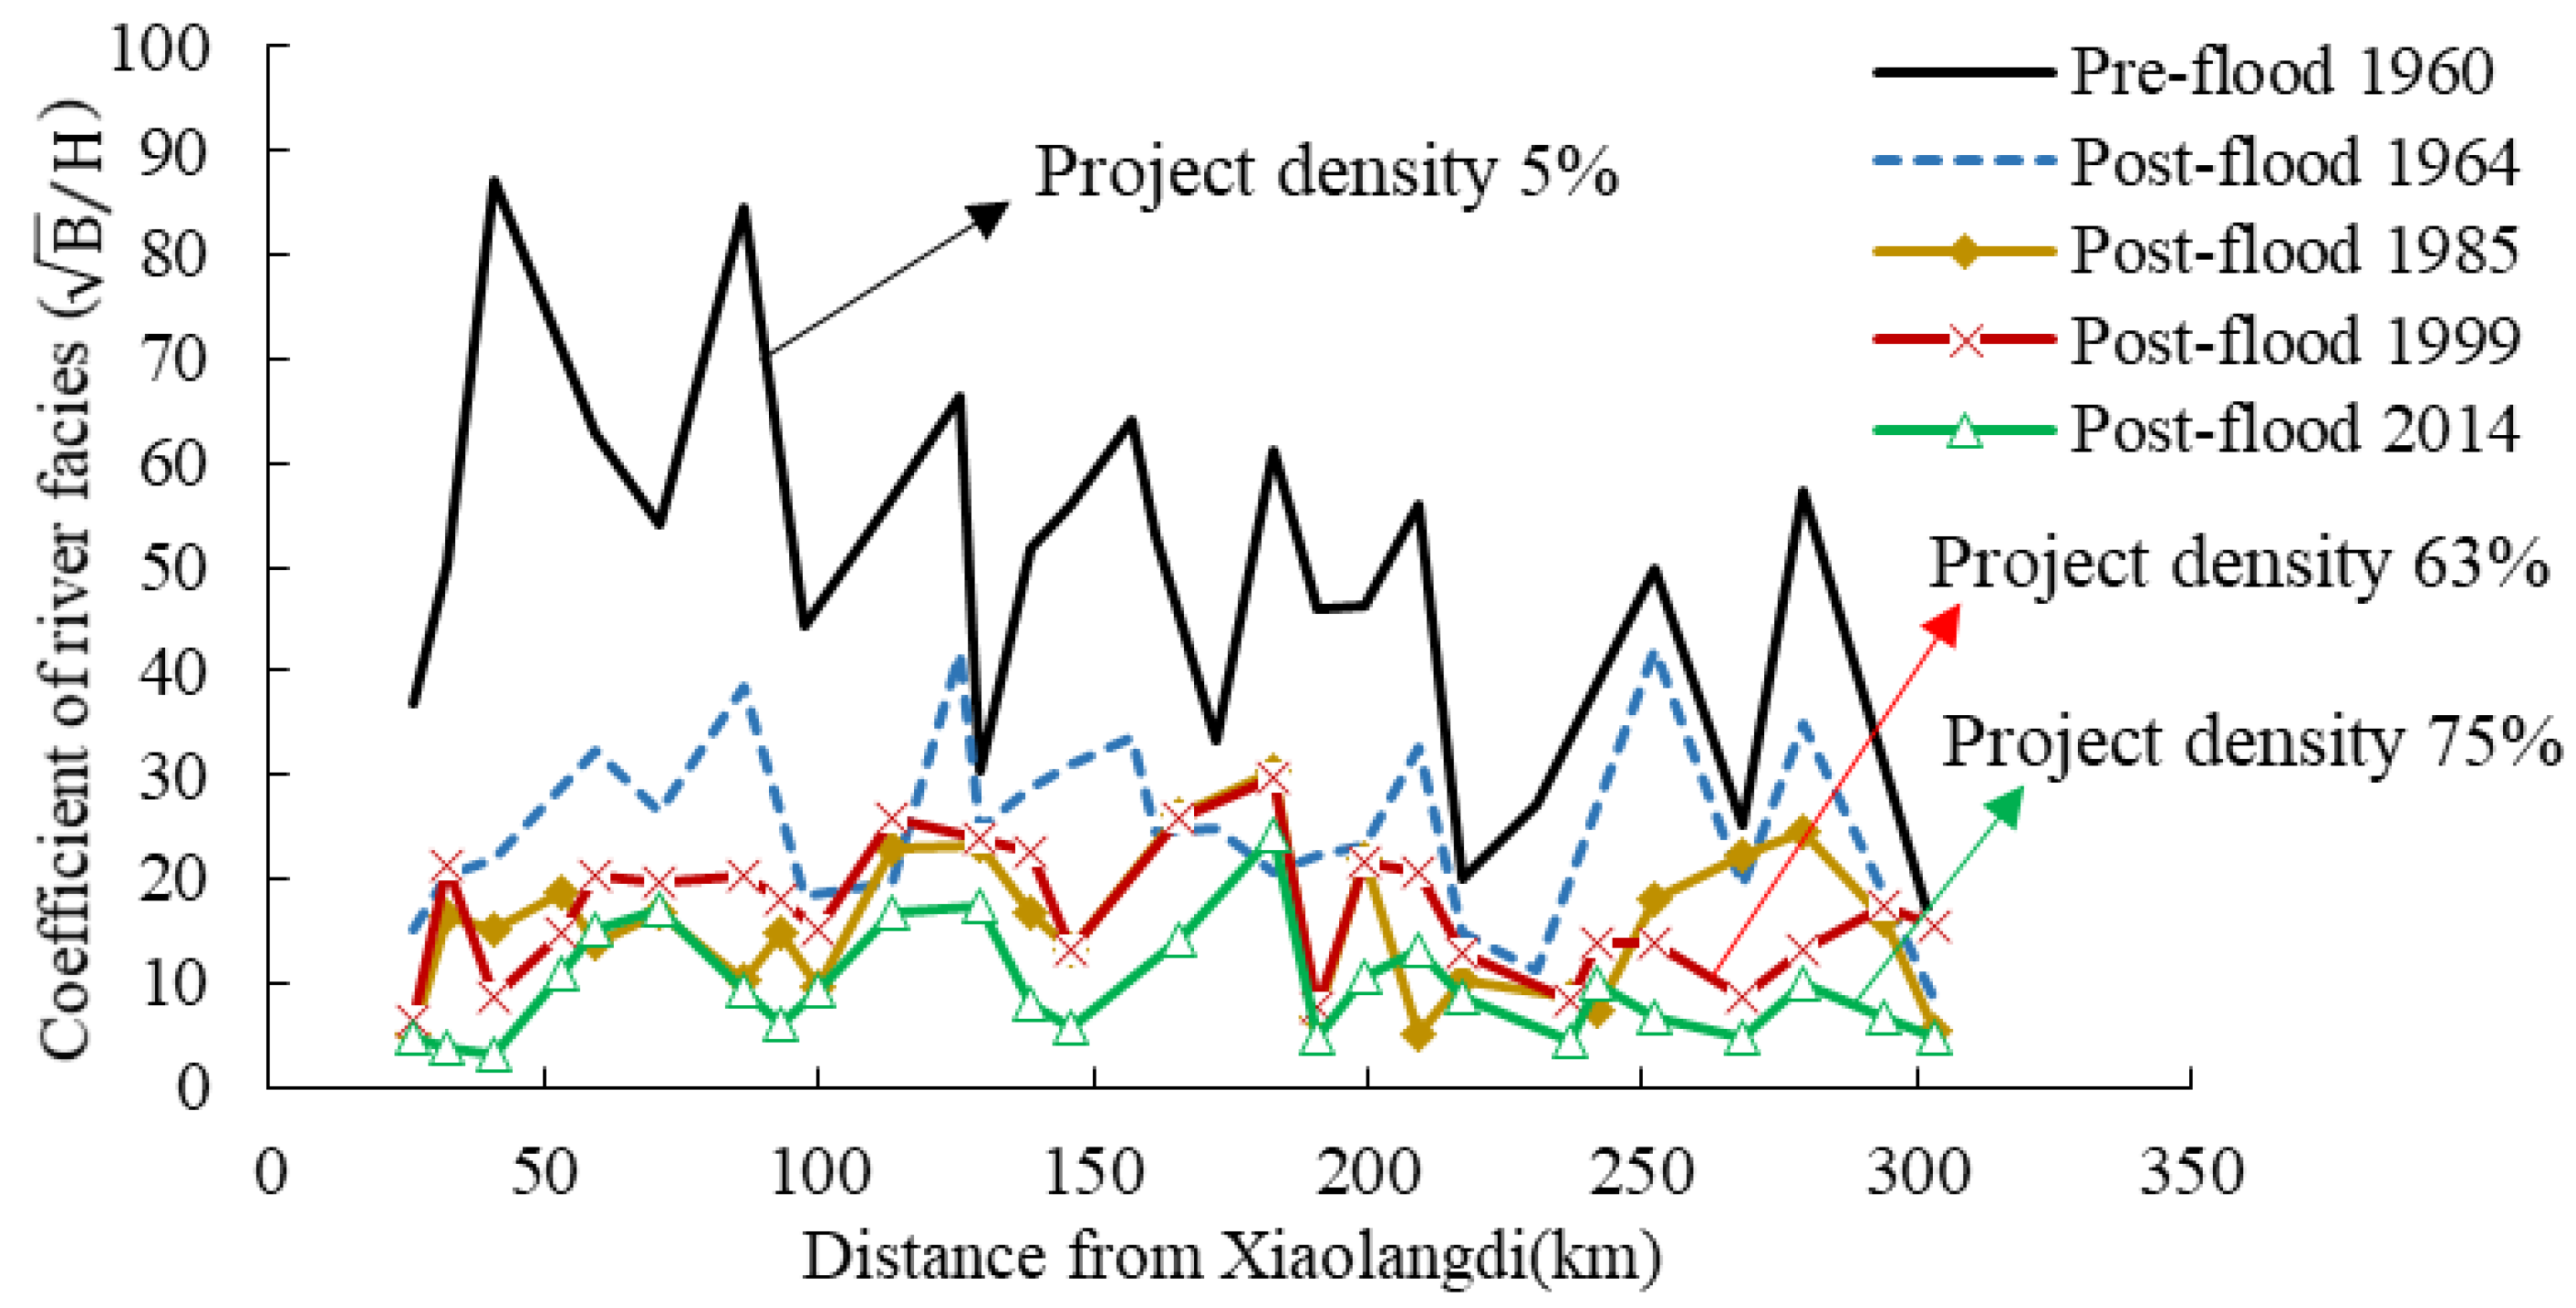
The river facies coefficient is generally used to represent the section shape of the reach. Figure 9 shows the changes in the river facies coefficients of typical sections in the lower Yellow River in different periods. In 1960, the river facies coefficient in the downstream was roughly in the range of 20–88. After the initial operation of the Sanmenxia Reservoir in 1964, the river facies coefficient in the downstream reaches decreased significantly to a range of 10–40. Form the stage of storing clean water and discharging muddy water in Sanmenxia Reservoir until 1985, the downstream river facies coefficient further decreased to a range of 5–30. In 1999, the downstream river facies coefficient increased in the Tiexie–Caogang reach, decreased in the Caogang–Gaocun reach and increased near the Gaocun section. After the operation of the Xiaolangdi Reservoir, the river facies coefficient in the downstream reaches continued to decrease. By 2014, the river facies coefficient of the river section above Huayuankou had continued to increase slightly, and the river facies coefficient of other river sections increased and decreased. Except for the sections of the Yiluo Estuary, Huayuankou and Weicheng, the river facies coefficient of other sections is within 15.
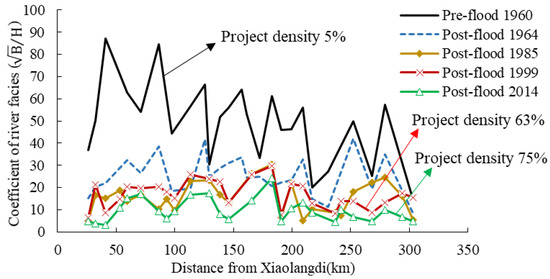
Figure 9.
Variation in the river facies coefficient in the lower Yellow River in different periods.
At the same time, it can be seen that the amplitude of the variation in the river facies coefficient of each reach was different in different periods. Before 1960, the variation range of the river facies coefficient of each reach was the largest. This is because the river channel was in a state of natural evolution before 1960, and there was little manual intervention. From 1960 to 1964, with the application of water storage and sediment retention in the Sanmenxia Reservoir, there was abundant water in this period, the downstream channel was generally scoured and the river facies coefficient was improved to a certain extent. After 1985, the change in the river facies relationship in each river section did not follow a particular law, and the amplitude of the variation also decreased somewhat. Since the operation of the Xiaolangdi Reservoir in 2000, the amplitude of the variation in the river facies coefficient in each reach decreased further. During this period, due to the significant increase in the density of river regulation works, the river regime tended to be stable to a great extent.
To sum up, from 1960 to 2014, with the increase in the engineering project density of the wandering channel in the lower Yellow River, the river facies coefficient generally showed a decreasing trend, and the sections generally tended to be narrow and deep. It can be seen that the finite control boundary had a certain impact on the river facies coefficient. In the Jiahetan–Gaocun reach, where river regulation was applied earlier and the river regulation project is relatively perfect, the river facies coefficient decreased significantly after river regulation, and the section shape tended to be narrow and deep. In the reaches where the river was wide and shallow and the adjustable range was large, such as the river section above Huayuankou, the river facies coefficient is likely to have a decreasing trend in the near future.
4. Discussion
Through a comparative analysis of the process of channel shape adjustment under different engineering constraints through the flume model test, it was seen that due to the strong artificial constraints by nine engineering projects, the channel shape did not changed significantly after changing the water and sediment conditions; only the local sections had a small-scale changes, and the stability was good. However, in tests of four engineering projects, due to the lower engineering density and the long distance between two projects, after a change in the water and sediment conditions, the river channel became severely silted up and the river channel shape altered violently, especially in the river reaches not controlled by the project. These sections swung laterally and deformed seriously after an increase in the sediment concentration. Therefore, when the density of river regulation works is low, the main factor affecting river channel alterations is the water and sediment conditions. In this case, an increase in the sediment concentration can very easily cause a lateral swing in the section and an abnormal river regime. When the density of river regulation works reaches a certain degree and the river channel has wide adaptability to water and sediment conditions, a more stable shape of the river channel can be maintained.
The evolution of river morphology in the lower Yellow River was quantitatively calculated on the basis of the measured prototype data. The results show that the river regulation projects have had good control over the evolution of river morphology. For the river bends without engineering control, the swing range of main streamline is greater and the probability of abnormal river bend increases. Under the constraint of the regulation projects, the changes in river channel shape can be divided into three stages. In the first stage, due to the change in the hydrodynamic process, the river facies coefficient decreased, the river bend coefficient increased and the gradient decreased. In the second stage, due to the feedback of boundary conditions, the river facies coefficient gradually increased, the river bend coefficient decreased and the gradient changed slowly. In the third stage, the river geometry entered a relative equilibrium state in which the river facies coefficient, the river bend coefficient and the gradient are close to constant.
Due to the regulation and operation of the Xiaolangdi Reservoir, the wandering river channel may face long-term dry periods and a short-term design flow process in the future. In order to stabilize the river regime, it is necessary to have a stable river channel shape that adapts to the water and sediment process regulated by the reservoir without affecting flood control. When the sediment blocking period of the reservoir is switched to normal operation, the water and sediment conditions entering the downstream reaches will be improved. If the water and sediment processes are not dynamically adjusted, the channel shape will have a new response. Therefore, if the future water and sediment process is to adapt to the stable channel shape, there must be a relatively stable and balanced sediment transport process downstream. Depending on the sediment inflow in the middle reaches, a balanced water and sediment process can be maintained as far as possible through the combination of manual sediment excavation and dynamic regulation of the reservoir. Due to the different types of the downstream channels, a balance between the erosion and deposition of different upstream and downstream river reaches should also be considered in the process of water and sediment regulation, which will be most beneficial to the stability of the river channel.
In this study, the evolution of river morphology under the constraint of different engineering densities was qualitatively analyzed with a flume model test. Based on the measured natural data, the morphological parameters of the wandering reach in different periods were calculated, and the changes in the river’s morphological parameters with different densities of regulation engineering in different periods were quantitatively analyzed. To a certain extent, the study confirmed the favorable impact of the river regulation projects on the morphological evolution of the lower Yellow River, namely that the river as a whole is developing in the direction of being narrow and deep, which is very beneficial for the stability of the river regime.
5. Conclusions
With the increase in the engineering density, the bending coefficient of the wandering reach showed an upward trend as a whole, except in particular years. Before the construction of river regulation projects (from 1949 to 1960), the bending coefficient of wandering reach was only 1.14, but in the mature stage of river regulation projects (from 2011 to 2014), the bending coefficient of the wandering reach increased to 1.32, which indicates that the finite control boundary has had an obvious constraining and improving effect on the channel shape, as the characteristics of rapid change and the straightness of the wandering channel have changed, and the river now has some of the characteristics of a meandering river in terms of river shape.
With the increase in engineering density, the swing range of the main stream in the wandering channel was significantly reduced, which indicates that the finite control boundary has had a good controlling effect on the river regime of the wandering reach. Some river sections showed that the swing range of the main stream was still large, even when controlled by a higher engineering density. Through this analysis, it was found that this was mainly caused by abnormal bends in the river channel. Therefore, in the next step, some engineering measures targeting typical river sections should be taken to further standardize the river regime and make the river regime close to the planned regulation line, thus achieving the goal of stabilizing the mainstream.
With the increase in the engineering density, the river facies coefficient of the wandering channel generally decreased, and the river section has tended to be narrow and deep. It can be seen that the finite control boundary has had a certain impact on the river facies coefficient. In the Jiahetan–Gaocun reach, where the river regulation was applied earlier and the river regulation project is relatively perfect, the river facies coefficient decreased significantly after river regulation, and the section’s shape tends to be narrow and deep. In the reaches where the river is wide and shallow and the range of change is large, such as the river section above Huayuankou, the river facies coefficient is likely to have a decreasing trend in the near future.
With the development of the social economy and the great attention paid by the state to controlling the Yellow River, the channel in the lower Yellow River has been basically controlled by regulation projects, and the river regime is becoming more and more stable. The river regulation projects make the complicated relationship between water and sediment in the Yellow River even more complex to a certain extent. Therefore, it is urgent to study the law of evolution of the wandering river under the control of river regulation projects in depth. In this article, a model test and data analysis were used for a preliminary exploration in this area. In the next step, a theoretical analysis will be proposed to deepen the research in this area. For example, an alluvial river linear theory suitable for wandering river channel could be established and tested to predict the change trend of the wandering channel in the lower Yellow River. This present study may not only help to deepen our understanding of the riverbed evolution law of a wandering river, but also has important theoretical significance and practical value for predicting river change trend and the development of river regulation.
Author Contributions
Conceptualization, J.L.; methodology, L.X.; validation, X.Z.; formal analysis, L.X. and N.H.; investigation, W.Z.; resources, J.L.; data curation, L.X. and W.Z.; writing—original draft preparation, L.X.; writing—review and editing, J.L.; supervision, J.L; project administration, L.X. All authors have read and agreed to the published version of the manuscript.
Funding
This research was funded by [Special Project of National Natural Science Fund], grant number [42041006, 42041004], [National Key Research and Development Project for the 13th Five-Year Plan], grant number [2018YFC0407403], [Special Project of Basic Scientific Research Business Expenses of Central Public Welfare Research Institutes], grant number [HKY-JBYW-2018-03, HKY-JBYW-2020-15], [Hubei Key Laboratory of Disaster Prevention and Mitigation(China Three Gorges University)], grant number [2021KJZ04].
Institutional Review Board Statement
Not applicable.
Informed Consent Statement
Not applicable.
Data Availability Statement
The data presented in this study, is available on request from the corresponding author.
Acknowledgments
We would like to thank the potential reviewer very much for their valuable comments and suggestions. We also thank my other colleagues’ valuable comments and suggestions that have helped improve the manuscript.
Conflicts of Interest
The authors declare no conflict of interest.
References
- Li, J.H.; Xu, L.J.; Jiang, E.H. Goals and Countermeasures for Upgrading Wandering Channels in the Lower Yellow River. People’s Yellow River 2020, 42, 81–85, 116. [Google Scholar] [CrossRef]
- Hu, Y.S. Evolution of the Yellow River Regime. J. Hydraul. Eng. 2003, 4, 46–50, 57. [Google Scholar] [CrossRef]
- Hu, Y.S.; Zhang, H.W.; Liu, G.Z. River Improvement of the Wandering Section of the Lower Yellow River; Yellow River Water Conservancy Press: Zhengzhou, China, 1998; pp. 77–80. [Google Scholar]
- Liu, W.; Wang, S.J.; Wang, Y.J. Changes in channel profile parameters of the lower Yellow River and their response to the water-sediment process. Chin. J. Geogr. 2020, 40, 1563–1572. [Google Scholar] [CrossRef]
- Dai, Q. Discussion on the mechanism of river channel evolution and its cause analysis system. Sediment Res. 2007, 5, 54–59. [Google Scholar] [CrossRef]
- Xue, B.W.; Li, J.H.; Zhang, Y.; Xu, L.J. Experimental simulation of river environment transformation and development. Fresenius Environ. Bull. 2021, 30, 10675–10684. [Google Scholar]
- LI, J.; XIA, J.Q.; Zhang, S.Y. Changes in the ratio of width to depth in the wandering section of the lower Yellow River after floods with high sediment content. People’s Yellow River 2016, 38, 26–30. [Google Scholar] [CrossRef]
- Xia, J.Q.; Li, J.; Zhang, S.Y. Riverbed adjustment law of the lower Yellow River after the operation of Xiaolangdi Reservoir. People’s Yellow River 2016, 38, 49–55. [Google Scholar] [CrossRef]
- Yu, Y.; Xia, J.Q.; Li, J.; Zhang, X.L. The influence of Xiaolangdi Reservoir on the riverbed shape and flow capacity of the wandering downstream reach. Sediment Res. 2020, 45, 7–15. [Google Scholar] [CrossRef]
- Chen, L. Water and Sediment Changes and River Erosion and Silting Evolution of the Lower Yellow River after the Operation of Xiaolangdi Reservoir. Master’s Thesis, China Institute of Water Resources and Hydropower Research, Beijing, China, 2017. [Google Scholar]
- Hu, C.H.; Chen, J.G.; Liu, D.B.; Dong, Z.D. Study on the morphological characteristics of the cross section of the lower Yellow River under the condition of water and sediment variation. J. Hydraul. Eng. 2006, 11, 1283–1289. [Google Scholar] [CrossRef]
- Yao, W.Y.; Yang, B.Z. The response of river bed evolution to river regulation in the wandering reach of the lower Yellow River. Adv. Water Sci. 2004, 3, 324–329. [Google Scholar] [CrossRef]
- Liu, Y. Experimental study on the influence of river improvement projects on the wandering reaches of the lower Yellow River. In Proceedings of the 18th National Hydrodynamics Symposium; Ocean Press: Beijing, China, 2004; pp. 709–715. [Google Scholar]
- Wang, Y.J.; Wu, B.S.; Shen, G.Q. Adjustment of the main channel of the lower Yellow River before and after the operation of Xiaolangdi Reservoir from 1986 to 2015. Acta Geogr. Sin. 2019, 74, 2411–2427. [Google Scholar] [CrossRef]
- Liu, X.; Liu, Y.Z. Research on Riverbed Evolution of the Wandering Reach of the Lower Yellow River Since Xiaolangdi Reservoir Diversion and Sedimentation. Sediment Res. 2019, 44, 56–60. [Google Scholar] [CrossRef]
- Zhang, M. Discussion on the Evolution Characteristics and Adjustment Laws of the Cross-Section Morphology of the Lower Reaches of the Yellow River. Master’s Thesis, Taiyuan University of Technology, Taiyuan, China, 2006. [Google Scholar]
- Liu, C.M.; Zheng, H.X. Analysis of the change trend of water circulation elements in the Yellow River Valley. J. Nat. Resour. 2003, 18, 129–135. [Google Scholar] [CrossRef]
- Tang, Q.; Oki, T.; Kanae, S.; Hu, H. A spatial analysis of hydro-climatic and vegetation condition trends in the Yellow River basin. Hydrol. Processes 2008, 22, 451–458. [Google Scholar] [CrossRef]
- Huang, Y.; Cai, J.L.; Yin, H.; Cai, M.T. Correlation of precipitation to temperature variation in the Huanghe River (Yellow River) basin during 1957–2006. J. Hydrol. 2009, 372, 1–8. [Google Scholar] [CrossRef]
- Qin, N.X.; Chen, X.; Fu, G.B.; Zhai, J.Q.; Xue, X.W. Precipitation and temperature trends for the Southwest China: 1960–2007. Hydrol. Processes 2010, 24, 3733–3744. [Google Scholar] [CrossRef]
- Lan, Y.C.; Zhao, G.H.; Zhang, Y.N.; Wen, J.; Liu, J.Q.; Hu, X.L. Response of runoff in the source region of the Yellow River to climate warming. Quat. Int. 2010, 226, 60–65. [Google Scholar] [CrossRef]
- Liu, Q.; Cui, B.S. Impacts of climate change/variability on the streamflow in the Yellow River Basin, China. Ecol. Model. 2011, 222, 268–274. [Google Scholar] [CrossRef]
- Ma, Z.; Fu, C.; Zhou, T.; Yan, Z.; Li, M.; Zheng, Z.; Chen, L.; Lv, M. Status and Ponder of Climate and Hydrology Changes in the Yellow River Basin. Bull. Chin. Acad. Sci. 2020, 35, 52–60. [Google Scholar] [CrossRef]
- Dang, S.Z.; Liu, X.Y.; Yin, H.J.; Guo, X.W. Prediction of Sediment Yield in the Middle Reaches of the Yellow River Basin Under Extreme Precipitation. Front. Earth Sci. 2020, 8, 542686. [Google Scholar] [CrossRef]
- Yuan, X.M.; Tian, F.C.; Wang, X.J.; Liu, Y.S.; Chen, M.T. Small-scale sediment scouring and siltation laws in the evolution trends of fluvial facies in the Ningxia Plain Reaches of the Yellow River. Quat. Int. 2018, 476, 14–25. [Google Scholar] [CrossRef]
- Wang, Y.J.; Wu, B.S.; Shen, G.Q. Adjustment in the main-channel geometry of the lower Yellow River before and after the operation of the Xiaolangdi Reservoir from 1986 to 2015. J. Geogr. Sci. 2020, 30, 468–487. [Google Scholar] [CrossRef]
- Xie, Z.H.; Huang, H.Q.; Yu, G.A.; Zhang, M. Quantifying the Effects of Dramatic Changes in Runoff and Sediment on the Channel Morphology of a Large, Wandering River Using Remote Sensing Images. Water 2018, 10, 1767. [Google Scholar] [CrossRef] [Green Version]
- Zhang, T.Y. Analysis of the Effects of Typical River Regulation Projects in the Wandering Reach of the Yellow River. Master’s Thesis, Tsinghua University, Beiing, China, 2016. [Google Scholar]
- Xu, L.J.; Wang, S.S.; Li, J.H.; Zhao, W.J.; Li, M.Y. Influence of river regulation works on the section shape of wandering reach. South-to-North Water Transf. Water Sci. Technol. 2022, 21, 201–208. (In Chinese) [Google Scholar] [CrossRef]


Publisher’s Note: MDPI stays neutral with regard to jurisdictional claims in published maps and institutional affiliations. |
© 2022 by the authors. Licensee MDPI, Basel, Switzerland. This article is an open access article distributed under the terms and conditions of the Creative Commons Attribution (CC BY) license (https://creativecommons.org/licenses/by/4.0/).