Abstract
Dust deposition on solar photovoltaic (PV) cells will dramatically reduce the photovoltaic power output. Self-cleaning coating may be a novel method to decrease dust deposition problems. This paper compares self-cleaning performances and mechanisms of super-hydrophobic and super-hydrophilic coating on dirt deposition decrease for solar photovoltaic cells by experimental measurement. In the process of the deposition of dust on solar cells, covering glass, coated and uncoated, is conducted under natural settling conditions. Moreover, the dust removal efficiency of the glass samples with and without coatings is studied under water spraying conditions. The wettability of different surfaces, dust deposition mass, dust removal efficiency, self-cleaning mechanisms, and transmittance of glass samples are investigated and analyzed. Under natural settling conditions, the deposition mass reduction ratio by the super-hydrophilic coating is only 8.1%, while it can reach 85.8% by the super-hydrophobic coating because of surface micro-structures and low surface energy. However, after the water spraying process, the remaining dust mass ratio for the super-hydrophobic surface is only 16.5%, while it is 18.6% for the super-hydrophilic surface. The self-cleaning mechanism of super-hydrophobic coating is that most deposited particles of dust are removed from glass samples by the rolling of liquid droplets. However, the self-cleaning mechanism of super-hydrophilic coating is the breakup of the liquid film. Therefore, both coatings can effectively reduce dust deposition under water spraying conditions. The average transmittance of super-hydrophobic and super-hydrophilic coatings after the water spraying process is 91.1% and 86.4%, respectively, while it is only 61.1% for the uncoated glass sample.
1. Introduction
As a clean and environmental way of energy utilization, solar photovoltaic technology is developing all over the world rapidly [1,2,3]. For the sake of enhancing the manufacturing efficiency and generating efficiency of solar cells, Basher and Hossain et al. conducted in-depth studies on solar cells’ transmission, electrode optimization, anode film thickness, and phosphorus doping time. Basher et al. [4] investigated the effect of pyramid texturing on the optical surface reflectance of monocrystalline silicon PV cells by systematically changing the etching time and chemical concentration to optimize the surface reflectance. For the manufacture of efficient solar cells, Basher et al. [5] also studied the optimization of phosphorus doping time in the emission region of monocrystalline silicon solar cells and the surface morphology of textured silicon wafers, which may help in the manufacture of efficient monocrystalline silicon solar cells. Hossain et al. [6] investigated the effect of the thickness change of γ-irradiated dye sensitize solar cell (DSSC) photoanode TiO2 film on its structure, morphology, and optical performances. Hossain et al. [7] also studied the optimization of electrode production parameters in order to improve the efficiency of natural-dye-sensitized solar cells. The results show that improving the sensitivity of natural dyes by optimizing the electrode parameters is helpful to improve its power generation efficiency. However, dust particles carried by the wind flow will deposit on solar PV panels and significantly decrease the PV power efficiency [8,9,10]. This is because the transmittance of solar cells’ covering glass decreased by deposited dust particles. Vivar et al. [11] found that the PV power output reduces by 26% during four months because of dust deposition on solar cells’ covering glass. Moreover, Fan et al. [12] studied the influence of dust deposition on solar photovoltaic panels in an arid plateau region. They found that the PV efficiency can reduce by 25% due to dust deposition. Therefore, dust deposition on solar cells’ covering glass becomes a serious problem for solar PV panels. Artificial or mechanical washing by water is the common method to reduce the dust deposition problem for solar photovoltaic cells. Nonetheless, the traditional method of water cleaning has high costs and is not efficient. Therefore, development of novel cleaning methods is necessary to avoid deposition of dust on the solar cells.
Over the past several decades, the influences of dust deposition on solar PV cells have been studied by researchers [13,14,15,16,17,18]. Goossens [19] studied the effect of airflow velocity on dust deposition characteristics on solar PV panels. They found that the photovoltaic efficiency reduction increases in the wake of the rise of wind velocity. Jiang et al. [20] investigated the relationship of dust deposition on solar cells and solar PV output by experimental measurement. The results revealed that the photovoltaic output degeneration almost increases linearly in the wake of the rise of dust deposition density. Recently, Lu et al. [21,22,23] used numerical simulation to study dust deposition behavior on solar PV panels. The results indicated that medium dust in solar cells has the highest deposition rate.
Although the influence of dust deposition on solar PV efficiency has been investigated by a lot of researchers, the research of an effective solution on dust deposition is limited. Recently, on solar cell covering glass, super-hydrophobic and super-hydrophilic coatings were applied to reduce dust deposition [24,25,26]. Piliougine et al. [27] examined the self-cleaning performance of anti-soiling coatings on solar PV panels. The daily PV energy loss can decrease by 0.8% when the anti-soiling coating is used on the solar cells. Quan et al. [28] prepared hyaline hydrophobic coatings for solar cells. On solar cells, both the super-hydrophobic and hydrophobic coatings reduce dust deposition. Wang et al. [29] studied the self-cleaning property of different super-hydrophobic coatings for solar PV panels. The silicon-based coating has higher self-cleaning efficiency than that of the fluorine-based coating. Prabhu et al. [30] accomplished the preparation of super-hydrophilic rGO–TiO2 coatings applied on solar PV cells. The coating can decontaminate the adsorbed pollutants under simulated solar light irradiation. Besides, Lei et al. [31] modified α-zirconium phosphate nanoplatelets to obtain highly transparent and super-hydrophilic coatings on glass. The results showed that the contact angle of the coating can be close to 0° and we can use it on solar cell covering glass. Nevertheless, the comparison of self-cleaning performance on super-hydrophobic and super-hydrophilic coatings has been seldom investigated. The self-cleaning mechanisms of the two coatings may be quite different. Huang et al. [32] investigated anti-soiling properties of four transparent coatings, including hydrophilic, super-hydrophilic, hydrophobic, and super-hydrophobic coatings. The results showed that the decrease in PV efficiency of super-hydrophobic coating was the least, followed by hydrophobic, hydrophilic, and super-hydrophilic coatings. However, the water spraying experiment was not conducted in the study. Lately, the authors [33,34] studied the influence of super-hydrophobic coating on dust deposition reduction for diverse dust performances and surface structures. The results showed that, because of low surface energy and surface micro-structure, the coating obviously reduces dust deposition rate, even without water. At the same time, the authors [35] also studied the dust prevention performance of solar photovoltaic cells under the condition of water spraying. In the process, in the wake of the increase in water spraying time, the dust deposition quality of naked glass and coated glass samples dramatically reduced; in addition, with the increase in deposition and spraying inclination, the dust deposition quality significantly reduced. However, in this study, the dust removal effects of super-hydrophobic and super-hydrophilic coatings on solar photovoltaic cells were not compared.
In this paper, the self-cleaning performances and mechanisms of super-hydrophobic and super-hydrophilic coatings on dust deposition reduction for solar cells are investigated by experimental measurement. After preparation of self-cleaning coatings, the experiment of the dust deposition on solar cell covering glass with and without coatings is conducted under natural dust settling conditions. Furthermore, the self-cleaning performance of different surfaces on dust removal efficiency is studied under water spraying conditions. The wettability of different surfaces, dust deposition mass, dust removal process, remaining dust mass ratios, and spectral transmittance of glass samples are studied and analyzed. Comparing the effect of dust removal on super-hydrophobic and super-hydrophilic surfaces under water spraying conditions, the study results can provide a reference for choosing super-hydrophobic or super-hydrophilic coating schemes in different regions and may concentrate on a dust deposition reduction solution in solar PV engineering application.
2. Experiments
2.1. Experimental Method
Figure 1a,b shows, respectively, the schematic design and realistic picture of the test rig for dust deposition on solar cell covering glass. The test chamber is 0.8 m in length, 0.5 m in width, and 0.5 m in height. A fan is adopted to generate airflow inside the chamber, while the glass samples are installed with a certain inclination on the bottom of the chamber. To ensure natural settling of dust particles on the solar cell covering glass, airflow velocity produced by the fan is very low. Dust particles are uniformly injected into the chamber by a dust generator, and a particle counter (LZJ-01D3, Suzhou Xingyuan Clean Environment Technology Co., Ltd., Suzhou, China) is used to measure the dust particle concentration in the test chamber. The tilt angle of the solar cell covering glass is 30° in this study, which is a common tilt angle in realistic solar PV panel application. The deposition mass on the coated and uncoated glass surfaces after the dust deposition process and water spraying process is measured by a precious balance. Besides, the transmittance of the glass samples after the water spraying process is gauged by a UV spectrometer (U-3010, HITACHI, Tokyo, Japan). The contact angles of different surfaces are gauged by a contact angle meter (OCA20, Dataphysics, Filderstadt, Germany).
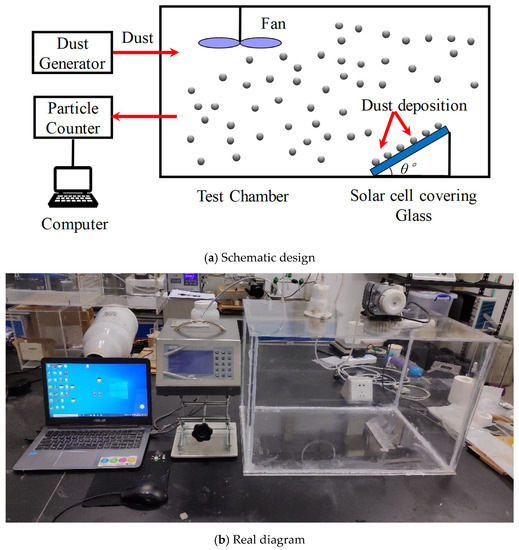
Figure 1.
Experimental schematic of dust deposition on solar cell covering glass.
2.2. Experimental Dust
We buy the dust particles adopted in the test from Powder Technology Inc., Arden Hills, MN, USA. We use a laser particle analyzer (S3500, Microtrac Inc., York, PA, USA) to gauge the cumulative volume fraction distribution of dust particles, which can be seen in Figure 2a. It can be found that the dust diameter is from 0 μm to 20 μm. Moreover, it is about 90% of, that is, the volume fraction of the dust particles is no more than 10 μm. Figure 2b reveals the chemical component of dust particles, which are measured by a soil composition analyzer (DPO-6000, OLYMPUS, Tokyo, Japan).
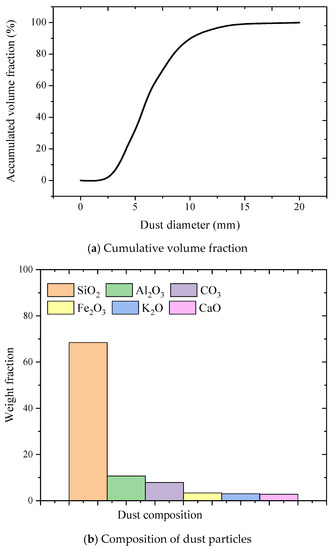
Figure 2.
Cumulative volume fraction and composition of dust particles.
2.3. Preparations of Self-Cleaning Coatings
The preparation of super-hydrophobic coating can be found in our previous paper [28] and the literature [31], which is not repeated here. The preparation of super-hydrophilic coating is as follows: the titanium dioxide and silica sol were prepared from tetrabutyl titanate and ethyl silicate, respectively. Tetrabutyl titanate was mixed with ethanol and agitated for 30 min. Then the acetic acid, distilled water, and ethanol were added slowly to the mixture of tetrabutyl titanate and ethanol. After that, the mixture solution was agitated at room temperature and the TiO2 sol was obtained. Meanwhile, the SiO2 sol was fabricated by the mixture of ethyl silicate, ethanol, and polyethylene glycol. The prepared TiO2 and SiO2 sol were mixed and continuously stirred for 4 h. Finally, the sol was uniformly coated on the bare glass sample with a coating thickness of 100 nm. It was subsequently dried at the temperature of 40 °C for 3 h. We used an electron microscope scanner (SEM, S-8820, HITACHI, Tokyo, Japan) to acquire the scanning electron microscope (SEM) images of the super-hydrophilic coating and super-hydrophobic coating, as displayed in Figure 3.
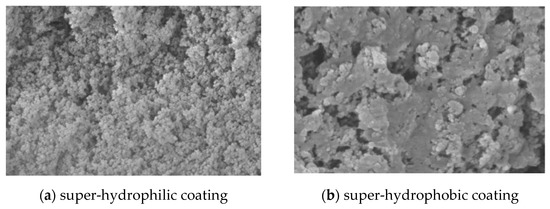
Figure 3.
SEM images of surfaces with different self-cleaning coatings.
As shown in the infrared spectrum of Figure 4a, it has obvious absorption peaks at 3358 cm−1, 2958 cm−1, 1687 cm−1, 1604 cm−1, 1510 cm−1, 1461 cm−1, 1436 cm−1, 1325cm−1, 1288 cm−1, 1251 cm−1, 1195 cm−1, 1088 cm−1, 845 cm−1, and 725 cm−1, of which the sharp and strong absorption peak at 3385 cm−1 is N–H stretching vibration; the absorption peak near 2958 cm−1 is caused by the C–H symmetric and antisymmetric stretching vibrations in CH3; the absorption peaks at 1687 cm−1 and 1604 cm−1 are N–H stretching vibrations; the peaks near 1510 are N–H bending vibrations; 1461 cm−1, 1325 cm−1, and 1251 cm−1 are C–H surfaces in CH3 internal bending vibration; the antisymmetric stretching vibration of Si–O–Si is at 1195 cm−1 and 1088 cm−1; the symmetric stretching vibration of Si–O–Si is at 845 cm−1; and the absorption peak near 764 cm−1 is CH out-of-plane bending vibration.
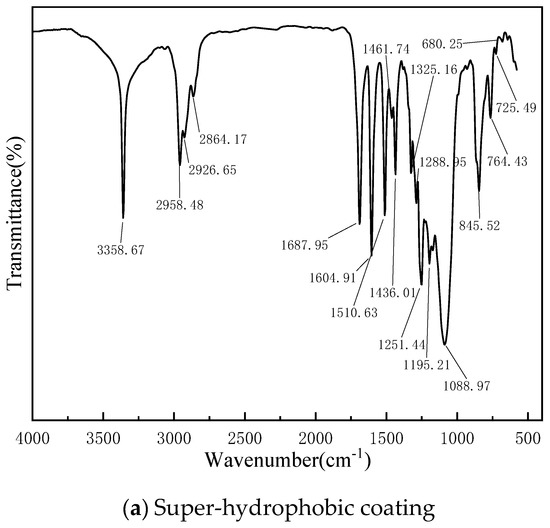
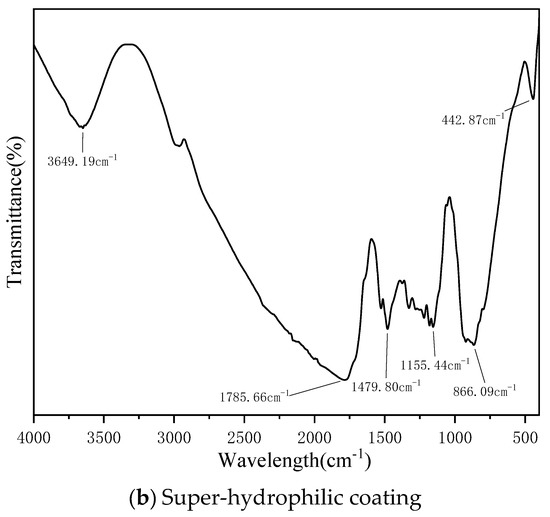
Figure 4.
FTIR spectra of super-hydrophobic and super-hydrophilic coating.
As shown in the infrared spectrum of Figure 4b, the broad peak at 3649 cm−1 is O–H stretching vibration; the absorption peak at 1785 cm−1 is acetic acid carbonyl C=O stretching vibration; the absorption peak at 1479 cm−1 is C–H bending vibration; the absorption peaks at 1155 cm−1 and 866 cm−1 are antisymmetric and symmetric stretching vibrations of Si–O–Si; and the absorption peak at 442 cm−1 is caused by the Ti–O peak.
3. Results and Discussion
3.1. Wettability for Contrasting Surfaces
To compare the wettability of the bare glass surface, super-hydrophobic coating, and super-hydrophilic coating, the contact angles of different surfaces are shown in Figure 5. The contact angle of the surface of the glass sample A is 158°. It indicates the glass sample A is super-hydrophobic, as the contact angle exceeds 150°. The super-hydrophobic surface includes surface micro-structure and low surface energy, which will greatly affect the dust deposition characteristics. The adhesion force of dust particles on the super-hydrophobic surface is significantly lower than that of the normal surface [28,29]. Moreover, the rebound behaviors of dust particles on surface micro-structures will also be quite different with the normal surface. For the glass sample B, the contact angle is 5°, which presents as super-hydrophilic. The super-hydrophilic surface consists of high surface energy and surface micro-structures. The droplets can be widely spread on the super-hydrophilic surface and the liquid film flow can be formed to take away the deposited dust particles. For the bare surface, the contact angle reaches 76°. The bare surface is hydrophilic, as the contact angle is less than 90° [30,31].
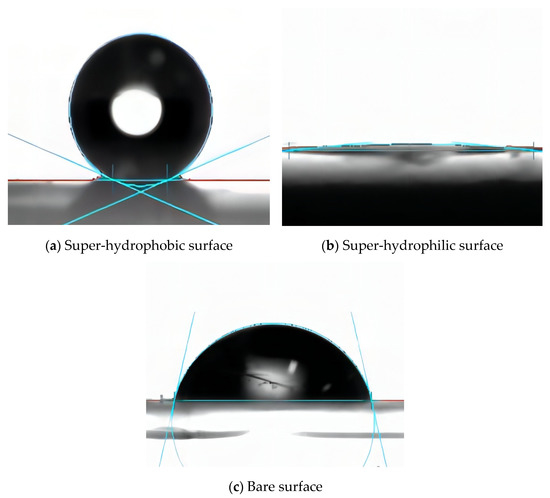
Figure 5.
Contact angles of solar cell covering glass with and without coating.
3.2. Dust Deposition Mass on Different Surfaces
The dust deposition process is conducted on the coated and uncoated surfaces under natural settling conditions. The dust deposition period in a real engineering application usually lasts for a long time. Therefore, a high concentration of dust is always used to decrease the test period in the laboratorial experiment. Figure 6 shows the dust concentration of different particle diameters with time in the test chamber. With deposition time, the concentration of dust particle number universally reduces. Nevertheless, the number concentration of large particles decreases faster than that of small particles because of stronger gravitational settling.
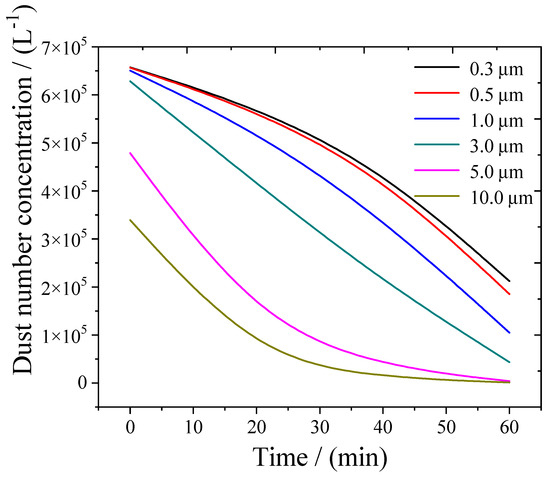
Figure 6.
Dust particle concentration during the deposition process.
Figure 7 shows the density of dust deposition on the glass samples with and without coating. The density of dust deposition is gauged every 3 min. The total deposition time is 15 min. The dust deposition quality of glass samples B and C increases almost linearly in the wake of the rise of deposition time. The difference in dust deposition mass between the glass sample B and C is not large. It implies that the super-hydrophilic coating has no obvious self-cleaning effect under natural settling conditions. This is because the high surface energy of the super-hydrophilic coating may enhance dust deposition. However, the surface micro-structures can decrease the dust deposition. Therefore, the final dust deposition mass for the super-hydrophilic surface is similar to that of the bare surface. The deposition mass reduction ratio by super-hydrophilic coating is only 8.1%, compared to the naked glass sample case. However, the dust deposition mass for the glass sample A slightly rises in the wake of the deposition time. The dust deposition mass of t = 12 min is even less than that of t = 9 min. This is because some dust particles slide down from the glass sample due to the airflow and gravitation force. Moreover, the dust deposition mass for the glass sample A is much less than that of glass samples B and C. The deposition mass reduction ratio by super-hydrophobic coating is 85.8%, compared to the case of the naked glass sample. Thus, the super-hydrophobic coating dramatically reduces dust deposition mass, even without water spraying process. This is because both low surface energy and micro-structures can decrease the dust deposition rate. Thus, the dust rebound rate is enhanced and the deposition mass can decrease. Moreover, the surface micro-structures can decrease the area of contact between the surface and the dust; then, they also reduce dust deposition rate. The experimental results are the same as those found in the literature [32], which shows that the photovoltaic efficiency reduction of the super-hydrophobic coatings is minimal during dust deposition and the super-hydrophilic coatings are slightly less effective.
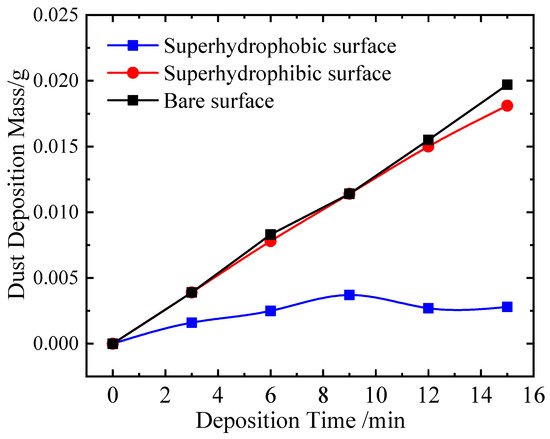
Figure 7.
Dust deposition mass on solar cell covering glass with and without coatings.
3.3. Dust Removal Performance for Different Surfaces
In real engineering application, the self-cleaning process by super-hydrophobic or super-hydrophilic coating is always conducted under rainwater washing or artificial water washing. Therefore, the dust removal process is conducted for different surfaces under water spraying conditions. During the water spraying process, the spraying flow rate is 1.5 mL/s. The dust cleaning process under water spraying for the super-hydrophobic coating is shown in Figure 8a–i. Figure 8a reveals the initial dust deposition pattern for the glass sample A. We can find that the dust particles are not uniformly distributed on the surface. This may be related with the surface micro-structures of the super-hydrophobic coating. When the water spraying process starts, small liquid droplets immediately form on the super-hydrophobic surface and roll down from the glass sample. The rolling droplets carry the deposited dust particles away from the sample surface, as displayed in Figure 8b,c. When the water spraying process continues, small water droplets gradually merge to large water droplets and more dust particles are taken away by large waterdrops, as displayed in Figure 8d–f. Finally, almost all the dust particles are removed by larger waterdrops, as displayed in Figure 8g–i. Therefore, the self-cleaning property of the super-hydrophobic coating is quite effective under water spraying conditions.
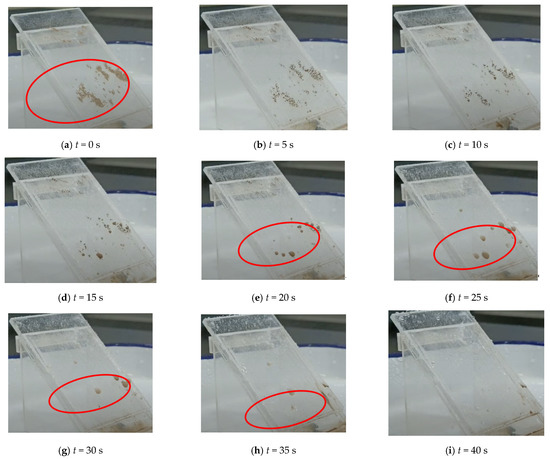
Figure 8.
Dust cleaning process under water spraying for the super-hydrophobic coating.
The dust cleaning process under water spraying for the super-hydrophilic coating is displayed in Figure 9a–i. The initial deposition pattern of dust for the glass sample B can be seen in Figure 9a. The dust particles are not uniformly distributed on the super-hydrophilic surface, which is similar with the case of super-hydrophobic coating. When the process of water spraying starts, liquid film is shaped on the super-hydrophilic surface and falls down from the glass sample, as shown in Figure 9b. This is very different from the super-hydrophobic surface case. However, the liquid film cannot completely cover the glass sample B. When the water spraying process continues, the liquid film becomes larger and gathers on the bottom of the glass sample due to the gravitational force, as shown in Figure 9c. The liquid film reaches the maximum pattern and includes many particles of dust, as displayed in Figure 9d. Then, the liquid film is broken up as a result of gravity and many dust particles are removed from the glass sample by the broken liquid film flow, as shown in Figure 9e. The similar process can be seen from Figure 9f–h. Many dust particles are taken away again by the second liquid film flow. Finally, the majority of deposited dust particles are brought away from the sample surface by the liquid film flow. Therefore, the self-cleaning property of super-hydrophilic coating is also effective under the condition of water spraying, although the cleaning method is completely different from the super-hydrophobic coating case.
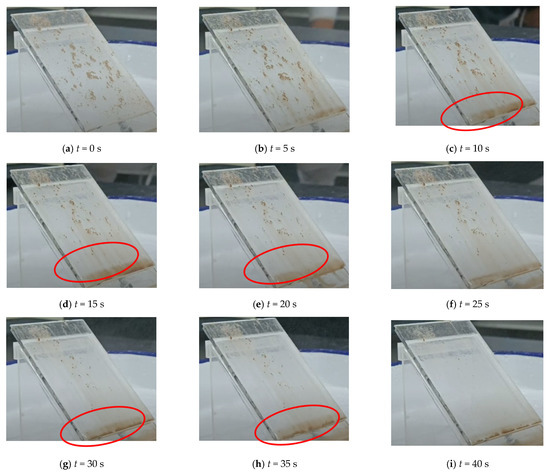
Figure 9.
Dust cleaning process under water spraying for the super-hydrophilic coating.
Figure 10a–i shows the dust cleaning process under water spraying for the naked glass sample. We can see the initial deposition pattern of dust for the glass sample C in Figure 10a and know the deposited dust particles are relatedly uniform on the bare surface. This may be because the bare glass surface does not include roughness micro-structures. When the water spraying process starts, small liquid droplets can be found on the bare sample surface, as displayed in Figure 10b–d. Whereas, unlike the super-hydrophobic surface or super-hydrophilic surface, the liquid droplets neither roll down from the sample surface nor form the liquid film. When the water spraying process continues, small water droplets can merge to large water droplets, as displayed in Figure 10e–i. However, the large liquid droplets just stay or slide down for a little distance on the sample surface due to the surface wettability of the bare sample. Therefore, very few particles of dust can be removed from the sample surface. The dust removal property of the bare glass sample is not effective under water spraying conditions.
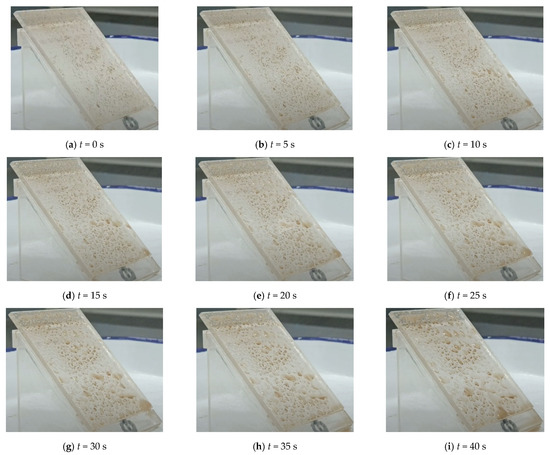
Figure 10.
Dust cleaning process under water spraying for the bare surface.
To quantificationally evaluate the self-cleaning performance of the coated and uncoated sample surfaces, Figure 11 shows the remaining dust mass ratio for different samples under the water spraying process. The remaining dust mass ratio is the ratio of deposited dust mass after and before the water spraying process. It can be observed that the remaining dust mass ratio for the super-hydrophobic surface first decreases rapidly and then decreases slowly during the water spraying process. This is on account that, at the commencement of the water spraying process, most of the dust particles are brought away by rolling water droplets. Then, the rest of the dust particles will be removed by large water droplets, as discussed in Figure 8. However, the remaining dust mass ratio curve for the super-hydrophilic surface is quite different from the super-hydrophobic surface. The remaining dust mass ratio for the super-hydrophilic surface first decreases slowly, and then decreases dramatically during the water spraying process, as shown in Figure 11. This is on account that few dust particles can be brought away from the surface of the sample before the liquid film breaks up, as discussed in Figure 9. However, when the liquid film breaks up, a lot of dust particles will be removed by the water film flow. Thus, the remaining dust mass ratio for the super-hydrophilic surface decreases dramatically at the second half of the water spraying process. Nevertheless, it needs to be noted that, on the super-hydrophilic surface and super-hydrophobic surface, the final remaining dust mass ratios are almost the same. The remaining dust mass ratio for the super-hydrophobic surface can reach 16.5, while it is 18.6 for the super-hydrophilic surface. For the bare glass sample, the remaining dust mass ratio slightly decreases during the water spraying process. As discussed in Figure 10, this is because the liquid droplets hardly roll down from the bare sample surface. The remaining dust mass ratio for the bare sample surface is only 86%. Thus, we can conclude that either super-hydrophobic or super-hydrophilic coatings can effectively decrease dust deposition under water spraying conditions. The results are the same as those acquired in the paper [36] conducted in desert areas.
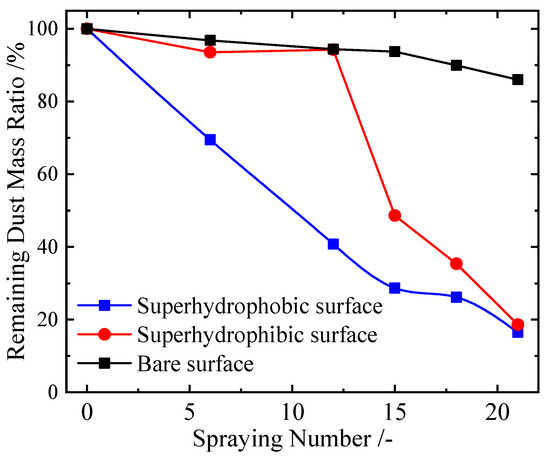
Figure 11.
Dust deposition mass on solar cell covering glass with and without coating.
3.4. Spectral Transmittance for Different Surfaces
The spectral transmittance of solar cell covering glass is critical to improve production efficiency of solar photovoltaic cells. The main reason for the decrease in photovoltaic output is the transmittance loss by dust deposition [6,7]. Thus, the transmittance of glass samples after the water spraying process is measured and shown in Figure 12. We can calculate the spectral transmittance of glass sample τ in this way:
where It represents the magnitude of light passing through a glass sample; and I0 represents the magnitude of the incident ray on the glass sample. The transmittance of different glass samples is measured by the UV spectrometer (U-3010, HITACHI, Tokyo, Japan). The spectral transmittance of different glass samples after the process of water spraying is shown in Figure 12. Compared with the bare glass sample, both super-hydrophobic and super-hydrophilic surfaces have much higher transmittance. However, the transmittance of the super-hydrophobic surface is slightly higher than that of the super-hydrophilic surface. The mean transmittance is, respectively, 91.1%, 86.4%, or 61.1% for the sample A, B, or C. Thus, we can improve the transmittance by self-cleaning coatings, in particular, for the super-hydrophobic coating.
τ = It/I0 × 100%
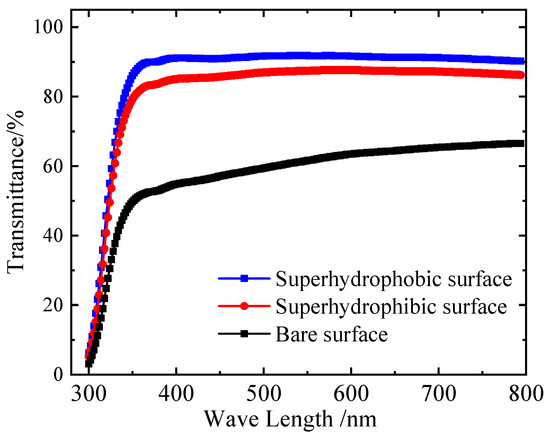
Figure 12.
The spectral transmittance of glass samples after the process of water spraying.
4. Conclusions
In this study, the self-cleaning performances and mechanisms of super-hydrophobic and super-hydrophilic coatings on solar photovoltaic cells are compared by experimental measurement. Super-hydrophobic coating has high self-cleaning performance, even under natural settling conditions without water, compared with super-hydrophilic coating. This may be important for self-cleaning of solar PV panels installed at dry and dusty regions, such as Qinghai or Xinjiang in the northwest of China. However, if rainfall is sufficient, both super-hydrophobic and super-hydrophilic coatings can be used for the self-cleaning of solar cells. Then, the durability and economy of the self-cleaning coating may be the most important concern for choosing the self-cleaning coating. This may be investigated in our future study.
Author Contributions
Conceptualization, H.L. and C.Z.; methodology, H.L.; software, H.L.; validation, H.L. and C.Z.; formal analysis, C.Z.; investigation, H.L.; resources, H.L.; data curation, C.Z.; writing—original draft preparation, H.L.; writing—review and editing, C.Z.; visualization; supervision, C.Z.; project administration, H.L.; funding acquisition, H.L. All authors have read and agreed to the published version of the manuscript.
Funding
This research was funded by the Xinjiang Natural Science Fund for Distinguished Young Scholars (No. 2021D01E08), High-level Talents Project of Xinjiang University (No. 100521001), and National Oversea High-level Talents Program. The research was also funded by Guangdong Basic and Applied Basic Research Fund (No. 2019A1515110555) and the Fundamental Research Funds for the Central Universities (No. D2191930).
Institutional Review Board Statement
Not applicable.
Informed Consent Statement
Not applicable.
Data Availability Statement
Not applicable.
Conflicts of Interest
The authors declare no conflict of interest.
References
- Zhao, W.; Lu, H. Self-Cleaning Performance of Super-Hydrophilic Coatings for Dust Deposition Reduction on Solar Photovoltaic Cells. Coatings 2021, 11, 1059. [Google Scholar] [CrossRef]
- Bai, Y.; Zhang, H.; Shao, Y.; Zhang, H.; Zhu, J. Recent Progresses of Superhydrophobic Coatings in Different Application Fields: An Overview. Coatings 2021, 11, 116. [Google Scholar] [CrossRef]
- Ferrari, M.; Piccardo, P.; Vernet, J.; Cirisano, F. High Transmittance Superhydrophobic Coatings with Durable Self-Cleaning Properties. Coatings 2021, 11, 493. [Google Scholar] [CrossRef]
- Basher, M.K.; Khalid Hossain, M.; Jalal Uddin, M.; Akand, M.A.R.; Shoroword, K.M. Effect of pyramidal texturization on the optical surface reflectance of monocrystalline photovoltaic silicon wafers. Optik 2018, 172, 801–811. [Google Scholar] [CrossRef]
- Basher, M.K.; Afaz, R.; Tayyaba, S.; Akanda, M.A.R.; Rahman, M.T.; Eman, N.M. Study and investigation of phosphorus doping time on emitter region for contact resistance optimization of monocrystalline silicon solar cells. Results Phys. 2018, 10, 205–211. [Google Scholar] [CrossRef]
- Khalid Hossain, M.; Rahman, M.T.; Basher, M.K.; Manir, M.S.; Bashar, M.S. Influence of thickness variation of gamma-irradiated DSSC photoanodic TiO2 film on structural, morphological and optical properties. Optik 2019, 178, 449–460. [Google Scholar] [CrossRef]
- Khalid Hossain, M.; Pervez, M.F.; Tayyaba, S.; Jalal Uddin, M.; Mortuza, A.A.; Mia, M.N.H.; Manir, M.S.; Karim, M.R.; Khan Mubarak, A. Efficiency enhancement of natural dye sensitized solar cells by optimizing electrode fabrication parameters. Mater. Sci. 2017, 35, 816–823. [Google Scholar]
- Mani, M.; Pillai, R. Impact of dust on solar photovoltaic (PV) performance: Research status, challenges and recommendations. Renew. Sustain. Energy Rev. 2010, 14, 3124–3131. [Google Scholar] [CrossRef]
- Tian, M.; Su, Y.; Zheng, H.; Pei, G.; Li, G.; Riffat, S. A review on the recent research progress in the compound parabolic concentrator (CPC) for solar energy applications. Renew. Sustain. Energy Rev. 2018, 82, 1272–1296. [Google Scholar] [CrossRef] [Green Version]
- El-Shobokshy, M.S.; Hussein, F.M. Effect of dust with different physical properties on the performance of photovoltaic cells. Sol. Energy 1993, 51, 505–511. [Google Scholar] [CrossRef]
- Vivar, M.; Herrero, R.; Antón, I.; Martínez-Moreno, F.; Moretón, R.; Sala, G.; Blakers, A.W.; Smeltink, J. Effect of soiling in CPV systems. Sol. Energy 2010, 84, 1327–1335. [Google Scholar] [CrossRef] [Green Version]
- Fan, D.; Dong, B.; Wang, S.; Zhao, L.; Wan, L.; Xu, Z.; Wu, Y. Research process of Self-cleaning technologies on solar panels. J. Mater. Rev. 2015, 29, 111–115. [Google Scholar]
- Kaldellis, J.K.; Kapsali, M. Simulating the dust effect on the energy performance of photovoltaic generators based on experimental measurements. Energy 2011, 36, 5154–5161. [Google Scholar] [CrossRef]
- Qasem, H.; Betts, T.R.; Müllejans, H.; AlBusairi, H.; Gottschalg, R. Dust-induced shading on photovoltaic modules. Prog. Photovolt. Res. Appl. 2014, 22, 218–226. [Google Scholar] [CrossRef] [Green Version]
- El-Nashar, A.M. The effect of dust accumulation on the performance of evacuated tube collectors. Sol. Energy 1994, 53, 105–115. [Google Scholar] [CrossRef]
- Zorrilla-Casanova, J.; Piliougine, M.; Carretero, J.; Bernaola-Galván, P.; Carpena, P.; Mora-López, L.; Sidrach-De-Cardona, M. Losses produced by soiling in the incoming radiation to photovoltaic modules. Prog. Photovolt. Res. Appl. 2013, 21, 790–796. [Google Scholar] [CrossRef]
- Lorenzo, E.; Moretón, R.; Luque, I. Dust effects on PV array performance: In-field observations with non-uniform patterns. Prog. Photovolt. Res. Appl. 2014, 22, 666–670. [Google Scholar] [CrossRef] [Green Version]
- Alajlan, S. Photovoltaic grid-connection system as load-shaving tool in Riyadh, Saudi Arabia. Appl. Energy 1999, 63, 91–99. [Google Scholar] [CrossRef]
- Goossens, D.; Kerschaever, E.V. Aeolian dust deposition on photovoltaic solar cellss: The effects of wind velocity and airborne dust concentration on cell performance. Sol. Energy 1999, 66, 277–289. [Google Scholar] [CrossRef]
- Jiang, H.; Lu, L.; Sun, K. Experimental investigation of the impact of airbourne dust deposition on the performance of solar photovoltaic (PV) modules. Atmos. Environ. 2011, 45, 4299–4304. [Google Scholar] [CrossRef]
- Lu, H.; Lu, L.; Wang, Y. Numerical investigation of dust pollution on a solar photovoltaic (PV) system mounted on an isolated building. Appl. Energy 2016, 180, 27–36. [Google Scholar] [CrossRef]
- Lu, H.; Zhao, W. Effects of particle sizes and tilt angles on dust deposition characteristics of a ground-mounted solar photovoltaic system. Appl. Energy 2018, 220, 514–526. [Google Scholar] [CrossRef]
- Lu, H.; Zhao, W. CFD prediction of dust pollution and impact on an isolated ground-mounted solar photovoltaic system. Renew. Energy 2019, 131, 829–840. [Google Scholar] [CrossRef]
- Appels, R.; Lefevre, B.; Herteleer, B.; Goverde, H.; Beerten, A.; Paesen, R.; De Medts, K.; Driesen, J.; Poortmans, J. Effect of soiling on photovoltaic modules. Sol. Energy 2013, 96, 283–291. [Google Scholar] [CrossRef]
- García, M.; Marroyo, L.; Lorenzo, E.; Pérez, M. Soiling and other optical losses in solar-tracking PV plants in navarra. Prog. Photovolt. Res. Appl. 2011, 19, 211–217. [Google Scholar] [CrossRef] [Green Version]
- Sueto, T.; Ota, Y.; Nishioka, K. Suppression of dust adhesion on a concentrator photovoltaic module using an anti-soiling photocatalytic coating. Sol. Energy 2013, 97, 414–417. [Google Scholar] [CrossRef]
- Piliougine, M.; Cañete, C.; Moreno, R.; Carretero, J.; Hirose, J.; Ogawa, S.; Sidrach-De-Cardona, M. Comparative analysis of energy produced by photovoltaic modules with anti-soiling coated surface in arid climates. Appl. Energy 2013, 112, 626–634. [Google Scholar] [CrossRef]
- Quan, Y.-Y.; Zhang, L.-Z. Experimental investigation of the anti-dust effect of transparent hydrophobic coatings applied for solar cell covering glass. Sol. Energy Mater. Sol. Cells 2017, 160, 382–389. [Google Scholar] [CrossRef]
- Wang, P.; Xie, J.; Ni, L.; Wan, L.; Ou, K.; Zheng, L.; Sun, K. Reducing the effect of dust deposition on the generating efficiency of solar PV modules by super-hydrophobic films. Sol. Energy 2018, 169, 277–283. [Google Scholar] [CrossRef]
- Prabhu, S.; Cindrella, L.; Joong Kwon, O.; Mohanraju, K. Superhydrophilic and self-cleaning rGO-TiO2 composite coatings for indoor and outdoor photovoltaic applications. Sol. Energy Mater. Sol. Cells 2017, 169, 304–312. [Google Scholar] [CrossRef]
- Lei, F.; Chen, S.; Sun, H.; Han, H.; Yang, J.; Huang, J.; Li, D.; Sun, D. Fabrication of highly transparent and superhydrophilic coatings on glass by modified α-zirconium phosphate nanoplatelets. Mater. Chem. Phys. 2021, 263, 124377. [Google Scholar] [CrossRef]
- Huang, Z.-S.; Shen, C.; Fan, L.; Ye, X.; Shi, X.; Li, H.; Zhang, Y.; Lai, Y.; Quan, Y.-Y. Experimental investigation of the anti-soiling performances of different wettability of transparent coatings: Superhydrophilic, hydrophilic, hydrophobic and superhydrophobic coatings. Sol. Energy Mater. Sol. Cells 2021, 225, 111053. [Google Scholar] [CrossRef]
- Pan, A.; Lu, H.; Zhang, L.-Z. Experimental investigation of dust deposition reduction on solar cell covering glass by different self-cleaning coatings. Energy 2019, 181, 645–653. [Google Scholar] [CrossRef]
- Lu, H.; Cai, R.; Zhang, L.-Z.; Lu, L.; Zhang, L. Experimental investigation on deposition reduction of different types of dust on solar PV cells by self-cleaning coatings. Sol. Energy 2020, 206, 365–373. [Google Scholar] [CrossRef]
- Quan, Y.-Y.; Zhang, L.-Z. Facile fabrication of superhydrophobic films with fractal structures using epoxy resin microspheres. Appl. Surf. Sci. 2014, 292, 44–54. [Google Scholar] [CrossRef]
- Khan, M.Z.; Ghaffar, A.; Bahattab, M.A.; Mirza, M.; Lange, K.; Abaalkheel, I.M.S.; Alqahtani, M.H.M.; Aldhuwaile, A.A.A.; Alqahtani, S.H.; Qasem, H.; et al. Outdoor performance of anti-soiling coatings in various climates of Saudi Arabia. Sol. Energy Mater. Sol. Cells 2022, 235, 111470. [Google Scholar] [CrossRef]
Publisher’s Note: MDPI stays neutral with regard to jurisdictional claims in published maps and institutional affiliations. |
© 2022 by the authors. Licensee MDPI, Basel, Switzerland. This article is an open access article distributed under the terms and conditions of the Creative Commons Attribution (CC BY) license (https://creativecommons.org/licenses/by/4.0/).