Abstract
This paper presents obtaining a single-phase ferrite layer with low content of carbon (the average thickness is about 156–246 µm) on the surface of 0.45% carbon steel by precisely designing the cooling rate during heat treatment, and its mechanical properties show a graded change in the cross-section. It may be achieved by preparing gradient/multilayer materials with more commonly utilized structures or a specific performance. Combining with phase identification by employing electron backscatter diffraction (EBSD) of the layer in this study is BCC ferritic phases. Based on the examination of Continuous Cooling Transformation (CCT) curves, the following conclusions are given. Under the cooling process with gradient temperature, a ferrite layer first forms on the outer lower temperature surface of the 0.45% carbon steel and subsequently develops by pushing the surplus carbon to the inner higher temperature austenite region. It is corroborated by the experimental findings of carbon contents dispersion acquired by electron probe microanalyzer (EPMA). Finally, the experimental findings of grain orientations and size distribution defined by electron backscatter diffraction (EBSD) are given as requirements for microscopic interpretation of the combination of excellent strength and bending capabilities of materials. Furthermore, the experimental findings of oxidation precisely specified the cooling rate during heat treatment of Cu coating samples, which are defined as criteria for identifying the production mechanism of the surface ferrite layer. It provides a theoretical explanation and direct experimental proof for creating the ferrite layer on the surface.
1. Introduction
Metal heat treatment is one of the fundamental processing methods for tuning metal microstructures. Different microstructures and characteristics of materials may be achieved by altering the heat treatment procedure. Conventional heat treatment may enhance the overall structure and performance across the complete metal. Thus, the difficulty of the standard heat treatment in generating gradient/multilayer materials with uneven surfaces and core by heat treatment should be addressed. There are many studies on the preparation of gradient materials, which suggest that gradient materials can exhibit unique performances such as strength-ductility synergy, corrosion resistance, electric conductivity, and so forth [1,2,3]. However, only a few studies reported the preparation of gradient materials by heat treatment.
With the fast growth of science and technology, the heat treatment of steel materials is growing in the direction of quantification, intelligence, and precise control [4,5]. Some studies have been conducted to optimize heat treatment procedures for enhancing characteristics. Zhang et al. [6,7] endowed the low carbon steel (C, 0.05 wt%) with a multi-structure consisting of an outer surface ferrite phase (a 450 µm in thickness) and an inner ferrite-pearlite multiphase through a precisely designed cooling rate during heat treatment; that is, a local ferrite transformation happened. The precisely designed cooling rate heat treatment technique can be applied to obtain a surface microstructure different from the core, such as endowing materials with a multi-structure consisting of pure ferrite on the surface and bainite or martensite inside. The technique can be critical to obtaining a better combination of strength and ductility. On the other hand, it can obtain a better coating performance and improve surface corrosion resistance. Besides, it has enlarged the use of the traditional heat treatment of steel, which is low-cost and more efficient. However, only the precisely designed cooling rate heat treatment on low carbon steel to obtain a surface ferrite layer is conducted, and the formation process is concentrated. Further efforts should be made to uncover the surface ferrite’s formation mechanism, notably the process of carbon diffusion during the interface movement, which plays a key role in the development of surface ferrite. Moreover, the precisely designed cooling rate heat treatment technique requires further experimental data backing.
According to references [8,9,10], local ferrite transformation can only be performed at a high transformation start temperature (Ar3). In this paper, the cooling rate of 0.45% carbon steel during heat treatment is designed accurately to produce a single-phase ferrite layer on its surface according to the above principle, which is applied to research the effect of a slightly lower transformation start temperature (Ar3) on local ferrite transformation. The formation process is explored at length based on CCT curves. The electron probe microanalyzer (EPMA) is used to analyze the 0.45% carbon steel after the carefully specified cooling rate heat treatment, and the contents distribution of carbon from the surface to the interior is studied. Moreover, the microstructure of the surface ferrite layer is studied by electron backscatter diffraction (EBSD), which is defined as a requirement for microscopic interpretation of the combination of excellent strength and bending capabilities of materials. Furthermore, based on the efficiency of Cu coating as a carburization barrier in carbon steel, identification tests of the production mechanism of the surface ferrite layer are used in this work. This work aims to increase the range of steel that may be produced in a single-phase ferrite layer on the surface to build gradient/multilayer materials with more commonly used structures or a specific performance. The additional objective of the study is to present a theoretical explanation and direct experimental proof for the production of the surface ferrite layer via the theoretical analysis of CCT curves and the use of EPMA.
2. Materials and Experimental Methods
The material employed in this study was 0.45% carbon steel. The composition of the 0.45% carbon steel is reported in Table 1. The sample size is 8 mm × 8 mm × 23 mm. Before the carefully specified cooling rate heat treatment, it was quenched to room temperature to achieve a more homogenous dispersion of carbon.

Table 1.
Chemical composition of 0.45% carbon steel (wt%).
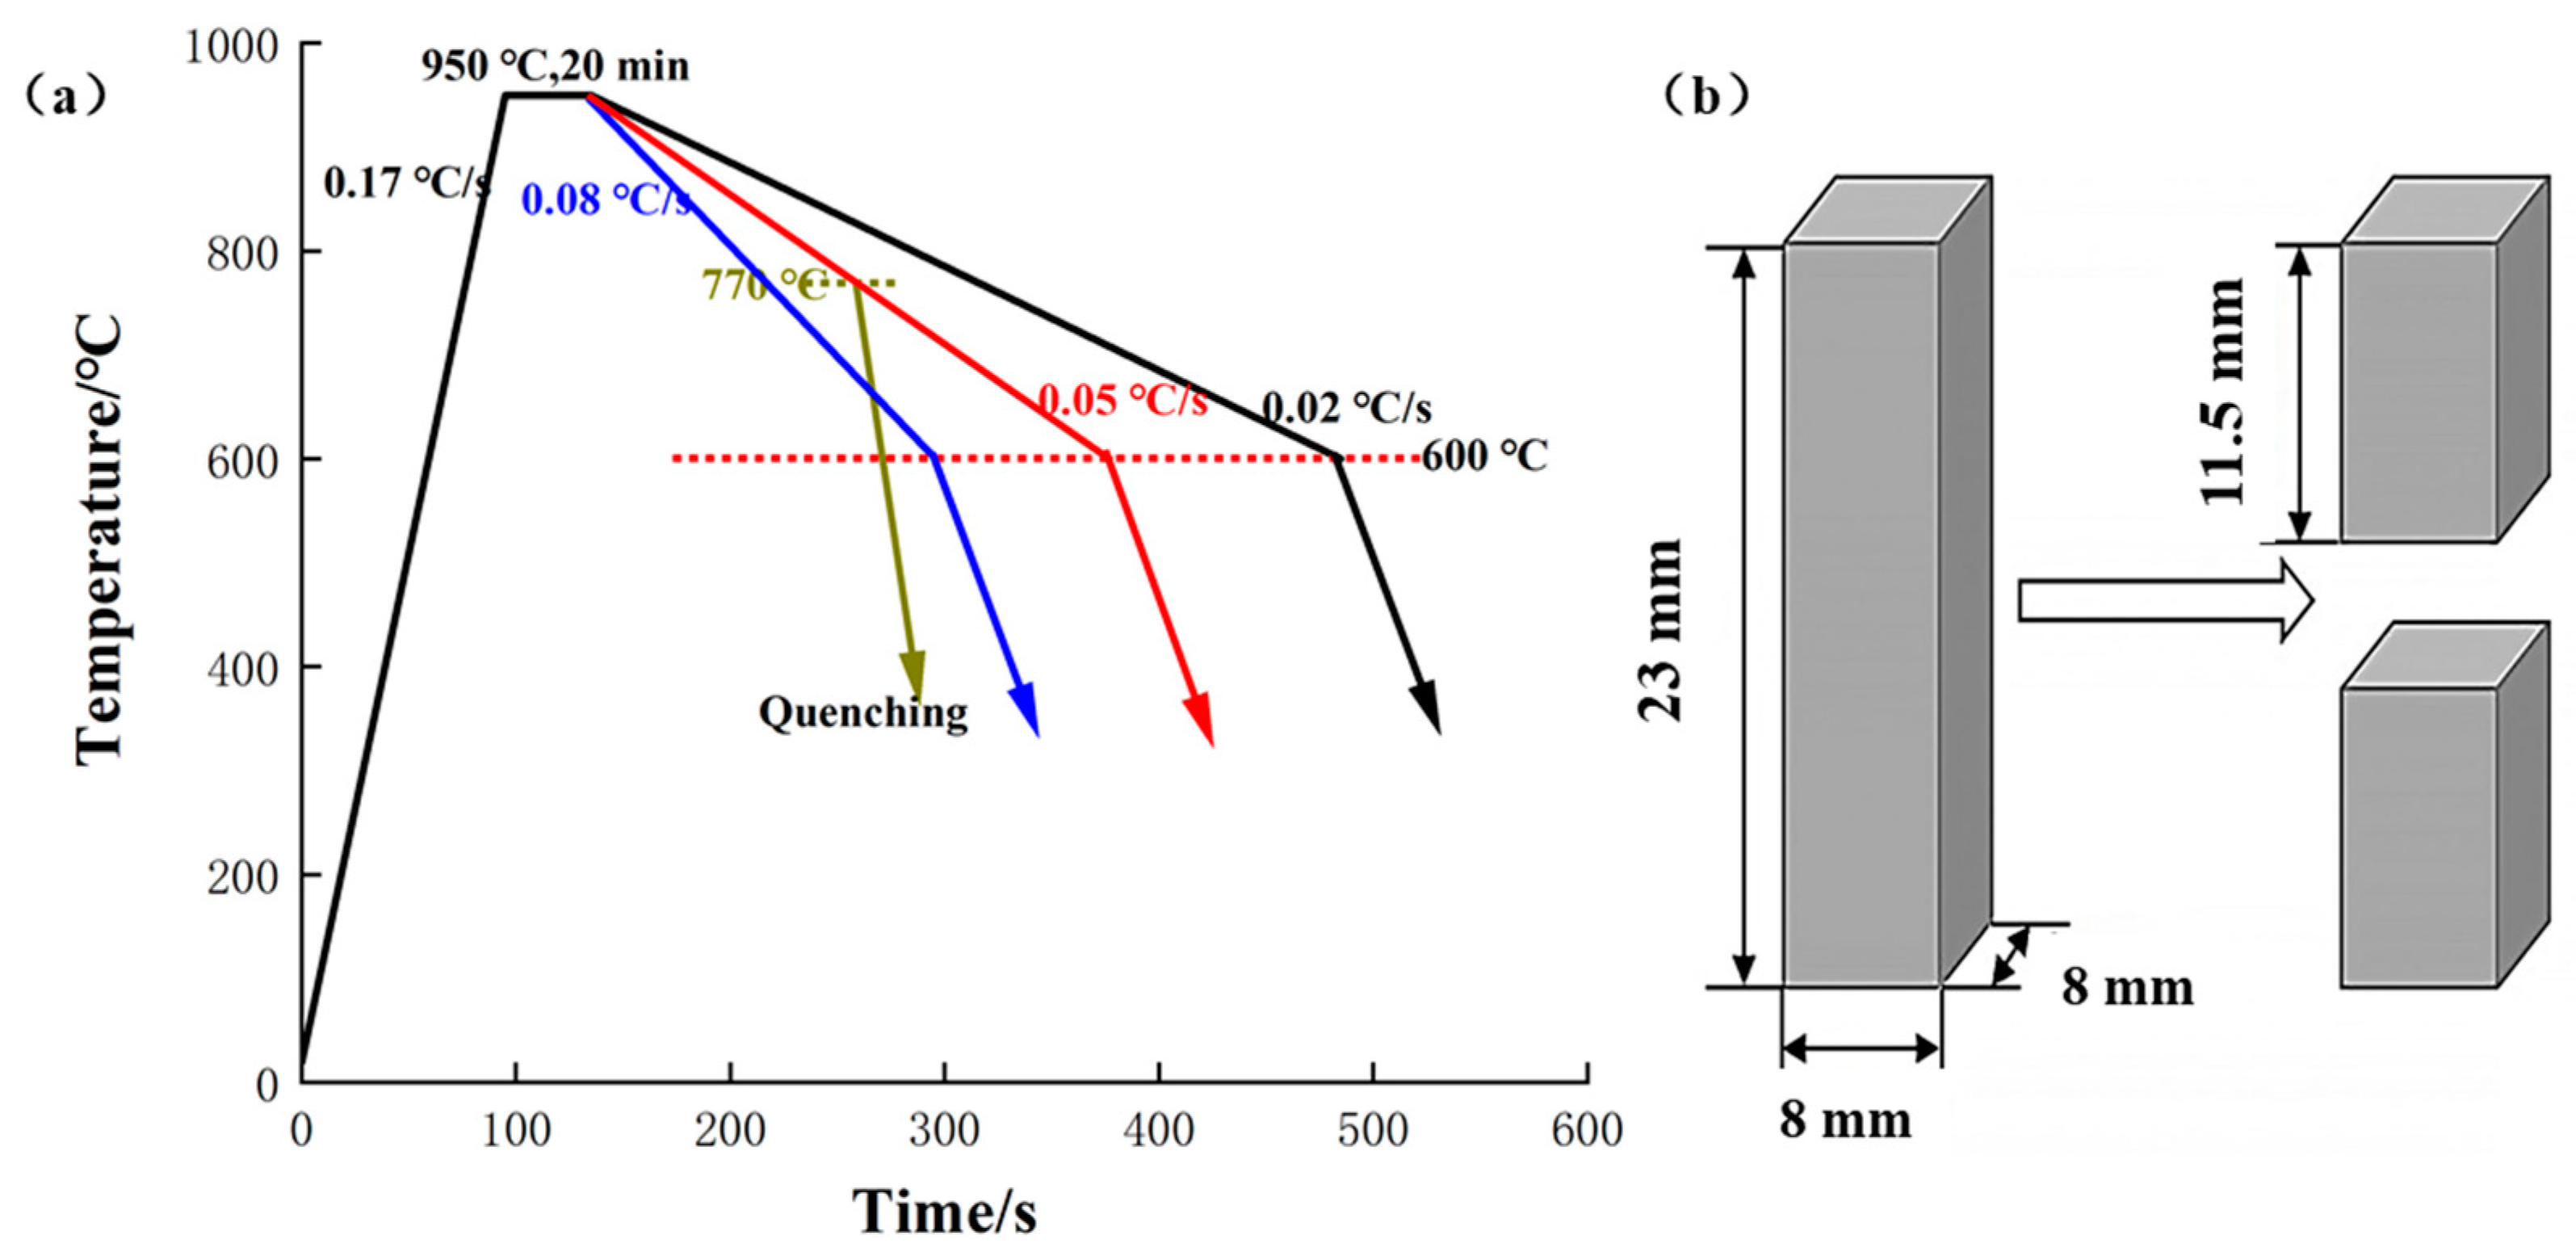
The heat treatment studies were conducted in a vacuum tube furnace (OTF-1200X, Hefei Kejing Materials Technology Co., Ltd., Hefei, China). Firstly, the pressure in the quartz tube was inflated to less than 10 Pa, and then the quartz tube was maintained under a purging argon stream, which was utilized to establish an inert atmosphere inside the furnace. Finally, the pressure was again pushed to less than 10 Pa. The samples were heated to 950 °C at a heating rate of 0.17 °C/s, which remained at 950 °C for 20 min. After that, samples were cooled to 600 °C at a cooling rate of 0.08, 0.05, and 0.02 °C/s, respectively. Then, the samples were cooled to room temperature. The cooling rate described above was randomly picked to discuss during further heat treatment about the accurate and dependable experimental data produced. Altogether, there were six samples used in this study.
Moreover, to explore the development process of proeutectoid ferrite, another sample with a cooling rate of 0.05 °C/s was quenched at 770 °C, assuming its transition start temperature was 780 °C according to the Fe-Fe3C phase diagram. Furthermore, the oxidation tests and carefully planned cooling rate heat treatment of the samples with Cu coating as a barrier were explored, which could determine the creation process of the surface ferrite layer. Before the Cu coating oxidation experiment and planned cooling rate heat treatment experiment, the conventional electroless copper plating method was used to apply Cu coatings on the surface of 0.45% carbon steel. A series of proprietary chemistries were used as the ingredients for the several process baths in the electroless copper plating operation involving cleaning, activation, acceleration, and deposition. Copper sulfate pentahydrate (≥98.0%) was used, with hydrazine hydrate (N2H4·xH2O, N2H4 50%–60%) as the solvent and reductant, respectively. The heating process of oxidation tests was used in a nitrogen environment until the temperature was escalated to 850 °C, then the sample was exposed to an oxidizing atmosphere for 60 min.
After carefully controlled cooling rate heat treatment, the samples were uniformly cross-cut into two pieces at the height center (as shown in Figure 1b). The treated specimens were mounted and polished using normal metallographic procedures and etched using a 4% nitric acid ethanol solution. The microstructure of materials was studied by optical microscopic and scanning electron microscopy (Sigma-300, Zeiss, Oberkochen, Germany). The carbon distribution of the quenching samples in the cross-section was examined using an electron probe microanalysis (EPMA-1720H, Shimadzu, Kyoto, Japan) working at 10 kV. The line scanning measurements began from the edge of the sample section to the core point by point with a step of 1 µm The phase identification of the surface layer and characterization of its grain orientations and size were accomplished using electron backscatter diffraction (EBSD). Vibration polishing was conducted to prepare the sample surface for EBSD analysis with a 40 nm colloidal silica suspension. The EBSD data were collected using a Tescan Mira 3 XH Extreme-resolution Analytical Field Emission scanning electron microscopy (SEM) running at 20 kV with the sample tilted at 70°, and the data were processed using HKL Channel 5 system software. The microhardness measurements in the cross-section of the intended cooling rate heat treatment samples were performed using a microhardness meter under the load of 200 gf, 15 s dwell. X-ray diffraction (XRD, D/mas-2000PC, Rigaku, Tokyo, Japan) analysis was performed to determine the component phases of the Cu coating on the surface according to the microstructure observation, with a Cu Kα source.
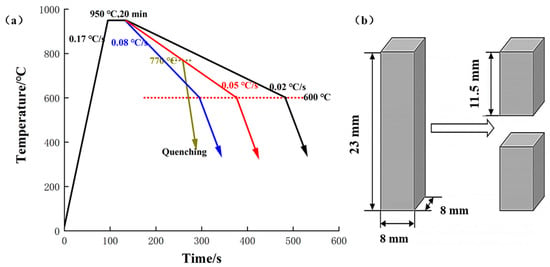
Figure 1.
Samples processing. (a) schematic diagram of the precisely designed cooling rate heat treatment at a cooling rate of 0.08, 0.05, and 0.02 °C/s and quenching; (b) schematic diagram of sample cutting.
3. Experiment Results and Discussion
3.1. OM of the Structure of Surface Ferrite Layer
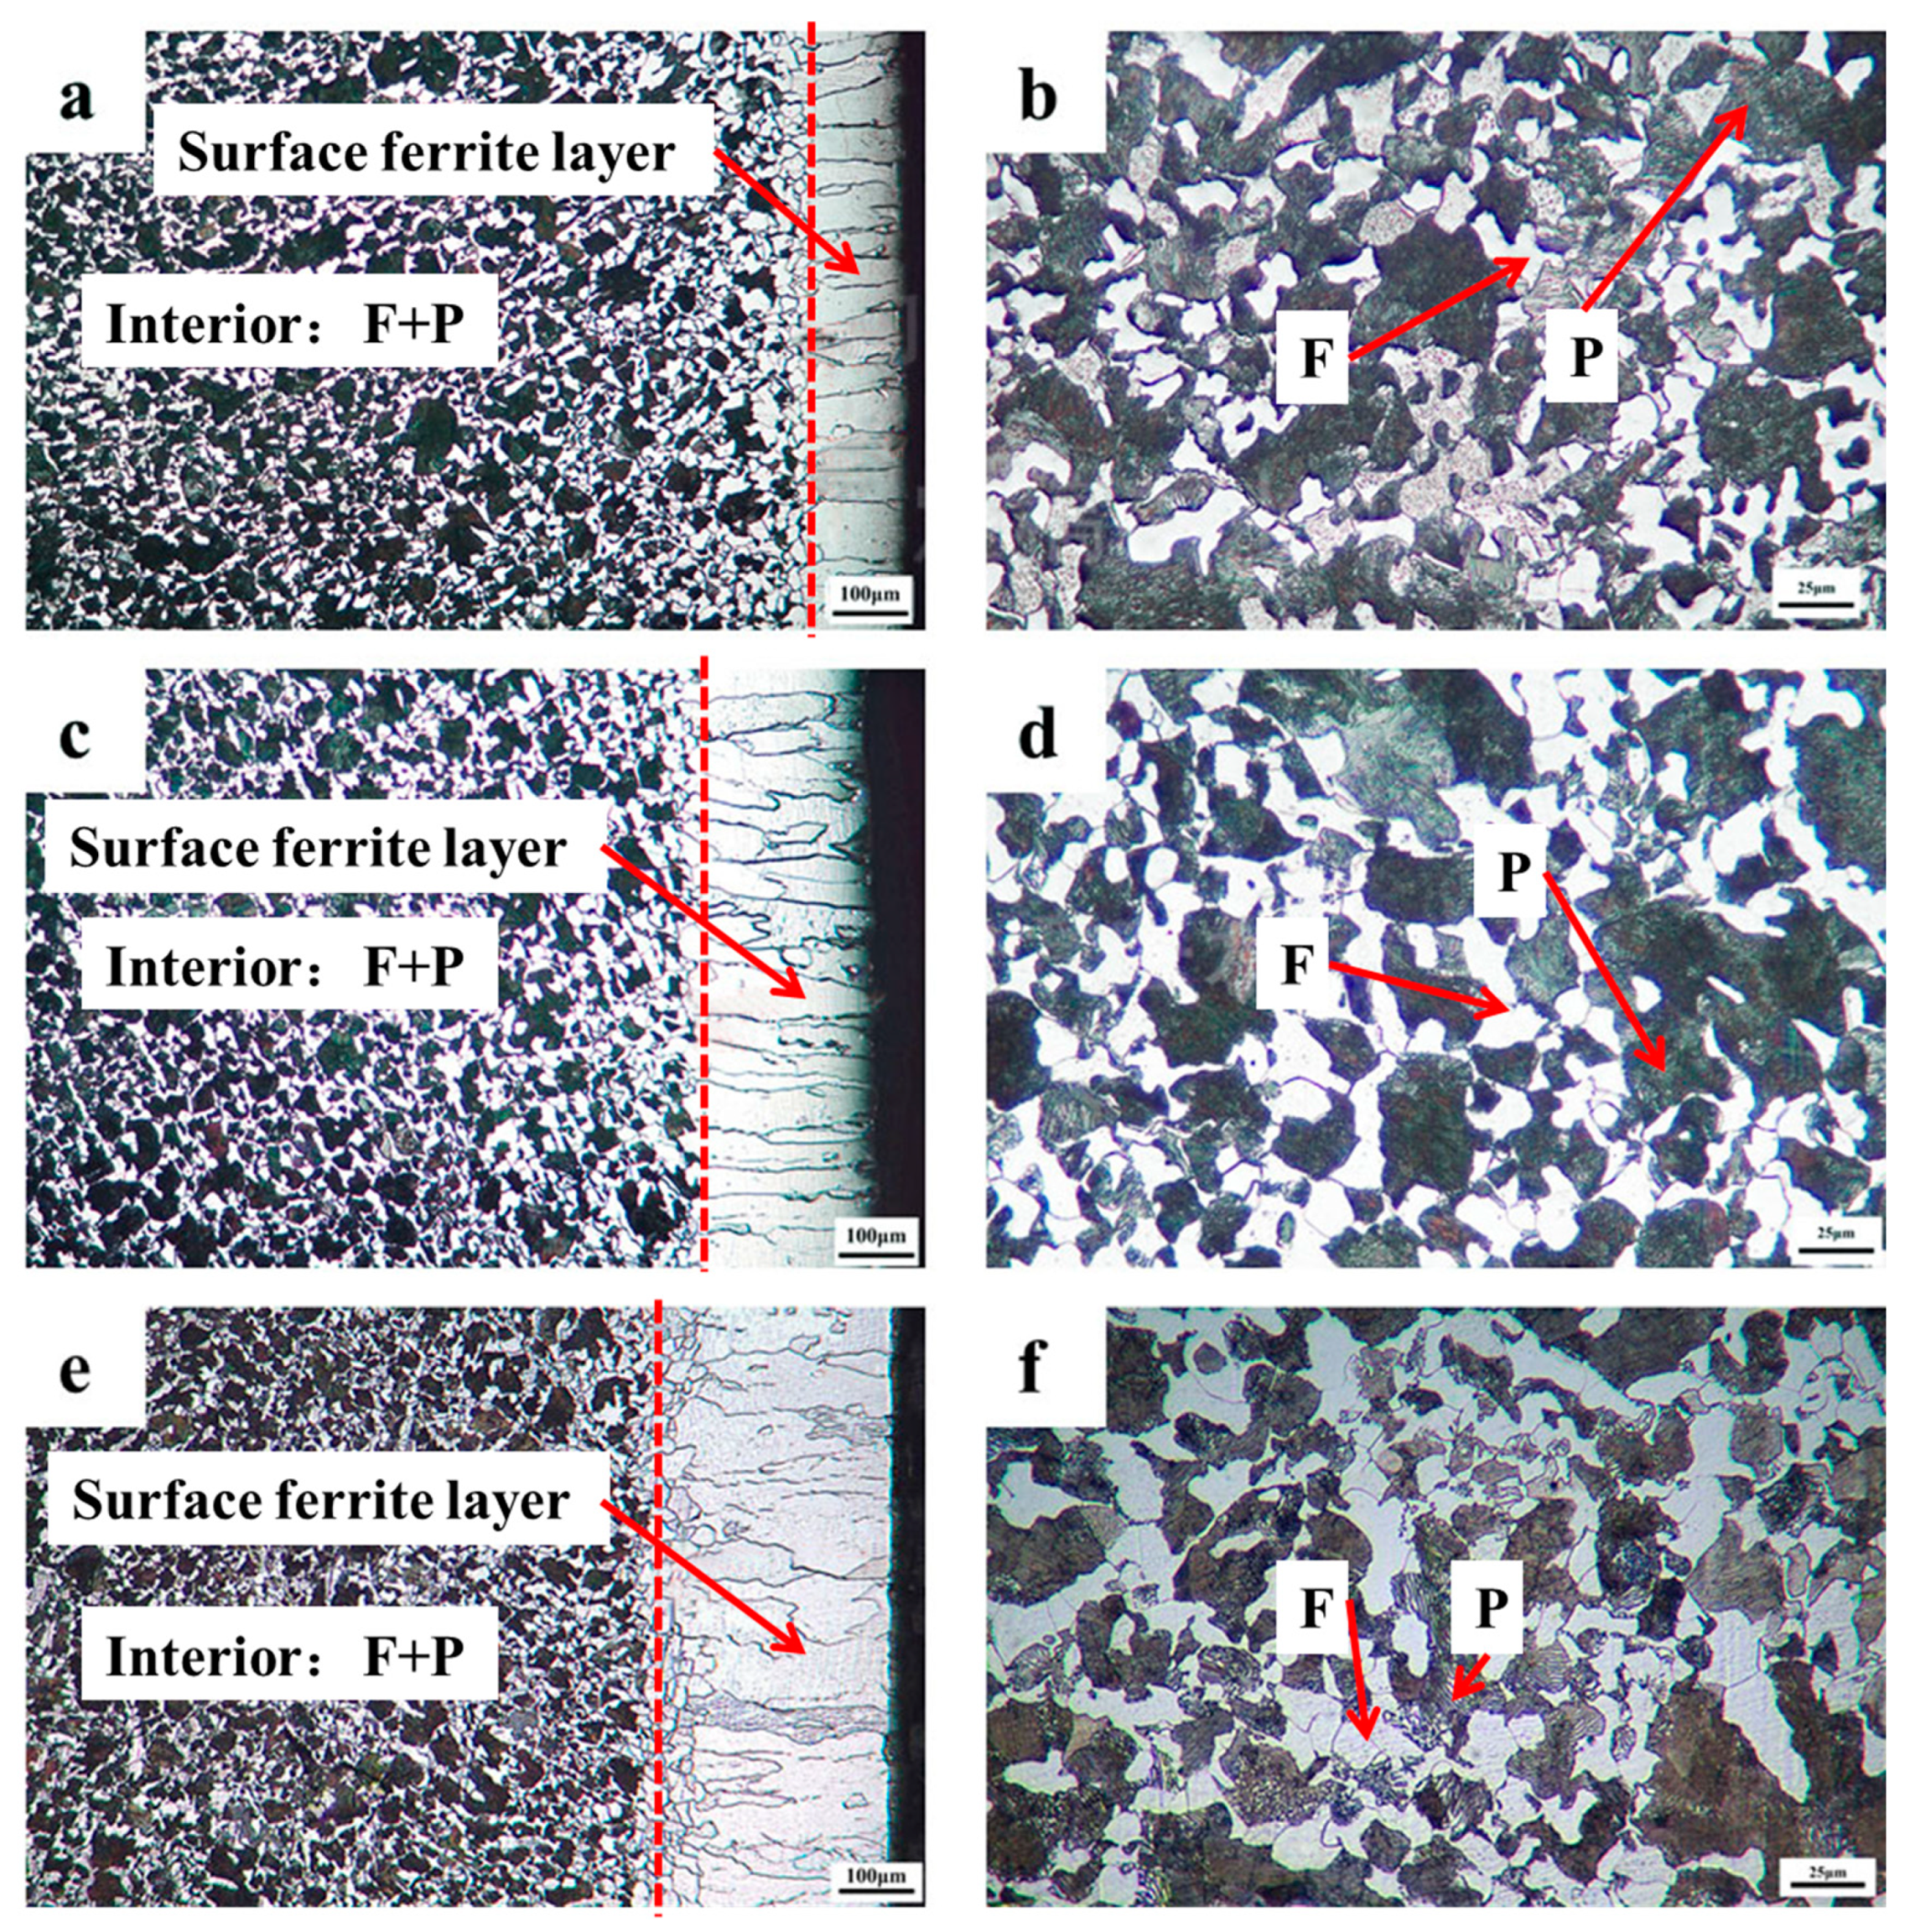
Figure 2 depicts the microstructure of the materials mentioned above using an optical microscope. Figure 2a,c,e represents the surface region with the transition from ferrite near the surface to a mixed phase of ferrite and pearlite in the interior at a cooling rate of 0.08, 0.05, and 0.02 °C/s; Figure 2b,d,f represents the mixed phase of ferrite and pearlite in the interior of the sample at a cooling rate of 0.08, 0.05, and 0.02 °C/s. It can be shown that after carefully designed cooling rate heat treatment at a cooling rate of 0.08, 0.05, and 0.02 °C/s, the multilayer structure with an evident interface in 0.45% carbon steel were all effectively manufactured. The surface of the samples in Figure 2 has a dazzling white single-phase ferrite structure with a thickness ranging from 150 to 340 µm, whereas the interior region comprises ferrite and pearlite structures, showing the creation of the multilayer structure. This finding is comparable to that of the surface ferrite layer of a low carbon steel (0.054%) reported by Zhang et al. [6,7].
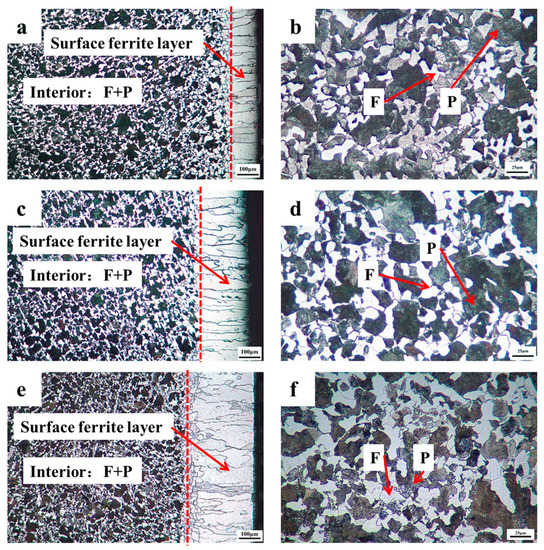
Figure 2.
Cross-sectional microstructures of 0.45% carbon steel after the precisely designed cooling rate heat treatment: (a,b) cooling rate: 0.08 °C/s; (c,d) cooling rate: 0.05 °C/s; (e,f) cooling rate: 0.02 °C/s.
The creation of the single-phase ferrite layer on the surface is understood as follows. As the temperature drops, the phase change from austenite to ferrite occurs over the full sample. However, considering the interior parts, the ferrite preferentially nucleates on the surface of the sample owing to the low temperature during the cooling process [11]. Moreover, the volume of ferrite is bigger than that of austenite, and then the ferrite also preferentially nucleates on the free surface. It can be called the “surface effect”. Therefore, properly tailoring the cooling rate within a specified range to suit the gradient field conditions, the proeutectoid ferrite preferentially nucleates on the surface and then expands towards the core of the sample. It needs to be pointed out that the interior austenite does not undergo a phase change owing to the high temperature. Meanwhile, during the formation of ferrite, the phase interface will continually push the carbon atoms dispersed from the ferrite to the austenite side, as the solid solubility of the carbon in ferrite is exceedingly low [12]. Finally, the surface ferrite layer is produced.
Furthermore, the thickness of the ferrite layer on the surface could be adjusted by designing the cooling rate during heat treatment, increasing the corrosion resistance of steel [13]. The thickness of the ferrite layer on the surface was around 156, 209, and 246 µm correspondingly, with a cooling rate of 0.08, 0.05, and 0.02 °C/s. It is shown that additional time for the directed diffusion of carbon has been supplied with reducing the cooling rate, as the cooling rate is designed within a specified range fulfilling gradient field conditions. Thus, the thickness of the surface ferrite layer grows.
3.2. Discussion on the Surface Ferrite Layer Formation Using CCT Curves
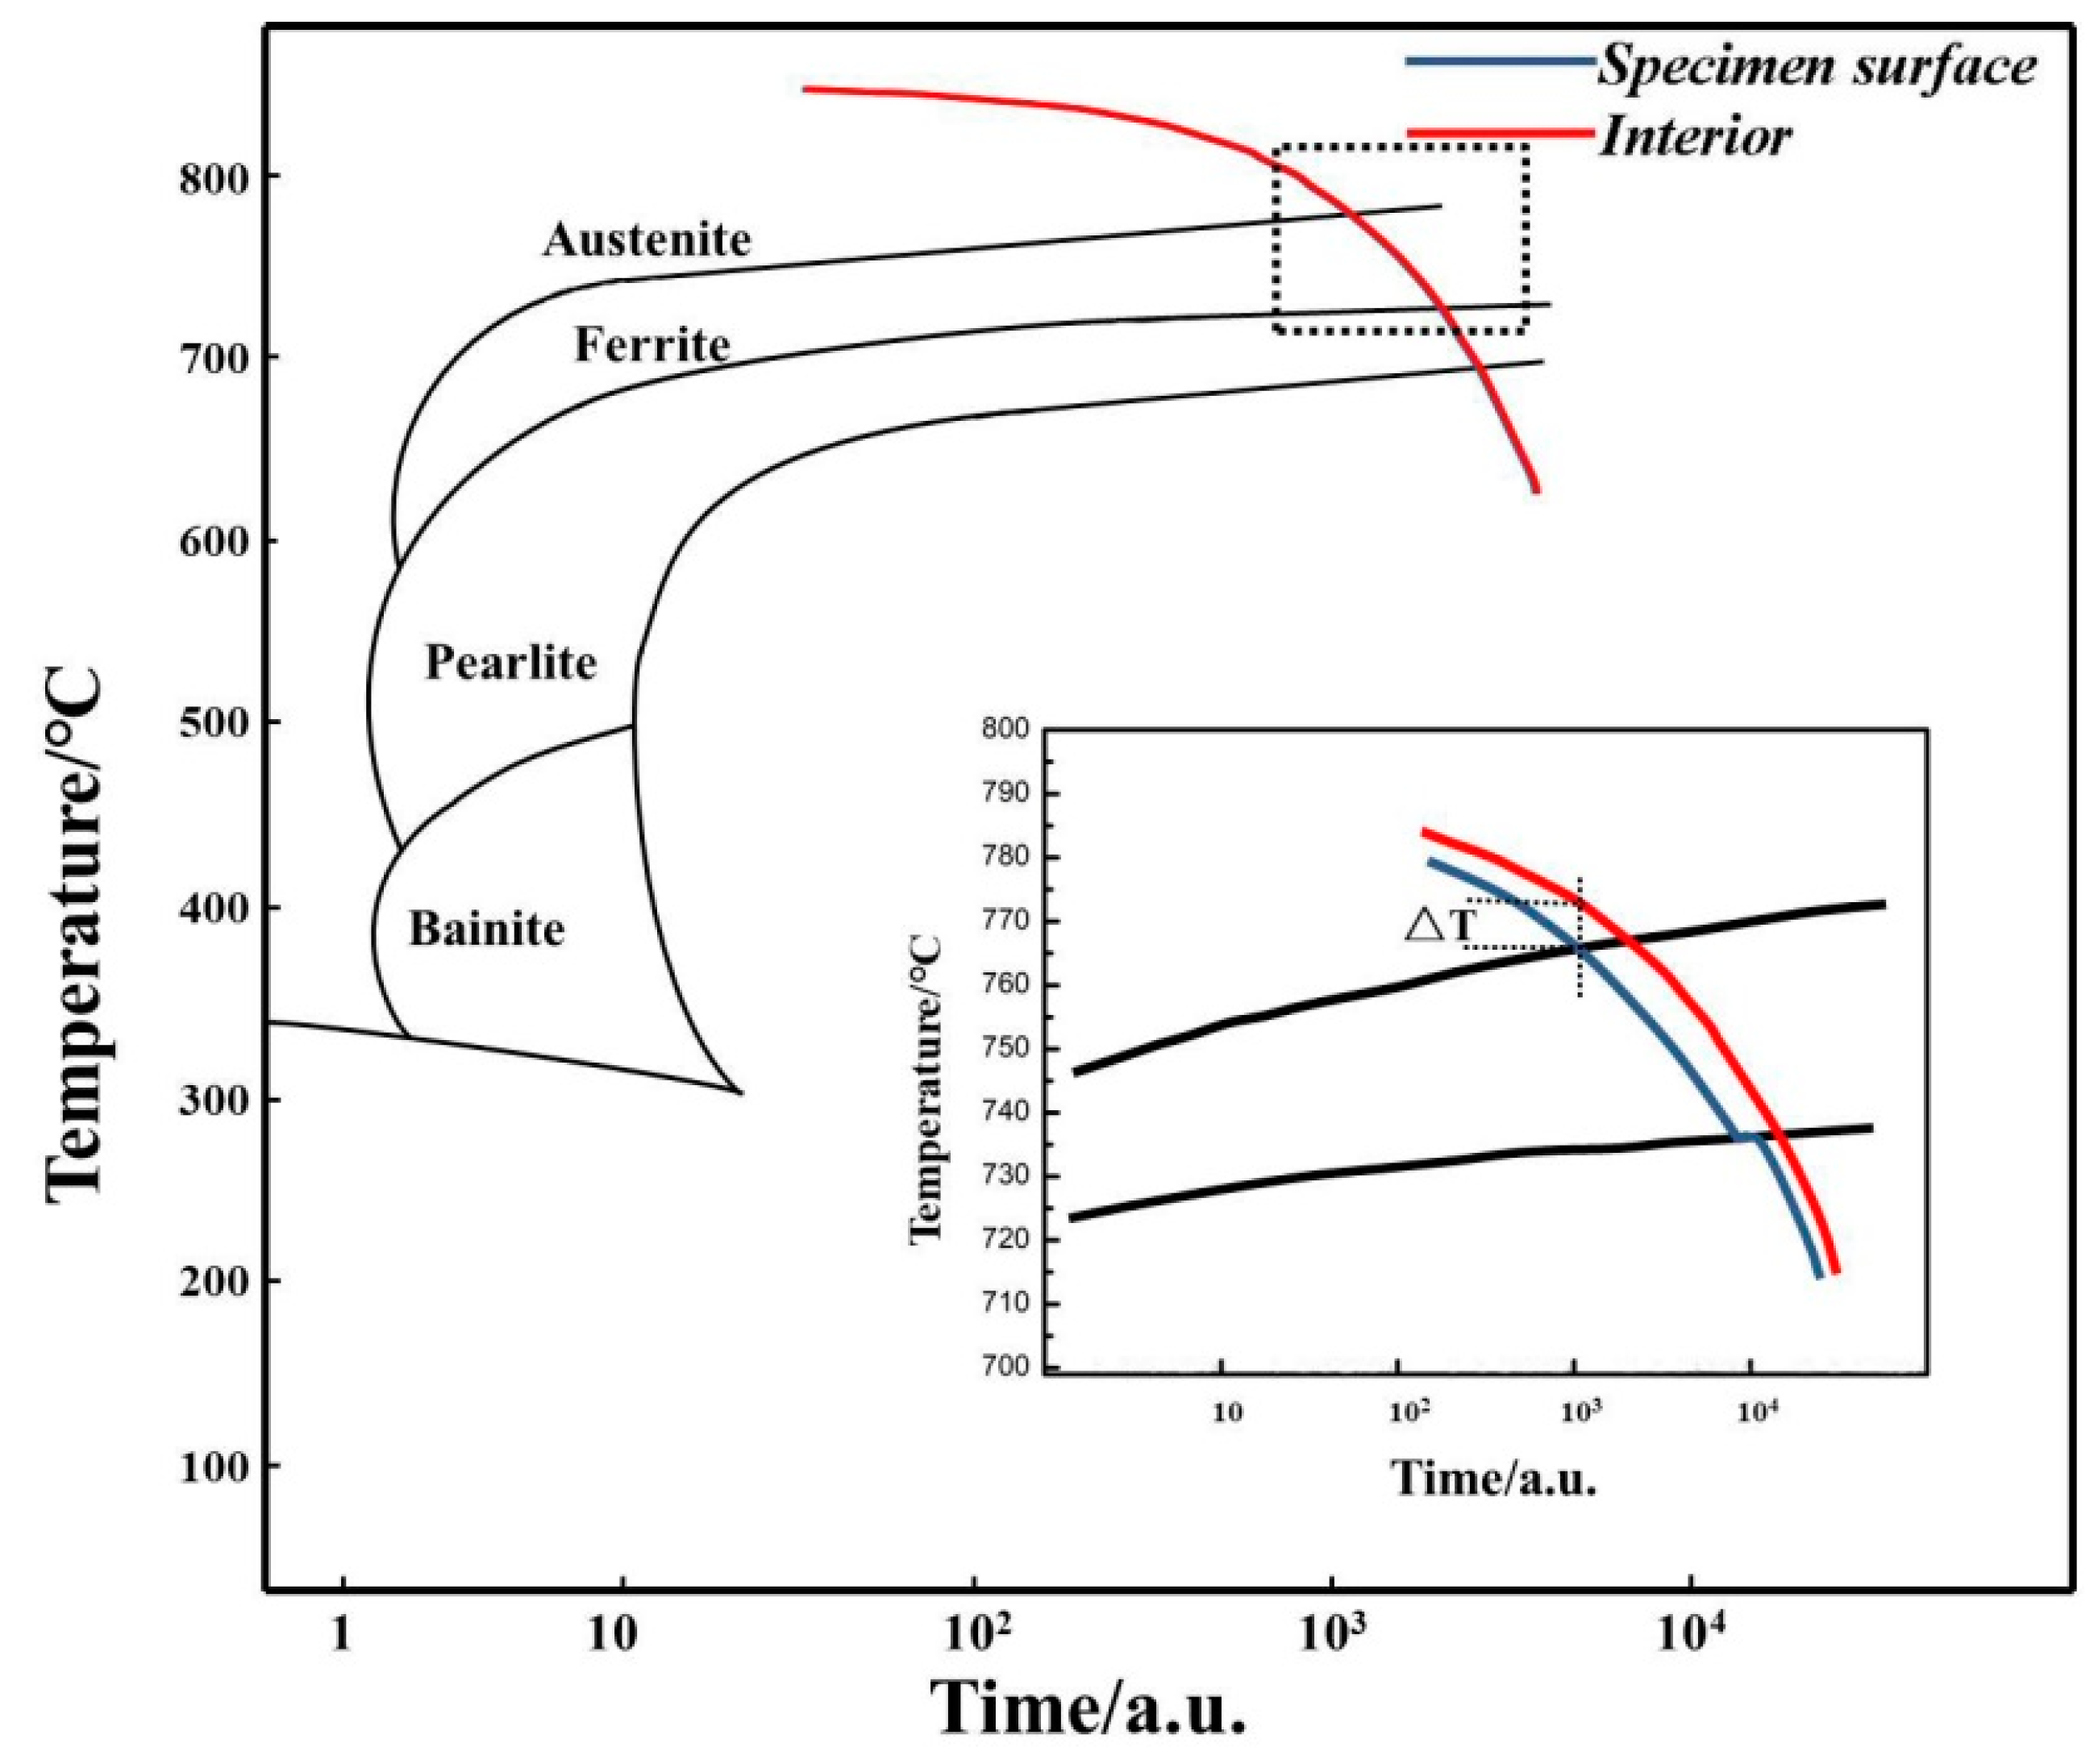
The continuous cooling transformation curves of 0.45% carbon steel are exhibited in Figure 3. The transformation from austenite to ferrite may be achieved within a specified cooling rate range, and the transformation temperature of proeutectoid ferrite falls with the rise of the cooling rate [14]. The undercooled austenite phase change process of the surface and core in the carefully determined cooling rate heat treatment is interpreted in Figure 3.
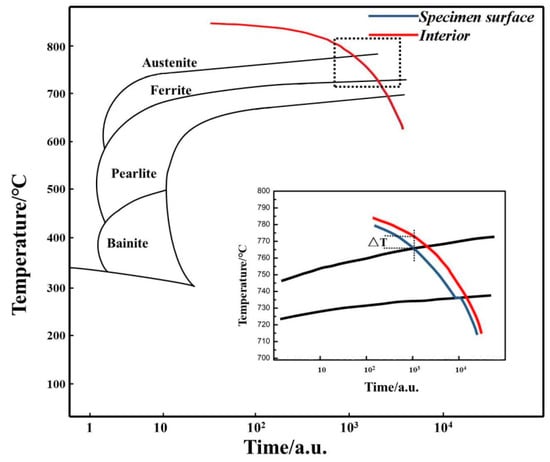
Figure 3.
CCT curves of 0.45% carbon steel.
There is a temperature differential between the core and surface of samples, as demonstrated by the ΔT in Figure 3. Thus, when the surface temperature decreases to Ar3, the core temperature does not reach Ar3. Undercooled austenite on the surface undergoes ferrite transition, while the core remains austenite [15]. As surface ferrite grains expand, the directed diffusion of carbon atoms from ferrite to austenite occurs, raising the carbon content in the austenite within, further decreasing the transformation driving force and making it more stable. When the core temperature exceeds Ar3, ferrite nucleation begins at the grain boundaries of the internal austenite, and this time the global ferrite transformation commences. Thus, carbon precipitation will be isotropic, and there will be no unidirectional (surface to the core) diffusion of carbon. Therefore, the barrier prevents the future development of the surface ferrite. The freshly generated ferrite nucleates and grows in the crystal corners, edges, grain boundaries, and interior of the crystal, generating a mixed structure of ferrite and austenite.
With the further temperature decrease, when the temperature of the sample is lower than Ar1, the internal austenite will transition to pearlite. As it is a single-phase ferrite on the sample surface, the area where the pearlite transition happens should be from the phase interface between the surface ferrite and austenite to the core of the sample. It is indicated by the deviation of the cooling curve of the sample surface at Ar1 in the expanded schematic image shown in Figure 3.
Finally, a gradient structure in which the surface is ferrite and the inside is a mixed ferrite and pearlite structure will be constructed. Therefore, the cooling rate is vital in regulating surface (local) ferrite transformation. With an appropriate cooling rate to fulfill a temperature gradient, a single-phase ferrite layer with a specified thickness may be created on the surface. As described above, here it presents a theoretical explanation for the creation process of the surface ferrite layer.
3.3. SEM Observation and Carbon Distribution Measurement of the Surface Ferrite Layer
3.3.1. SEM Observation of the Surface Ferrite Layer
To explore the non-uniform distribution of carbon diffusion produced by local ferrite transformation, a single-phase must be generated for direct investigation of carbon content. However, pearlite is a two-phase combination made of ferrite and cementite, and the average carbon amounts can only be derived through conversion. Thus, the quenching sample mentioned above was picked for discussion to prevent carbide interference.
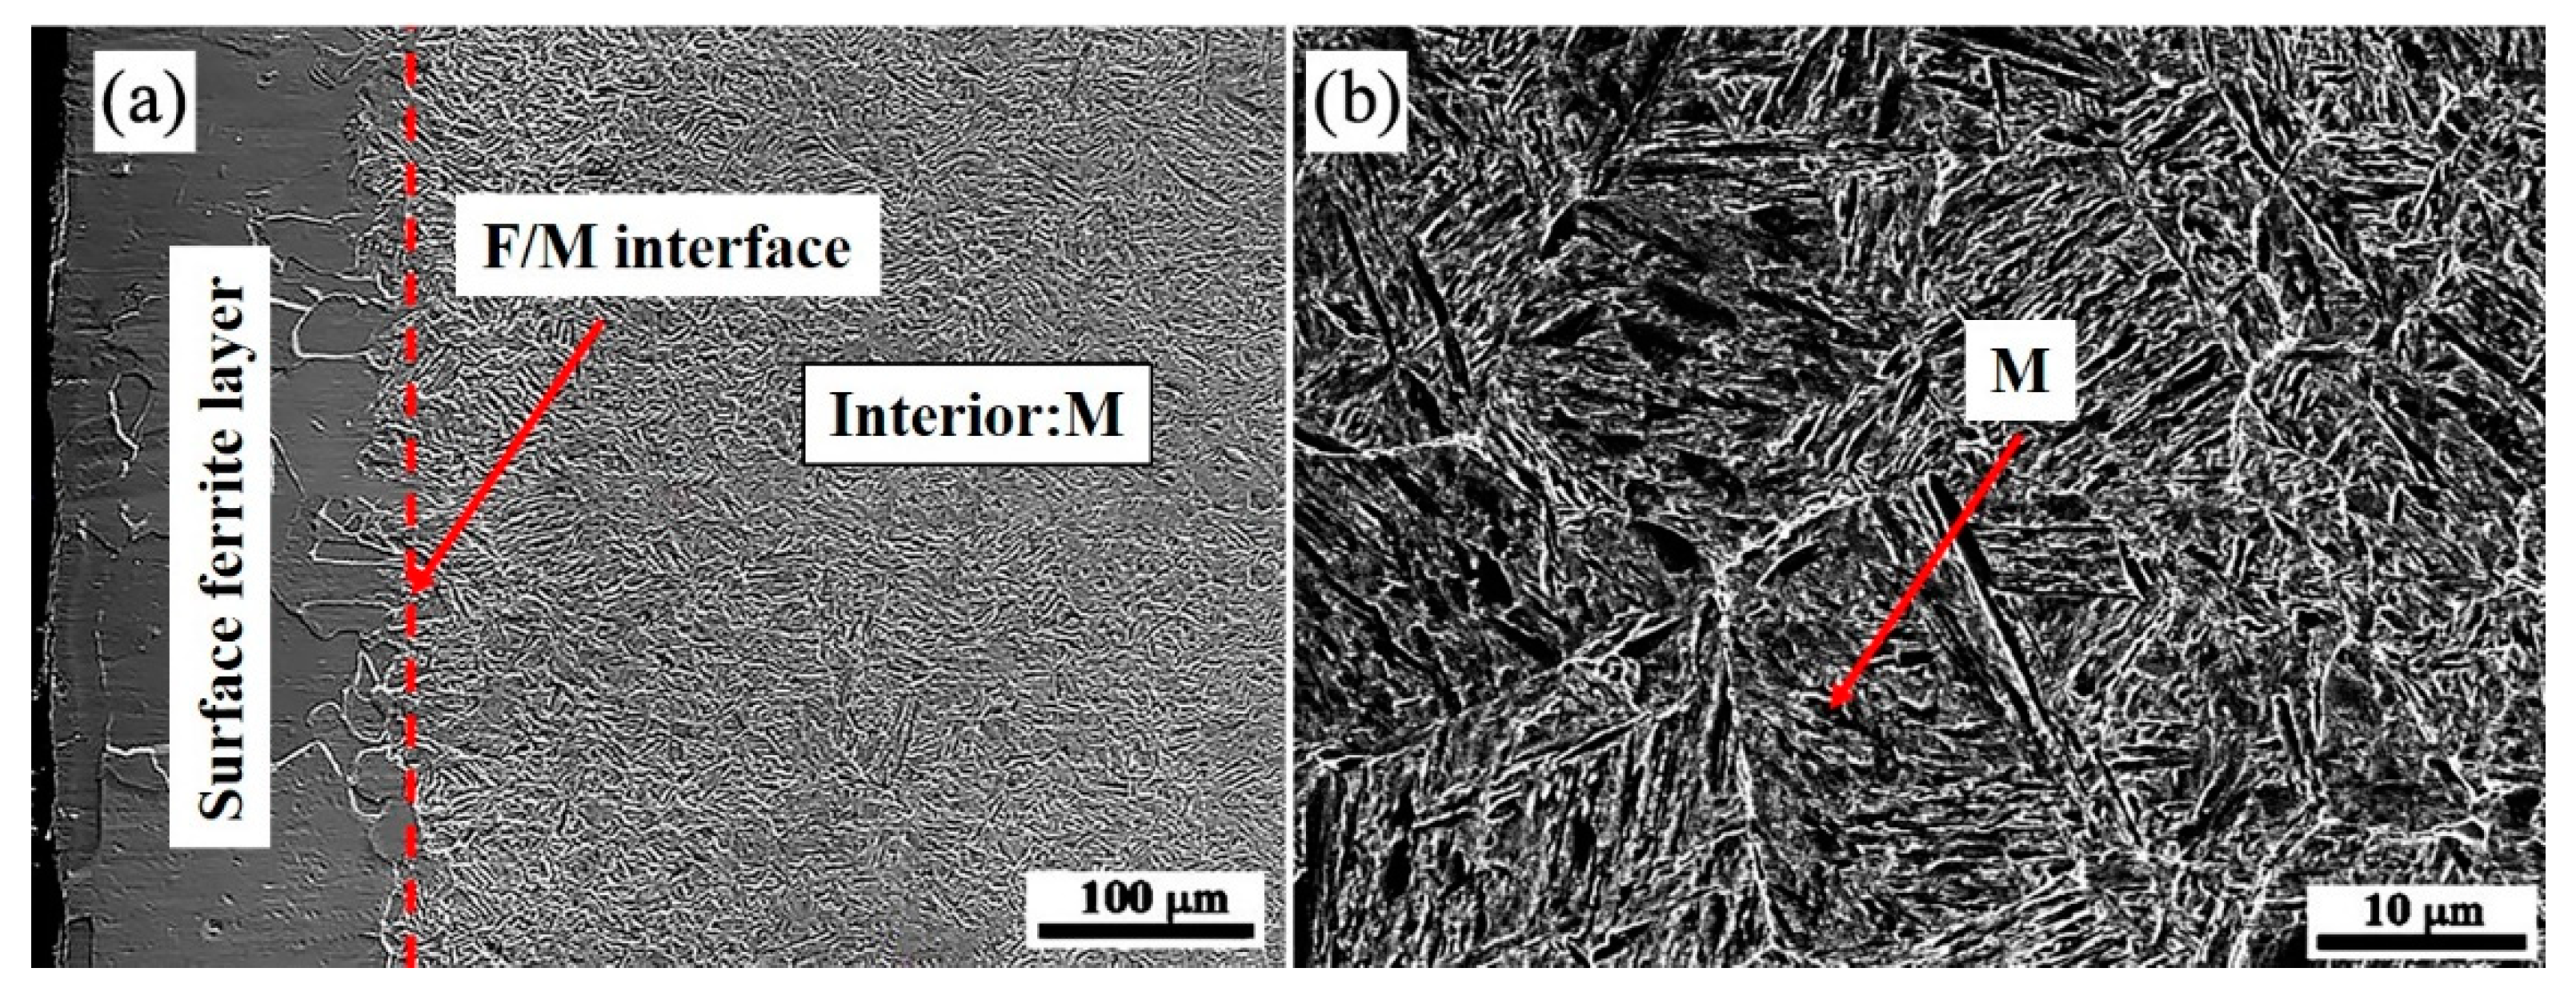
The microstructure of the quenching sample was studied by SEM and is displayed in Figure 4. It is proven that the surface of the sample quenched at 770 °C is a single-phase ferrite, whereas the subsurface and interior are martensite. The material has undergone local ferrite transition, which validates the earlier hypothesis. As the temperature below A3 is in the range of the two-phase zone, by precisely designing the cooling rate within a certain range to meet the gradient field conditions, the surface effect will occur; that is, the proeutectoid ferrite preferentially nucleates and grows on the surface, while the internal austenite has not undergone the austenite-ferrite transformation. When ferrite increases, carbon atoms will diffuse from ferrite to austenite. The increase in carbon levels in the austenite lessens the driving force for transformation, making the austenite more stable [16]. At this moment, the quenching is conducted, and martensite transition will occur.
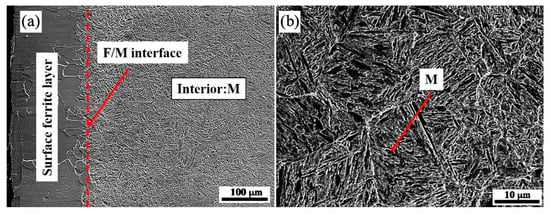
Figure 4.
The cross-sectional SEM morphology of 0.45% carbon steel quenched at 770 °C: (a) surface; (b) interior.
3.3.2. Carbon Distribution Measurement and hardness distribution of the Surface Ferrite Layer
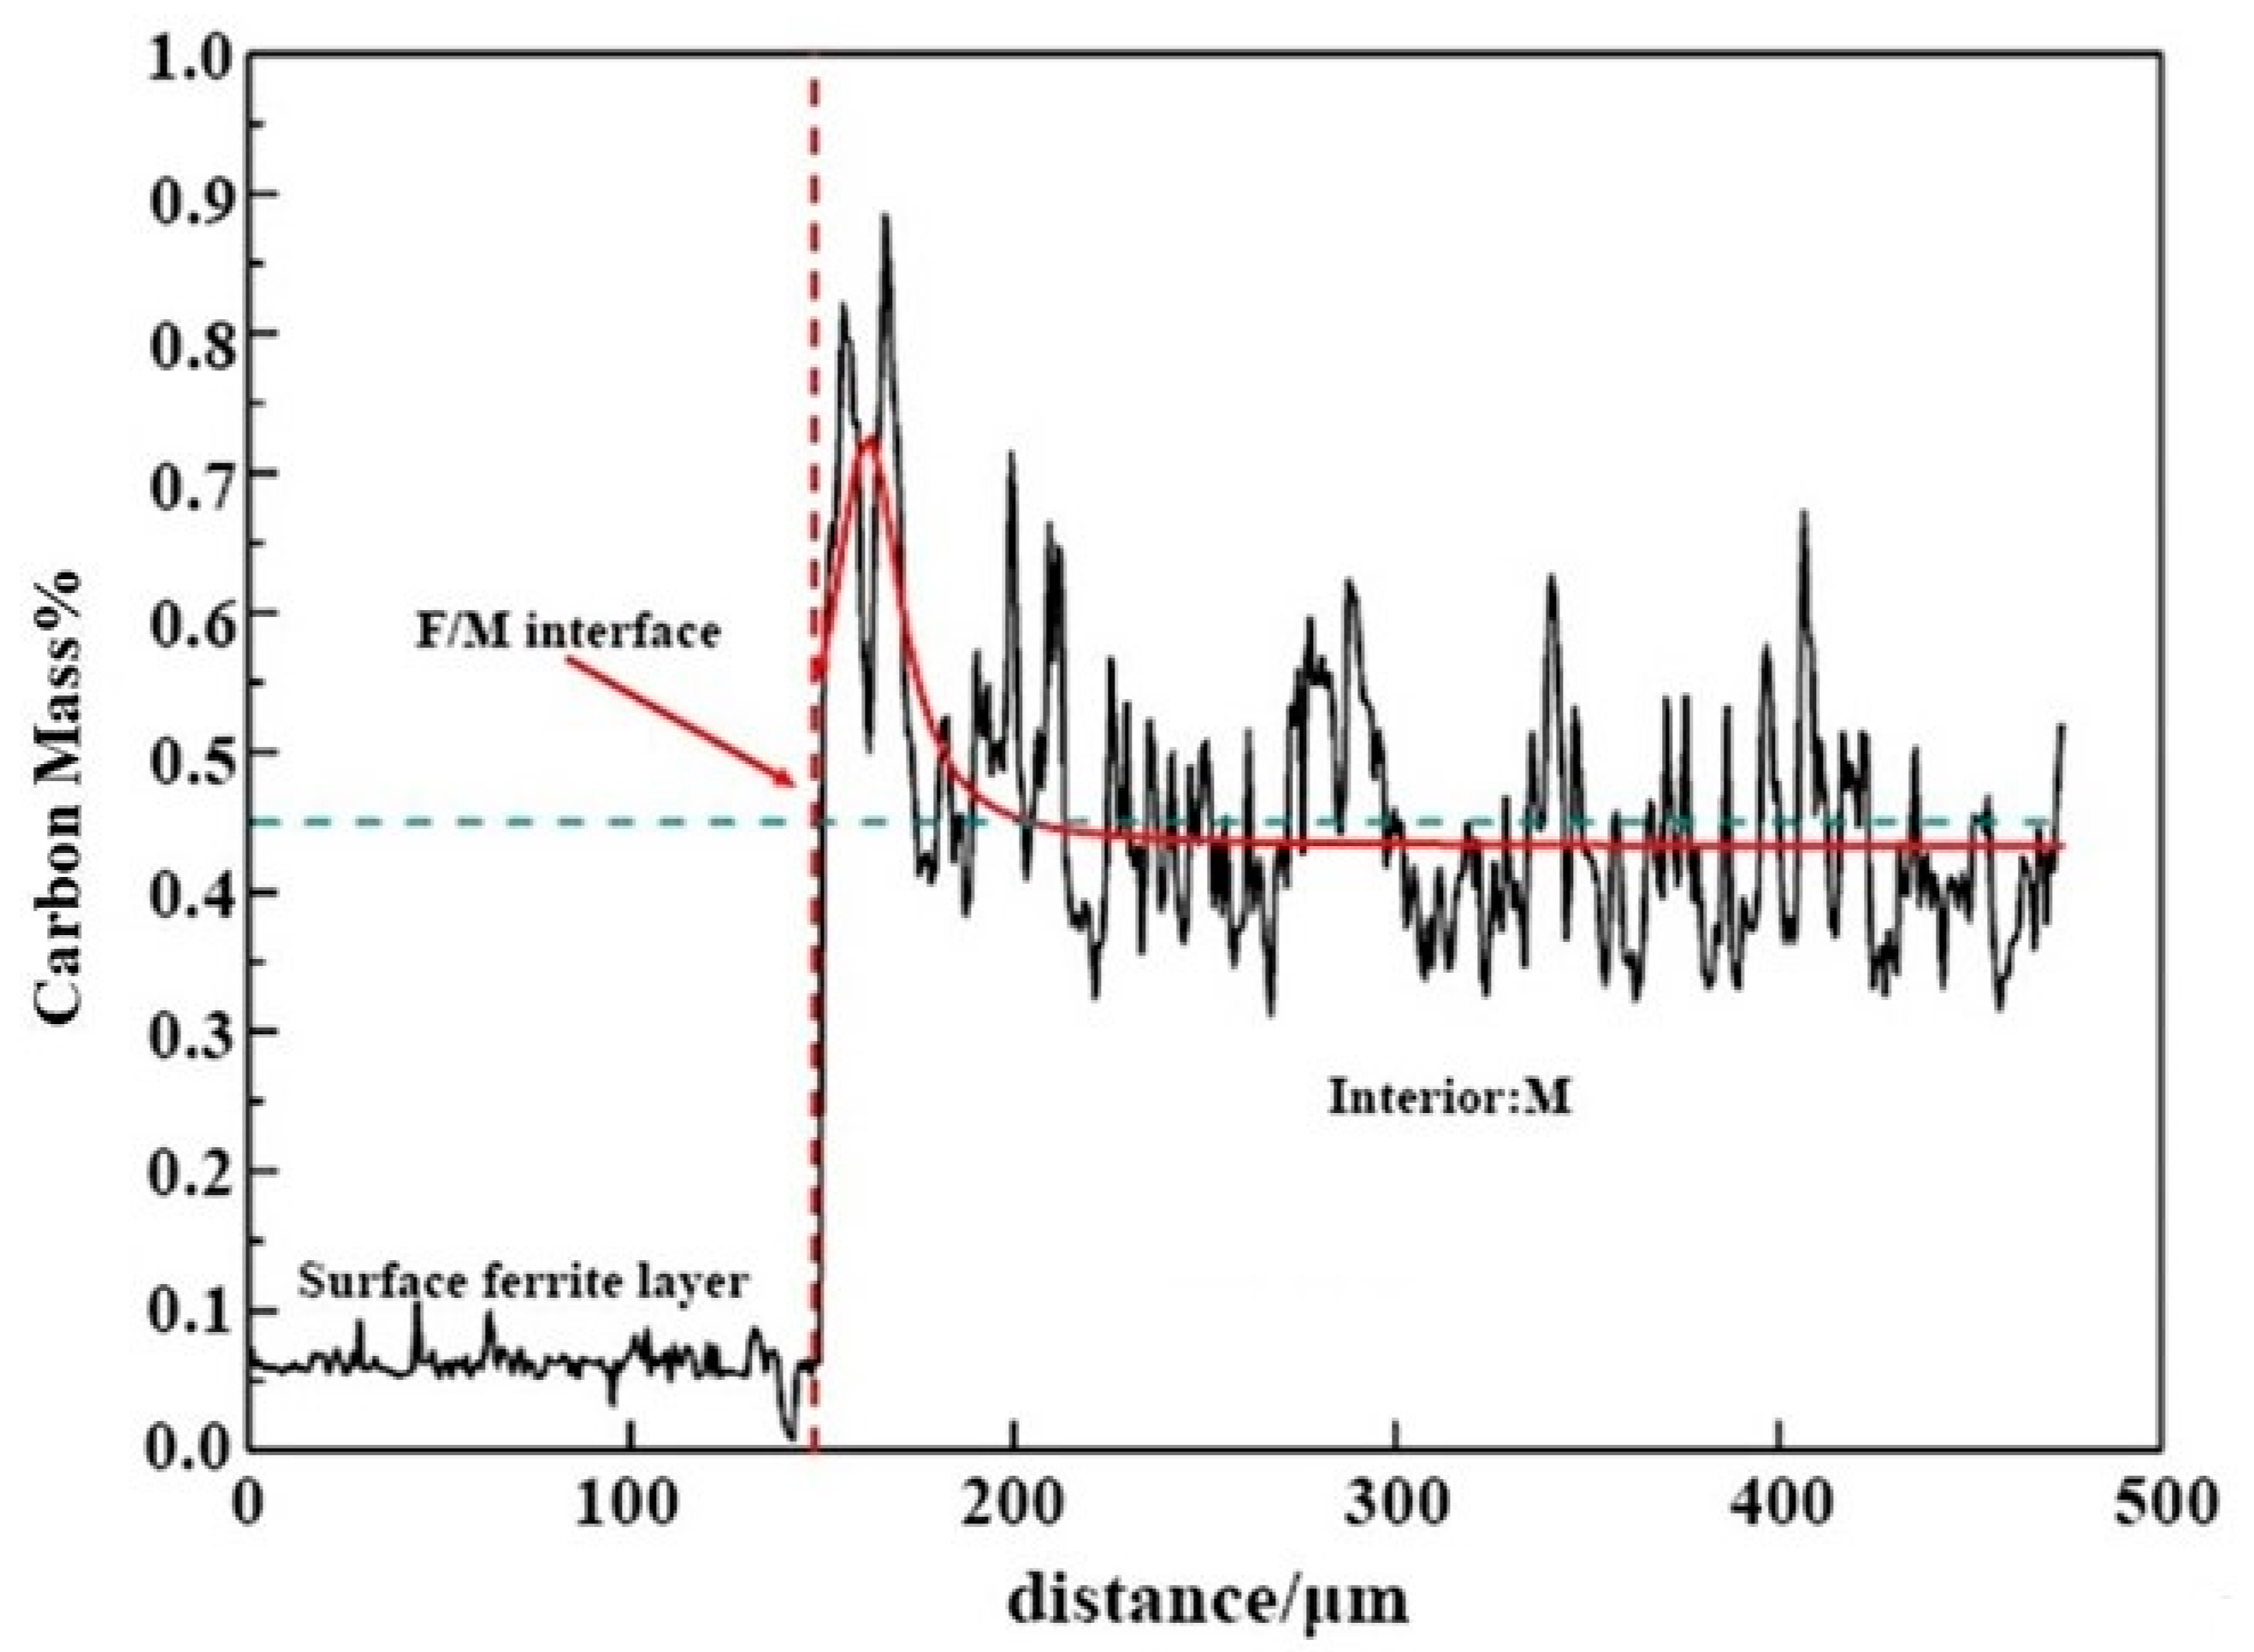
The carbon content distribution and related morphology of 0.45% carbon steel after quenching at 770 °C are determined using EPMA. As demonstrated in Figure 5, the carbon content of the surface is only 0.065%, suggesting the existence of a ferrite layer on the surface. Within a specific area, around 150 µm away from the surface, the distribution of carbon contents displays a “peak-shaped” fluctuating distribution; the peak of the carbon contents is located near the phase boundary between ferrite and austenite, which is up to about 0.8%. However, the carbon concentration is approximately 0.4% at a place far away from the interface. The carbon content distribution in the sample treated by decarburization heat treatment shows no peak, which is entirely different from this study. The reasons are provided as follows. During the carefully selected cooling rate heat treatment, the proeutectoid ferrite nucleates and develops on the surface. The ferrite layer on the sample surface pushes the carbon atoms to the phase interface during the ferrite development process. Then the carbon atoms constantly diffuse into the austenite. Thereby a gradient distribution of carbon contents at the front of the phase interface is generated, and a fluctuation distribution of carbon in the austenite is formed [17]. The peak in carbon contents is located on the austenite side at the phase interface. The EPMA data indicate the carbon content distribution in the surface ferrite layer of 0.45% carbon steel. They also display direct evidence of the long-range diffusion of carbon from ferrite to the austenite during the creation process of the surface ferrite phase.
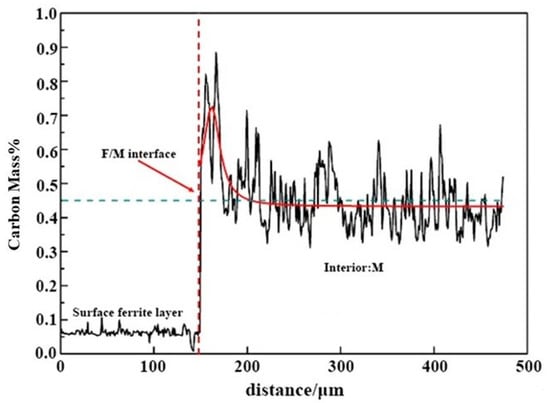
Figure 5.
The cross-sectional of 0.45% carbon steel was quenched at 770 °C using EPMA, in which, red line represents Gauss fitting curve of carbon concentration distribution in the interior martensite, and blue dotted line represents average carbon content of 45 steel.
3.4. Grain Orientation and Size Analysis of the Surface Ferrite Layer
3.4.1. Analysis of Grain Orientation Distribution of the Surface Ferrite Layer
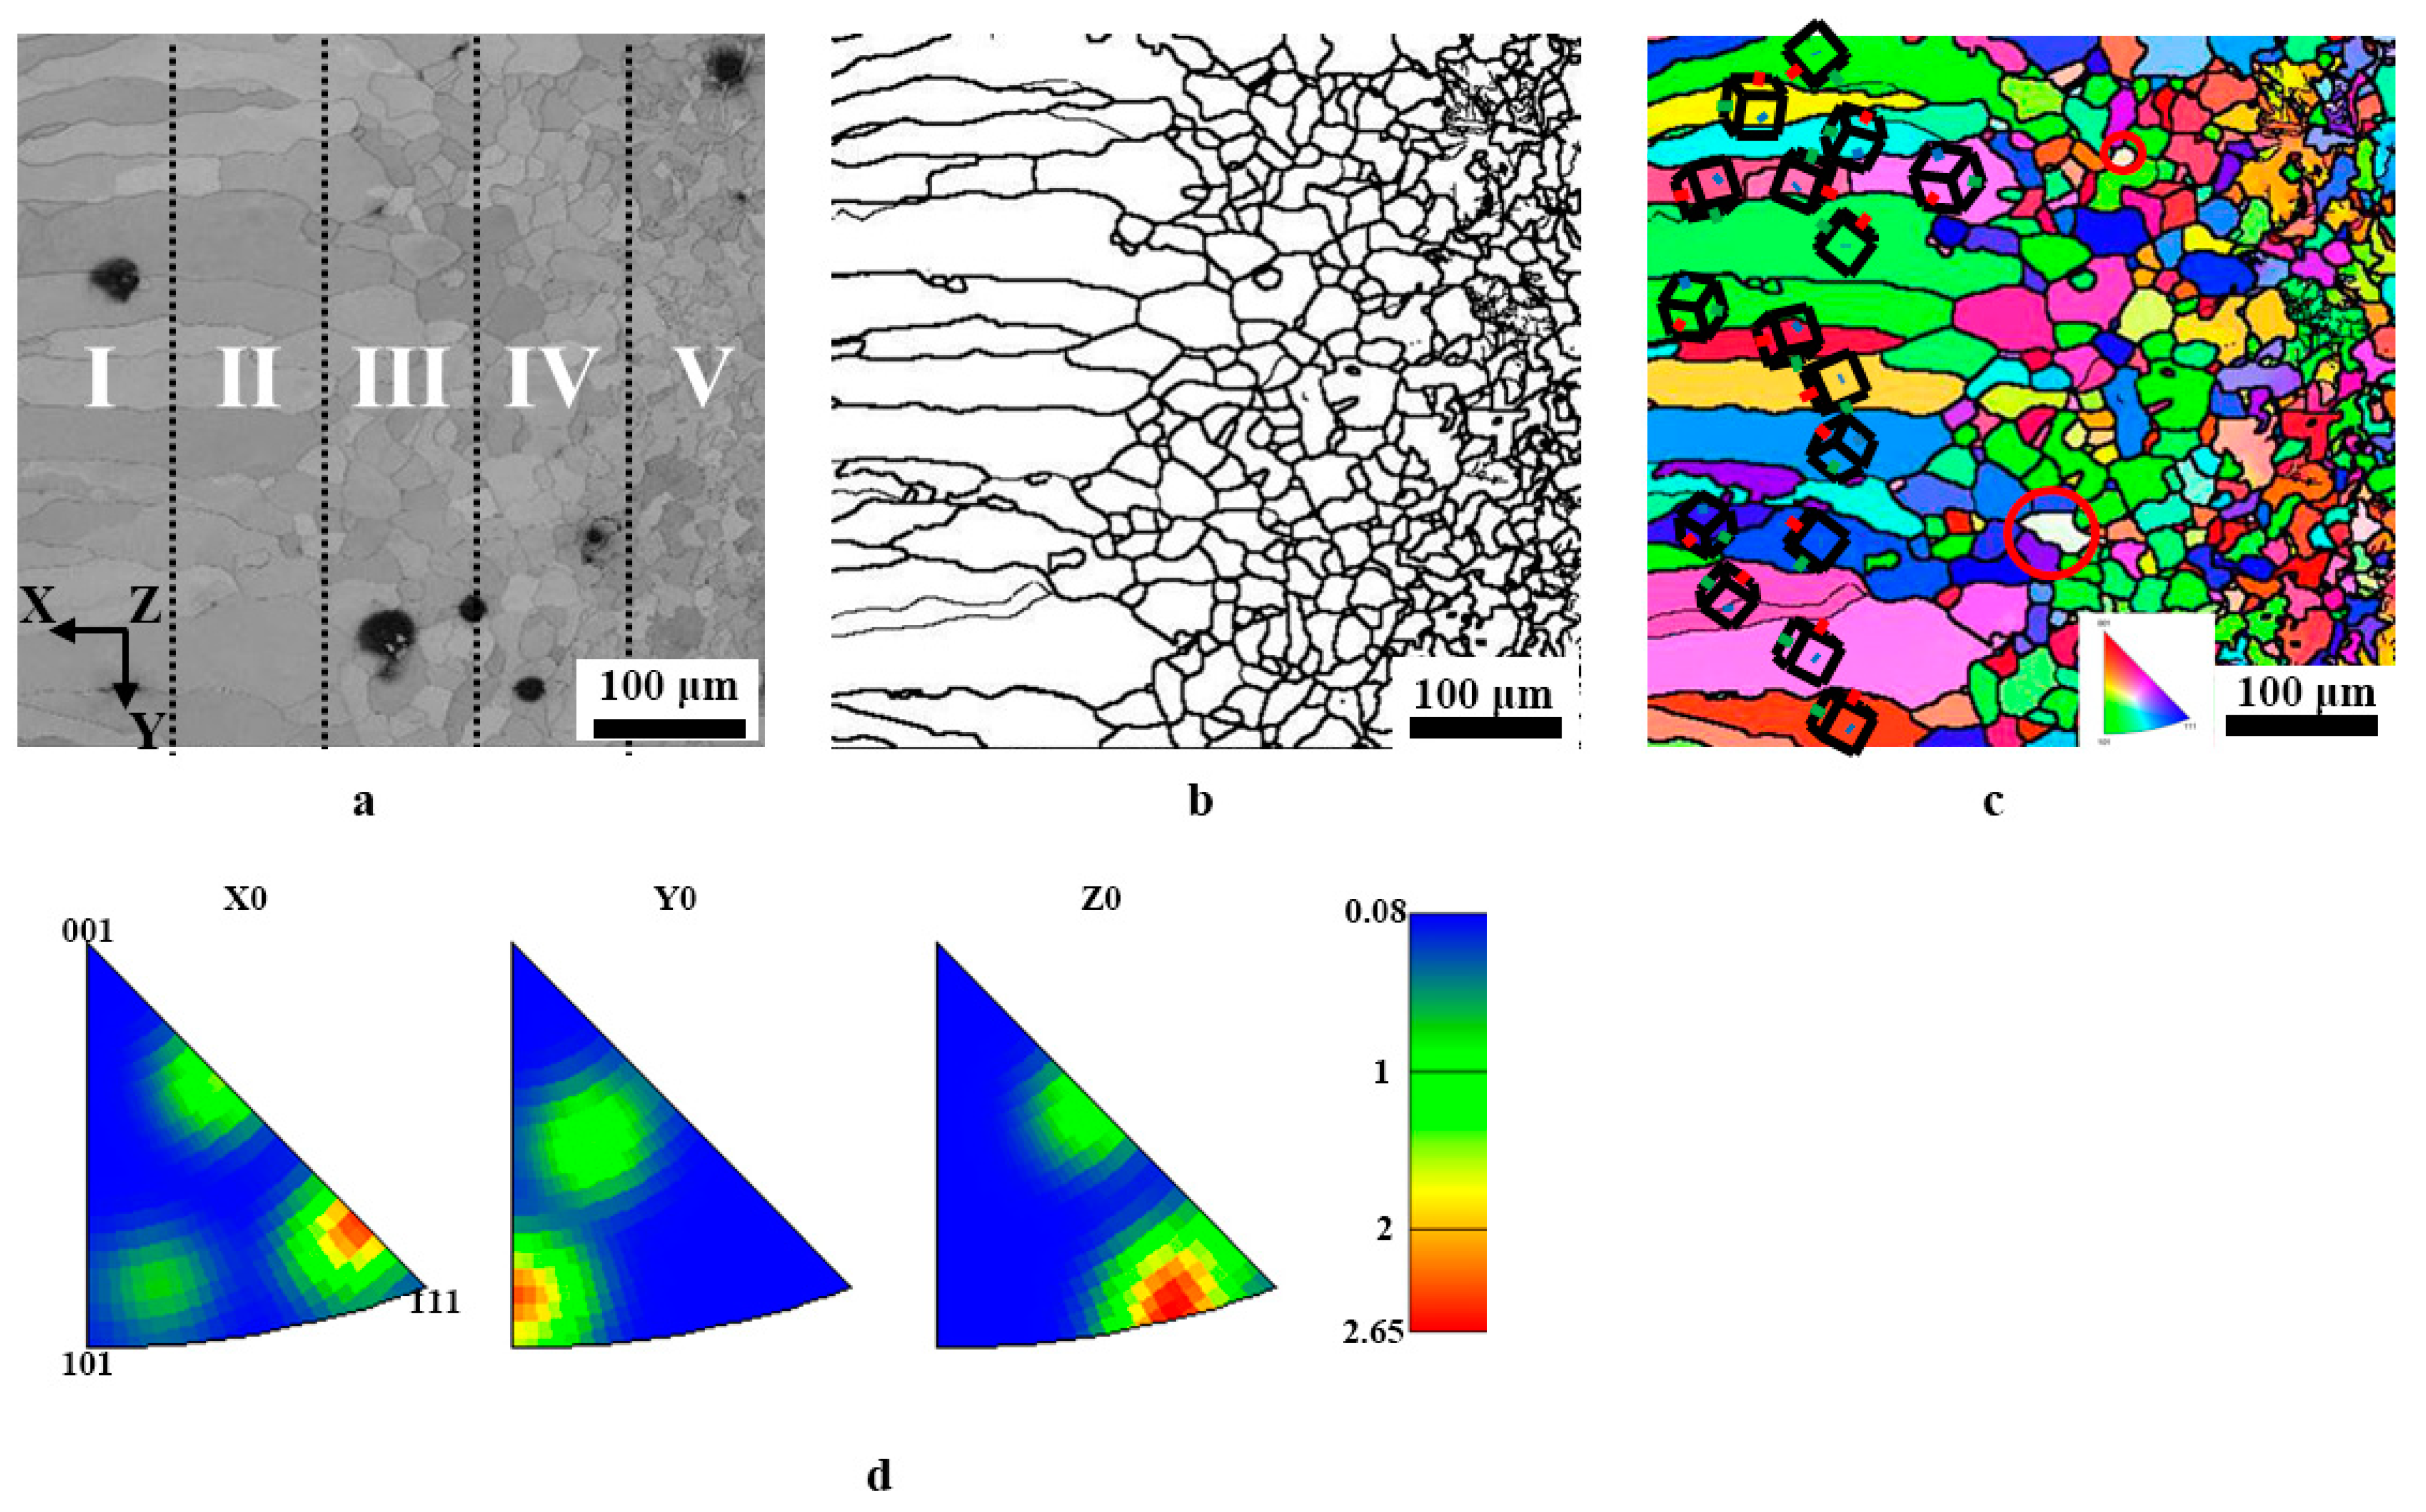
To explore the microstructure, such as grain orientation and grain size of the surface ferrite layer, EBSD was employed here. All data are linked to the x-direction, perpendicular to the sample’s surface. As shown in Figure 6a, the outer of the surface ferrite layer is composed of columnar grains, and then the grains are transformed into inner equiaxial crystals, as the location departs from the surface of the sample. A crystal orientation map was also created to assess the level of texture, dubbed the preferred orientation of grain development. Before analysis, it needs to be pointed out that the ferrite phase with a body-centered cubic structure was chosen, and the findings are given in Figure 6c. Thus, certain blank places may be observed in the crystal maps, pointed out by the red circle. As demonstrated in Figure 6c, along the longitudinal direction of the columnar grains, no clear preferential grain development orientation is identified, indicating that no texture occurs. The findings of the inverted pole figure may indicate this (see Figure 6d). This is fundamentally different from the columnar grains generated by other procedures such as directional solidification, electroplating, and directional annealing.
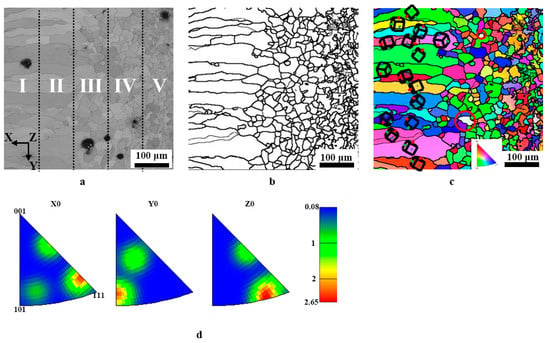
Figure 6.
EBSD orientation diagram and reverse pole diagram of the section of 0.45% carbon steel after carefully controlled cooling rate heat treatment. (a) cross-sectional SEM; (b) grain boundary diagram; (c) ferrite grains (x-direction); (d) reverse pole figure.
Generally, the texture provides the sample with anisotropic qualities. For instance, the existence of (200) fiber texture along the development direction of the columnar grains may lead to poor corrosion resistance, and low wear resistance since the atoms formed in (200) generally had chemical stability and maximum ductility. Thus, textures are frequently regarded as “defects,” which may be corrected by additional treatment such as plastic deformation [18,19,20]. However, the different treatment makes the preparation more difficult and increases expenses. Xu et al. [21] developed three asymmetric extrusion procedures for magnesium alloys: thickness gradient, lateral gradient, and three-dimensional arc extrusion. The texture is softened, resulting in enhanced mechanical qualities. Wu et al. [22] introduced the rare earth element of Gd to magnesium alloys, which successfully degraded the texture of magnesium alloy sheets or bars, therefore greatly enhancing the formability and plasticity of magnesium alloys.
3.4.2. Analysis of Grain Size and Hardness Distribution of the Surface Ferrite Layer
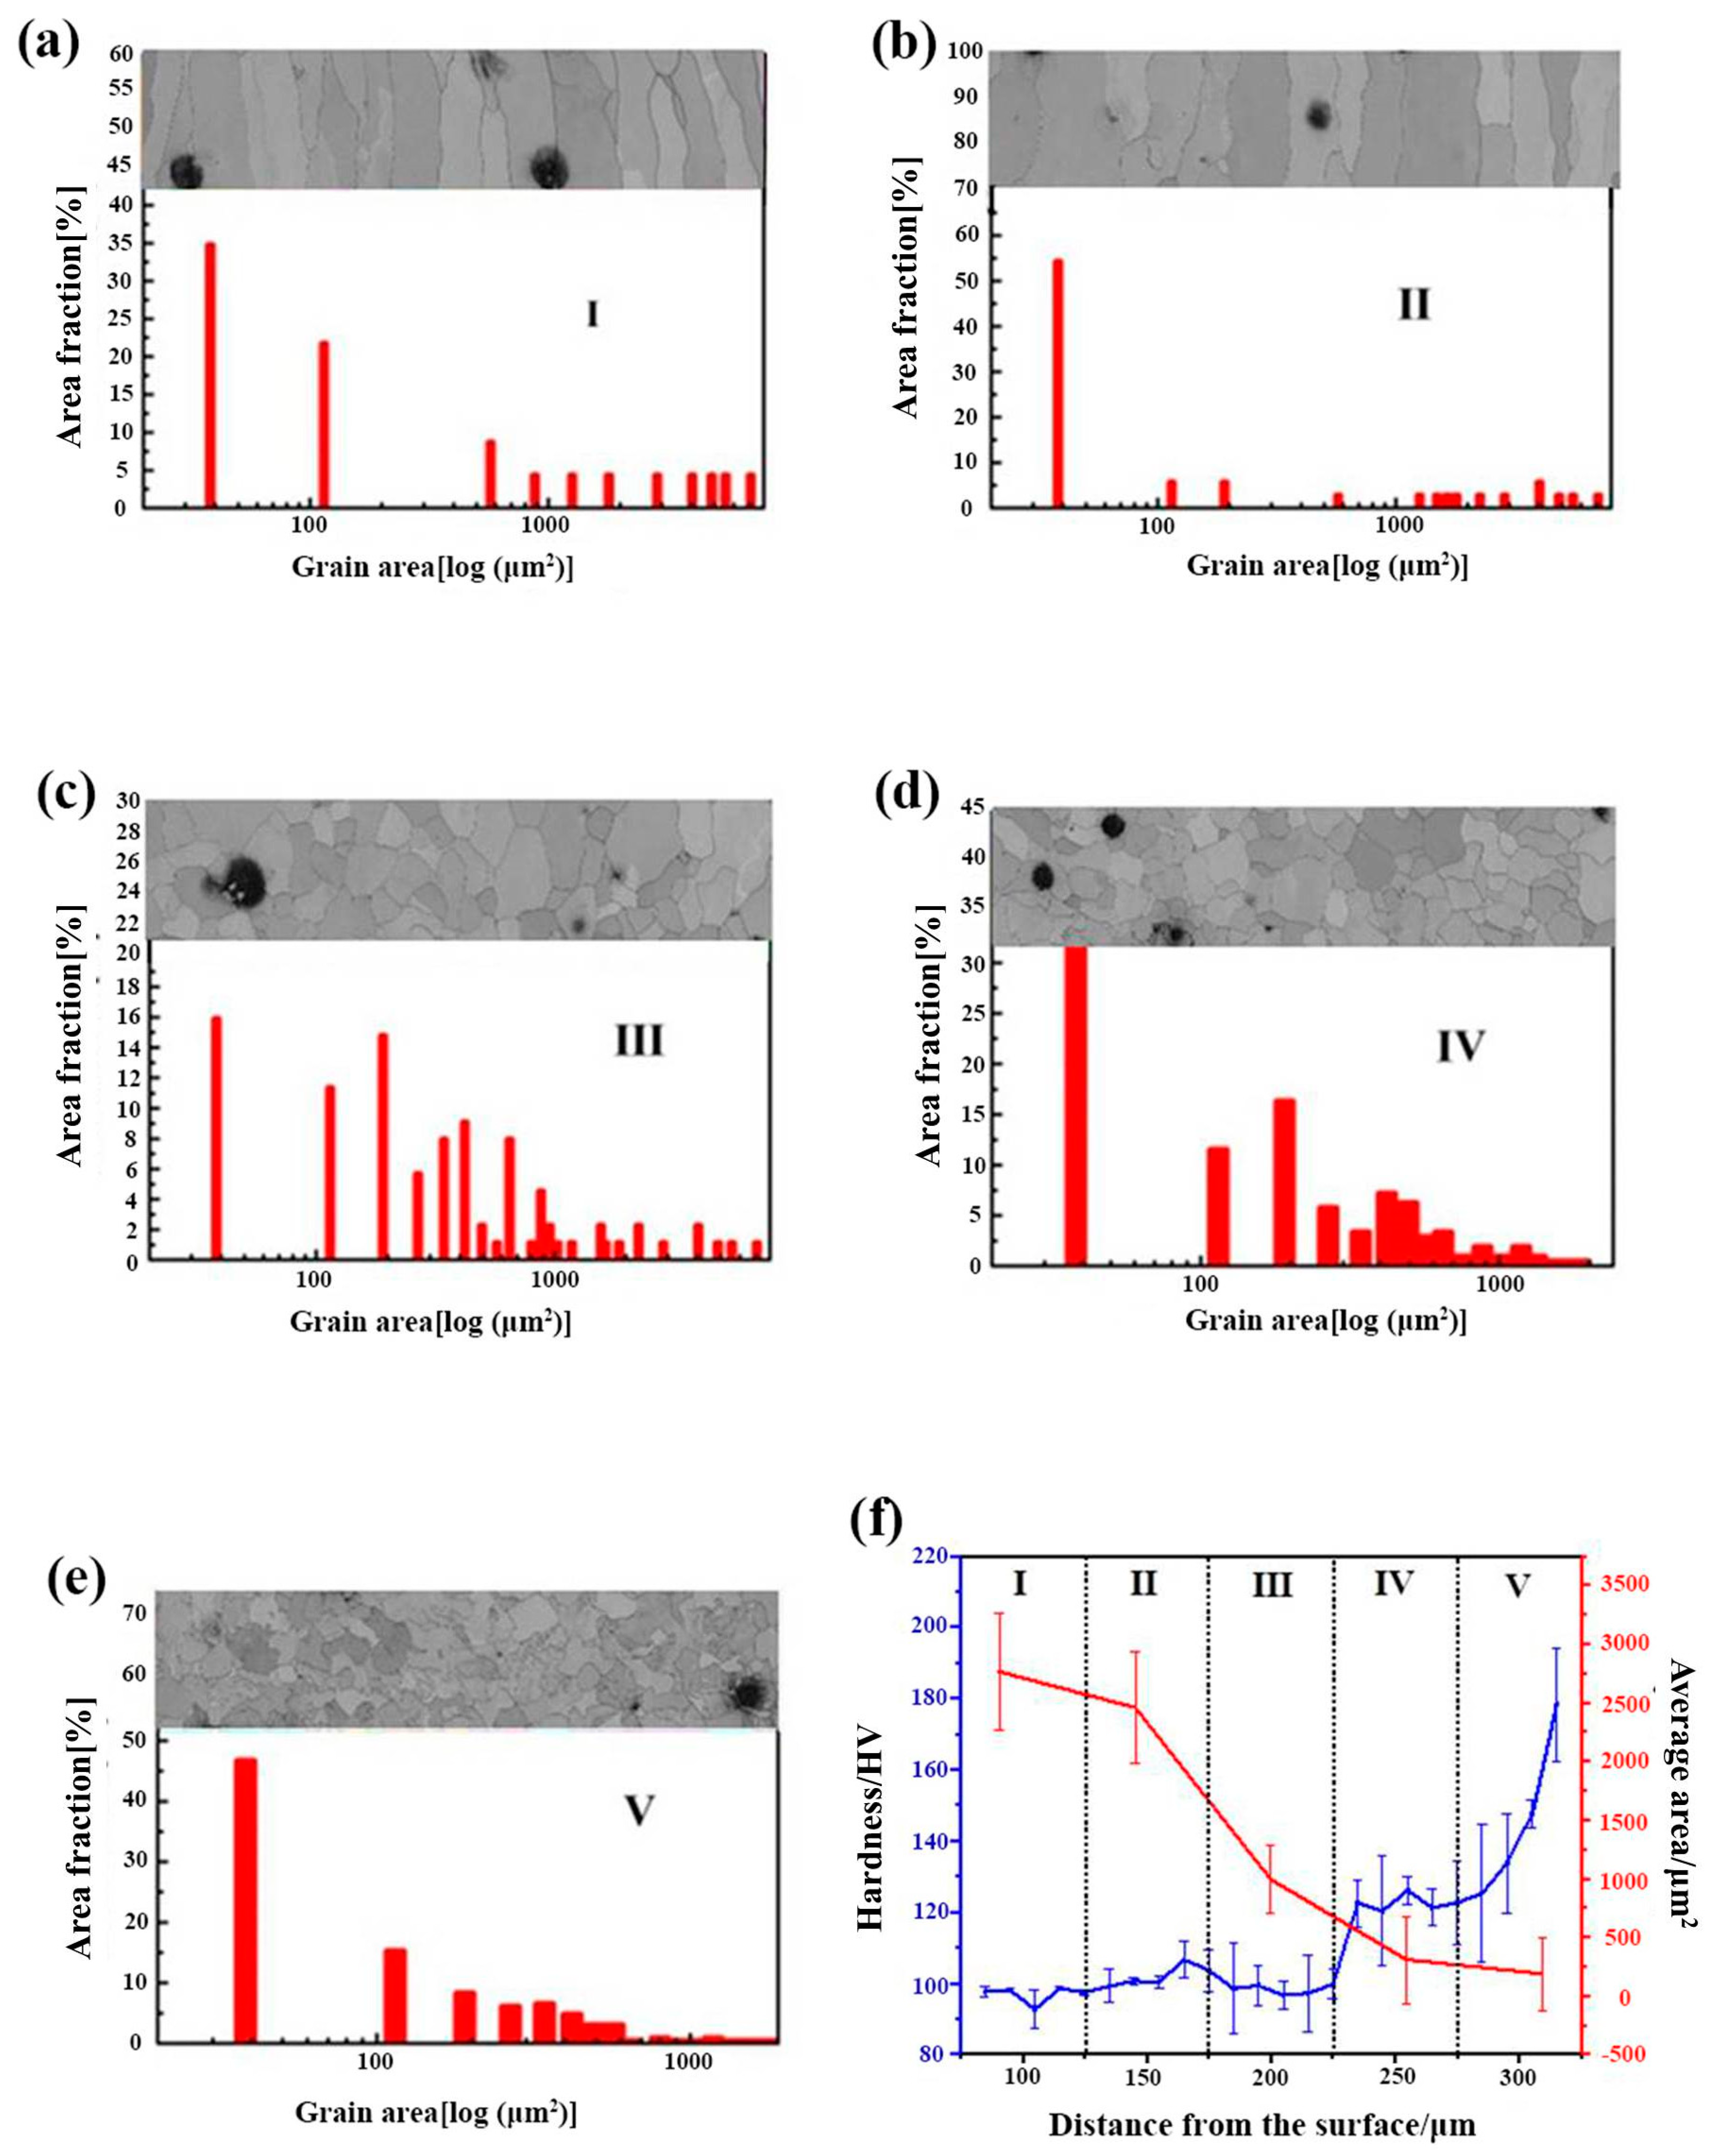
To further describe the microstructure, the surface ferrite layer was evenly split into five sub-regions (Figure 6c) along the growing direction of the columnar grains, which are marked out by I, II, III, IV, and V, in Figure 6a, respectively. It needs to be pointed out that the columnar grains’ length/diameter ratio differs. Thus, the grain size distribution mentioned in this study is determined by the grain area to limit the experimental error. Figure 7a–e illustrates the grain size distribution and the corresponding areas described above as I, II, III, IV, and V. The grain size is reduced from the outside to the inside. From the exterior to the interior of the surface ferrite, the average grain sizes of I–V are 2765.9, 2458.5, 999.6, 307.2, and 186.3 μm2, respectively.
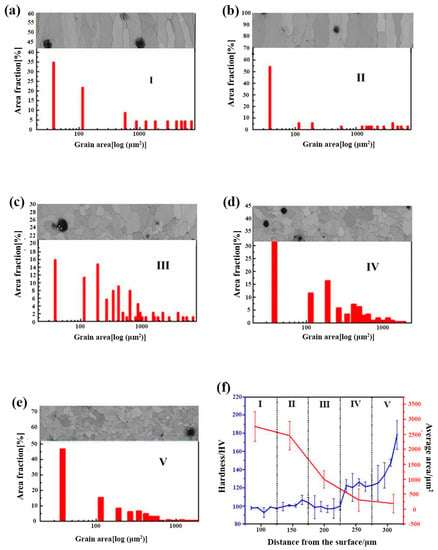
Figure 7.
After the designed cooling rate heat treatment, the cross-sectional grain size and hardness distribution of 0.45% carbon steel. (a) sub-region I; (b) sub-region II; (c) sub-region III; (d) sub-region IV; (e) sub-region V; (f) grain size and hardness distribution from sub-region I to sub-region IV.
The grain size progressively decreases from sub-region I to sub-region IV, displaying a gradient distribution. The development of gradient structure is one of the most utilized strategies to obtain high strength with appropriate toughness. Designing and creating a gradient material with high plasticity in the surface layer and high strength in the interior layer may produce a suitable mix of strength and toughness [23,24,25,26,27,28,29,30]. The hardness in five sub-regions from I to IV of the 0.45% carbon steel samples after the precisely specified cooling rate heat treatment was performed. The resulting hardness distribution is illustrated in Figure 7f. The hardness of the columnar grain in the surface layer is 110 HV, whereas the hardness of the internal equiaxed grain rises to 162 HV, demonstrating a gradient distribution. This should be close to the gradient distribution of the grain size. According to the Hall–Petch connection, hardness is inversely related to grain size. As described above, from the outside to the interior of the surface ferrite, the grain size displays a decreasing tendency. Thus, the hardness here exhibits an increasing tendency, which may embow the sample with high strength and suitable toughness.
3.5. Experimental Identification of the Formation Mechanism of the Surface Ferrite Layer
According to the literature, decarburization heat treatment may yield gradient materials with different surfaces than cores. Schlick et al. [31,32] achieved a microstructure with pure ferrite on the surface and pearlite or martensite by decarburization heat treatment of 1070 steel (C, 0.7 wt%). Chen et al. [33] obtained a composition gradient material with interior martensite, surface bainite, or ferrite by 0.4% medium carbon steel decarburization. Zorc et al. [34] carried out a chemical heat treatment to decarburize hypoeutectoid steel C45 at varying temperatures and holding durations. They obtained a cross-sectional microstructure with a gradient distribution of carbon. However, the creation method of the gradient microstructure with the surface ferrite layer in this research is fundamentally distinct from decarburization. When the cooling rate is regulated within a specified range to fulfill the gradient field requirements, the proeutectoid ferrite preferentially nucleates and develops on the sample’s surface, while the interior austenite does not undergo a phase change. At this time, the phase interface will continually stimulate the migration of carbon atoms to the austenite within the sample, and the surface ferrite layer will finally be formed. Therefore, an identification experiment for the creation process of the surface ferrite layer is proposed in this part.
The theoretical and experimental investigations [35,36,37] have proven that Cu coating may effectively resist the penetration of components such as carbon and nitrogen. Brittan et al. [35] examined the anti-carburization performance and corrosion resistance of 316 stainless steel surface deposited copper coating in a supercritical carbon dioxide (s-CO2) environment, and proved that Cu coating could successfully inhibit carburization at various temperatures. Chunet al. [36] conducted carbonization corrosion experiments in a CO-H2 gas mixture after depositing a copper coating on the surface of 2.25Cr-0.5Mo steel in the temperature range of 450–700 °C, which proves that Cu coating can effectively inhibit the diffusion of carbon atoms from the carbon supersaturated atmosphere (CO-H2) to the sample surface. Therefore, Cu coating as a barrier to accomplishing local anti-carburization has been extensively employed in the aviation industry, agricultural equipment industry, automotive industry, and other areas for a long time. The identification experiments for the creation mechanism of the surface ferrite layer developed in this part are offered according to that specified above, including the Cu coating oxidation experiment and planned cooling rate heat treatment experiment.
3.5.1. Experimental Results Analysis of Cu Coating Oxidation
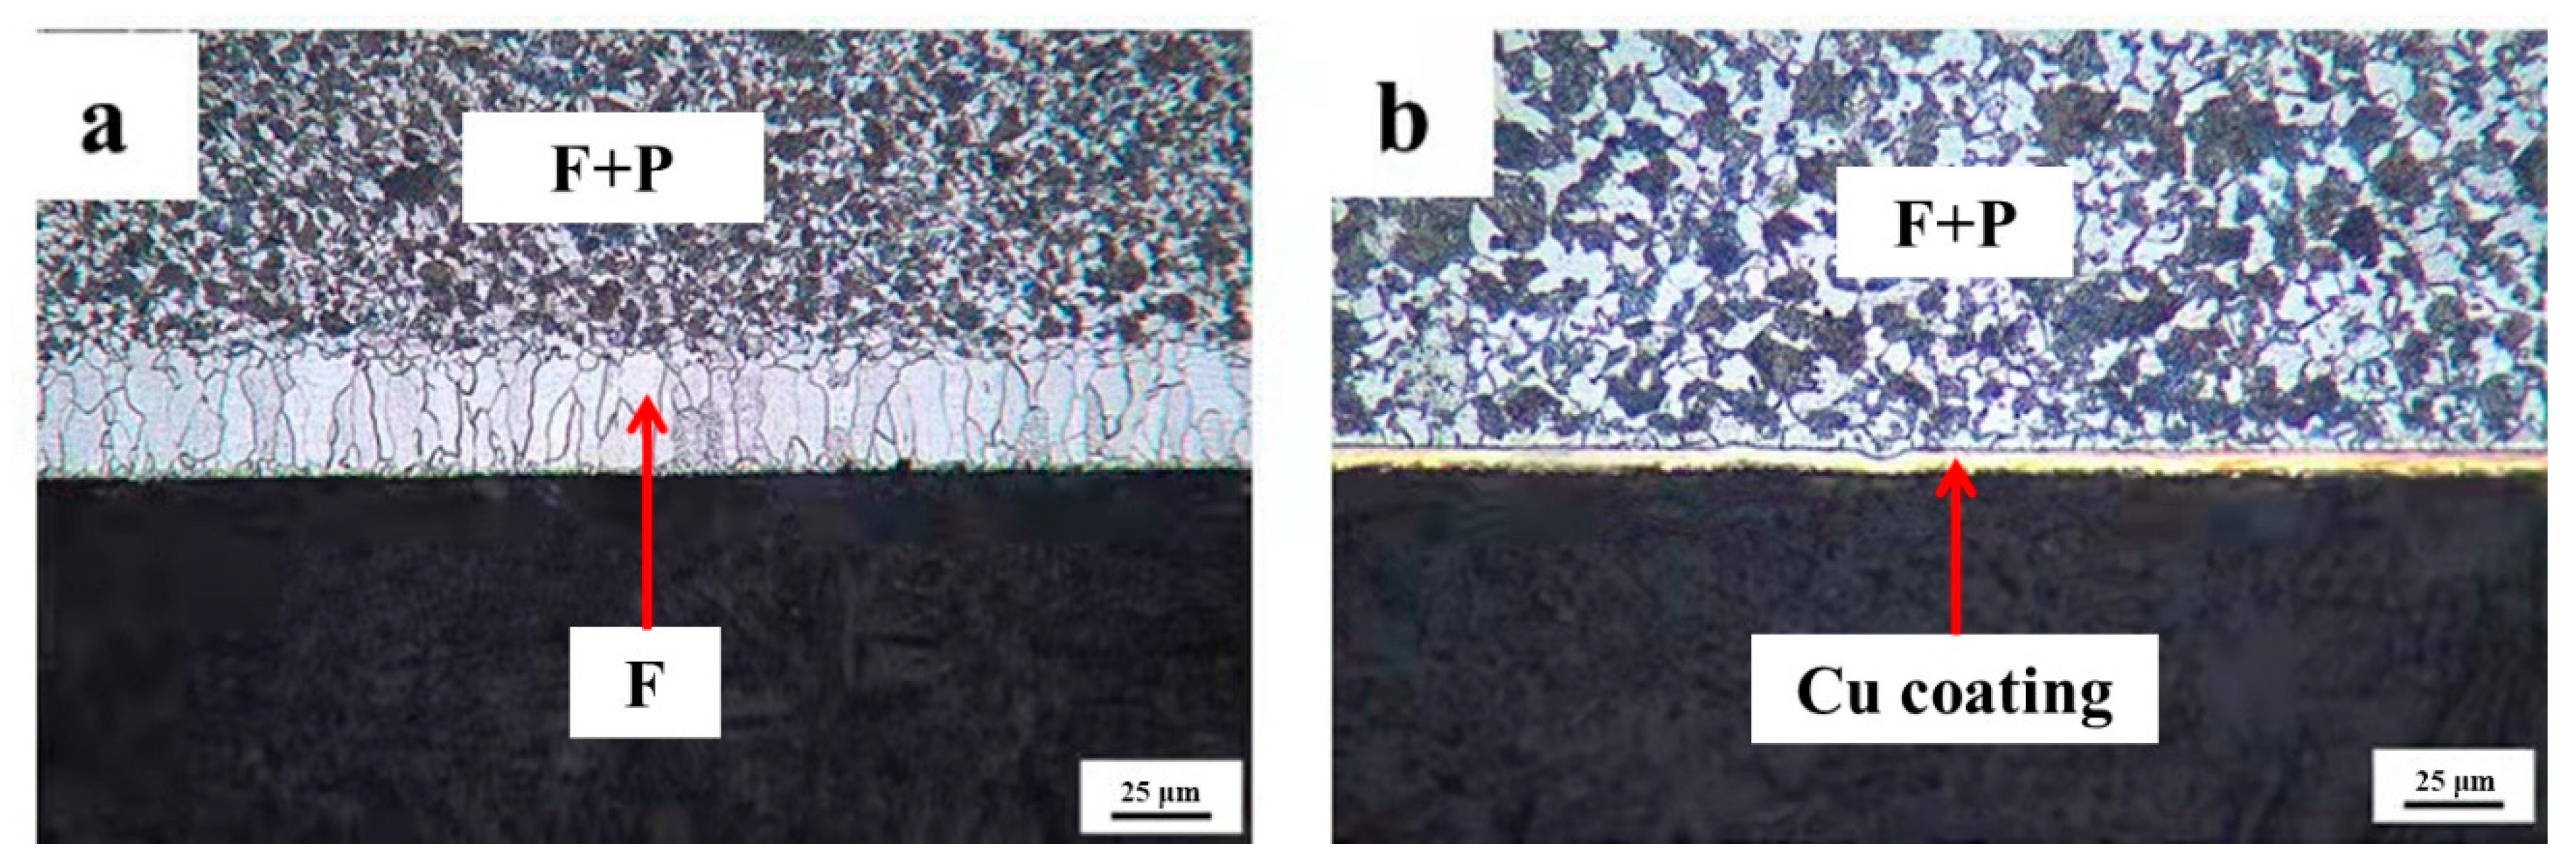
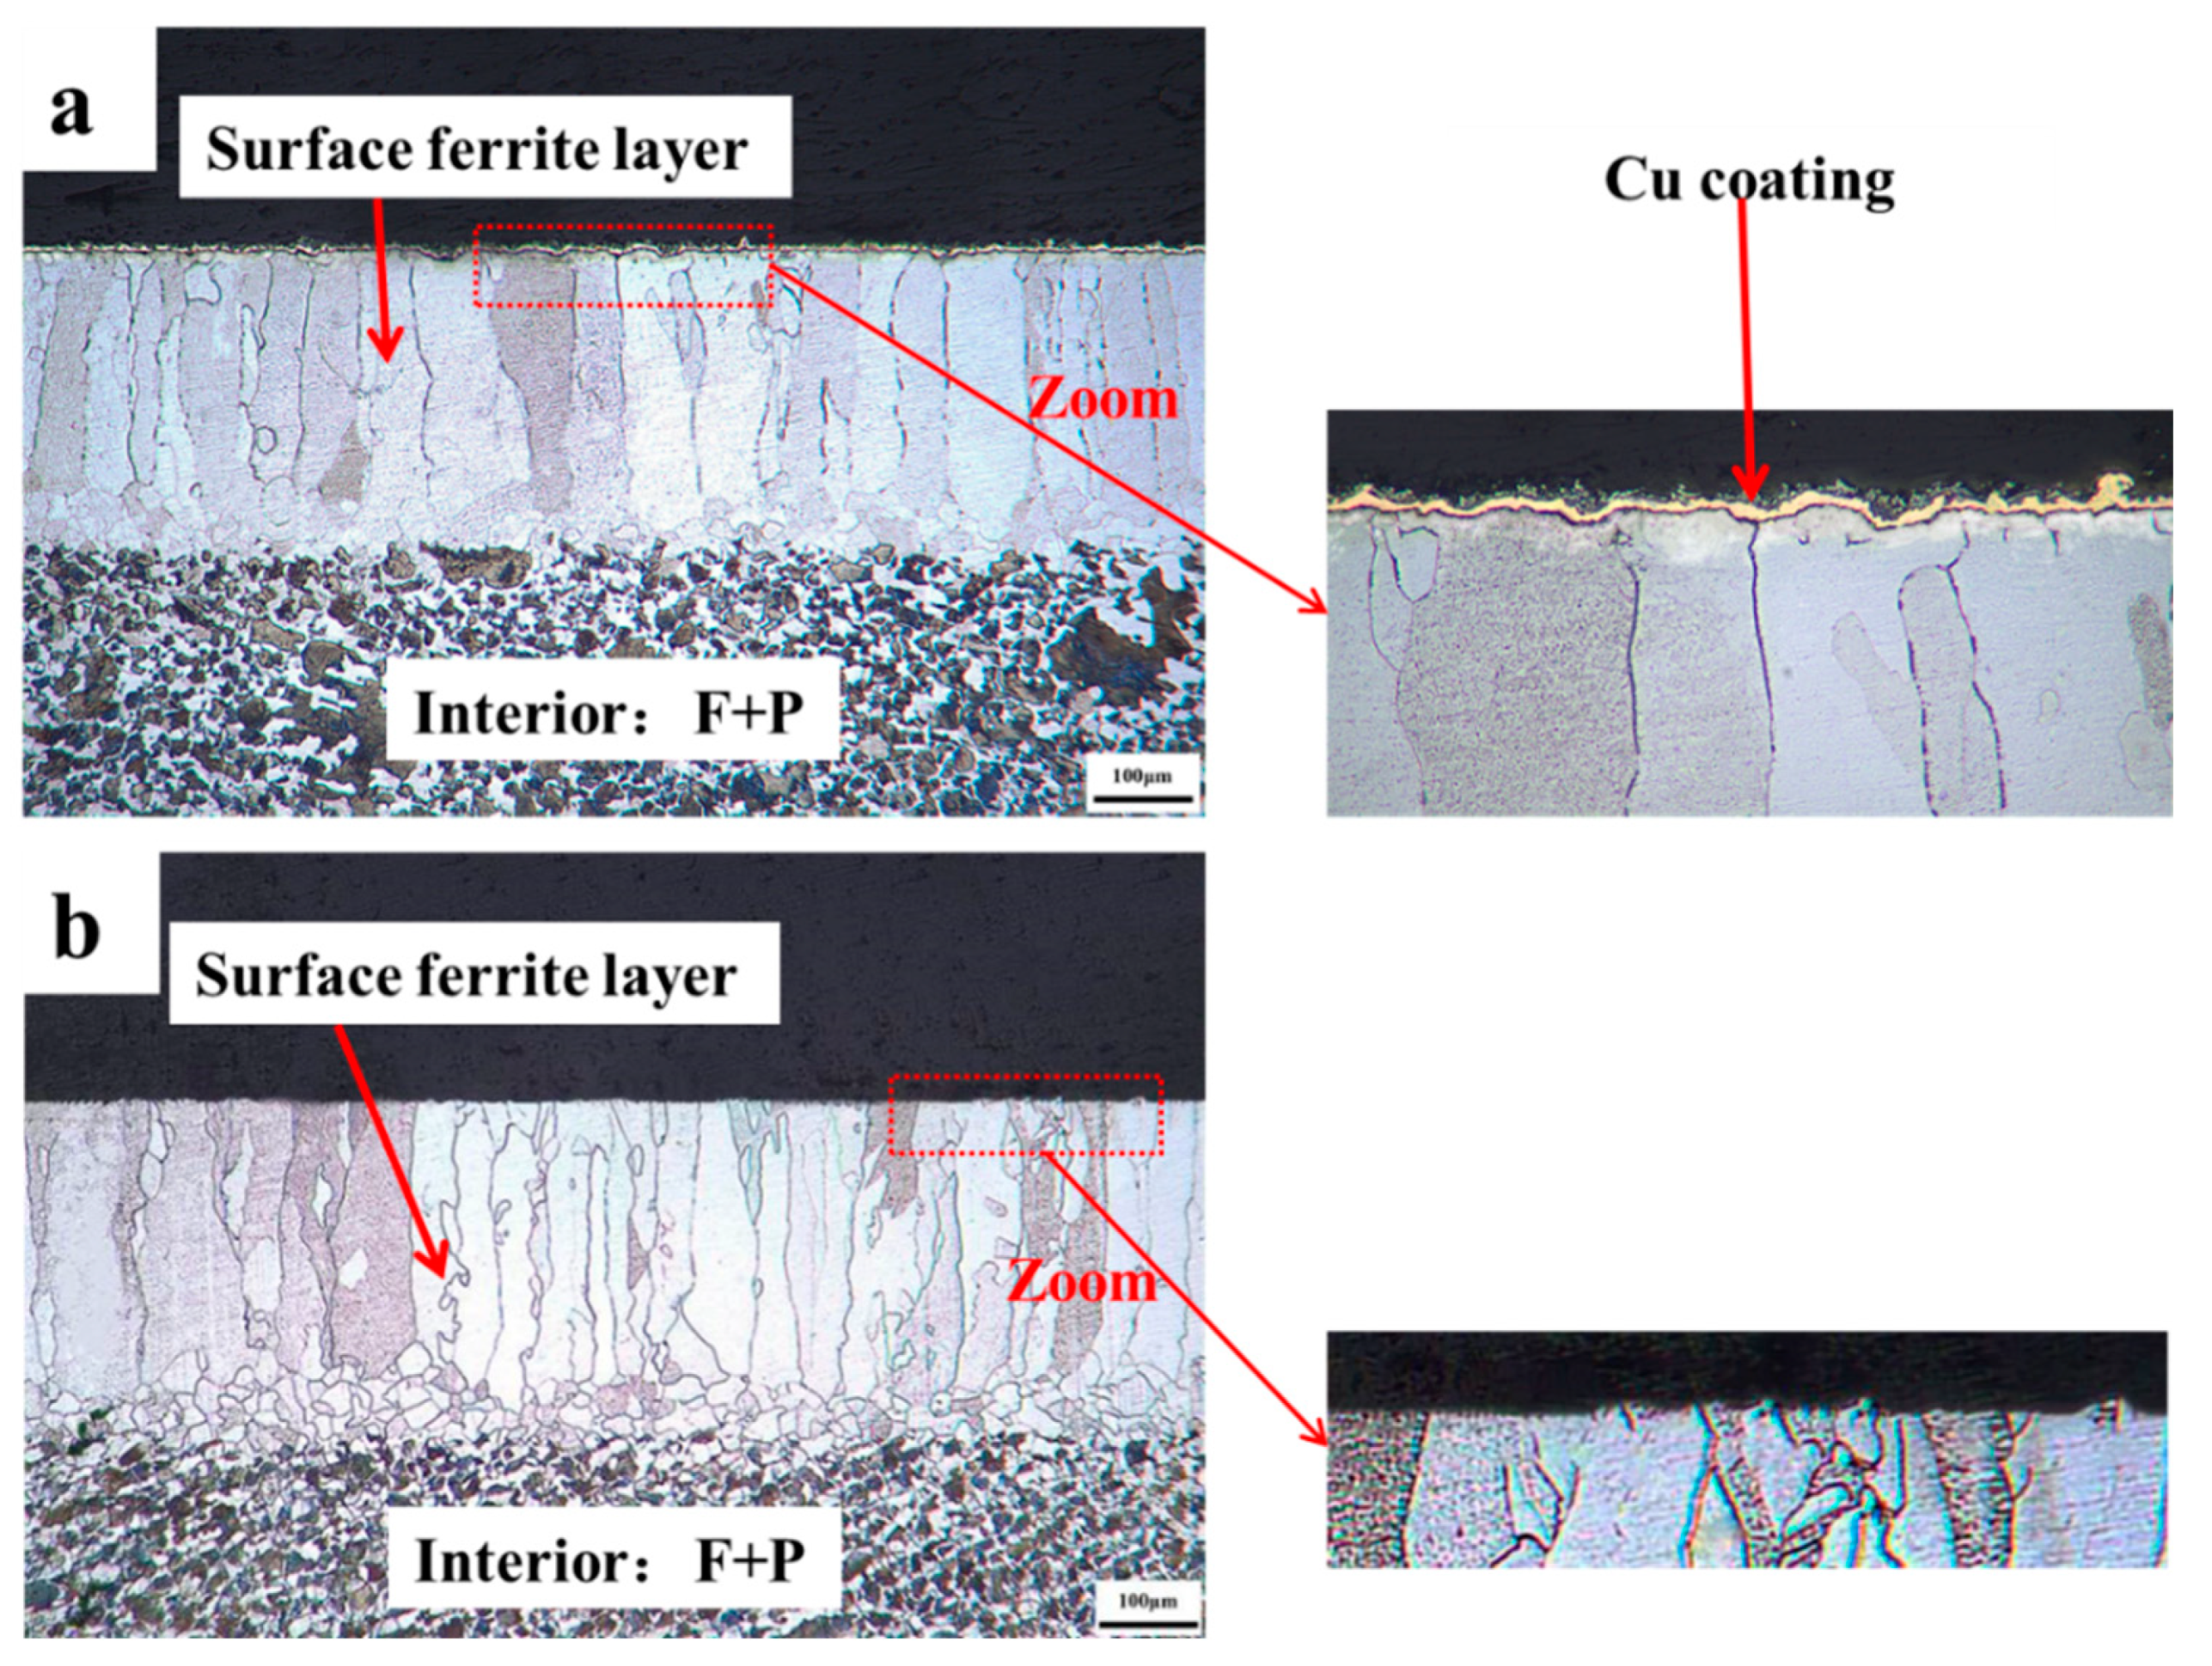
To identify that Cu coating as a barrier may successfully prevent decarburization, the quenched 0.45% carbon steel with destroying the Cu coating and without destroying the Cu coating are concurrently conducted oxidation processes. The cross-sectional micrographs of 0.45% carbon steel when destroying the Cu coating and without destroying the Cu coating after oxidation are presented in Figure 8. It reveals that a visible decarburization layer emerges on the surface of 0.45% carbon steel with a damaged Cu coating. However, there is no decarburization layer on the surface of the sample without degrading the Cu coating, while the Cu coating is thick and uniform, thereby promoting the unique performance of the Cu coating as a barrier impeding the diffusion of carbon atoms to the surface.
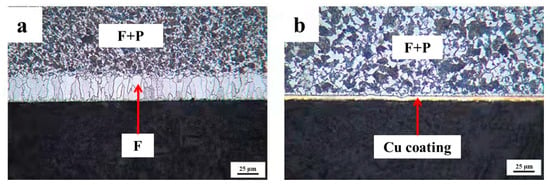
Figure 8.
The cross-sectional micrographs of 0.45% carbon steel with destroying Cu coating and without destroying Cu coating after oxidation. (a) with destroying Cu coating; (b) without destroying Cu coating.
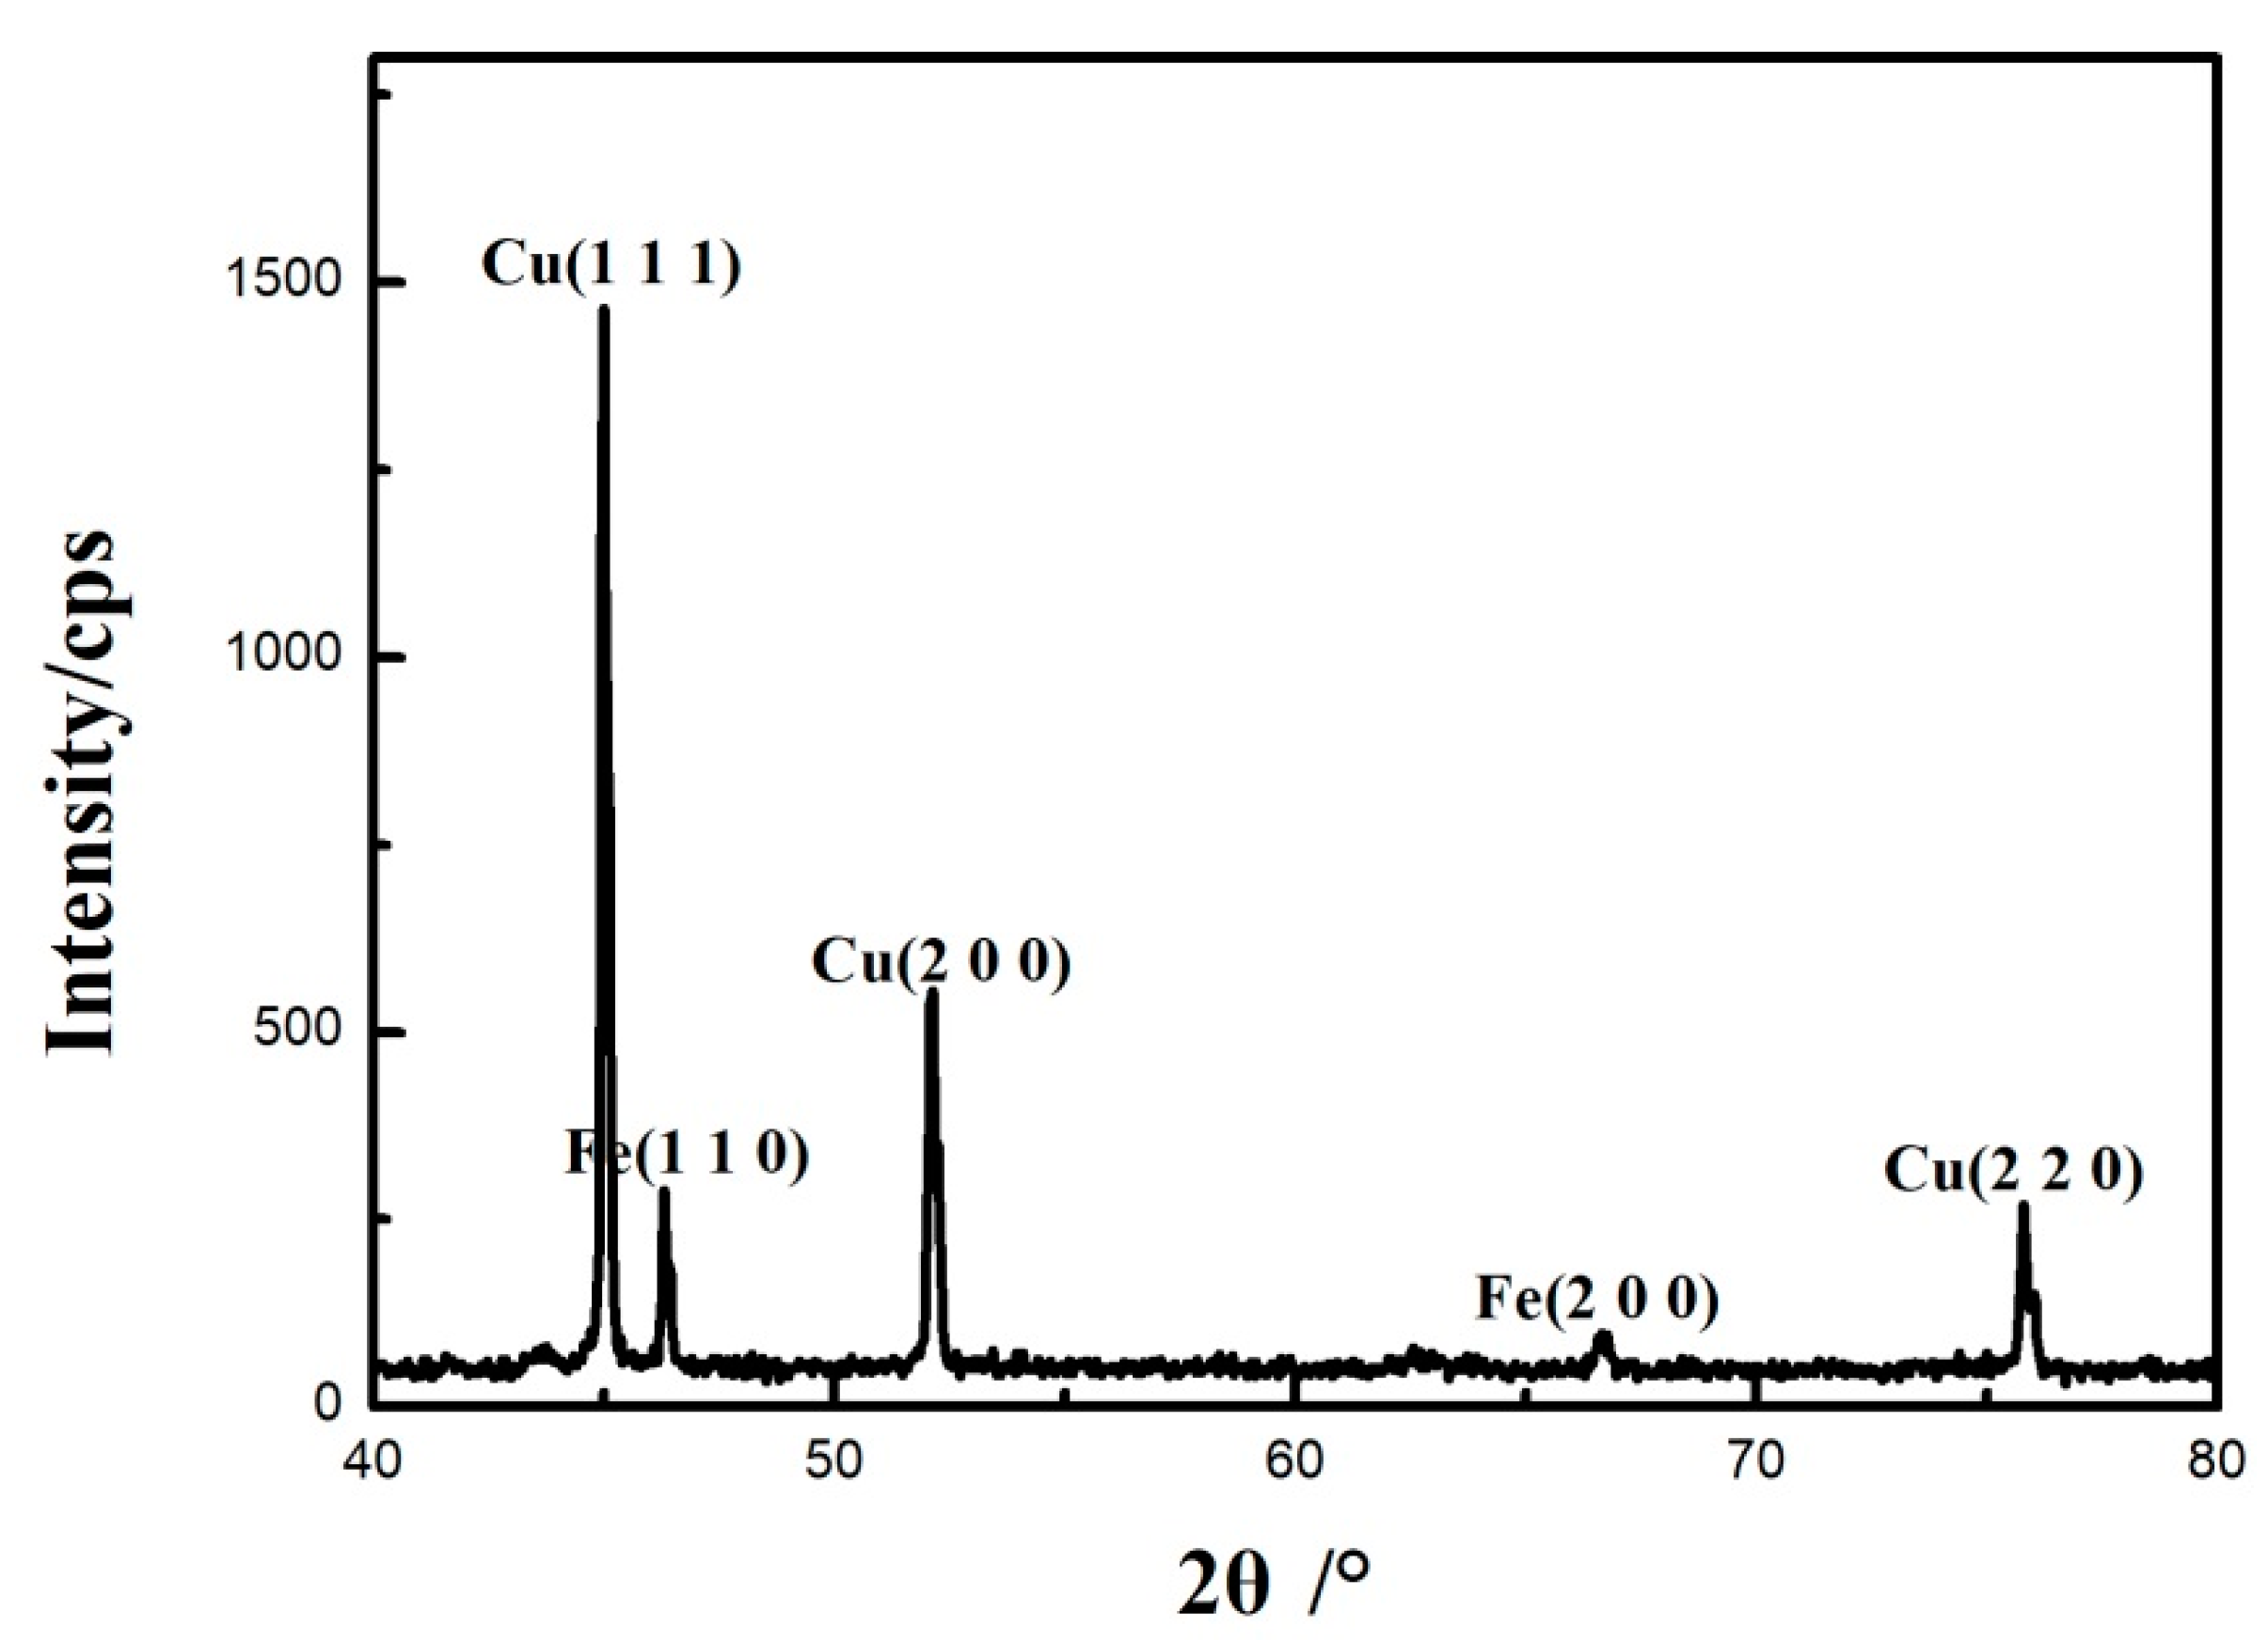
The surface of 0.45% carbon steel without damaging Cu coating after oxidation was examined by X-ray diffraction. The XRD examination in Figure 9 demonstrates that, following oxidation, a copper oxide-free structure on the surface is generated, consisting of only the copper phase, showing the efficiency of the Cu coating as a barrier inhibiting carbon transport and thus hindering the decarburization process.
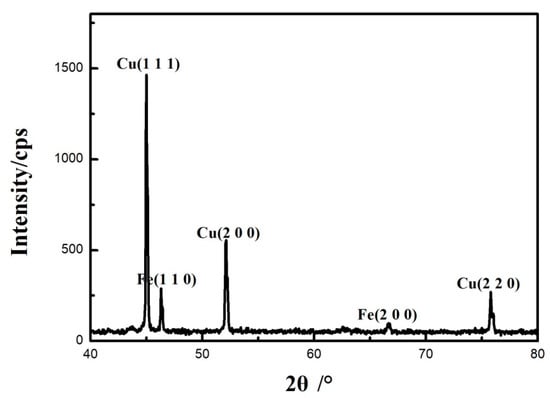
Figure 9.
XRD patterns of the surface of 0.45% carbon steel without destroying Cu coating after oxidation.
3.5.2. Experimental Results Analysis of Cu Coating Designing Cooling Rate Heat Treatment
To validate the creation process of the surface ferrite layer described in this study, the quenched 0.45% carbon steel with destroying the Cu coating and without destroying the Cu coating were conducted with a cooling rate heat treatment at a cooling rate of 0.02 °C/s. The cross-sectional micrographs of 0.45% carbon steel with destroying the Cu coating and without destroying the Cu coating after planned cooling rate heat treatment are presented in Figure 10. It demonstrates that, following planned cooling rate heat treatment at a cooling rate of 0.02 °C/s, a dazzling white ferrite layer with a thickness of approximately 309 μm is created on the surface of 0.45% carbon steel without damaging the Cu coating. From the findings of the above oxidation studies, Cu coating as a barrier may effectively block the passage of carbon to the surface and impede the decarburization process. Therefore, the surface ferrite layer can only be formed by the surface (local) ferrite transformation resulting in the unidirectional diffusion of carbon from the surface to the core. Furthermore, the thickness is equivalent to that created on the surface when damaging the Cu coating (approximately 327 μm), which shows that at a cooling rate of 0.02 °C/s, a graded material of 0.45% carbon steel is effectively prepared by surface (local) ferrite transformation.
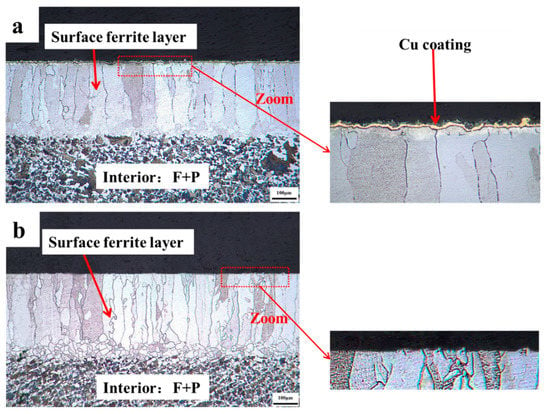
Figure 10.
After the designed cooling rate heat treatment, the cross-sectional micrographs of 0.45% carbon steel with destroying Cu coating and without destroying Cu coating. (a) without destroying Cu coating; (b) with destroying Cu coating.
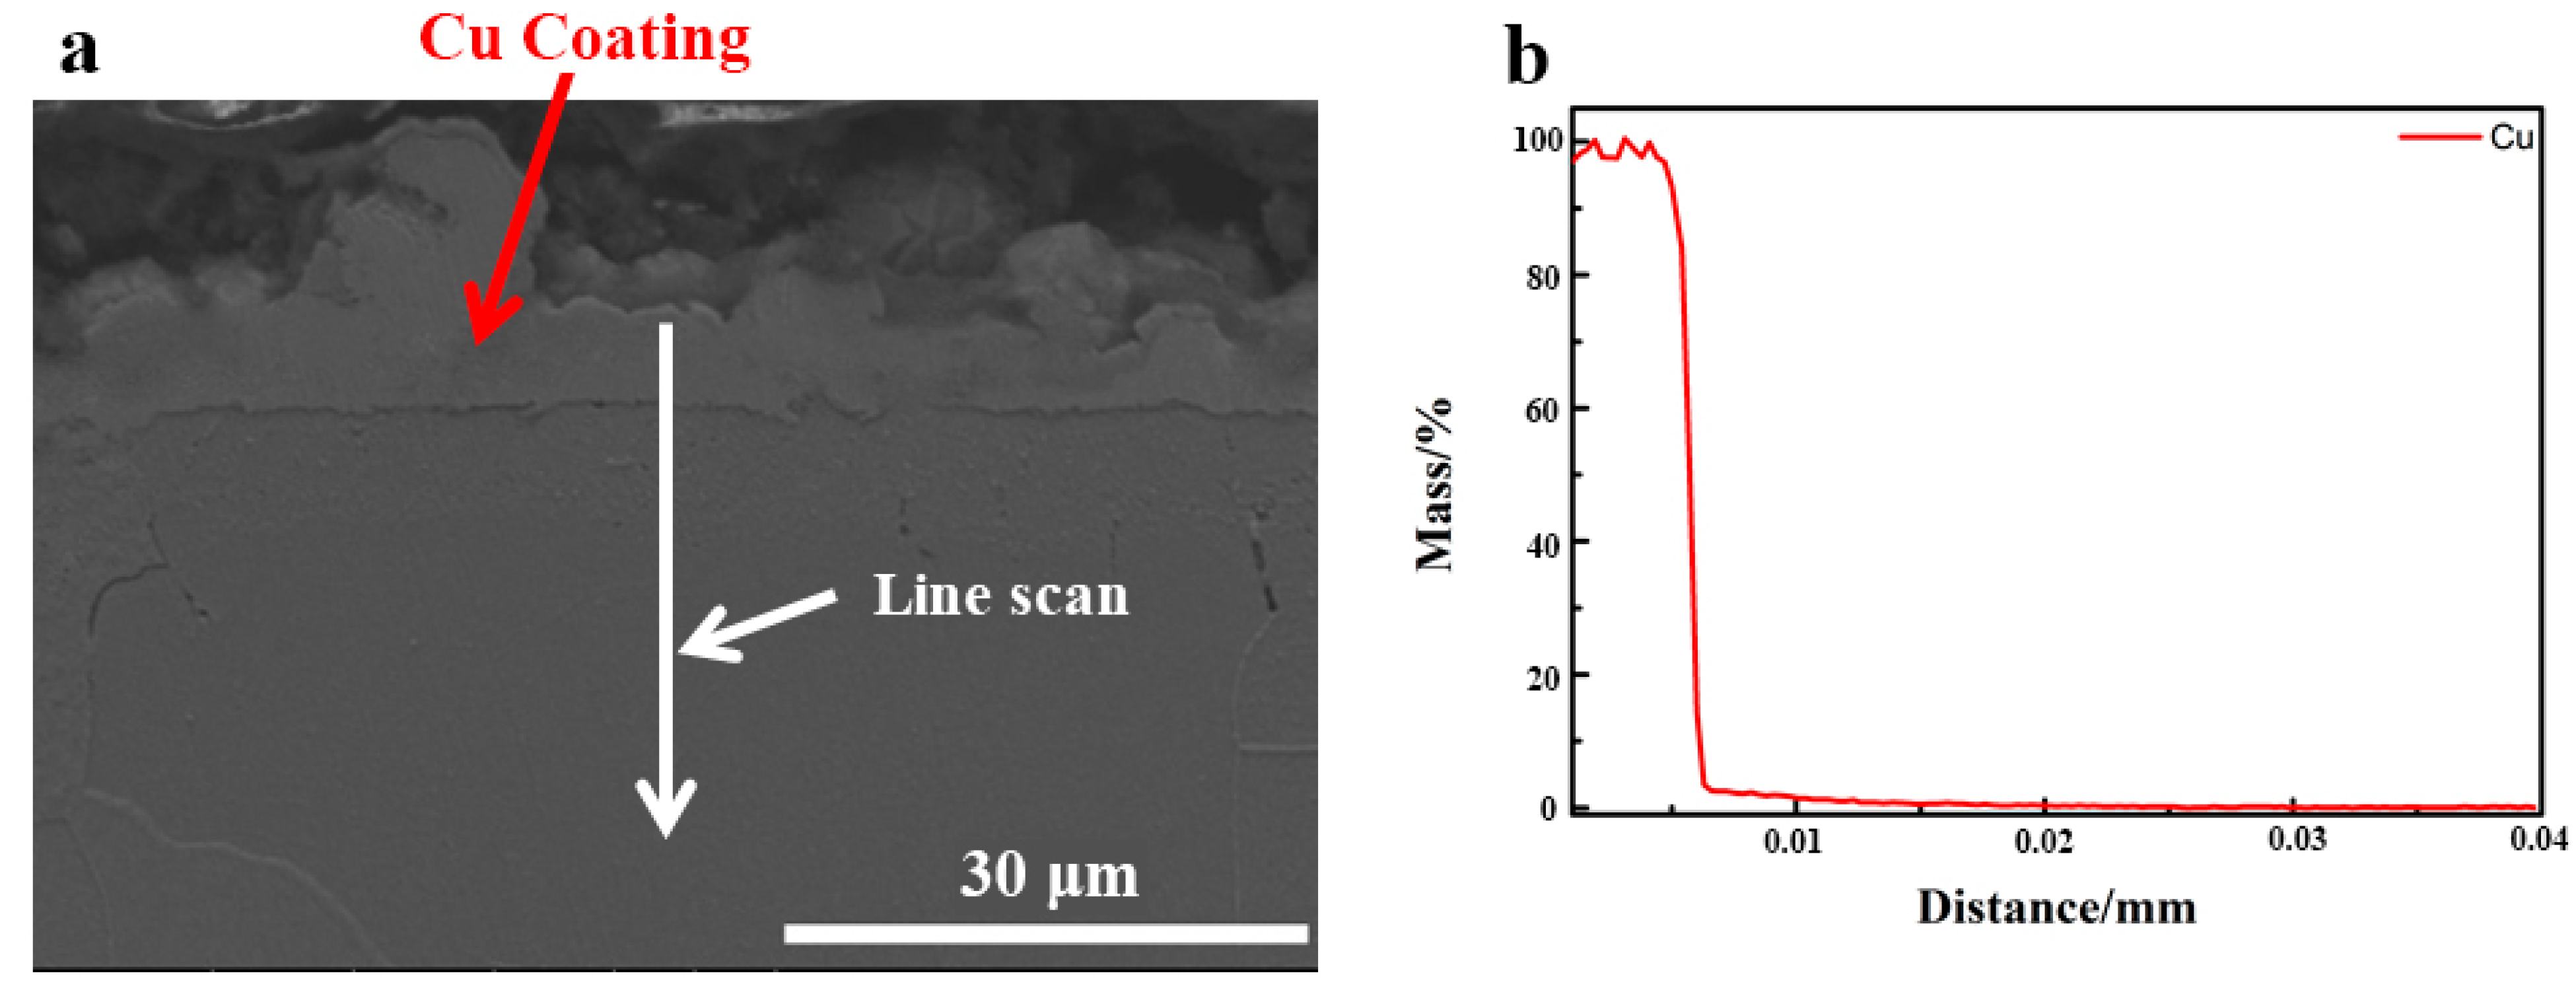
Figure 11 illustrates the line scanning element Cu distribution over the cross-section of 0.45% carbon steel following heat treatment at a controlled cooling rate that did not remove the Cu coating (Figure 11). It can be seen that, after heat treatment with a predetermined cooling rate, the Cu coating is continuously spread throughout the substrate, which is dense and free of oxidation. As a result, the unique performance of Cu coating as a barrier may be successfully achieved during the heat treatment at the specified cooling rate.
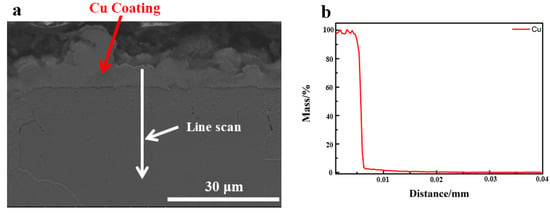
Figure 11.
The content of Cu distribution along the cross-section of 0.45% carbon steel without destroying Cu coating after designed cooling rate heat treatment. (a) SEM morphology; (b) Cu concentration distribution.
These experimental results of Cu coating oxidation and precisely designed cooling rate heat treatment are set as criteria for distinguishing between the surface ferrite layer described in this study, and the decarburized layer induced by the decarburization reaction on the elements of its formation process are mentioned. Consequently, it is concluded that the surface ferrite layer is prompted by the surface (local) ferrite transformation, which results in the unidirectional diffusion of carbon from the surface to the core. In contrast, the decarburized layer is exacerbated by the decarburization reaction, resulting in the diffusion of carbon to the surface and subsequent chemical reactions. The mechanisms by which these two methods produce surface ferrite layers are diametrically opposed to one another.
4. Conclusions
A 0.45% carbon steel has been accurately dealt with using a planned cooling rate heat treatment to obtain a single-phase ferrite layer on the surface, which causes its mechanical characteristics to alter in a graded manner throughout the cross-section, as shown in this study. In this way, creating gradient/multilayer materials with a more commonly used structure or particular performance may be accomplished more easily. Based on the study of CCT curves and the use of EPMA, a theoretical explanation for the creation of the surface ferrite layer is offered, as well as direct experimental proof. It is also explored by utilizing EBSD to determine the microscopic features of the surface ferrite layer, which will aid in the interpretation of the combination of excellent strength and bending capabilities of gradient/multilayer materials. Furthermore, the particular performance of Cu coating as a barrier is being used to determine the mechanism of creating the surface ferrite layer on the metal surface. The following are the most important conclusions:
- A single-phase ferrite layer containing 0.45% carbon steel is formed due to a carefully specified cooling rate heat treatment, with an average thickness of 156–246 µm. It is comparable to that of the surface ferrite layer of a low carbon steel (0.054%) reported by Zhang et al. [6,7]. As a result, the spectrum of steels that may be used to form a single-phase ferrite layer on the surface has been broadened.
- The EPMA experiment findings demonstrate that the ferrite on the surface forces carbon into the austenite interior, and that on the austenite side, a peak develops near the phase interface, and that the carbon concentration is around 0.4% away from the phase interface. It corresponds to the studies suggested in the literature [17]. The process of surface ferrite production provides direct experimental evidence for carbon migration to the interior.
- The findings of the EBSD experiment demonstrate that the surface layer is composed of BCC ferritic phases, with a grain orientation that is rather random and has no texture. In [22], it is noted that degrading the texture improves the forming performance when forming is performed. With a gradient change in grain size, the hardness increases from 110 to 162 HV, which is used as a criterion for microscopic interpretation of materials that have strong strength and bending capabilities.
- The experimental findings obtained using Cu coating as a barrier show that it is possible to distinguish between the surface ferrite layer mentioned in this study and the decarburized layer created by the decarburization process in terms of the mechanisms by which they are formed.
Author Contributions
Methodology, K.L.; validation, L.W.; formal analysis, W.Y. and Y.Z.; investigation, L.W.; data curation, Y.M.; writing—original draft preparation, W.Y.; writing—review and editing, K.C.; supervision, K.L. and K.C. All authors have read and agreed to the published version of the manuscript.
Funding
This research received no external funding.
Institutional Review Board Statement
Not applicable.
Informed Consent Statement
Not applicable.
Data Availability Statement
The data presented in this study are available on request from the corresponding author.
Acknowledgments
We are very grateful to all the people who gave us valuable advice in the process of writing this paper.
Conflicts of Interest
The authors declare no conflict of interest.
References
- Lu, K. Making strong nanomaterials ductile with gradients. J. Sci. 2014, 345, 1455–1456. [Google Scholar] [CrossRef] [PubMed]
- Wang, H.; Cui, E.; Wang, C.; Yan, L.; Zhang, W.; Yu, G. Titanium oxide coatings deposited on MnZn ferrite by a molten salt reaction. J. Coat. 2022, 12, 298. [Google Scholar] [CrossRef]
- Shirahata, Y.; Oku, T. Characterization and photovoltaic properties of BiFeO3 thin films. J. Coat. 2016, 6, 68. [Google Scholar] [CrossRef]
- Rile, G. Advanced heat treatment equipment technology and product development of metal materials. J. Phys. Conf. Ser. 2019, 1213, 052117. [Google Scholar] [CrossRef]
- Bajwoluk, A. Modeling of Thermal Stresses in Technological Equipment of Heat Treatment Furnaces. In International Conference Mechatronics; Springer: Cham, Switzerland, 2020; pp. 45–56. [Google Scholar] [CrossRef]
- Zhang, S.Q.; Jiao, S.H.; Ding, J.H.; Wan, D.; Liu, Z.Y.; Wang, G.D. Super long-range diffusion of carbon during proeutectoid ferrite transformation. J. Cent. South Univ. 2019, 26, 560–566. [Google Scholar] [CrossRef]
- Zhang, S.Q. Study on Local Ferrite Transformation of Hypoeutectoid Steel. Ph.D. Thesis, Northeastern University, Liaoning, China, 2019. [Google Scholar]
- Militzer, M.; Pandi, R.; Hawbolt, E.B. Ferrite nucleation and growth during continuous cooling. J. Metall. Mater. Trans. A 1996, 27, 1547–1556. [Google Scholar] [CrossRef]
- Zhang, Z.; Farrar, R.A. An Atlas of Continuous Cooling Transformation (CCT) Diagrams Applicable to Low Carbon Low Alloy Weld Metals; CRC Press: London, UK, 2021. [Google Scholar] [CrossRef]
- Dong, H.; Zhang, Y.; Miyamoto, G.; Furuhara, T. A comparative study on intrinsic mobility of incoherent and semicoherent interfaces during the austenite to ferrite transformation. J. Scr. Mater. 2020, 188, 59–63. [Google Scholar] [CrossRef]
- Huang, C.J.; Browne, D.J. Phase-field model prediction of nucleation and coarsening during austenite/ferrite transformation in steels. J. Metall. Mater. Trans. A 2006, 37, 589–598. [Google Scholar] [CrossRef] [Green Version]
- Liu, Z.Q.; Miyamoto, G.; Yang, Z.G.; Furuhara, T. Direct measurement of carbon enrichment during austenite to ferrite transformation in hypoeutectoid Fe–2Mn–C alloys. J. Acta Mater. 2013, 61, 3120–3129. [Google Scholar] [CrossRef]
- Qian, B.; Peng, H.; Wen, Y. A novel sandwich Fe-Mn damping alloy with ferrite shell prepared by vacuum annealing. J. Smart Mater. Struct. 2018, 27, 045005. [Google Scholar] [CrossRef]
- Zou, Q.H. CCT Curves and Dynamic Phase Diagrams of Steel. In Applied Mechanics and Materials; Trans Tech Publications Ltd.: Bächau, Switzerland, 2011; Volume 52, pp. 1406–1410. [Google Scholar] [CrossRef]
- Grajcar, A.; Opiela, M. Influence of plastic deformation on CCT-diagrams of low-carbon and medium-carbon TRIP-steels. J. Achiev. Mater. Manuf. Eng. 2008, 29, 71–78. [Google Scholar]
- Li, Z.C.; Ding, H.; Misra, R.D.K.; Cai, Z.H. Microstructure-mechanical property relationship and austenite stability in medium-Mn TRIP steels: The effect of austenite-reverted transformation and quenching-tempering treatments. J. Mater. Sci. Eng. A 2017, 682, 211–219. [Google Scholar] [CrossRef] [Green Version]
- Wu, H.D.; Miyamoto, G.; Yang, Z.G.; Chen, H.; Furuhara, T. Carbon enrichment during ferrite transformation in Fe-Si-C alloys. J. Acta Mater. 2018, 149, 68–77. [Google Scholar] [CrossRef]
- Wang, L.B.; Zhao, Y.; Jiang, C.; Ji, V.; Chen, M.; Zhan, K.; Moreira, F. Investigation on microstructure and properties of electrodeposited Ni-Ti-CeO2 composite coating. J. Alloys Compd. 2018, 754, 93–104. [Google Scholar] [CrossRef]
- Wang, L.B.; Xing, S.; Liu, H.; Jiang, C.; Ji, V. Improved wear properties of NiTi nanocomposite coating with tailored spatial microstructures by extra adding CeO2 nanoparticles. J. Surf. Coat. Technol. 2020, 399, 126119. [Google Scholar] [CrossRef]
- Wang, L.B.; Xing, S.; Shen, Z.; Liu, H.; Jiang, C.; Ji, V.; Zhao, Y. The synergistic role of Ti microparticles and CeO2 nanoparticles in tailoring microstructures and properties of high-quality Ni matrix nanocomposite coating. J. Mater. Sci. Technol. 2022, 105, 182–193. [Google Scholar] [CrossRef]
- Xu, J.; Song, J.F.; Jiang, B.; He, J.; Wang, Q.; Liu, B.; Huang, G.; Pan, F. Effect of effective strain gradient on texture and mechanical properties of Mg–3Al–1Zn alloy sheets produced by asymmetric extrusion. J. Mater. Sci. Eng. A 2017, 706, 172–180. [Google Scholar] [CrossRef]
- Wu, W.X.; Jin, L.; Dong, J.; Ding, W.J. Deformation behavior and texture evolution in an extruded Mg-1Gd alloy during uniaxial compression. J. Mater. Sci. Eng. A 2014, 593, 48–54. [Google Scholar] [CrossRef]
- Ke, L.; Jian, L. Surface nanocrystallization (SNC) of metallic materials-presentation of the concept behind a new approach. J. Mater. Sci. Technol. 1999, 15, 193–197. [Google Scholar] [CrossRef]
- Roland, T.; Retraint, D.; Lu, K.; Lu, J. Fatigue life improvement through surface nanostructuring of stainless steel by means of surface mechanical attrition treatment. J. Scr. Mater. 2006, 54, 1949–1954. [Google Scholar] [CrossRef]
- Liu, G.; Wang, S.C.; Lou, X.F.; Lu, J.; Lu, K. Low carbon steel with nanostructured surface layer induced by high-energy shot peening. J. Scr. Mater. 2001, 44, 1791–1795. [Google Scholar] [CrossRef] [Green Version]
- Wang, Z.B.; Tao, N.R.; Li, S.; Wang, W.; Liu, G.; Lu, J.; Lu, K. Effect of surface nanocrystallization on friction and wear properties in low carbon steel. J. Mater. Sci. Eng. A 2003, 352, 144–149. [Google Scholar] [CrossRef]
- Zhang, Y.S.; Han, Z.; Wang, K.; Lu, K. Friction and wear behaviors of nanocrystalline surface layer of pure copper. J. Wear. 2006, 260, 942–948. [Google Scholar] [CrossRef]
- Wang, Z.B.; Lu, J.; Lu, K. Chromizing behaviors of a low carbon steel processed by means of surface mechanical attrition treatment. J. Acta Mater. 2005, 53, 2081–2089. [Google Scholar] [CrossRef]
- Wu, X.; Zhu, Y.; Lu, K. Ductility and strain hardening in gradient and lamellar structured materials. J. Scr. Mater. 2020, 186, 321–325. [Google Scholar] [CrossRef]
- Tao, N.; Zhang, H.; Lu, J.; Lu, K. Development of nanostructures in metallic materials with low stacking fault energies during surface mechanical attrition treatment (SMAT). J. Mater. Trans. 2003, 44, 1919–1925. [Google Scholar] [CrossRef] [Green Version]
- Lefevre-Schlick, F. Microstructures and Properties of Materials Engineered by Controlled Heat Treatment Methods. Ph.D. Thesis, McMaster University, Hamilton, ON, Canada, 2007. [Google Scholar]
- Lefevre-Schlick, F.; Bouaziz, O.; Brechet, Y.; Embury, J.D. Compositionally graded steels: The effect of partial decarburization on the mechanical properties of spherodite and pearlite. J. Mater. Sci. Eng. A 2008, 491, 80–87. [Google Scholar] [CrossRef]
- Chen, T.; Guang, X.U. Study on composition-graded steel. J. Hot Work. Technol. 2011, 40, 4. (In Chinese) [Google Scholar] [CrossRef]
- Zorc, M.; Nagode, A.; Bizjak, M.; Zorc, B. Decarburization of the carbon steel C45 during annealing in air. J. Mater. Geoenviron. 2018, 65, 167–178. [Google Scholar] [CrossRef] [Green Version]
- Brittan, A.M.; Mahaffey, J.T.; Colgan, N.E.; Elbakhshwan, M.; Anderson, M.H. Carburization resistance of Cu-coated stainless steel in supercritical carbon dioxide environments. J. Corros. Sci. 2020, 169, 108639. [Google Scholar] [CrossRef]
- Chun, C.M.; Desai, S.; Ramanarayanan, T.A. Metal dusting resistant copper-based materials. J. Corros. 2012, 68, 810–821. [Google Scholar] [CrossRef]
- Zhou, H.B.; Li, Y.H.; Jin, S.; Zhang, Y.; Shu, X.L. First-principles investigation of site preference and diffusion behaviors of carbon in copper. Nucl. Instrum. Methods Phys. Res. Sect. B Beam Interact. Mater. At. 2015, 352, 72–76. [Google Scholar] [CrossRef]
Publisher’s Note: MDPI stays neutral with regard to jurisdictional claims in published maps and institutional affiliations. |
© 2022 by the authors. Licensee MDPI, Basel, Switzerland. This article is an open access article distributed under the terms and conditions of the Creative Commons Attribution (CC BY) license (https://creativecommons.org/licenses/by/4.0/).

