Abstract
To compare the corrosion inhibition behaviors of rust inhibitors with different mechanisms on steel bars, the rust resistance effect of sodium molybdate (Na2MoO4), sodium chromate (Na2CrO4), benzotriazole (BTA), N-N dimethyl ethanolamine, sodium molybdate (Na2MoO4) + benzotriazole (BTA), and sodium chromate (Na2CrO4) + benzotriazole (BTA) on steel bars in a simulated chloride concrete pore solution was studied. The rust resistance effects of different types of rust inhibitors were assessed by electrochemical impedance spectroscopy (EIS), X-ray photoelectron spectroscopy (XPS), X-ray diffraction (XRD), and scanning electron microscopy (SEM). The effects of different types of rust inhibitors on the film formation characteristics of a passive film on a steel bar surface were expounded. The results show that: When sodium molybdate (Na2MoO4) and benzotriazole (BTA) acted together, the impedance value and the capacitive reactance arc radius were the largest, and the density of the passive film and the inhibition efficiency were the highest. The composition of the passive film was primarily composed of iron compounds, and it also contained oxide and adsorption films that were formed on the steel bar surface by the rust inhibitors. The rust resistance effect was proportional to the compactness of the passive film.
1. Introduction
The chloride-induced corrosion of steel bars in concrete is the main cause of premature damage to concrete [1,2]. Corrosion products expand the volume of the steel bar, resulting in concrete cracking along the length of steel bar, thereby reducing the durability of concrete [3,4]. Generally, when the steel bar is placed in highly alkaline concrete, a dense passive film is formed on the surface. However, when chloride ions erode the steel bar, the original alkalinity of the concrete pore fluid near the steel bar passive film is locally weakened. After the alkalinity decreases to a certain value, the passive film of the steel bar is destroyed and begins to rust. The chloride ion penetrates the defective passive film and reacts with the iron so that the exposed part becomes the anode of the corrosive battery. The part of the passive film that has not been broken down is used as the cathode of the battery. In this way, a corrosion battery with a small anode and large cathode is formed, which accelerates the corrosion of steel bar [5,6]. Previous research indicates [7,8] that the composition and structure of the passive film affect the compactness of the passive film and thereby affect the corrosion rate of the steel bar. Therefore, the corrosion protection of the steel bar is the key to improving the service life of reinforced concrete structures.
There are many ways to prevent steel bar corrosion [9,10]. However, many studies showed [11,12] that adding rust inhibitors is the simplest and most effective way to inhibit the corrosion of a steel bar. In the corrosive environment, the passivation environment in concrete could be improved by using the rust inhibitor, which ensured the steel bar was not rusted [13]. According to the mechanism of action, rust inhibitors are divided into anode rust inhibitors, cathode rust inhibitors, and composite rust inhibitors. Anodic rust inhibitors include nitrite, chromate, and molybdate [14]. They prevent steel bar corrosion by improving the passive film and reducing the contact between the steel bar and oxygen [15,16]. Unfortunately, the anodic rust inhibitor causes the pitting corrosion of the steel bar to accelerate corrosion within a certain concentration range. Cathodic rust inhibitors includes organic carboxylic acids, organic aldehydes, organic amines, and alcohols [17]. They improve the corrosion resistance by forming an adsorption film on the steel bar surface [18,19,20]. The composite rust inhibitor has the characteristics of the single rust inhibitor and overcomes the shortcomings of the single rust inhibitor. This kind of rust inhibitor inhibits the dissolution of the anode and provides a protective barrier for the cathode. Okeniyi et al. [21] found that concrete mixed with 0.145 M potassium chromate has the best inhibition effect. Lin et al. [22] studied the rust resistance effect of a composite calcium lignosulfonate and Na2MoO4 on a steel bar in a simulated carbonated concrete pore solution by electrochemical and surface analysis techniques. They found that the calcium lignosulfonate and Na2MoO4 showed synergistic corrosion inhibition. Through electrochemical and microscopic tests, Zhang et al. [23] found that the the corrosion inhibition of a steel bar was the best when the concrete was mixed with 0.5% NaNO2 and 0.5% benzotriazole. To reduce the corrosion of a steel bar in concrete, Ryu et al. [24] studied the inhibition efficiency of DMEA under the condition of different concentrations of NaCl by electrochemical methods. They found that DMEA effectively reduced the corrosion rate. Although research on rust inhibitors is relatively extensive, there are relatively few studies comparing rust inhibitors with different action mechanisms. Under chloride attack conditions, there is no systematic study on the effect of rust inhibitors with different mechanisms on the microstructure of the passive film.
Therefore, this paper analyzes the effect of different rust inhibitors on the corrosion inhibition of the steel under the condition of chloride corrosion by electrochemical and microscopic methods. The relationship between the rust resistance effect and passive film microstructure is explored. This provides a theoretical basis for optimizing the passive film structure and improving the application of rust inhibitors in reinforced concrete.
2. Materials and Methods
2.1. Materials
Grade HPB235 (Ningbo Zhedong building materials factory, Ningbo, China) round steel bars with a diameter of 8 mm were used in preparation of the 2 mm thick steel samples used in the experiments. Steel samples with a length of 60 mm were also prepared. All steel samples were soaked in 10% ammonium citrate solution for five days to remove the oxide. Then, steel samples were washed with water, dried with a towel, and placed in an oven at about 100 °C for 10 min. After polishing with sandpaper, the grease on the steel samples was removed with absolute ethanol. At last, the steel samples without rust marks were wrapped with plastic wrap. The main chemical composition of the steel bar is shown in Table 1. Sodium chromate (Na2CrO4), sodium molybdate (Na2MoO4), benzotriazole (BTA), and N-N dimethyl ethanolamine (DMEA) were used as rust inhibitors. The purity was over than 99.9%, and the content of chloride ions was less than 0.01%. Additionally, Table 2 shows the physical property index of the rust inhibitors.

Table 1.
Chemical composition of the HPB235 round steel bar.
Table 2.
Physical property index of the rust inhibitors.
2.2. Sample Preparation
First, the simulated concrete hole solution [25,26] with a pH of 13.3 was prepared. The solution was prepared by 0.001 mol/L Ca(OH)2, 0.200 mol/L NaOH, and 0.600 mol/L KOH. NaCl and the rust inhibitor were added to the solution, and the content is shown in Table 3. During the test, in order to ensure the pH of the simulated solution did not change more than 0.1, a 0.8 mol/L NaHCO3 solution was used to adjust the pH downward, and the 0.1 mol/L NaOH solution was used to adjust the pH of the solution upward. Three steel samples with a thickness of 2 mm were added to each test group. At the same time, a 50 mm × 50 mm × 50 mm cement specimen was made for the electrochemical test. The schematic diagram of the specimen is shown in Figure 1. A two-electrode system was adopted. The embedded steel sample in the center of the specimen was used as the working electrode end. The stainless steel mesh was fixed on the side of the specimen as a reference electrode when the specimen was made. The content of NaCl and rust inhibitor was the same as above. The electrochemical impedance spectrum was tested after curing for 28 days and 90 days. After six months, the steel samples in the solution were taken out for XPS, XRD, and SEM tests. The steel samples were weighed and recorded as m0 and immersed in 10% ammonium citrate solution for dusting. Then, the steel samples were weighed and recorded as m. Thereby, the weight loss mass m0-m was obtained. Additionally, the inhibition efficiency (IE%) [27] of the rust inhibitor was calculated according to Equation (1):
where △w0 is the weight loss mass of the steel without the rust inhibitor in the solution; and △w is the weight loss mass of the steel when adding the rust inhibitor to the solution.
Table 3.
The content of the rust inhibitor and NaCl g/L.

Figure 1.
Schematic diagram of the electrochemical specimen.
2.3. Test Parameter Setting
The electrochemical impedance spectra of the steel samples were measured by PARSTAT 3000 A electrochemical workstation (Princeton Corporation, Ningbo, China). The frequency range was 1 Hz–10 KHz, the amplitude was 5 mV, and the application voltage range was ±6 V.
XPS used a magnesium target. The X-ray emission current was 20 mA. The high voltage of the X-ray source was 10 kV, the multiplier voltage was 2.8 kV, anda the passing energy of full-spectrum was 100 eV. The passing energy of narrow scanning was 50 eV, and scanning times were 20. Additionally, each step time was l0 m/s. After the XPS test, the data were fitted using the CasaXPS2.3.16 software. The binding energies of all elements were calibrated with the C1s as the standard, and the binding energy of carbon was 284.8 eV.
The XRD model was D8Advance Davinci, using Cu Kα1 radiation. Additionally, the tube voltage was 40 kV, and the tube current was 40 mA. The scanning method was continuous scanning, and the range was 20~90°, with a rate of 8°/min and step size of 0.02°.
The model of SEM was S-4800. The cold-field-emission electron source, backscattered electron resolution was 3.0 nm (15 kV), accelerating voltage was 0.5~30.9 kV, and magnification range was 30~800,000.
3. Results and Discussion
3.1. Electrochemical Analysis
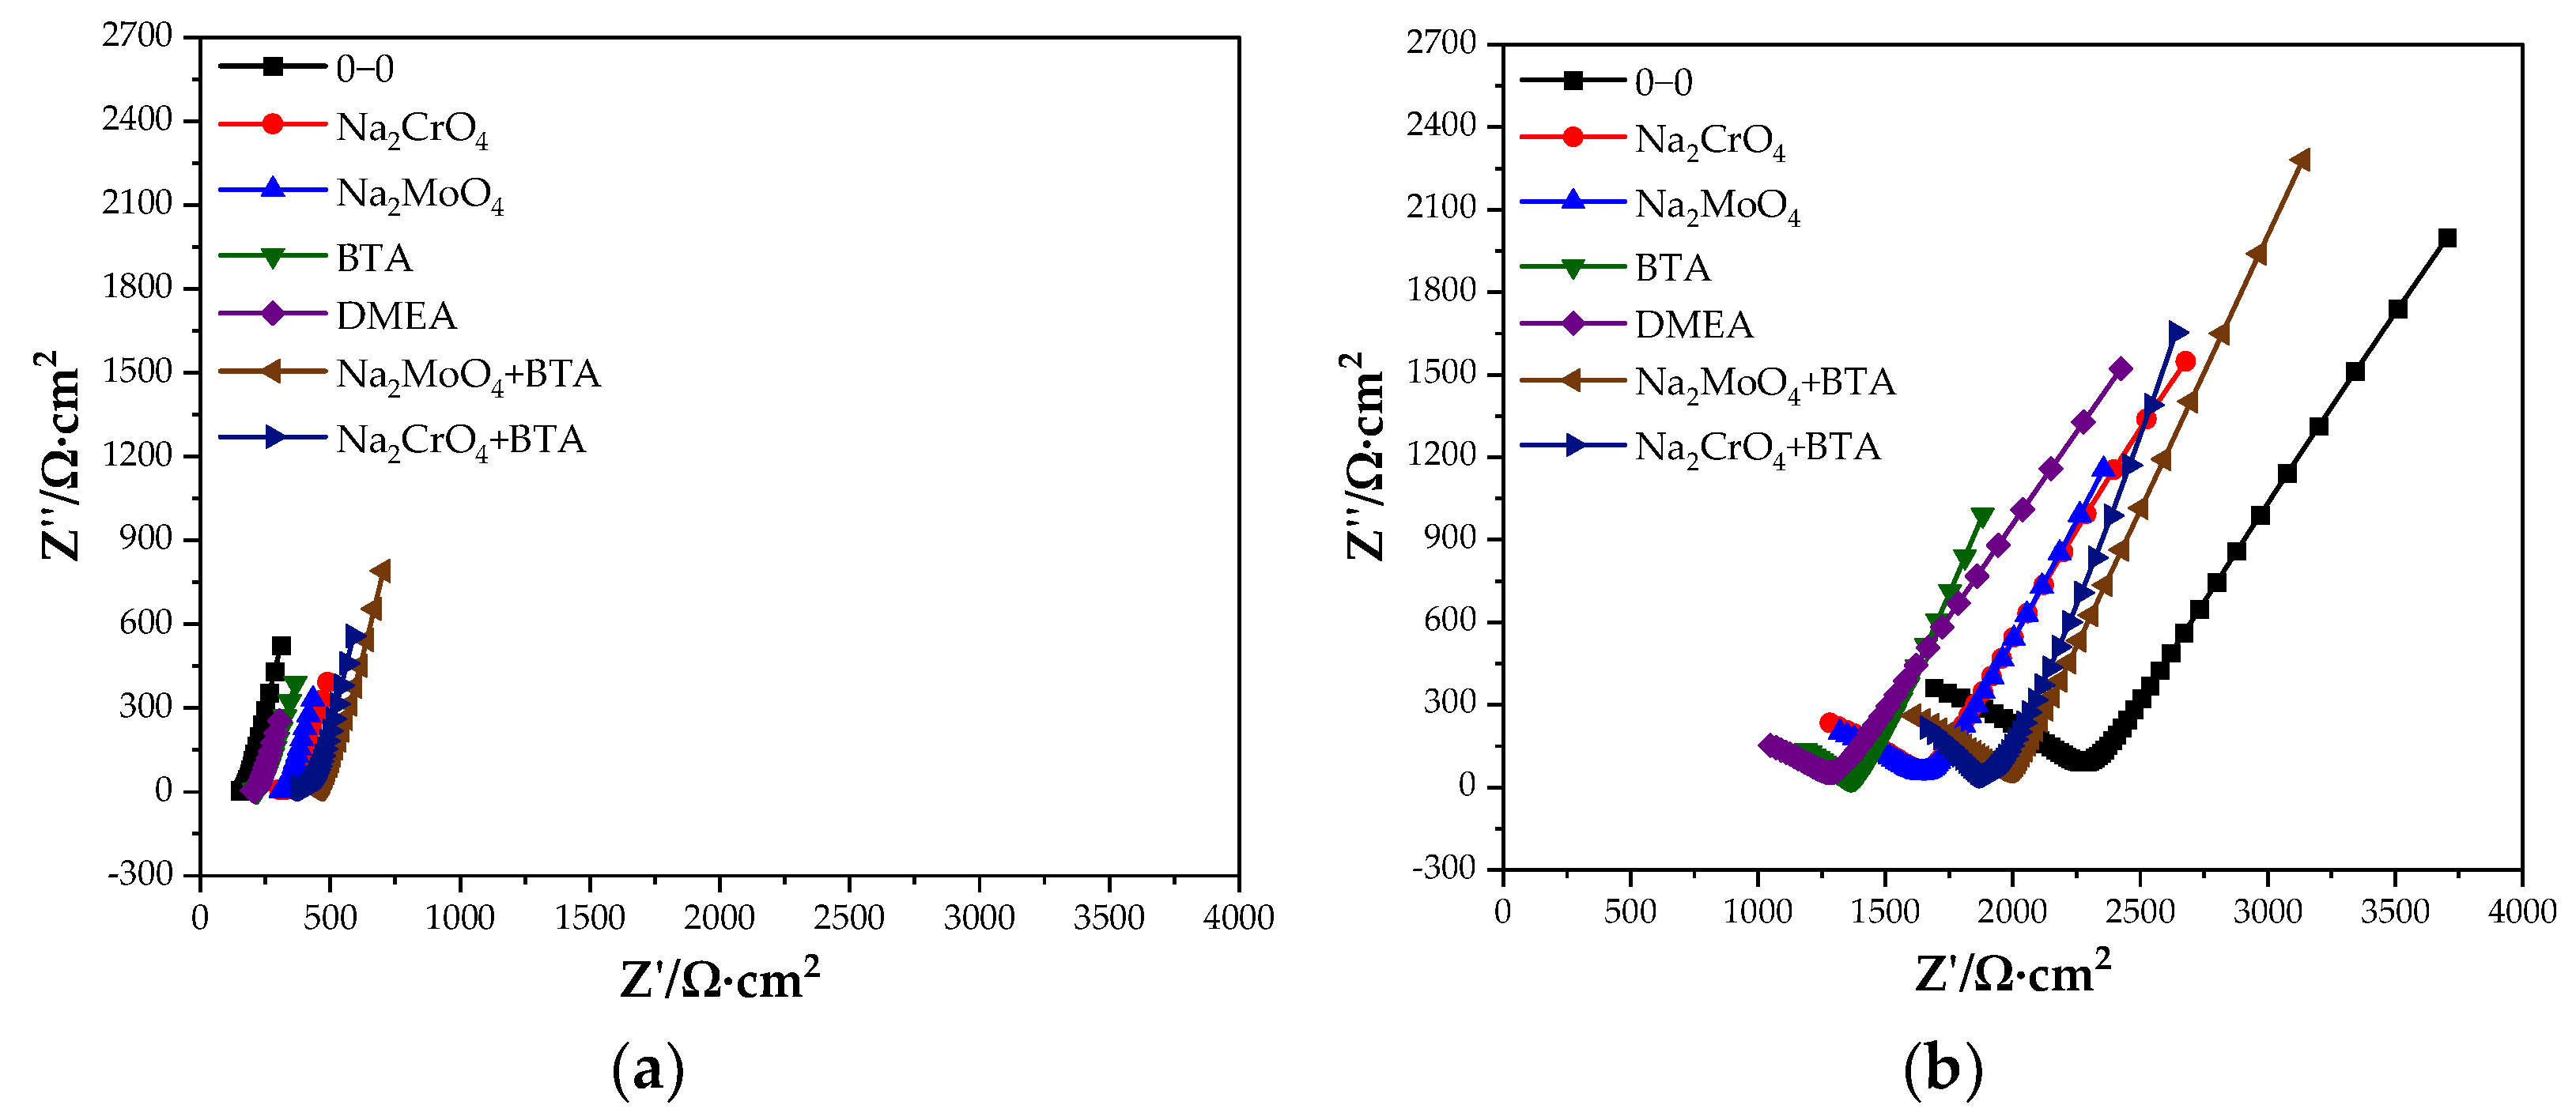
Figure 2 shows the Nyquist diagram of the steel sample in the cement paste specimen at 28 and 90 days. At 28 days, the capacitive arc in the low-frequency region is close to a straight line, and the steel sample is passivated. The transfer resistance of the double electric layer on the steel sample surface is very large, and the corresponding equivalent circuit diagram is shown in Figure 3a. At 28 days, the impedance of the control group is significantly lower than that of the group mixed with the rust inhibitor, indicating that the rust inhibitor effectively inhibits the corrosion of the steel sample. The impedance is the largest under the combined action of Na2MoO4 and BTA. At 90 days, a straight line with a slope close to 45° appears in the low-frequency region. The equivalent circuit diagram is shown in Figure 3b, and the impedance W related to diffusion appears. The electrochemical system is controlled by diffusion. The radian of the capacitive arc in the low-frequency region of each group becomes large, and the radius becomes small. It shows that the steel sample has the trend of corrosion. The impedance of the control group is higher than that of the group mixed with the rust inhibitor. This is because more rust is formed on the steel sample surface, and the resistance of the rust is higher than that of iron, so the impedance is significantly improved. The impedance and capacitive arc radius of the composite rust inhibitors are significantly larger than that of the single rust inhibitors. Additionally, under the combined action of Na2MoO4 and BTA, the impedance and the radius of capacitive arc are the largest. It shows that the inhibition efficiency is the highest, and the rust resistance effect is the best when Na2MoO4 and BTA are mixed together.
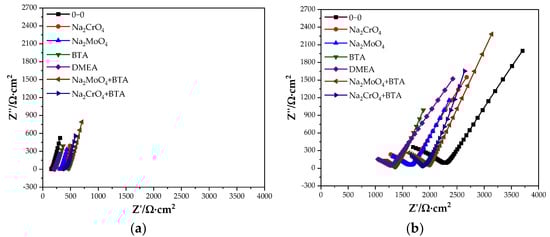
Figure 2.
Nyquist diagram of the specimen with the rust inhibitor. (a) 28 days. (b) 90 days.
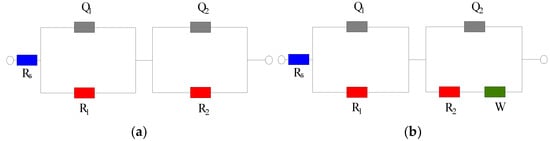
Figure 3.
EIS equivalent circuit diagram. (a) Circuit diagram 1. (b) Circuit diagram 2.
3.2. XPS Analysis of the Passive Film on the Steel Sample
3.2.1. XPS Scanning Full Spectrum Analysis of the Passive Film
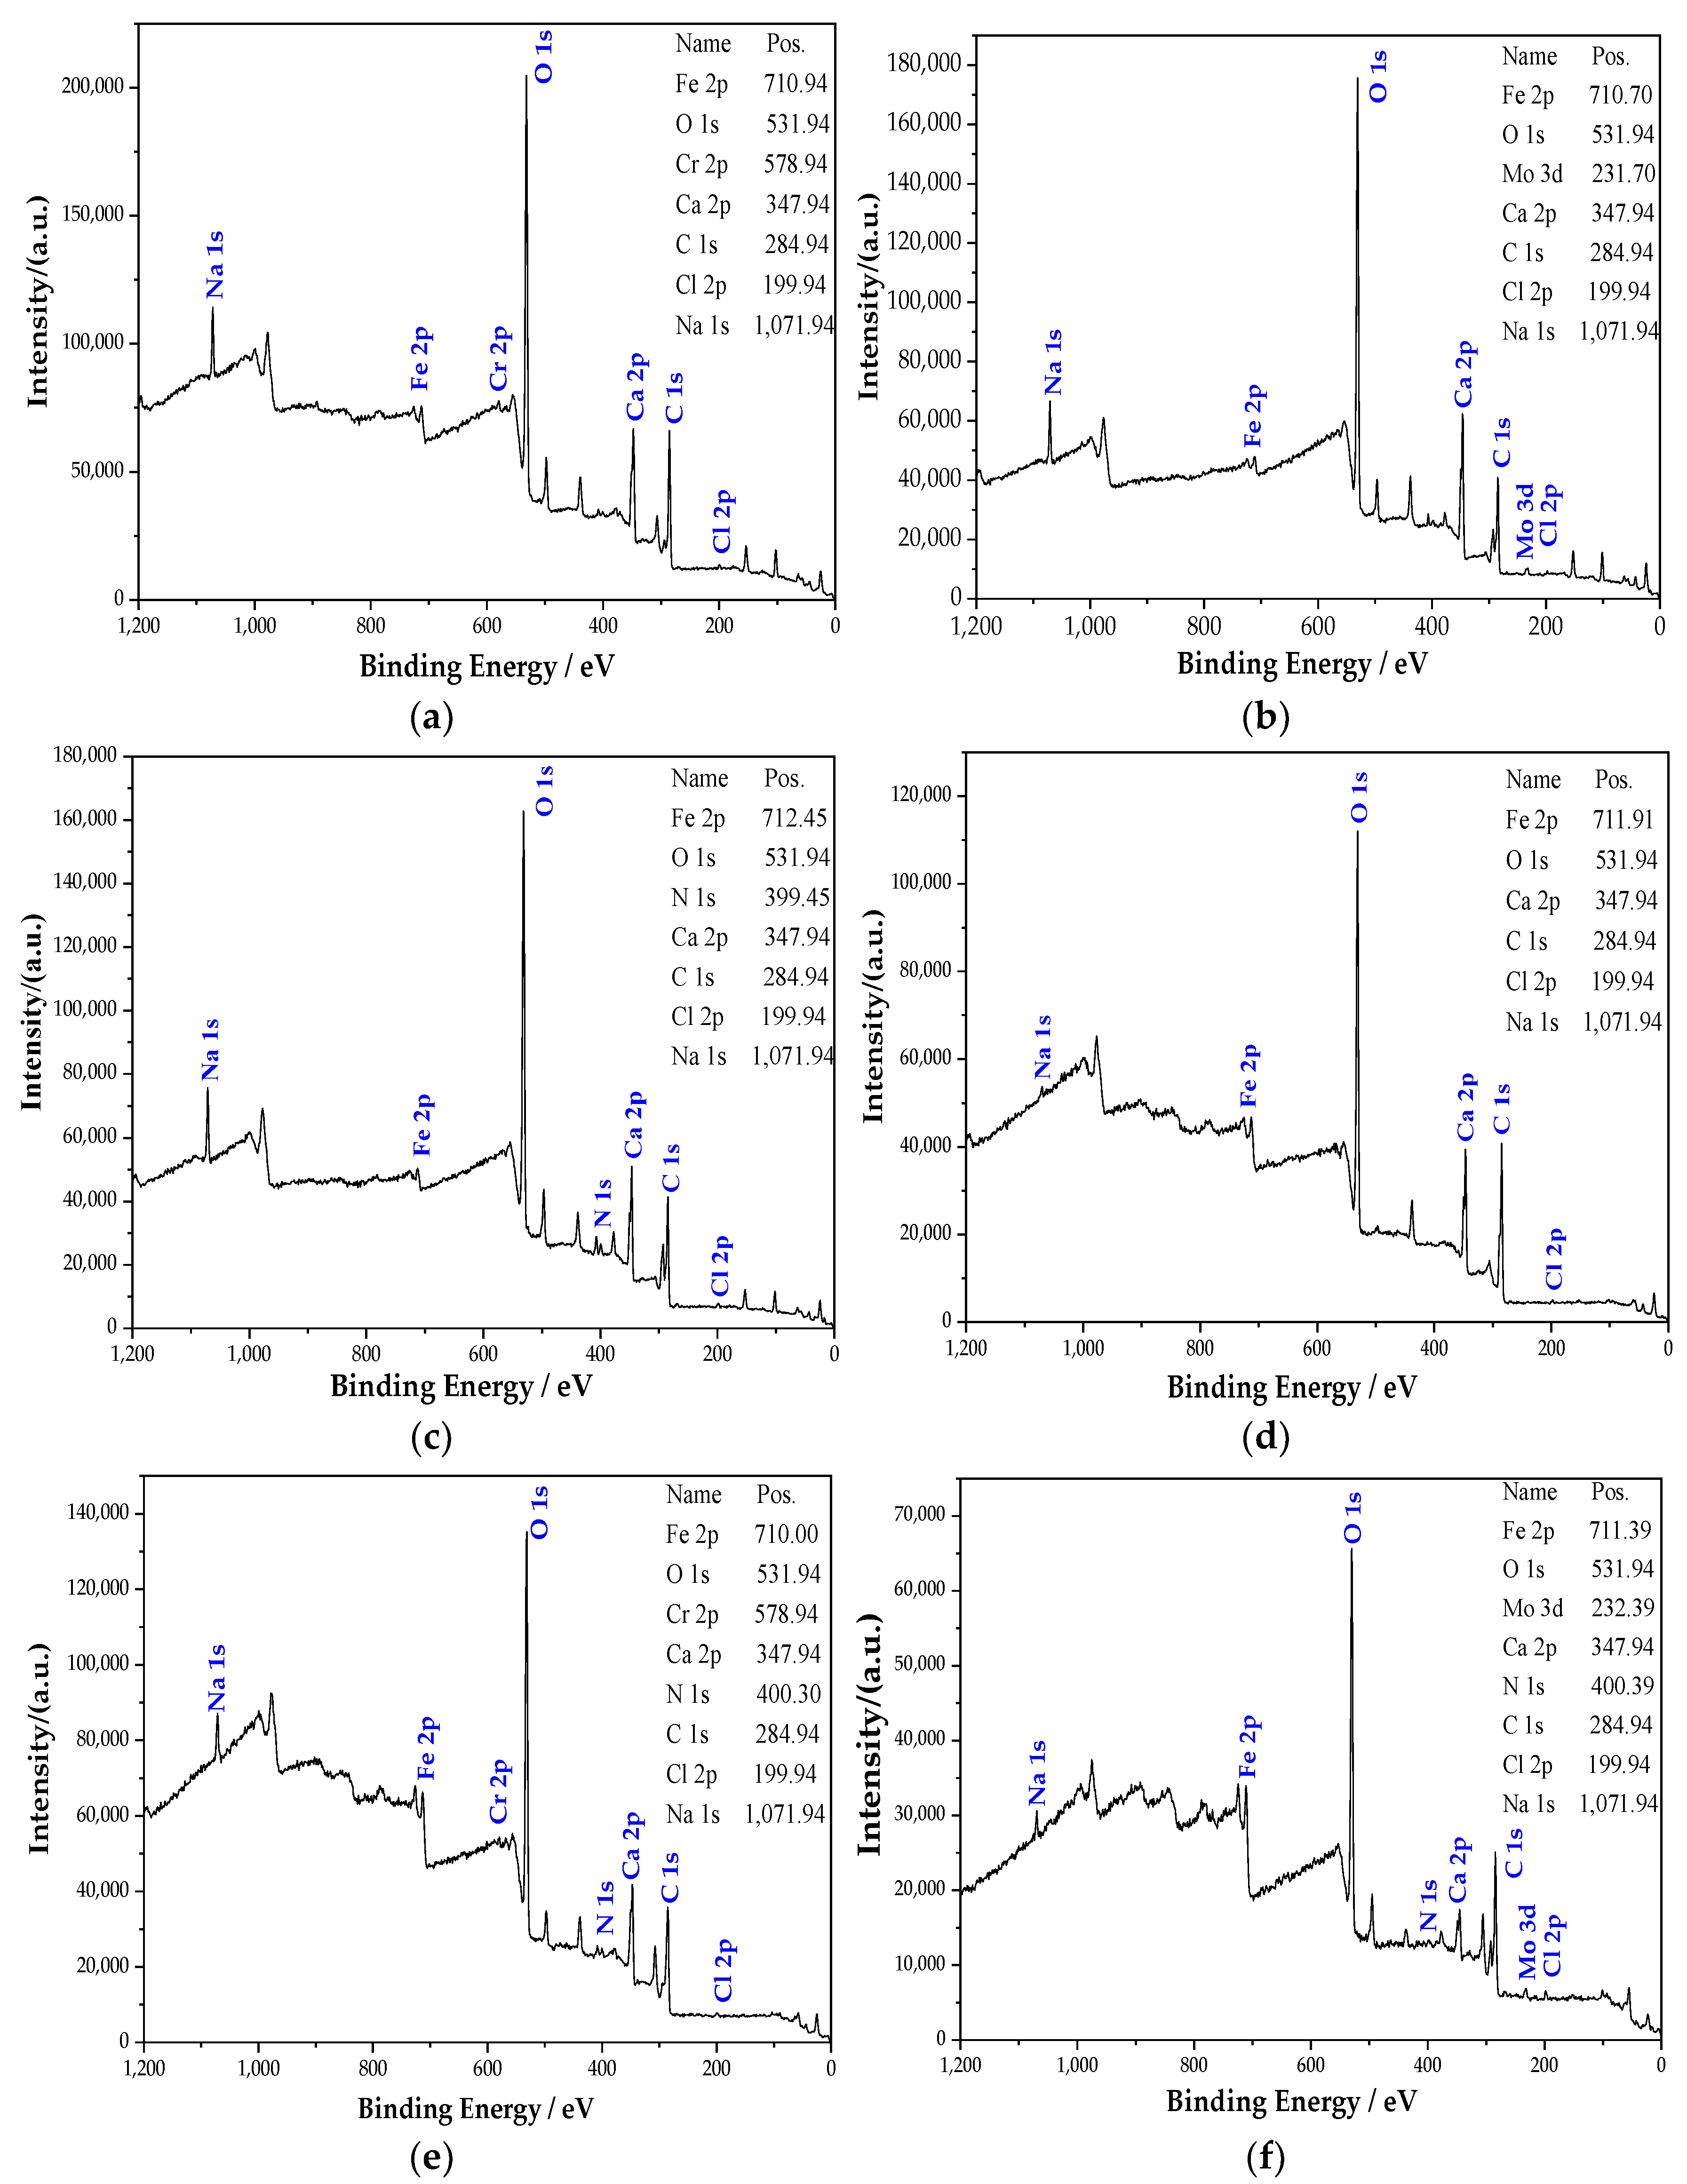
Figure 4 shows the full scan XPS spectrum of the passive film on the steel sample surface. It can be seen from Figure 4 that the passive film mainly contains Fe, O, Ca, C, Cl, and Na elements. The elements of Ca, Cl, and Na come from Ca(OH)2, NaCl, NaOH, and NaHCO3 added during the solution preparation. XPS detects the C element, and the diffraction peak of the C is powerful. On the one hand, it is because the steel sample contains C. On the other hand, since the C element [28] does not exist in the solution, it may come from pollutants. The diffraction peaks of O and Fe are very strong, indicating that the passive film is mainly composed of iron oxide [29]. In addition, the components in the rust inhibitor also participated in the formation of the passive film. The passive film of the group mixed with Na2CrO4 contains compounds related to the Cr element. Additionally, the groups mixed with Na2CrO4 contain compounds related to the Mo element. In the groups containing BTA, the N peak is obviously raised after adding BTA, illustrating that the passive film contains some compounds related to the N element. The N element could only come from BTA. Additionally, the diffraction peaks of Cr, Mo, and N are powerful. By observing the binding energy of Fe 2p in Figure 4, it can be observed that the binding energy of Fe 2p changed with different rust inhibitors. This phenomenon shows that the iron oxide in the passive film has a difference in composition under the action of different rust inhibitors.
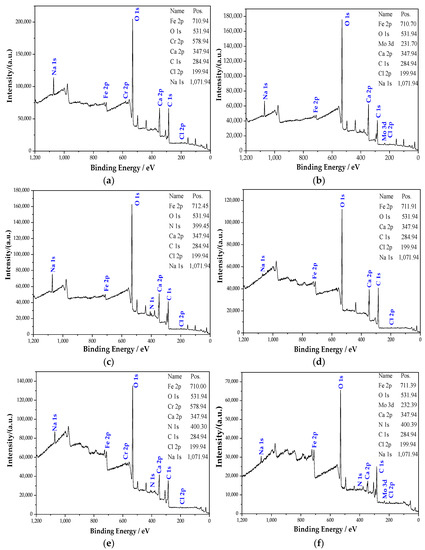
Figure 4.
XPS full scan of the steel sample passive film in the different groups. (a) Na2CrO4 group. (b) Na2MoO4 group. (c) BTA group. (d) DMEA group. (e) Na2CrO4 + BTA group. (f) Na2MoO4 + BTA group.
3.2.2. Analysis of the XPS Peak Fitting Spectrum of Fe
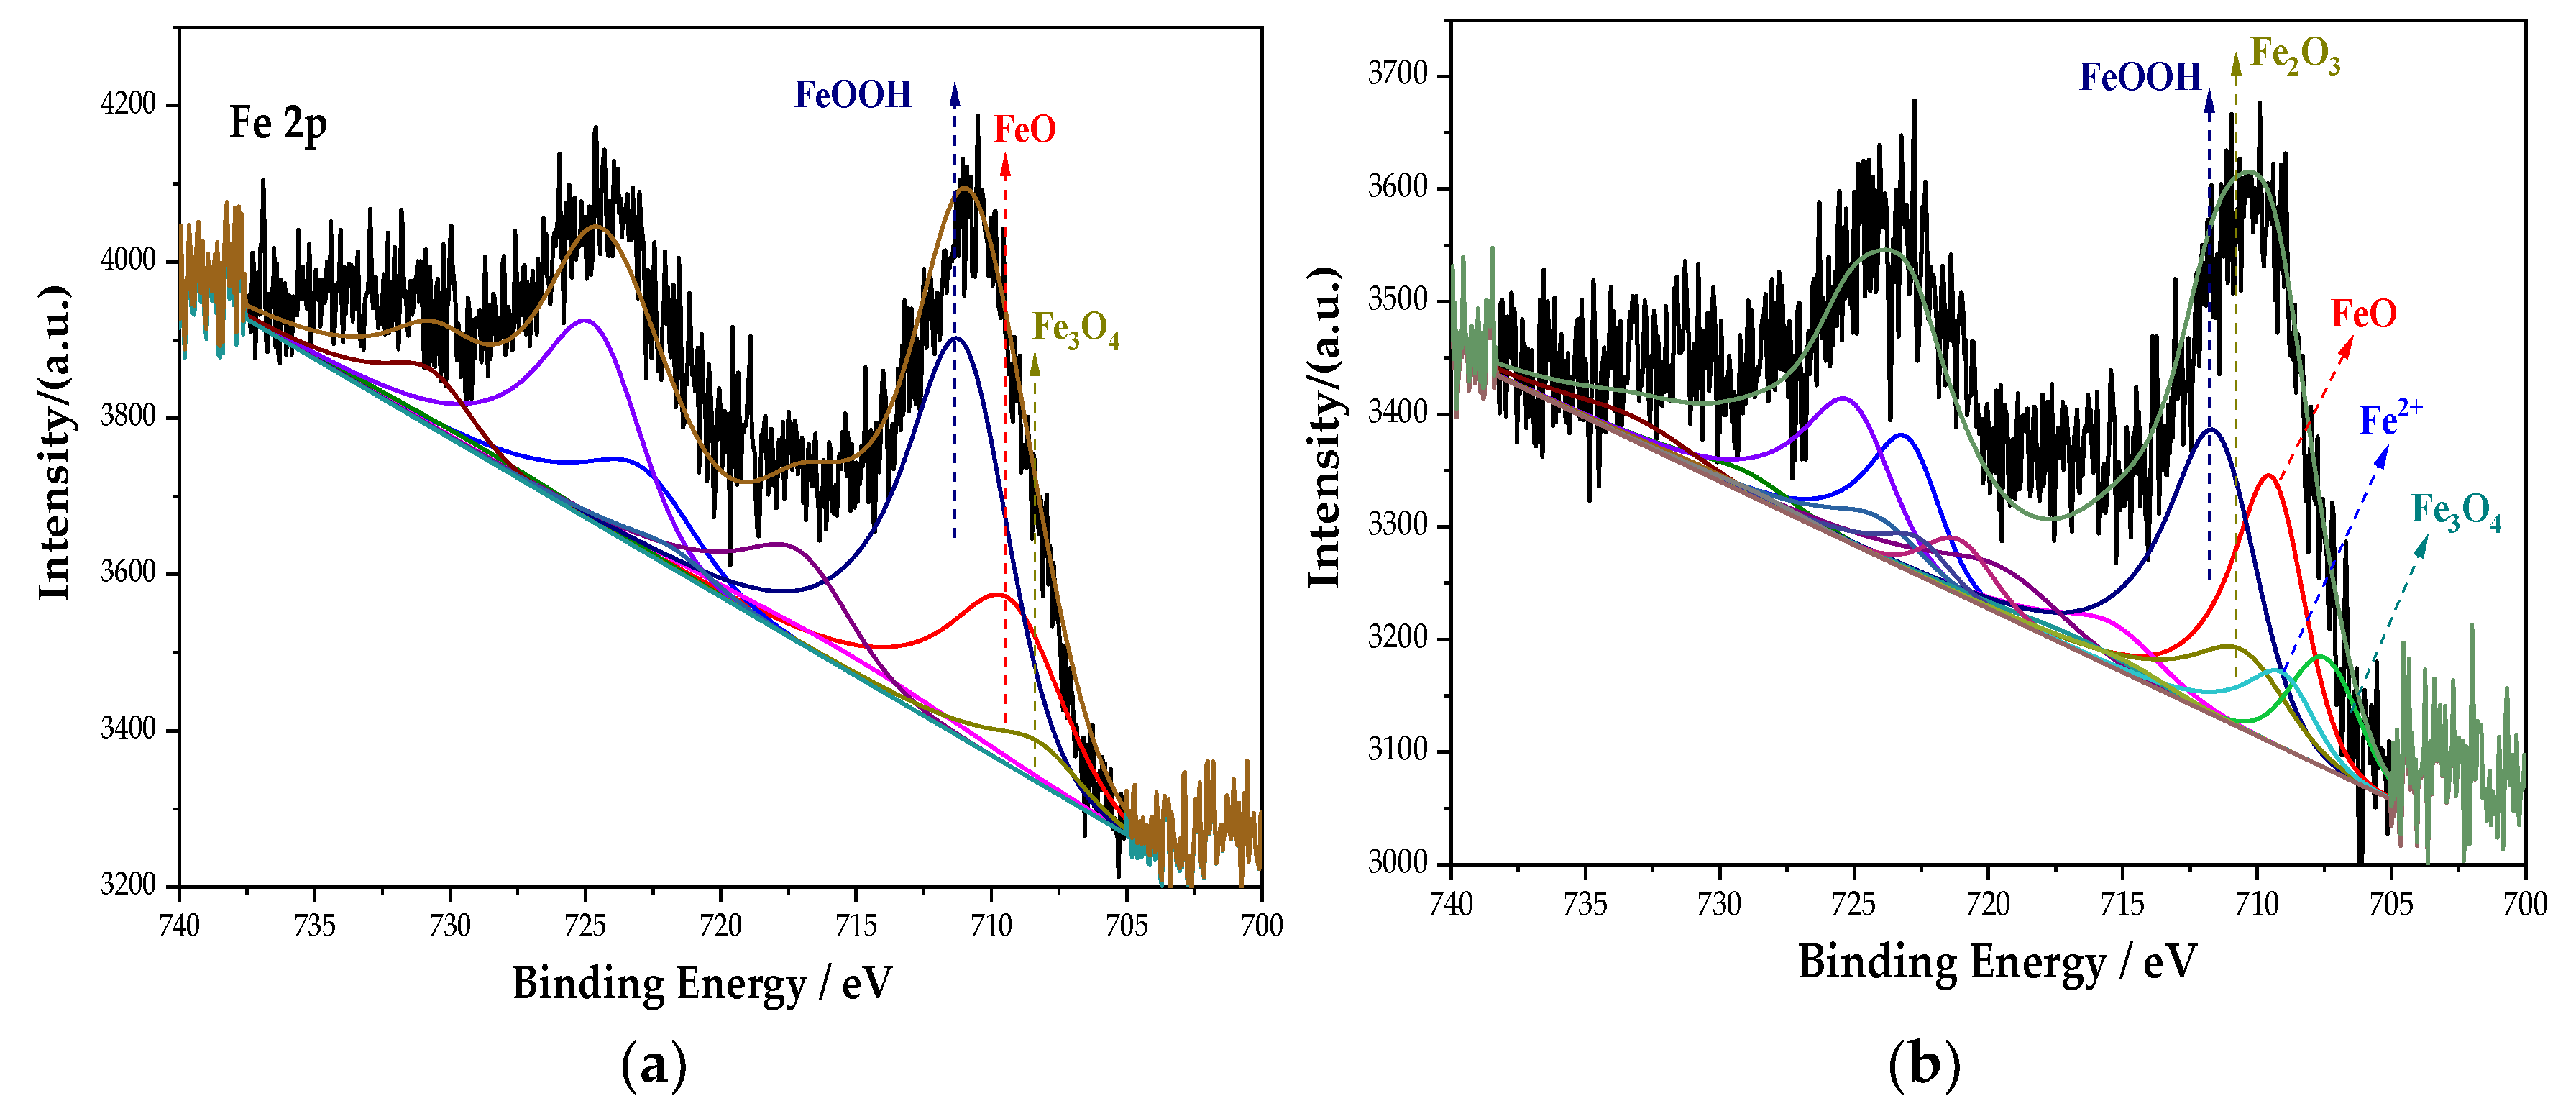
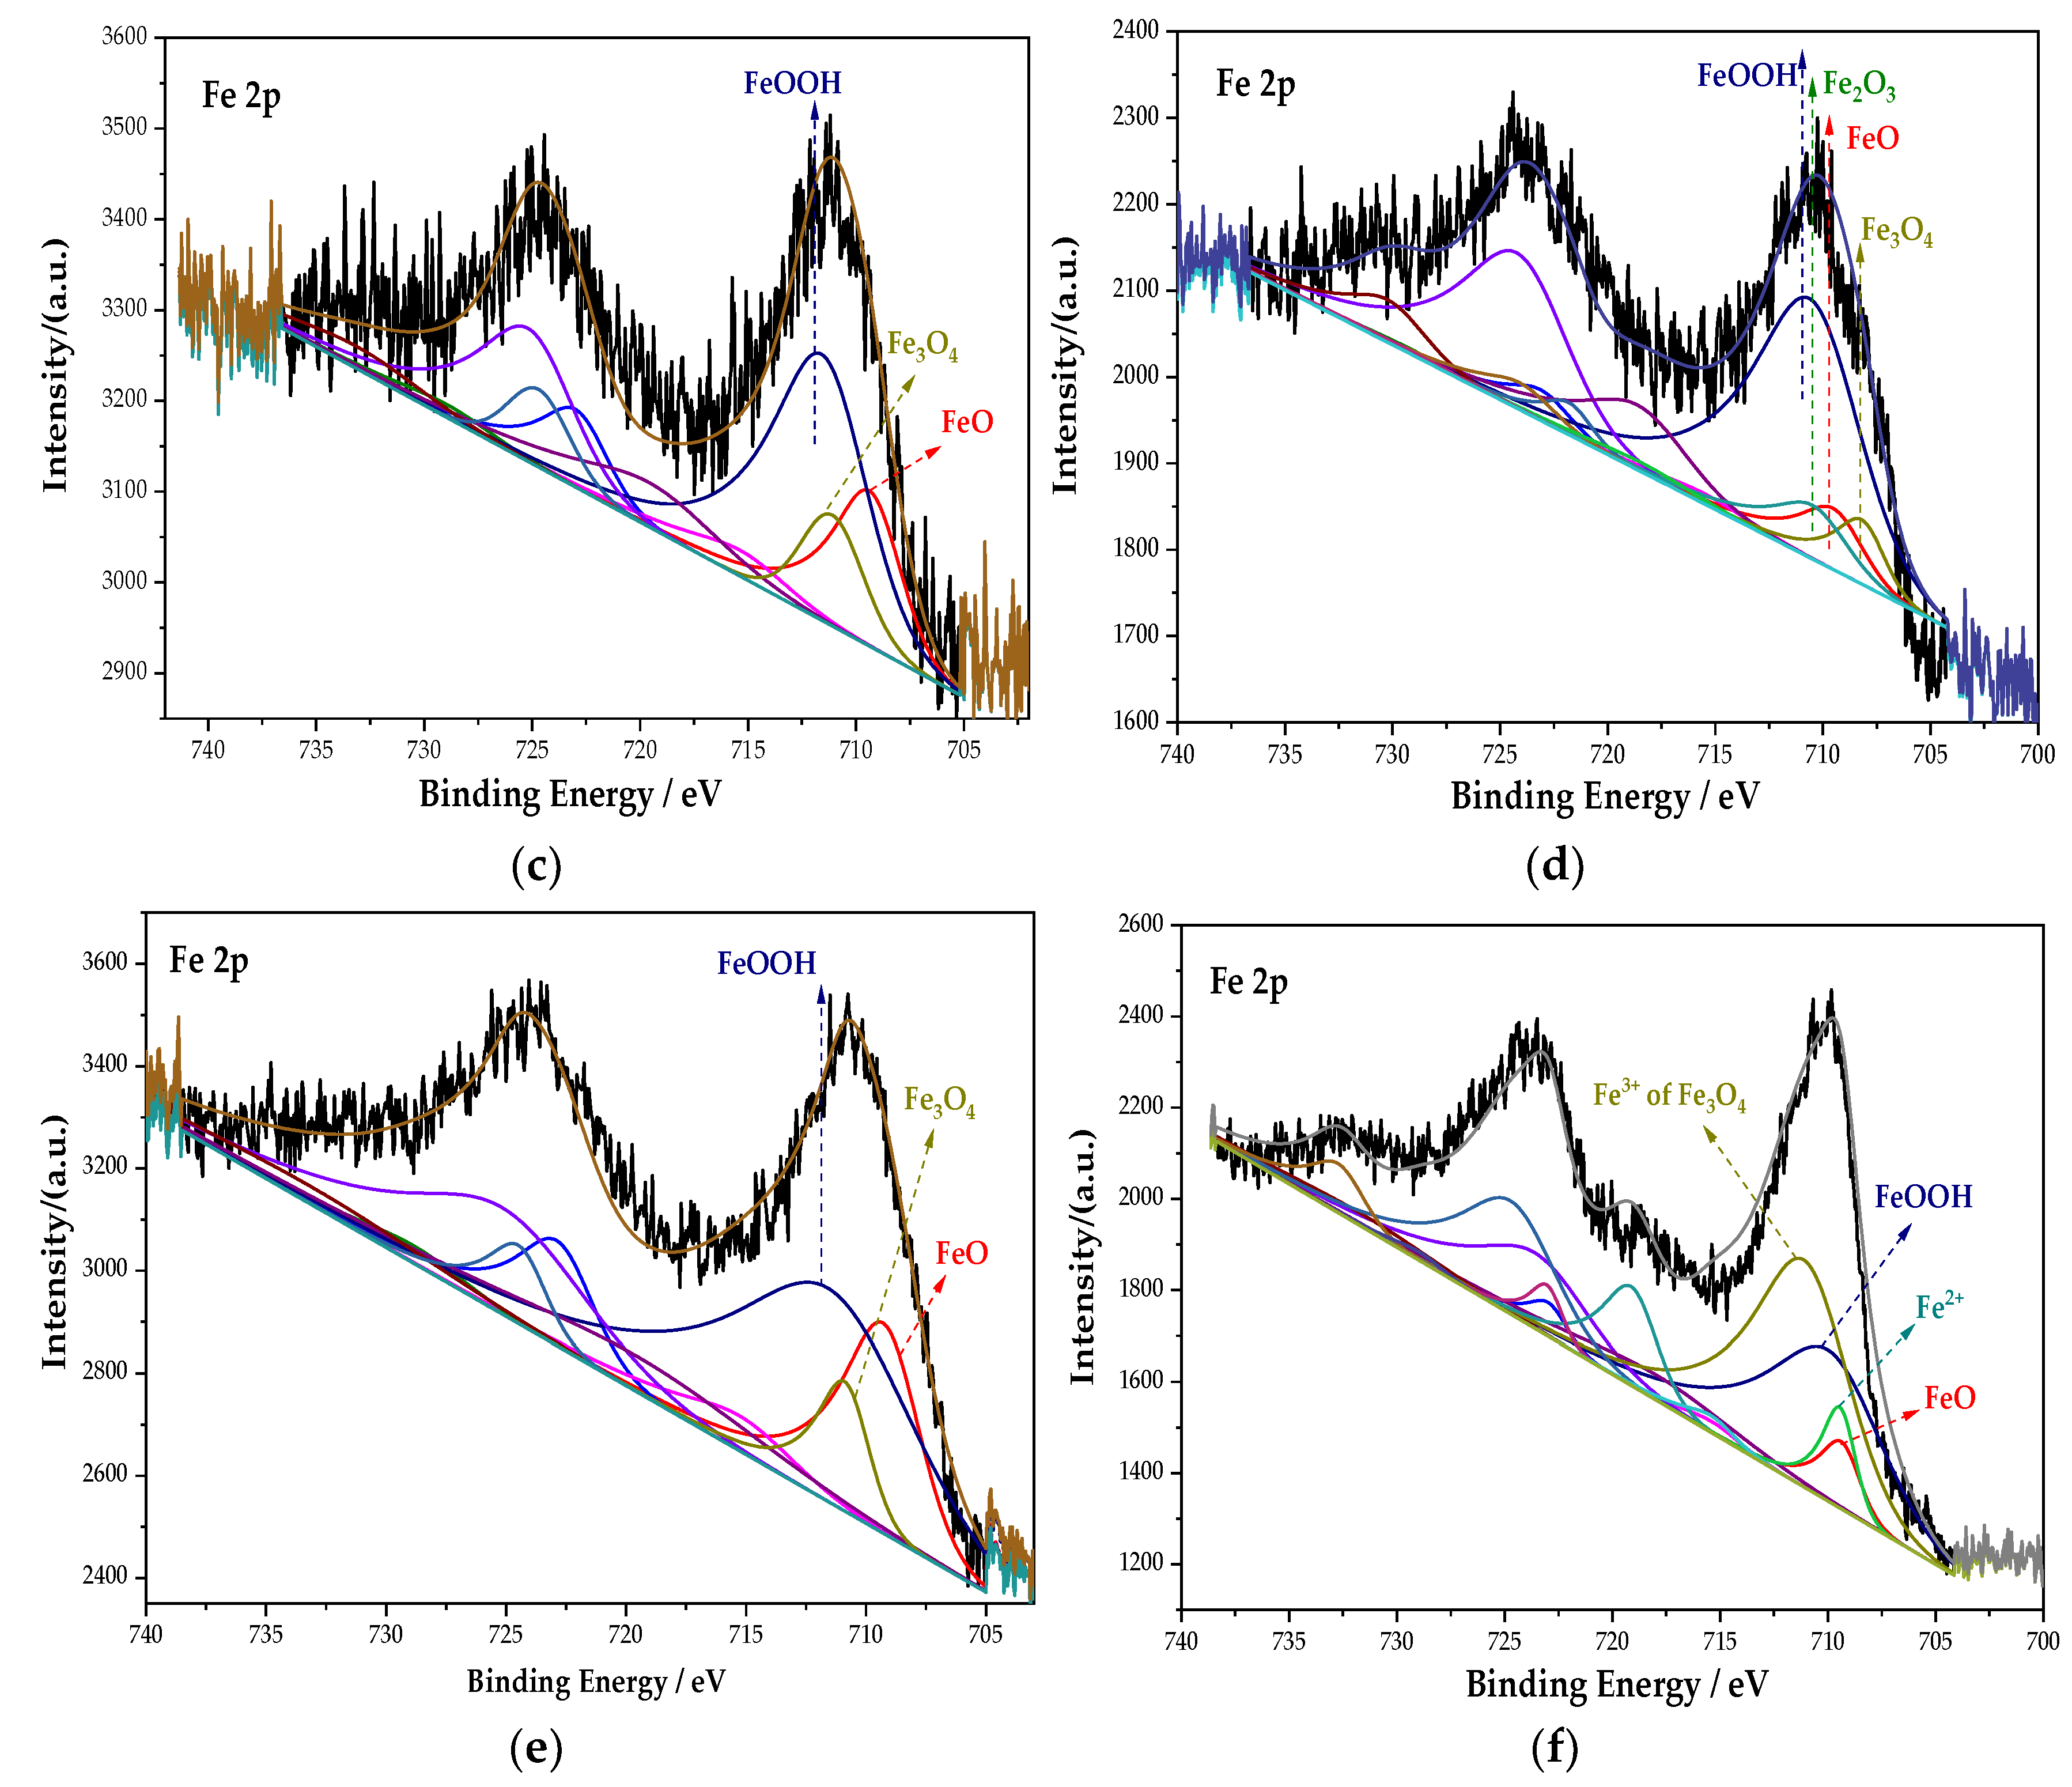
The whole XPS spectra were processed using the CasaXPS software. Combined with the relevant literature [30] and the NIST XPS database, the XPS spectrum of the Fe element in the passive film was obtained, as shown in Figure 5. The main components of the passive film containing the Fe element in each group are composed of Fe3O4, FeOOH, and Fe2+. Among them, Fe3O4 has the highest density and is insoluble in acid and alkali. In addition, the Na2MoO4 and DMEA groups also possess Fe2O3. After fitting, the peak fitting data of the Fe element are shown in Table 4. The FeOOH in the Na2CrO4 group occupies the majority, and Fe3O4 with a higher density is significantly lower than that in the Na2MoO4 group. In the Na2MoO4 group, due to the existence of MoO42− and the instability of FeCl2, the two react to generate insoluble and stable FeMoO4 [31]. The molybdate inhibits the dissolution of steels, thereby preventing corrosion [32]. Its formation process is shown in Equations (2) and (3):
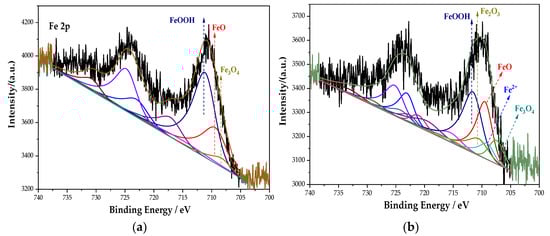

Figure 5.
XPS peak spectrum of the Fe element in the passive film under the action of different rust inhibitors. (a) Na2CrO4 group. (b) Na2MoO4 group. (c) BTA group. (d) DMEA group. (e) Na2CrO4 + BTA group. (f) Na2MoO4 + BTA group.
Table 4.
Fitting data of the Fe element in different groups.
In the groups containing BTA, compared with the anodic rust inhibitor, the content of FeOOH changes little, but the content of Fe3O4 increases, while the content of FeO decreases. The incorporation of BTA further oxidizes FeO into Fe3O4 and improves the resistance of the passive film to chloride ions. In the DMEA group, the content of FeO and Fe3O4 with a higher density is less, and Fe2O3 with loose and porous is generated. This indicates that the compactness of the passive film is not ideal under the action of DMEA, which is lower than that of BTA. Comparing the percentage of each component in each group, the content of Fe3O4 under the combined action of Na2MoO4 and BTA is 48.29%, which is much larger than that in other groups. Additionally, the formation of FeMoO4 further prevented corrosion. The mechanism of steel bar corrosion is electrochemical reaction. This process is completed by electron transfer between the anode and cathode. An anodic rust inhibitor can slow down the progress of steel bar corrosion by inhibiting the loss of electrons in the iron matrix in the anode area or slowing down its loss of electrons. However, local corrosion or accelerated corrosion may be caused during use. A cathode rust inhibitor can, by physical and chemical adsorption on the passive film, slow down the ability of the electrochemical cathode to gain electrons, thereby enhancing corrosion resistance. Under the combined action of Na2MoO4 and BTA, the characteristics of anodic and cathodic rust inhibitors are combined. It inhibits the dissolution of the anode and provides a protective barrier for the cathode. It follows that the passive film is the densest in the Na2MoO4 + BTA group, and the inhibition efficiency is the highest.
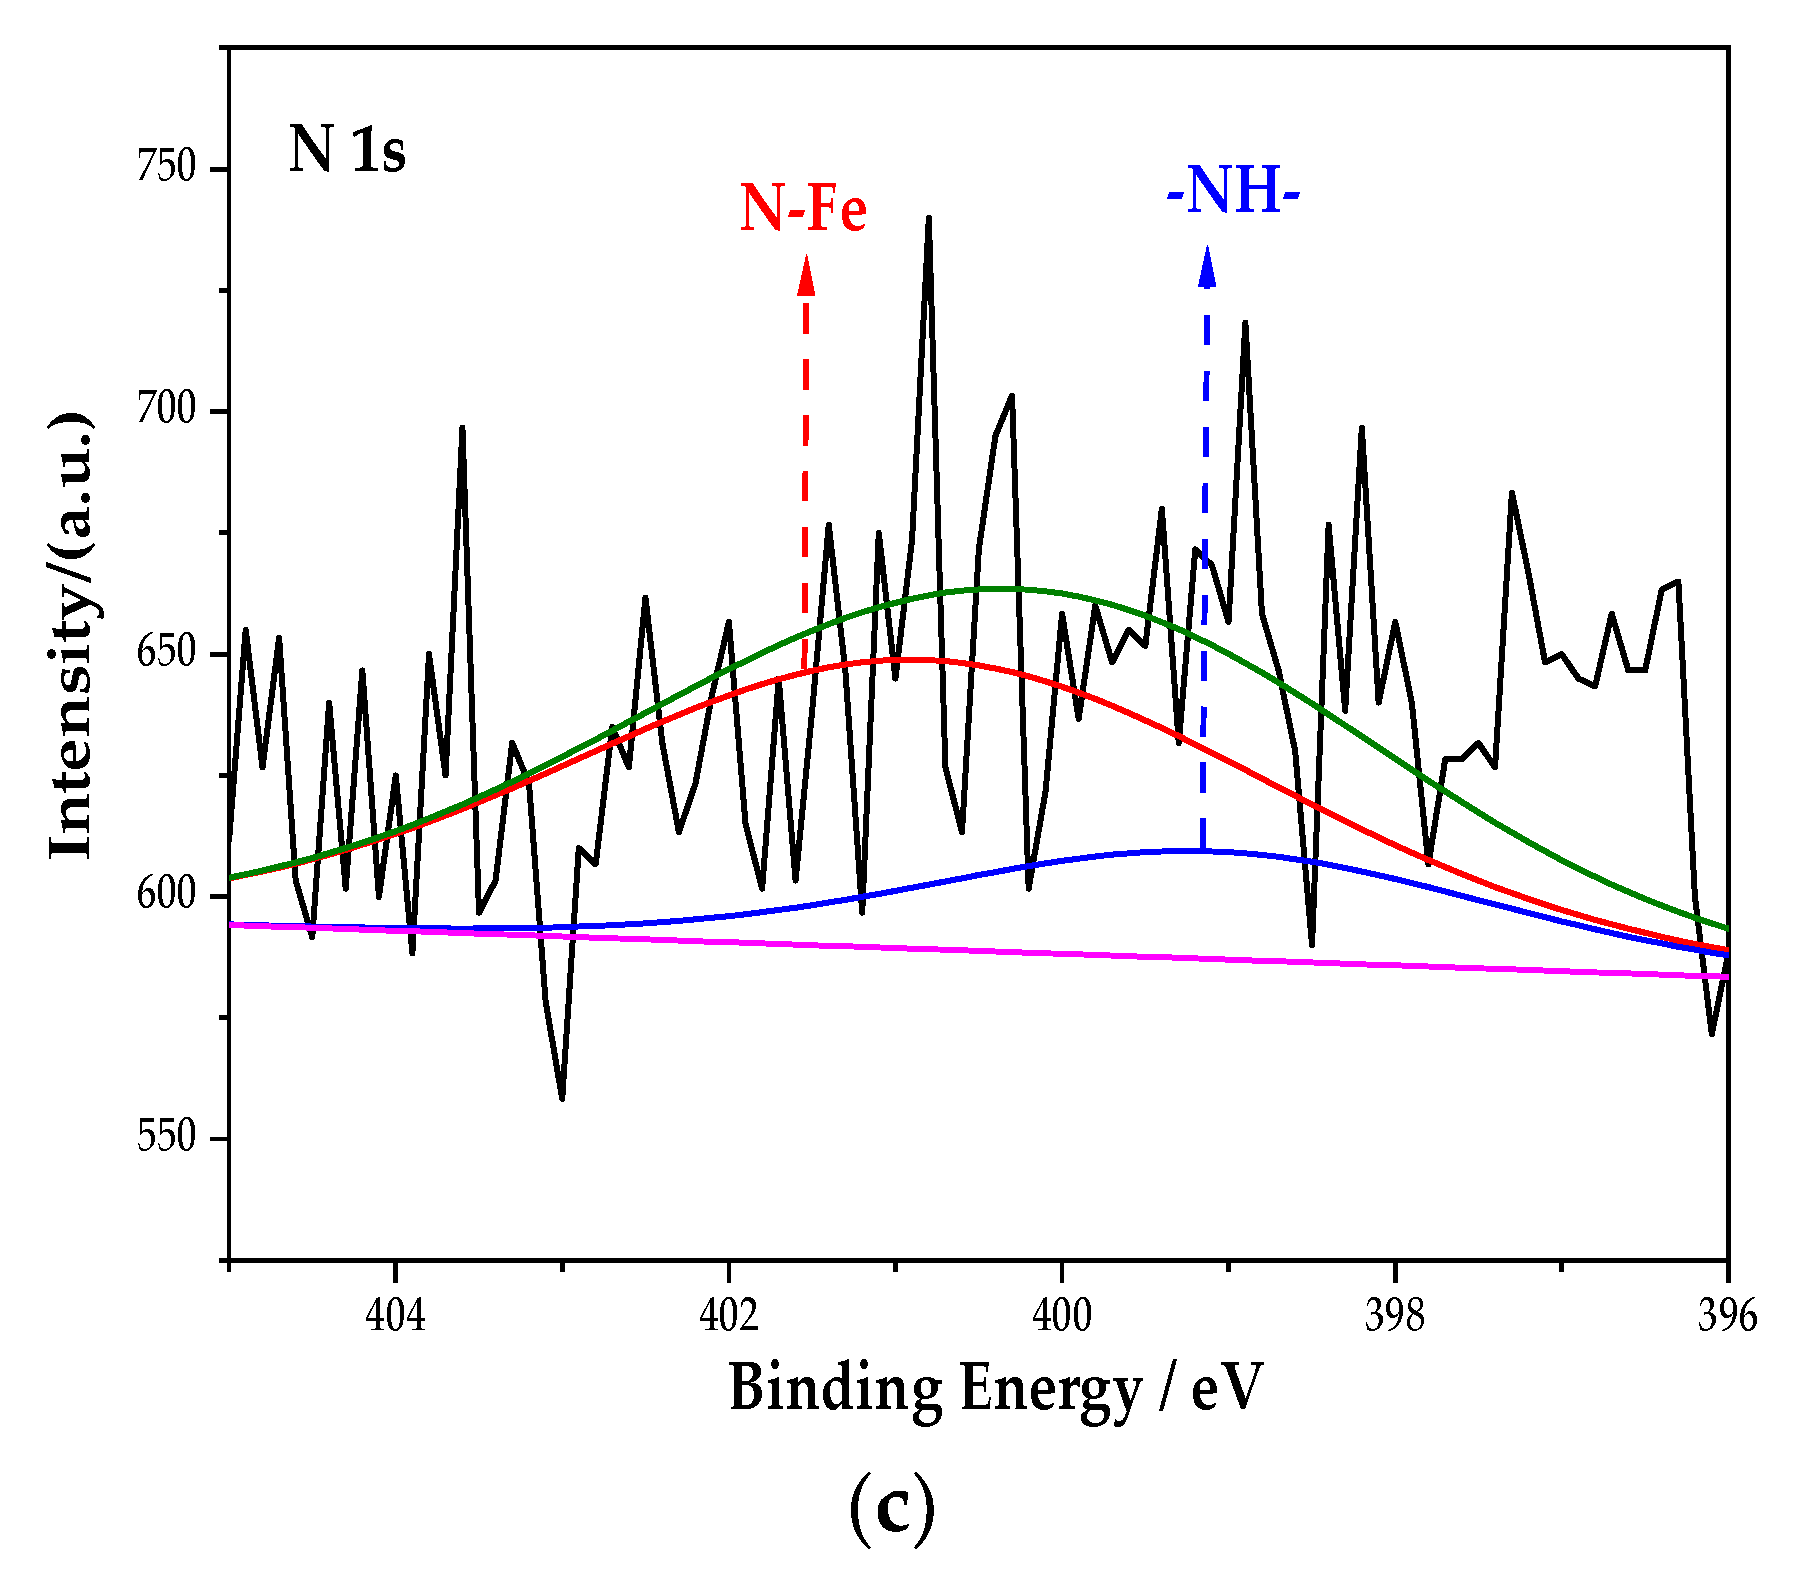
3.2.3. Analysis of the XPS Peak Fitting Spectrum of the N Element
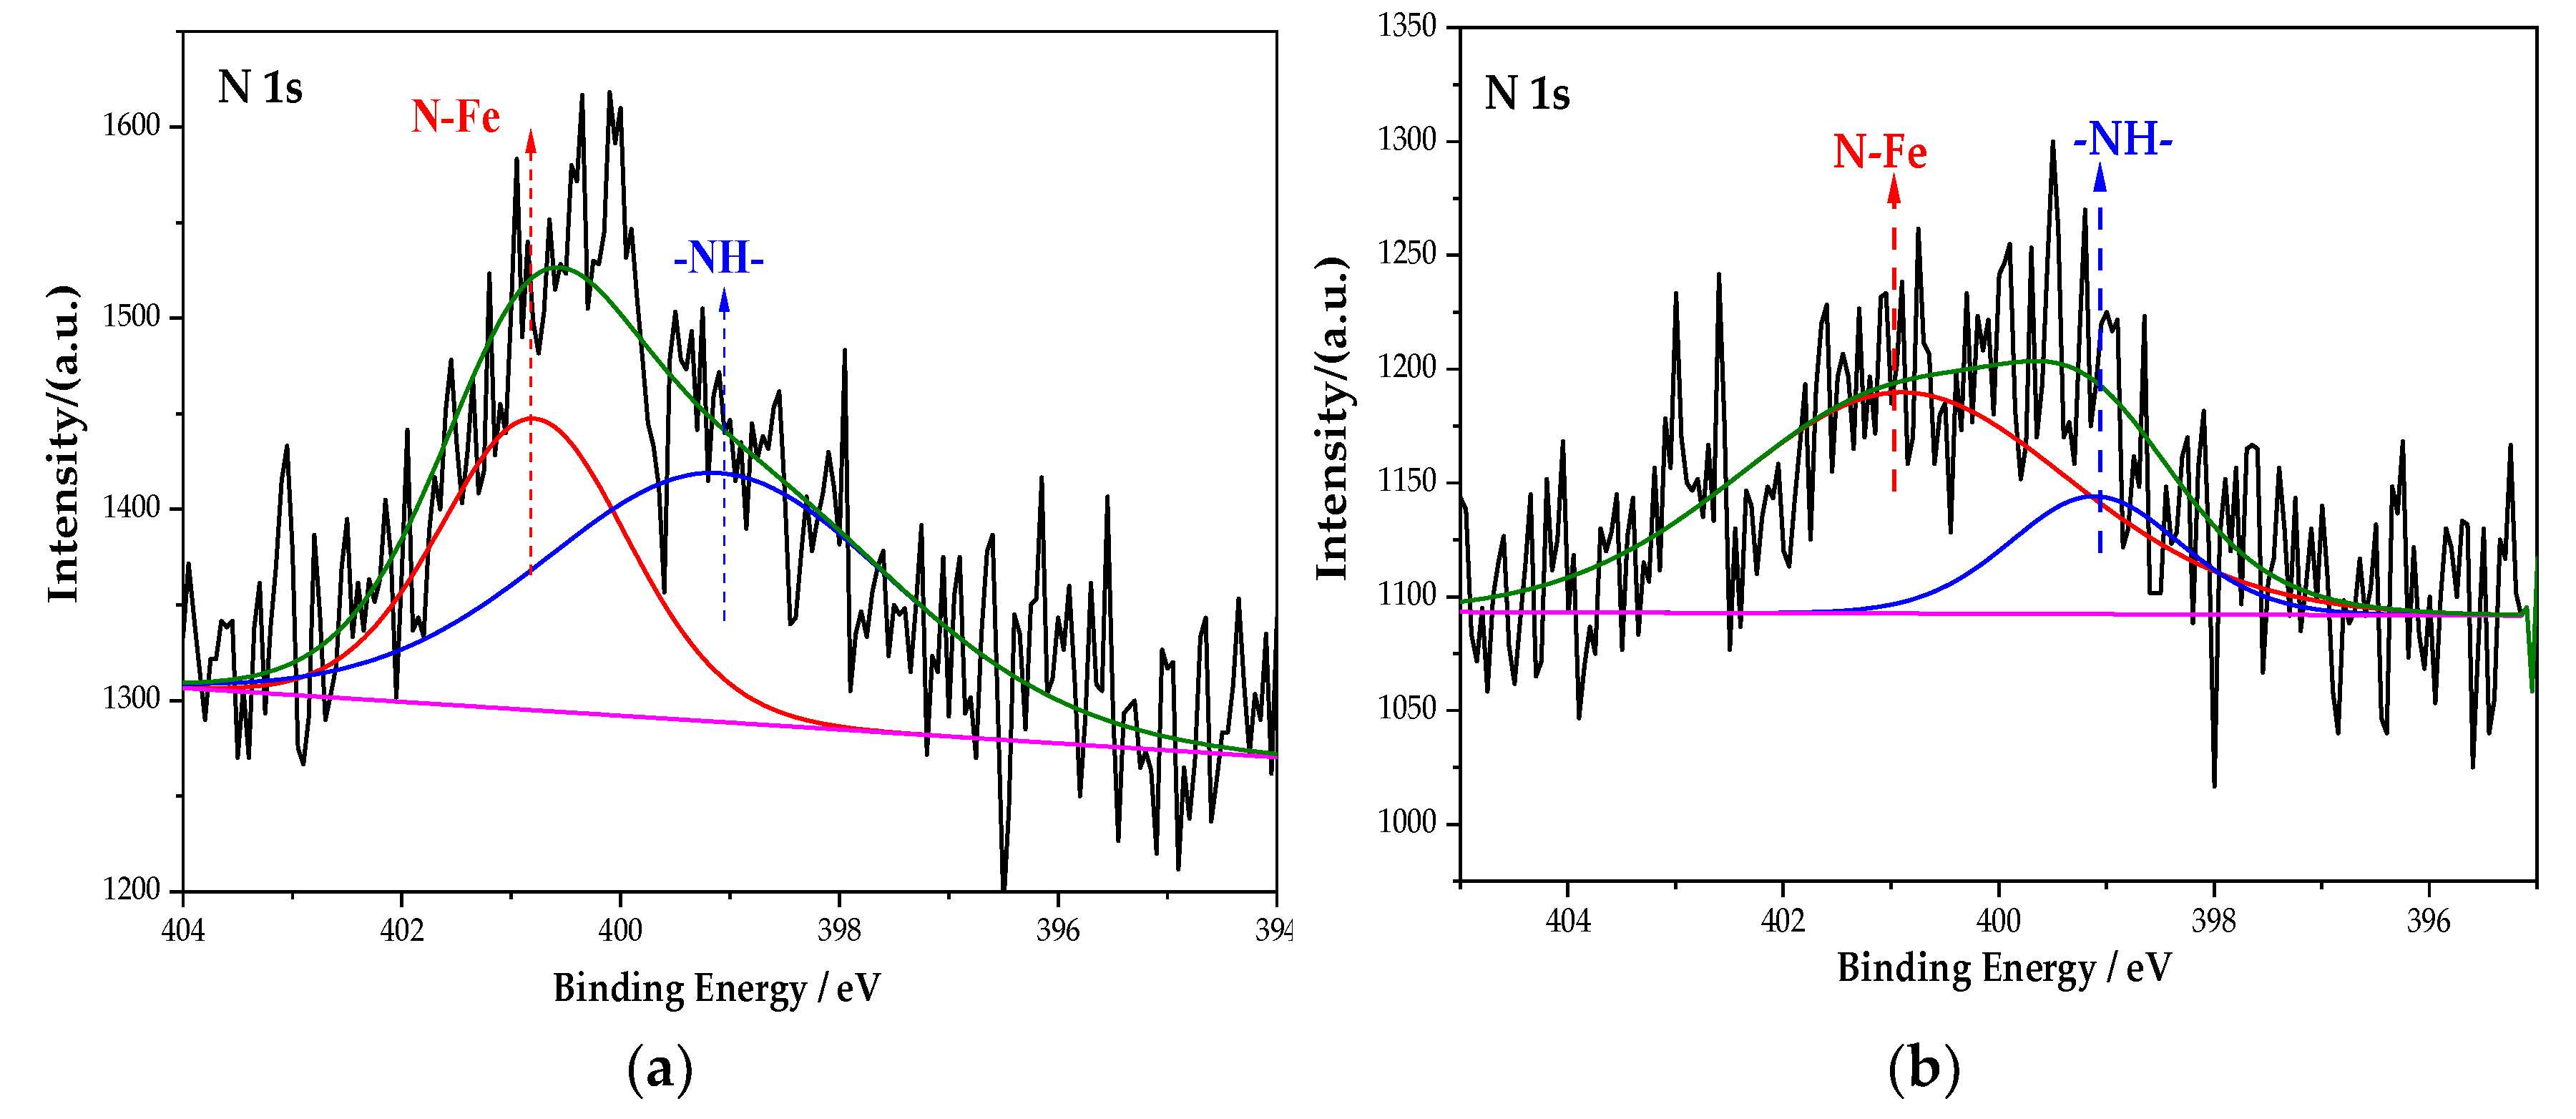
Figure 6 is the XPS spectrum of the N element of the passive film on the steel sample surface. After the peak fitting and comparing the N1s energy table, it can be seen that the N1s peaks correspond to the N–Fe and -NH- bonds, and the binding energy is 400.8 eV and 399.1 eV [33]. The peak fitting data of the N element are shown in Table 5. The type of rust inhibitor affects the content of the N–Fe and -NH- bonds. Only the groups containing BTA contain N–Fe and -NH- bonds. The above shows that the N–Fe bond is formed between BTA and steel sample. BTA attaches to the steel sample surface through this bond to form a dense adsorption film, which becomes a part of the passive film [34]. At the same time, BTA itself also combines with the steel sample. Because the coordination bonds between the hydrogen and nitrogen atoms are unstable in BTA, the lone electron pair existing in the N element is coordinated with d vacant orbital in Fe [35]. Since Fe is usually 6-coordinated, the chemical formula of this substance is C36H24FeN18, which is wrapped on the steel sample surface in the form of an adsorption film to improve the compactness of the passive film. The chemical structure of C36H24FeN18 is shown in Figure 7.
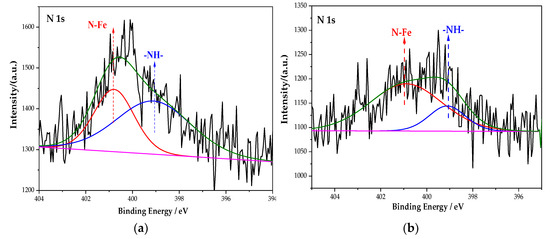

Figure 6.
XPS peak spectrum of the N element in the passive film under the action of different rust inhibitors. (a) BTA group. (b) Na2CrO4 + BTA group. (c) Na2MoO4 + BTA group.
Table 5.
Fitting data of N element in different test groups.
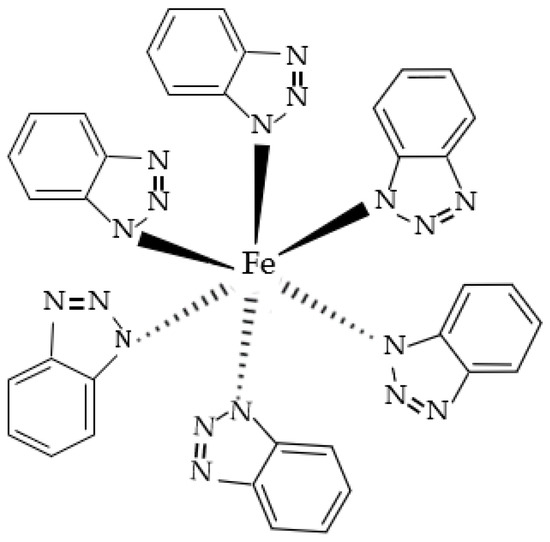
Figure 7.
Chemical structure of C36H24FeN18.
3.2.4. Analysis of the XPS Peak Fitting Spectrum of the Cr Element
Figure 8 is the XPS spectrum of the Cr element of the passive film on the steel sample surface. Comparing the energy level spectrum of Cr 2p in the NIST database, the composition of Cr in the passive film is mainly CrO3 and Cr2O3. After fitting, the peak fitting data of the Cr element are shown in Table 6. Compared with the single rust inhibitor, the passive film containing the Fe element is still mainly FeOOH when mixed with the composite rust inhibitor. However, the content of the substances corresponding to the Cr and N elements has changed dramatically. On the one hand, the content of Cr2O3 increases from 45.38% of the single rust inhibitor to 80.41% of the composite rust inhibitor. On the other hand, the N–Fe bond increases from 38.58% to 78.74%. The density of Cr2O3 is higher than that of CrO3, and it is more stable [36]. The chemical reaction formula of Cr2O3 is as follows (4) and (5):
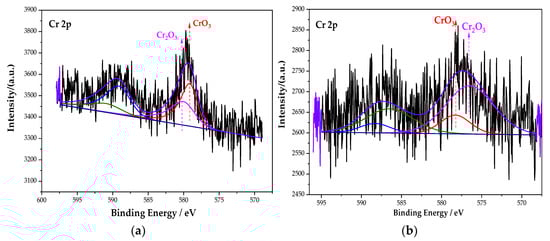
Figure 8.
XPS peak spectrum of the Cr element in the passive film under the action of different rust inhibitors. (a) Na2CrO4 group. (b) Na2CrO4 + BTA group.
Table 6.
Fitting data of the Cr element in different groups.
The increase in Cr2O3’s content optimizes the compactness of the passive film. It can be seen from Section 3.2.3 that the increase in the content of the N–Fe bond can promote more BTA to be adsorbed on the steel sample surface and contribute to the formation of the BTA adsorption film. The above explanation indicates that, under the interaction of Na2CrO4 and BTA, the passive film is denser than that of the single rust inhibitor. The composite action of Na2CrO4 and BTA can effectively prevent the corrosion of the steel sample, and the inhibition efficiency is effectively improved.
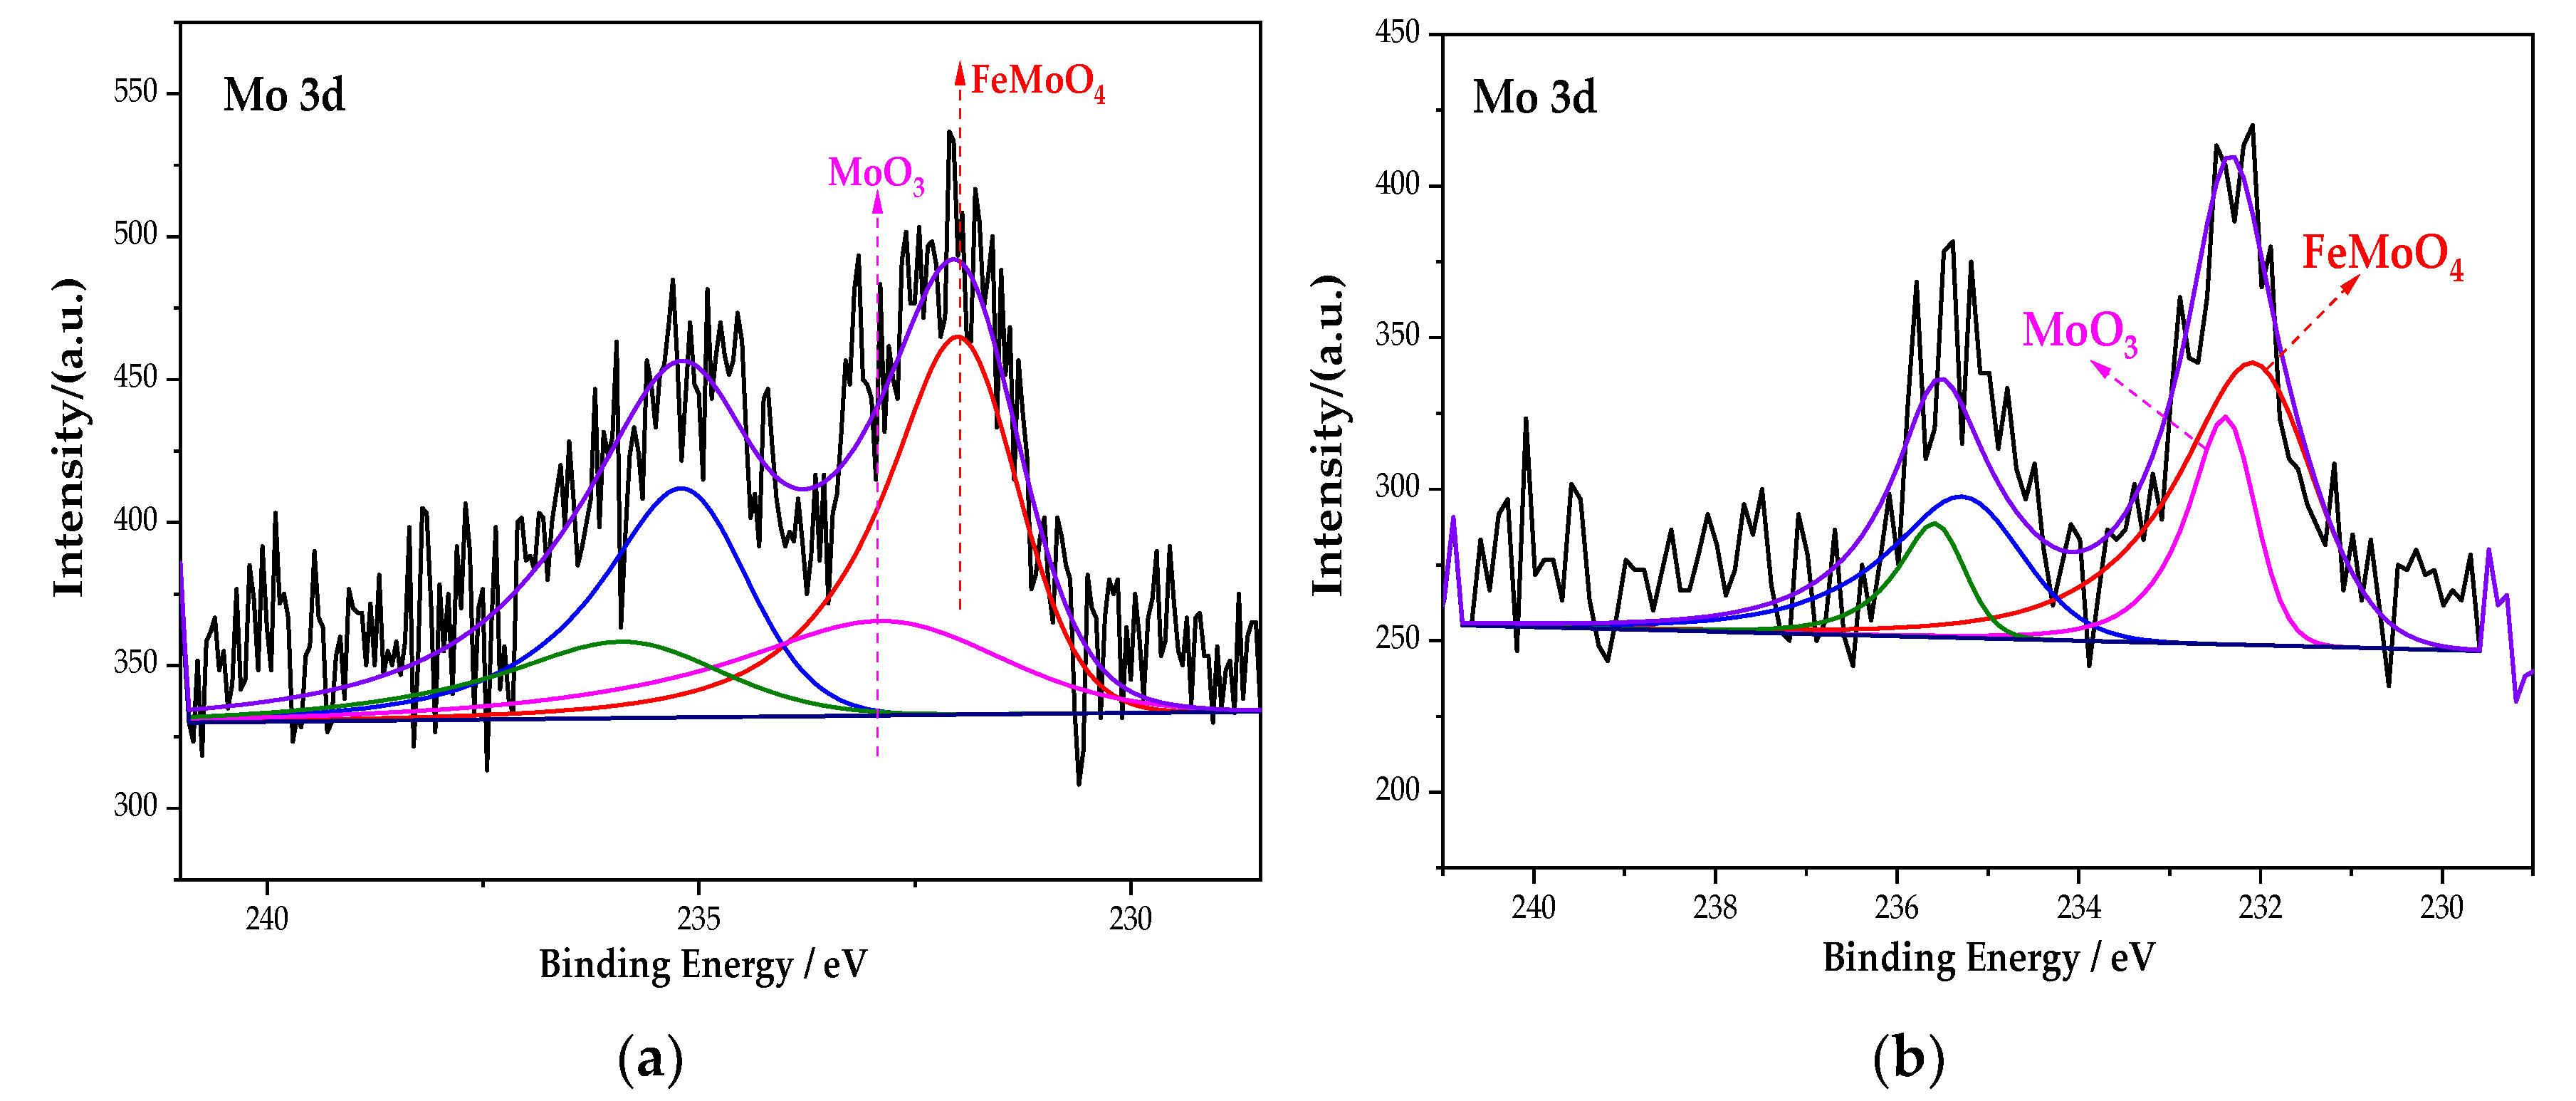
3.2.5. Analysis of the XPS Peak Fitting Spectrum of the Mo Element
Figure 9 is the XPS spectrum of the Mo element of the passive film on the steel sample surface. Figure 9 shows that the peak curve of Mo 3d consists of FeMoO4 and MoO3. After fitting, the peak fitting data of the element Mo are shown in Table 7. The peak binding energy of FeMoO4 is 232.1 eV [37]. Compared with the single rust inhibitor, the passivation substances content of each element changed dramatically under the combined action of Na2MoO4 and BTA. For the Fe element, the content of Fe3O4 increases to 48.29%, while FeOOH decreases to 38.26%. For the Mo element, FeMoO4 increases from 66.7% to 71.29%. In addition, the N–Fe bond also increases, because the ion–dipole interaction is generated after MoO42− is adsorbed on the steel sample. Additionally, the ion–dipole interaction can promote more BTA to be adsorbed on the steel sample surface [38]. Additionally, this process is conducive to the formation of an adsorption film. It indicates that, under the interaction of Na2MoO4 and BTA, although the oxide content of Mo decreases, the adsorption capacity of BTA is improved with the formation of FeMoO4. At the same time, the passivation of iron is denser too. Compared with the interaction of Na2CrO4 and BTA, the passive film is more complete and denser. The rust resistance effect is the best in the Na2MoO4 + BTA group.
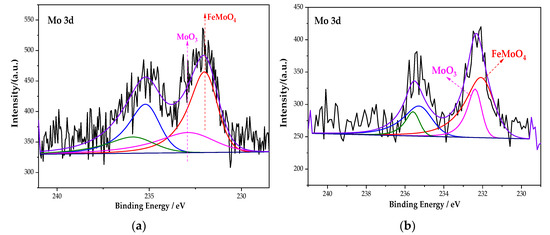
Figure 9.
XPS peak spectrum of the Mo element in the passive film under the action of different rust inhibitors. (a) Na2MoO4 group. (b) Na2MoO4 + BTA group.
Table 7.
Fitting data of the Mo element in different groups.
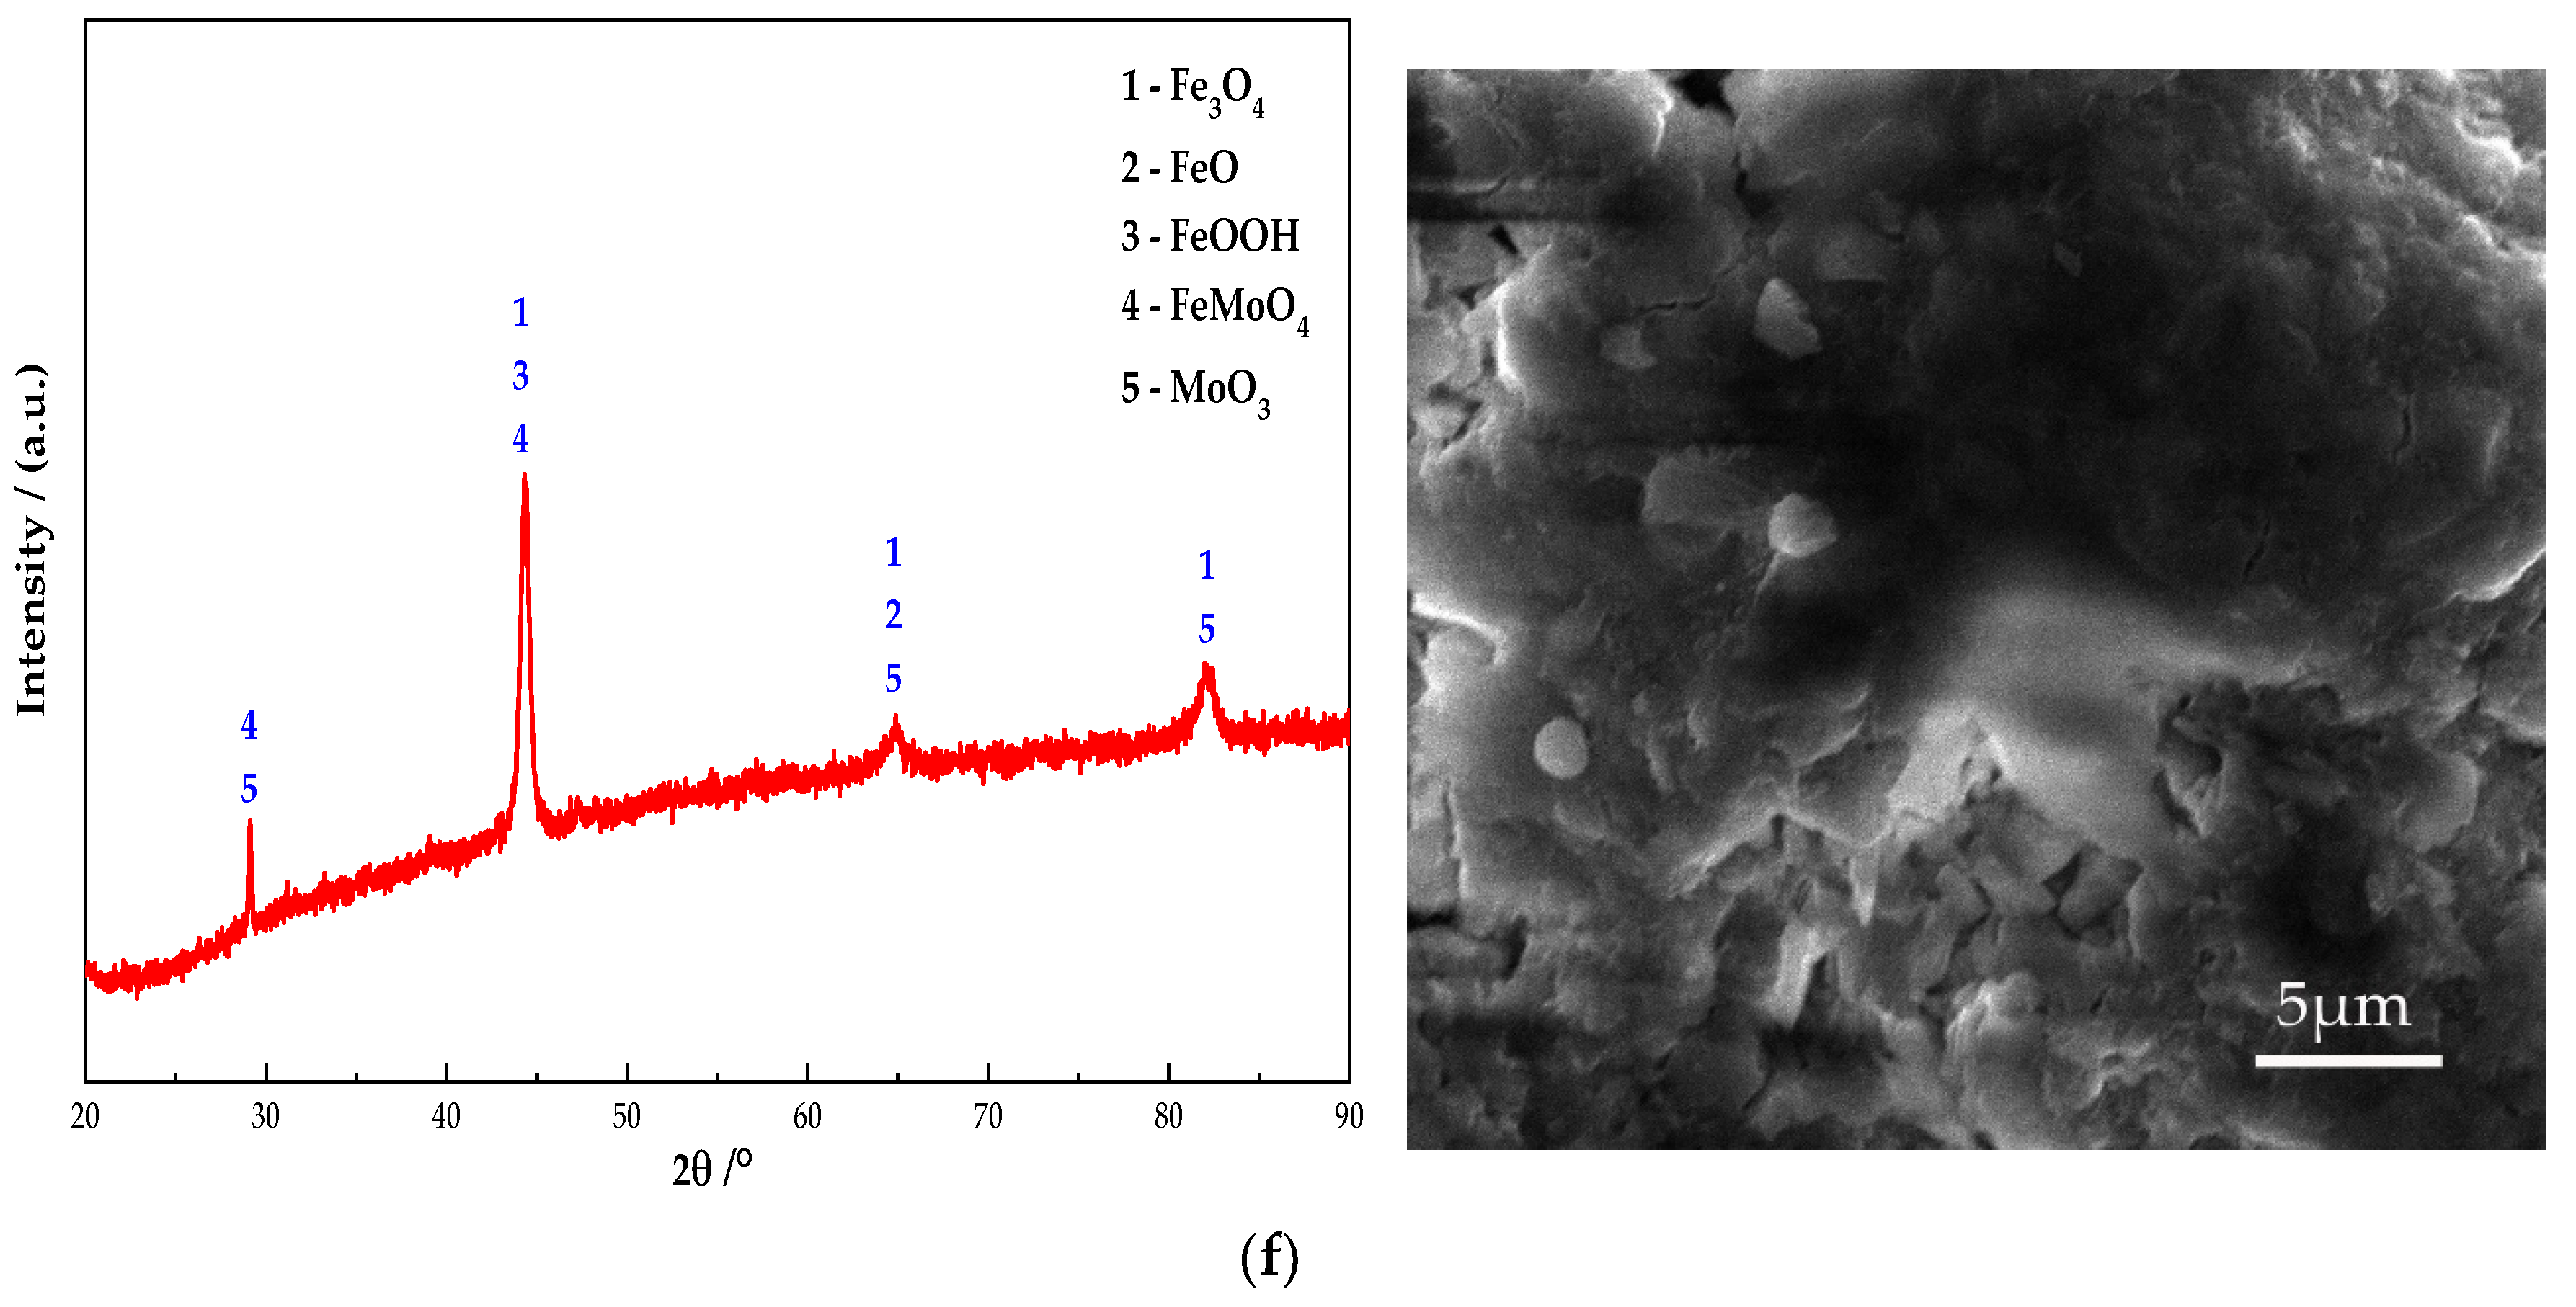
3.3. XRD Analysis of the Sample Passive Film
Figure 10 shows the electron microscope at 10 K magnification image and XRD pattern of the passive film on the steel sample surface. It can be seen from Figure 10 that Fe oxides are present in obvious diffraction peaks in each group. Additionally, the main component of the passive film on the steel sample surface is Fe oxides. In addition, the Na2CrO4 group detects a mixture of CrO3 and Fe0.5Cr0.5. The existence of iron shows that the passive film does not completely wrap the steel sample. At the same time, some cracks can be found in the passive film from the SEM. It shows that the inhibition efficiency of Na2CrO4 is low. The group of Na2MoO4 detects FeMoO4 and MoO3 and does not detect Fe element. This indicates that a complete passive film was formed and the steel sample is in the state of complete passivation. The surface of passive film is relatively smooth. Additionally, it also verifies that the rust resistance of Na2MoO4 is stronger than that of Na2CrO4 [30]. The diffraction peaks of Fe in the groups mixed with BTA are mainly Fe3O4 and FeOOH, and the content of Fe3O4 is higher than that of the anodic rust inhibitor. Since XRD is mainly used to determine the crystal structure of inorganic compounds, the determination of BTA adsorption film substances is mainly based on XPS results. Cr2O3 and CrO1.01 are detected in the group mixed with Na2CrO4 and BTA. The Mo compounds in the group mixed with Na2MoO4 and BTA include MoO3 and FeMoO4, and there is no Fe element. This indicates that the composition of the passive film is relatively dense when Na2MoO4 and BTA are mixed. The XRD scanning results are consistent with the XPS analysis. In addition, from the SEM figure, it can be observed that the passive film in the DMEA group has a long crack, and the chloride ion erosion has caused a certain damage to the passive film structure. After comparison, the DMEA has the worst inhibition efficiency. Under the combined action of the rust inhibitor, the passive film contains granular substances and presents a multi-level structure, indicating that, in addition to the iron compound, there is also a BTA adsorption film. The structure of passive film is denser than that of single rust inhibitors. However, compared with the composite Na2CrO4 and BTA group, the composite Na2MoO4 and BTA group embeds some massive materials on the steel sample surface. Combined with XRD, they are inferred to be FeMoO4. When mixed with Na2MoO4 and BTA, the passive film is smoother, the hierarchical structure is better, and the inhibition efficiency is the highest.
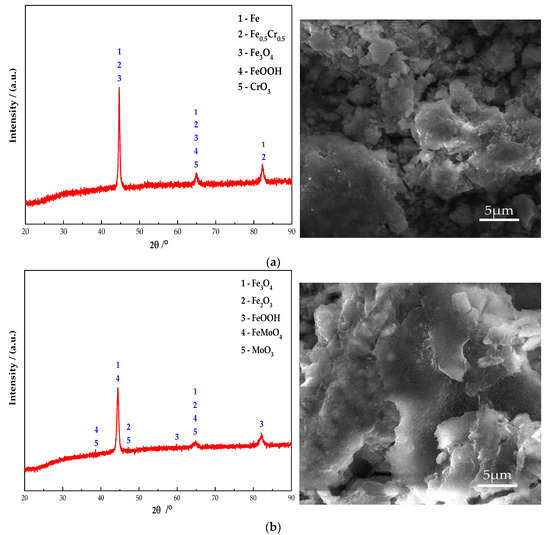
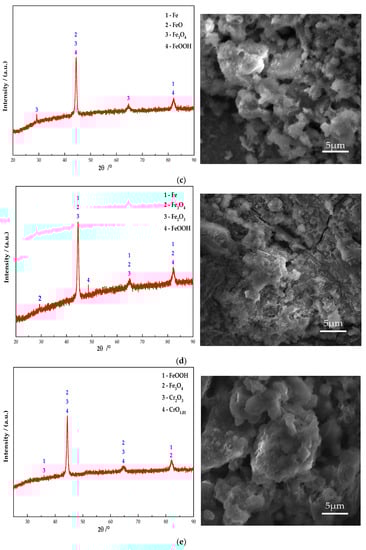

Figure 10.
XRD patterns and micromorphology of the passive film on the steel sample surface under the action of different rust inhibitors. (a) Na2CrO4 group. (b) Na2MoO4 group. (c) BTA group. (d) DMEA group. (e) Na2CrO4 + BTA group. (f) Na2MoO4 + BTA group.
3.4. Inhibition Efficiency of the Rust Inhibitor
The inhibition efficiency can clearly reflect the rust resistance of rust inhibitors. Table 8 shows the inhibition efficiency of different types of rust inhibitors. It can be seen that the rust resistance of composite rust inhibitors is better than that of single rust inhibitors [22]. The composite rust inhibitor inhibits the dissolution of the anode and provides a protective barrier for the cathode. It could not cause the pitting corrosion of the steel bar. The inhibition efficiency of Na2MoO4 and BTA is the best. Additionally, DMEA has the lowest inhibition efficiency. This is because DMEA is liquid, and the test process cannot fully ensure the uniform distribution of liquid on the steel sample. This reason may lead to an uneven concentration distribution around the steel sample and reduce the rust resistance of the film formed by physical and chemical action. According to the inhibition efficiency, the rust resistance effect: Na2MoO4 + BTA > Na2CrO4 + BTA > BTA > Na2MoO4 > Na2CrO4 > DMEA.
Table 8.
Inhibition efficiency of the rust inhibitor.
4. Conclusions
The effects of different types of rust inhibitors on the microstructure characteristics of the passive film on the steel bar surface and the inhibition efficiency of the steel bar in a simulated chloride concrete pore solution were investigated. The rust inhibitor participated in the formation of a passive film and effectively delayed the occurrence of steel bar corrosion. The passive film was primarily composed of iron compounds, but it also contained an oxide film and an adsorption film formed on the surface of the steel bar by the rust inhibitor. The rust resistance effect of composite rust inhibitors was better than that of single rust inhibitors. The passive film mixed with Na2MoO4 and BTA together had the highest compactness, largest impedance, and highest inhibition efficiency. The rust resistance effect was: Na2MoO4 + BTA > Na2CrO4 + BTA > BTA > Na2MoO4 > Na2CrO4 > DMEA.
Author Contributions
Conceptualization, Q.G. and N.L.; methodology, Q.G. and X.L.; validation, X.L. and N.L.; formal analysis, J.L. and N.L.; investigation, J.L. and X.L.; resources, J.L.; data curation, N.L.; writing—original draft preparation, Q.G.; writing—review and editing, J.L.; visualization, Q.G.; supervision, J.L.; project administration, X.L.; funding acquisition, J.L. All authors have read and agreed to the published version of the manuscript.
Funding
This research was funded by [National Natural Science Foundation of China] grant number [52178223, 51778302]. This research was funded by [Construction and scientific research projects of Zhejiang Province] grant number [2021K065]. This research was funded by [General scientific research project from education department of Zhejiang Province] grant number [Y202146609].
Institutional Review Board Statement
Not applicable.
Informed Consent Statement
Not applicable.
Data Availability Statement
Since the experiment was completed with the support of Qingdao Agricultural University, the data used to support the results of this study are available from the responsible person and the author upon request.
Conflicts of Interest
The authors declare no conflict of interest.
References
- Stephen, S.; Edward, G.; Paul, B.R. Microscale miniaturisation of chloride ion detection sensors for long-term embedding in reinforced concrete structures. Struct. Control. Health Monit. 2021, 28, 2834. [Google Scholar]
- Ueli, M.; Angst, B.E. The size effect in corrosion greatly influences the predicted life span of concrete infrastructures. Sci. Adv. 2017, 3, e1700751. [Google Scholar]
- Shang, H.S.; Yang, J.X.; Huang., Y.; Fan, L.; Wang, R. Study on the bond behavior of steel bars embedded in concrete under the long-term coupling of repeated loads and chloride ion erosion. Constr. Build. Mater. 2022, 323, 126498. [Google Scholar] [CrossRef]
- Li, B.; Yin, H.G.; Mao, X.B.; Li, Y.; Zhang, L.; Liu, R.; Qiu, P. Macroscopic and microscopic fracture features of concrete used in coal mine under chlorine salt erosion. Int. J. Min. Sci. Technol. 2015, 26, 455–459. [Google Scholar] [CrossRef]
- Scott, A.; Alexander, M.G. Effect of supplementary cementitious materials (binder type) on the pore solution chemistry and the corrosion of steel in alkaline environments. Cem. Concr. Res. 2016, 89, 25–55. [Google Scholar] [CrossRef]
- Wang, Y.; Chen, R.; Hu, J.; Zhang, Z.; Huang, H.; Ma, Y.; Wei, J.; Zhang, Z.; Yin, S.; Wang, H.; et al. Surface characteristics and electrochemical behaviors of passive reinforcing steel in alkali-activated slag. Corros. Sci. 2021, 190, 109657. [Google Scholar] [CrossRef]
- Alhozaimy, A.; Hussain, R.R.; Al-Negheimish, A.; Al-Zaid, R.; Singh, D.D.N. Effect of Simulated Concrete Pore Solution Chemistry, Chloride Ions, and Temperature on Passive Layer Formed on Steel Reinforcement. ACI Mater. J. 2014, 111, 411–421. [Google Scholar] [CrossRef]
- Huet, B.; Hostis, V.L.; Miserque, F.; Idrissi, H. Electrochemical behavior of mild steel in concrete: Influence ofp H and carbonate content ofconcrete pore solution. Electrochim. Acta 2010, 51, 172–180. [Google Scholar] [CrossRef]
- Cheewaket, T.; Jaturapitakkul, C.; Chalee, W. Initial corrosion presented by chloride threshold penetration of concrete up to 10year-results under marine site. Constr. Build. Mater. 2012, 37, 693–698. [Google Scholar] [CrossRef]
- Wang, H.; Shi, F.; Shen, J.; Zhang, A.; Zhang, L.; Huang, H.; Liu, J.; Jin, K.; Feng, L.; Tang, Z. Research on the self-sensing and mechanical properties of aligned stainless steel fiber-reinforced reactive powder concrete. Cem. Concr. Compos. 2021, 119, 104001. [Google Scholar] [CrossRef]
- Tristijanto, H.; Ilman, M.N.; Iswanto, P.T. Corrosion Inhibition of Welded of X-52 Steel Pipelines by Sodium Molybdate in 3.5% NaCl Solution. Egypt. J. Pet. 2020, 29, 155–162. [Google Scholar] [CrossRef]
- Liu, J.; Wang, H.; Zhang, A.; Zhang, L.; Han, Y.; Shu, H.; Wang, J. Study on the influence of compound rust inhibitor on corrosion of steel bars in chloride concrete by electrical parameters. Constr. Build. Mater. 2020, 262, 120763. [Google Scholar]
- Gartner, N.; Kosec, T.; Legat, A. The efficiency of a corrosion inhibitor on steel in a simulated concrete environment. Mater. Chem. Phys. 2016, 184, 31–40. [Google Scholar] [CrossRef]
- Söylev, T.A.; Richardson, M.G. Corrosion inhibitors for steel in concrete: State-of-the-art report. Constr. Build. Mater. 2008, 22, 609–622. [Google Scholar] [CrossRef]
- Tavassolian, R.; Moayed, M.H.; Taji, I. Mechanistic Investigation on the Effect of Molybdate on the Critical Pitting Temperature of 2205 Duplex Stainless Steel. J. Electrochem. Soc. 2019, 166, 101–107. [Google Scholar] [CrossRef] [Green Version]
- Soeda, K.; Ichimura, T. Present state of corrosion inhibitors in Japan. Cem. Concr. Compos. 2003, 25, 117–122. [Google Scholar] [CrossRef]
- Holloway, L.; Nairn, K.; Forsyth, M. Concentration monitoring and performance of a migratory corrosion inhibitor in steel-reinforced concrete. Cem. Concr. Res. 2004, 34, 1435–1440. [Google Scholar] [CrossRef]
- Kioumrsi, M.M.; Hendriks, M.A.N.; Kohler, J.; Geiker, M.R. The effect of interference of corrosion pits on the failure probability of a reinforced concrete beam. Eng. Struct. 2016, 114, 113–121. [Google Scholar] [CrossRef]
- Tang, Z. A review of corrosion inhibitors for rust preventative fluids. Curr. Opin. Solid State Mater. Sci. 2019, 23, 100759. [Google Scholar] [CrossRef]
- Odewunmi Nurudeen, A.; Mazumder Mohammad, A.J.; Aldahdooh Mohammed, K.; Ali Shaikh, A. N1,N1,N12,N12-Tetramethyl-N1,N12-dioctyldodecane-1,12-diaminium bromide: Its synthesis and application in inhibition of mild steel corrosion in 15% HCl. J. Mol. Liq. 2021, 338, 116630. [Google Scholar] [CrossRef]
- Okeniyi, J.O.; Omotosho, O.A.; Ajayi, O.O.; Loto, C.A. Effect of potassium-chromate and sodium-nitrite on concrete steel-rebar degradation in sulphate and saline media. Constr. Build. Mater. 2014, 50, 448–456. [Google Scholar] [CrossRef]
- Lin, B.; Zuo, Y. Inhibition of Q235 carbon steel by calcium lignosulfonate and sodium molybdate in carbonated concrete pore solution. Molecules 2019, 24, 518. [Google Scholar] [CrossRef] [PubMed] [Green Version]
- Zhang, L.; Zhang, A.; Li, K.; Wang, Q.; Liu, J.; Wang, H. Influence of Rust Inhibitor on the Corrosion Resistance of Reinforcement in Cement Paste with Chloride. Coatings 2021, 11, 606. [Google Scholar] [CrossRef]
- Ryu, H.S.; Singh, J.K.; Yang, H.M.; Lee, H.S.; Ismail, M.A. Evaluation of corrosion resistance properties of N, N′-Dimethyl ethanolamine corrosion inhibitor in saturated Ca(OH)2 solution with different concentrations of chloride ions by electrochemical experiments. Constr. Build. Mater. 2016, 114, 223–231. [Google Scholar] [CrossRef]
- Liu, R.; Jiang, L.; Xu, J.; Xiong, C.; Song, Z. Influence of carbonation on chloride-induced reinforcement corrosion in simulated concrete pore solutions. Constr. Build. Mater. 2014, 56, 16–20. [Google Scholar] [CrossRef]
- Moreno, M.; Morris, W.; Alvarez, M.; Duffó, G. Corrosion of reinforcing steel in simulated concrete pore solutions: Effect of carbonation and chloride content. Corros. Sci. 2004, 46, 2681–2699. [Google Scholar] [CrossRef]
- Agiriga, C.E.; Oguzie, E.; Chidiebere, A.; Okorocha, N.J.; Chikwe, R.N. Corrosion inhibition action of Landolphia heudelotii on mild steel in acidic media. Pigment Resin Technol. 2020, 49, 387–392. [Google Scholar] [CrossRef]
- Hussain, R.R.; Singh, J.K.; Alhozaimy, A.; Al-Negheimish, A.; Bhattacharya, C.; Pathania, R.S.; Singh, D.D.N. Effect of Reinforcing Bar Microstructure on Passive Film Exposed to Simulated Concrete Pore Solution. ACI Mater. J. 2018, 115, 181–190. [Google Scholar] [CrossRef]
- Ghods, P.; Isgor, B.; Bensebaa, F.; Kingston, D. Angle-resolved XPS study of carbon steel passivity and chloride-induced depassivation in simulated concrete pore solution. Corros. Sci. 2012, 58, 159–167. [Google Scholar] [CrossRef]
- Gaithersburg. NIST X-ray photoelectron spectroscopy database. Natl. Inst. Stand. Technol. 2013, 12, 250–258. [Google Scholar]
- González, J.A.; Feliú, S.; Rodríguez, P.; Ramírez, E.; Alonso, C.; Andrade, C. Some questions on the corrosion of steel in concrete—Part I: When, how and how much steel corrodes. Mater. Struct. 1996, 29, 40–46. [Google Scholar] [CrossRef]
- Wang, Y.-Q.; Kong, G.; Che, C.-S.; Zhang, B. Inhibitive effect of sodium molybdate on the corrosion behavior of galvanized steel in simulated concrete pore solution. Constr. Build. Mater. 2018, 162, 383–392. [Google Scholar] [CrossRef]
- Tang, Y.; Zhang, F.; Hu, S.; Cao, Z.; Wu, Z.; Jing, W. Novel benzimidazole derivatives as corrosion inhibitors of mild steel in the acidic media. Part I: Gravimetric, electrochemical, SEM and XPS studies. Corros. Sci. 2013, 74, 271–282. [Google Scholar] [CrossRef]
- Liu, T.; Li, W.; Zhang, C.; Wang, W.; Dou, W.; Chen, S. Preparation of highly efficient self-healing anticorrosion epoxy coating by integration of benzotriazole corrosion inhibitor loaded 2D-COF. J. Ind. Eng. Chem. 2021, 97, 560–573. [Google Scholar] [CrossRef]
- Khadom, A.A. Protection of Steel Corrosion Reaction by Benzotriazoles: A Historical Background. J. Fail. Anal. Prev. 2015, 15, 794–802. [Google Scholar] [CrossRef]
- Abd El Wanees, S.; Nooh, S.; Farouk, A. Corrosion inhibition of aluminum in sodium hydroxide solutions using some inorganic anions. J. Dispers. Sci. Technol. 2021, 1–16. [Google Scholar] [CrossRef]
- Zhang, H.L.; Shen, J.Y.; Ge, X. A study of in-situ Mossbauer spectroscopy on Fe-Mo oxides for selective oxidation of toluene. Hyperfine Interact. 1992, 69, 859–862. [Google Scholar] [CrossRef]
- Zhou, Y.; Zuo, Y.; Lin, B. The compounded inhibition of sodium molybdate and benzotriazole on pitting corrosion of Q235 steel in NaCl + NaHCO3 solution. Mater. Chem. Phys. 2017, 192, 86–93. [Google Scholar] [CrossRef]


Publisher’s Note: MDPI stays neutral with regard to jurisdictional claims in published maps and institutional affiliations. |
© 2022 by the authors. Licensee MDPI, Basel, Switzerland. This article is an open access article distributed under the terms and conditions of the Creative Commons Attribution (CC BY) license (https://creativecommons.org/licenses/by/4.0/).