Article

Modeling Technology of Bonded Particle Model for Gold Ore and Its Validation Based on Drop Weight Test

1
School of Mechatronics Engineering, Henan University of Science and Technology, Luoyang 471003, China
2
Longmen Laboratory, Luoyang 471003, China
3
School of Mechanical and Mining Engineering, University of Queensland, Brisbane 4702, Australia
4
Henan Key Laboratory for Machinery Design and Transmission System, School of Mechatronics Engineering, Henan University of Science and Technology, Luoyang 471003, China
*
Author to whom correspondence should be addressed.
Coatings 2022, 12(6), 731; https://doi.org/10.3390/coatings12060731
Submission received: 16 April 2022 / Revised: 24 May 2022 / Accepted: 24 May 2022 / Published: 25 May 2022
(This article belongs to the Special Issue Mechanical Bionic and Bio-Inspired Interface Materials)

Abstract

:
In recent years, studies have focused mainly on the selection of appropriate parameters for ore crushing technology to achieve optimal distributions of particle sizes. The control of particle sizes in mineral processing plays a significant role in improving mineral separation efficiency. The discrete element method (DEM) is an effective numerical simulation method for studying the process of mineral crushing, which can deal with the problem of deformation and movement of discontinuities, that is, the problem of cracks caused by mineral crushing, which is difficult to be solved by traditional continuum mechanics simulation methods. Additionally, the transformation of a mechanical model from continuum to discontinuum mechanics can be realized simply and effectively, so the discrete element method has obvious advantages in the simulation of mineral crushing. However, the accuracy of the DEM simulation is highly dependent on the mathematical models used. In this paper, methodologies for selecting particle sizes and inter-particle bond energy are proposed based on the results of the drop weight test carried out in the laboratory. Particle sizes and inter-particle bond energy are the key parameters for bonded particle model used in discrete element simulation. The suitable parameters proposed by methodologies were applied to construct the bonded particle model for the ore, and its particle size distribution was obtained by simulating the impact crushing process using DEM. The particle size distributions obtained from both the DEM simulation and the drop weight test were in good agreement. The average errors under the three impact energies were 1.96%, 3.31%, and 1.66%, which indicated that the modeling technique proposed in this paper can represent the crushing characteristics of ore materials and improve the accuracy of the DEM simulation. It lays the foundation for guiding the reasonable selection of grinding process parameters and mill equipment.

1. Introduction

Mineral processing plays an important role in the mining, metallurgy, cement, and chemical industries. The control of the particle size in mineral crushing is a key factor that affects the mineral processing efficiency and product performance [1,2,3,4,5]. The particle sizes in mineral processing depended on many factors, including grinding equipment and the process parameters, such as lining structure, grinding medium shape, distribution of grinding media, filling rate, and feed amount. In addition, characteristics of minerals are also important factors directly affecting the crushing process.
Due to the complexity and diversity of minerals, different tests should be carried out in advance to test the characteristics of minerals and formulate appropriate grinding processes [6,7,8,9,10,11]. However, due to the differences between any test environment and the production environment, the test characteristics are different from the actual mineral properties in the field. Therefore, a simulation method is often used to study the crushing characteristics of materials. The discrete element method (DEM) is a method for the analysis of granular dispersions [12,13,14]. It can effectively simulate the crushing process of materials and has been widely used in the simulation of material characteristics [15,16,17,18]. Additionally, it has been proved to be effective in such simulations [19,20,21].
The discrete element method (DEM) is an analytical method for granular discrete bodies. The core idea is to separate discontinuities into sets of rigid elements. The time iteration method is used to solve the motion of each rigid element, and then the whole motion behavior of a discontinuous body is obtained. DEM can be used to simulate the mineral crushing process effectively. The bonded particle model (BPM) and fragment replacement method (FRM) are two well-known modeling methods for mineral crushing [22,23]. The FRM uses a group of unbonded small particles to replace the broken large particles directly while meeting the preset particle failure rule. The BPM binds certain number basic particles with different sizes to form large breakable particles, which simulates the crushing process through the fracturing of the bonds. DEM based on BPM with suitable parameters could be used to simulate a crushing process while considering mineral particle size and strength.
Mathematical models, including the spring-tetrahedral element model, which is suitable for multi-body particle crushing; models based on fractal dimension; and the condensed particle rapid generation model, have been developed by different researchers [24,25,26,27]. The crushing characteristics of ore, such as the interlayer crushing characteristics of marble, rock compression crushing characteristics, and resilient properties of soil–rock mixture materials have also been studied [28,29,30].
From the above studies, it can be seen that the particle crushing modeling is mainly focused on the research on the crushing characteristics of materials with specific structures and the evaluation of the crushing effect. Less consideration is given to the changeable mechanical properties of the ore. There is no unified method to select the appropriate model parameters for DEM simulations. There is a big gap between the particle crushing models and the actual crushing process because there are few studies on the correlation between single particle crushing models and the crushing of particles during the grinding process.
In order to solve the problem of breakage simulation distortion caused by inaccurate material modeling, the characteristic parameters of BPM were determined based on the results of a drop weight test. The selection method of bond parameters and the particle size composition of material modeling were analyzed and optimized. A crushing simulation of the BPM was designed, and the particle size distribution of the crushing simulation was compared with the results obtained from the drop weight test to verify the effectiveness of the model. The first section is the introduction, the second is the introduction of the principles of the bonded particle model, the third shows the drop weight test, the fourth presents the method to determine the parameters of the model and the crushing simulation, the fifth presents the analysis of the simulation results, and the sixth presents the conclusions.

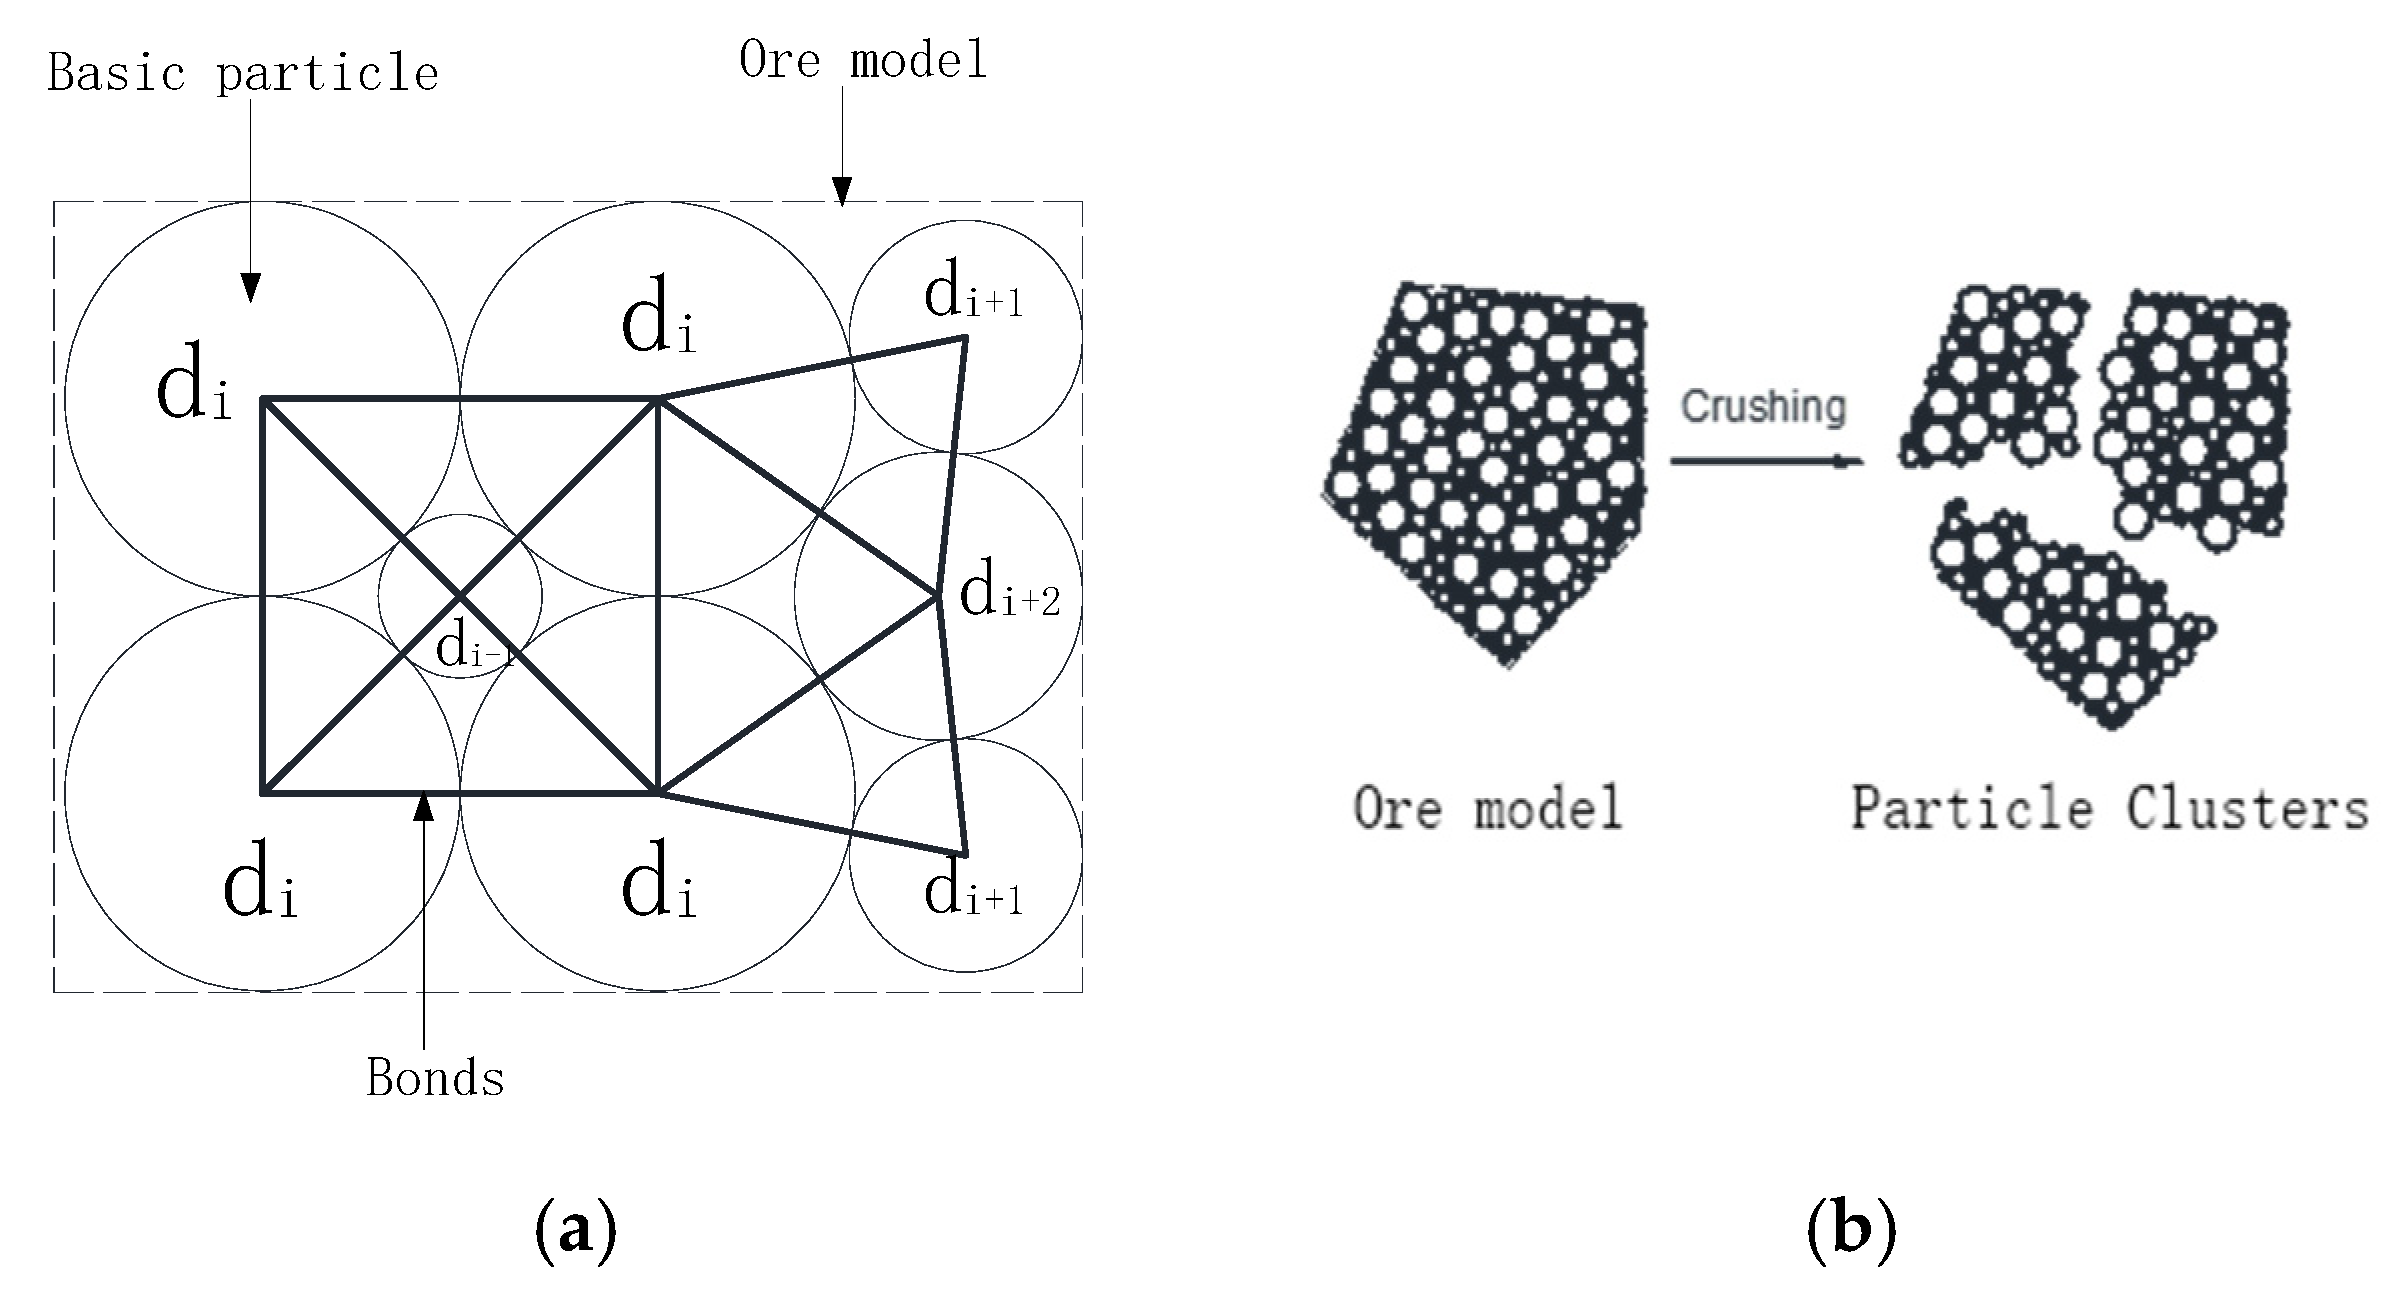
2. Bonded Particle Model

The BPM model was proposed by Cundall and Potyondy in 2004, and mineral crushing was modeled and simulated by using particle flow code (PFC2D and PFC3D). They compared their simulation results with the experimental results and found the BPM they developed was effective for mineral crushing simulations. The application of BPM requires parameters such as particle size, bond stiffness, and strength. By selecting the appropriate parameters, the model can characterize the crushing characteristics of the actual ore [31]. PFC2D and PEC3D have been used by many researchers to study the influences of the changes in model parameters on the accuracy of crushing simulations. Simulations of various minerals have been conducted, such as marble and sandstone. The results showed that for estimating strength, elastic modulus, stiffness, and other parameters, the test calibration method is effective [32]. To improve the accuracy of simulations in 3D modeling, Cundall and Potyondy optimized the particle connection mode of the BPM, and the flat-joint model was proposed [33,34]. The improved model has been recognized by researchers [6]. With the development of discrete element technology, various new software (different from PFC2D and PFC3D) has been developed. In this paper, DEM is used to study mineral crushing process. The DEM can directly show the change in particle size after crushing, and can more intuitively analyze the change of particle size distribution parameters after crushing. In our DEM, the BPM model is the particle crushing model.
BPM is a direct modeling method to construct a rock mechanics model according to the damage development and fracture process. It binds a certain number of basic particles to form aggregates through bond formation. When the bond failure between basic particles reaches a certain amount, the particle aggregates break down [35]. Small particles bonded together are called basic particles, and they can have a variety of particle diameters. The basic particles of various sizes constitute the basic particle group, and the adjacent particles are connected by bonds to form the mineral model. Figure 1a shows the structure of the BPM, where the ore model is represented by the dotted line. The ore model is composed of basic particles connected by bonds, and the basic particles with different particle sizes, di−1, di, di+1, and di−2, constitute the basic particle group. The basic particle group can make the size of the broken cluster more diverse than a single basic particle diameter in the BPM, thereby making the broken particle size distribution obtained by a simulation more in line with reality. The values of bond parameters between particles with different particle sizes in the basic particle group can differ. These can be characterized by the variability of the internal mechanical properties of the ore. The crushing process of BPM is shown in Figure 1b. The key parameters of BPM include basic particle diameter and interparticle bonds. The particle size selection directly represents the smallest particle size obtained after crushing. The bonds between particles have a decisive influence on the difficulty of crushing and the particle size distribution after crushing.
The BPM mimics the mechanical behavior of a collection of grains joined by cement. It is characterized by particle shape and size distribution, and some microscopic properties of the bonds. The particle is spherical in shape, and it can have a single size, or it can fulfill the criteria of uniform particle size distribution defined by Dmin and Dmax. Each part of the cemented contact based on the cement is called a bond. A bond can be regarded as a beam in the model, and the following five microscopic parameters describe its force-displacement behavior: normal and shear stiffness (kn and ks), critical tensile stress and shear stress (σc and τc) per unit area, and bond radius r0. These parameters define parallel bonds and need to be determined in simulations.
k n = Δ F n A Δ U n
k s = Δ F s A Δ U s
In the formula, Δ F n and Δ F s are the increments in normal force and shear force per unit time; Δ U n and Δ U s are normal displacement increment and shear displacement increment in unit time; A is the cross-sectional area of the bond. When the maximum tensile strength is greater than the critical normal stress ( σ max σ c ) or the maximum shear strength is greater than the critical shear stress ( τ max τ c ), the bond breaks. The force–displacement characteristics of the particle bonding system are shown in Figure 2.
σ max = F n A + 2 M s I R σ c
τ max = F s A + M n J R τ c
where F n and F s are the normal force and shear force of the particles, respectively; M n and M s are the normal moment and shear moment of the particles, respectively; A is the cross-sectional area of the bond; A = π R 2 ; I is the moment of inertia of the bond; and J is the polar moment of inertia of the bond.

3. Mineral Crushing Methods

The research method is shown in Figure 3. In order to establish an accurate model in line with the actual ore crushing characteristics, the selection method for model parameters was optimized. The parameters of the particle bonding model were determined based on the weight drop test results, and the accuracy of the model was judged by the test results.

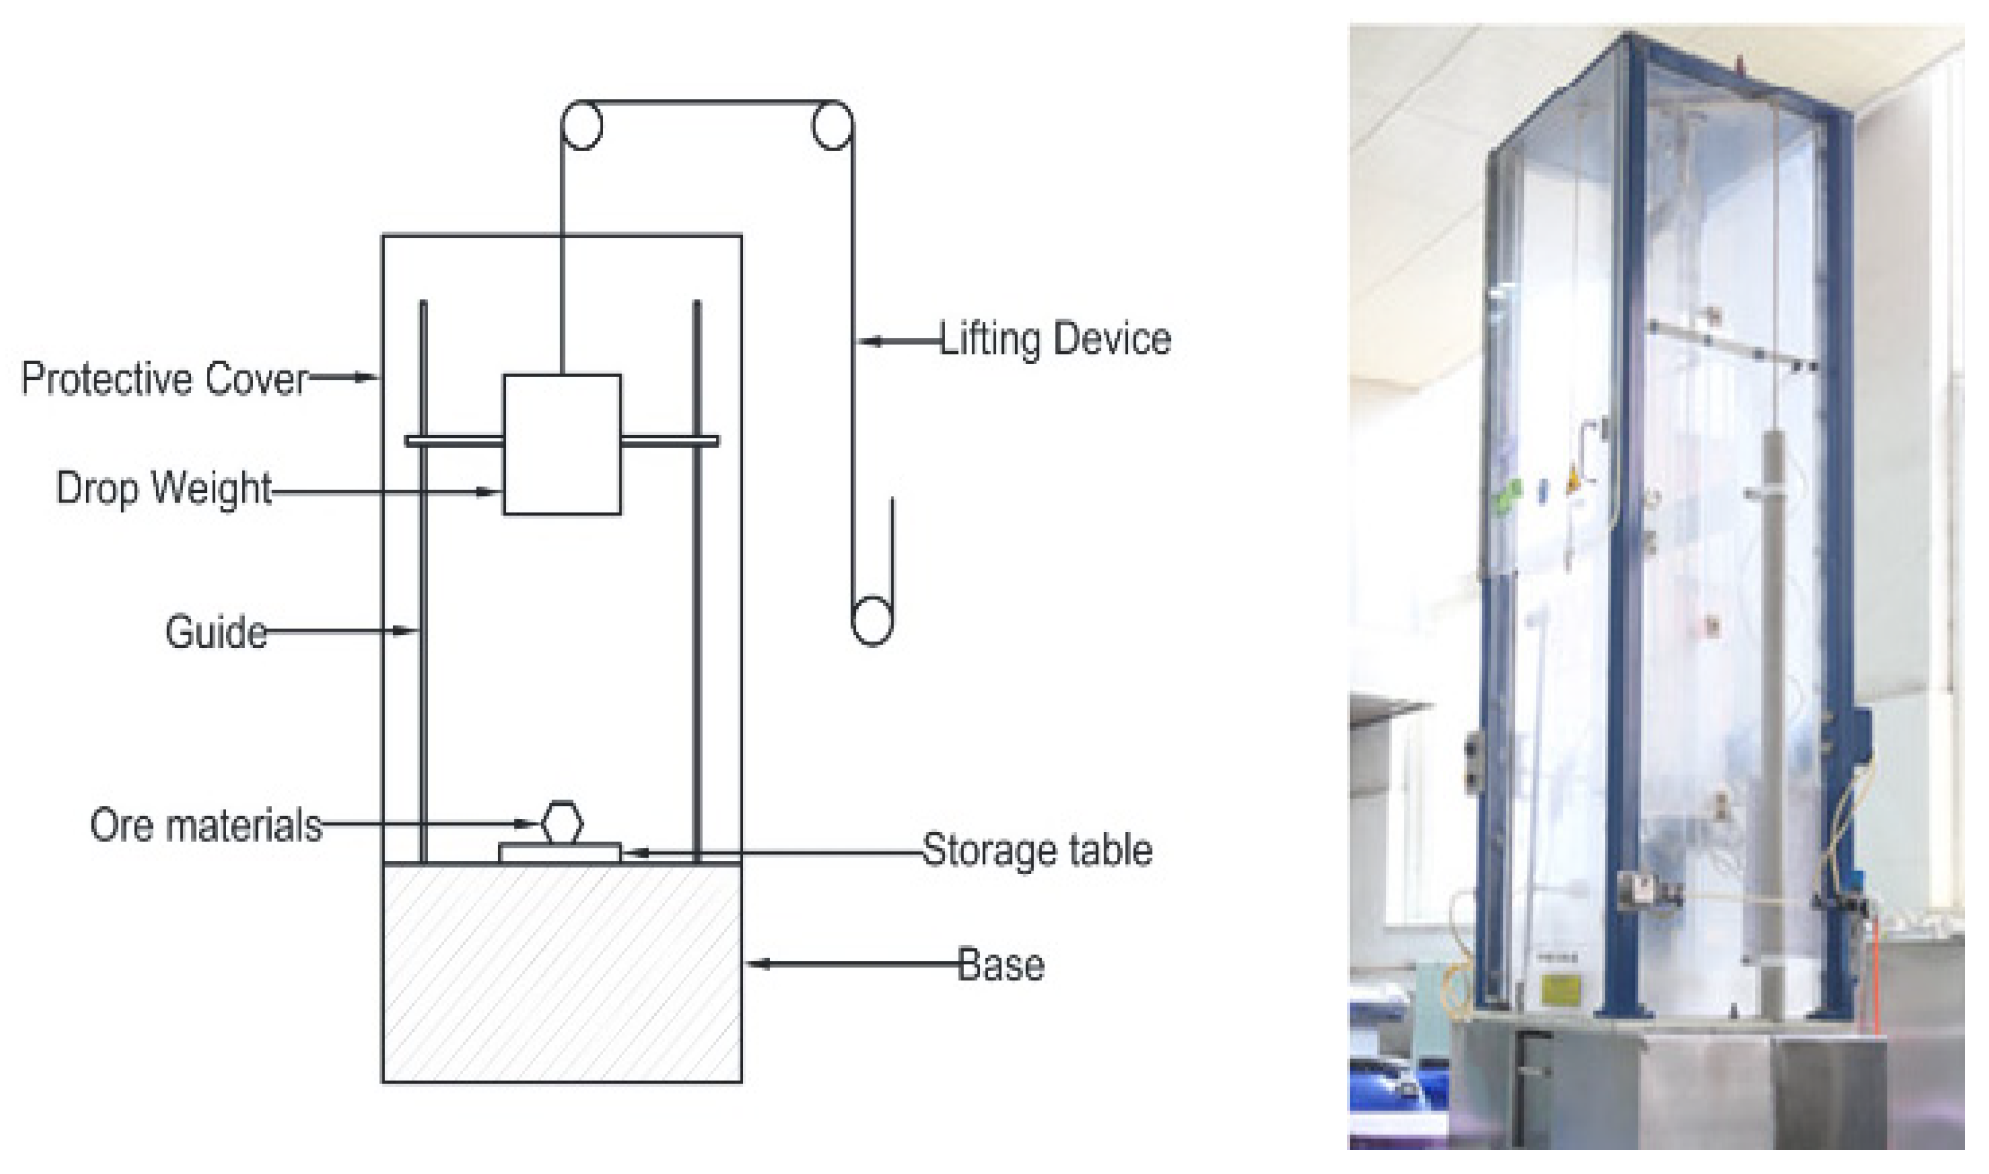
3.1. Drop Weight Test Method

The tests were conducted using a JKTech drop weight testing machine, as shown in Figure 4. Its working principle is as follows: the drop hammer freely falls along with the guide from a predetermined height to impact the ore. After the impact, the crushed ore fragments are collected for particle size screening analysis. The protective cover is used to prevent splinters from the impact, and the guide is used to prevent any secondary breakage caused by a rebound after the impact of the falling hammer.
A single piece of gold ore with a size in the range of 45–37.5 mm across was selected as the test object, and ten repetitive tests per impact energy value were carried out. Under the same impact energy, the fragments of 10 ore samples were collected together and then screened, graded, and weighed to obtain the mass percentage of each size. The specific test parameters are shown in Table 1.

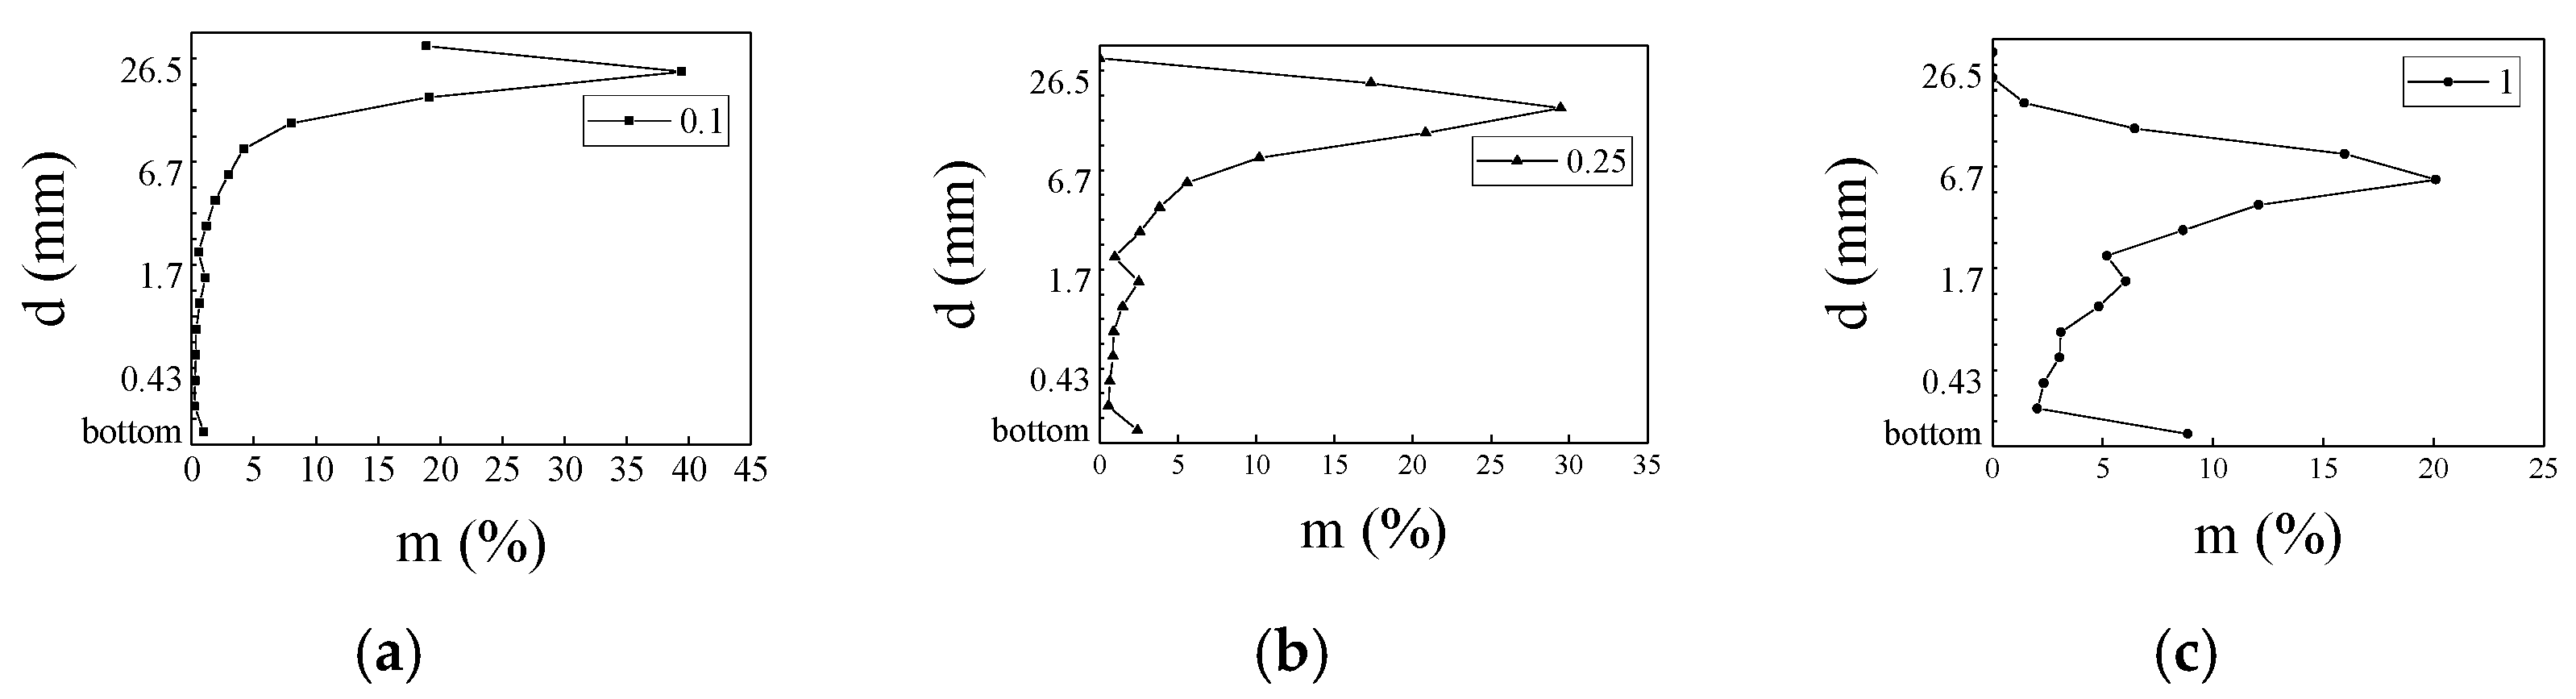
3.2. Mineral Crushing Size Distribution

Table 2 shows the mineral sieving particle size and sieve mass obtained from the drop weight test with three levels of impact energy. The results showed that the impact energy increased, whereas the maximum particle size decreased after crushing. The particle size mass fraction first increased and then decreased with the increase in sieving size. The particle size and mass distribution of crushed minerals under three impact energies are shown in Figure 5. It can be seen in Figure 5 that the peaks of the first and second groups of curves were between 19–26.5 mm, and that of the third group was at 6.7 mm. The particle size at the peak of the curve decreases with the increase in impact energy. Excluding the grinding mass fraction at the bottom of the sieve, the components with a mass fraction greater than 10% on the sieve were above 4.75 mm, and the components below 4.75 mm were relatively small. The total mass fractions of particles above 4.75 mm in size under three impact energies were 94.38%, 87.23% and 56.00%, respectively; the size of most of the particles after crushing was above 4.75 mm.

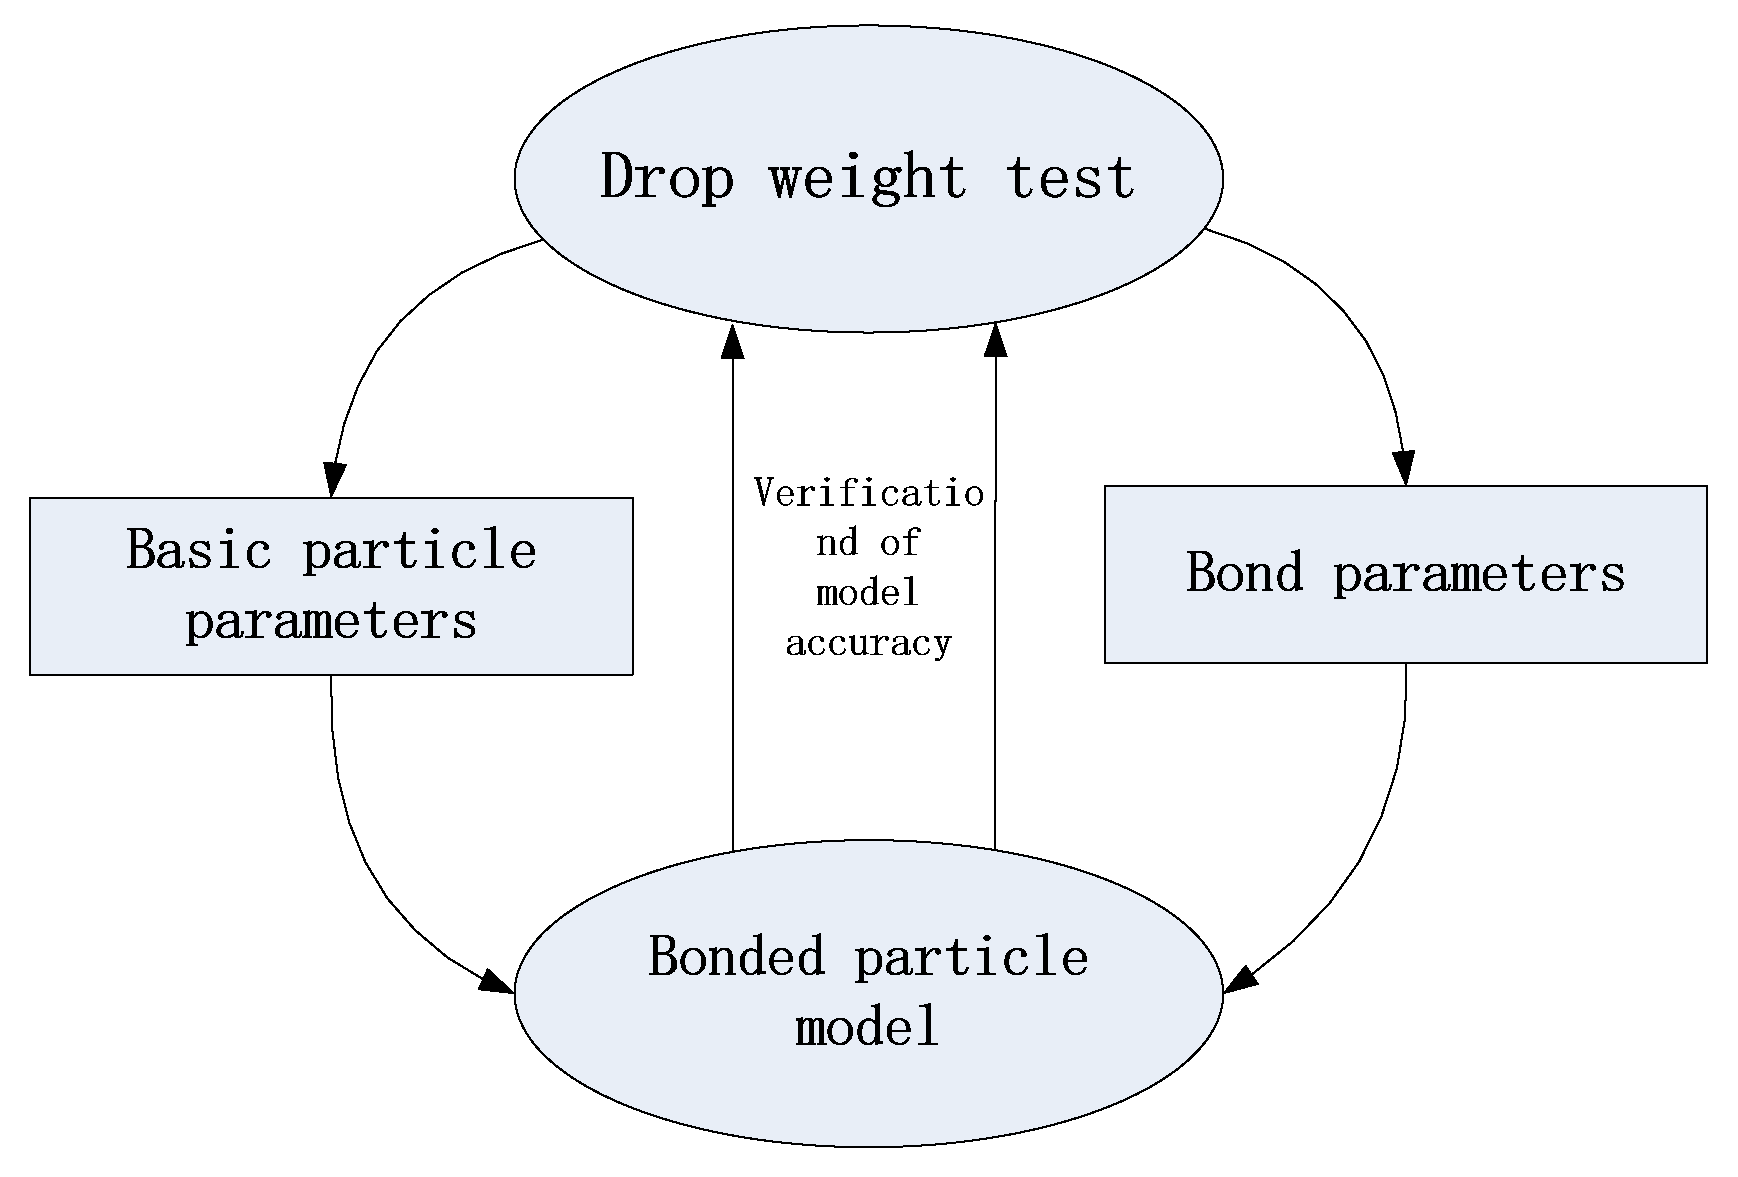
4. Determination of Model Parameters

4.1. The Diameter of the Basic Particle

4.1.1. The Method Adopted for the Determination of the Basic Particle’s Diameter

In a crushing simulation, the particle size distribution of the crushed model is represented by the particle clusters obtained after crushing. The particle cluster is composed of basic particles. The selection of basic particle diameter directly affects the sizes of particle clusters, that is, the parameters of particle size distribution after crushing. In order to improve the accuracy of the model and achieve consistency in the simulation, the size of the particle cluster must be consistent with the particle size classification of the drop weight test. In the drop weight test, the particle size classification after crushing is determined by the sieving size. The ore is crushed by a falling weight; the crushed ore is then screened and graded by sieves of different sizes. As a result, the masses of fragments of different sizes are obtained, and finally, the parameters of particle size distribution are achieved. Figure 6 depicts the schematic of the sieving particle size of the test. In the simulation, the broken ore is considered as the particle cluster, and the size of the particle cluster should match with the screening size as far as possible.
It is assumed that the maximum size of the particle cluster is the same as the sieving size. Additionally, the size number is m, and the maximum size of the particle cluster is Dm. The broken particle clusters are composed of several basic particles of different sizes. The diameters of different basic particles are d1, d2, …, dn. The corresponding numbers of particles are k1, k2, …, kn. This results in a linear relationship between the maximum size of the particle cluster and the basic particle diameter (Figure 7).
When the size number is m, the maximum diameter of the particle cluster Dm satisfies the following relationship given by Equation (5):
D m = i = 1 i = n k i d i
where Dm is the maximum diameter of clusters when the size classification number is m, in mm, kn is the number of basic particles with diameter dn, and dn is the basic particle diameter of size classification n, in mm.
If there are several groups of broken size classification, the basic particle group should satisfy the maximum cluster size of all classifications at the same time; that is, each classification size should be composed of several basic particle sizes. The basic particle group should satisfy the matrix equation (Equation (6)):
D 1 D 2 D m = k 11 k 12 k 1 n k 21 k 22 k 2 n k m 1 k m 2 k mn d 1 d 2 d n
where kmn is the number of basic small particles whose particle size is dn when the particle classification is m, and the other parameters are consistent with the Equation (1).
In Equation (2), the basic particle group is composed of n kinds of particles with diameters of d 1 , d 2 ,……, d n . There are m kinds of classification sizes, which are D 1 , D 2 , ……, D m . The broken particle clusters are composed of basic particles, and the maximum diameter of each particle cluster satisfies Equation (1). When there are many kinds of particle clusters at the same time and their maximum diameter is exactly the same as each classification size, the number of basic particles satisfies matrix k. If there is a matrix k of the number of basic particles, which can meet all the classification sizes at the same time, it is considered that the selection of the basic particle diameter is reasonable.
When constructing the model, according to the actual particle size distributions of different ores and selection of the appropriate basic particle diameters and quantities, the particle size composition of each particle size classification can be expressed flexibly.

4.1.2. Determination of Basic Particle Diameters Based on the Drop Weight Test

According to the particle size distribution in the drop weight test (DWT), the basic particle diameter in the bonding model was selected. By analyzing the data of DWT, a particle smaller than 4.75 mm sees a small change and has a small mass fraction, which slightly influenced the change in particle size after characterization. Considering the modeling efficiency, the simulation characterization of particles larger than 4.75 mm after crushing is mainly considered. Therefore, the particle diameter of the basic particle group should be less than 4.75 mm.
There were six different particle sizes above 4.75 mm, namely, 6.7, 9.5, 13.2, 19, 26.5, and 37.5. To simplify the modeling process and improve the modeling efficiency, Equation (2) is considered to be satisfied when the particle size error is less than 1 mm. The above six particle sizes were screened, and the number of basic particles in DWT was substituted into Equation (6), and the basic particle diameter selection equation as per the screening size in DWT was obtained (Equation (7)).
6.7 9.5 13.2 19 26.5 37.5 k 11 k 12 k 13 k 21 k 22 k 23 k 31 k 32 k 33 k 41 k 42 k 43 k 51 k 52 k 53 k 61 k 62 k 63 d 1 d 2 d 3
This equation system has multiple sets of solutions, on taking d1 = 1, d2 = 2, d3 = 3. The value of matrix k is:
k 11 k 12 k 13 k 21 k 22 k 23 k 31 k 32 k 33 k 41 k 42 k 43 k 51 k 52 k 53 k 61 k 62 k 63 = 1 1 1 2 2 1 2 1 3 3 2 4 2 3 6 1 3 10
The matrix in Equation (6) is satisfied when the basic particle group has three sizes equal to 1, 2, and 3 mm, and fulfills the condition of bonded particle and breaking model. That is, for example, the 13.2 mm group could be composed of two 1 mm particles, one 2 mm particle, and three 3 mm particles. In Equation (7), the matrix k is the matrix of the number of particles satisfying all the sieve sizes. The number of particles is not unique, and the change in its value does not affect the selection of the basic particle diameter. As long as there is a matrix of particle number k, all sieve sizes D1, D2, ……, Dm can be satisfied at the same time.

4.2. Bond Parameters between Particles

4.2.1. Determination Method of Bond Parameters

The formation of inter-particle bonds in the BPM theory is shown in Figure 8. When the distance between the particles is in the range of contact radius, the bond is formed between the particles.
According to the BPM theory, bond strength is comprehensively characterized by four mineral parameters, including normal stiffness per unit area, shear stiffness per unit area, critical normal stress, and critical shear stress [9]. Characteristic mineral parameters vary greatly with ore types and other factors. There are differences between standard mineral library parameters and actual mineral parameters. At present, there is no clear method or theory to quantitatively and intuitively connect the microscopic parameters of the model with the mechanical properties of macroscopic minerals. Therefore, numerical modeling was used to simulate the impact crushing of the mineral model to determine the parameter of the mineral that conforms to the actual mineral [36,37]. By comparing the simulation results with the test results, if the results are consistent, it is considered that the simulation parameters are consistent with reality.
In this paper, the drop weight test is taken as the standard, and hence, the drop weight test process was also simulated. The maximum particle cluster size after crushing was used as the evaluation standard. Additionally, it determined the upper limit of the particle size distribution. If the maximum particle cluster size obtained by simulation is the same as that obtained by DWT, it can be preliminarily judged that the setting of mineral parameters in the model is reasonable and accords with the actual mineral characteristics.

4.2.2. Determination of Bond Parameters in the Model

In the standard mineral database, only some basic parameters of minerals are available; thus, bond parameters between particles in BPM cannot be determined and must be adjusted according to the drop weight test data. Natural ores are polymerized from a variety of minerals, and the aggregation forces acting on the binding surfaces of different mineral aggregates are different, resulting in the highly diverse mechanical structure of ores. The strength of ore is determined by the internal cohesion of the ore. According to the rock compressive strength and the actual test results, the bond parameters are selected based on the following two conditions: the values of bond parameters between particles of the same size increase as the particle size increases, and the values of bond parameters between particles of different sizes decrease as the size difference increases.
Bond parameter K is a set of four parameters, K = (kn, kt, σ, τ), consisting of unit area normal stiffness kn, unit area shear stiffness kt, critical normal stress σ, and critical shear stress τ. The particles with different diameters (1 mm, 2 mm, 3 mm) are numbered P1, P2, and P3. Each bond parameter is only related to one combination of particle sizes or diameters, and six groups of bond parameters were considered in this case, named K11, K22, K33, K12 (K21), K13 (K31), and K23 (K32), which represent the bond parameters of particle combinations P1–P1, P2–P2, P3–P3, P1–P2, P1–P3, and P2–P3, respectively.
The stiffness parameters determine the degree of difficulty of bond fracturing, and the stress parameters determine the ability of the model to resist elastic deformation [31]. In the process of modeling and simulating several groups of bond parameters, it was observed that changing the stiffness parameters alone has a great influence on the formation of particle clusters. Therefore, the bond parameters are adjusted by using the stress parameters as fixed values and adjusting the stiffness parameters. Their specific values are shown in Table 3.
Using the bond parameters listed in Table 3, a discrete element bonded particle model was constructed, and EDEM, a type of DEM software, was used to simulate the drop weight test. The maximum particle size obtained by the simulation is shown in Figure 9. It can be seen in the figure that as the normal stiffness and shear stiffness of the bond parameters decreased, the maximum particle size after crushing also decreased accordingly. The maximum particle size after crushing is shown in Table 4. The crushing particle size obtained via simulation by using the second set of bond parameters was 30.78 mm and was consistent with the maximum crushing particle size obtained in the drop weight test (26.5–37.5 mm). According to the numerical test method discussed in Section 4.2.1 [36,37], the bond parameters of the second group are similar to the characteristics of the actual mineral.

5. Simulation and Analysis of the Impact Crushing Process

5.1. Modeling of the Crushing of Cohesive Multi-Particle Minerals

To improve the effectiveness of the simulations, the shape of minerals used in modeling was kept as similar as possible to that of the actual minerals. It was assumed that the influence of ore shape on ore crushing results can be ignored, the shape of the mineral chosen for the study was a four-prism, with dimensions equal to 40 mm × 40 mm × 39 mm. The whole mineral was filled with bonded particles [10,11].
Since the mineral is a four-prism and the bonded particles are spherical, porosity exists when the particles are filled. The filling volume fraction α was taken into account while calculating the number of the bonded particles. The filling volume fraction is the ratio of the total volume of the bonded particles to the actual mineral volume. The bonded particles with a single diameter, exhibited a filling volume fraction α0 = 0.56. The increase in porosity meant that the number of basic particles that made up the mineral decreased under the same mineral volume. As a result, the number of bonds between particles was reduced, the structure of the model was loosened, the strength was reduced, and the quality of the model was poor. It was not easy for the model, having high porosity, to form particle clusters after being broken; this affects the results of particle size distribution and is different from the actual ore structure. The filling of basic particle groups with multiple particle sizes can effectively reduce the porosity and improve the model quality.
We assumed that the volume of the bonded particles with a diameter equal to 1 mm is V1, that for 2 mm diameter, it was V2, and that for 3 mm diameter, it was V3. When all the bonded particles are 3 mm in diameter, the filling volume fraction α0 is equal to 0.56, and the calculated number of particles with 5 mm diameter particles was 2536. In order to ensure a uniform distribution of all particle diameters in the model and to satisfy the particle size relation (1), the number of bonded particles with 2 and 3 mm diameters should not vary too much. The 1 mm diameter particles were small in volume, and the number of them was appropriately increased to fill the pores between large particles to ensure a compact internal structure for the model. According to the volume ratio between the bonded particles, some 3 mm particles were replaced with 1 and 2 mm particles. After making the adjustments and calculation, the final volume filling fraction was increased to α1 = 0.574. The number of particles in the basic particle group is shown in Table 5.
The BPM established by DEM is shown in Figure 10. In this bonding model, the purple, brown, and gray balls represent 1, 2, and 3 mm particles, respectively. The red, blue, and gray line segments are representative of the bonds between 1, 2, and 3 mm particles, respectively. The dark red line segment displays the bonding between 1 and 2 mm particles, whereas the dark green and green line segments represent the bonds between 1 mm and 3 mm particles and 2 mm and 3 mm particles, respectively.

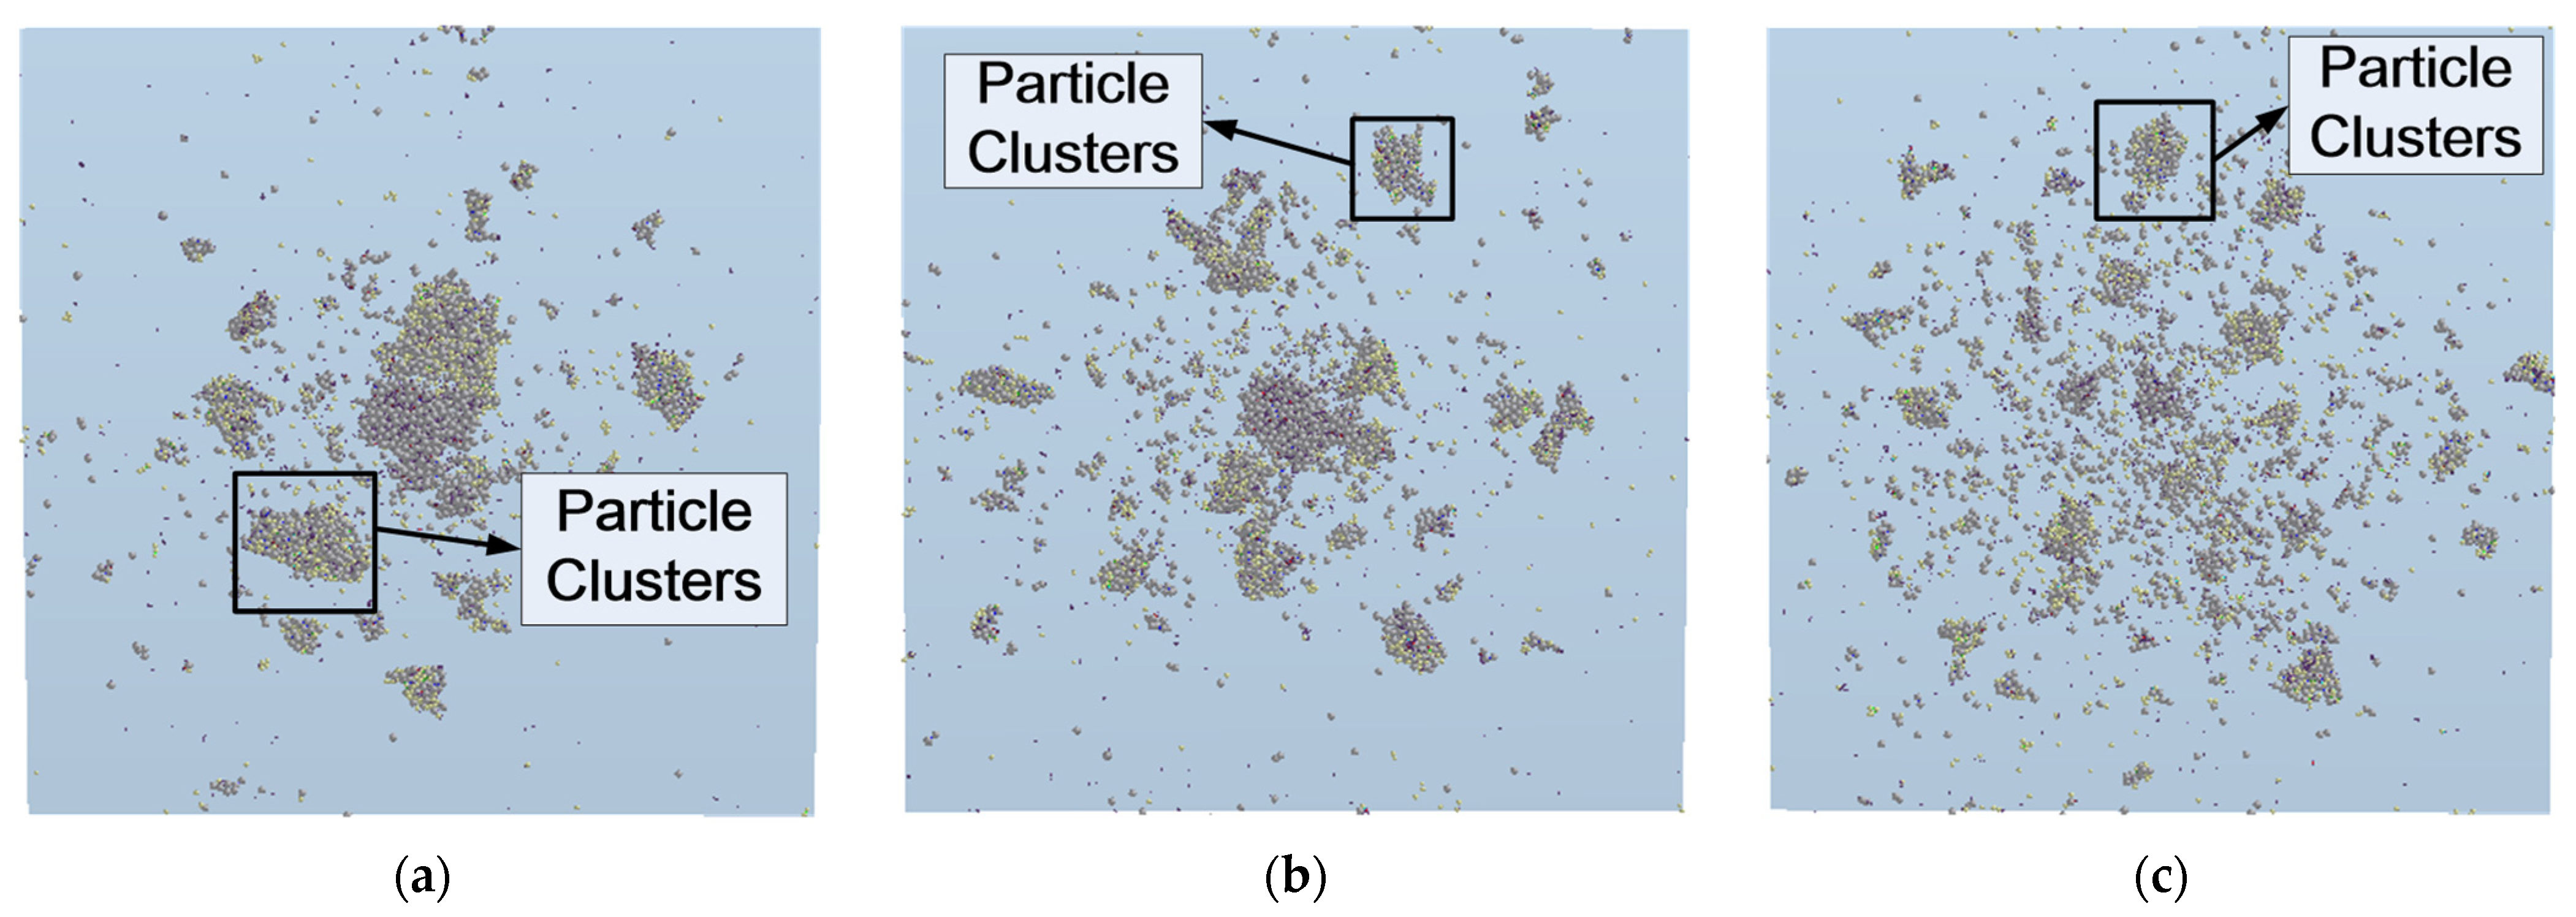
5.2. Discrete Element Simulation of the Mineral Crushing Process

The simulation parameters in the DEM were based on the results obtained from the drop weight test parameters. The drop hammer was cylindrical in shape and made of lead. The basic particles of the bonded particle model were 1, 2, and 3 mm in size. The bonds could be set according to the second group of bond parameters. The simulated impact energy was equal to 0.1 0. t, or 1 kwh/t, respectively, and is also consistent with the drop weight test.
The simulation results of drop weight crushing are shown in Figure 11. The results show that the bonding between the particles was not completely broken after crushing. After the crushing of large particles, parts of the basic particles were directly separated, while the other parts were still in clusters of different sizes. At the same time, it can be seen that the maximum particle size of the crushed mineral decreases as the impact energy increases.

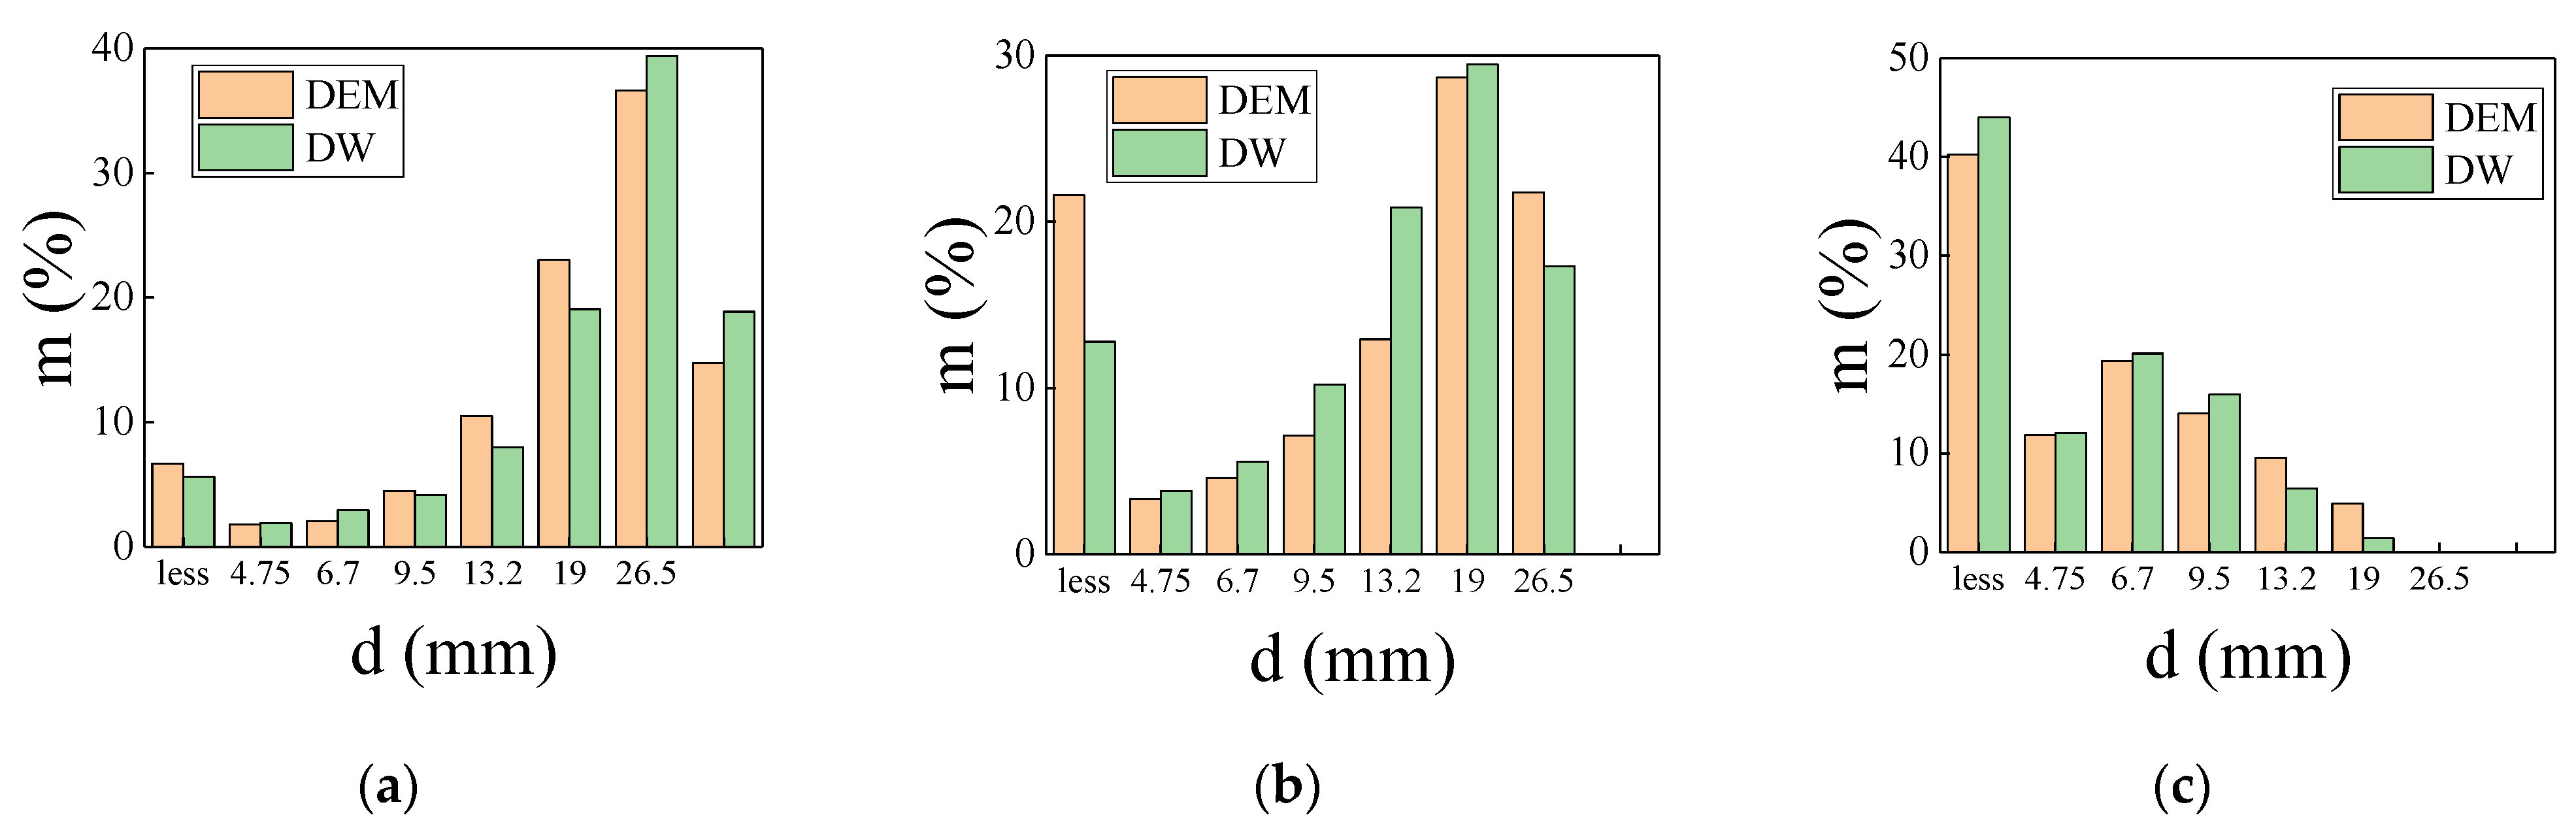
5.3. Comparison of Simulation and Test Results

The particle size distribution obtained from the drop weight test was compared with the results of the simulations by counting the mass fractions of the mineral particles obtained via simulation, and the corresponding statistical results are listed in Table 6. The particle mass fraction curve obtained from both the drop weight test and the simulation is shown in Figure 12.
The results showed that the maximum grain mass percentage was 36.65%, 28.68%, or 19.34% under the three impact energies, and the grain size was 26.5, 19, or 6.7 mm, respectively. The simulation and experimental results have the same peak in particle size distribution. With the increase in impact energy, the peak value and particle size gradually decreased, and the mass percentage of particle size below 4.75 mm gradually increased. Besides, the differences between the three groups were 1.96%, 3.31%, and 1.66% respectively, and the particle size distribution shows good consistency.

6. Conclusions

The following conclusions can be drawn from the present study:
(1)
A method of determining the basic particle type and the sizes of particles based on the sieve size distribution in the drop weight test was realized. When modeling ore 45–37.5 mm in size, a high-precision model can be obtained that considers the particle sizes of three kinds of basic particles to be 1, 2, and 3 mm.
(2)
The parameter setting and bond verification method was created. The bond parameters are set as per the actual ore strength parameters in the drop weight test. By comparing the broken particle size distribution obtained by simulation and drop weight test, the accuracy of the model was verified. The maximum mass distribution error of the model was no more than 3.31%.
(3)
Based on the proposed methodologies of the selection of particle size and bond parameters in mineral crushing processes in this paper, the discrete element method (DEM) can be used for mineral crushing simulation with accurate results.

Author Contributions

Conceptualization, J.L. and X.M.; methodology, J.L.; software, M.Z.; validation, X.W., X.M. and Y.H.; formal analysis, X.W.; investigation, Y.H.; resources, X.M.; data curation, X.M.; writing—original draft preparation, X.W.; writing—review and editing, J.L. and Z.G.; visualization, X.W.; supervision, J.L.; project administration, X.M.; funding acquisition, J.L. All authors have read and agreed to the published version of the manuscript.

Funding

This work was supported by the National Basic Research Development Program of China (grant number 2012CB724306); Special Project of Industrial Cluster in National Innovation Demonstration Zone (grant number 201200210500); Henan Province Key Science and Technology Project (grant number 202102210263); Key Science and Research Program in University of Henan Province (grant number 21A460014).

Institutional Review Board Statement

Not applicable.

Informed Consent Statement

Not applicable.

Data Availability Statement

Data is contained within the article.

Conflicts of Interest

The authors declare no conflict of interest.

References

  1. Rasoul, P.; Kianoush, B. The effect of ball size distribution on power draw, charge motion and breakage mechanism of tumbling ball mill by discrete element method (DEM) simulation. Physicochem. Probl. Miner. Process. 2018, 54, 258–269. [Google Scholar]
  2. Nagata, Y.; Minagawa, M.; Hisatomi, S.; Tsunazawa, Y.; Okuyama, K.; Iwamoto, M.; Sekine, Y.; Tokoro, C. Investigation of optimum design for nanoparticle dispersion in centrifugal bead mill using DEM-CFD simulation. Adv. Powder Technol. 2019, 30, 1034–1042. [Google Scholar] [CrossRef]
  3. Jia, L.; Erich, B.; Wei, W. A combined method to model grain crushing with DEM. Geosci. Front. 2020, 11, 451–459. [Google Scholar]
  4. Kinaci, M.; Lichtenegger, T.; Schneiderbauer, S. A CFD-DEM model for the simulation of direct reduction of iron-ore in fluidized beds. Chem. Eng. Sci. 2020, 227, 115858. [Google Scholar] [CrossRef]
  5. Wentao, Z.; Yuexin, H.; Yanjun, L.; Jinlin, Y.; Shaojian, M.; Yongsheng, S. Research on prediction model of ore grinding particle size distribution. J. Dispers. Sci. Technol. 2019, 41, 537–546. [Google Scholar] [CrossRef]
  6. Cheng, Y.; Wong, L.N.Y. A study on mechanical properties and fracturing behavior of Carrera marble with the flat-jointed model. Int. J. Numer. Anal. Methods Geomech. 2020, 44, 803–822. [Google Scholar] [CrossRef]
  7. Castro, F.U.; Alejano, L.R.; Ivars, D.M. Particle flow code simulation of intact and fissured granitic rock samples. J. Rock Mech. Geotech. Eng. 2020, 12, 960–974. [Google Scholar] [CrossRef]
  8. Xie, C.; Zhao, Y.; Song, T.; Zhao, Y. Investigation of the effect of filling level on the wear and vibration of a SAG mill by DEM. Particuology 2021, 63, 24–34. [Google Scholar] [CrossRef]
  9. Abid, S.R.; Abdul-Hussein, M.L.; Ayoob, N.S.; Ali, S.H.; Kadhum, A.L. Repeated drop-weight impact tests on self-compacting concrete reinforced with micro-steel fiber. Heliyon 2020, 6, e03198. [Google Scholar] [CrossRef] [Green Version]
  10. Zhou, W.; Han, Y.; Li, Y.; Sun, Y.; Yang, J.; Ma, S. Establishment and prediction of impact crushing particle size distribution model. Chin. J. Nonferrous Met. 2019, 29, 1316–1323. [Google Scholar] [CrossRef]
  11. Zhou, W.; Han, Y.; Li, Y.; Sun, Y.; Yang, J.; Ma, S. Multi-scale impact crushing characteristics of polymetal licsulphide ores. Trans. Nonferrous Met. Soc. China 2019, 29, 1929–1938. [Google Scholar] [CrossRef]
  12. Vu, G.; Iskhakov, T.; Timothy, J.J.; Schulte-Schrepping, C.; Breitenbücher, R.; Meschke, G. Cementitious Composites with High Compaction Potential: Modeling and Calibration. Materials 2020, 13, 4989. [Google Scholar] [CrossRef] [PubMed]
  13. Ramírez-Aragón, C.; Ordieres-Meré, J.; Alba-Elías, F.; González-Marcos, A. Numerical Modeling for Simulation of Compaction of Refractory Materials for Secondary Steelmaking. Materials 2020, 13, 224. [Google Scholar] [CrossRef] [PubMed] [Green Version]
  14. Jargalsaikhan, B.; Bor, A.; Lee, J.; Choi, H. Effect of Different Raw Material Property for the Fabrication on Al/CNT Nanocomposite Using a Ball Mill with a Discrete Element Method (DEM) Simulation. Materials 2019, 12, 3291. [Google Scholar] [CrossRef] [Green Version]
  15. Horabik, J.; Wiącek, J.; Parafiniuk, P.; Stasiak, M.; Bańda, M.; Kobyłka, R.; Molenda, M. Discrete Element Method Modelling of the Diametral Compression of Starch Agglomerates. Materials 2020, 13, 932. [Google Scholar] [CrossRef] [Green Version]
  16. Sadeghi-Chahardeh, A.; Mollaabbasi, R.; Picard, D.; Taghavi, S.; Alamdari, H. Discrete Element Method Modeling for the Failure Analysis of Dry Mono-Size Coke Aggregates. Materials 2021, 14, 2174. [Google Scholar] [CrossRef]
  17. Chen, J.; Furuichi, M.; Nishiura, D. Discrete Element Simulation and Validation of a Mixing Process of Granular Materials. Materials 2020, 13, 1208. [Google Scholar] [CrossRef] [Green Version]
  18. Rojek, J.; Madan, N.; Nosewicz, S. Micro–Macro Relationships in the Simulation of Wave Propagation Phenomenon Using the Discrete Element Method. Materials 2019, 12, 4241. [Google Scholar] [CrossRef] [Green Version]
  19. Zhu, S.; Wu, C.; Yin, H. Virtual Experiments of Particle Mixing Process with the SPH-DEM Model. Materials 2021, 14, 2199. [Google Scholar] [CrossRef]
  20. Ferretti, E. DECM: A Discrete Element for Multiscale Modeling of Composite Materials Using the Cell Method. Materials 2020, 13, 880. [Google Scholar] [CrossRef] [Green Version]
  21. Liu, C.; Pan, L.; Wang, F.; Zhang, Z.; Cui, J.; Liu, H.; Duan, Z.; Ji, X. Three-Dimensional Discrete Element Analysis on Tunnel Face Instability in Cobbles Using Ellipsoidal Particles. Materials 2019, 12, 3347. [Google Scholar] [CrossRef] [PubMed] [Green Version]
  22. Zhao, H.; Huang, Y.; Liu, Z.; Liu, W.; Zheng, Z. Applications of Discrete Element Method in the Research of Agricultural Machinery: A Review. Agriculture 2021, 11, 425. [Google Scholar] [CrossRef]
  23. Yao, Z.; Wu, W.; Lin, F.; Li, Y. Study on Impact Crushing Energy of Coal Body Based on Impact Crushing Experiment. Coal Technol. 2019, 38, 73–75. [Google Scholar] [CrossRef]
  24. Hong, J.; Li, J.; Shen, Y.; Wang, X. Particle Fracture Model Based on the Discrete Element Method. J. Tianjin Univ. Sci. Technol. 2018, 51, 1253–1259. [Google Scholar] [CrossRef]
  25. Raisianzadeh, J.; Mohammadi, S.; Mirghasemi, A. Micromechanical study of particle breakage in 2D angular rock fill media using combined DEM and XFEM. Granul. Matter 2019, 21, 48. [Google Scholar] [CrossRef]
  26. Huang, X.; Qi, S.; Zheng, B.; Guo, S.; Liang, N.; Zhan, Z. Progressive Failure Characteristics of Brittle Rock under High-Strain-Rate Compression Using the Bonded Particle Model. Materials 2020, 13, 3943. [Google Scholar] [CrossRef]
  27. Sun, Y.; Nimbalkar, S.; Chen, C. Particle breakage of granular materials during sample preparation. J. Rock Mech. Geotech. Eng. 2019, 11, 203–208. [Google Scholar] [CrossRef]
  28. Xu, K.; Huang, W.; Wang, J.; Zhang, T.; Chen, G. Progress in numerical simulation study of rock particle crushing. Sci. Technol. Eng. 2019, 19, 8–14. [Google Scholar] [CrossRef]
  29. Mao, H. Experimental and Numerical Studies on the Direct Shear Behavior of Sand–RCA (Recycled Concrete Aggregates) Mixtures with Different Contents of RCA. Materials 2021, 14, 2909. [Google Scholar] [CrossRef]
  30. Qian, J.; Yao, Y.; Li, J.; Xiao, H.; Luo, S. Resilient Properties of Soil-Rock Mixture Materials: Preliminary Investigation of the Effect of Composition and Structure. Materials 2020, 13, 1658. [Google Scholar] [CrossRef] [Green Version]
  31. Cundall, P.A.; Potyondy, D.O. A bonded-particle model for rock. Int. J. Rock Mech. Min. Sci. 2004, 41, 1329–1364. [Google Scholar] [CrossRef]
  32. Tavares, L.M.; Chagas, A. A stochastic particle replacement strategy for simulating breakage in DEM. Powder Technol. 2020, 377, 222–232. [Google Scholar] [CrossRef]
  33. Potyondy, D.O. A flat-jointed bonded-particle material for hard rock. In Proceedings of the 46th U.S. Rock Mechanics/Geomechanics Symposium, Chicago, IL, USA, 24–27 June 2012; American Rock Mechanics Association (ARMA): Alexandria, VA, USA, 2012. [Google Scholar]
  34. Potyondy, D.O. The bonded-particle model as a tool for rock mechanics research and application: Current trends and future directions. Geosystem Eng. 2015, 18, 1–28. [Google Scholar] [CrossRef]
  35. Potyondy, D.O. A flat-jointed bonded-particle model for rock. In Proceedings of the 52nd U.S. Rock Mechanics/Geomechanics Symposium, Seattle, WA, USA, 17–20 June 2018; American Rock Mechanics Association (ARMA): Alexandria, VA, USA, 2018. [Google Scholar]
  36. Mao, Y.; Sun, Y.; Ji, S.; Shan, J.; Jin, X. Nipped Configuration of Unconfined Particle Beds under Falling Ball Impact Test. China Mech. Eng. 2016, 27, 168–172. [Google Scholar] [CrossRef]
  37. Zhang, Q.; Zhang, X.P.; Ji, P.Q.; Zhang, H.; Wu, Z. Study of interaction mechanisms between multiple parallel weak planes and hydraulic fracture using the bonded-particle model based on moment tensors. J. Nat. Gas Sci. Eng. 2020, 76, 103176. [Google Scholar] [CrossRef]
Figure 1. Structure and the crushing process of BPM. (a) Structure of the BPM; (b) Crushing process of BPM.
Coatings 12 00731 g001
Figure 2. Force–displacement behavior of particle bonding.
Coatings 12 00731 g002
Figure 3. Research method.
Coatings 12 00731 g003
Figure 4. Schematic of the drop weight test machine.
Coatings 12 00731 g004
Figure 5. Histogram of crushed particle size and mass distributions under different impact energies. (a) E = 0.1 kwh/t; (b) E = 0.25 kwh/t; (c) E = 1 kwh/t.
Coatings 12 00731 g005
Figure 6. Ore screening process in the drop weight test.
Coatings 12 00731 g006
Figure 7. Particle cluster size.
Coatings 12 00731 g007
Figure 8. Interparticle bond.
Coatings 12 00731 g008
Figure 9. Maximum particle size obtained after crushing of three groups of bond parameters. (a) First group; (b) second group; (c) third group.
Coatings 12 00731 g009
Figure 10. Bonded particle model of ore. (a) Particle bonding structure; (b) bond structure.
Coatings 12 00731 g010
Figure 11. Simulation results under different impact energies. (a) E = 0.1 kwh/t; (b) E = 0.25 kwh/t; (c) E = 1 kwh/t.
Coatings 12 00731 g011
Figure 12. Mass percentage comparison among different particle sizes. (a) E = 0.1 kwh/t; (b) E = 0.25 kwh/t; (c) E = 1 kwh/t.
Coatings 12 00731 g012
Table 1. Drop weight test parameters.
Ore Size (mm)45–37.5
Impact energy E (kWh/t)0.10.251
Drop weight m (kg)4.7614.9549.91
Drop height H (cm)99.6979.2594.14
Table 2. Drop weight test particle size distribution.
Group Number123
Impact Energy E (kwh/t)0.100.251
Sieving Size
(mm)
Mass
(g)
Percentage
(%)
Mass
(g)
Percentage
(%)
Mass
(g)
Percentage
(%)
37.50355.3018.870.000.000.000.00
26.50742.2039.41325.3017.330.000.00
19.00359.7019.10553.0029.4626.901.43
13.20150.608.00391.0020.83121.306.44
9.5078.604.17191.5010.20300.6015.97
6.7055.502.95104.905.59378.3020.10
4.7535.601.8971.803.82227.1012.06
3.3522.101.1748.102.56162.508.63
2.3610.100.5417.900.9597.505.18
1.7020.601.0946.702.49113.706.04
1.1812.000.6427.201.4590.704.82
0.856.900.3716.500.8858.303.10
0.606.300.3315.700.8457.103.03
0.435.200.2812.100.6443.702.32
0.304.400.2310.300.5538.102.02
Sieve Bottom18.200.9745.202.41166.708.86
Total1883.30100.001877.20100.001882.50100.00
Table 3. Parameters of the bonds between particles.
Adjacent Particle Diameterd
(mm)
Normal Stiffness per Unit Area Kn
(N/m2)
Shear Stiffness per Unit Area Kt
(N/m2)
Critical Normal Stress σ
(Pa)
Critical Shear Stress τ
(Pa)
Bonded Disk Radius
r0
(mm)
Group 1Group 2Group 3Group 1Group 2Group 3
118 × 1078 × 1078 × 1075 × 1075 × 1075 × 10730,00030,0000.6
227 × 1077 × 1077 × 1074 × 1074 × 1074 × 10731,00031,0001.1
336 × 1075 × 1074 × 1073 × 1072 × 1072 × 10732,00032,0001.6
125.5 × 1075.5 × 1075.5 × 1072.5 × 1072.5 × 1072.5 × 10733,00033,0000.6
235 × 1074.5 × 1073.5 × 1072 × 1071.5 × 1071.5 × 10734,00034,0001.1
134.5 × 1074 × 1072 × 1071.5 × 1071 × 1077 × 10635,00035,0000.6
Table 4. Maximum particle size after crushing.
Bond Parameters GroupGroup 1Group 2Group 3
Maximum Size (mm)40.1530.7844.75
Table 5. 40 mm × 40 mm × 39 mm particle composition.
Size d (mm)123
Number n250015002000
Table 6. 40 mm × 40 mm × 39 mm particle composition.
Sieving Size
(mm)
Mass Percentage m
(%)
E = 0.10 kwh/tE = 0.25 kwh/tE = 1 kwh/t
37.5014.750.000.00
26.5036.6521.770.00
19.0023.0528.684.93
13.2010.5012.949.60
9.504.507.1214.07
6.702.084.5919.34
4.751.783.3211.85
Less than 4.756.6921.5840.22
Total100100100
Publisher’s Note: MDPI stays neutral with regard to jurisdictional claims in published maps and institutional affiliations.

