Article

Synthesis and Characterization of Highly Photocatalytic Active Ce and Cu Co-Doped Novel Spray Pyrolysis Developed MoO3 Films for Photocatalytic Degradation of Eosin-Y Dye

1
Laboratoire de Physique de la Matière Condensée, Faculté des Sciences de Tunis, Université de Tunis El Manar, Tunis 2092, Tunisia
2
Department of Physics, Faculty of Science, King Khalid University, P.O. Box 9004, Abha 61413, Saudi Arabia
3
Renewable Energies, Dundalk Institute of Technology, A91K584 Dundalk, Ireland
*
Author to whom correspondence should be addressed.
Coatings 2022, 12(6), 823; https://doi.org/10.3390/coatings12060823
Submission received: 18 May 2022 / Revised: 7 June 2022 / Accepted: 8 June 2022 / Published: 11 June 2022
(This article belongs to the Topic Optical and Optoelectronic Materials and Applications)

Abstract

:
The current work deals with the fabrication of novel MoO3 nanostructured films with Ce and Cu co-doping through the spray pyrolysis route on a glass substrate maintained at 460 °C for the first time. The phase of developed films was approved by an X-ray diffraction study, and the crystallite size was determined between 82 and 92 nm. The optical transmission of the developed films was noticed to be reduced with doping and found between 45 and 90% for all films, and the absorption edge shifted to a higher wavelength with doping. The optical energy gap of the fabricated films was found to be reduced from 3.85 to 3.28 eV with doping. The developed films were used to degrade the harmful Eosin-Y dye under UV light. The system with 2% Ce and 1% Cu-doped MoO3 turned out to be the most effective catalyst for photodegradation of the dye in a period of 3H and almost degrade it. Hence, the MoO3 films prepared with 2% Ce and 1% Cu will be highly applicable as photocatalysts for the removal of hazardous dye from wastewater.

1. Introduction

Transition metal oxides (TMOs) are widely investigated for their unique features such as the existence of outer-shell d-electrons, crystallographic inhomogeneities, better surface selectivity, and, most importantly, their ability to develop various structural phases. They are mostly made up of transition metal and oxygen atoms in various stoichiometric compositions linked by covalent, ionic, or metallic bonds. These attractive qualities, combined with their cost-effective nature, lands them in various applications. In recent times, water treatment holds a critical position among the research community in the pursuit of achieving clean water for the masses. The development prospect of photocatalytic water treatment is great. Choosing a suitable photocatalytic reactor plays an extremely important role for application in wastewater treatment and effectively saving energy [1].
On this account, photocatalysis is a widely utilized technique to eliminate pollutants from water bodies, with sunlight as the source in mind [2,3,4]. The reaction mostly tends to happen on the semiconductor surface, which indicates the importance of improving its ability to adsorb pollutants and its ability to remove contaminants. It is also possible to remove pollutants from water by adsorption, which is another method. In this regard, it is important to develop materials with strong photocatalytic behavior and high adsorption capacity in a quick, efficient, and simple way. Even though adsorption and photocatalytic degradation have already been shown to work together, the metal oxide TiO2 is the most sought-after compound for this purpose, in addition to carbonaceous composites and other chemically synthesized metal oxide nanostructures. Although TiO2 is a well-known photocatalyst, research has focused on the photocatalytic properties of other semiconductors instead of TiO2 for the betterment and greater understanding of the mechanism. In such cases, molybdenum trioxide (MoO3) has been chosen for study since it has received less attention than other metal oxides such as ZnO, SnO, CoxOy, etc.
Molybdenum trioxide (MoO3) is among the commonly investigated TMOs for its structure, morphology, and size-dependent, tunable, optoelectronic properties, which have interested researchers worldwide [5]. In general, it appears in three different structures such as orthorhombic (α), monoclinic (β), and hexagonal crystallographic phases. The α phase is the most stable state among them, where the phase stability and crystal structure are dictated by the MoO6 octahedra, which are made up of six ‘O’ atoms and one ‘Mo’ atom [5,6,7,8,9]. From an application perspective, it has a variety of domains ranging from optoelectronic devices, chromism, energy storage, and catalysts. In the domain of photocatalysis, MoO3 nanostructures in powder form have been tested for their efficiency; however, the difficult process of retrieving the powder after the photodegradation experiment is also a matter of concern. This moves our focus towards thin films, where only fewer reports on MoO3 photocatalytic performance have been reported, which will be discussed later in this section.
MoO3 thin films can be prepared using a variety of processes, which includes CVD, MOCVD, PVD, sol–gel, hydrothermal, atomic layer deposition, molecular-beam epitaxy (MBE), and spray pyrolysis [6,7,8,9,10,11,12,13]. Among these techniques, spray pyrolysis thin-film coating is a facile and low-cost approach to fabricate large-area thin-film structures. This enables one to fabricate pin-hole free and smooth homogenous thin-film structures at different substrate temperatures. Thus, it is a highly sought-after technique to fabricate thin-film structures of oxides and sulfides in the II–VI group. Because of these attractive qualities and the profound experience in spray pyrolysis, we chose the same to develop thin-film structures. Few reports on MoO3 thin films by various research groups will now be discussed here before presenting the theme of the current article. Arfaoui et al. reported the testing of thermally evaporated MoO3 films for gas sensing, with a photocatalytic efficiency of 81% in methyl blue (MB) photodegradation [14,15]. Amorphous MoO3 thin-film structures were fabricated over a glass substrate by Mosso et al. [16,17], who reported a photodegradation efficiency of 54%. Further, reactive magnetron-sputtered amorphous MoO3 thin films were fabricated by Ponce-Mosso et al. [18]. They found that the fabricated films had low methylene blue (MB) adsorption under dark conditions, with less than 13% after 120 min of the photodegradation experiment. These reports are lower than those of powder/solution MoO3 systems, which could be linked to the adsorption of the MoO3 catalyst than the photocatalytic mechanism. In this situation, tuning the optical and electrical properties is a reliable option for the betterment/understanding of the degradation mechanism by using MoO3 films. Thus, doping of impurities is a well-known and efficient method for tuning the properties of MoO3 thin-film structures. In this regard, the doping of elements such as cobalt, cadmium, tin, zinc, and rare-earth components is introduced into the MoO3 host lattice [10,13,19,20,21,22,23]. The timeline implies that doping has become routine in many cases, and this thought process has paved the way for the co-doping of elements into the host lattice.
With this ambition, the co-doping of ‘Fe’ and ‘Co’ into the MoO3 lattice is carried out by the spray pyrolysis technique and shows promising signs in the photodegradation process [24]. Thus, the purpose of this experiment is to develop pure MoO3 thin-film structures and unearth the effect of co-doping ‘Cu’ and ‘Ce’ elements into the host lattice, which is the first of its kind. Various characterization techniques are utilized to characterize the pure and co-doped MoO3 thin-film structures. Finally, the ability of the prepared thin-film structures in the photodegradation of eosin yellow dye is presented.

2. Experimental Details

2.1. Ce-Cu-Doped MoO3 Thin-Film Deposition

The fabrication of MoO3 films was achieved on a glass substrate maintained at an optimized temperature of 460 °C. In a simple process, 0.01 M (NH4)6Mo7O24·4H2O solution was used. In this solution, the Ce/Mo and Cu/Mo molar ratios were set at 0, 1, and 2%. A carrier nitrogen gas pressure at 0.35 bar was used via a nozzle of 0.5 mm-dia. The flow rate was maintained at 4 mL/min during the deposition of films.

2.2. Characterization Techniques

The structure was confirmed by an X-ray diffractometer (Philips PW1729, Amsterdam, Netherlands) with Cu-Ka radiation (λ = 0.15405 nm). For optical analysis, such as reflectance R(λ) and transmittance T(λ), a spectrophotometer from PerkinElmer (Waltham, MA, USA) was employed over the 200 to 2000 nm region. The photocatalytic decomposition of Eosin-Y (EY) was studied under two UV lamps kept parallel with 16 W power. The dimensions of the developed films used for photocatalytic degradation of dye were ~1 × 1 cm2, which were placed in an aqueous solution containing 3 mg/L EY dye. Under dark surroundings, the solution was stirred magnetically for ~30 min to attain the adsorption–desorption equilibrium. For quantitative analysis of EY dye decomposition after UV illumination, the UV spectra were recorded.

3. Results and Discussion

3.1. X-ray Diffraction Analysis

The XRD patterns of undoped MoO3 thin film and various molar concentrations of Ce and Cu co-doped MoO3 films are presented in Figure 1. The XRD pattern of the MoO3 film was found to be polycrystalline in nature, and the obtained diffraction peaks were more consistent with the standard JCPDS No.05-0508 [9]. The peaks were indexed to the (0 2 0), (0 4 0), (0 2 1), and (0 6 0) planes, agreeing with the orthorhombic system of the α-MoO3 crystalline phase. The strongest diffraction peaks corresponding to the (0 k 0), orientation with k values of 2, 4, and 6, indicate the film has good crystallinity and the successful deposition of the MoO3 film. The Ce- and Cu-doped MoO3 films exhibit similar diffraction peaks to the MoO3 crystalline phase. No other characteristic peaks corresponding to the Ce or Cu phases were detected in the co-doped films, suggesting Ce and Cu elements are uniformly doped into MoO3 lattices without affecting the crystal structure of MoO3 [25]. However, the changes in peak position and intensities were evident with various Ce and Cu concentrations. The degradation of diffraction intensity in a doped sample has a familiar effect, and it usually occurs due to the induced lattice stress by the foreign atoms [26]. In our case, dopant elements with equal concentrations effectively decreased the intensity of all the peaks. However, the intensity of the peak obtained increased with different Ce and Cu molar concentrations, particularly with Ce 1% and Cu 2% molar ratio peak intensity, which increased higher than the pure MoO3. Usually, Cu2+ ions have an ionic radius of 73 pm, which is less than the ionic radii of Ce3+ and Ce4+ (103 and 92 pm) ions but slightly higher than the Mo6+ ion (59) [22,25]. Therefore, the Ce with a high doping concentration causes more crystalline degradation than the co-dopant of Cu. Similar results were observed in Ba and Sb co-doped SnO2 thin films reported by Ramarajan et al. [27]. Moreover, a significant shift in peak position was observed towards a higher angle with respect to pure MoO3 for ahigh Ce doping ratio. The shift towards the higher angle is owing to an increase in the interlayer distance by the partial replacement of the Mo atom in MoO3 by a dopant atom. In our case, the peak shift towards a higher angle occurs only with a high Ce concentration. This might be the interstitial substation of Mo6+ ions by Ce ions due to the larger ionic radii than the Cu ions. The impact of various doping concentrations on the lattice parameters of MoO3 was determined using the following relation:
1 d 2 = h 2 a 2 + k 2 b 2 + l 3 c 2
where a, b, and c are lattice constants, (hkl) are Miller indices, and ‘d’ is the interplanar distance. The estimated lattice constant of ‘a’ is 3.93 Å, ‘b’ is 13.66 Å, and ‘c’ is 3.68 Å. Bare MoO3 matched well with standard JCPDS data. The texture coefficient (TC) was also used in the quantitative investigation of crystal structure. The physical properties of the films may be influenced by the growth direction of textures during film formation. The following equation was used to estimate the texture coefficient of the films.
TC ( hkl ) = I ( hkl ) / I 0   ( hkl ) N 1   1 N I ( hkl ) / I 0 ( hkl )
where N is the number of diffraction peaks, I(hkl) is the obtained peak intensity, and I0 (hkl) is the standard peak intensity from JCPDS data. The TC was estimated for all the diffraction planes of the samples, and the values are summarized in Table 1. Among all the planes, the (0 4 0) plane was a highly textured coefficient in the co-doped film with Ce 1% Cu 2%. It seems co-doped MoO3 film had preferential growth along the (0 4 0) plane, and it varied with different Ce:Cu concentrations.
Hence, the lattice parameters such as grain size (D), microstrain ε, and dislocation density δ were calculated using the Scherrer relation as follows:
D = 0.9 λ β cos θ
ε = β cos θ 4
δ = 1 D 2
where β is FWHM, D is crystallite size, ε is micro-strain, and δ is dislocation density. The average D of the films was calculated, and the values are listed in Table 2. Upon doping Ce and Cu, the average crystallite size increased gradually up to the doping concentrations of Ce 2% Cu 1%. However, for higher concentrations (Ce 2% Cu 2%), the crystallite size was found to decrease due to the high microstrain value.

3.2. UV-DRS Spectroscopy

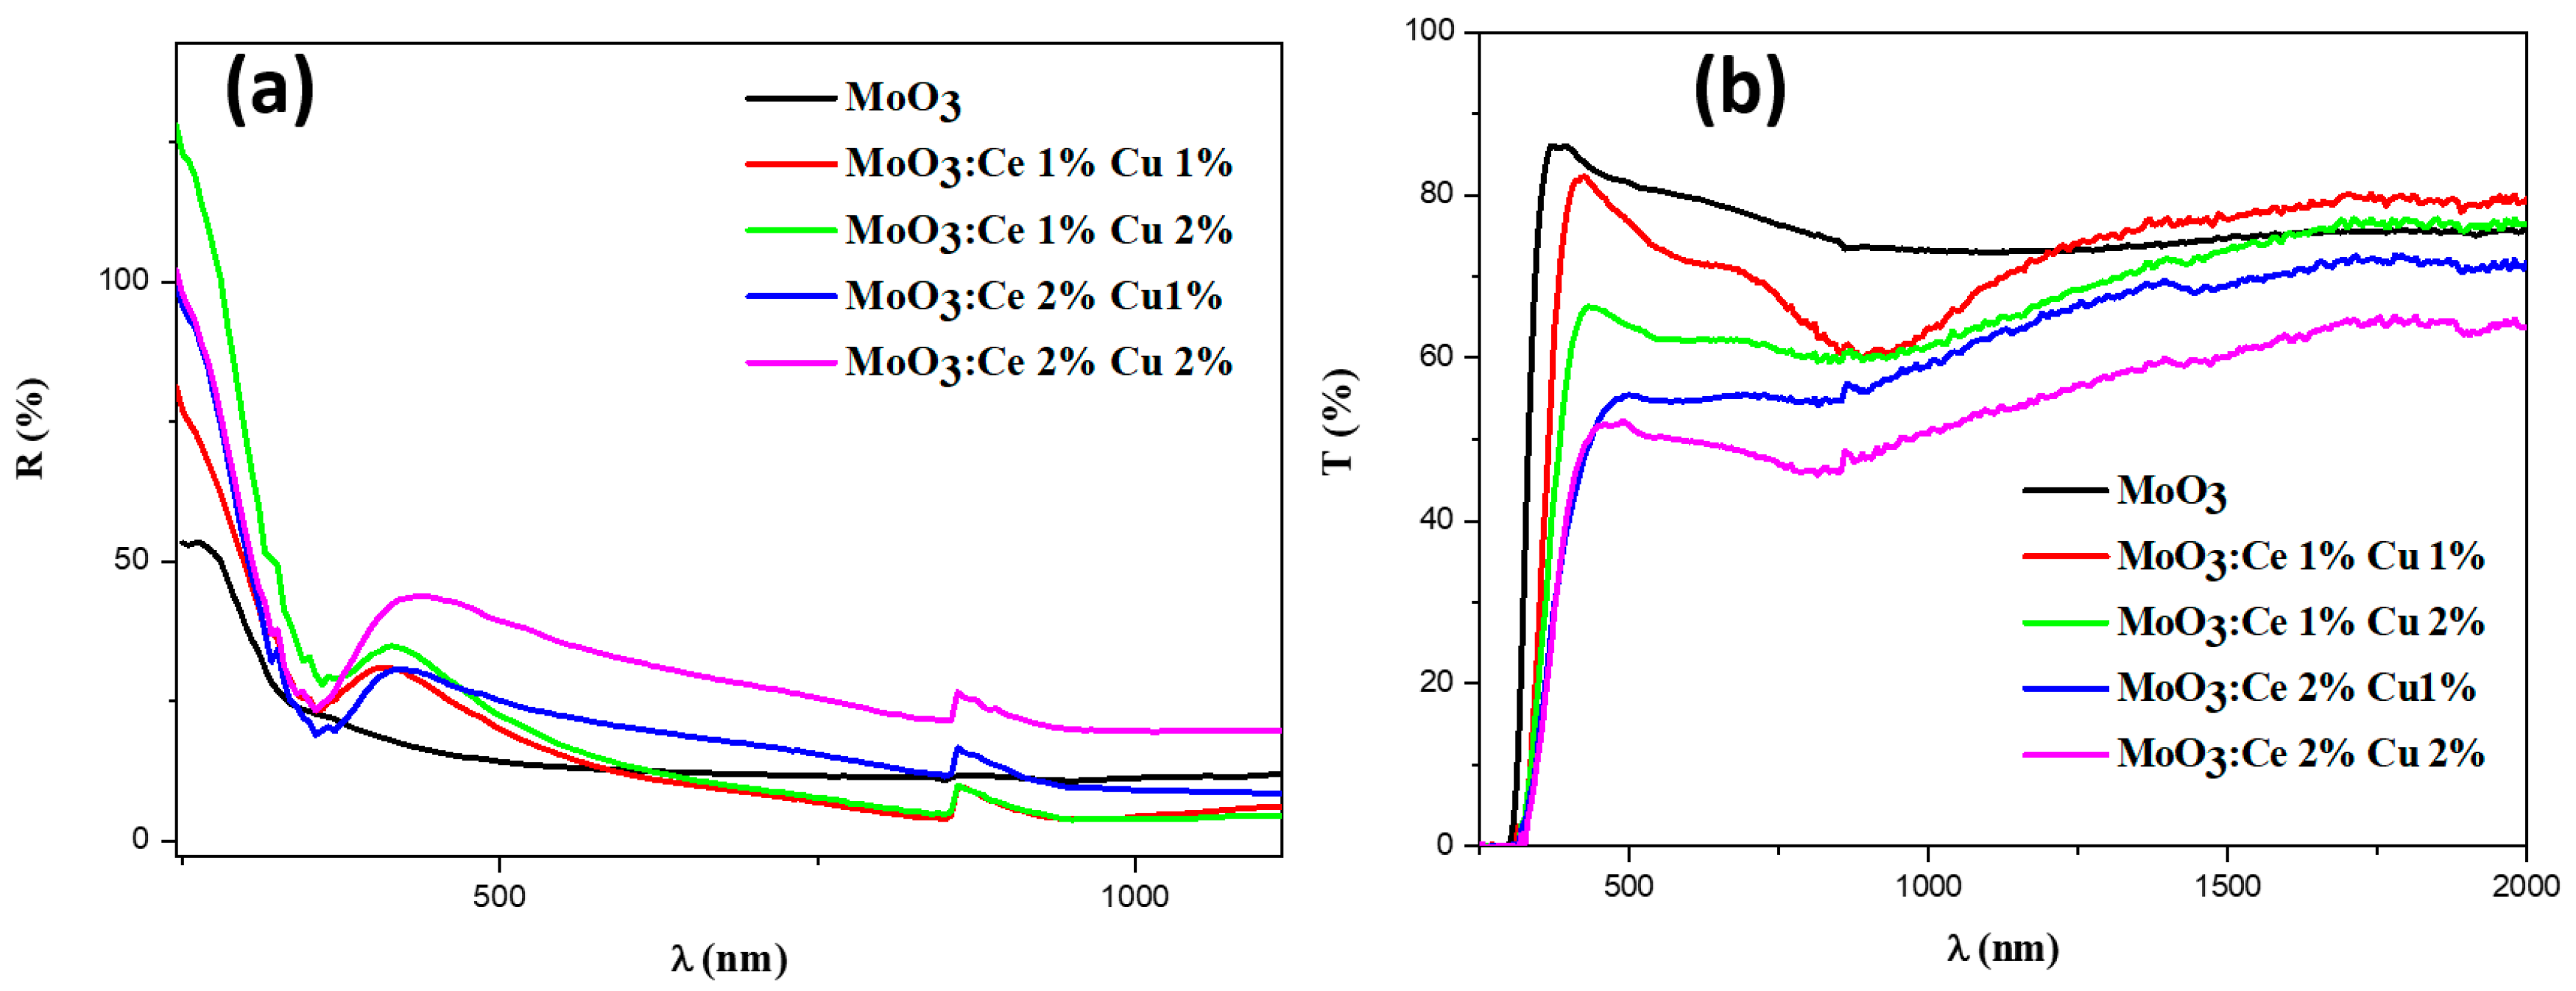
The optical characteristics of the prepared thin-film structures were examined by using UV-DRS spectroscopy. The obtained transmission and reflectance measurements are depicted in Figure 2a,b, respectively. The average optical transmission was found to be 70%, whereas the reflectance was 10–15% in the visible region. The Ce–Cu doping into the MoO3 structure induced significant changes in both the transmission and reflectance spectra. The MoO3:Ce 2% Cu 2% has the highest reflectance and lowest transmission among the films. The basic absorption edge of a semiconductor is the charge transition barrier among the highest almost-filled and the lowest nearly empty bands. For photon energies, the absorption is substantially lower compared to the energy gap, and it rises significantly for larger photon energies. In terms of the direct interband transition, the intrinsic absorption edge of the films can be examined. The absorption coefficient (α) is assessed using the relation α = 4πk/λ, where k is the coefficient of extinction, and λ is the wavelength of the EM spectrum.
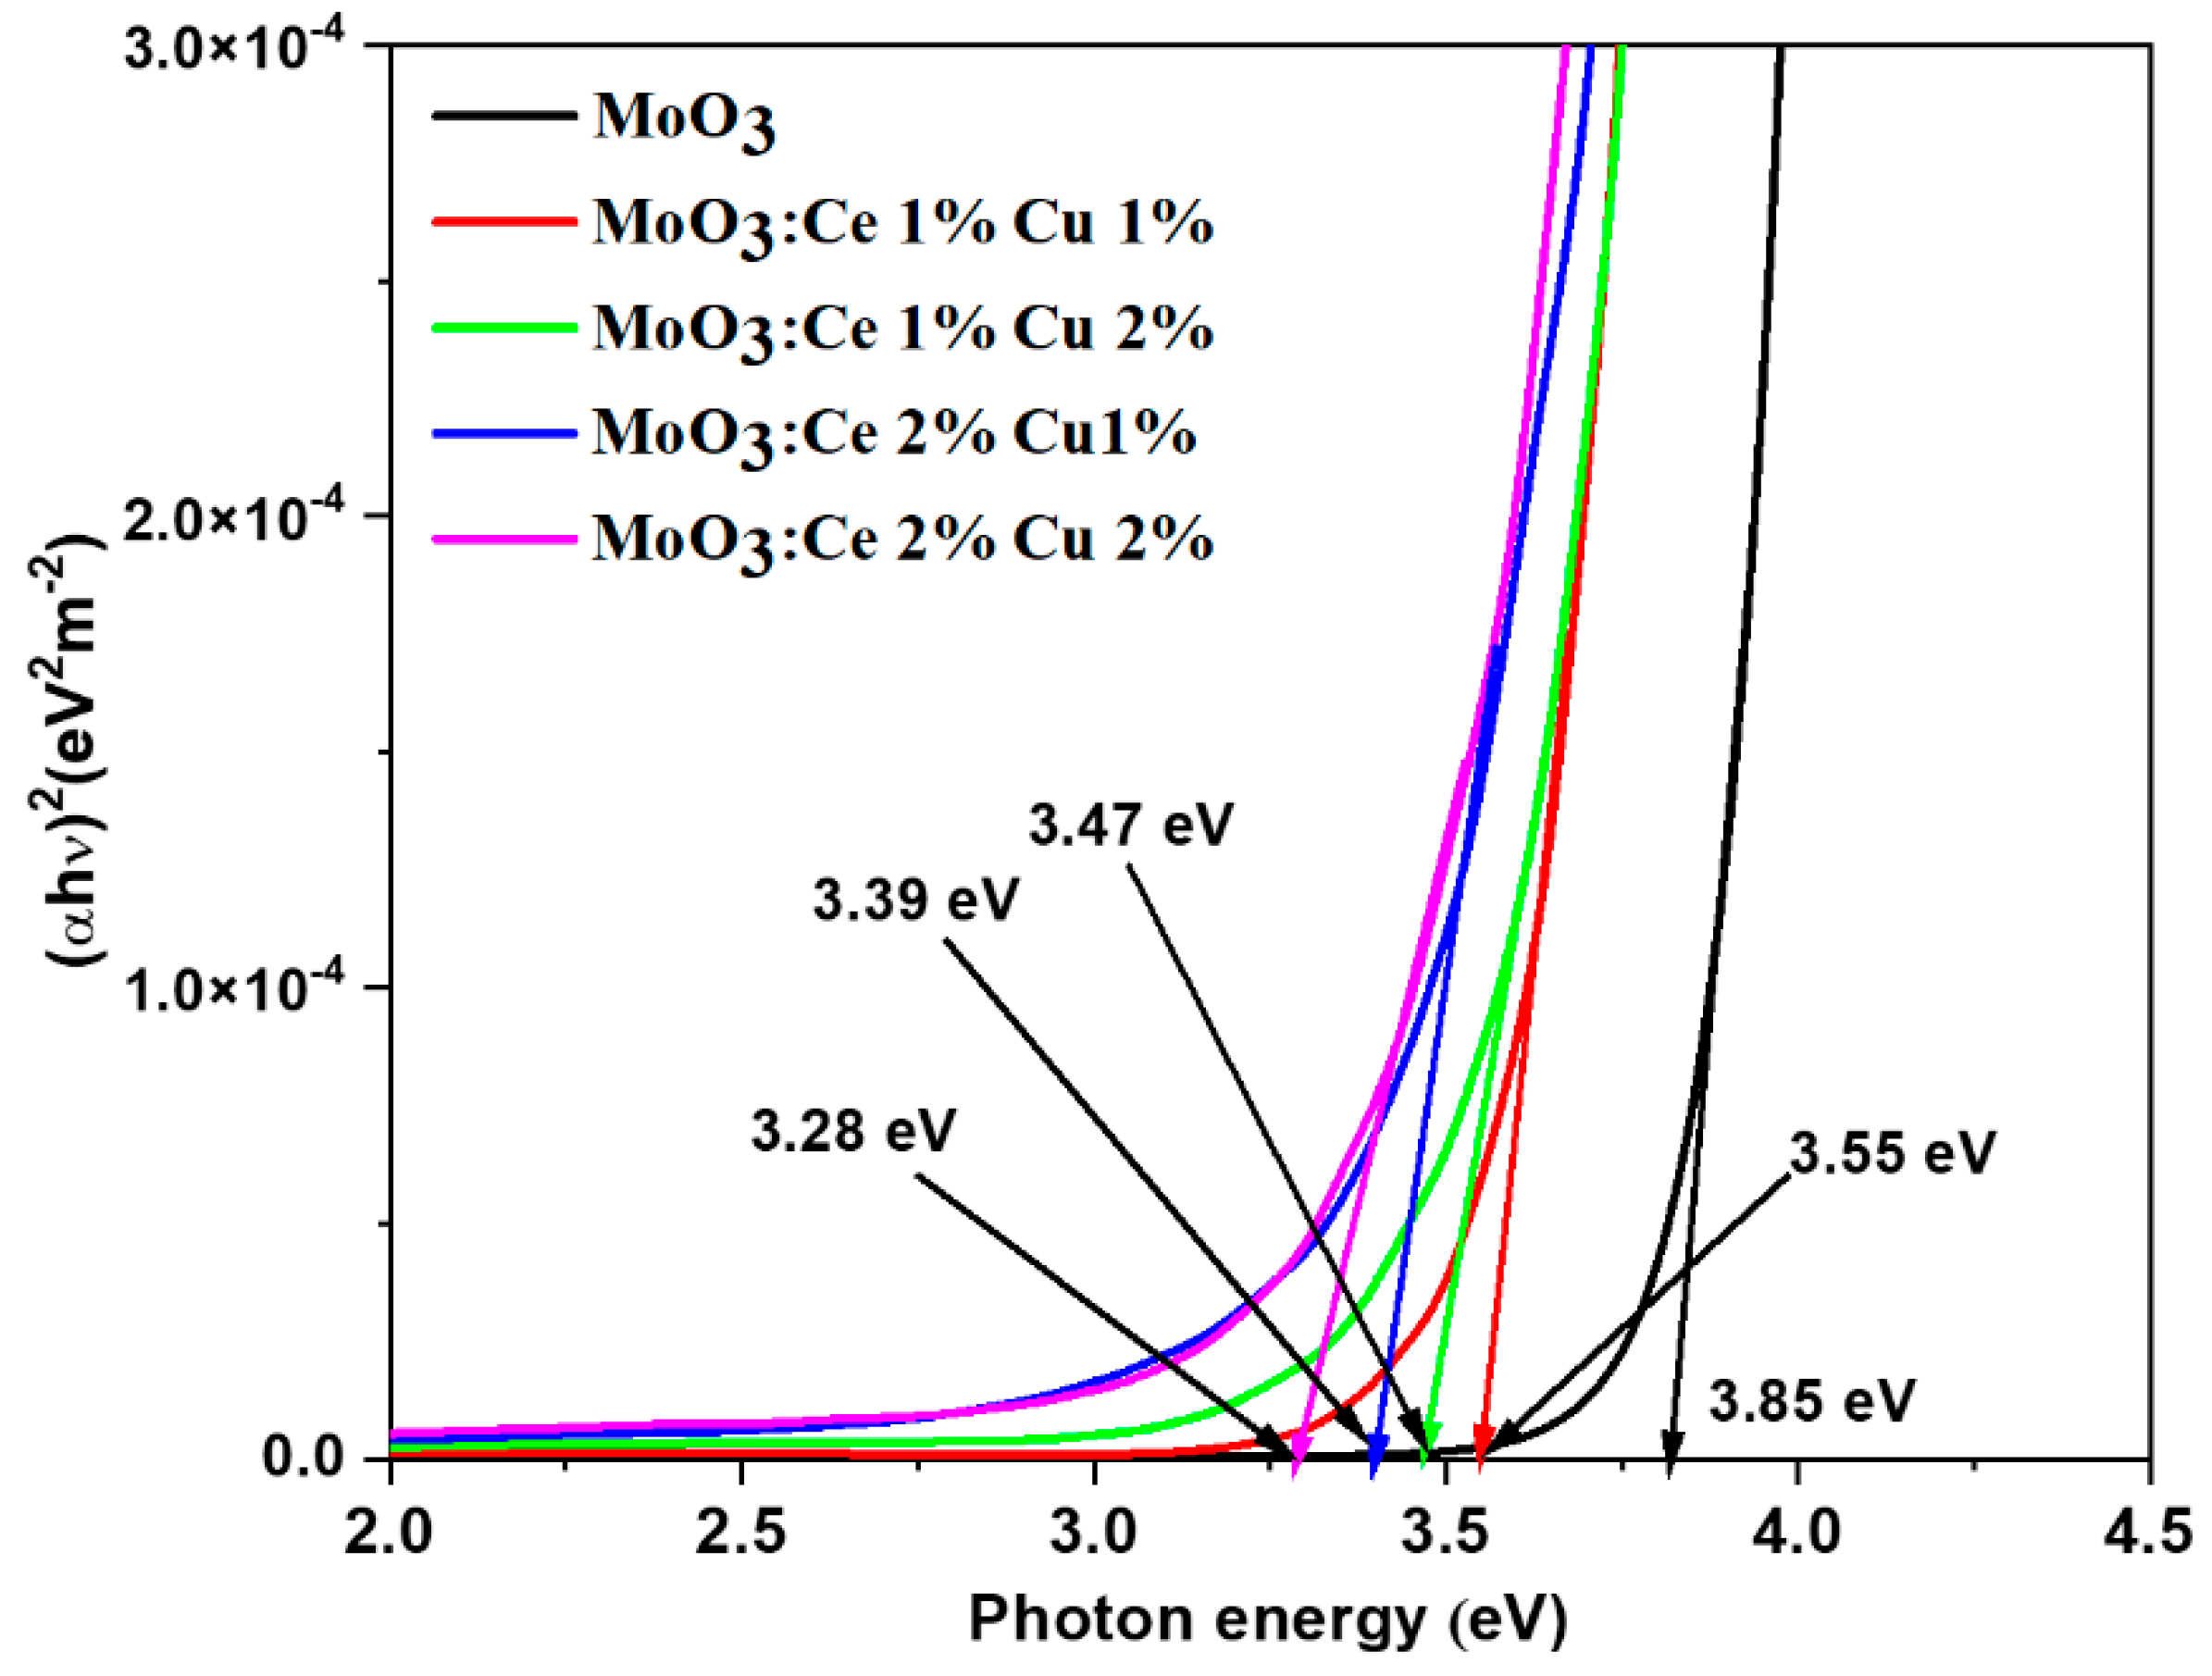
The (αhν)n versus photon energy (hν) plot, known as the Tauc plot, is expected to exhibit linear behavior in the higher energy area, corresponding to strong absorption around the absorption edge. Since the material is reported to be a direct band gap material, n = 2 is applied, and (αhν)2 versus photon energy (hν) is plotted. The extrapolation of the linear portion at x = 0 gives the bandgap of the material.
The extrapolation at x = 0 gives the deposited thin films’ optical band gap energy (Figure 3). The estimated values are 3.85, 3.55, 3.47, 3.39, and 3.28 eV for pure MoO3 and Ce–Cu co-doped MoO3 thin films (also given in Table 3). Addition of Ce and Cu ions into the MoO3 lattice led to a decrease in the bandgap values by the creation of additional energy levels in the band energy of the MoO3 structure. This is evident with the red shift in the shoulder peak in transmittance spectra. The dopants are reasonable for the narrowing of bandgap values with the assistance of subband states near to its valence and conduction band edges/maximum. However, this kind of exhibition can also be attributed to the created vacancy, defects, altered crystallite size, and compositional changes concerning the substituted dopants into the host system.
To investigate the defects and impact on the optical transitions, the Urbach tail/energy was estimated. The logarithmic absorption coefficient on the x-axis was plotted versus the photon energy (eV) on the y-axis (see Figure 4). A slope was drawn in the linear region/absorption edge region of the spectrum, whereas the reciprocal of the slope gives the Urbach energy (Eu) of the system. It is observed that the estimated Eu is found to increase with increasing dopant levels till MoO3:Cu 2%–Ce 1% and decreases at the maximum doped system (see Table 3). The bare MoO3 thin-film structure has an Eu of 0.19 eV, which increases to a value of 0.52 eV upon Cu 2%–Ce 1% inclusion into the host lattice. The thermal assistance to Eu can be considered as nullified since the experiments were performed at room temperature. Hence, the substitution of Ce–Cu at the Mo-site creates the disorder in electronic transitions and the structural defects in the system. The inserted Ce and Cu ions’ random distribution in the MoO3 lattice could lead to the difference between the doped ions and the host Mo ion. Such changes create disorders in the system, which may introduce subbands or new energy levels near the valence/conduction band with the help of a disorder or high Eu concerning the doping concentrations.

3.3. Photocatalytic Analysis

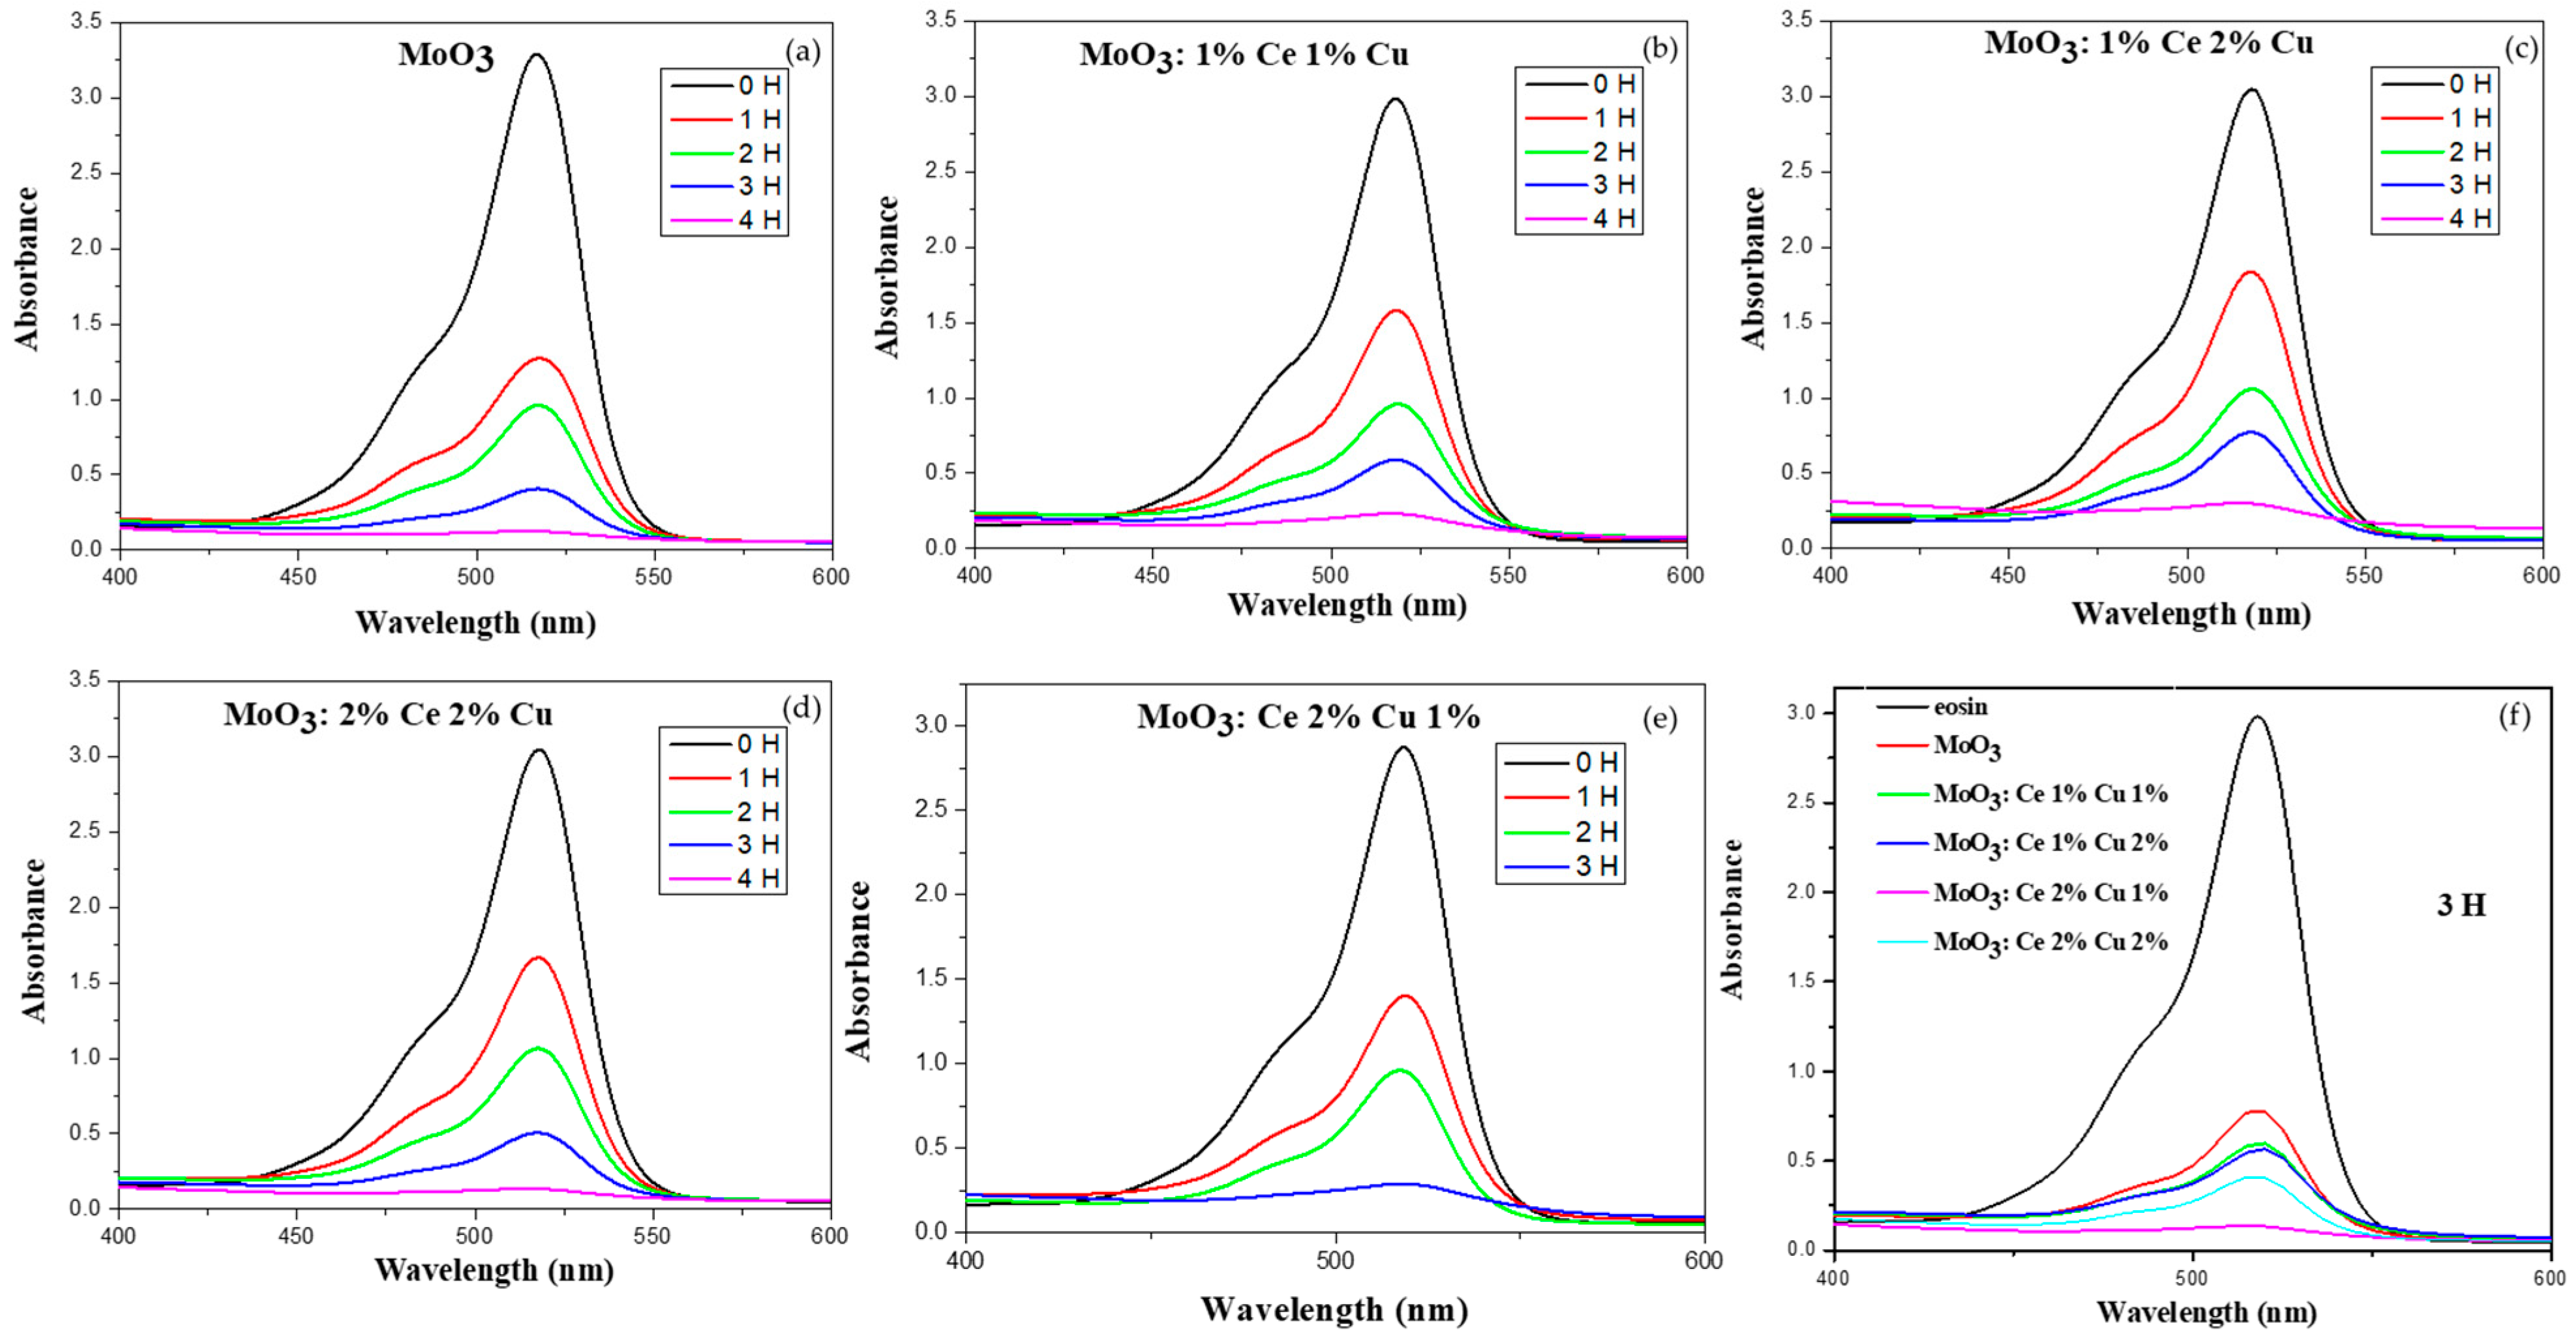
In this work, pure and co-doped MoO3 thin-film structures were taken for the photodegradation of Eosin yellow dye. The chosen bare dye has a strong absorbance maximum at 516 nm in the visible region of the EM spectrum. The experiment was carried out by adding respective compounds into the dye solution and irradiating them with a light source of nm. The photodegradation process was carried out for 4H, and the solution was retained from the experiment at the interval of a 1H period for assessing the photodegradation process. The absorbance of the retained solutions was measured since the concentration of the dye is directly linked to the intensity of the absorbance characteristics. The time dependence of absorbance was plotted versus the wavelength, as shown in Figure 5a–f. The maximum absorption of the added catalyst solution at 516 nm decreased exponentially with time. The dye components almost degraded (≥90%) for the 240 min (4H) photodegradation process in the bare and co-doped systems. Thus, the photodegradation time (3H)-dependent absorption features of Eosin Yellow dye with bare and various wt.% co-doped systems were considered for comparison. The system with 2% Ce- 1% Cu-doped MoO3 turned out to be the most effective catalyst for the photodegradation of dye in a period of 3H. It is noteworthy to state that the maximum co-doped system showed a decline in photodegradation, which implies the dopant exceeds the optimum level. If the dopant level exceeds the optimum, at higher doped systems, it will promote recombination of charge carriers, which could hinder the photocatalytic performance of such modified systems. In our case, 2% Ce- 1% Cu-doped MoO3 composition can be the right combination for the photodegradation process. Such good efficiency can be attributed to the dopant material’s ability to act as a charge carrier separator in the modified host system. Moreover, this behavior can be related to the change in trend in crystallite size, microstrain, and Urbach energy estimations beyond the 2% Ce- 1% Cu-doped MoO3 system. Logically, it motivated us to test the mentioned catalyst’s performance upon irradiation of sunlight. The catalyst photodegraded above 90% of the chosen dye in a 3H period. The photodegradation efficiency of the catalyst is estimated by using the relation
Efficiency   ( % ) = C 0 C C 0 × 100
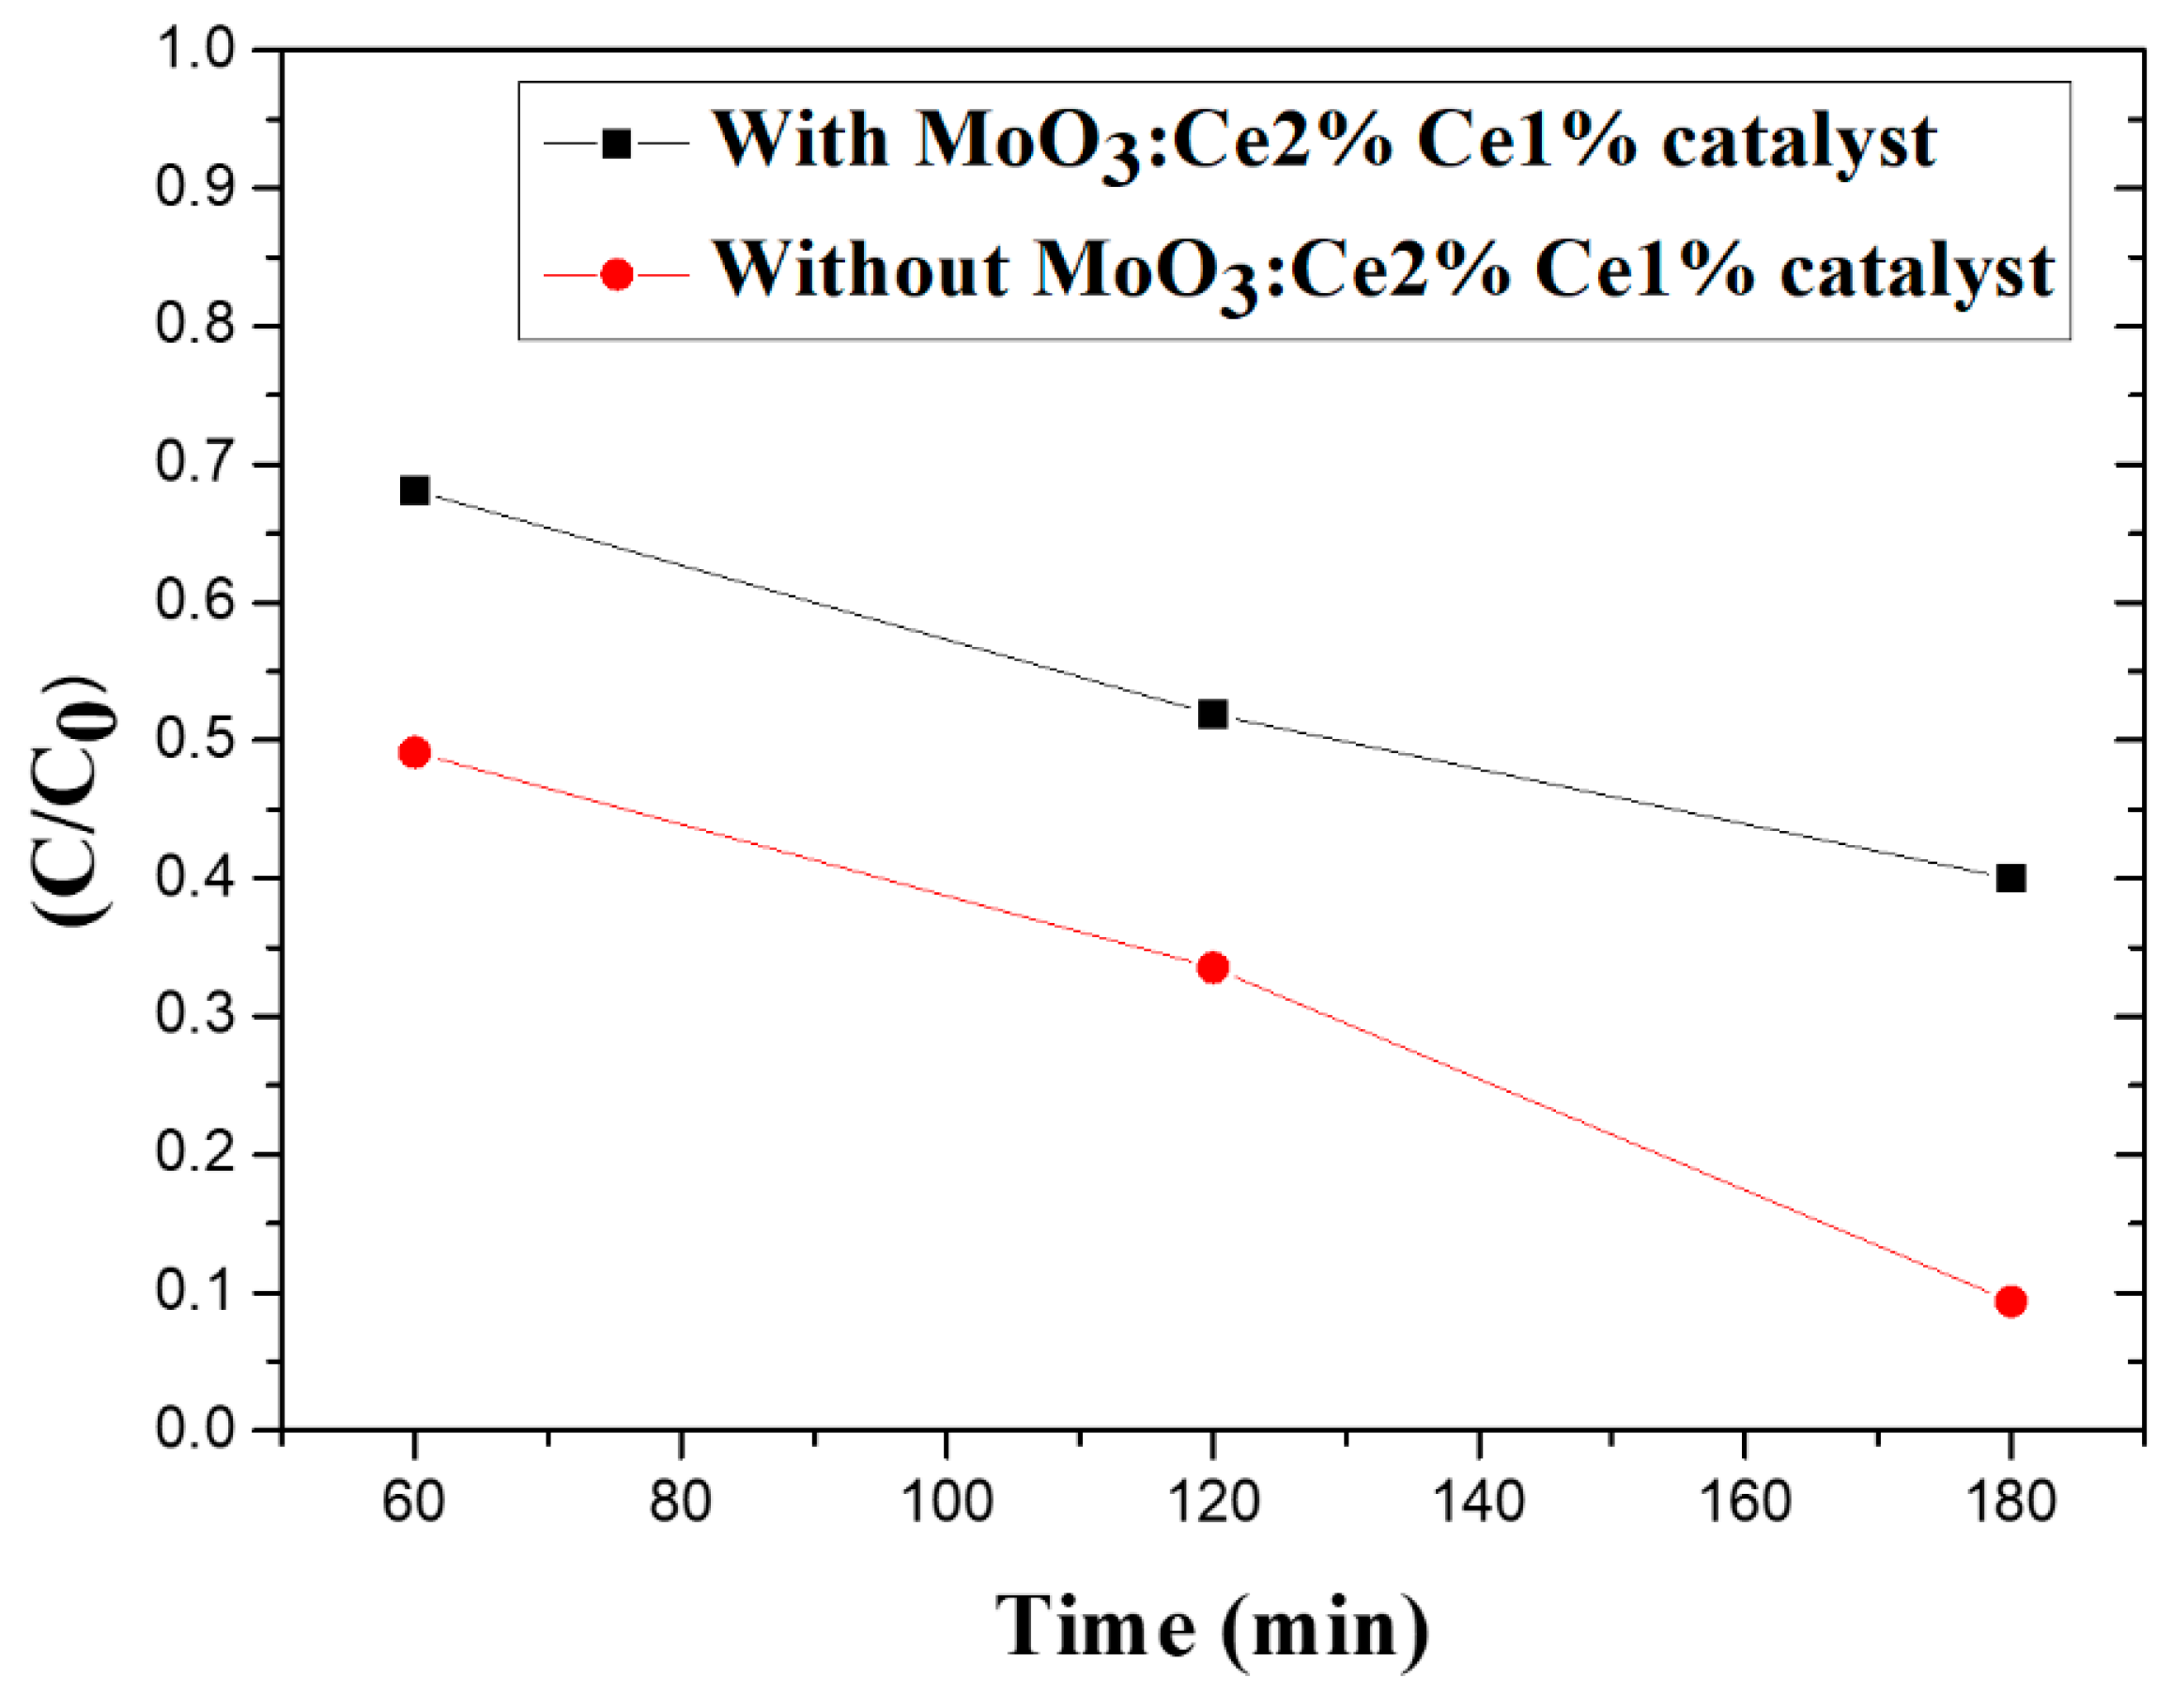
where C0 and C are the starting and final eosin yellow E-Y dye concentrations after photoirradiation. The pseudo-first-order kinetics were tracked by degradation performed under sunlight with and without the 2% Ce and 1% Cu-doped MoO3 catalyst. The L-H kinetics [27] were utilized to investigate the photodegradation kinetics of E-Y via below relation:
Ln ( C C 0 ) = kt
where k is the rate constant (min−1) for EY degradation, represented by ln(C/Co) vs. the t graph slope (see Figure 6 and Figure 7), and t is time of irradiation (min.). The linear behavior ensures the catalyst follows the first-order kinetics.

4. Conclusions

Herein, we developed novel Ce and Cu co-doped MoO3 films for the first time using the facile and cost-effective spray pyrolysis technique on glass kept at 460 °C. The single phase of developed Ce and Cu co-doped MoO3 films was approved by XRD analysis. The size of crystallites and texture coefficient values were estimated for all films. Low absorption and high optical transmission were noticed for the developed films. The optical transmission was reduced with doping, which was observed between 45 and 90%. The absorption edge of the films shifted to a higher wavelength with doping, and hence, the band gap of the fabricated films was found to be reduced from 3.85 to 3.28 eV with doping. The photocatalytic degradation of Eosin-Y dye in the presence of the developed films was investigated. The photocatalytic results indicate that the film of MoO3 with 2% Ce and 1% Cu co-doping is the most effective catalyst for dye degradation within a 3h period. The outcomes signify that 2% Ce and 1% Cu co-doped MoO3 films are highly useful for the removal of hazardous Eosin-Y dye from wastewater. Hence, the prepared films of MoO3 with Ce and Cu combination can be used as excellent photocatalysts in degrading harmful dyes.

Author Contributions

Investigation, O.K. and A.G.; Resources, N.E.G.; Writing—original draft, M.S. and N.T.-K. All authors have read and agreed to the published version of the manuscript.

Funding

This research received no external funding.

Institutional Review Board Statement

Not applicable.

Informed Consent Statement

Not applicable.

Data Availability Statement

Data is contained within the article.

Conflicts of Interest

The authors declare no conflict of interest.

References

  1. Al Boukhari, J.; Zeidan, L.; Khalaf, A.; Awad, R. Synthesis, characterization, optical and magnetic properties of pure and Mn, Fe and Zn doped NiO nanoparticles. Chem. Phys. 2019, 516, 116–124. [Google Scholar] [CrossRef]
  2. Chen, Y.; Xu, M.; Wen, J.; Wan, Y.; Zhao, Q.; Cao, X.; Ding, Y.; Wang, Z.L.; Li, H.; Bian, Z. Selective recovery of precious metals through photocatalysis. Nat. Sustain. 2021, 4, 618–626. [Google Scholar] [CrossRef]
  3. Bahnemann, D. Photocatalytic water treatment: Solar energy applications. Sol. Energy 2004, 77, 445–459. [Google Scholar] [CrossRef]
  4. Ravelli, D.; Dondi, D.; Fagnoni, M.; Albini, A. Photocatalysis. A multi-faceted concept for green chemistry. Chem. Soc. Rev. 2009, 38, 1999–2011. [Google Scholar] [CrossRef]
  5. de Castro, I.A.; Datta, R.S.; Ou, J.Z.; Castellanos-Gomez, A.; Sriram, S.; Daeneke, T.; Kalantar-zadeh, K. Molybdenum Oxides—From Fundamentals to Functionality. Adv. Mater. 2017, 29, 1701619. [Google Scholar] [CrossRef]
  6. Ammar, I.; Gassoumi, A.; Akkari, A.; Delpech, F.; Ammar, S.; Turki-Kamoun, N. Deposition of SnS thin films by chemical bath deposition method: Effect of surfactants. Eur. Phys. J. Plus 2019, 134, 505. [Google Scholar] [CrossRef]
  7. Kamoun, O.; Gassoumi, A.; Kouass, S.; Alhalaili, B.; Vidu, R.; Turki-Kamoun, N. An Investigation on the Synthesis of Molybdenum Oxide and Its Silica Nanoparticle Composites for Dye Degradation. Nanomaterials 2020, 10, 2409. [Google Scholar] [CrossRef]
  8. Tomás, S.A.; Arvizu, M.A.; Zelaya-Angel, O.; Rodríguez, P. Effect of ZnSe doping on the photochromic and thermochromic properties of MoO3 thin films. Thin Solid Films 2009, 518, 1332–1336. [Google Scholar] [CrossRef]
  9. Pandeeswari, R.; Jeyaprakash, B.G. Nanostructured α-MoO3 thin film as a highly selective TMA sensor. Biosens. Bioelectron. 2014, 53, 182–186. [Google Scholar] [CrossRef]
  10. Pérez-González, M.; Morales-Luna, M.; Santoyo-Salazar, J.; Crotte-Ledesma, H.; García-Tinoco, P.E.; Tomás, S.A. Improved adsorption and photocatalytic removal of methylene blue by MoO3 thin films: Role of the sputtering power, film thickness, and sputtering working pressure. Catal. Today 2021, 360, 138–146. [Google Scholar] [CrossRef]
  11. Ghaleghafi, E.; Rahmani, M.B. Facile synthesis, characterization, and photoluminescence of lamellar α-MoO3 thin films. Solid State Sci. 2019, 94, 85–91. [Google Scholar] [CrossRef]
  12. Zhang, Y.; Ping, X.; Hao, L.; He, Y.; Guo, Y.; Zhao, Q.; Zheng, Z.; Lu, Y. Facile preparation of anodized MoO3−x films and their boosted photocatalytic activity. J. Environ. Chem. Eng. 2021, 9, 105565. [Google Scholar] [CrossRef]
  13. Al-Otaibi, A.L.; Ghrib, T.; Alqahtani, M.; Alharbi, M.A.; Hamdi, R.; Massoudi, I. Structural, optical and photocatalytic studies of Zn doped MoO3 nanobelts. Chem. Phys. 2019, 525, 110410. [Google Scholar] [CrossRef]
  14. Szkoda, M.; Trzciński, K.; Klein, M.; Siuzdak, K.; Lisowska-Oleksiak, A. The influence of photointercalaction and photochromism effects on the photocatalytic properties of electrochemically obtained maze-like MoO3 microstructures. Sep. Purif. Technol. 2018, 197, 382–387. [Google Scholar] [CrossRef]
  15. Arfaoui, A.; Touihri, S.; Mhamdi, A.; Labidi, A.; Manoubi, T. Structural, morphological, gas sensing and photocatalytic characterization of MoO3 and WO3 thin films prepared by the thermal vacuum evaporation technique. Appl. Surf. Sci. 2015, 357, 1089–1096. [Google Scholar] [CrossRef]
  16. Alex, K.V.; Jayakrishnan, A.R.; Ajeesh Kumar, S.; Ibrahim, A.S.; Kamakshi, K.; Silva, J.P.B.; Sekhar, K.C.; Gomes, M.J.M. Substrate temperature induced effect on microstructure, optical and photocatalytic activity of ultrasonic spray pyrolysis deposited MoO3 thin films. Mater. Res. Express 2019, 6, 066421. [Google Scholar] [CrossRef]
  17. Song, K.Y.; Park, M.K.; Kwon, Y.T.; Lee, H.W.; Chung, W.J.; Lee, W.I. Preparation of Transparent Particulate MoO3/TiO2 and WO3/TiO2 Films and Their Photocatalytic Properties. Chem. Mater. 2001, 13, 2349–2355. [Google Scholar] [CrossRef]
  18. Ponce-Mosso, M.; Pérez-González, M.; García-Tinoco, P.E.; Crotte-Ledesma, H.; Morales-Luna, M.; Tomás, A.S. Enhanced photocatalytic activity of amorphous MoO3 thin films deposited by rf reactive magnetron sputtering. Catal. Today 2020, 349, 150–158. [Google Scholar] [CrossRef]
  19. Gomathi, K.; Padmanathan, S.; Ali, A.M.; Rajamanickam, A.T. Construction of Ni doped MoO3 nanostructures and their application as counter electrode in dye-sensitized solar cells. Inorg. Chem. Commun. 2022, 135, 109079. [Google Scholar] [CrossRef]
  20. Kumar, A.; Prajapati, C.S.; Sahay, P.P. Results on the microstructural, optical and electrochromic properties of spray-deposited MoO3 thin films by the influence of W doping. Mater. Sci. Semicond. Process. 2019, 104, 104668. [Google Scholar] [CrossRef]
  21. Huang, L.; Xu, H.; Zhang, R.; Cheng, X.; Xia, J.; Xu, Y.; Li, H. Synthesis and characterization of g-C3N4/MoO3 photocatalyst with improved visible-light photoactivity. Appl. Surf. Sci. 2013, 283, 25–32. [Google Scholar] [CrossRef]
  22. Balaji, M.; Chandrasekaran, J.; Raja, M.; Marnadu, R. Impact of Cu concentration on the properties of spray coated Cu-MoO 3 thin films: Evaluation of n-CuMoO3/p-Si junction diodes by J-V, Norde and Cheung’s methods. Mater. Res. Express 2019, 6, 106404. [Google Scholar] [CrossRef]
  23. Benameur, N.; Chakhoum, M.A.; Boukhachem, A.; Dahamni, M.A.; Ghamnia, M.; Hacini, N.; Pireaux, J.P.; Houssiau, L.; Ziouche, A. Investigation of some physical properties of pure and Co-doped MoO3 synthesized on glass substrates by the spray pyrolysis method. J. Electron Spectrosc. Relat. Phenom. 2019, 234, 71–79. [Google Scholar] [CrossRef]
  24. Kamoun, O.; Mami, A.; Amara, M.A.; Vidu, R.; Amlouk, M. Nanostructured Fe,Co-codoped MoO3 thin films. Micromachines 2019, 10, 138. [Google Scholar] [CrossRef] [PubMed] [Green Version]
  25. Li, P.H.; Song, Z.Y.; Yang, M.; Chen, S.H.; Xiao, X.Y.; Duan, W.; Li, L.N.; Huang, X.J. Electrons in Oxygen Vacancies and Oxygen Atoms Activated by Ce3+/Ce4+ Promote High-Sensitive Electrochemical Detection of Pb(II) over Ce-Doped α-MoO3 Catalysts. Anal. Chem. 2020, 92, 16089–16096. [Google Scholar] [CrossRef] [PubMed]
  26. Giba, A.E.; Pigeat, P.; Bruyere, S.; Rinnert, H.; Soldera, F.; Mücklich, F.; Gago, R.; Horwat, D. Strong Room Temperature Blue Emission from Rapid Thermal Annealed Cerium-Doped Aluminum (Oxy)Nitride Thin Films. ACS Photonics 2017, 4, 1945–1953. [Google Scholar] [CrossRef]
  27. Ramarajan, R.; Kovendhan, M.; Thangaraju, K.; Joseph, D.P.; Babu, R.R.; Elumalai, V. Enhanced optical transparency and electrical conductivity of Ba and Sb co-doped SnO2 thin films. J. Alloys Compd. 2020, 823, 153709. [Google Scholar] [CrossRef]
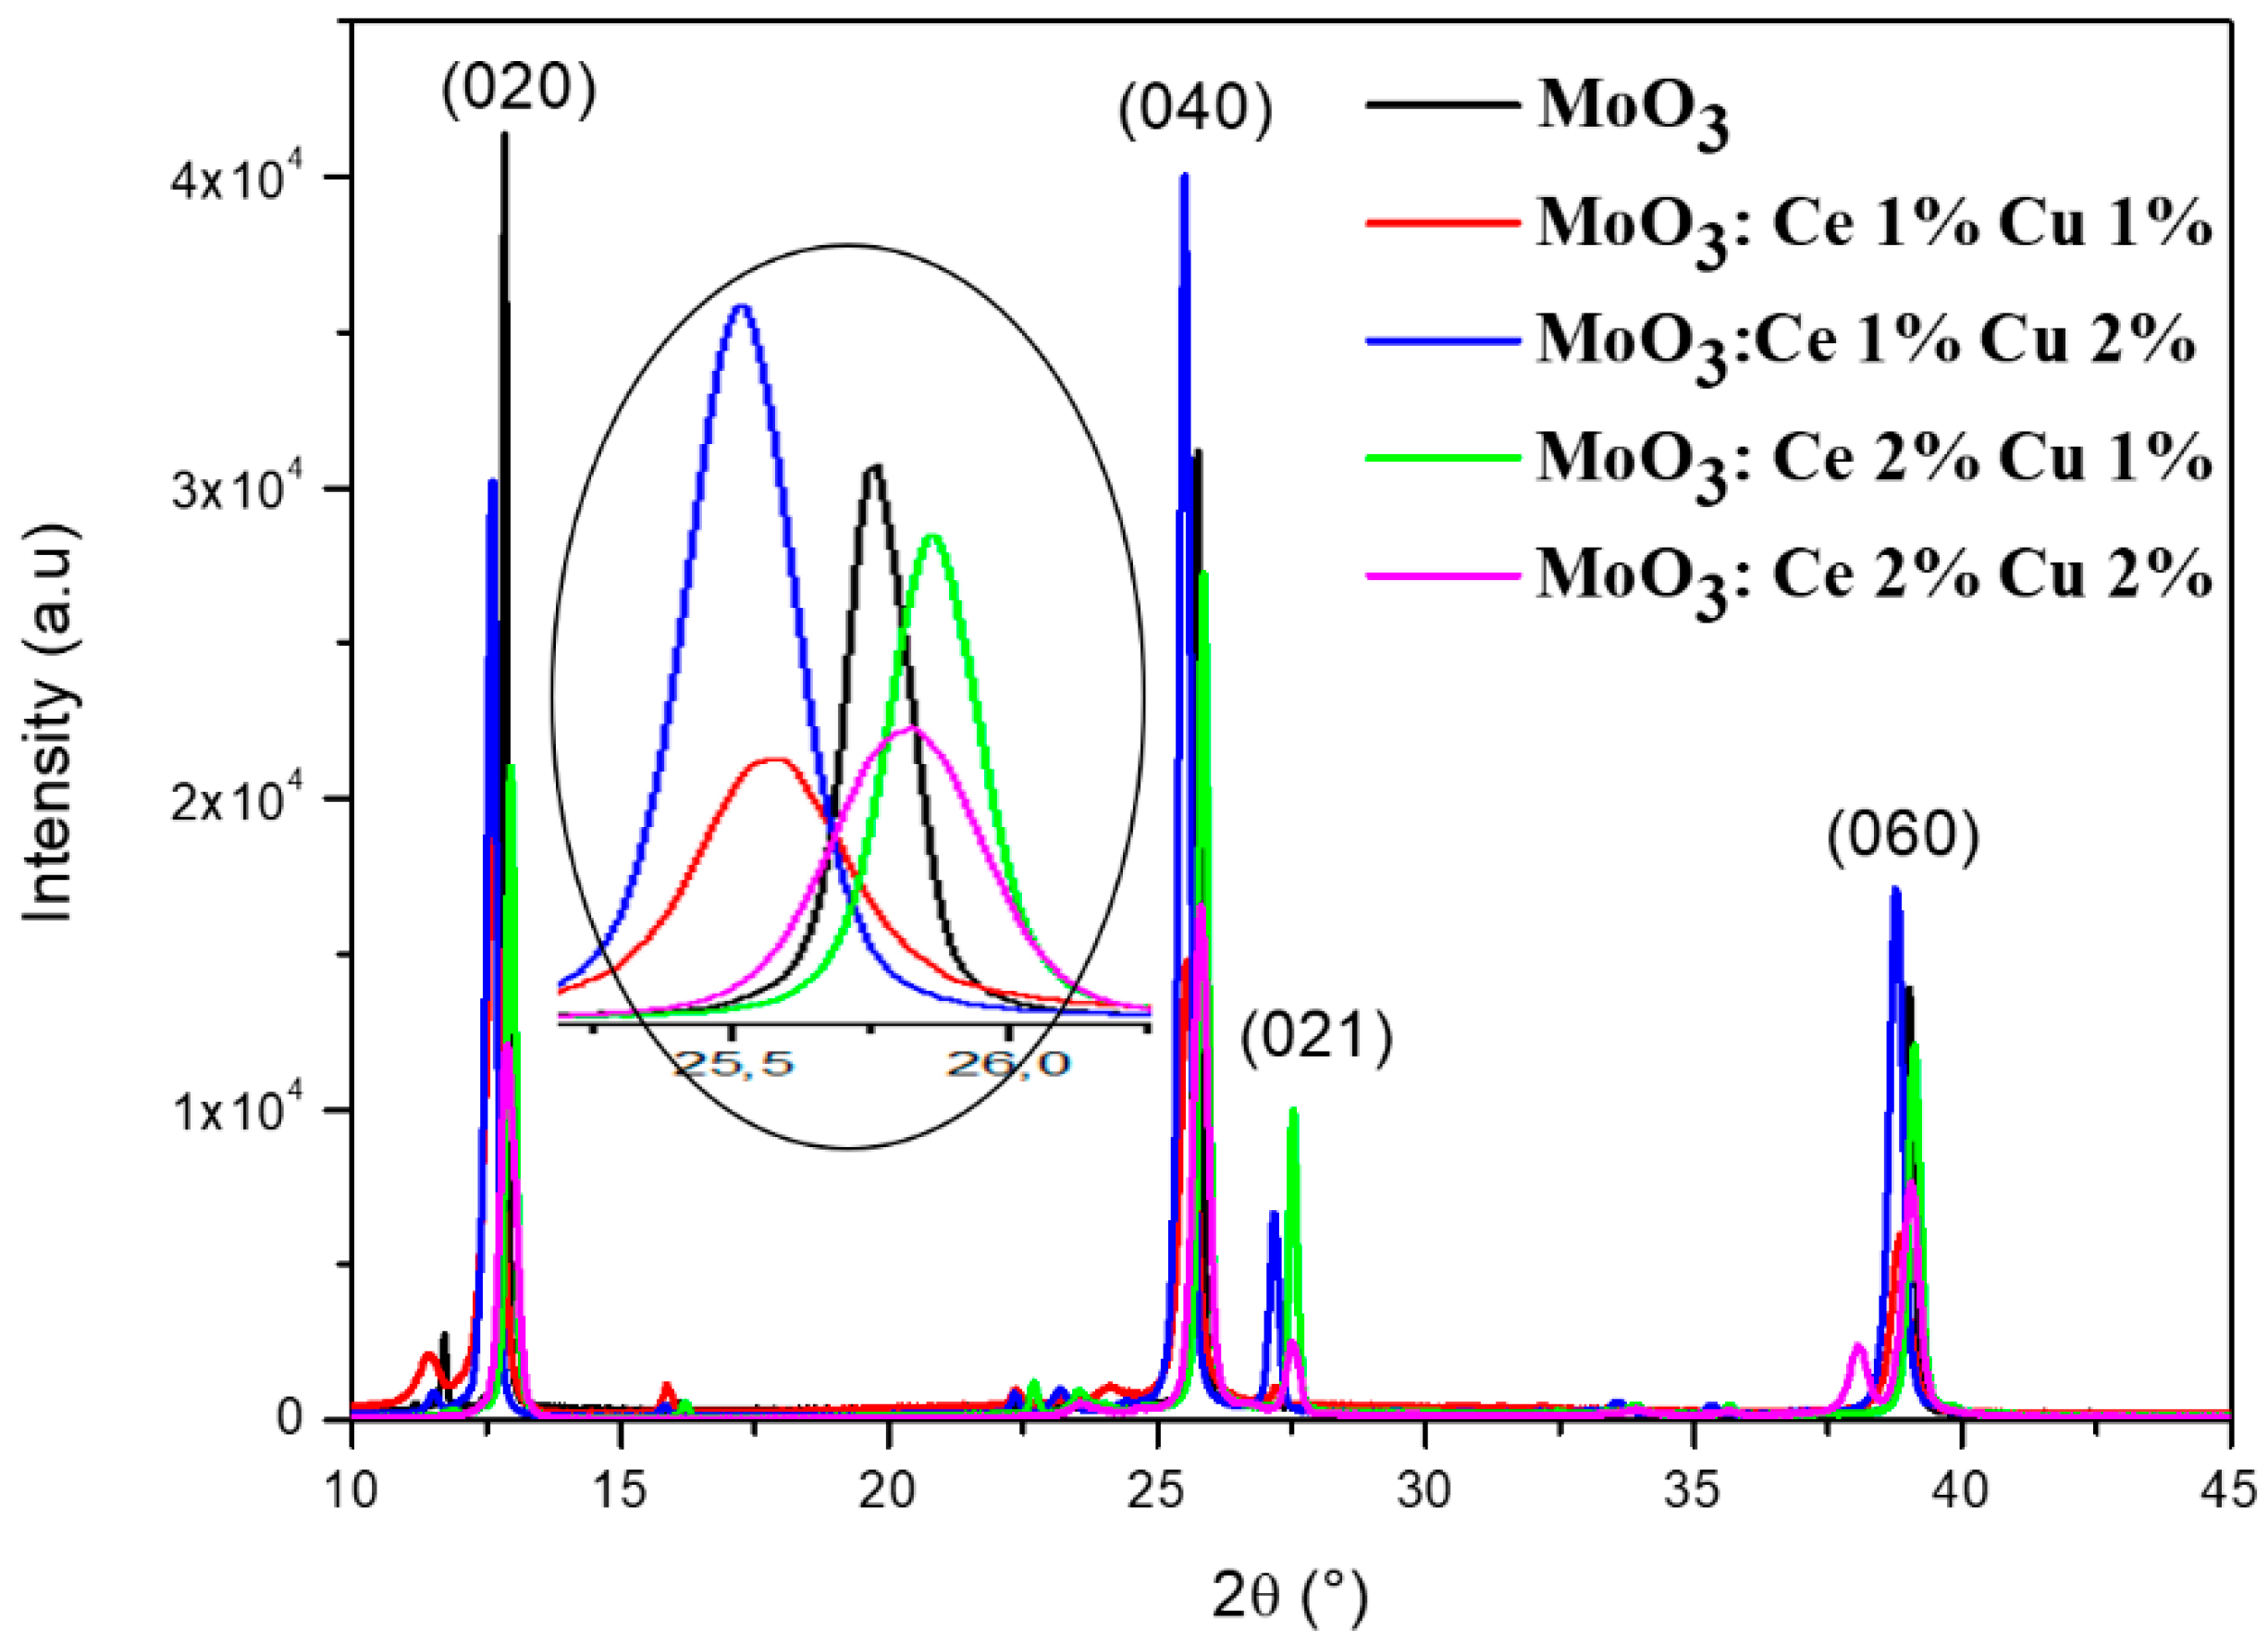
Figure 1. X-ray diffraction spectra of Ce and Cu co-doped MoO3 thin films.
Coatings 12 00823 g001
Figure 2. (a) Reflectance spectrum and (b) transmission spectra of undoped and Ce–Cu co-doped MoO3 structures.
Coatings 12 00823 g002
Figure 3. (αhν)2 vs. hν for MoO3:Ce–Cu thin films.
Coatings 12 00823 g003
Figure 4. Lnα vs. hν spectra of MoO3:Ce–Cu sprayed thin films.
Coatings 12 00823 g004
Figure 5. UV-VIS spectra of photodegradation of Eosin-Y under sunlight, with and without MoO3:Ce2% Cu1% catalyst thin film for [S] = 40 × 10−3 M after (1, 2 and 3 H). (a) MoO3 (b) MoO3:Ce 1% Cu 1% (c) MoO3:Ce 1% Cu 2% (d) MoO3:Ce 2% Cu 1% (e) MoO3:Ce 2% Cu 2% and (f) Eosin-Y.
Coatings 12 00823 g005
Figure 6. Photodegradation rate (C/C0) of Eosin-Y versus sunlight irradiation time, without and with MoO3:Ce 2% Cu 1% catalyst thin film for [S] = 40 × 10−3 M.
Coatings 12 00823 g006
Figure 7. First-order linear plot of ln(C0/C) of Eosin-Y versus sunlight irradiation time, without and with MoO3:Ce2% Cu1% catalyst thin film for [S] = 40 × 10−3 M.
Coatings 12 00823 g007
Table 1. Different texture coefficient TC (hkl) values of MoO3:Ce–Cu spayed thin films.
(hkl)MoO3MoO3:Ce 1% Cu 1%MoO3:Ce 1% Cu 2%MoO3:Ce 2% Cu 1%MoO3:Ce 2% Cu 2%
TC (020)1.921.901.231.220.77
TC (040)1.441.501.691.540.25
TC (021)--0.270.561.74
TC (060)0.640.600.710.681.24
Table 2. Crystallite size D, the microstrain ε and dislocation density δdis for MoO3 thin films grown for different contents of Ce and Cu in the spray solution.
SamplesD
(nm)
ε (10−4)δdis
(1014 Lines/m2)
MoO382.72.991.5
MoO3:Ce 1% Cu 1%85.37.071.4
MoO3:Ce 1% Cu 2%87.14.871.3
MoO3:Ce 2% Cu 1%92.04.141.2
MoO3:Ce 2% Cu 2%88.56.821.3
Table 3. Optical band gap Eg and Urbach energy for MoO3:Ce–Cu.
SamplesEg (eV)Eu (meV)
MoO33.85190
MoO3:Ce 1% Cu 1%3.55256
MoO3:Ce 1% Cu 2%3.47370
MoO3:Ce 2% Cu 1%3.39525
MoO3:Ce 2% Cu 2%3.28460
Publisher’s Note: MDPI stays neutral with regard to jurisdictional claims in published maps and institutional affiliations.