Article

Intelligent Evaluation of Marine Corrosion of Q420 Steel Based on Image Recognition Method

1
State Key Laboratory of Eco-Hydraulics in Northwest Arid Region, Xi’an University of Technology, Xi’an 710048, China
2
Science and Technology on Liquid Rocket Engine Laboratory, Xi’an Aerospace Propulsion Institute, Xi’an 710100, China
3
Power China Kunming Engineering Corporation Limited, Kunming 650051, China
*
Authors to whom correspondence should be addressed.
Coatings 2022, 12(7), 881; https://doi.org/10.3390/coatings12070881
Submission received: 28 April 2022 / Revised: 31 May 2022 / Accepted: 15 June 2022 / Published: 22 June 2022
(This article belongs to the Special Issue Liquid–Fluid Interfaces and Dynamics)

Abstract

:
Marine engineering materials are prone to serious corrosion damage, which affects the efficiency and reliability of marine equipment. The diversity of corrosion morphology makes it difficult to achieve the quantification and standardization of the microscopic local information on the corroded surface, which is of great significance to reveal the multi-scale corrosion mechanism. In this paper, an image intelligent recognition method for the corrosion damage of Q420 steel in seawater is established, which is based on the gray level co-occurrence matrix, binary image method and fractal model. Through the feature extraction of corrosion morphology, the quantitative analysis of corrosion morphology and the microscopic evaluation of corrosion characteristics are achieved. The image recognition data are consistent with the electrochemical result for most cases, which confirms the validity of this image intelligent recognition method. The average gray value and energy value of corrosion morphology reduces with the Cl concentration, indicating that the corrosion damage aggravates gradually. The increasing standard deviation and entropy reflects that the randomness of the pit distribution increases. The pitting ratio increases from 20.19% to 51.64% as the Cl concentration increases from 50% to 200% of the standard solution. However, there exists a discrepancy for high Cl concentration because of the irregular corrosion morphology and various pit depth. The fractal dimension increases with the complexity of the corroded surface at low Cl concentration, but the fractal dimension decreases at high Cl concentration because the corrosion complexity is interfered by the interconnection of corrosion holes due to the accelerated pit evolution.

1. Introduction

The metal components in a seawater environment are easily subjected to serious corrosion damage, leading to efficiency loss, mechanical vibration and environment pollution [1,2,3]. This corrosion behavior is affected by the coupling of various physical and chemical processes in different scales, including ion mass transfer, the deposition of corrosion products, and chemical and electrochemical reactions [4], which make the corrosion morphology complex. The size, geometric structure and area distribution of corrosion pits vary significantly with the exposure time and chemical environment, posing a challenge to the quantitation and characterization of corrosion damage. The quantitation analysis of corrosion morphology is important to reveal the corrosion mechanism and to evaluate the corrosion risk, which is helpful to ensure the safe and efficient operation of engineering equipment.
The evaluation parameters of corrosion degree mainly include corrosion depth, corrosion area and corrosion rate. Generally, the electrochemical test and weight loss method are widely used in corrosion evaluation. However, due to the uneven distribution of a large amount of corrosion pits on the metal surface, these two methods are difficult to reflect the local corrosion details. In contrast, corrosion morphology images can directly exhibit various information of corrosion damage, such as corrosion depth, corrosion location, and the geometry and distribution of corrosion pits. However, the corrosion morphology analysis at an early stage is mainly based on manual observation. The size and distribution of corrosion pits on scanning electron microscope (SEM) images are mainly obtained by the naked eye. As a result, some small holes are often overlooked, resulting in large error and low efficiency. In addition, for the large-scale corrosion pits on the metal surface, due to the large pit number and various pit shapes, it is difficult to accurately obtain the size, quantity and area distribution of corrosion pits by traditional methods. The corresponding evaluation results can only be used for qualitative analysis, which is not conducive to the automation and standardization of corrosion damage evaluation. In recent years, with the rapid development of computer technology and image analysis technology, the corrosion morphology image can be transformed into a digital signal, and then the corrosion feature information is extracted quantitatively by computer processing and conversion. Finally, the quantitative analysis of the corrosion damage image can be realized, which is important to characterize the corrosion degree and to promote the quantitative standardization of corrosion evaluation. Due to the advantages of being non-destructive and having high efficiency, high precision and low cost, the corrosion image recognition has received much attention and has achieved remarkable results in the corrosion morphology analysis and corrosion degree evaluation. The main image processing method includes Markov random fields [5,6], autoregressive models [7,8], fractal models [9,10,11], gray-level co-occurrence matrices (GLCM) [12,13,14], discrete wavelet transforms (DWTs) [15,16] and binary image processing [17,18]. Fajardo et al. [12] identified the damage degree caused by different corrosion types through the gray-level co-occurrence matrix, which could extract useful characteristics from the corrosion morphology images. The results indicated that the established method had a greater effectiveness than those reported in the literature. Zhu et al. [17] quantified the pit depth and pit area on a metal surface through binary image processing. Jing et al. [19] proved that the surface morphology of Si3N4 ceramics for rotary ultrasonic grinding machining has fractal features with qualitative and quantitative investigation.
Therefore, the corrosion performance of materials can be effectively evaluated by extracting the surface corrosion characteristics and then by analyzing the corrosion type, corrosion degree and corrosion law. This is of great significance to improve the automation of material failure evaluation, and it has a broader prospect of engineering application. Unfortunately, the application of image recognition method in the corrosion behavior in a seawater environment has been rarely reported in the literature. Cl ions are abundant in seawater, and they have a small radius and strong penetration. It is easy to adsorb on the surface, thereby causing a large amount of corrosion pits with different shapes and sizes. The image recognition method is appropriate for the analysis and quantitative evaluation of this kind of corrosion behavior. In this paper, the corrosion behavior of Q420 steel in seawater was investigated by potentiodynamic polarization and electrochemical impedance spectroscopy, which was interpreted based on a series of physical and chemical processes, including ion mass transfer, chemical reaction, electrode kinetics, and corrosion product film precipitation. The corrosion characteristics of Q420 steel in artificial seawater solutions with different Cl concentrations were compared. A corrosion damage characterization method based on image intelligent recognition was developed by using a gray-level co-occurrence matrix, binary image method and fractal model. Through the feature extraction of corrosion morphology images, the mathematical analysis of corrosion morphology distribution and the microscopic quantitative evaluation of corrosion damage degree can be achieved.

2. Materials and Methods

2.1. Test Material and Solution

Q420 steel was conventionally used as a marine engineering material, and thus, it was selected as the test material in this study. The chemical composition of Q420 steel is listed in Table 1.
The sample was machined into a thin disk with an area of 1 cm2 for electrochemical experiments and immersion tests. The test surface was grinded with SiC paper (400# to 2000#) and then polished with a 0.5 μm diamond suspension. Subsequently, the sample surface was cleaned with deionized water by using the ultrasonic cleaning instrument, and then, the sample surface was dried by the inert air flow. The optical microscope was used to ensure that there was no obvious scratch on the surface.
The solution used in this work was the simulated seawater solution. The composition of the standard seawater solution is listed in Table 2. The Cl concentration in the standard seawater solution was expressed as [Cl]Std. In order to investigate the influence of Cl concentration on the corrosion behavior, the Cl concentrations of 50% [Cl]Std, 150% [Cl]Std and 200% [Cl]Std were chosen for comparison.

2.2. Corrosion Measurement

The electrochemical test was carried out by the CS2350H electrochemical workstation (CorrTest Instruments, Wuhan, China). The three-electrode test system consisted of the working electrode, the platinum electrode as auxiliary electrode, and the saturated calomel electrode as reference electrode. When the open current potential was stable, the electrochemical impedance spectroscopy was measured with an amplitude of 5 mV and a frequency range of 10−2~105 Hz. The potentiodynamic polarization curve was recorded with a scan range of −1 V~+1 V (relative to open circuit potential). The morphology of the corroded surface was analyzed by scanning electron microscope (SEM, S-3000N, Hitachi, Tokyo, Japan). Before the image recognition method, the corroded specimen was immersed into the citrate solution by using the ultrasonic cleaning instrument for 10 min to remove the corrosion product film.

2.3. Image Recognition Method

In this work, the quantitative analysis of corrosion morphology was carried out by using gray-level co-occurrence matrices (GLCM), binary images, and a fractal model.

2.3.1. Gray-Level Co-Occurrence Matrix

The gray-value distribution on the corrosion image can be defined as a two-dimensional function f(x, y), where x and y are spatial position coordinates, and the function value f(x, y) at any spatial position coordinate (x, y) represents the corresponding gray value. As a result, the image is transformed into a gray-level co-occurrence matrix. The statistical characteristics such as mean value, standard deviation, energy and entropy can be extracted to quantitatively characterize the severity or complexity of corrosion damage [20].
The gray statistics can be expressed by the following discrete function [21]:
P ( h i ) = n i n
where hi is the i-level gray value of the image f(x, y), P(hi) is the probability of hi, ni is the number of pixels whose gray value is hi, and n is the total number of pixels in the image.
The mean gray value M of the image is:
M = i = 0 255 P ( h i ) h i
The standard deviation σ of the image is:
σ = i = 0 255 ( h i M ) 2 P ( h i )
The energy value Eenergy of the image is:
E e n e r g y = i = 0 255 P ( h i ) 2
The entropy Eentropy of the image [22] is:
E e n t r o p y = i = 0 255 P ( h i ) log 2 P ( h i )
The mean gray value can reflect the average corrosion degree, and the small mean gray value corresponds to serious corrosion damage. The standard deviation reflects the dispersion degree between the local gray value and the mean gray value. The large standard deviation indicates that the corrosion morphology is complex. The energy value denotes the dispersion of gray-level distribution in different regions of the image. The large energy value indicates a relatively uniform corrosion morphology. The entropy reflects the randomness of corrosion damage.

2.3.2. Binary Image Method

Due to the large amount of corrosion pits with irregular shape on the sample surface, it is difficult for the traditional method to achieve an accurate measurement of the pit number and the pit area distribution. Therefore, the binary image method is used in this study. There are many image binarization methods; the commonly used method is the threshold method. In order to clearly distinguish the corrosion region and the material matrix, the gray threshold values of the corrosion region and the material matrix region are set as Ta and Tb, respectively [18]. The gray value of the pixel position (x, y) in the image is converted to g(x, y), given as:
g ( x , y ) = { 1 0 T a < f ( x , y ) T b f ( x , y ) T a   or   f ( x , y ) > T b
Subsequently, the corrosion region and the material matrix can be distinguished. Finally, the number and area of corrosion pits on the image can be obtained by calculating the corresponding pixel number. In particular, the pitting ratio can be quantified by the pixel number ratio of the corrosion area and the statistical area [23].

2.3.3. Fractal Model

Generally, the corrosion morphology is irregular, and both the surface fluctuation and the pit distribution are relatively complex. However, the local and overall corrosion morphology have self-similarity, which can be described by fractal dimension. Fractal dimension D is commonly used to quantify the complexity and roughness of the image. The large fractal dimension indicates the complex image and the rough surface. The common fractal model, differential box counting (DBC) [24], is shown as follows:
N ε = K ε D
D = lim ε 0 [ lg N ε / lg ( 1 / ε ) ]
where N ε is the characteristic value under the scale ɛ, and K is the fractal coefficient.

3. Results and Discussion

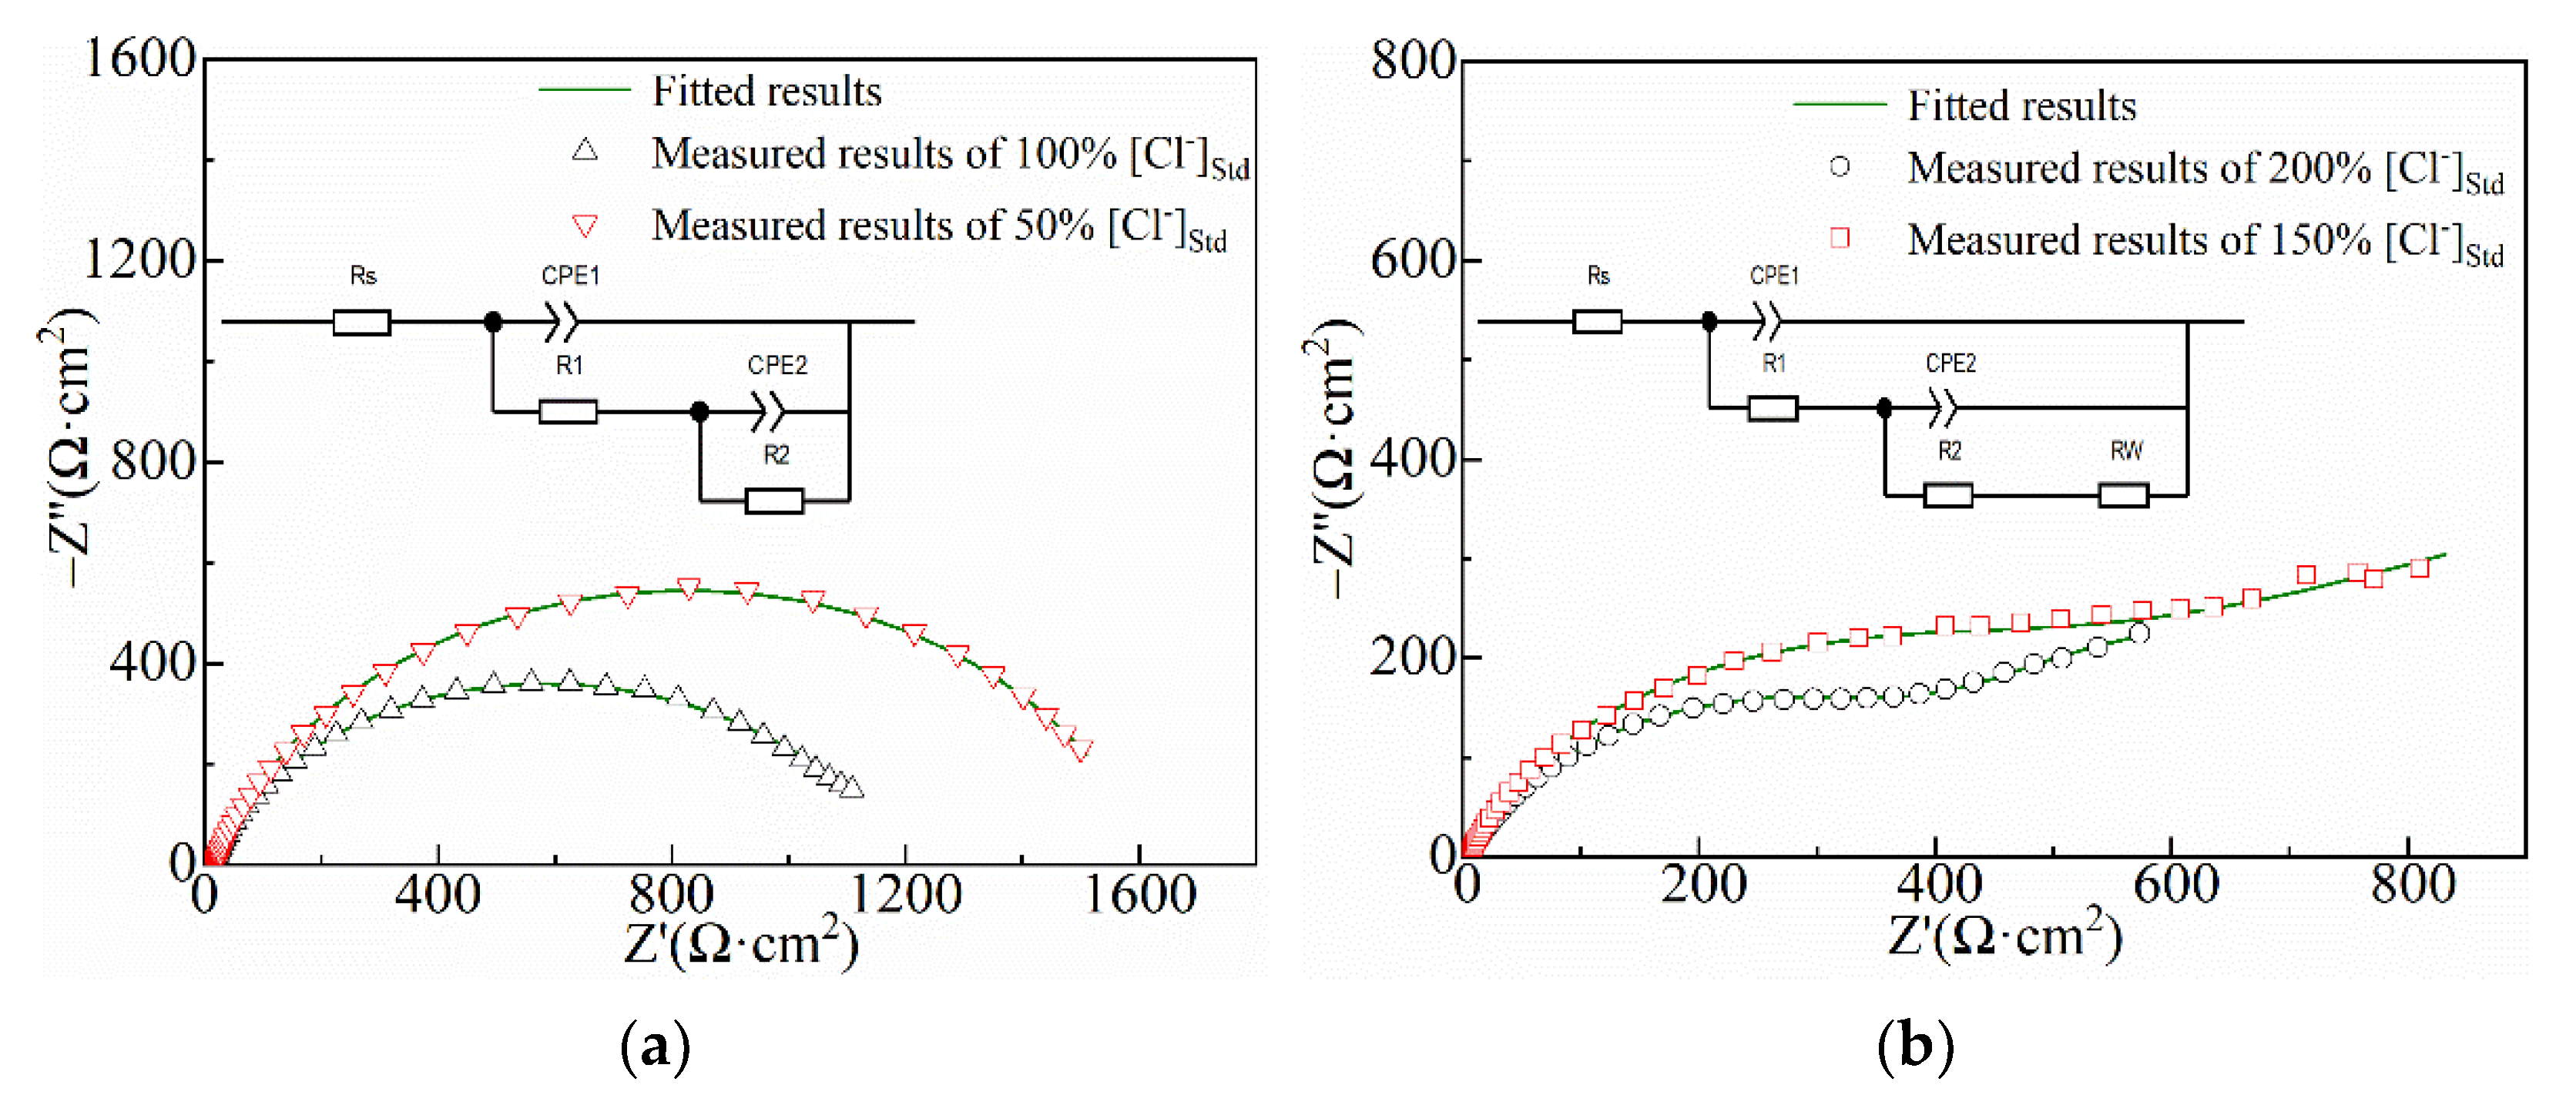
3.1. Electrochemical Analysis

Figure 1 shows the potentiodynamic polarization curve of Q420 steel at different Cl concentrations, and Table 3 shows the fitted electrochemical parameters. The critical potential at which the anodic current density increases abruptly is almost identical at high Cl concentrations, but the current densities in the active region before the critical potential are different for these Cl concentrations. As the Cl concentration increases, the corrosion current density increases from 2.35 to 187.01 μA·cm−2. The corrosion product film in the solution with low Cl concentration has a certain protective effect on the metal substrate. In contrast, for the high Cl concentration, the adsorption of Cl on the sample can destroy the integrity and compactness of the corrosion product film; meanwhile, it can accelerate the metal dissolution through the anode catalytic mechanism. Therefore, the corrosion current density increases with the Cl concentration.
The electrochemical impedance spectroscopy (EIS) at different Cl concentrations is shown in Figure 2. The equivalent circuit in the figure is applied for modeling the EIS results, where the element Rs indicates the solution resistance, CPE1 indicates the capacitance of the corrosion product film, R1 indicates the resistance of the adsorbed corrosion product, CPE2 indicates the double-layer capacitance, R2 indicates the charge-transfer resistance, and Rw indicates the Warburg impedance. It is seen that the fitted and measured results match well in the Nyquist diagrams. There exists two time constants, which are attributed to the interfacial change-transfer reaction and the formation of the corrosion product on the electrode surface. The capacitance semicircle decreases with the Cl concentration, indicating that the corrosion process is accelerated due to the addition of Cl ions, which is consistent with the polarization curve. In particular, the Warburg impedance appears at high Cl concentrations, because the higher corrosion rate contributes to the formation of a thick corrosion product film, indicating that the corrosion process is controlled by a diffusion process.

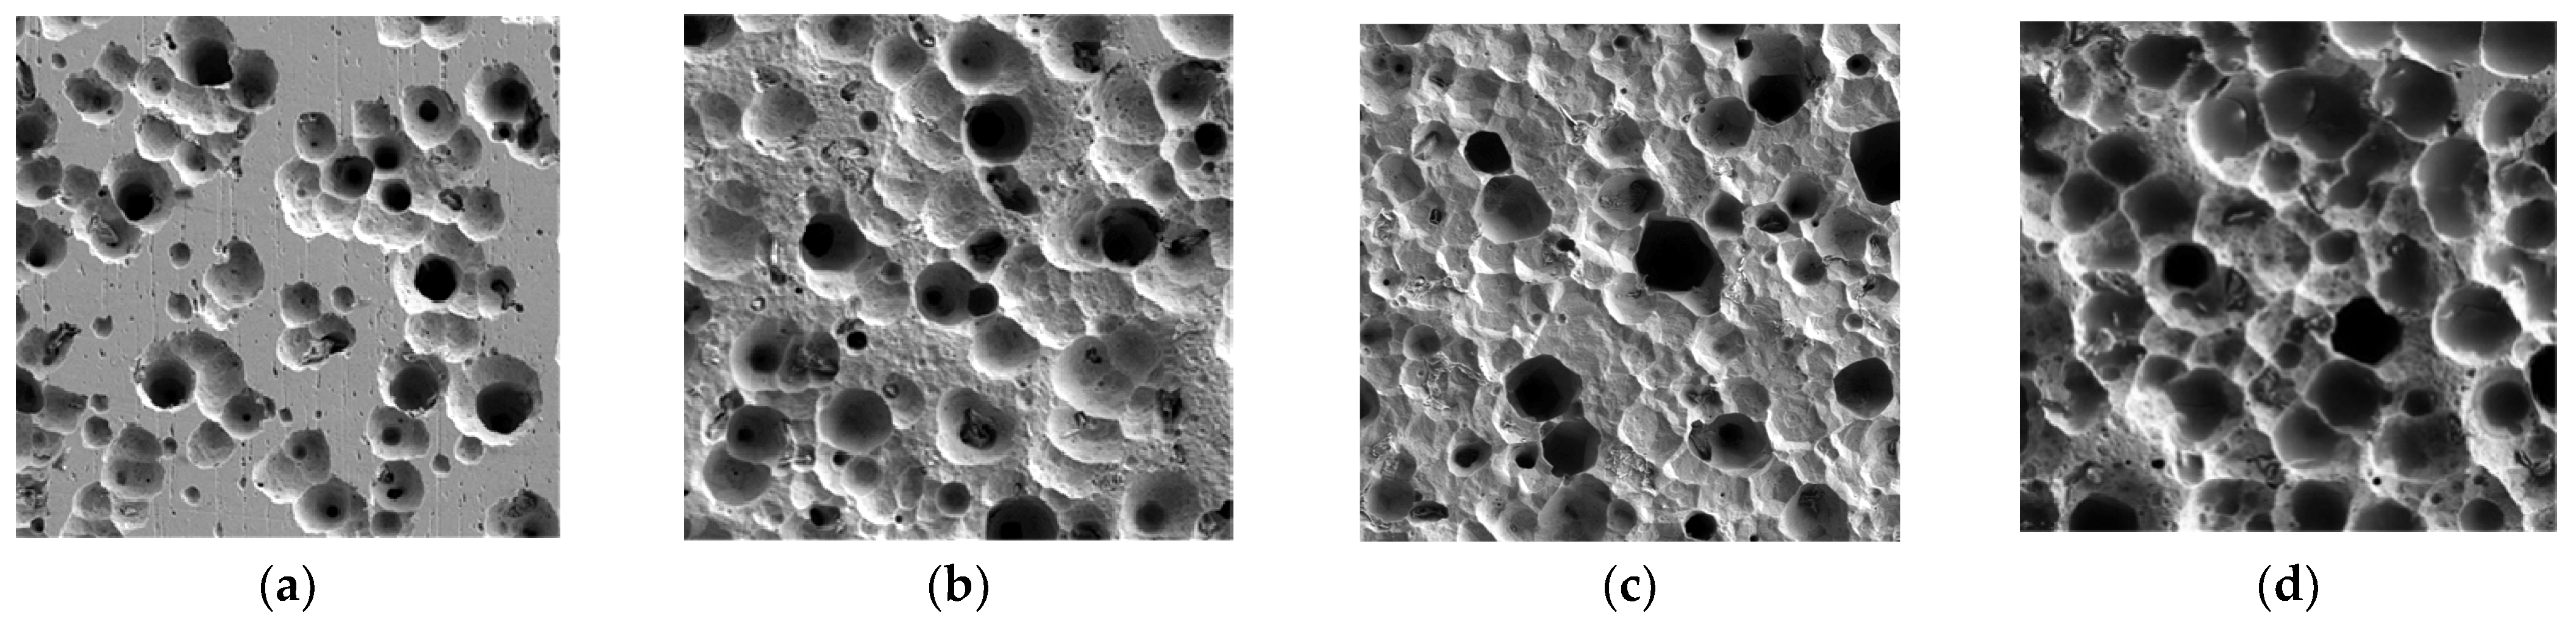
3.2. Image Recognition of Corrosion Morphology

3.2.1. Characteristic Parameter Analysis Based on GLCM

Figure 3 shows the corrosion morphology images after pretreatment. With the increase in Cl concentration, the number of corrosion pits gradually increases and the pit size becomes larger. Furthermore, the corrosion morphology image is transformed into a gray-level co-occurrence matrix, and then, the gray characteristic parameters are extracted to evaluate the corrosion severity and complexity. The results are shown in Table 4. As the Cl concentration increases, the average gray value of corrosion morphology gradually decreases, indicating that the corrosion damage aggravates gradually. The increasing standard deviation and the decreasing energy value reflect that the corrosion morphology becomes more complex. This is consistent with the phenomenon that the corrosion pits on the surface gradually become larger and deeper. The increasing entropy proves that the randomness of the pit distribution is gradually increasing, which is in accordance with the number of corrosion pits increasing.
The changes in standard deviation, energy and entropy regarding the Cl concentration are consistent with the change of the electrochemical results in this paper, which confirm the reliability of this method based on GLCM. However, one limitation of this image recognition method is that the statistical parameters mainly indicate the macroscopic overall corrosion degree of the sample, but the local microscopic corrosion characteristics are not reflected, for example, the pit number, pit size and pit area distribution.

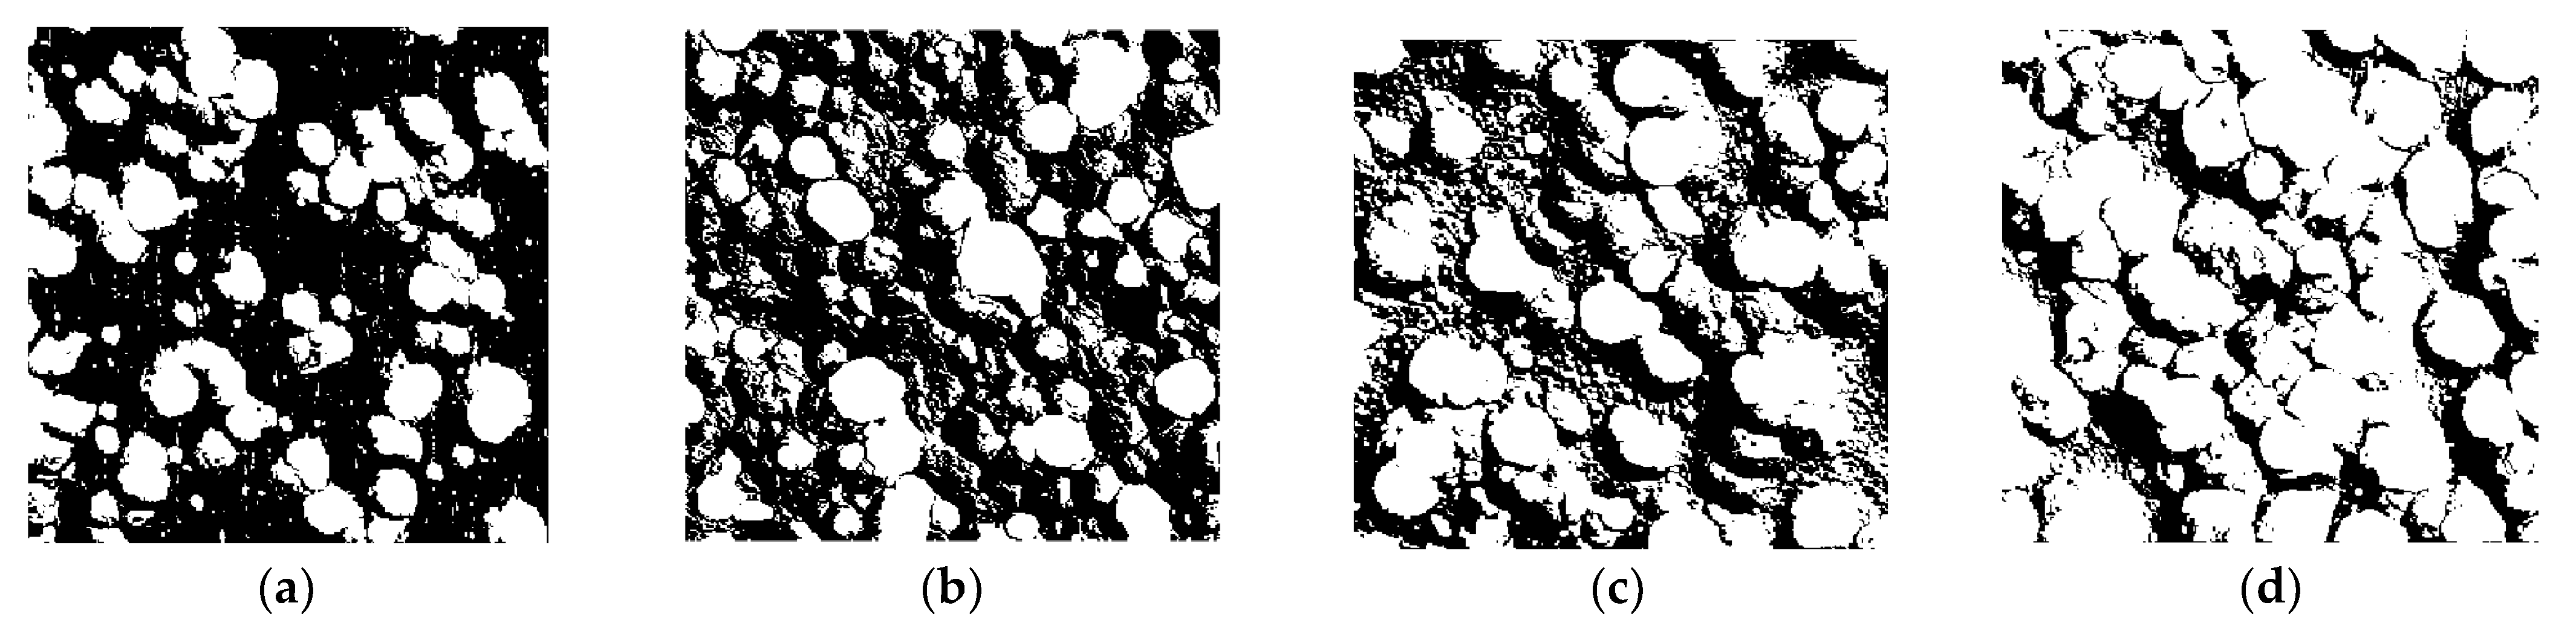
3.2.2. Characteristic Parameter Analysis Based on Binary Image

The binary image of the corrosion characteristic region at different Cl concentrations is shown in Figure 4. The white area in the figure corresponds to the corrosion pits, and the black area corresponds to the metal matrix. The statistical results of the pitting area distribution on the sample surface are shown in Figure 5 and Table 5. In Figure 5, the horizontal axis indicates the pit number, and the vertical axis indicates the corrosion area of each corrosion pit, represented by the pixel number. When the Cl concentration is relatively low, the number of corrosion pits increases gradually with the Cl concentration. However, the number of corrosion pits decreases when the Cl concentration increases to 200% of the standard solution. The reason for this phenomenon is that the small corrosion pits are gradually connected to form a large pit. When the Cl concentration is 50% of the standard solution, the total area of the corrosion pits corresponds to 18,171 pixels, and the pitting ratio was as low as 20.19%. As the Cl concentration increases, the total area of corrosion pits and the pitting ratio increases. When the Cl concentration is 200% of the standard solution, the total corrosion area is the largest, which reaches 46,476 pixels, and the pitting ratio is 51.64%. For this case, the number of corrosion pits with large size was the highest.
This binary method is effective for analyzing the pit number and area of each corrosion pit. The change of pit area distribution with Cl concentration is in accordance with the change of electrochemical results at low Cl concentration, while it slightly differs from the electrochemical results at high Cl concentration. The binary method mainly quantitatively characterizes the area distribution of numerous corrosion pits from the perspective of two-dimensional corrosion morphology, rather than a three-dimensional description. The electrochemical results can reflect the average corrosion intensity, which is affected by not only the pit area distribution but also by the pit depth distribution. The corrosion extent at high Cl concentration is more serious such that the corrosion morphology is irregular and the depth of the corrosion pits changes significantly. As a result, the relationship between the pit area distribution by the binary method and the corrosion intensity by the electrochemical test is uncertain at high Cl concentration.

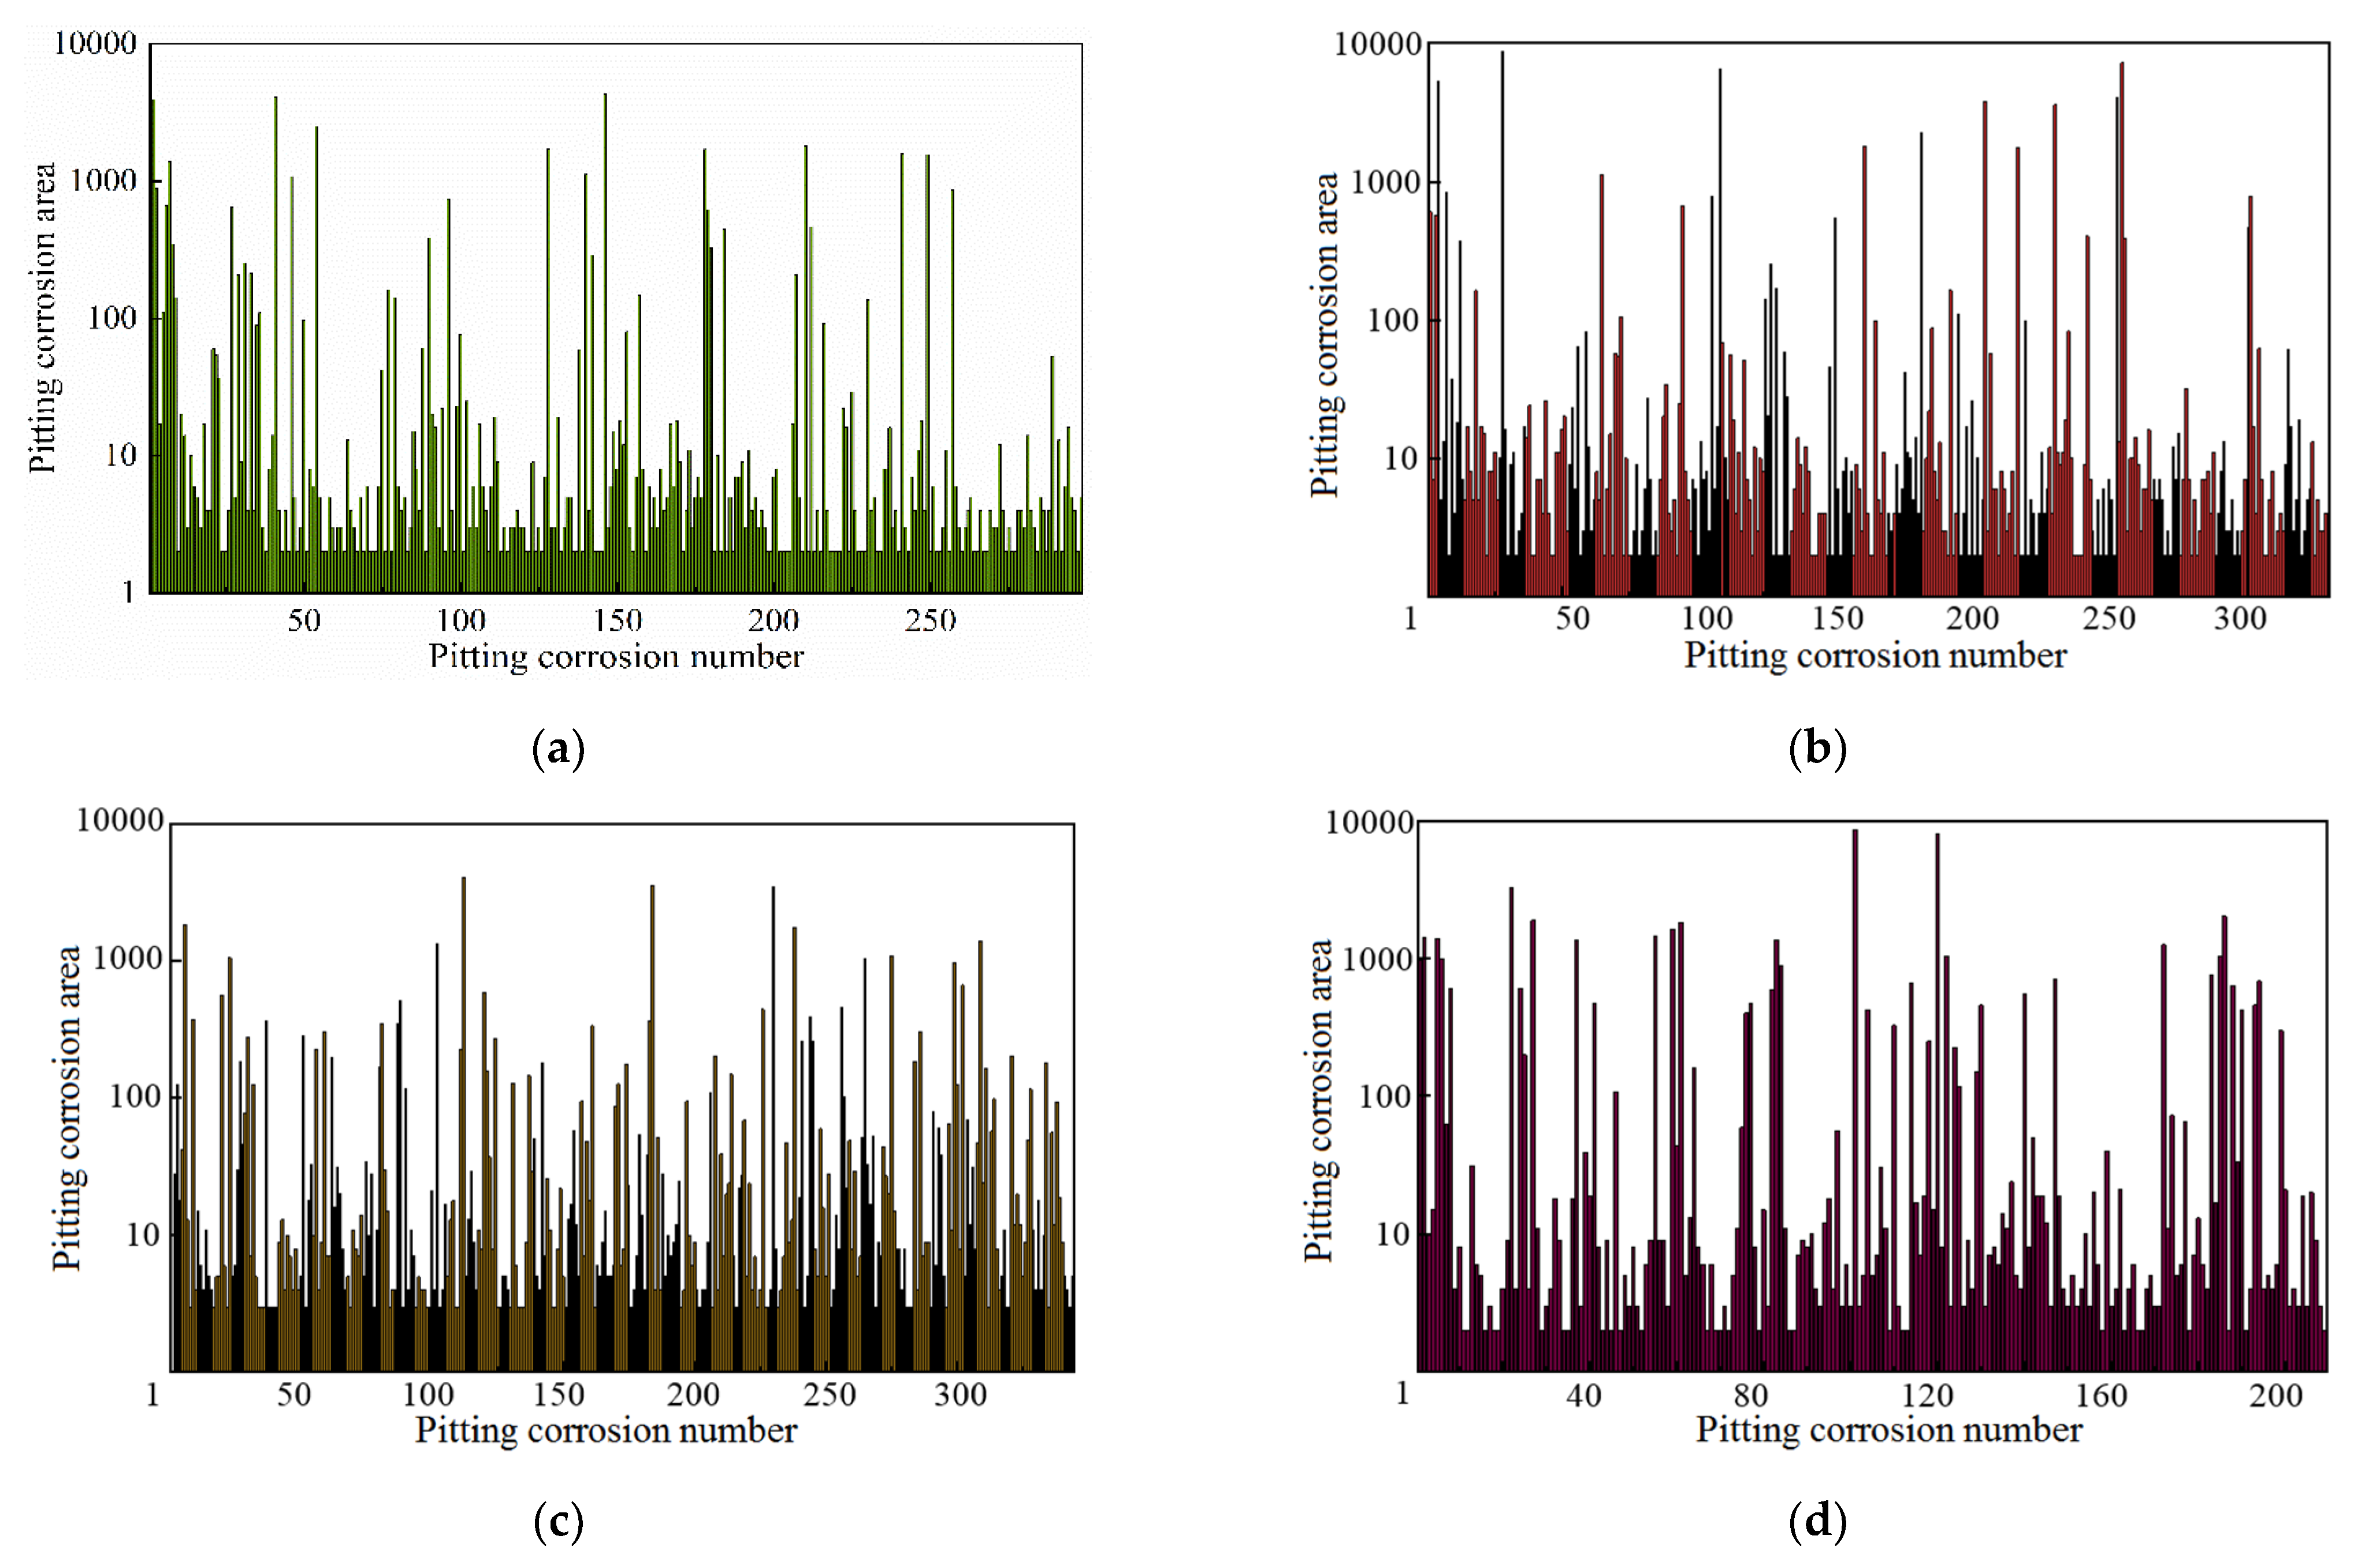
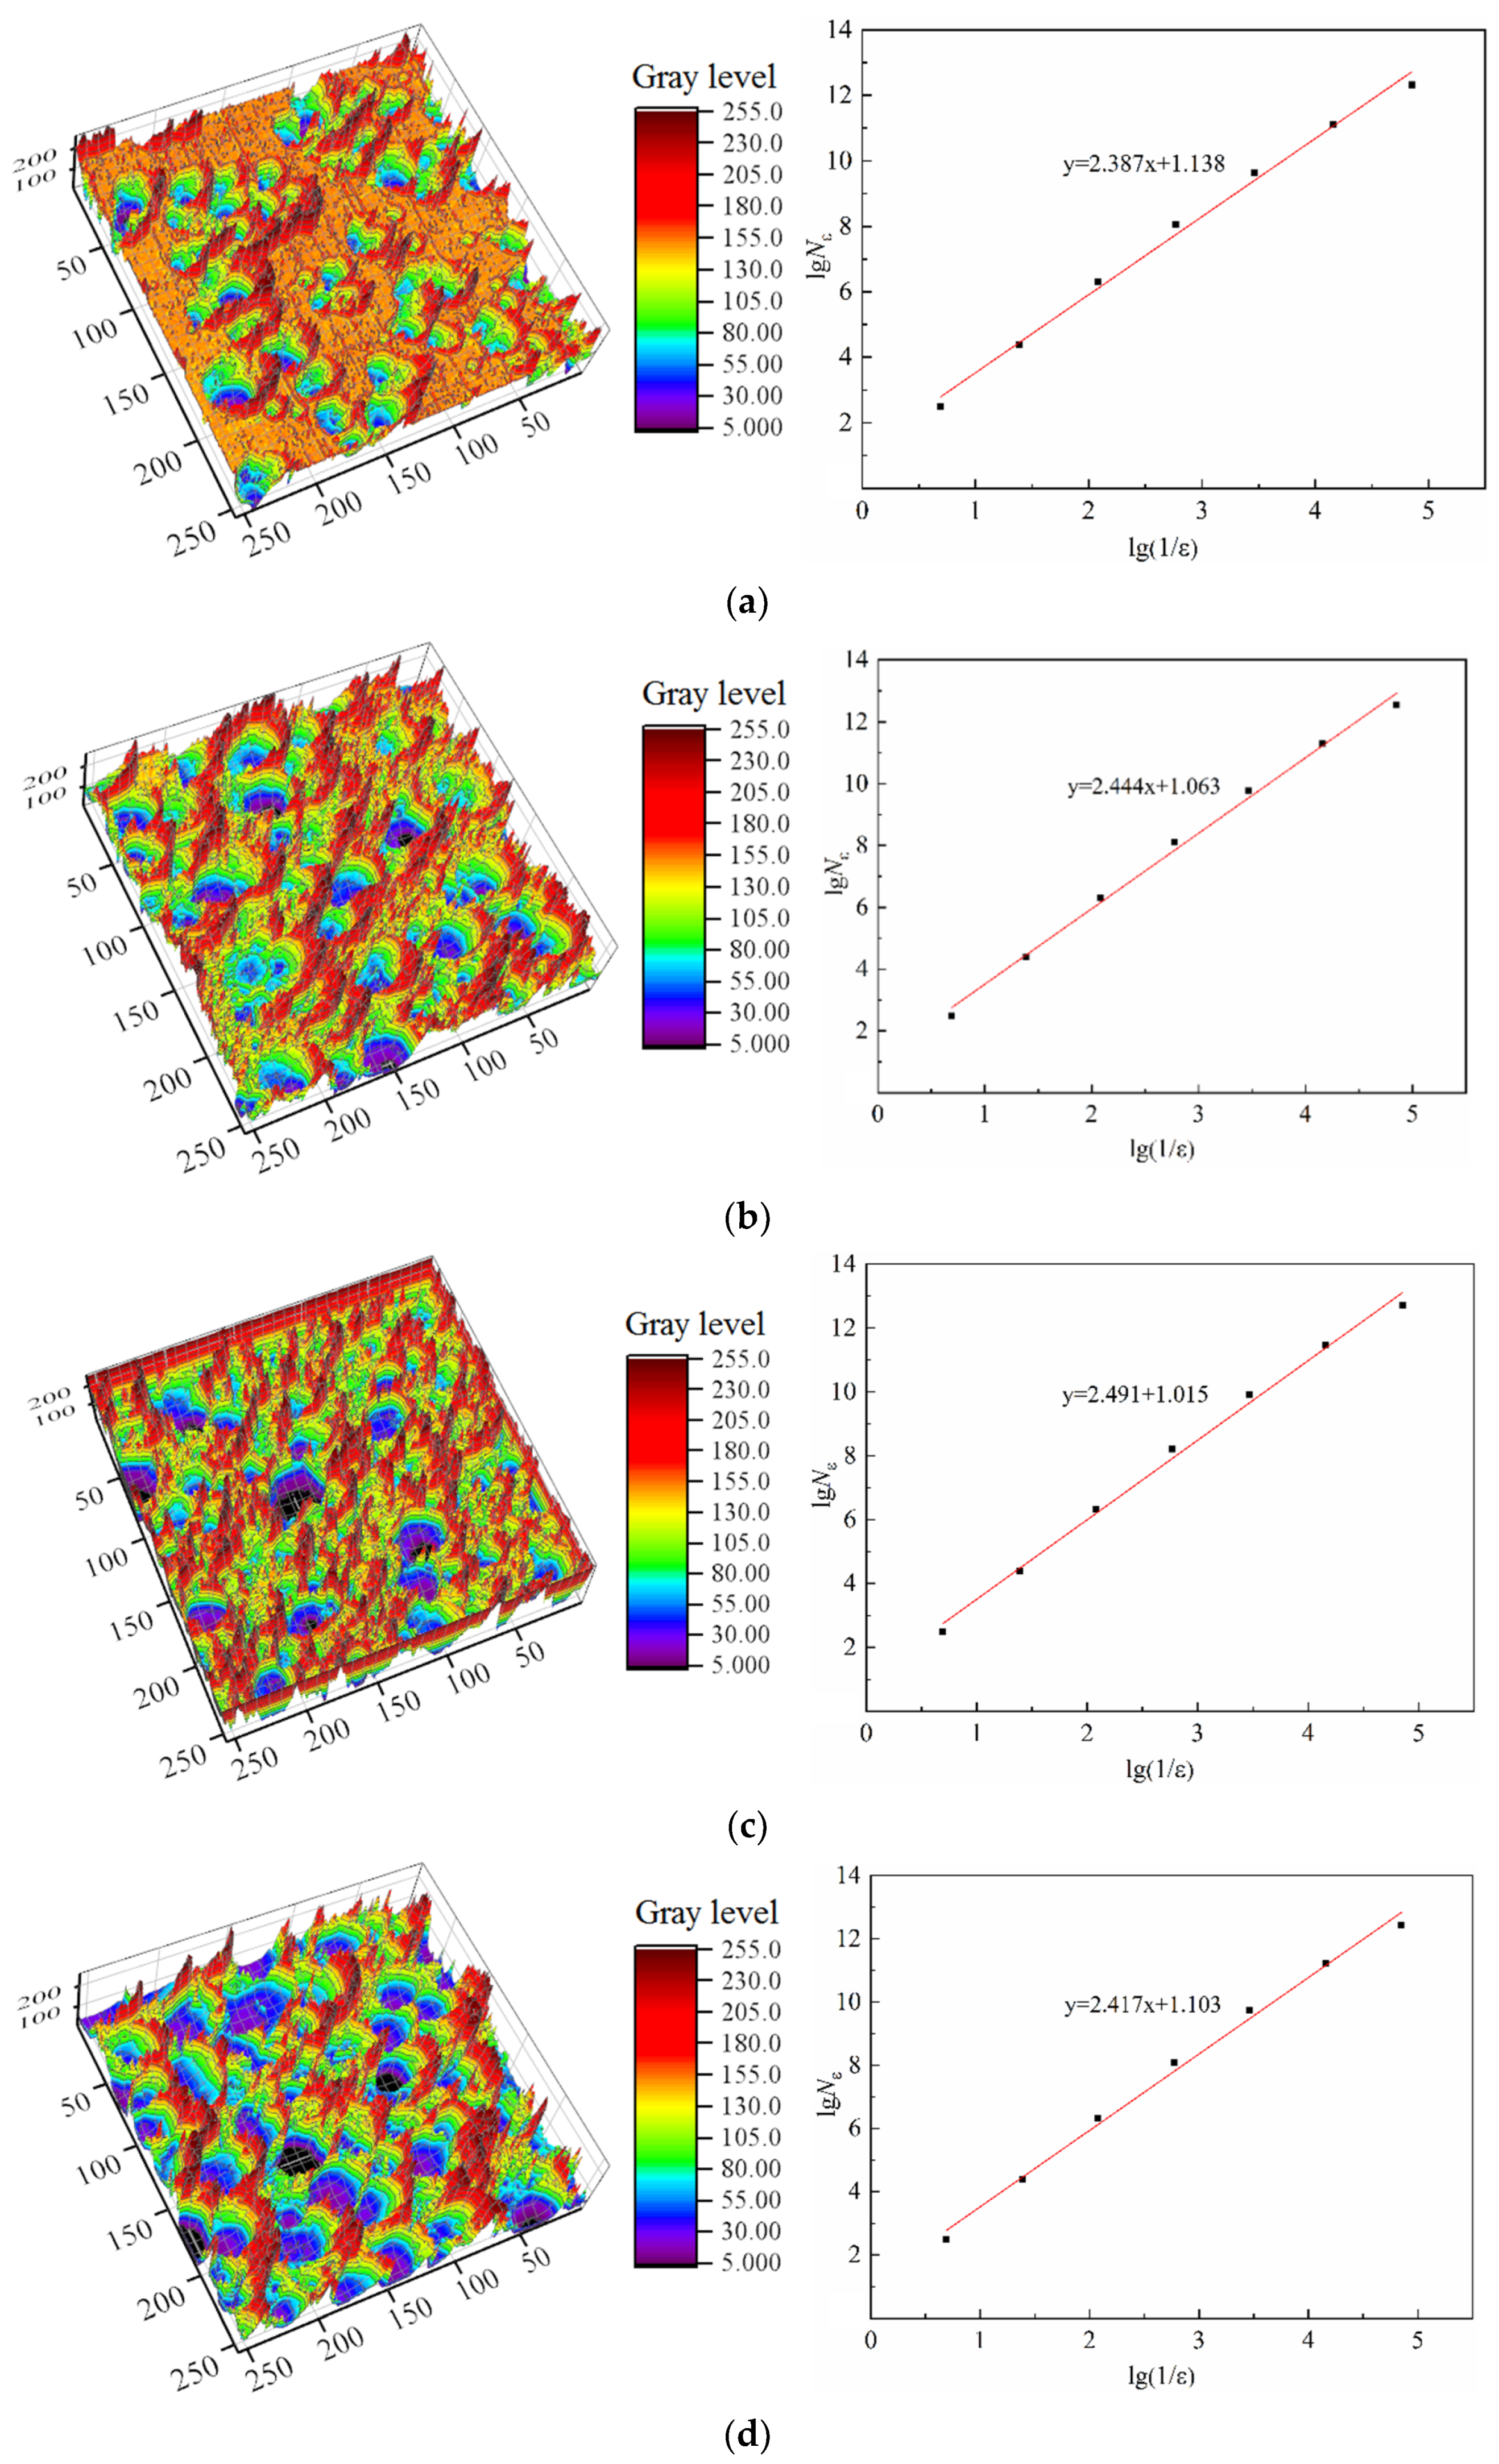
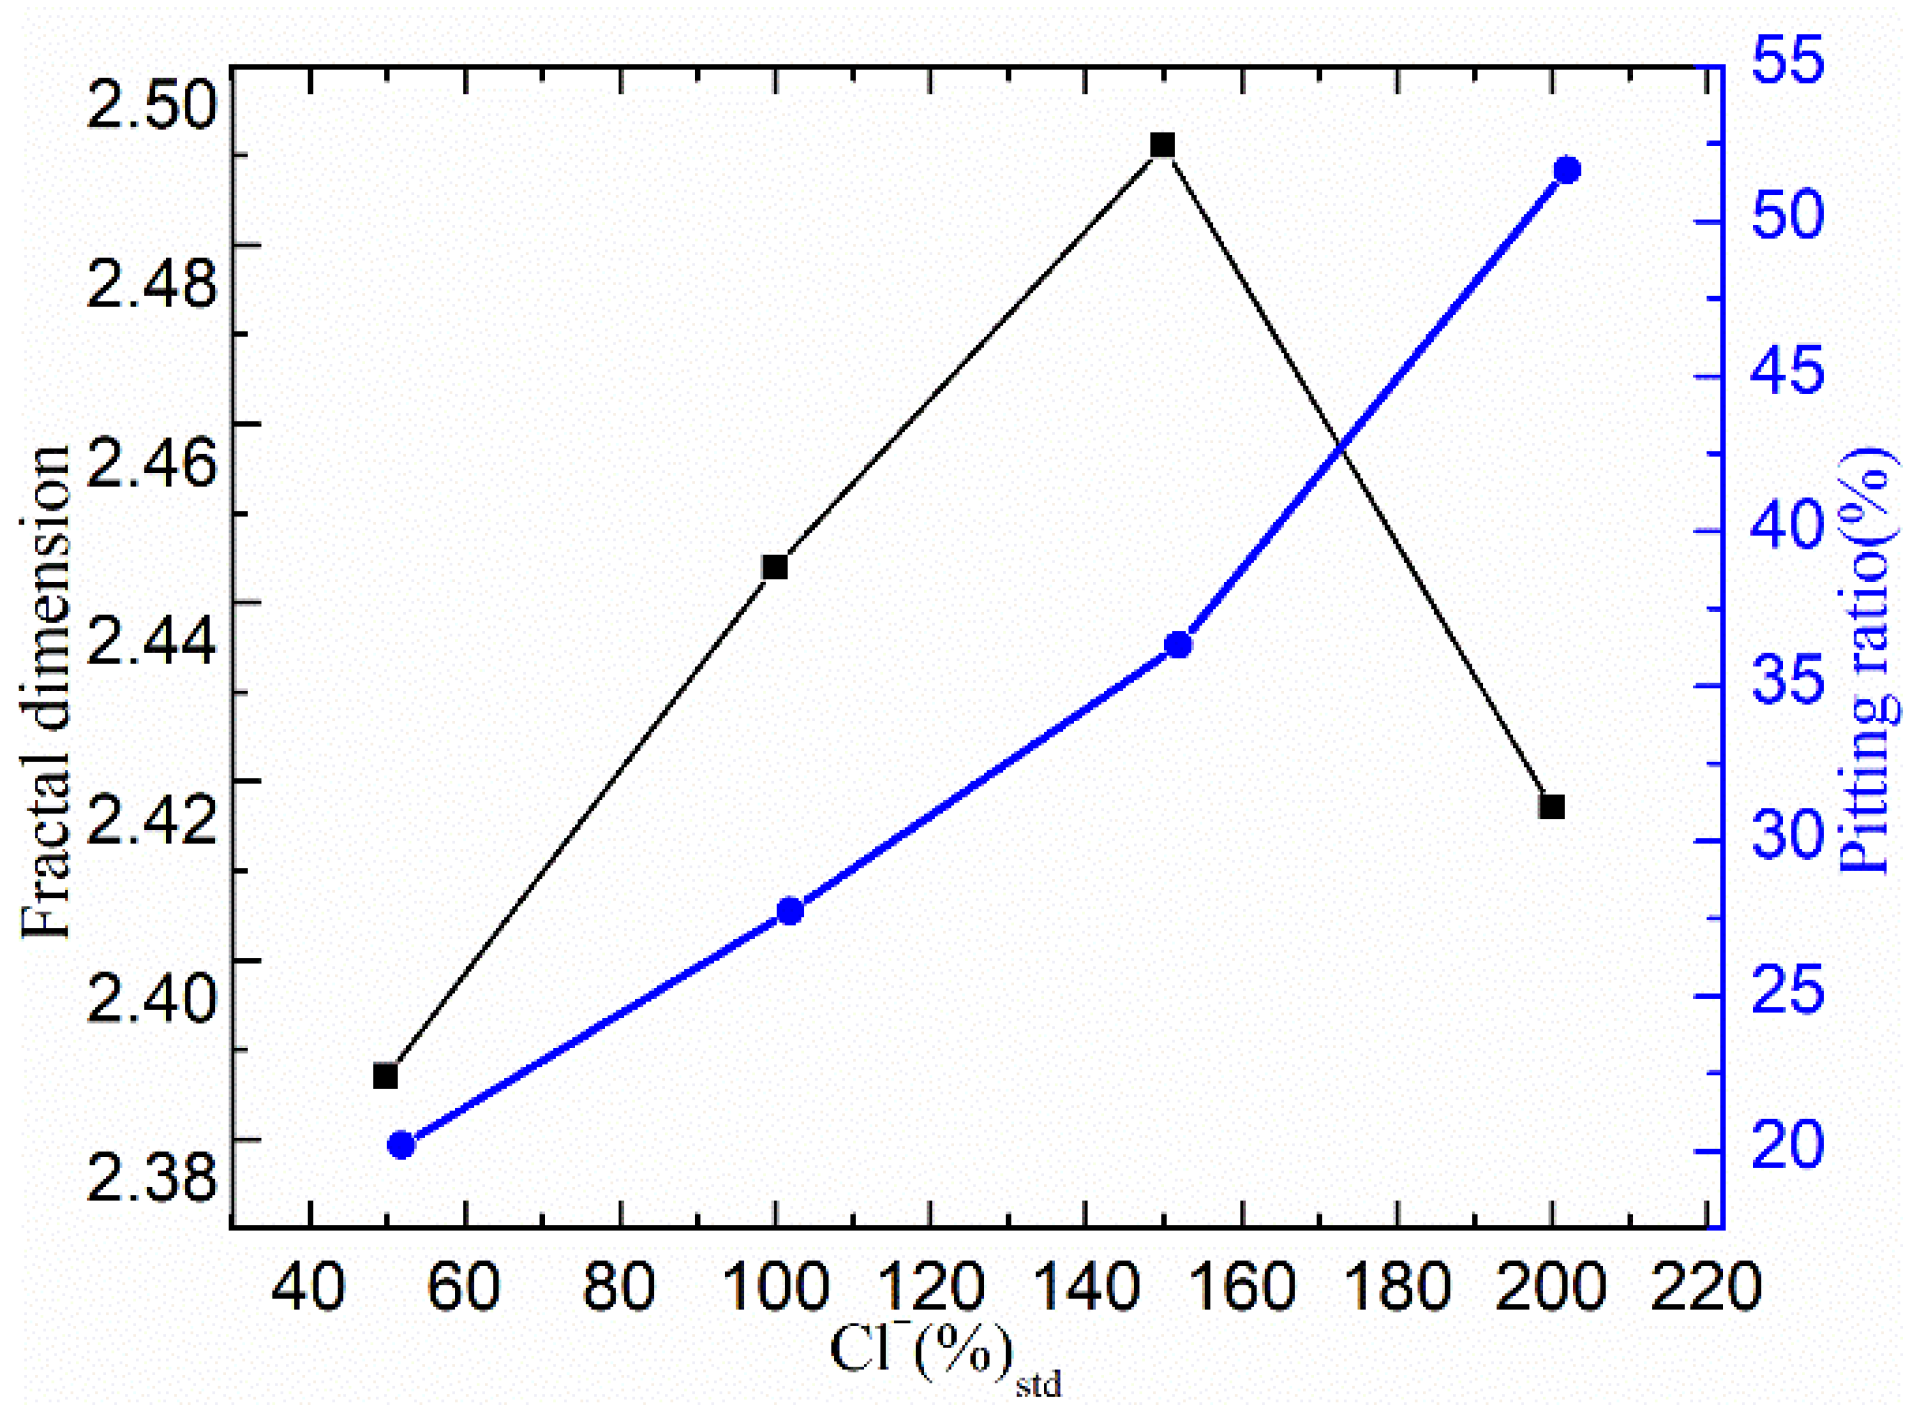
3.2.3. Characteristic Parameter Analysis Based on Fractal Theory

The corrosion morphology image obtained by scanning electron microscopy is a two-dimensional image, and the gray value at different locations can be used to indicate the corrosion depth. As a result, the three-dimensional corrosion image can be obtained by using the gray value as the z-axis coordinates of the corrosion image. Based on the fractal theory, the fractal characteristic parameters of the corrosion morphology image are extracted. The calculated three-dimensional corrosion image and the corresponding fractal dimension diagram are shown in Figure 6. It can be seen that the three-dimensional images can better simulate the realistic surface corrosion morphology and clearly show the change of pit distribution, including pit size and pitting ratio. With the increase in Cl concentration, the area and number of the regions with a small gray value increase gradually, indicating that the corrosion severity increases.
Figure 7 shows the relationship between the pitting ratio and the fractal dimension at different Cl concentrations. The fractal dimension is 2.387 when the Cl concentration is 50% of the standard solution. With the increase in Cl concentration, the fractal dimension increases to 2.491 when the Cl concentration is 150% of the standard solution. Subsequently, the fractal dimension decreases to 2.417 when the Cl concentration increases to 200% of the standard solution. When the Cl concentration increases from 50% to 150% of the standard solution, the change of the fractal dimension and the pitting ratio is consistent, exhibiting an increasing trend. The main reason is that the corrosion of Q420 specimen is promoted by the high Cl concentration. With the increase in Cl concentration, the number of corrosion pits and the corresponding corrosion area increase, and thus the material surface is more uneven and complex, leading to the increasing fractal dimension. When the Cl concentration reaches 200% of the standard solution, the pitting ratio increases, but the fractal dimension decreases. The main reason is that the corrosion is more serious such that some small pits are connected to form a large pit, and the average area of corrosion pits increases. The size difference between different corrosion pit decreases, and then, the corrosion morphology gradually tends to be relatively uniform such that the fractal dimension decreases.
In conclusion, the fractal dimension can effectively characterize the corrosion complexity of the specimen. In this paper, the change of fractal dimension with the Cl concentration is consistent with the change of electrochemical results at low Cl concentration, whereas there is obvious discrepancy at the highest Cl concentration. This is because the accelerated pit evolution at high Cl concentration leads to the connection of adjacent pits, which have an influence on the complexity of the corrosion morphology and the corresponding fractal dimension.

4. Conclusions

Based on the image intelligent recognition method, a new characterization method of corrosion damage in a seawater environment was established in this study. For the conventional marine engineering material, Q420 steel, the corrosion electrochemical test and characterization at different Cl concentrations were carried out. The mathematical analysis of the pit size, pit number and pit area distribution were conducted, and then, the microscopic quantitative evaluation of damage degree could be achieved, which provided a new idea for the evaluation of corrosion damage on marine equipment. The main conclusions are as follows:
(1) Based on the gray-level co-occurrence matrix, the average gray value and energy value of the corrosion morphology gradually decreased as the Cl concentration increased, and the standard deviation and entropy increased, indicating that the corrosion damage aggravates gradually and the randomness of the corrosion pit distribution increases. The change of these parameters with Cl concentration are consistent with the change of electrochemical results, which confirms the reliability of this method based on GLCM.
(2) The accurate measurements of the pit number and the pit area distribution were achieved by the binary image method. The change of pit area distribution with Cl concentration was in accordance with the change of electrochemical results at low Cl concentration. However, there exists a discrepancy for high Cl concentration, because the corrosion extent at high Cl concentration was more serious, such that the corrosion morphology was irregular and the depth of the corrosion pits changed significantly, which caused an uncertainty between the pit area distribution and the average corrosion loss.
(3) The fractal dimension increased with the Cl concentration at low Cl concentration, indicating that the corrosion morphology was more complex. In contrast, the fractal dimension decreased at high Cl concentration, because the complexity of the corrosion morphology was interfered by the connection of the adjacent pits due to the accelerated pit evolution at high Cl concentration.

Author Contributions

Conceptualization, K.W.; methodology, C.L. and C.N.; investigation, K.W. and Q.Z.; writing—review and editing, K.W.; visualization, H.Z.; supervision, J.L.; project administration, K.W. and J.L.; funding acquisition, K.W. and J.L. All authors have read and agreed to the published version of the manuscript.

Funding

This work was supported by the National Natural Science Foundation of China (grant nos. 51906200, 51879216), the Key Project of National Natural Science Foundation of China (grant no. 51839010), the Key Laboratory Foundation of Education Department of Shaanxi (grant no. 19JS045), the Natural Science Special Project of Shaanxi Provincial Department of Education (grant no. 21JK0802), and the China Postdoctoral Science Foundation (grant nos. 2019TQ0248, 2019M663735).

Institutional Review Board Statement

Not applicable.

Informed Consent Statement

Not applicable.

Data Availability Statement

The data are contained within the article.

Conflicts of Interest

The authors declare no conflict of interest.

References

  1. Zhu, J.; Li, D.; Chang, W.; Wang, Z.; Hu, L.; Zhang, Y.; Wang, M.; Yang, Z.; Song, J.; Chen, S.; et al. In situ marine exposure study on corrosion behaviors of five alloys in coastal waters of western Pacific Ocean. J. Mater. Res. Technol. 2020, 9, 8104–8116. [Google Scholar] [CrossRef]
  2. Zhang, X.M.; Chen, Z.Y.; Luo, H.F.; Zhou, T.; Zhao, Y.L.; Ling, Z.C. Corrosion resistances of metallic materials in environments containing chloride ions: A review. Trans. Nonferrous Met. Soc. China 2022, 32, 377–410. [Google Scholar] [CrossRef]
  3. Cui, M.M.; Wang, P.Y.; Wang, Z.K.; Wang, B. Mangrove inspired anti-corrosion coatings. Coatings 2019, 9, 725. [Google Scholar] [CrossRef] [Green Version]
  4. Wang, K.; Li, C.P.; Li, Y.H.; Lu, J.L.; Wang, Y.S.; Luo, X.Q. Multi-physics analysis of the galvanic corrosion of Mg-steel couple under the influence of time-dependent anisotropic deposition film. J. Magnes. Alloy. 2021, 9, 866–882. [Google Scholar] [CrossRef]
  5. Xing, W.; Deng, N.; Xin, B.; Chen, Y.; Zhang, Z. Investigation of a novel automatic micro image-based method for the recognition of animal fibers based on Wavelet and Markov Random Field. Micron 2019, 119, 88–97. [Google Scholar] [CrossRef] [PubMed]
  6. Wu, W.; Liu, Z.; Krys, D. Improving laser image resolution for pitting corrosion measurement using Markov random field method. Automat. Constr. 2012, 21, 172–183. [Google Scholar] [CrossRef] [Green Version]
  7. Palm, B.G.; Bayer, F.M.; Cintra, R.J. 2-D Rayleigh autoregressive moving average model for SAR image modeling. Comput. Stat. Data. Anal. 2022, 171, 107453. [Google Scholar] [CrossRef]
  8. Sun, D.; Li, F.; Gao, Q.; Lu, Y. A dynamical analysis on non-local autoregressive model and its application on image reconstruction. Chaos Solitons Fractals 2020, 130, 109427. [Google Scholar] [CrossRef]
  9. Qi, Z.; Hongqi, Y.; Huan, Z.; Kaixuan, L.; Yi, H. Ultimate strength assessment of hull structural plates with general corrosion based on fractal theory. Ocean Eng. 2022, 245, 110417. [Google Scholar] [CrossRef]
  10. Peng, L.; Pan, B.; Liu, Z.; Liu, Z.; Tan, S. Investigation on abrasion-corrosion properties of WC-based composite with fractal theory. Int. J. Refract. Met. Hard Mater. 2020, 87, 105142. [Google Scholar] [CrossRef]
  11. Songbo, R.; Chao, K.; Ying, G.; Song, G.; Shenghui, Z.; Gang, L.; Tao, Y.; Yajie, Z. Measurement pitting morphology characteristic of corroded steel surface and fractal reconstruction model. Measurement 2022, 190, 110678. [Google Scholar] [CrossRef]
  12. Fajardo, J.I.; Paltán, C.A.; López, L.M.; Carrasquero, E.J. Textural analysis by means of a gray level co-occurrence matrix method. Case: Corrosion in steam piping systems. Mater. Today Proc. 2022, 49, 149–154. [Google Scholar] [CrossRef]
  13. Wang, P.; Qiao, H.; Zhang, Y.; Li, Y.; Feng, Q.; Chen, K. Meso-damage evolution analysis of magnesium oxychloride cement concrete based on X-CT and grey-level co-occurrence matrix. Constr. Build. Mater. 2020, 255, 119373. [Google Scholar] [CrossRef]
  14. Patel, D.R.; Kiran, M.B. Vision based prediction of surface roughness for end milling. Mater. Today Proc. 2021, 44, 792–796. [Google Scholar] [CrossRef]
  15. Zhang, Z.; Li, X.; Zhao, Z.; Bai, P.; Liu, B.; Tan, J.; Wu, X. In-situ monitoring of pitting corrosion of Q235 carbon steel by electrochemical noise: Wavelet and recurrence quantification analysis. J. Electroanal. Chem. 2020, 879, 114776. [Google Scholar] [CrossRef]
  16. Li, J.; Du, C.W.; Liu, Z.Y.; Li, X.G.; Liu, M. Effect of microstructure on the corrosion resistance of 2205 duplex stainless steel. Part 2: Electrochemical noise analysis of corrosion behaviors of different microstructures based on wavelet transform. Constr. Build. Mater. 2018, 189, 1294–1302. [Google Scholar]
  17. Zhu, Y.; Wang, L.; Behnamian, Y.; Song, S.; Wang, R.; Gao, Z.; Hu, W.; Xia, D.-H. Metal pitting corrosion characterized by scanning acoustic microscopy and binary image processing. Corros. Sci. 2020, 170, 108685. [Google Scholar] [CrossRef]
  18. Wang, Z.Q.; Wang, J.Q.; Behnamian, Y.; Gao, Z.M.; Wang, J.H.; Xia, D.H. Pitting growth rate on alloy 800 in chloride solutions containing thiosulphate: Image analysis assessment. Corros. Eng. Sci. Tec. 2018, 53, 206–213. [Google Scholar] [CrossRef]
  19. Jing, J.T.; Feng, P.F.; Wei, S.L.; Zhao, H.; Liu, Y.F. Investigation on the surface morphology of Si3N4 ceramics by a new fractal dimension calculation method. Appl. Surf. Sci. 2016, 387, 812–821. [Google Scholar] [CrossRef]
  20. Li, J.; Liu, H.; Wu, W.; Yang, S.; Sheng, L. Corrosion Assessment of Carbon Steel Using Texture and Color Features. In Proceedings of the 2020 3rd International Conference on Advanced Electronic Materials, Computers and Software Engineering (AEMCSE), Shenzhen, China, 24–26 April 2020. [Google Scholar]
  21. Benco, M.; Hudec, R.; Kamencay, P.; Zachariasova, M.; Matuska, S. An advanced approach to extraction of colour texture features based on GLCM. Int. J. Adv. Robot. Syst. 2014, 11, 104. [Google Scholar] [CrossRef]
  22. Irarrazaval, G.P. A correction algorithm for undersampled images using dynamic segmentation and entropy based focus criterion. Magn. Reson. Imaging 2002, 20, 659–666. [Google Scholar]
  23. Bondada, V.; Pratihar, D.K.; Kumar, C.S. Detection and quantitative assessment of corrosion on pipelines through image analysis. Procedia Comput. Sci. 2018, 133, 804–811. [Google Scholar] [CrossRef]
  24. Sarkar, N.; Chaudhuri, B.B. An efficient approach to estimate fractal dimension of textural images. Pattern Recognit. 1992, 25, 1035–1041. [Google Scholar] [CrossRef]
Figure 1. Potentiodynamic polarization curves at different Cl concentrations.
Coatings 12 00881 g001
Figure 2. Electrochemical impedance spectroscopy at different Cl concentrations: (a) low Cl concentrations; (b) high Cl concentrations.
Coatings 12 00881 g002
Figure 3. Corrosion morphology image after pretreatment at different Cl concentrations: (a) 50% [Cl]Std; (b) 100% [Cl]Std; (c) 150% [Cl]Std; (d) 200% [Cl]Std.
Coatings 12 00881 g003
Figure 4. Binary image of corrosion characteristic region at different Cl concentrations: (a) 50% [Cl]Std; (b) 100% [Cl]Std; (c) 150% [Cl]Std; (d) 200% [Cl]Std.
Coatings 12 00881 g004
Figure 5. Pitting area distribution on sample surface at different Cl concentrations: (a) 50% [Cl]Std; (b) 100% [Cl]Std; (c) 150% [Cl]Std; (d) 200% [Cl]Std.
Coatings 12 00881 g005
Figure 6. Three-dimensional corrosion morphology image and fractal dimension calculation diagram: (a) 50% [Cl]Std; (b) 100% [Cl]Std; (c) 150% [Cl]Std; (d) 200% [Cl]Std.
Coatings 12 00881 g006
Figure 7. Relationship between pitting ratio and fractal dimension at different Cl concentrations.
Coatings 12 00881 g007
Table 1. Chemical composition of Q420 steel.
ElementCMnSiPSAlNi + Cu + Cr
Content (wt%)0.051.680.440.010.0030.0371.1
Table 2. Species composition of standard seawater solution.
SpeciesNaClMgCl2Na2SO4CaCl2KClNaHCO3
Concentration (g/L)24.535.24.091.160.690.20
Table 3. The fitting data of the potentiodynamic polarization curve.
[Cl]Std50%100%150%200%
Ecorr (V)−0.81−0.92−0.94−0.94
Icorr (µA·cm−2)2.3572.6893.37187.01
Table 4. Gray statistical characteristic values of the corrosion morphology image.
Cl ConcentrationAverage Gray ValueStandard DeviationEnergyEntropy
50% [Cl]Std129.4350.320.0455.34
100% [Cl]Std118.8656.590.025.7
150% [Cl]Std115.5557.930.025.72
200% [Cl]Std92.3859.650.025.74
Table 5. Statistical values of corrosion characteristics at different Cl concentrations.
Cl ConcentrationNumber of
Corrosion Pits
Total Number of
Corroded Pixels
Pitting Ratio (%)
50% [Cl]Std29818,17120.19
100% [Cl]Std33624,94827.72
150% [Cl]Std34432,68836.32
200% [Cl]Std20946,47651.64
Publisher’s Note: MDPI stays neutral with regard to jurisdictional claims in published maps and institutional affiliations.

