Article

The Use of Fibreglass Mesh in the Experimental Characterisation of Applied Coating Mortars

1
DEC, CERIS, Faculty of Sciences and Technology, University of Coimbra, 3030-788 Coimbra, Portugal
2
DECivil, Instituto Superior Técnico, Universidade de Lisboa, 1649-004 Lisbon, Portugal
3
Department of Civil Engineering, Faculty of Sciences and Technology of the University of Coimbra, Rua Luís Reis Santos—Pólo II, 3030-788 Coimbra, Portugal
4
IteCons—Institute for Research and Technological Development in Construction Sciences, Rua Pedro Hispano, s/n, 3030-289 Coimbra, Portugal
5
CERIS, Instituto Superior Técnico, Universidade de Lisboa, 1649-004 Lisbon, Portugal
*
Author to whom correspondence should be addressed.
Coatings 2022, 12(8), 1091; https://doi.org/10.3390/coatings12081091
Submission received: 6 June 2022 / Revised: 25 July 2022 / Accepted: 26 July 2022 / Published: 1 August 2022
(This article belongs to the Special Issue Advanced Coatings for Buildings - Challenges and Opportunities)

Abstract

:
Mortars are still among the most used wall coatings, whether lime-based or cement-based or traditional and prepared in situ or pre-dosed. When these mortars are formulated and characterized, the influence of the substrate on their characteristics is not taken into account. To study the influence of the substrate on the mortar characteristics, it is necessary to apply the mortar on the substrate, and after its hardening process, to detach it, test it, and then compare its characteristics with those of standard specimens subjected to standard tests. The central problem focuses on detaching the mortar without damaging it, in order to obtain specimens suitable for testing. For this, a fibreglass mesh, positioned at the mortar–substrate interface, can be used to facilitate the detachment in the experimental program. The objective of the present study is to understand if the fibreglass mesh influences the characteristics of the detached mortar. The methodology adopted was as follows: mortars were applied to the substrates, both using the mesh (with the net positioned at the mortar–substrate interface) and without using the mesh, and after hardening, they were detached and tested; then, the independent sample t-test was used to evaluate the differences between the results obtained for the mortars applied with the mesh and without the mesh. As a result, it was concluded that the use of the mesh does not significantly influence the macrostructural properties studied. The relevance of the present study lies in the development of an experimental methodology that allows for the characterization of mortar’s behaviour after its application on the substrate, i.e., that enables the substrate’s influence to be considered in the formulation of each mortar.

1. Introduction

The external coatings of building walls are of fundamental importance for buildings’ durability because these coatings are the first barrier against the attack of external agents such as weather agents (rain, wind, and sun), mechanical actions, and human intervention (pollution and vandalism) [1,2]. Since mortars are among the most common wall coatings and are still the most common type of coating in Portugal, whether in modern or old constructions, understanding their behaviour through adequate characterization has become increasingly important [3,4].
Mortar coatings can be cement-based, for use in most modern constructions, or lime-based (with hydraulic or air lime) for rehabilitating historic or old buildings, and can be produced in situ or purchased with a pre-set dosage. Knowledge about the different types of mortar is fundamental in order to make adequate choices and to apply mortars correctly, thus improving their compatibility with other building components.
The study of mortars and their characteristics is of fundamental importance in terms of the service life of buildings, particularly of their facades. In general, the study of mortars focuses on their formulation and characterization, and also on their in-service performance and interaction with the substrate, namely their interface formation and adhesion properties.
After the application of the mortar to the substrate and during the formation of the interface, interactions occur that begin soon after the mortar comes in contact with the substrate, and these interactions change over time due to the hydration kinetics and the absorption of the substrate [3,4]. The behaviour and characteristics of the applied mortar will then be influenced by the characteristics of the substrate and the interface created between these two elements.
Traditional mortars have already been the subject of extensive research on their formulation, manufacturing and application methods, and also on the influence of these and other factors on their characteristics. Mortars should have low permeability to liquid water but good permeability to water vapour, good adhesion to the substrate, and adequate mechanical strength and deformation capacity, among others [5,6,7,8].
The in-service performance of mortars is influenced by the substrate characteristics, application conditions, curing conditions, and the characteristics of the mortars themselves [9,10,11,12,13,14].
One of the important factors that influences the adhesion between phases is the water absorption and retention capacity [15]. Considering that the adhesion is mostly induced by the mechanical penetration of the cement matrix into the pores of the substrate where the mortar is applied [16], a transition zone can be identified where two types of adhesion can be observed, chemical and mechanical, and this occurs in multiphase systems [17].
Mechanical adhesion can be described as the potential of the mortar to penetrate the pores of the substrate [3]; thus, the surface characteristics of the substrate influence this type of adhesion. If the porosity and/or roughness of the substrate allows for the penetration of the cementitious base, there is a great potential for mechanical adhesion [18] and this phenomenon can also be explained as a complex system involving the transport of material to the zone of transition, penetrating the pores of the substrate, and following the hydration of cementitious materials.
In order to be able to estimate the characteristics of the mortars applied to a substrate, using the characteristics of the mortars determined under laboratory conditions, a funded research project is under development: IF MORTAR. The objective of this project is to compare, for similar mortars, the characteristics analysed in laboratory specimens, prepared with non-absorbent moulds, with the characteristics determined after the application of these mortars on several different substrates.
To achieve this objective, it was necessary to apply the mortars to the substrates and after hardening, to detach and analyse them. Due to the difficulty of separating the two materials encountered in the laboratory, a fibreglass mesh was introduced between the mortar and the substrate to facilitate detachment [8,19,20,21], and it was confirmed that this helps the detachment process.
However, the question arises: will this methodology—the introduction of a fibreglass mesh in the mortar–substrate interface—cause significant changes in the characteristics of the applied mortars?
To answer this question, an experimental campaign was carried out, comparing the characteristics of the mortars applied to the substrates with and without the application of a fibreglass mesh in the interface of the two materials. Thus, the main objective of this work is to evaluate the efficacy of the fibreglass mesh as a support in the characterization of applied coating mortars.

2. Materials and Methods

2.1. Materials

For the experimental design, the following mortars were chosen: in situ-made cement mortar, in situ-made hydraulic lime mortar, and pre-dosed one coat air lime mortar. The materials used for the mortar’s formulation were the following: CEM II/B-L 32.5 N cement, NHL 3.5 hydraulic lime, washed river sand with well-distributed particle size, and industrial air lime. The following substrates (Figure 1) were used: regular hollow ceramic bricks (30 cm × 20 cm × 7 cm), solid ceramic bricks (20 cm × 10 cm × 5 cm), concrete slabs (30 cm × 20 cm × 7 cm), lightweight concrete blocks (50 cm × 20 cm × 10 cm), and natural stone slabs (30 cm × 20 cm × 7 cm, Figure 1e).
The cement mortar was produced with a binder:sand ratio of 1:4, by volume, and with a water/binder ratio of 1, by mass. In the case of the hydraulic lime mortar, the binder:sand ratio was of 1:3, in volume, and the water/binder ratio of 1.2, by mass. For both types of mortar, these are the binder:sand ratios commonly used in construction practice. The amount of water was adjusted so that the mortars showed good workability. Regarding the air lime mortar, an industrial mortar was selected, which was produced according to the manufacturer’s instructions. According to the technical sheet, this mortar has the following composition: calcium hydroxide, pozzolanic binders, aggregates of selected particle size distribution, chemical admixtures, and fibres.
For the chosen mortars and substrates, the intention was to cover materials used both in new constructions and in the rehabilitation of old constructions. Solid brick and natural stone are commonly found in old buildings and the other substrates are generally used in new constructions. Cement mortars are usually applied in new constructions and lime mortars are suitable for application to traditional substrates—although hydraulic lime mortar is also suitable for use on modern substrates.
The cement mortar was applied to the following substrates: hollow ceramic brick, concrete slab, and lightweight concrete block. The hydraulic lime mortar, in addition to the substrates used for the cement mortar, was also applied to the natural stone and solid ceramic brick substrates. The air lime mortar was applied only to the natural stone and solid ceramic brick substrates. Table 1 shows the different types of mortar used and the corresponding application substrates.
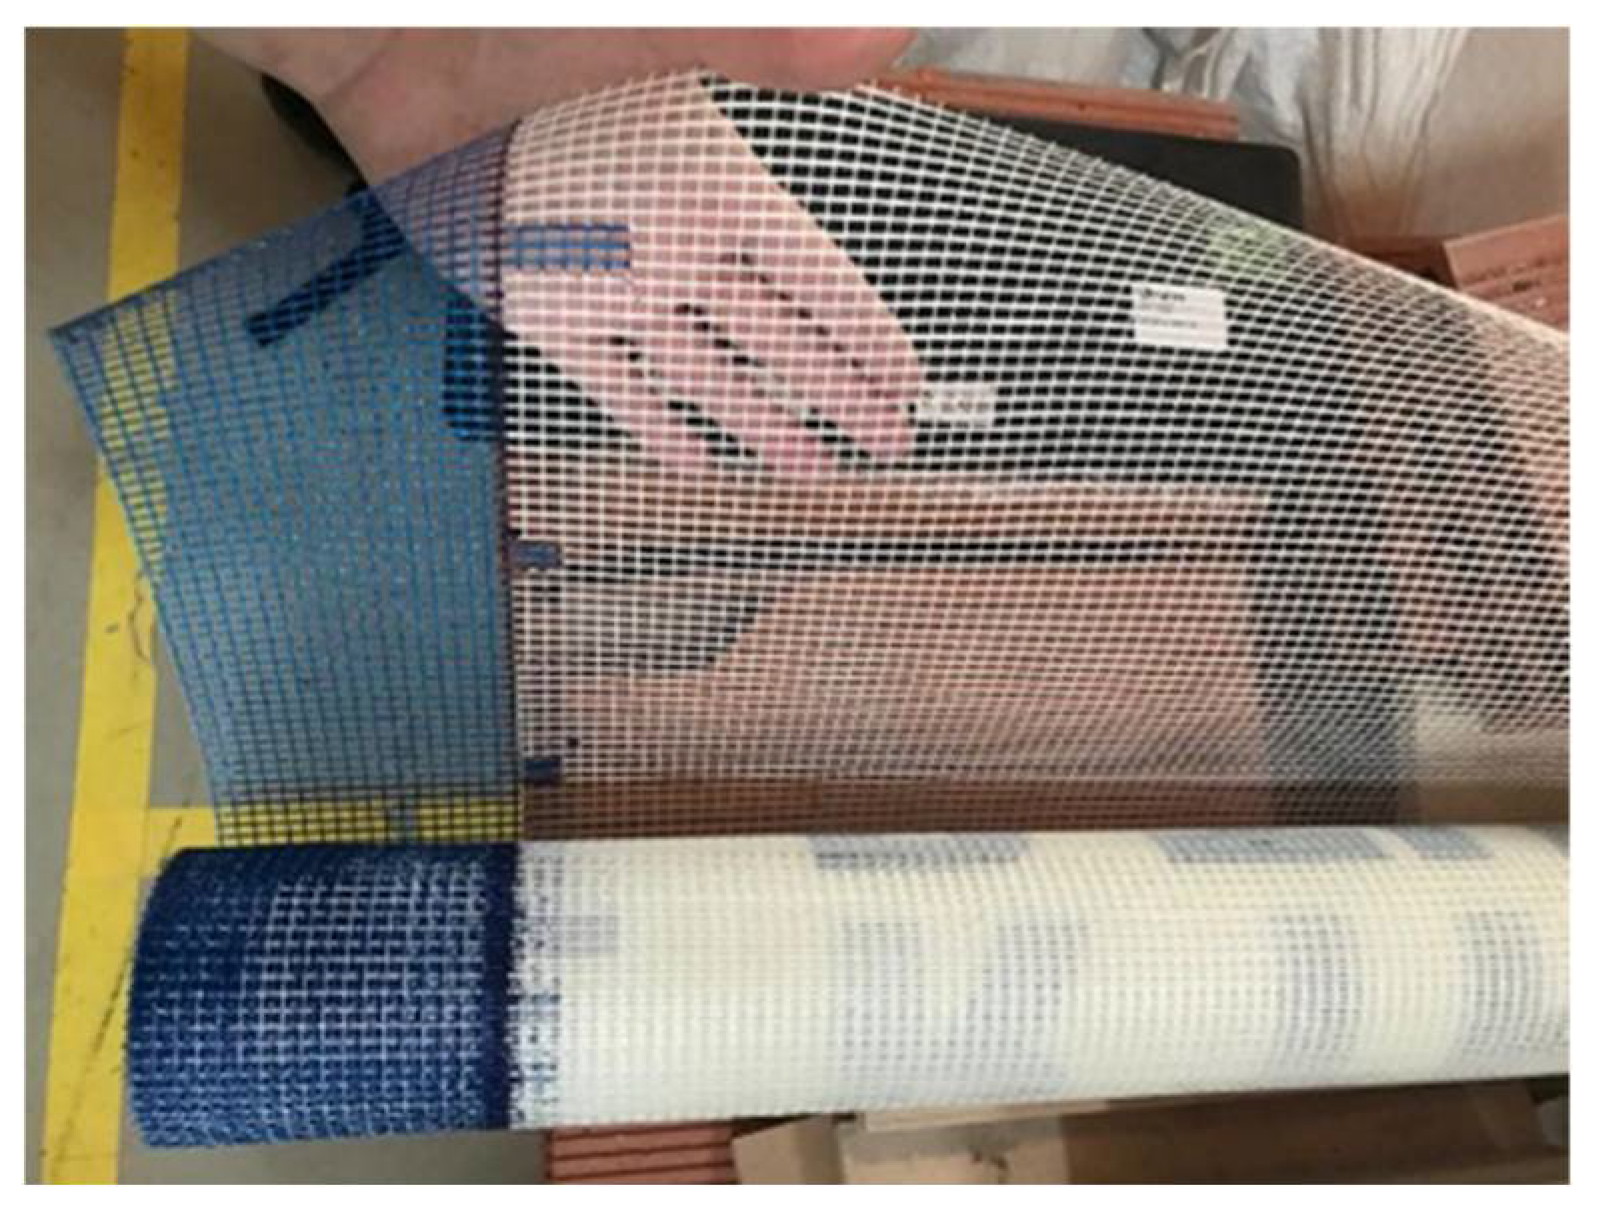
The fiberglass mesh used, shown in Figure 2, was THERM 160, resistant to alkalinity, with a mesh opening of 5 mm × 5 mm and a specific mass of 158 g/m². This material was chosen because it had already been applied in the work by Torres et al. [9] with good results, Figure 2.

2.2. Methods

The methodology of this work was essentially experimental, comparing mortars applied, cured, and detached from the substrates with the use of fibreglass mesh in the interface between the two materials (Figure 3a) and without the use of fibreglass mesh (Figure 3b). For the application of mortars on the substrates, wooden molds were used in order to guarantee a constant mortar thickness of 1.5 cm.
Before applying the mortar, each substrate was moistened by spraying water in the following amounts: 100 mL and 33 mL in the case of the hollow ceramic bricks (Figure 3c) and solid ceramic bricks, respectively, and 75 mL for the remaining substrates (lightweight concrete block, concrete slab, and natural stone).
Figure 4a,b illustrate the coating surface levelling process and the mortar after application on the substrate. To carry out the tests and compare the results, immediately after applying the mortars, “square” specimens (40 mm × 40 mm) and “circular” specimens (diameter of 100 mm) were marked in the fresh mortar (Figure 4c). These dimensions were used as they match those of the moulds indicated in standards for mortar testing (except for the thickness, in the case of the square specimens). The disks were produced for the water vapour permeability test, and the rest of the tests (bulk density, open porosity, drying index, and compressive strength) were carried out on the specimens with dimensions of 40 mm × 40 mm × 15 mm. Subsequently, after the curing process, the specimens were detached and submitted to characterisation tests.
Regarding the curing conditions, the indications of standard EN 1015-11 [22] were followed, namely:
  • For first 2 days, in the case of cement and hydraulic lime mortars, and for the first 5 days, in the case of air lime mortar: temperature of 20 °C +/− 2 °C, relative humidity of 95% +/− 5% or in a polyethylene bag (in the mould);
  • Following 5 days (for cement and hydraulic lime mortars, the following 2 days), in the case of air lime mortar: temperature of 20 °C +/− 2 °C, relative humidity of 95% +/− 5% or in a polyethylene bag (without the mould);
  • Remaining 21 days (for cement and hydraulic lime mortars, remaining 83 days), in the case of air lime mortar: temperature of 20 °C +/− 2 °C, relative humidity of 65% +/− 5% (without the mould).
After the curing process, tests were carried out to evaluate the following properties: bulk density and open porosity (NP EN 1936 [23]); percentage and distribution of pore sizes, through mercury intrusion porosimetry (ISO 15901–1 [24]); capillary water absorption coefficient (ISO 15148 [25]); drying index (EN 16322 [26]); water vapour permeability (ISO 12572 [27]); and compressive strength (EN 1015-11 [22]).
The tests were conducted according to the following procedures:
  • Bulk density and open porosity
To carry out the test, the specimens were dried in an oven at 60 °C until reaching constant mass and were weighed (Ms). Then, they were immersed in water until saturation, for 48 h, and were weighed while immersed (Mh) (hydrostatic weighing). After that, they were removed from the water, the excess water was removed, and they were weighed again to obtain the saturated mass (Msat).
With this, the bulk density was calculated through the expression in Equation (1):
B D = M s M s a t M h .   ρ r h
Open porosity was calculated using the expression in Equation (2):
O P = M s a t M s M s a t M h
In the Equations:
  • BD is the bulk density in kg/m3;
  • Ms is the mass of the dry specimen, in g;
  • Mh is the mass of the specimen immersed in water, in g;
  • Msat is the mass of the saturated specimen, in g;
  • ρrh is the density of water at room temperature, in kg/m3;
  • OP is the open porosity in %.
  • Capillary water absorption coefficient
The specimens were waterproofed on their side faces to ensure a unidirectional water flow. All samples were placed in a vat with a lid (avoiding water evaporation) with a water depth of approximately 5 to 7 mm, and the level was periodically checked.
The samples were removed from the water, weighed, and placed again after 5 min, 10 min, 20 min, 30 min, 1 h, 1 h and 30 min, 2 h, 4 h, 8 h, 24 h, 48 h, and 72 h.
The capillary water absorption coefficient represents the speed at which the material absorbs water. First, the amount of water absorbed at the different weighing times must be determined; then, the graph of the change in mass per unit area as a function of the square root of time must be plotted. The capillary absorption coefficient was calculated using the following Equation (3):
A w = Δ m t f Δ m 0 t f
where
  • m’tf is the mass change, per unit area, on the straight line, at time tf, in kg/m2;
  • m’0 is the mass change, per unit area, at the intersection of the straight line with the mass change axis, in kg/m2;
  • tf is the time elapsed between the start and end of the straight portion of the test curve, in seconds.
  • Water vapour permeability
For this test, specimens approximately 10 cm in diameter and 1.5 cm in thickness were placed in a glass cup with water (wet cup method), with an air height of about 15 mm between the water and the specimen. The side face of the specimen and the area of connection with the cup were properly waterproofed, so the vapour diffusion occurred exclusively through the specimen (through its lower and upper faces).
The assembly was placed in a climatic chamber with a constant temperature and humidity (23 °C and 50% relative humidity). The initial and periodic weighing was carried out until the mass variation per unit time was constant (steady-state diffusion current).
From the weighing records, a graphic representation of the weight variation as a function of time was performed. When the vapour transmission proved to be constant, the slope of the line joining the points where this circumstance occurred, and which is equal to the water vapour diffusion flux, Equation (4), was determined:
G = m 2 m 1 t 2 t 1
where
  • G is the water vapour flow rate, in kg/s;
  • m2m1 is the change in mass after the steady-state diffusion current is established, in kg;
  • t2t1 is the time interval corresponding to the mass change, in s.
From this value, the density of water vapour flow rate can be obtained through the expression Equation (5):
g = G A
where
  • g is the density of water vapour flow rate in kg/(s·m2);
  • G is the water vapour flow rate, in kg/s;
  • A is the sample area, in m².
The water vapour permeance (W) is given by Equations (6) and (7):
W = g Δ p v
Δ p v = p s a t . 1 2 100
where
  • psat is the saturation pressure at the test temperature (23 °C), in Pa;
  • 1–∅2 is the difference between the relative humidity values inside and outside the test cup, in %.
The water vapour permeability is given by expression 8:
δ = W · d
where
  • δ is the water vapour permeability, in kg/(m·s·Pa);
  • W is the water vapour permeance, in kg/(m²·s·Pa);
  • d is the thickness of the specimens, in m.
  • Drying index
Saturated specimens had their faces waterproofed, except the upper face, and were placed in a climatic chamber at 23 ± 2 °C and at a relative humidity of 50 ± 5 °C.
The specimens were weighed every 10 min in the first hour and every hour until completing 8 h. After this, the specimens were weighed every 24 h until the difference in mass between two consecutive weightings was less than 0.1%.
After stabilization, the drying index was determined according to the following expression:
I s = i = 1 n ( t i t i 1 ) W i 1 + W i W m a x   t f
where
  • ti is the test time i, in hours;
  • Wi is the moisture content at time i, in %;
  • tf is the final test time, in hours.
  • Percentage and distribution of pore sizes was determined through mercury intrusion porosimetry (MIP)
Mercury intrusion porosimetry is a test that quantifies the percentage and distribution of pore sizes in each solid sample. A Micromeritics mercury porosimeter, model Autopore IV 9500, with a capacity to reach 60,000 psi, was used.
For the test’s execution, fragments of the mortars were used, and all were subjected to drying to constant mass before the test.
  • Compressive strength
The mechanical strength of the mortar is the material’s ability to resist induced stresses.
In this test, a compressive load is applied without chock, at a rate of 100 N/s, so that failure occurs between 30 and 90 s. The compressive strength is calculated according to the following expression:
R c = F c S
where
  • Rc is the compressive strength, in MPa;
  • Fc is the compressive failure load, in N;
  • S is the load application area, in mm2.
After the tests were carried out, the t-test for independent samples was performed to evaluate the statistical significance of the differences found between the results of the specimens with and without the fibreglass mesh applied between the coating and the substrate.
For this, the following hypotheses were established: “H0: there is no difference between the samples with and without the fibreglass mesh” and “H1: the samples can be considered statistically different”. So, to reject hypothesis H0 and consequently accept hypothesis H1, a p-value of 0.05 was considered, where p-value < 0.05 rejects H0.

3. Results and Discussion

The tables presented in this chapter show the results obtained in the different tests for the mortars hardened with and without the mesh at the mortar–substrate interface, namely: the mean results, the coefficient of variation, the difference between the means, and the p-value. The coefficient of variation is a measure of dispersion. For a set of n observations, it is defined as the quotient between the standard deviation and the arithmetic mean of the distribution [28].
The obtained results were also analysed considering the porosimetry properties, and particularly, the distribution of the pore sizes for each combination, related to the differential intrusion of mercury (volume of pores).
According to Pipilikaki and Beazi-Katsioti [29] the pores can be classified as follows:
  • Pores larger than 10 microns—these usually have no relevant influence on water capillarity and are often closed; so, in addition to not influencing the water transport in general, they may also be interparticle voids, influencing vapour transport but not liquid water capillary transport in a significant way.
  • Capillary pores—between 0.0025 and 10 microns (controlling water capillary transport).
Within the capillary pores, there are:
  • Large capillary pores—between 0.050 and 10 microns (high effect on capillarity);
  • Medium capillary pores—between 0.010 and 0.050 microns (small effect on permeability);
  • Small capillary pores, or gel pores, affecting mainly the shrinkage and characteristics of the hydrated cement matrixes.
  • For each type of mortar, the results are represented graphically, with the pore sizes vs the differential mercury intrusion, which allows for the evaluation of the volume of the pores for each one of the ranges of pore diameters described above.

3.1. Cement Mortar

The results obtained in the tests are presented in Table 2, Table 3 and Table 4 for the cement mortar applied to hollow ceramic brick, concrete slab, and lightweight concrete block, respectively. None of the differences obtained between the results corresponding to the two application modes (with and without de fibreglass mesh) are considered statistically significant, according to the t-test (p-value > 0.05).
Thus, according to Table 2, none of the characteristics of the cement mortar applied to the hollow ceramic brick substrate showed significant differences when comparing the results obtained with the fibreglass mesh and the results without the fibreglass mesh. The bulk density was the characteristic with the most similar results (p-value = 0.48), while the capillarity water absorption coefficient was the one that presented the greatest discrepancy in the results with and without the use of fibreglass mesh (p-value = 0.06). Therefore, for the cement mortar applied to the hollow ceramic brick substrate, the fibreglass does not seem to influence the results obtained, but helps the detachment of the specimens.
Regarding the cement mortar applied to the concrete slab substrate (Table 3), none of the characteristics showed significant differences between the mortars applied with the fibreglass mesh and without the fibreglass mesh. The compressive strength presented the highest p-values (0.40), that is, the least significant differences between the result with and without fibreglass mesh.
For the cement mortar applied to the lightweight concrete block substrate, the p-values obtained in the t-test were the highest (the capillarity water absorption coefficient reached 0.91).
It was verified that the application of the fibreglass mesh between the substrate and the coating layer did not have a significant influence on the results obtained for cement mortars.
The pore size diameter distribution, open porosity, and the average pore diameter obtained by the mercury intrusion are presented for the cement mortar applied to the hollow ceramic brick substrate in Figure 5, for the cement mortar applied to the concrete slab substrate in Figure 6, and for the cement mortar applied to lightweight concrete block substrate in Figure 7. Table 5 shows the cumulative mercury volume intruded by the capillary pore range.
For the cement mortar applied to the ceramic brick substrate, after analysing Figure 5 and Table 5, it is evident that the greatest differences observed are in the range of pores between 0.05 µm and 10 µm, that are the ones that have great effect on the capillarity. The same conclusion had been drawn with the analysis of the results presented in Table 2.
The open porosity obtained by mercury intrusion is also close to the open porosity obtained by immersion; however, there is an inverted tendency as the open porosity obtained by immersion increases for the mortar applied without mesh. The porosity obtained by the mercury intrusion results might justify the compressive strength results, as the mortar with fewer pores indicates a more compact structure and consequently a slightly higher compressive strength, as observed for mortar applied without mesh.
As for the cement mortar applied to the concrete slab substrate, analysing the results obtained for the porosimetry properties acquired by the mercury intrusion, presented in Figure 6 and Table 5, it can be observed that the inclusion of the mesh led to the increase of the open porosity, in contrast to that which is observed for the open porosity results obtained by immersion, presented in Table 3. There is a large increase in pores with a dimension greater than 10 μm, which as previously mentioned, are non-active, normally closed pores, and are not detected in the determination of open porosity by immersion. It is also evident that there is a considerable increase in the number of pores between 0.05 µm and 10 µm, i.e., an increase in the large capillary pores that are the ones that have a high effect on capillarity. The same conclusion had been drawn with the analysis of the results presented in Table 3.
The average pore diameter does not suffer a significant change with the inclusion of the mesh.
No major differences were observed for the mortar applied to the lightweight concrete block with and without mesh, in what concerns to the open porosity and pore size distribution as it can be seen in the chart. In addition, the results obtained for open porosity determined by mercury intrusion are close to the ones obtained by immersion. Most of the pores have diameters between 0.01 µm and 10 µm.

3.2. Hydraulic Lime Mortar

In the case of the hydraulic lime mortar, the results obtained in the open porosity (hollow ceramic brick and natural stone), drying index (solid ceramic brick), and compressive strength (natural stone) tests presented differences of statistical significance and may indicate a possible mesh influence.
Table 6, Table 7, Table 8, Table 9 and Table 10 present the results obtained for the hollow ceramic brick, concrete slab, lightweight concrete block, solid ceramic brick, and natural stone substrates, respectively, without and with the application of fibreglass mesh. Figure 8, Figure 9, Figure 10, Figure 11 and Figure 12 present the charts of the pore size diameter distribution, porosity obtained by mercury intrusion, and average pore diameter obtained by mercury intrusion. Table 11 shows the cumulative mercury volume intruded by capillary pore range.
For the case of the hollow ceramic brick, a p-value equal to 0.02 (value less than 0.05) was obtained for the open porosity, indicating a statistically significant difference between the values obtained with and without the mesh at the mortar–substrate interface. The water vapour permeability coefficient was the characteristic that was least altered using the mesh, with a p-value of 0.85.
Despite the differences observed in the chart for the pores size distribution, the mortar applied to the hollow ceramic brick substrate without mesh has a porosity obtained by mercury intrusion very similar to the one applied with mesh. These results are also very close to the ones obtained for the open porosity by immersion (Table 6). The inclusion of the mesh led to the appearance of pores in the range of 0.01 µm to 10 µm, which is reflected in a considerable difference in the average pore diameter. The mortar without mesh has a higher average pore diameter.
Regarding the concrete slab substrate, none of the characteristics were influenced using the fibreglass mesh. The same can be said for the lightweight concrete block substrate. In this case, the highest p-values were obtained for the drying index, compressive strength, and bulk density.
With respect to the porosimetry properties of the mortars applied to the concrete slab substrate, obtained by mercury intrusion, minor differences were observed in the pore size diameter vs differential intrusion chart. The porosity obtained by mercury intrusion is slightly higher for the mortar applied without mesh in the concrete slab substrate and the average pore diameter is slightly lower for this case. The open porosity obtained by mercury intrusion values obtained are relatively close to the ones obtained for open porosity by immersion.
For the mortar applied to the lightweight concrete block substrate, slight differences were observed with respect to the evolution of pore size diameter vs. the differential intrusion. However, the mortar applied to this substrate without mesh had a higher porosity obtained by mercury intrusion than the one applied with mesh. The average pore diameter of the mortar applied with mesh is higher than that of the mortar applied without mesh. The porosity values obtained by mercury intrusion are close to the open porosity presented in Table 8.
For the drying index, a significant statistical difference was found in the case of the mortar applied to the solid ceramic brick substrate. The p-value was equal to 0.03. The remaining values were above the limit established for the p-value (0.05), which indicates that the results obtained with and without the use of the mesh do not have significant statistical differences. In the case of bulk density, the p-value was 2.77.
The tendencies of pore size diameter vs. differential intrusion are similar for the hydraulic lime mortar applied to the solid ceramic brick with and without mesh, except for pore sizes above 100 µm, for which a significant increase in the number of pores was recorded. However, there is a significant difference for the porosity obtained by mercury intrusion: the porosity of the mortar applied without mesh is almost double that of the mortar applied with mesh. Since the open porosity presented in Table 9 is similar for both circumstances (with and without mesh) and close to the result obtained for porosity obtained by mercury intrusion of the mortar applied with mesh, it is possible that the sample used to determine the porosity of the mortar applied without mesh had some cracking that was not detected during the test.
As for the mortar applied to the natural stone substrate, with and without mesh, it was found that there is a statistically significant difference for the open porosity and compressive strength results, with p-values of 0.01 and 0.04, respectively.
The open porosimetry properties obtained by mercury intrusion of the hydraulic lime mortar applied to the natural stone substrate with mesh are very similar to the properties of the same mortar applied without mesh. These results are within the same range of the results obtained for open porosity by immersion, presented in Table 10.

3.3. Industrial Air Lime Mortar

A possible influence of the fibreglass mesh was observed in the following results obtained for the air lime mortar: bulk density (solid ceramic brick), open porosity (natural stone), drying index (solid ceramic brick and natural stone), and the water vapour permeability coefficient (solid ceramic brick). Table 12 and Table 13 show the results of the air lime mortar applied to the solid ceramic brick and natural stone substrates. Figure 13 and Figure 14 present the results obtained by mercury intrusion for the porosimetry properties. Table 14 shows the cumulative mercury volume intruded by capillary pore range.
In the case of the mortar applied to the solid ceramic brick substrate, 50% of the analysed characteristics showed statistically significant differences after the use of the fibreglass mesh, namely: the bulk density, drying index, and water vapour permeability coefficient. The open porosity showed the greatest similarity (p-value = 0.95).
The evolution of the pore size diameter vs. the differential intrusion of the air lime mortar applied to the solid ceramic brick with mesh is very similar to that of the same mortar applied to the substrate without mesh. In some areas of the chart, the mortar applied with mesh presents a higher number of pores, which is confirmed by the higher porosity obtained for this combination. The average pore diameter is higher for the mortar applied without mesh and the open porosity of this same mortar is similar to the open porosity values presented in Table 13. Analysing Table 14, it is evident that the largest changes in pore size are in the pore ranges between 0.0025/0.01 μm and between 0.05/10 μm, which are responsible for the changes in capillary absorption and mechanical resistance.
When analysing the results obtained for the mortar applied to the natural stone substrate, with and without mesh, it is evident that two of the analysed characteristics, the open porosity and drying index, showed statistically significant differences, with p-values much lower than 0.05.
Even though the tendencies for the evolution of pore size diameter vs. differential intrusion are similar within some ranges, there are differences for the air lime mortar applied to the natural stone substrate with and without mesh. These differences are similar to those observed for the air lime mortar applied to the solid ceramic brick substrate.

4. Conclusions

To choose the appropriate mortar to apply to a given substrate, it is necessary to possess detailed knowledge of its behaviour and properties. This is essential for making a compatible and sustainable choice.
The characteristics of the mortars are mostly determined in specimens prepared with non-absorbent laboratory moulds, according to the applicable standards. However, after their application to the substrate, the mortars might present a different behaviour from the one determined in the laboratory specimens. To ascertain the possible behaviour differences, it is necessary to apply the mortar to the substrate, and after curing, to detach it for analysis and characterization. The greater the adherence on the substrate, the more difficult the detachment will be. To facilitate this, a fibreglass mesh can be introduced between the substrate and the mortar, but it is important to know if this mesh will affect the final properties of the mortar. Therefore, the main objective of this work was to analyse the potential use of a fibreglass mesh, placed between the fresh mortar and the substrate, towards the behaviour of applied mortars.
According to the results presented, the cement mortar was the one that showed the smallest differences between applications with or without fibreglass mesh, for all types of substrates. For this type of mortar, the mesh does not influence any of the properties tested, which was confirmed by the t-tests with a p-value < 0.05 for all the properties.
Regarding the hydraulic lime mortar, some properties (such as the open porosity, drying index, and compressive strength) were affected by the use of the mesh, for some substrates. This mortar was the most influenced by the use of the mesh when applied to the natural stone substrate.
However, for the industrial air lime mortar statistically significant differences were found for most properties (the bulk density, drying index, and water vapour permeability coefficient) when applied to the solid ceramic brick.
It can be concluded that there were some changes in behaviour when the mesh was used to facilitate the detachment of the coating layer, especially in the industrial air lime mortar, for which some results with statistically significant differences were found. However, in most cases, it was concluded that the properties of the mortars did not change significantly due to the presence of this mesh in the experimental program. Despite the t-test showing a statistically significant difference for some cases, the physical interpretation of the results, in many of these cases, indicates that the absolute difference between these values is slight. There was no significant difference in the characteristics of the tested mortars; therefore, the differences found in the pore distribution were not capable of producing significant effects on the studied properties.
Thus, using a fibreglass mesh at the substrate–mortar interface is an effective technique to be used in an experimental program to help detach the coating layer from the substrate, thereby allowing for an analysis of its behaviour after application, i.e., its in-service behaviour. In general, there were no significant differences in the results compared with those obtained for the mortar applied to the substrate without the use of the fibreglass mesh.

Author Contributions

Conceptualization, all the authors; methodology, all the authors; formal analysis, all the authors; investigation, all the authors; data curation, all the authors; writing—original draft preparation, P.B. and R.T.; writing—review and editing, all the authors; supervision, I.T. and I.F.-C.; project administration, I.T. and I.F.-C. All authors have read and agreed to the published version of the manuscript.

Funding

The work presented was carried out within the framework of the IF MORTAR project (POCI-01-0145-FEDER- 032223/PTDC/ECI-EGC/32223/2017), within the scope of the Portugal 2020 program, financed by FEDER through the POCI program. The funding provided is kindly acknowledged. The authors also thank CERIS research unit from IST and are grateful for the FCT support through funding UI/DB/04625/2020 and UI/BD/151151/2021 from this research unit. The funding provided is kindly acknowledged.

Institutional Review Board Statement

Not applicable.

Informed Consent Statement

Not applicable.

Data Availability Statement

Data sharing is not applicable to this article.

Conflicts of Interest

The authors declare no conflict of interest.

References

  1. Veiga, M.R. Behaviour of Renderings Mortars: Contribution for the Research in Cracking Resistance. Ph.D. Thesis, Civil Engineering, Faculty of Engineering of the University of Porto, Porto, Portugal, 1998. (In Portuguese). [Google Scholar]
  2. Magalhães, A. Pathology of Old Plasters; Cadernos Edifícios, n.o 2; LNEC: Lisboa, Portugal, 2002. [Google Scholar]
  3. Nicot, P. Interactions Mortier-Support: Éléments Déterminants des Performances et de L’adhérence D’un Mortier. Ph.D. Thesis, Université de Toulouse, Toulouse, France, 2008. [Google Scholar]
  4. Costa, E.B.C.; John, V.M. Substrate-cement matrix adhesion-state of the art. In IX Simpósio Brasileiro de Tecnologia de Argamassas; GT Argamassas: Belo Horizonte, Brazil, 2011. (In Portuguese) [Google Scholar]
  5. LNEC. Recommendations for the Execution of External Mortar Coatings; Laboratório Nacional de Engenharia Civil: Lisboa, Portugal, 1968. (In Portuguese) [Google Scholar]
  6. Flores-Colen, I. Methodology for Evaluating the Performance in Service of Plastered Facades from the Perspective of Predictive Maintenance. Ph.D. Thesis, Instituto Superior Técnico, Lisboa, Portugal, 2009. (In Portuguese). [Google Scholar]
  7. Martins, A. Study of the Influence of Cement Dosage on the Performance of Plastering Mortars. Master’s Thesis, Instituto Superior Técnico, Lisboa, Portugal, 2008. (In Portuguese). [Google Scholar]
  8. Bellei, P.; Arromba, J.; Flores-Colen, I.; Veiga, R.; Torres, I. Influence of brick and concrete substrates on the performance of renders using in-situ testing techniques. J. Build. Eng. 2021, 43, 102871. [Google Scholar] [CrossRef]
  9. Torres, I.; Veiga, R.; Freitas, V. Influence of substrate characteristics on behaviour of applied mortar. J. Mater. Civ. Eng. 2018, 30, 04018254. [Google Scholar] [CrossRef]
  10. Freitas, V.P.; Corvacho, H.; Sá, A.; Quintela, M.A. Discussing the Durability Assessment of Cement Mortars—A Contribution for a Prediction Model. In Proceedings of the 11th International Conference on Durability of Building Material and Components (11DBMC), Istambul, Turkey, 11–14 May 2008. [Google Scholar]
  11. Flores-Colen, I.; de Brito, J.; Branco, F. In Situ Adherence Evaluation of Coating Materials. Exp. Tech. 2009, 33, 51–60. [Google Scholar] [CrossRef]
  12. Malva, M. Rendering Mortars for Old Buildings Contribute to the Evaluation of Their Performance through In Situ and Laboratory Test Techniques. Master’s Thesis, Instituto Superior Técnico, Lisboa, Portugal, 2009. (In Portuguese). [Google Scholar]
  13. Silva, L.; Ferreira, V.M.; Vera, F. Influence of parameters associated with the mixing and application of a monolayer coating, with air introducer, on the properties of paste mortar and hardened. In 2nd International Symposium on Pathology, Durability and Rehabilitation of Buildings. GECoRPA; CIB W86; LNEC: Lisbon, Portugal, 2003. [Google Scholar]
  14. Romano, C.; Schreurs, H.; Silva, F.; Cardoso, F.; Barros, M.; Pileggi, R.; John, V. Effect of the mixing procedure on the characteristics of industrialized coating mortars. In 3rd Portuguese Congress of Construction Mortars; National Civil Engineering Laboratory: Lisbon, Portugal, 2010. (In Portuguese) [Google Scholar]
  15. Palmer, L.A.; Parsons, D.A. A study of the properties of mortars and bricks and their relation to bond. Bur. Stand. J. Res. 1934, 12, 5. [Google Scholar] [CrossRef]
  16. Grandet, J. Contribution h L’dtude de la Liaison entre la Pdte de Ciment Portland et les Terres Cuites. Doctoral Thesis, l’Université Paul Sabatier, Toulouse, France, 1971. [Google Scholar]
  17. Costa, E.B.C.; John, V.M. Adhesion substrate-matrix—State of the art. In IX SBTA; ANTAC: Belo Horizonte, Brazil, 2011. (In Portuguese) [Google Scholar]
  18. Carvalho, A.N., Jr. Evaluation of the Adhesion of Mortared Coatings: A Contribution to the Identification of the Mechanical Adhesion System. Ph.D. Thesis, Federal University of Minas Gerais, Belo Horizonte, Brazil, 2002. (In Portuguese). [Google Scholar]
  19. Silveira, D.; Gonçalves, A.; Flores-Colen, I.; Veiga, R.; Torres, I.; Travincas, R. Evaluation of in-service performance factors of renders based on in-situ testing techniques. J. Build. Eng. 2020, 34, 101806. [Google Scholar] [CrossRef]
  20. Torres, I.; Flores-Colen, I.; Travincas, R.; Silveira, D. Study of Different Sand Particle Size in Cement Mortars after Application in Ceramic Brick Substrate, Construction, Energy, Environment E Sustainability; CEES: Coimbra, Portugal, 2021. [Google Scholar]
  21. Torres, I.; Travincas, R.; Flores-Colen, I.; Bellei, P. The Influence of Ceramic Brick Support on Water Resistance in Applied Industrial Mortar. Construction, Energy, Environment E Sustainability; CEES: Coimbra, Portugal, 2021. [Google Scholar]
  22. EN1015-11; Methods of Test for Mortar for Masonry—Part 11: Determination of Flexural and Compressive Strength of Hardened Mortar. EN: Brussels, Belgium, 1999.
  23. NP EN 1936; Test Methods for Natural Stone. Determination of Real and Bulk Density and Total and Open Porosity. IPQ: Caparica, Portugal, 2008. (In Portuguese)
  24. ISO 15091; Evaluation of Pore size Distribution and Porosity of Solid Materials by Mercury Porosimetry and Gas Adsorption—Mercury Porosimetry. ISO: Geneva, Switzerland, 2016.
  25. NP EN ISO 15148; Hygrothermal Performance of Building Materials and Products—Determination of Water Absorption Coefficient by Partial Immersion. CEN: Brussels, Belgium, 2002.
  26. EN 16322; Conservation of Cultural Heritage; Test Methods; Determination of drying Properties. CEN: Brussels, Belgium, 2013.
  27. NP EN ISO 12572; Hygrothermal Performance of Building Materials and Products–Determination of Water Vapour Transmission Properties. CEN: Brussels, Belgium, 2016.
  28. Falco, J.G. Applied Statistics; EdUFMT/UFPR: Cuiabá/Curitiba, Brazil, 2008. (In Portuguese) [Google Scholar]
  29. Pipilikaki, P.; Beazi-Katsioti, M. The assessment of porosity and pore size distribution of limestone portland cement pastes. Constr. Build. Mater. 2009, 23, 1966–1970. [Google Scholar] [CrossRef]
Figure 1. Substrates: hollow ceramic brick (a); solid ceramic brick (b); concrete slab (c); lightweight concrete block (d); natural stone slab (e).
Coatings 12 01091 g001
Figure 2. Fibreglass mesh.
Coatings 12 01091 g002
Figure 3. Substrates preparation: with the fibreglass mesh (a); without the fibreglass mesh (b); wetting the application surface of the hollow ceramic bricks substrates (c).
Coatings 12 01091 g003
Figure 4. Mortar–substrate specimens: levelling the coating surface (a); mortar applied to the substrate (b); specimens marked on the coating layer (c).
Coatings 12 01091 g004
Figure 5. Porosimetry properties obtained by mercury intrusion of cement mortar applied to hollow ceramic brick substrate, with and without mesh.
Coatings 12 01091 g005
Figure 6. Porosimetry properties obtained by mercury intrusion of cement mortar applied to concrete slab substrate, with and without mesh.
Coatings 12 01091 g006
Figure 7. Porosimetry properties obtained by mercury intrusion of cement mortar applied to lightweight concrete block substrate, with and without mesh.
Coatings 12 01091 g007
Figure 8. Porosimetry properties obtained via mercury intrusion of hydraulic lime mortar applied to hollow ceramic brick substrate, with and without mesh.
Coatings 12 01091 g008
Figure 9. Porosimetry properties obtained by mercury intrusion of hydraulic lime mortar applied to concrete slab substrate, with and without mesh.
Coatings 12 01091 g009
Figure 10. Porosimetry properties obtained by mercury intrusion of hydraulic lime mortar applied to lightweight concrete block substrate, with and without mesh.
Coatings 12 01091 g010
Figure 11. Porosimetry properties obtained by mercury intrusion of hydraulic lime mortar applied to solid ceramic brick substrate, with and without mesh.
Coatings 12 01091 g011
Figure 12. Porosimetry properties obtained by mercury intrusion of hydraulic lime mortar applied to natural stone substrate, with and without mesh.
Coatings 12 01091 g012
Figure 13. Porosimetry properties obtained by mercury intrusion of air lime mortar applied to solid ceramic brick substrate, with and without mesh.
Coatings 12 01091 g013
Figure 14. Porosimetry properties obtained by mercury intrusion of air lime mortar applied to natural stone substrate, with and without mesh.
Coatings 12 01091 g014
Table 1. Types of mortar and corresponding application substrates.
MortarHollow Ceramic BrickSolid Ceramic BrickConcrete SlabLightweight Concrete BlockNatural Stone Slab
CementX-XX-
Hydraulic limeXXXXX
Air lime-X--X
Table 2. Cement mortar applied to the hollow ceramic brick substrate.
TestsFibreglass MeshNo. of SpecimensMean ValueCV (%)Means Differencep-Value *
Bulk density (kg/m3)Without 319440.6+1%0.48
With 319510.5
Open porosity (%)Without316.90.0−5%0.10
With316.13.1
Capillarity water absorption coefficient (kg/(m2·s0.5))Without30.322.4−25%0.06
With30.2414.1
Drying indexWithout30.1719.7+11%0.42
With30.190.8
Compressive strength (MPa)Without323.614.5−10%0.39
With321.44.9
* t-test results for independent samples (p value > 0.05 indicates that there is no statistically significant difference between the means).
Table 3. Cement mortar applied to the concrete slab substrate.
TestsFibreglass MeshNo. of SpecimensMean ValueCV (%)Means Differencep-Value *
Bulk density (kg/m3)Without31844.470.9+1%0.30
With31857.300.4
Open porosity (%)Without319.531.6−3%0.10
With319.071.2
Capillarity water absorption coefficient (kg/(m2·s0.5))Without30.2703.4−20%0.11
With30.22014.4
Drying indexWithout30.1219.3−34%0.10
With30.09022.4
Water vapour permeability coefficient (kg/(m·s·Pa))Without21.42 × 10−111.9−7%0.35
With21.32 × 10−116.4
Compressive strength (MPa)Without311.5113.1+17%0.40
With313.4723.1
* t-test results for independent samples (p value > 0.05 indicates that there is no statistically significant difference between the means).
Table 4. Cement mortar applied to the lightweight concrete block substrate.
TestsFibreglass MeshNo. of SpecimensMean ValueCV (%)Means Differencep-Value *
Bulk density (kg/m3)Without41885.051.0−1%0.81
With61882.470.5
Open porosity (%)Without419.981.2+1%0.69
With620.123.1
Capillarity water absorption coefficient (kg/(m2·s0.5))Without30.28011.21%0.91
With30.283.2
Drying indexWithout30.1313.2−34%0.24
With30.10331.2
Compressive strength (MPa)Without412.646.44%0.59
With612.1914.2
* t-test results for independent samples (p value > 0.05 indicates that there is no statistically significant difference between the means).
Table 5. Cement mortars–capillary pores–cumulative mercury intrusion.
Sample0.0025 μm < ø < 0.01 μm0.01 μm < ø < 0.05 μm0.05 μm < ø < 10 μmø > 10 μm
(mL/g)(mL/g)(mL/g)(mL/g)
Hollow brick—without mesh0.00700.14400.34110.1646
Hollow brick—with mesh0.01170.11590.60220.1364
Concrete slab—without mesh0.00000.04400.35240.2161
Concrete slab—with mesh0.04760.13311.46341.0686
Lightweight concrete block—without mesh0.00120.13730.80580.0446
Lightweight concrete block—with mesh0.02690.12410.70640.0442
Table 6. Hydraulic lime mortar applied to the hollow ceramic brick substrate.
TestsFibreglass MeshNo. of SpecimensMeanCV (%)Means Differencep-Value *
Bulk density (kg/m3)Without31898.730.71%0.38
With31889.630.5
Open porosity (%)Without322.401.65%0.02
With321.202.2
Capillarity water absorption coefficient (kg/(m2·s0.5))Without30.469.310%0.21
With30.425.8
Drying indexWithout30.1922.224%0.19
With30.249.1
Water vapour permeability coefficient (kg/(m·s·Pa))Without21.83 × 10−113.61%0.85
With31.85 × 10−117.4
Compressive strength (MPa)Without311.165.417%0.46
With39.5232.4
*t-test results for independent samples (p value > 0.05 indicates that there is no statistically significant difference between the means).
Table 7. Hydraulic lime mortar applied to the concrete slab substrate.
TestsFibreglass MeshNo. of SpecimensMeanCV (%)Means Differencep-Value *
Bulk density (kg/m3)With31876.600.61%0.08
Without31856.670.5
Open porosity (%)With322.030.73%0.08
Without321.431.8
Capillarity water absorption coefficient (kg/(m2·s0.5))With30.3811.02%0.78
Without30.378.9
Drying indexWith30.110.53%0.45
Without30.114.4
Compressive strength (MPa)With38.5020.218%0.34
Without37.0422.8
*t-test results for independent samples (p value > 0.05 indicates that there is no statistically significant difference between the means).
Table 8. Hydraulic lime mortar applied to the lightweight concrete block substrate.
TestsFibreglass MeshNo. of SpecimensMeanCV (%)Means Differencep-Value *
Bulk density (kg/m3)With51854.980.91%0.84
Without41857.401.0
Open porosity (%)With523.301.53%0.36
Without423.531.4
Capillarity water absorption coefficient (kg/(m2·s0.5))With30.444.46%0.17
Without30.475.0
Drying indexWith30.1312.93%0.97
Without30.1318.4
Water vapour permeability coefficient (kg/(m·s·Pa))With51.58 × 10−116.11%0.62
Without41.61 × 10−112.9
Compressive strength (MPa)With56.4614.72%0.87
Without36.3318.5
*t-test results for independent samples (p value > 0.05 indicates that there is no statistically significant difference between the means).
Table 9. Hydraulic lime mortar applied to the solid ceramic brick substrate.
TestsFibreglass MeshNo. of SpecimensMeanCV (%)Means Differencep-Value *
Bulk density (kg/m3)With31761.902.01%0.46
Without31782.971.5
Open porosity (%)With323.043.23%0.66
Without322.615.8
Capillarity water absorption coefficient (kg/(m2·s0.5))With30.2933.917%0.42
Without30.358.2
Drying indexWith30.157.545%0.03
Without30.1116.7
Compressive strength (MPa)With33.5532.72%0.90
Without33.6622.9
* t-test results for independent samples (p value > 0.05 indicates that there is no statistically significant difference between the means).
Table 10. Hydraulic lime mortar applied to the natural stone substrate.
TestsFibreglass MeshNo. of SpecimensMeanCV (%)Means Differencep-Value *
Bulk density (kg/m3)With31775.510.91%0.75
Without31778.960.5
Open porosity (%)With321.461.95%0.01
Without322.780.7
Capillarity water absorption coefficient (kg/(m2·s0.5))With40.272.610%0.23
Without30.3010.3
Drying indexWith40.1716.632%0.06
Without30.134.5
Compressive strength (MPa)With39.9020.260%0.04
Without34.0316.3
* t-test results for independent samples (p value > 0.05 indicates that there is no statistically significant difference between the means).
Table 11. Hydraulic lime mortars–capillary pores–cumulative mercury intrusion.
Sample0.0025 μm < ø < 0.01 μm0.01 μm < ø < 0.05 μm0.05 μm < ø < 10 μmø > 10 μm
(mL/g)(mL/g)(mL/g)(mL/g)
hollow ceramic brick—without mesh000000.00000.00190.1328
hollow ceramic brick—with mesh0.00860.09630.87230.1258
concrete slab—without mesh0.00000.09391.00720.1583
concrete slab—with mesh0.01590.04470.91320.1404
lightweight concrete block—without mesh0.00200.10441.16030.0811
lightweight concrete block—with mesh0.01590.04481.03710.0321
solid ceramic brick—without mesh0.00000.02660.34150.3830
solid ceramic brick—with mesh0.00440.06390.55540.4157
natural stone—without mesh0.00000.05540.47320.3256
natural stone—with mesh0.00540.06980.64910.4074
Table 12. Air lime mortar applied to the solid ceramic brick substrate.
TestsFibreglass MeshNo. of SpecimensMeanCV (%)Means Differencep-Value *
Bulk density (kg/m3)With31647.250.52%<0.01
Without31605.220.6
Open porosity (%)With323.556.11%0.95
Without323.600.7
Capillarity water absorption coefficient (kg/(m2·s0.5))With40.0111.937%0.09
Without30.0114.9
Drying indexWith30.205.528%<0.01
Without30.151.5
Water vapour permeability coefficient (kg/(m·s·Pa))With20.95 × 10−115.418%0.01
Without31.16 × 10−112.4
Compressive strength (MPa)With315.4778.342%0.48
Without310.9049.4
* t-test results for independent samples (p value > 0.05 indicates that there is no statistically significant difference between the means).
Table 13. Air lime mortar applied to the natural stone substrate.
TestsFibreglass MeshNo. of SpecimensMeanCV (%)Means Differencep-Value *
Bulk density (kg/m3)With41631.171.42%0.43
Without31618.790.9
Open porosity (%)With423.481.423%<0.01
Without319.051.1
Capillarity water absorption coefficient (kg/(m2·s0.5))With30.012.910%0.07
Without30.016.0
Drying indexWith30.199.941%<0.01
Without30.1410.4
Water vapour permeability coefficient (kg/(m·s·Pa))With31.28 × 10−114.96%0.13
Without21.36 × 10−113.7
Compressive strength (MPa)With321.8430.296%0.09
Without311.1231.7
* t-test results for independent samples (p value > 0.05 indicates that there is no statistically significant difference between the means).
Table 14. Air lime mortars–capillary pores–cumulative mercury intrusion.
Sample0.0025 μm < ø < 0.01 μm0.01 μm < ø < 0.05 μm0.05 μm < ø < 10 μmø > 10 μm
(mL/g)(mL/g)(mL/g)(mL/g)
solid ceramic brick—without mesh0.00000.17601.12820.0938
solid ceramic brick—with mesh0.08110.31431.36880.0549
natural stone—without mesh0.00000.18600.71730.5662
natural stone—with mesh0.05930.37961.26280.1515
Publisher’s Note: MDPI stays neutral with regard to jurisdictional claims in published maps and institutional affiliations.

