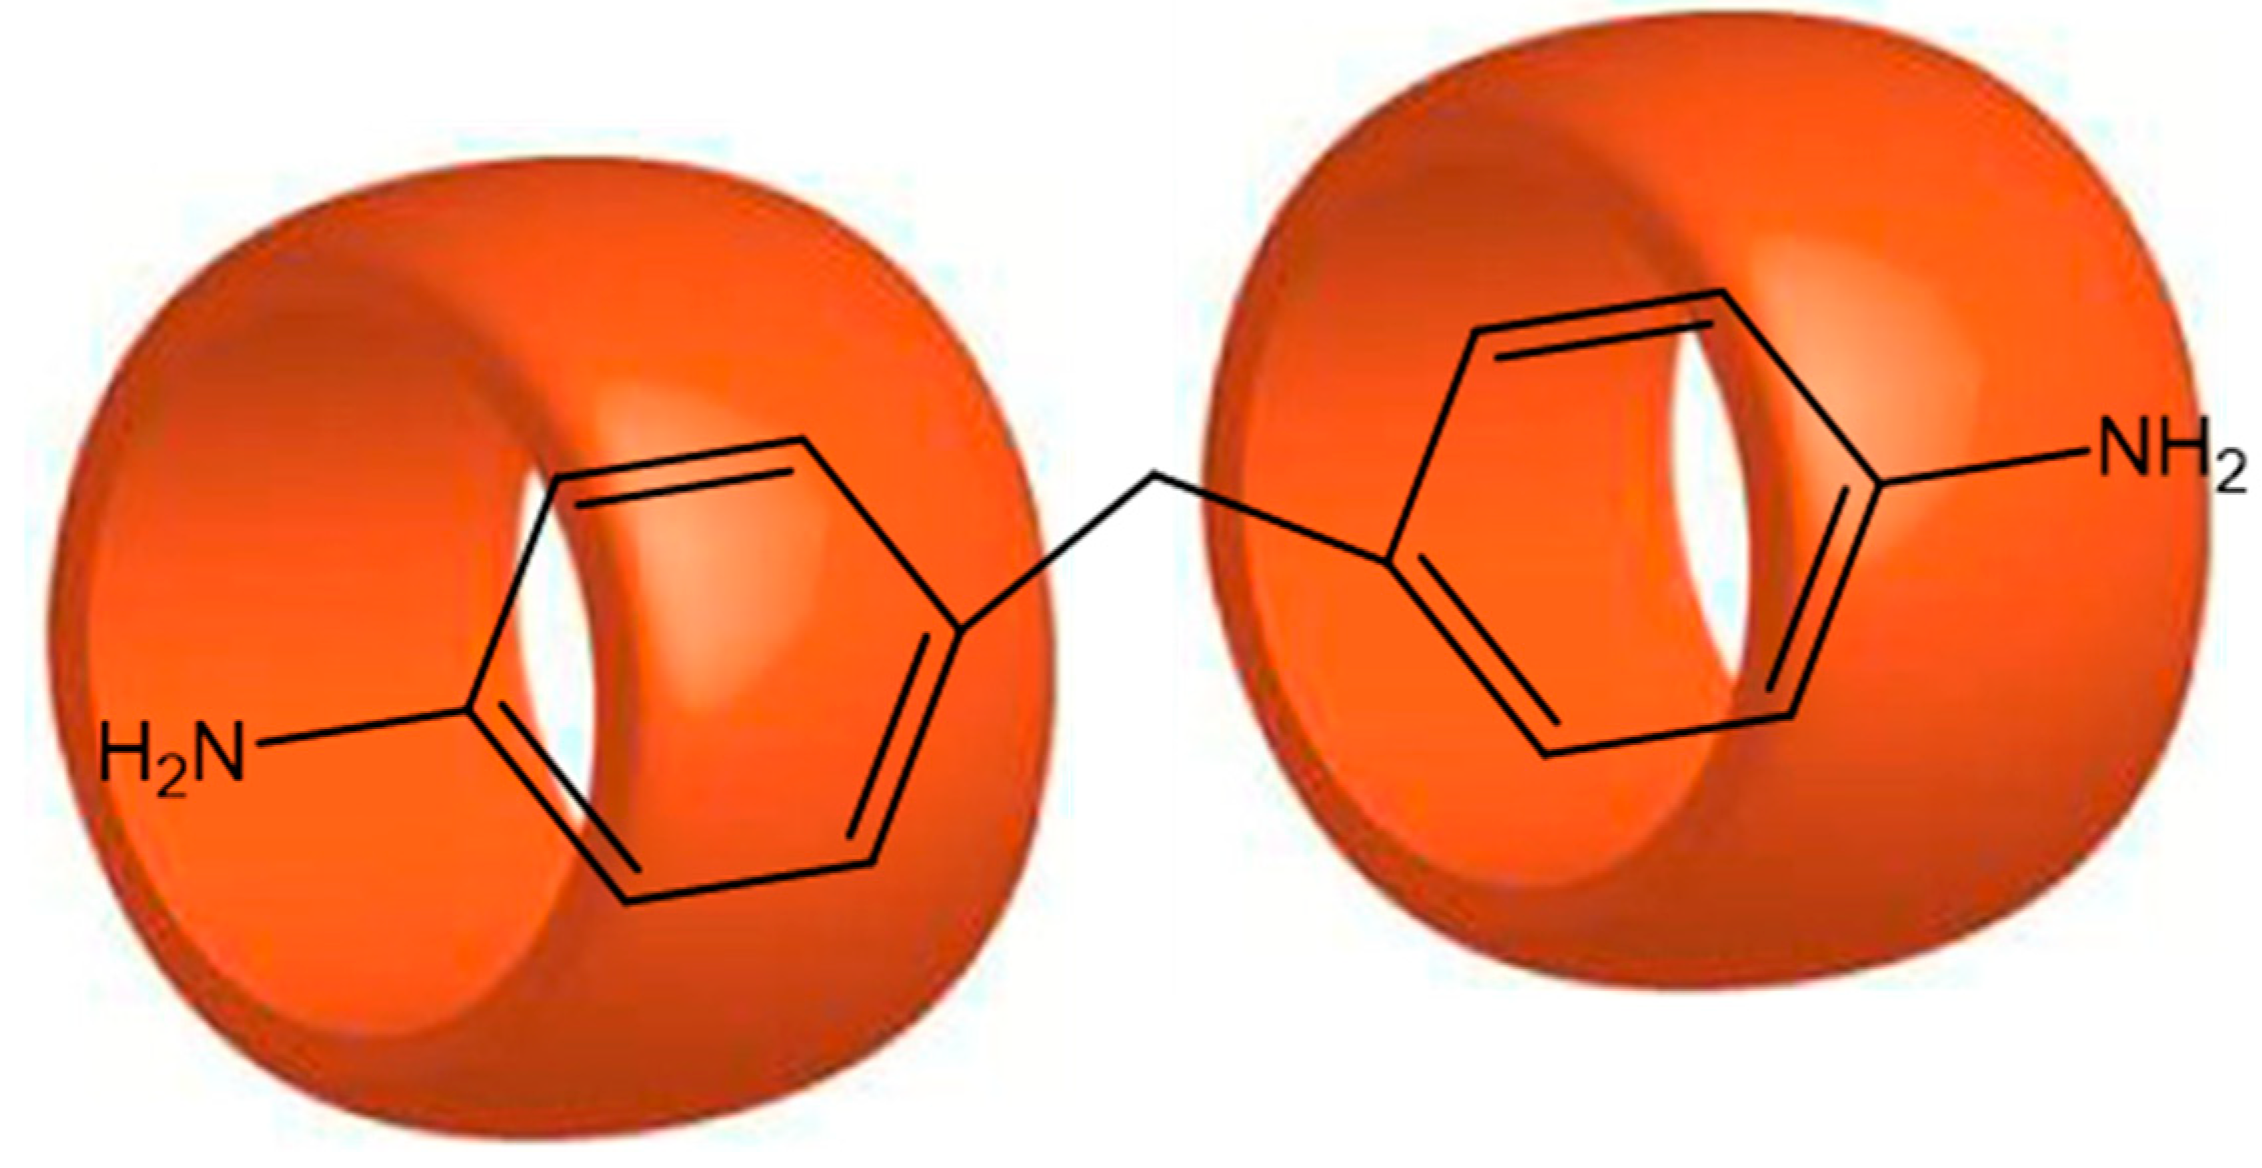
Article

Effect of Cucurbit[7]uril on Adsorption of Aniline Derivatives at Quartz

1
Department of Chemistry and Chemical Engineering, Guizhou University, Guiyang 550025, China
2
Department of Agriculture, Guizhou University, Guiyang 550025, China
*
Author to whom correspondence should be addressed.
Coatings 2022, 12(8), 1100; https://doi.org/10.3390/coatings12081100
Submission received: 29 June 2022 / Revised: 28 July 2022 / Accepted: 28 July 2022 / Published: 3 August 2022

Abstract

:
The adsorption behavior of small molecules at solid–liquid interfaces have become an important research topic in recent years. For example, small molecules of aniline pollutants will adsorb on solid surfaces with a massive discharge of industrial wastewater and are difficult to separate. Therefore, their adsorption and desorption on solid surfaces have become an important scientific problem. In this study, the interactions of cucurbit[7]uril (Q[7]) with 4,4′-diaminodiphenylmethane (MDA) and benzidine (AN) are studied using 1H NMR, UV-Vis spectrometry and fluorescence spectroscopy. The results show that Q[7] forms an inclusion complex with MDA and AN. According to the results of Quartz Crystal Microbalance with Dissipation (QCM-D), MDA adsorbs onto a quartz surface and forms a viscous adsorption layer on it. The AN adsorbs on the quartz surface and forms a rigid adsorption film on it. Q[7] can reduce the adsorption of MDA on the quartz surface and increases the adsorption of AN on it. Through the dynamic adsorption experiments, we find that Q[7] has a desorption effect on MDA molecules adsorbed on the quartz surface. An Atomic Force Microscope (AFM) is used to measure the morphological changes in the adsorption film before and after Q[7] makes contact with the quartz surface, and it proves that Q[7] has a desorption effect on MDA molecules adsorbed on the surface.

Graphical Abstract

1. Introduction

The adsorption of small molecules in a solid state is an important phenomenon in surface chemistry. Aniline derivatives may be used for the preparation of drugs, dyes, rubber, pesticides, pigments, and so on [1,2,3,4,5]. In addition, aniline derivatives are also widely used as identification agents for heavy metal ion pollutants [6,7]. Thus, they are released as industrial waste and cause serious environmental pollution [8,9,10]. Therefore, they can be absorbed by the human body through skin and tissue contact and accumulated in vivo, threatening human health, and have been included in a list of major toxicants [11,12]. At present, aniline derivatives in water could generally be removed or separated by catalytic degradation and adsorption of materials [13,14,15,16,17], but they are difficult to remove from soil and rock surfaces.
The cucurbit[n]urils (Q[n], n = 5, 6, 7, 8) are able to form complexes with different small molecules in aqueous solution [18,19,20]. Thus, research into the host–guest chemistry of cucurbit[n]urils in solution is of great importance. Recently, Zhang et al. reported the host–guest interactions between Q[n] and bis-pyridinium compounds in aqueous solution [21]. Kim et al. observed that Q[7] formed host–guest products with phenylenediamine [22]. Liu et al. studied the inclusion complex of Q[n] and toluidine at a low pH [23]. Suma et al. studied the host–object interaction between N-phenyl-2-Naphthylammonium ammonium (PH-AH-NP) and Q[7] and explored the influence of Na+ on the host-guest bonding mode of Ph-AH-Np@Q[7]. It was found that under the condition of low concentration of Na+, the action ratio of PH-AH-NP with Q[7] was 1:1 and there was only one action mode. Under the condition of high concentration of Na+, the action ratio of PH-AH-NP with Q[7] was 1:1 or 2:1, and there were three different action modes [24]. Ivanov et al. studied the host–guest interaction mode of 4-[(E)-2-(3,4-dimethoxyphenyl) ethenyl]-1-ethylpyridinium perchlorate (styryl dye) with Q[7]. The results showed that styryl dye formed a 1:1 inclusion complex with Q[7] [25] (association constant K = 1.0 × 10⁶ M−1 in the range of CB[7] concentration up to 16 µM). Nevertheless, further insights into the adsorption of small molecules at solid surfaces remain to be investigated in the presence of Q[n].
Our team recently studied the interaction of quaternary ammonium cationic surfactant HD with Q[7] and AM. We concluded that Q[7] had host–guest interaction with HD, which reduced the surface activity of HD. After the addition of AM, the HD molecules were extruded from the Q[7] cavity by strong binding with Q[7], and HD restored its original surface activity. We also measured the effect of Q[7] on the adsorption behavior of HD on the quartz surface by QCM-D, and characterized the change of the surface morphology of the adsorption film before and after the introduction of Q[7] by AFM, we concluded that Q[7] can regulate the adsorption and desorption of HD molecules on the quartz surface [26].
Quartz is a mineral widespread in nature and an important component of soil. Aniline derivatives can be adsorbed on the surface of quartz, causing environmental pollution. Therefore, it is of great significance to study the adsorption of aniline derivatives on quartz surfaces. In this paper, the host–guest interaction of Q[7] with 4,4′-diaminodiphenylmethane (MDA) and benzidine (AN) were studied. The influence of Q[7] on the adsorption behavior of MDA and AN on a quartz surface was also investigated. The adsorption and desorption process of the MDA on the quartz surface was reversible and regulated by Q[7] through dynamic adsorption experiments.

2. Experimental

2.1. Material

All the chemicals were provided by commercial suppliers without further purification. Q[7] was synthesized according to the literature (see Figure 1) [27]. 1H NMR spectra were performed with a Bruker 400 spectrometer. The UV-vis spectrometry was recorded with a UV-2450 spectrometer (Shimadzu, Kyoto, Japan). The adsorption of molecules onto quartz could be studied using Quartz Crystal Microbalance with Dissipation (Q-Sense E1, Biolin Scientific, Espoo, Finland). The characterization of the morphology of the adsorption layer on the quartz surface was achieved using Atomic Force Microscopy (MFP-3D, Oxford Instruments, Concord, MA, USA).
The structures of MDA, AN, and Q[7] are as follows:
Figure 1. The structures of MDA, AN, and Q[7].
Coatings 12 01100 g001

2.2. The Study of NMR Titration

In this NMR titration experiment, the subject (Q[7]) was used to titrate the object (MDA, AN). Firstly, 500 µL of the guest (1 × 10⁻² mol/L) was added into the NMR tube, followed by 100 µL of the same concentration of Q[7] solution. After the solution was evenly mixed, it was put into the NMR instrument. We repeated the above steps until there was no change in proton peak displacement in NMR.

2.3. The Study of UV-Vis Spectrometry

In this study, we mainly used the molar ratio method to test the host–guest interaction mode of Q[7] with MDA and AN. Host–guest mixed solutions (NQ[7]/NMDA = 0.1–2.6) with volumes of 5 mL were configured. After standing for 12 h, the absorbance of the mixed solution was measured, and the average value was taken after three parallel measurements.

2.4. The Study of Quartz Crystal Microbalance with Dissipation

We use sensor crystals coated with silica to simulate the surface of quartz ore. The mass of the adsorbed molecules is determined by measuring the frequency shift of silica-coated chip [28,29].
The frequency shift (ΔF) and energy dissipation (ΔD) can be measured simultaneously, and the decay of the quartz oscillation can be monitored in a real-time. Energy dissipation is the energy loss of a system. ΔD shows the viscoelastic properties of the adsorption layer of a solid surface. The Sauerbrey equation is used to determine the adsorbed in the silica-coated chips [30,31,32].
m = C F n
where Δm is the adsorbed mass, C is the sensitivity constant, n is the overtone number (n = 1, 3, 5, 7,…), and ΔF is the frequency shift.
Before we started the experiments of QCM-D, the sensor was cleaned completely, and dried by blowing it with N2. The flow rate of the aqueous solution was 100 µL/min. The data of the third overtone were used to analyze the adsorption of molecules onto the quartz.
The adsorption of the benzidine or the mixture of the benzidine and Q[7] on the quartz was monitored by QCM-D. First, water was pumped into the sample tank to eliminate the influence of water molecules in the solution to be tested, and then the aqueous solution of the benzidine was pumped into the chamber of QCM-D. The ΔF and ΔD values changed with the change in adsorption time until equilibrium.
The desorption of MDA at the quartz surface could be monitored in real-time by QCM-D. First, a similar method was used to study the adsorption of MDA on the quartz, and second, the injection of the solution of MDA was stopped when ΔF and ΔD remained unchanged, and then the aqueous solution of Q[7] was pumped into the sample chamber. The values of ΔF and ΔD varied over time until they reached equilibrium.

2.5. The Characterization of Atomic Force Microscopy

Atomic Force Microscopy (AFM) provides a new characterization method for us to study the morphology of small molecules adsorbed at the solid–liquid interface. The combination of AFM with QCM-D, TEM, etc. has greatly enriched the application range of AFM. So far, AFM has been widely used to measure organic compounds deposited on mica, graphite, quartz, and gold surfaces [33,34,35,36,37].
The silica-coated chips with adsorption equilibrium in QCM-D was blow-dried with nitrogen and observed under an atomic force microscope. The surface topography of the adsorption layer was measured via tapping mode.

3. Results and Discussion

3.1. The Host-Guest Interaction between Q[7] and Benzidine

In order to study the host–guest interaction mode between AN and Q[7], we carried out nuclear magnetic titration and UV-vis spectrometry. As shown in Figure 2, the proton resonance peak of Hm and Hn experienced an upfield shift when the Q[7] was continually added. When the mole ratio Q[7]:AN = 1:1, the nuclear proton peak did not shift, so it was speculated that the interaction ratio between Q[7] and AN may be 1:1. This was because the benzene ring of AN was shielded by the cage of Q[7]. This indicated that the benzene ring is in the cavity of Q[7].
In order to further determine the interaction mode between Q[7] and AN, Uv-vis spectrometry and fluorescence spectroscopy were carried out. As shown in Figure 3A, the maximum absorption wavelength of benzidine was 278 nm while Q[7] had no absorption peak in this wavelength. The absorption intensity continued to decrease when N(Q[7])/N(AN) was increased. The absorption intensity showed a break in the plot when NQ[7])/N(AN) was equal to 1 (Figure 3B). Therefore, the benzidine and Q[7] formed a host–guest complex in a ratio of 1:1.
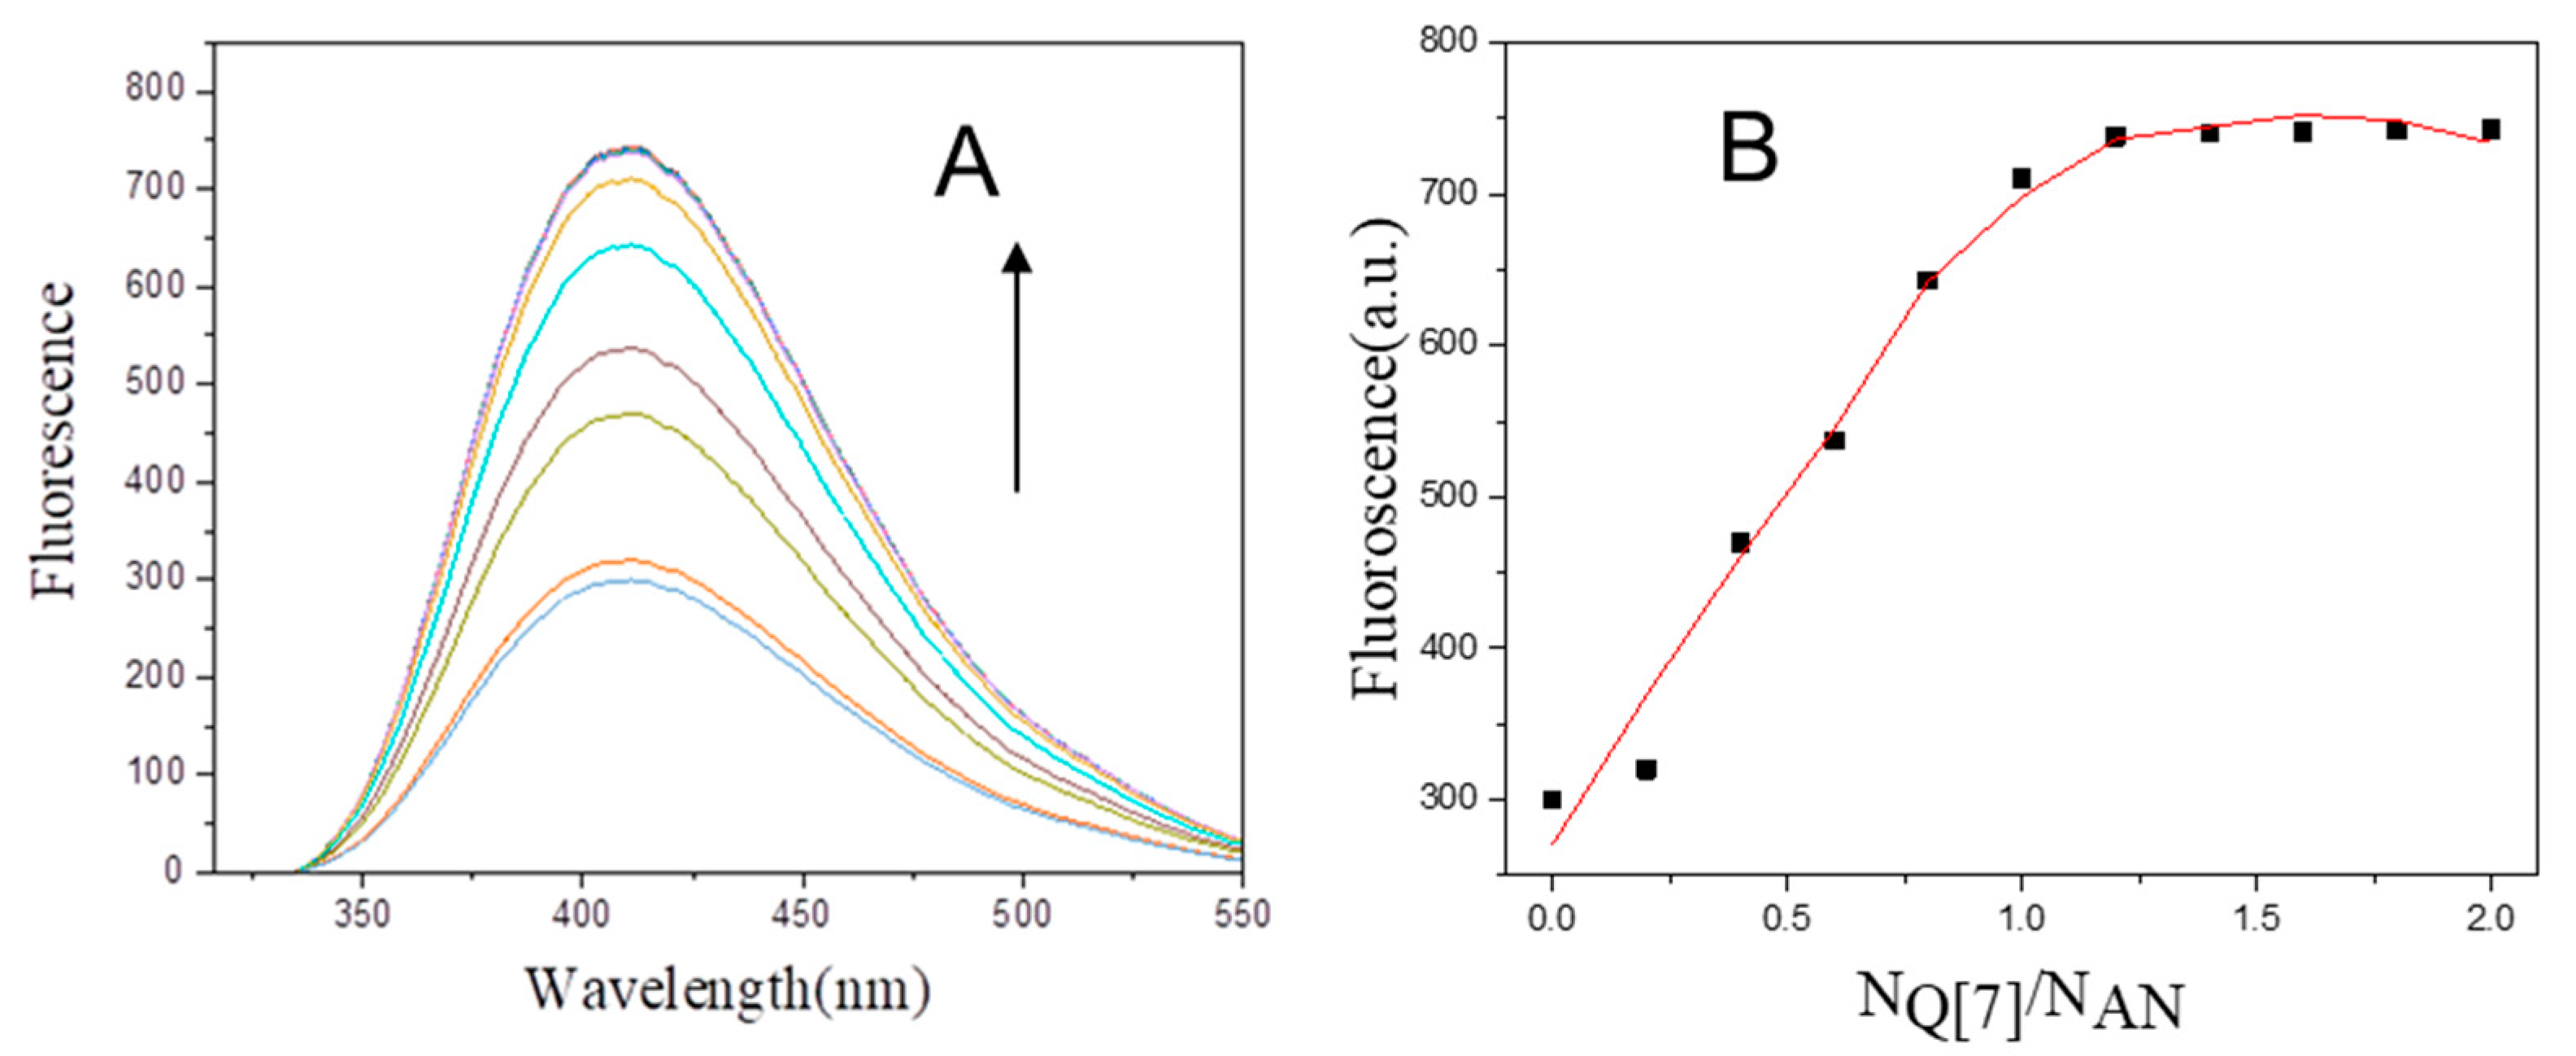
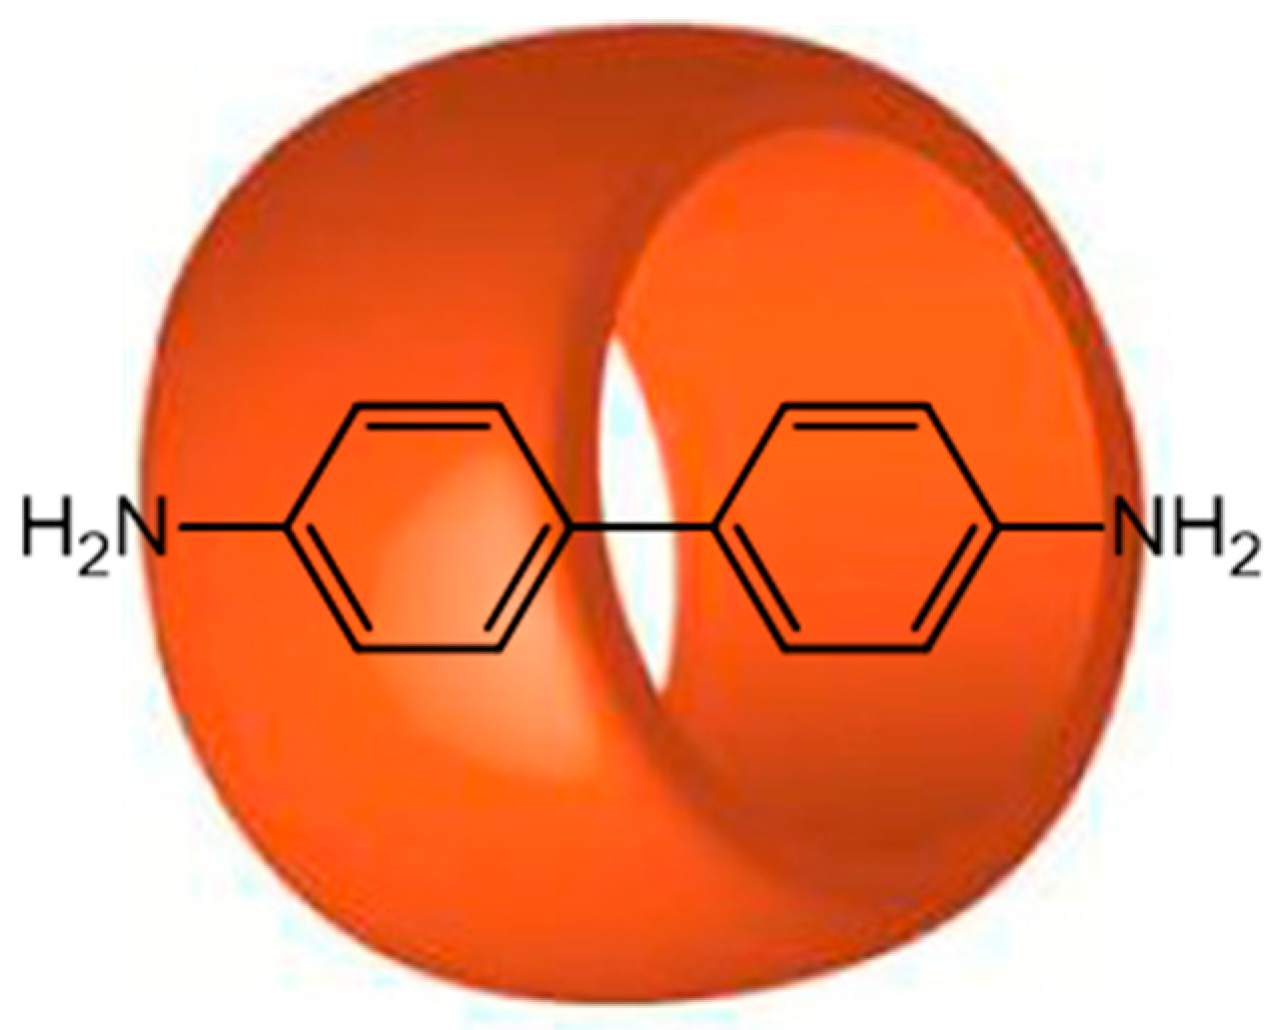
As shown in Figure 4A, when the maximum fluorescence emission wavelength of AN is 411 nm, Q[7] does not produce fluorescence. With the constant addition of Q[7] to the solution, the fluorescence intensity increased continuously. As shown in Figure 4B, when NQ[7]/NAN = 1:1, the curve has an inflection point, which is mutually verified with the NMR titration data. We consider Q[7] and AN to form a 1:1 host–guest complex. Following on from the above analysis, the possible action mode of AN and Q[7] is shown in Figure 5.

3.2. The Host–Guest Interaction between Q[7] and 4,4′-Diaminodiphenylmethane

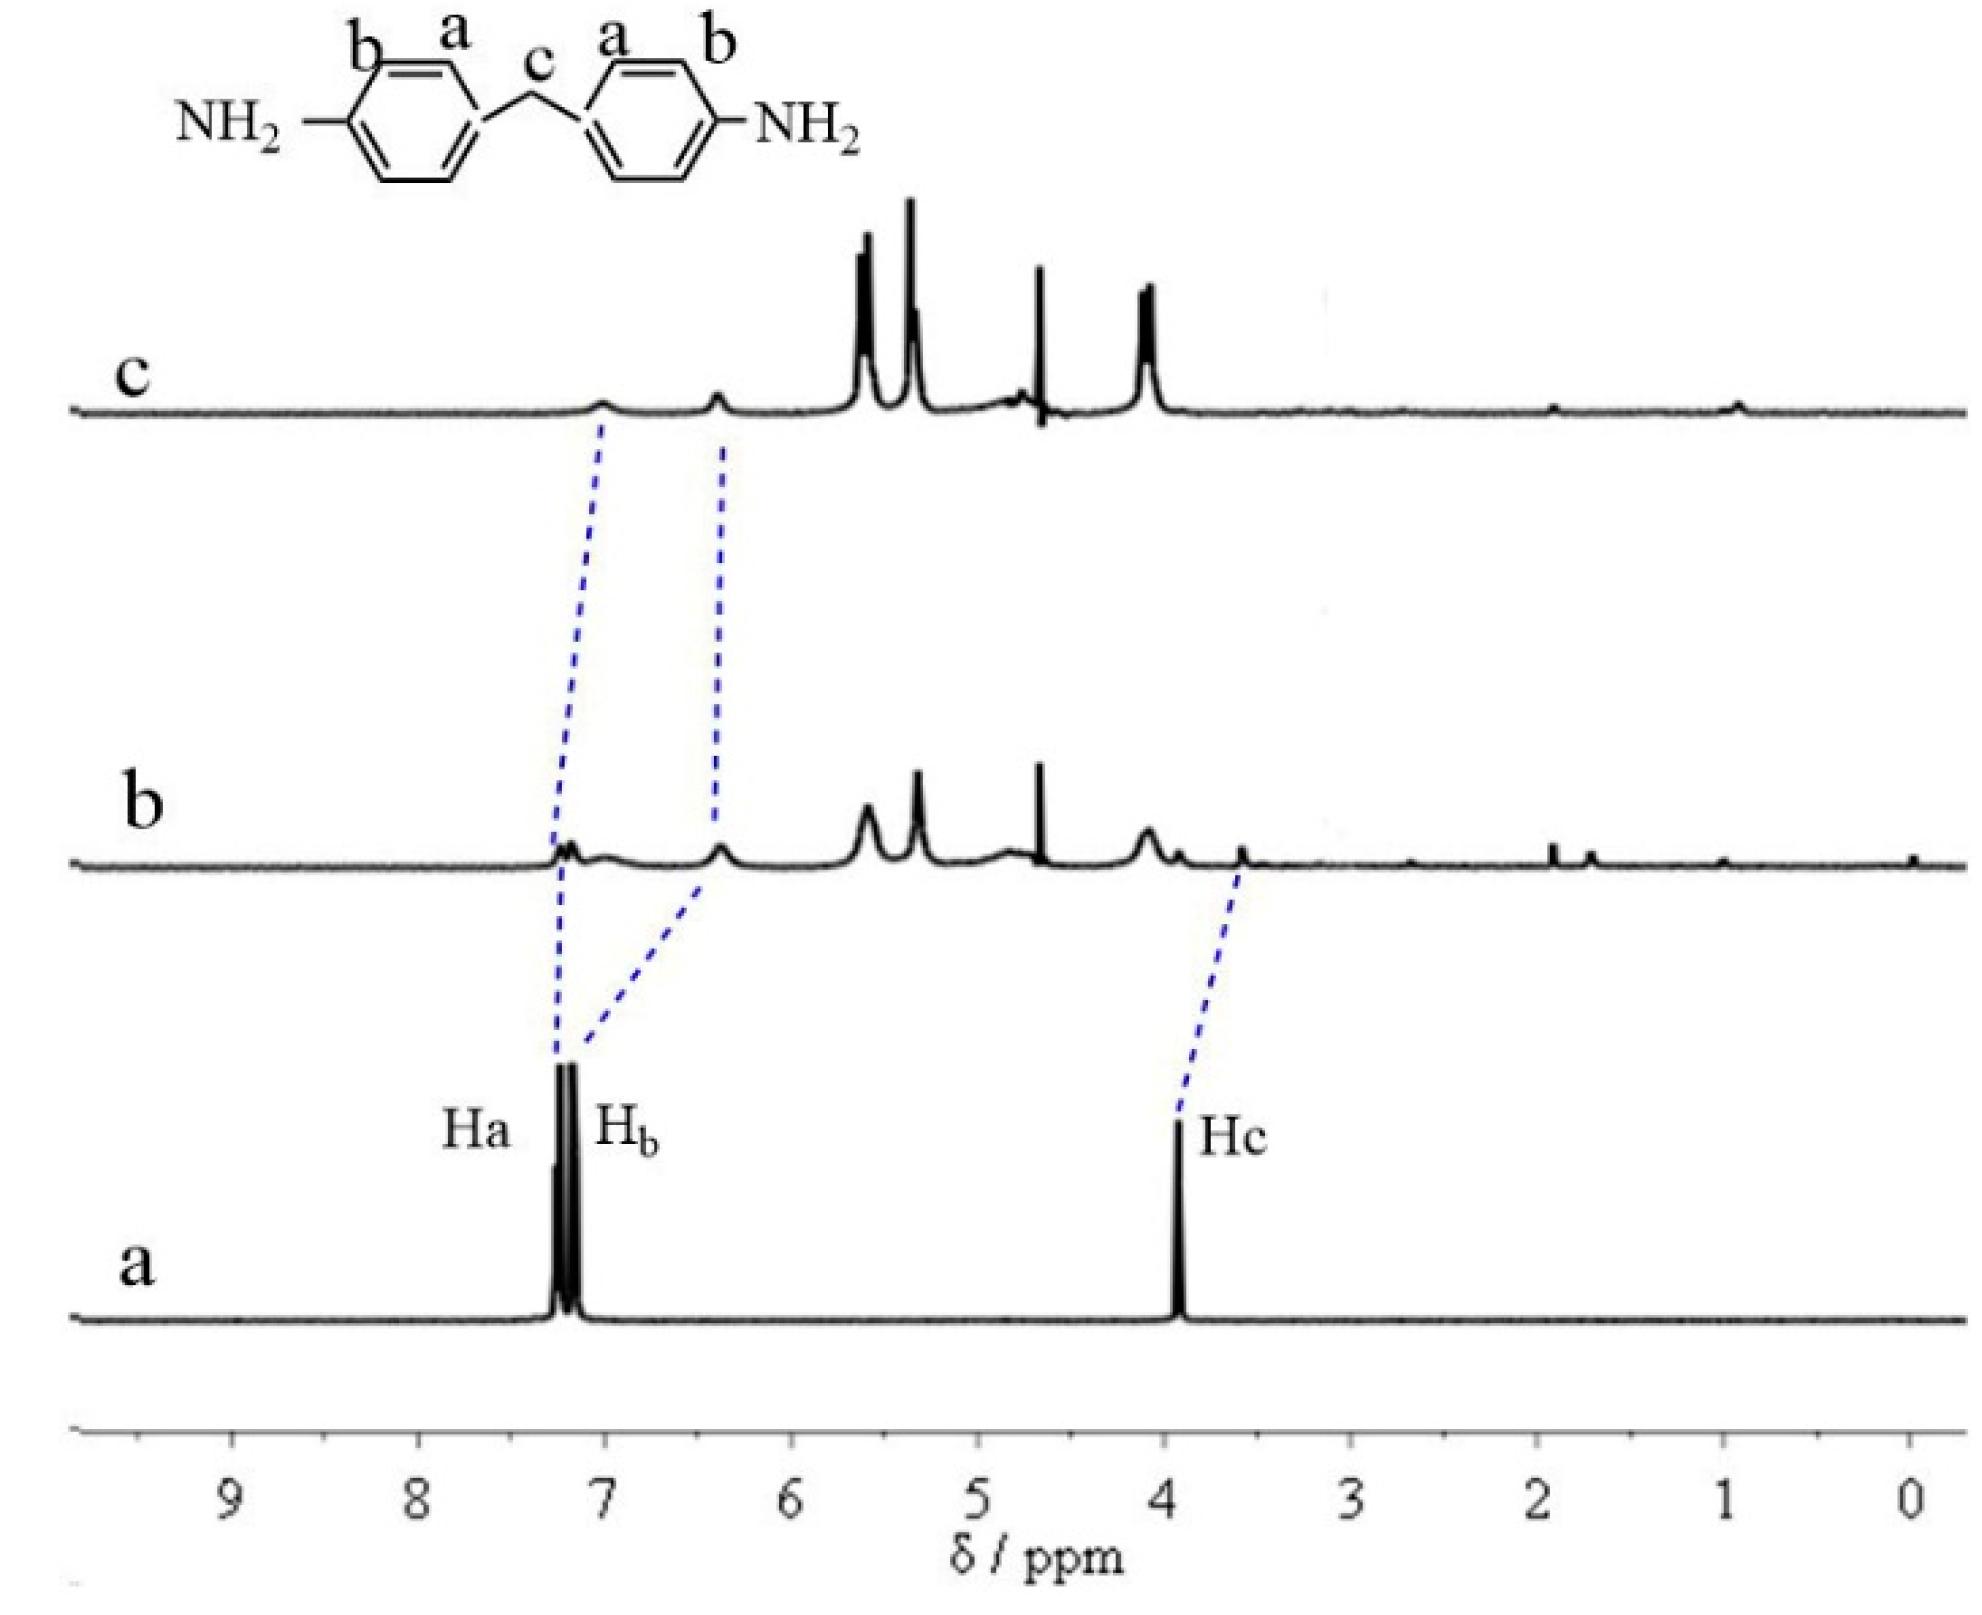
In order to study the host–guest interaction mode between MDA and Q[7], we utilized nuclear magnetic titration and UV-vis spectrometry. As shown in Figure 6, with the increasing Q[7] content, the proton peaks (Ha and Hb) gradually shifted to a high field, and the chemical shift of Hb was greater than that of Ha. These proton peaks moved to high field, indicating that the benzene ring of MDA was affected by the shielding effect of the Q[7] cavity, Hb was more shielded than Ha, and the benzene ring was in the cavity of Q[7]. Q[7] had a host–guest interaction with MDA.
We further studied the host–guest interaction between Q[7] and MDA via UV/vis absorption spectroscopy. As shown in Figure 7, the maximum absorption wavelength of MDA was 242 nm while Q[7] had no absorption peak and did not interfere with the UV-vis spectrometry of MDA. It could be also seen that the absorption value decreased with the increase in Q[7]. When N(Q[7])/N(MDA) = 2, the absorption value experienced an inflection point. Through the above analysis, it could be determined that the ratio of Q[7] to MDA was 2:1.
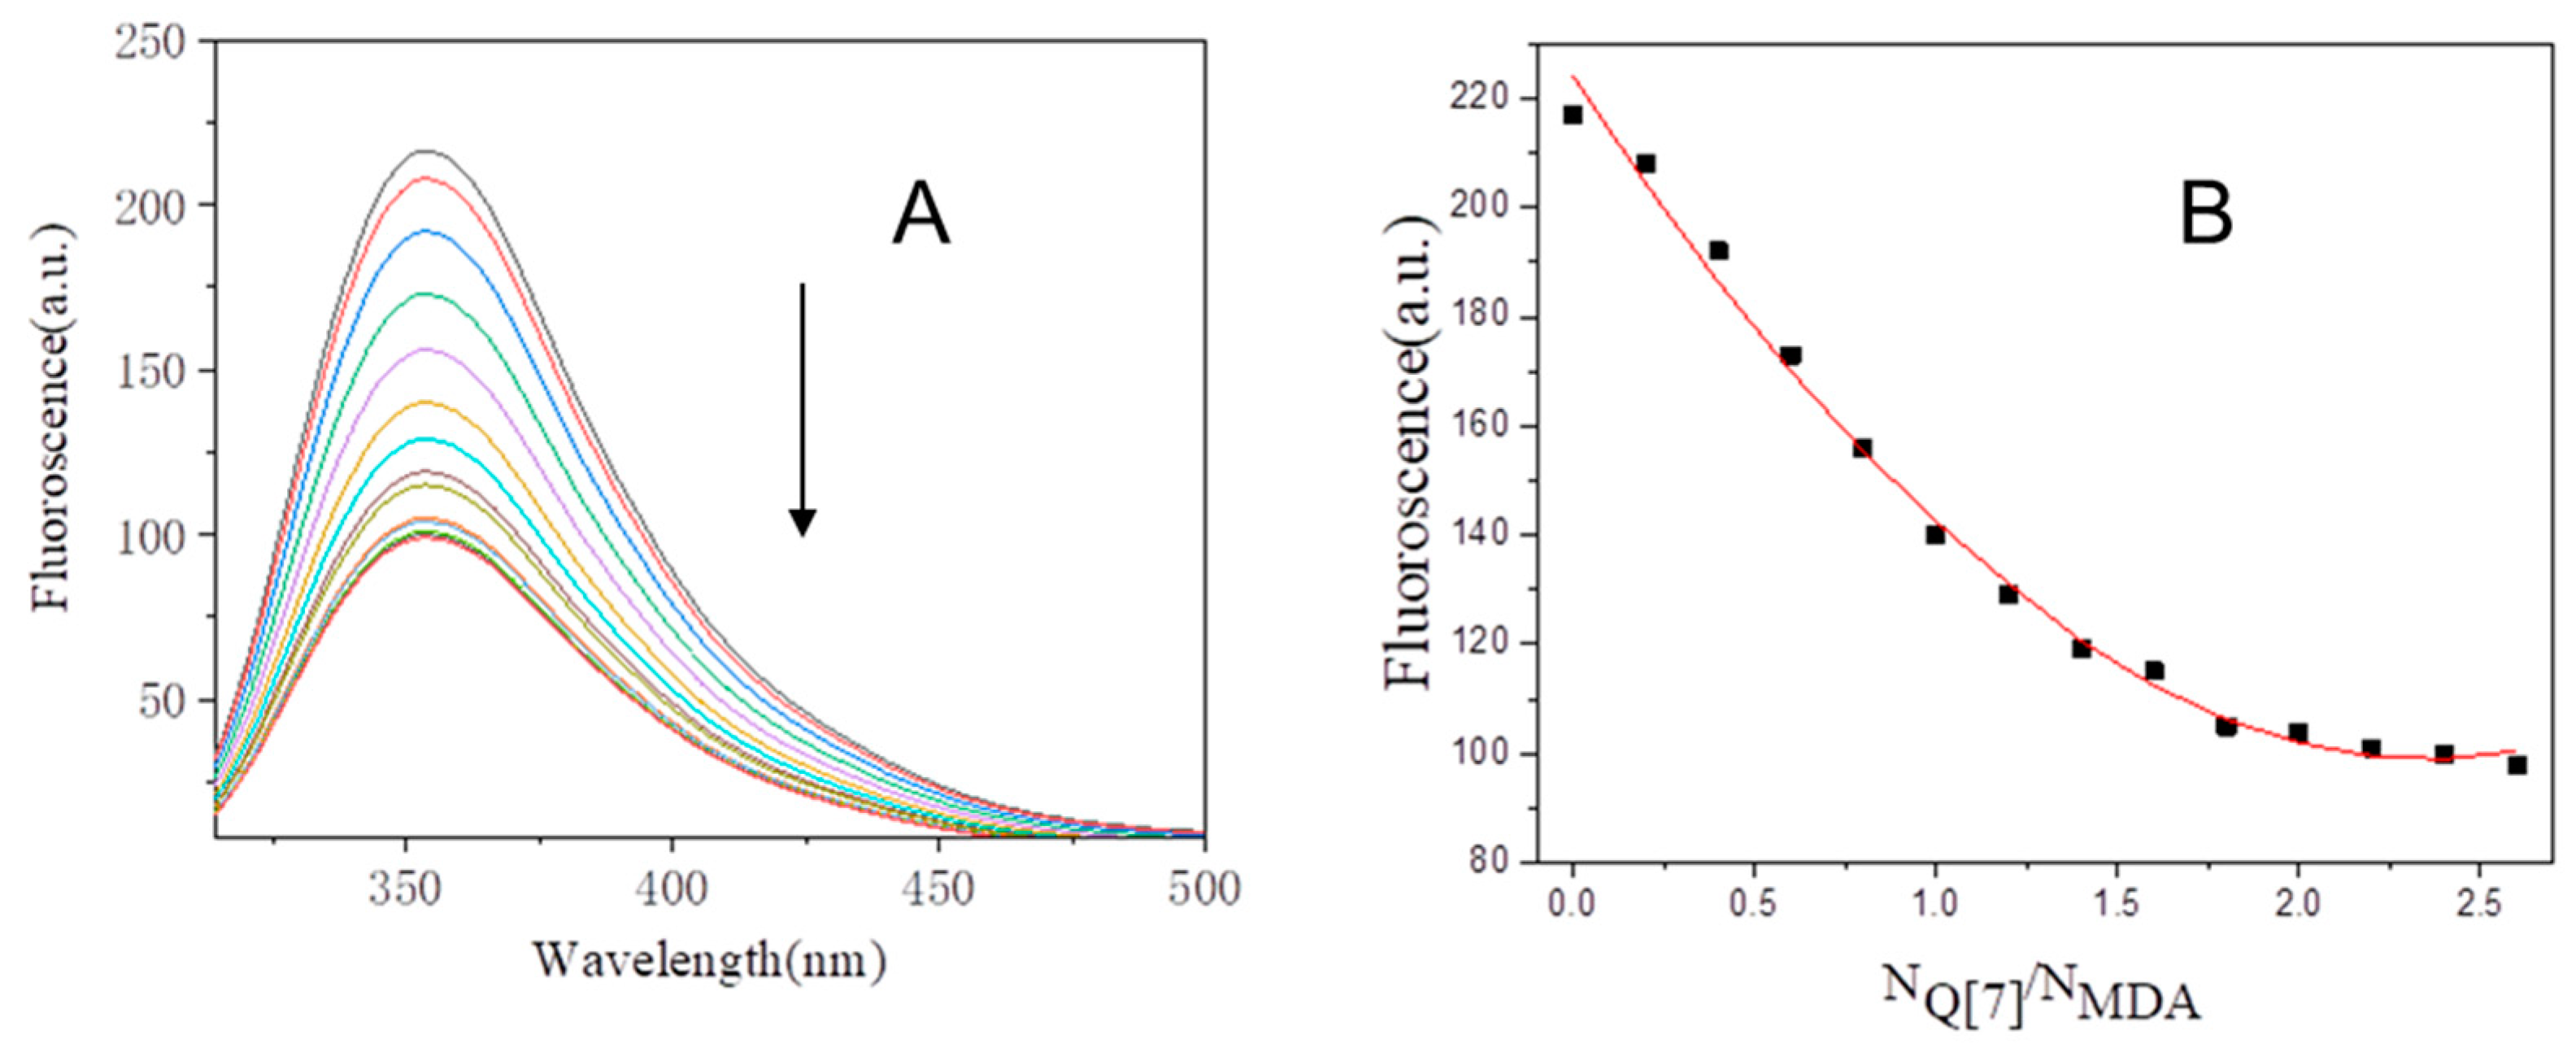
As shown in Figure 8A, the maximum fluorescence emission wavelength of MDA is 354 nm, and the fluorescence intensity decreases with the continuous addition of Q[7] into the solution. It can be seen from Figure 8B that when NQ[7]/NMDA = 2:1, the curve presents a turning point, and we conclude that Q[7] forms a 2:1 host–guest complex with MDA. Based on the above analysis, we created the host–object interaction model diagram between Q[7] and MDA (Figure 9).

3.3. The Adsorption of Benzidine at Quartz

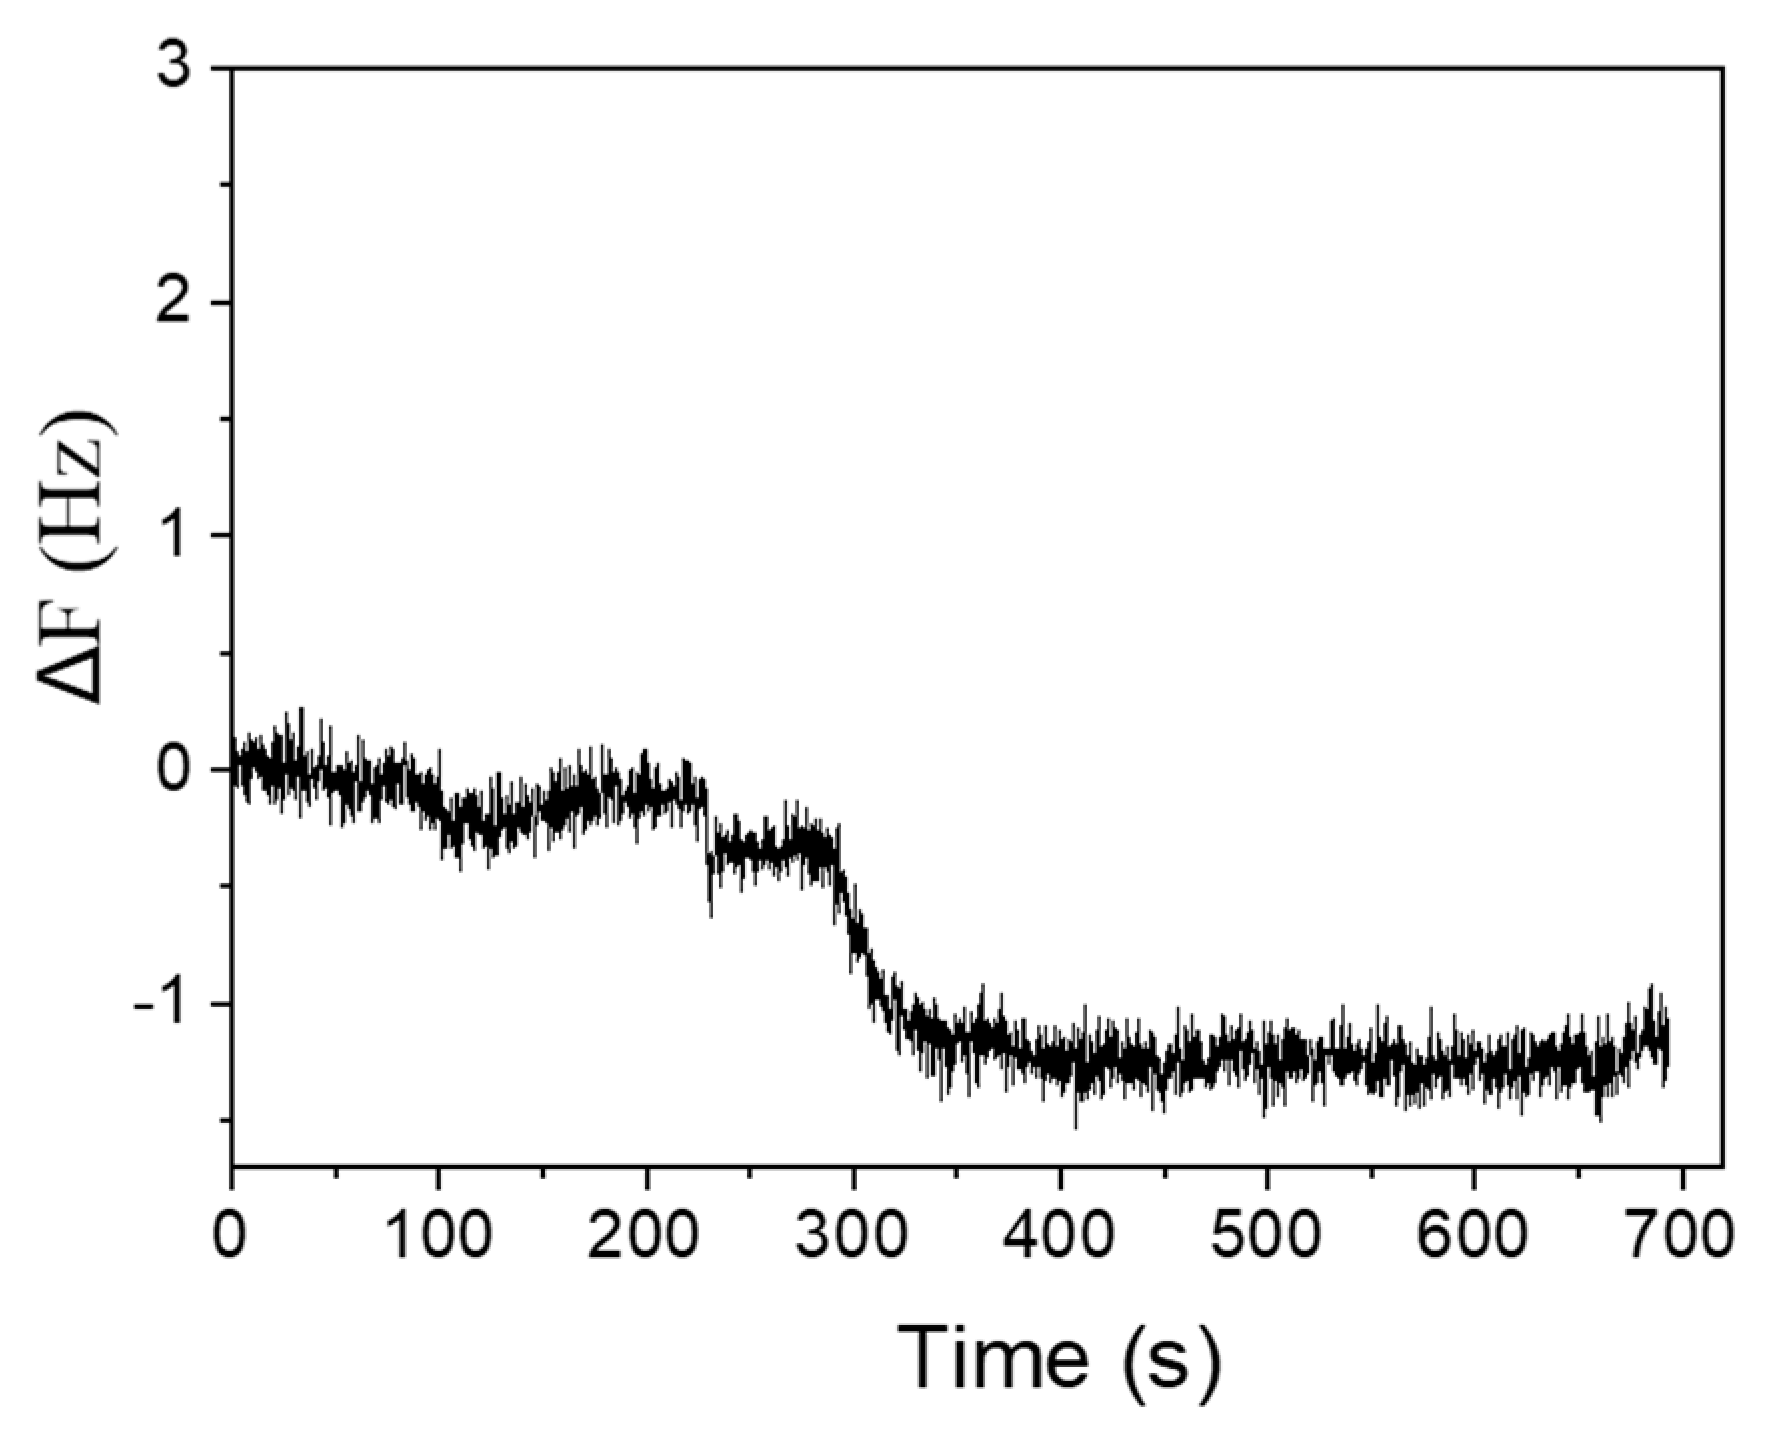
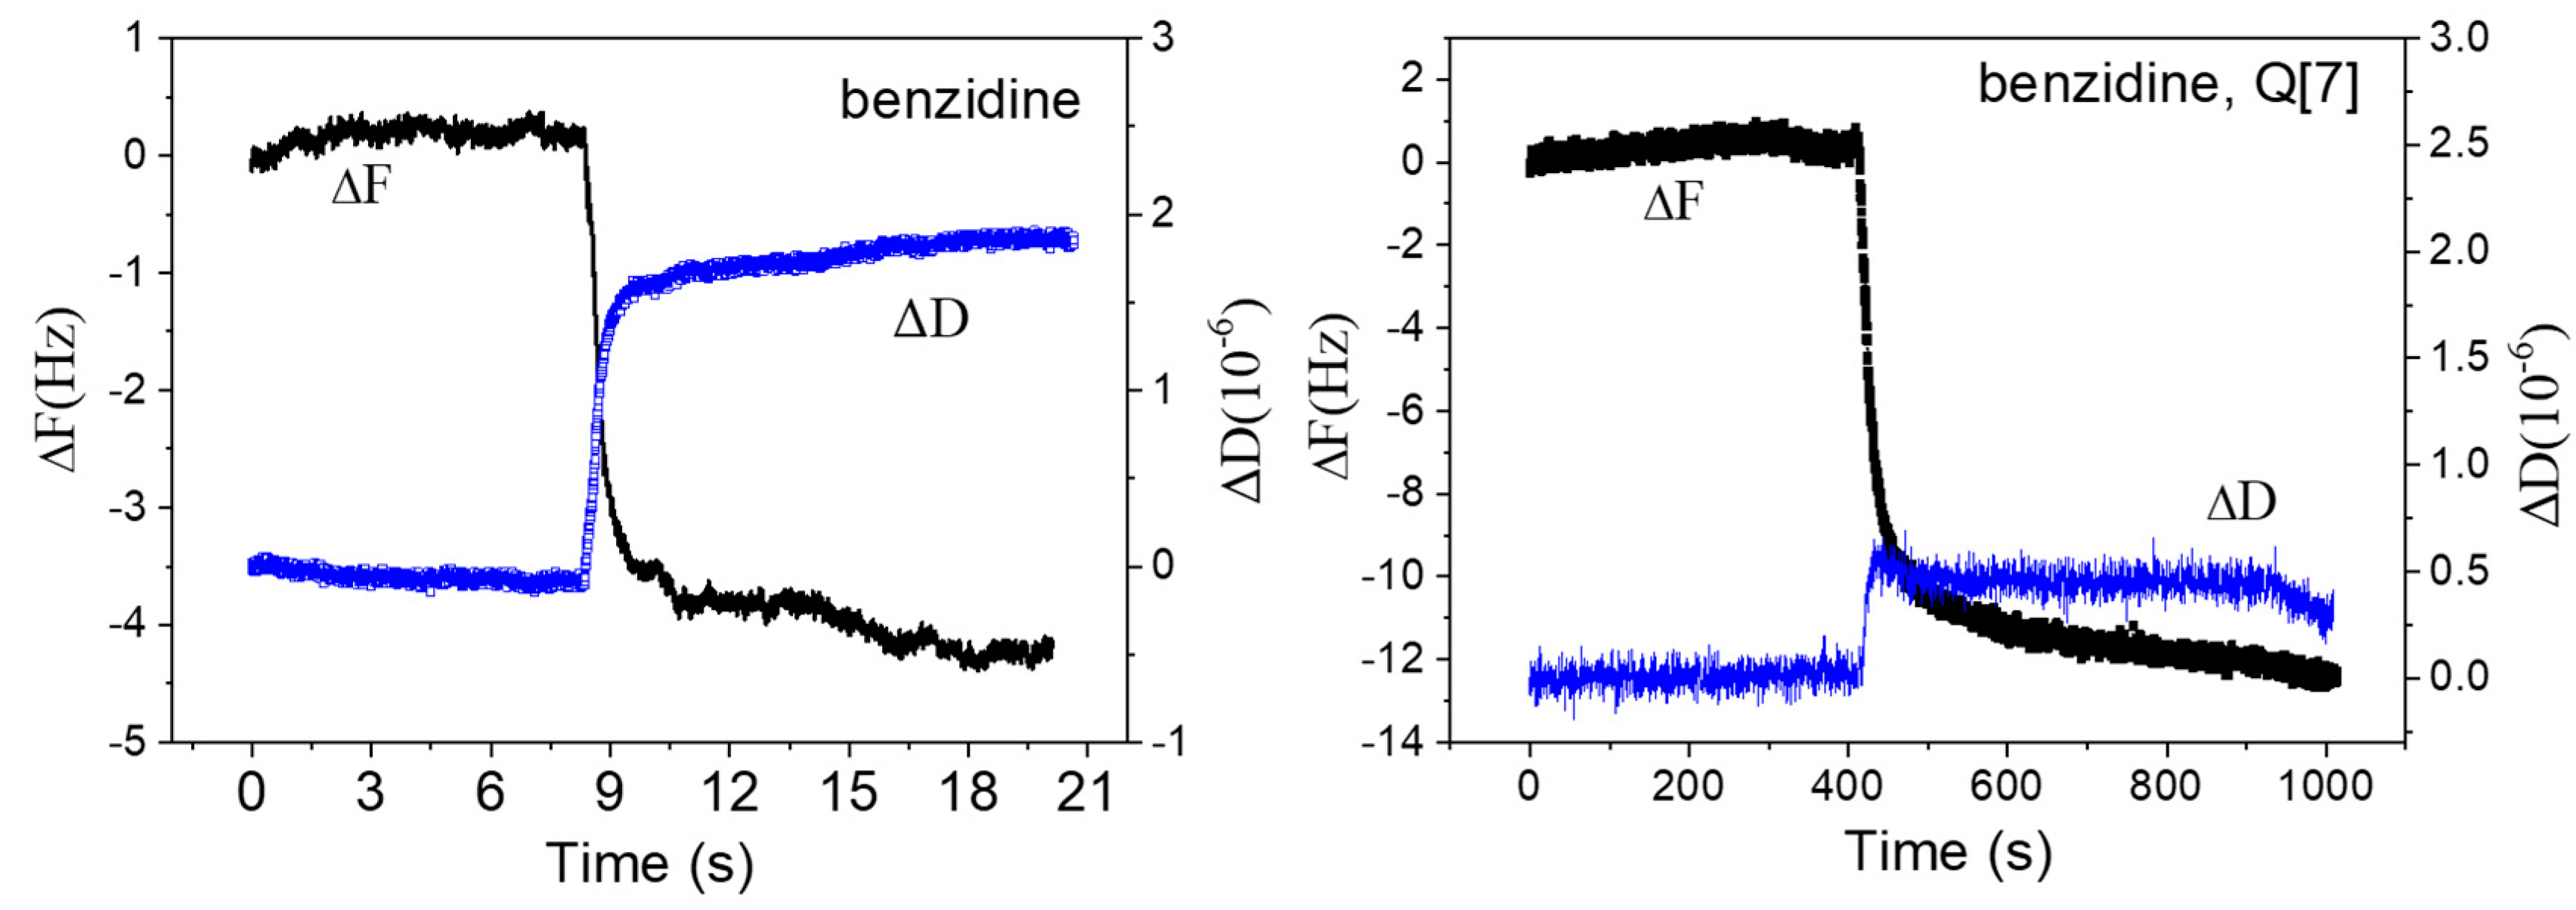
Firstly, by measuring whether Q[7] could adsorb on quartz (Figure 10), we found that the value of ΔF was very low (about −1.2 Hz), indicating that Q[7] had almost no adsorption on quartz in the experiment. In order to further study the effect of Q[7] on the adsorption behavior of AN on the quartz surface, we designed the QCM-D experiment, as shown in Figure 11, The ΔF value of the AN in the absence of Q[7] was −4.3 Hz; the corresponding ΔD value was 1.9 × 10⁻⁵ ppm, but in the presence of Q[7], the ΔF value decreased to −12.3 Hz, the corresponding ΔD value was 5.0 × 10⁻⁷ ppm. Apparently, the adsorption of AN on quartz was increased by Q[7]. As discussed above, Q[7] could not adsorb onto the quartz surface by itself, but the adsorbed AN appeared to form the host–guest complex with Q[7]. The AN was adsorbed at the quartz surface with Q[7], causing the adsorbed mass to increase. The ΔD value was very low (below 5 × 10⁻⁶ ppm), meaning that the adsorption layer was rigid.

3.4. The Adsorption of MDA on Quartz

Figure 12 showed that after adding Q[7] in MDA solution, the ΔF of MDA increased (−40~−3.5 Hz) and ΔD decreased (16.3 × 10⁻⁶–1.2 × 10⁻⁶ ppm). In contrast to AN, the host–guest complexation between MDA and Q7 would reduce the adsorption amount of MDA on the quartz surface and enhance the rigidity of its adsorption film. This may be due to the host–guest interaction between one molecule of MDA and two molecules of Q[7]. The amino linked to the benzene ring was wrapped in the Q[7] cavity. The ammonium ions at both ends of MDA cannot be adsorbed on the surface of quartz with Q[7], and only a small number of free MDA molecules were adsorbed on the surface of the quartz.
In order to further study the influence of Q[7] on the adsorption and desorption behavior of MDA on the quartz surface, we designed a dynamic adsorption experiment of QCM-D. As shown in Figure 13, when the MDA solution made contact with the quartz, ΔF decreased and ΔD increased rapidly, indicating that MDA was adsorbed on the surface of the quartz, the adsorption of MDA on the surface of quartz increased, and the viscoelasticity of the adsorption film increased. After MDA adsorption reached an equilibrium, Q[7] continued to be pumped without stopping the experiment. After adding Q[7] solution, it began to make contact with the quartz, and ΔF increased while ΔD decreased, indicating that some MDA molecules desorbed from the quartz surface into the solution, the adsorption of MDA decreased, and the viscoelasticity of the adsorption film decreased.
As shown in Figure 14, the silica-coated chips were put into AFM for imaging when the solution of MDA and Q[7] reached an adsorption equilibrium. It could be seen that after the solution of Q[7] was introduced, the height of the adsorption film and the thickness of the adsorption layer of MDA were significantly reduced, indicating that the introduction of Q[7] solution made a considerable number of MDA molecules be desorbed from the quartz chip. The imaging of the AFM and the data obtained by QCM-D confirmed each other, which indirectly proved that Q[7] could regulate the adsorption and desorption of MDA on the quartz chip.

4. Conclusions

In this paper, we used Q[7] to desorb the MDA molecule adsorbed on the quartz surface, and determined the host–guest interaction mode between Q[7] and MDA and AN by UV-Vis, fluorescence spectroscopy, and nuclear magnetic titration. The results showed that Q[7] could interact with MDA and AN to form the host–guest complex. The experimental results of QCM-D showed that MDA could adsorb on the surface of quartz and form the viscoelastic film. The AN could adsorb on quartz to form a rigid membrane. The host–guest interaction between Q[7] and aniline derivatives enhanced the adsorption of AN on quartz surface while reducing the adsorption of the MDA on the quartz surface. MDA adsorbed on the surface of quartz could interact with Q[7], and it could desorb on the surface of the quartz. The adsorption of MDA decreased, and the viscoelasticity of the adsorption film decreased. Thus, Q[7] reversibly regulated the adsorption and desorption process of MDA on quartz surface. These experimental results also provided a possible research direction for people to study the removal of aniline derivatives adsorbed on solid surface in natural environment.

Author Contributions

K.W. participated in the design of experimental ideas and completed the first draft of the paper. X.J. revised and improved the first draft of the paper. C.H. and Z.T. reviewed and supervised the work. All authors have read and agreed to the published version of the manuscript.

Funding

This work was supported by Open Fund Project of State Key Laboratory of Efficient Utilization of Medium and Low-Grade Phosphate Ore and Its Associated Resources (WFKF2018-05).

Institutional Review Board Statement

Not applicable.

Informed Consent Statement

Not applicable.

Data Availability Statement

All the data can be seen in the article, and the author can also provide the corresponding raw data.

Conflicts of Interest

The authors declare no conflict of interest.

References

  1. Sáenz-Pérez, M.; Lizundia, E.; Laza, J.M.; García-Barrasa, J.; Vilas, J.L.; León, L.M. Methylene Diphenyl Diisocyanate (Mdi) and Toluene Diisocyanate (Tdi) Based Polyurethanes: Thermal, Shape-Memory and Mechanical Behavior. RSC Adv. 2016, 6, 69094–69102. [Google Scholar] [CrossRef]
  2. Maleki, R.; Koukabi, N.; Kolvari, E. Fe3O4-Methylene Diphenyl Diisocyanate-Guanidine (Fe3O4–4,4′-Mdi-Gn): A Novel Superparamagnetic Powerful Basic and Recyclable Nanocatalyst as an Efficient Heterogeneous Catalyst for the Knoevenagel Condensation and Tandem Knoevenagel-Michael-Cyclocondensation Reactions. Appl. Organomet. Chem. 2018, 32, 3905–3915. [Google Scholar] [CrossRef]
  3. Travis, A.S. Poisoned Groundwater and Contaminated Soil: The Tribulations and Trial of the First Major Manufacturer of Aniline Dyes in Basel. Environ. Hist. 1997, 2, 343–365. [Google Scholar] [CrossRef]
  4. Grenner, A.; Klauck, M.; Meinhardt, R.; Schumann, R.; Schmelzer, J. Ternary Liquid−Liquid(−Liquid) Equilibria of Aniline + Cyclohexylamine + Water, Aniline + Cyclohexylamine + Octane, Aniline + Water + Toluene, and Aniline + Water + Octane. J. Chem. Eng. Data 2006, 51, 1009–1014. [Google Scholar] [CrossRef]
  5. Ganesh, V.; Noble, A.; Aggarwal, V.K. Chiral Aniline Synthesis Via Stereospecific C(Sp3)–C(Sp2) Coupling of Boronic Esters with Aryl Hydrazines. Org. Lett. 2018, 20, 6144–6147. [Google Scholar] [CrossRef]
  6. Schwarze, T.; Schneider, R.; Riemer, J.; Holdt, P.D.H.-J. A Highly K+-Selective Fluorescent Probe—Tuning the K+-Complex Stability and the K+/Na+ Selectivity by Varying the Lariat-Alkoxy Unit of a Phenylaza[18]Crown-6 Ionophore. Chem.—Asian J. 2016, 11, 241–247. [Google Scholar] [CrossRef]
  7. Singh, G.; Singh, J.; Mangat, S.S.; Arora, A. Three-Step Pathway Towards Bis(1,2,3-Triazolyl-Γ-Propylsilatranes) as Cu2+ Fluorescent Sensor, Via ‘Click Silylation’. Tetrahedron Lett. 2014, 55, 2551–2558. [Google Scholar] [CrossRef]
  8. Skipper, P.; Kim, M.; Sun, P.; Wogan, G.; Tannenbaum, S. Monocyclic Aromatic Amines as Potential Human Carcinogens: Old Is New Again. Carcinogenesis 2009, 31, 50–58. [Google Scholar] [CrossRef] [Green Version]
  9. Cocaign, A.; Bui, L.-C.; Silar, P.; Chan Ho Tong, L.; Busi, F.; Lamouri, A.; Mougin, C.; Rodrigues-Lima, F.; Dupret, J.-M.; Dairou, J. Biotransformation of Trichoderma Spp and Their Tolerance to Aromatic Amines, a Major Class of Pollutants. Appl. Environ. Microbiol. 2013, 79, 4719–4726. [Google Scholar] [CrossRef] [Green Version]
  10. Mujahid, M.; Prasuna, M.L.; Sasikala, C.; Ramana, C.V. Integrated Metabolomic and Proteomic Analysis Reveals Systemic Responses of Rubrivivax Benzoatilyticus Ja2 to Aniline Stress. J. Proteome Res. 2015, 14, 711–727. [Google Scholar] [CrossRef]
  11. Yi, Z.; Chen, L.; Ren, Y.; Li, Y.; Liu, Z.; Wu, J.; Zhu, A. Decontamination of Aniline and Malathion on Material Surface by Array Cold Atmospheric Pressure Plasma Jet: Mechanism and Decontamination Pathways. J. Environ. Chem. Eng. 2022, 10, 107383–107392. [Google Scholar] [CrossRef]
  12. Thakur, S.; Qanungo, K. Removal of Aniline Blue from Aqueous Solution Using Adsorption: A Mini Review. Mater. Today Proc. 2021, 37, 2290–2293. [Google Scholar] [CrossRef]
  13. Shao, M.; Li, Y.; Meng, L.; Guo, J.; Gao, Y.; Liu, Y.; Huang, M. Simultaneous Removal of Antimony, Chromium and Aniline by Forward Osmosis Membrane: Preparation, Performance and Mechanism. Desalination 2021, 520, 115363–115372. [Google Scholar] [CrossRef]
  14. Viayna, A.; Ghashghaei, O.; Vílchez, D.; Estarellas, C.; López, M.; Gómez-Catalán, J.; Lavilla, R.; Delgado, J.; Luque, F.J. Holistic Approach to Anti-Knock Agents: A High-Throughput Screening of Aniline-Like Compounds. Fuel 2021, 305, 121518–121526. [Google Scholar] [CrossRef]
  15. Sang, W.; Cui, J.; Feng, Y.; Mei, L.; Zhang, Q.; Li, D.; Zhang, W. Degradation of Aniline in Aqueous Solution by Dielectric Barrier Discharge Plasma: Mechanism and Degradation Pathways. Chemosphere 2019, 223, 416–424. [Google Scholar] [CrossRef]
  16. Pang, S.-Y.; Duan, J.-B.; Zhou, Y.; Gao, Y.; Jiang, J. Oxidation Kinetics of Anilines by Aqueous Permanganate and Effects of Manganese Products: Comparison to Phenols. Chemosphere 2019, 235, 104–112. [Google Scholar] [CrossRef]
  17. Liu, H.; Lin, H.; Song, B.; Sun, X.; Xu, R.; Kong, T.; Xu, F.; Li, B.; Sun, W. Stable-Isotope Probing Coupled with High-Throughput Sequencing Reveals Bacterial Taxa Capable of Degrading Aniline at Three Contaminated Sites with Contrasting Ph. Sci. Total Environ. 2021, 771, 144807–144816. [Google Scholar] [CrossRef]
  18. Assaf, K.I.; Abed Alfattah, H.; Eftaiha, A.A.; Bardaweel, S.K.; Alnajjar, M.A.; Alsoubani, F.A.; Qaroush, A.K.; El-Barghouthi, M.I.; Nau, W.M. Encapsulation of Ionic Liquids inside Cucurbiturils Electronic Supplementary Information (Esi) Available: Additional Nmr Data, Itc and Dye Displacement Experiments, Computational Results, Conductivity and Anti-Cancer Activity Results. Org. Biomol. Chem. 2020, 18, 2120–2128. [Google Scholar] [CrossRef]
  19. Máximo, P.; Colaço, M.; Pauleta, S.R.; Costa, P.J.; Pischel, U.; Parola, A.J.; Basílio, N. Photomodulation of Ultrastable Host–Guest Complexes in Water and Their Application in Light-Controlled Steroid Release. Org. Chem. Front. 2022. [Google Scholar] [CrossRef]
  20. Miskolczy, Z.; Megyesi, M.; Sinn, S.; Biedermann, F.; Biczók, L. Simultaneous Analyte Indicator Binding Assay (Sba) for the Monitoring of Reversible Host–Guest Complexation Kinetics. Chem. Commun. 2021, 57, 12663–12666. [Google Scholar] [CrossRef]
  21. Freitag, M.; Galoppini, E. Cucurbituril Complexes of Viologens Bound to TiO2 Films. Langmuir 2010, 26, 8262–8269. [Google Scholar] [CrossRef]
  22. Kim, J.; Jung, I.-S.; Kim, S.-Y.; Lee, E.; Kang, J.-K.; Sakamoto, S.; Yamaguchi, K.; Kim, K. New Cucurbituril Homologues:  Syntheses, Isolation, Characterization, and X-Ray Crystal Structures of Cucurbit[N]Uril (N = 5, 7, and 8). J. Am. Chem. Soc. 2000, 122, 540–541. [Google Scholar] [CrossRef]
  23. Lin, R.-L.; Dong, Y.-P.; Tang, M.; Liu, Z.; Tao, Z.; Liu, J.-X. Selective Recovery and Detection of Gold with Cucurbit[N]Urils (N = 5–7). Inorg. Chem. 2020, 59, 3850–3855. [Google Scholar] [CrossRef]
  24. Thomas, S.S.; Tang, H.; Bohne, C. Noninnocent Role of Na+ Ions in the Binding of the N-Phenyl-2-Naphthylammonium Cation as a Ditopic Guest with Cucurbit[7]Uril. J. Am. Chem. Soc. 2019, 141, 9645–9654. [Google Scholar] [CrossRef]
  25. Ivanov, D.A.; Petrov, N.K.; Nikitina, E.A.; Basilevsky, M.V.; Vedernikov, A.I.; Gromov, S.P.; Alfimov, M.V. The 1:1 Host−Guest Complexation between Cucurbit[7]Uril and Styryl Dye. J. Phys. Chem. A 2011, 115, 4505–4510. [Google Scholar] [CrossRef]
  26. Gan, L.X.; Hao, C.L.; Jiang, X.M. Controllable Adsorption and Desorption of a Cationic Surfactant at Quartz Directed by Host-Guest Complex. Colloids Surf. A Physicochem. Eng. Asp. 2021, 625, 126880. [Google Scholar] [CrossRef]
  27. Kataki-Anastasakou, A.; Axtell, J.C.; Hernandez, S.; Dziedzic, R.M.; Balaich, G.J.; Rheingold, A.L.; Spokoyny, A.M.; Sletten, E.M. Carborane Guests for Cucurbit[7]Uril Facilitate Strong Binding and on-Demand Removal. J. Am. Chem. Soc. 2020, 142, 20513–20518. [Google Scholar] [CrossRef]
  28. Monemian Esfahani, A.; Zhao, W.; Chen, J.Y.; Huang, C.; Xi, N.; Xi, J.; Yang, R. On the Measurement of Energy Dissipation of Adhered Cells with the Quartz Microbalance with Dissipation Monitoring. Anal. Chem. 2018, 90, 10340–10349. [Google Scholar] [CrossRef]
  29. Tanoue, H.; Yamada, N.L.; Ito, K.; Yokoyama, H. Quantitative Analysis of Polymer Brush Formation Kinetics Using Quartz Crystal Microbalance: Viscoelasticity of Polymer Brush. Langmuir 2017, 33, 5166–5172. [Google Scholar] [CrossRef]
  30. Largitte, L.; Pasquier, R. A Review of the Kinetics Adsorption Models and Their Application to the Adsorption of Lead by an Activated Carbon. Chem. Eng. Res. Des. 2016, 109, 495–504. [Google Scholar] [CrossRef]
  31. Kolman, K.; Makowski, M.M.; Golriz, A.A.; Kappl, M.; Pigłowski, J.; Butt, H.-J.; Kiersnowski, A. Adsorption, Aggregation, and Desorption of Proteins on Smectite Particles. Langmuir ACS J. Surf. Colloids 2014, 30, 11650–11659. [Google Scholar] [CrossRef] [PubMed]
  32. Sut, T.N.; Jackman, J.A.; Cho, N.-J. Understanding How Membrane Surface Charge Influences Lipid Bicelle Adsorption onto Oxide Surfaces. Langmuir ACS J. Surf. Colloids 2019, 35, 8436–8444. [Google Scholar] [CrossRef] [PubMed]
  33. Li, J.; Piehler, L.T.; Qin, D.; Baker, J.R.; Tomalia, D.A.; Meier, D.J. Visualization and Characterization of Poly(Amidoamine) Dendrimers by Atomic Force Microscopy. Langmuir 2000, 16, 5613–5616. [Google Scholar] [CrossRef]
  34. Hierlemann, A.; Campbell, J.K.; Baker, L.A.; Crooks, R.M.; Ricco, A.J. Structural Distortion of Dendrimers on Gold Surfaces:  A Tapping-Mode Afm Investigation. J. Am. Chem. Soc. 1998, 120, 5323–5324. [Google Scholar] [CrossRef]
  35. Tsukruk, V.V. Dendritic Macromolecules at Interfaces. Adv. Mater. 1998, 10, 253–257. [Google Scholar] [CrossRef]
  36. Li, J.; Qin, D.; Baker, J.; Tomalia, D. The Characterization of High Generation Poly(Amidoamine) G9 Dendrimers by Atomic Force Microscopy (Afm). Macromol. Symp. 2001, 167, 257–269. [Google Scholar] [CrossRef]
  37. Betley, T.A.; Hessler, J.A.; Mecke, A.; Banaszak Holl, M.M.; Orr, B.G.; Uppuluri, S.; Tomalia, D.A.; Baker, J.R. Tapping Mode Atomic Force Microscopy Investigation of Poly(Amidoamine) Core−Shell Tecto(Dendrimers) Using Carbon Nanoprobes. Langmuir 2002, 18, 3127–3133. [Google Scholar] [CrossRef]
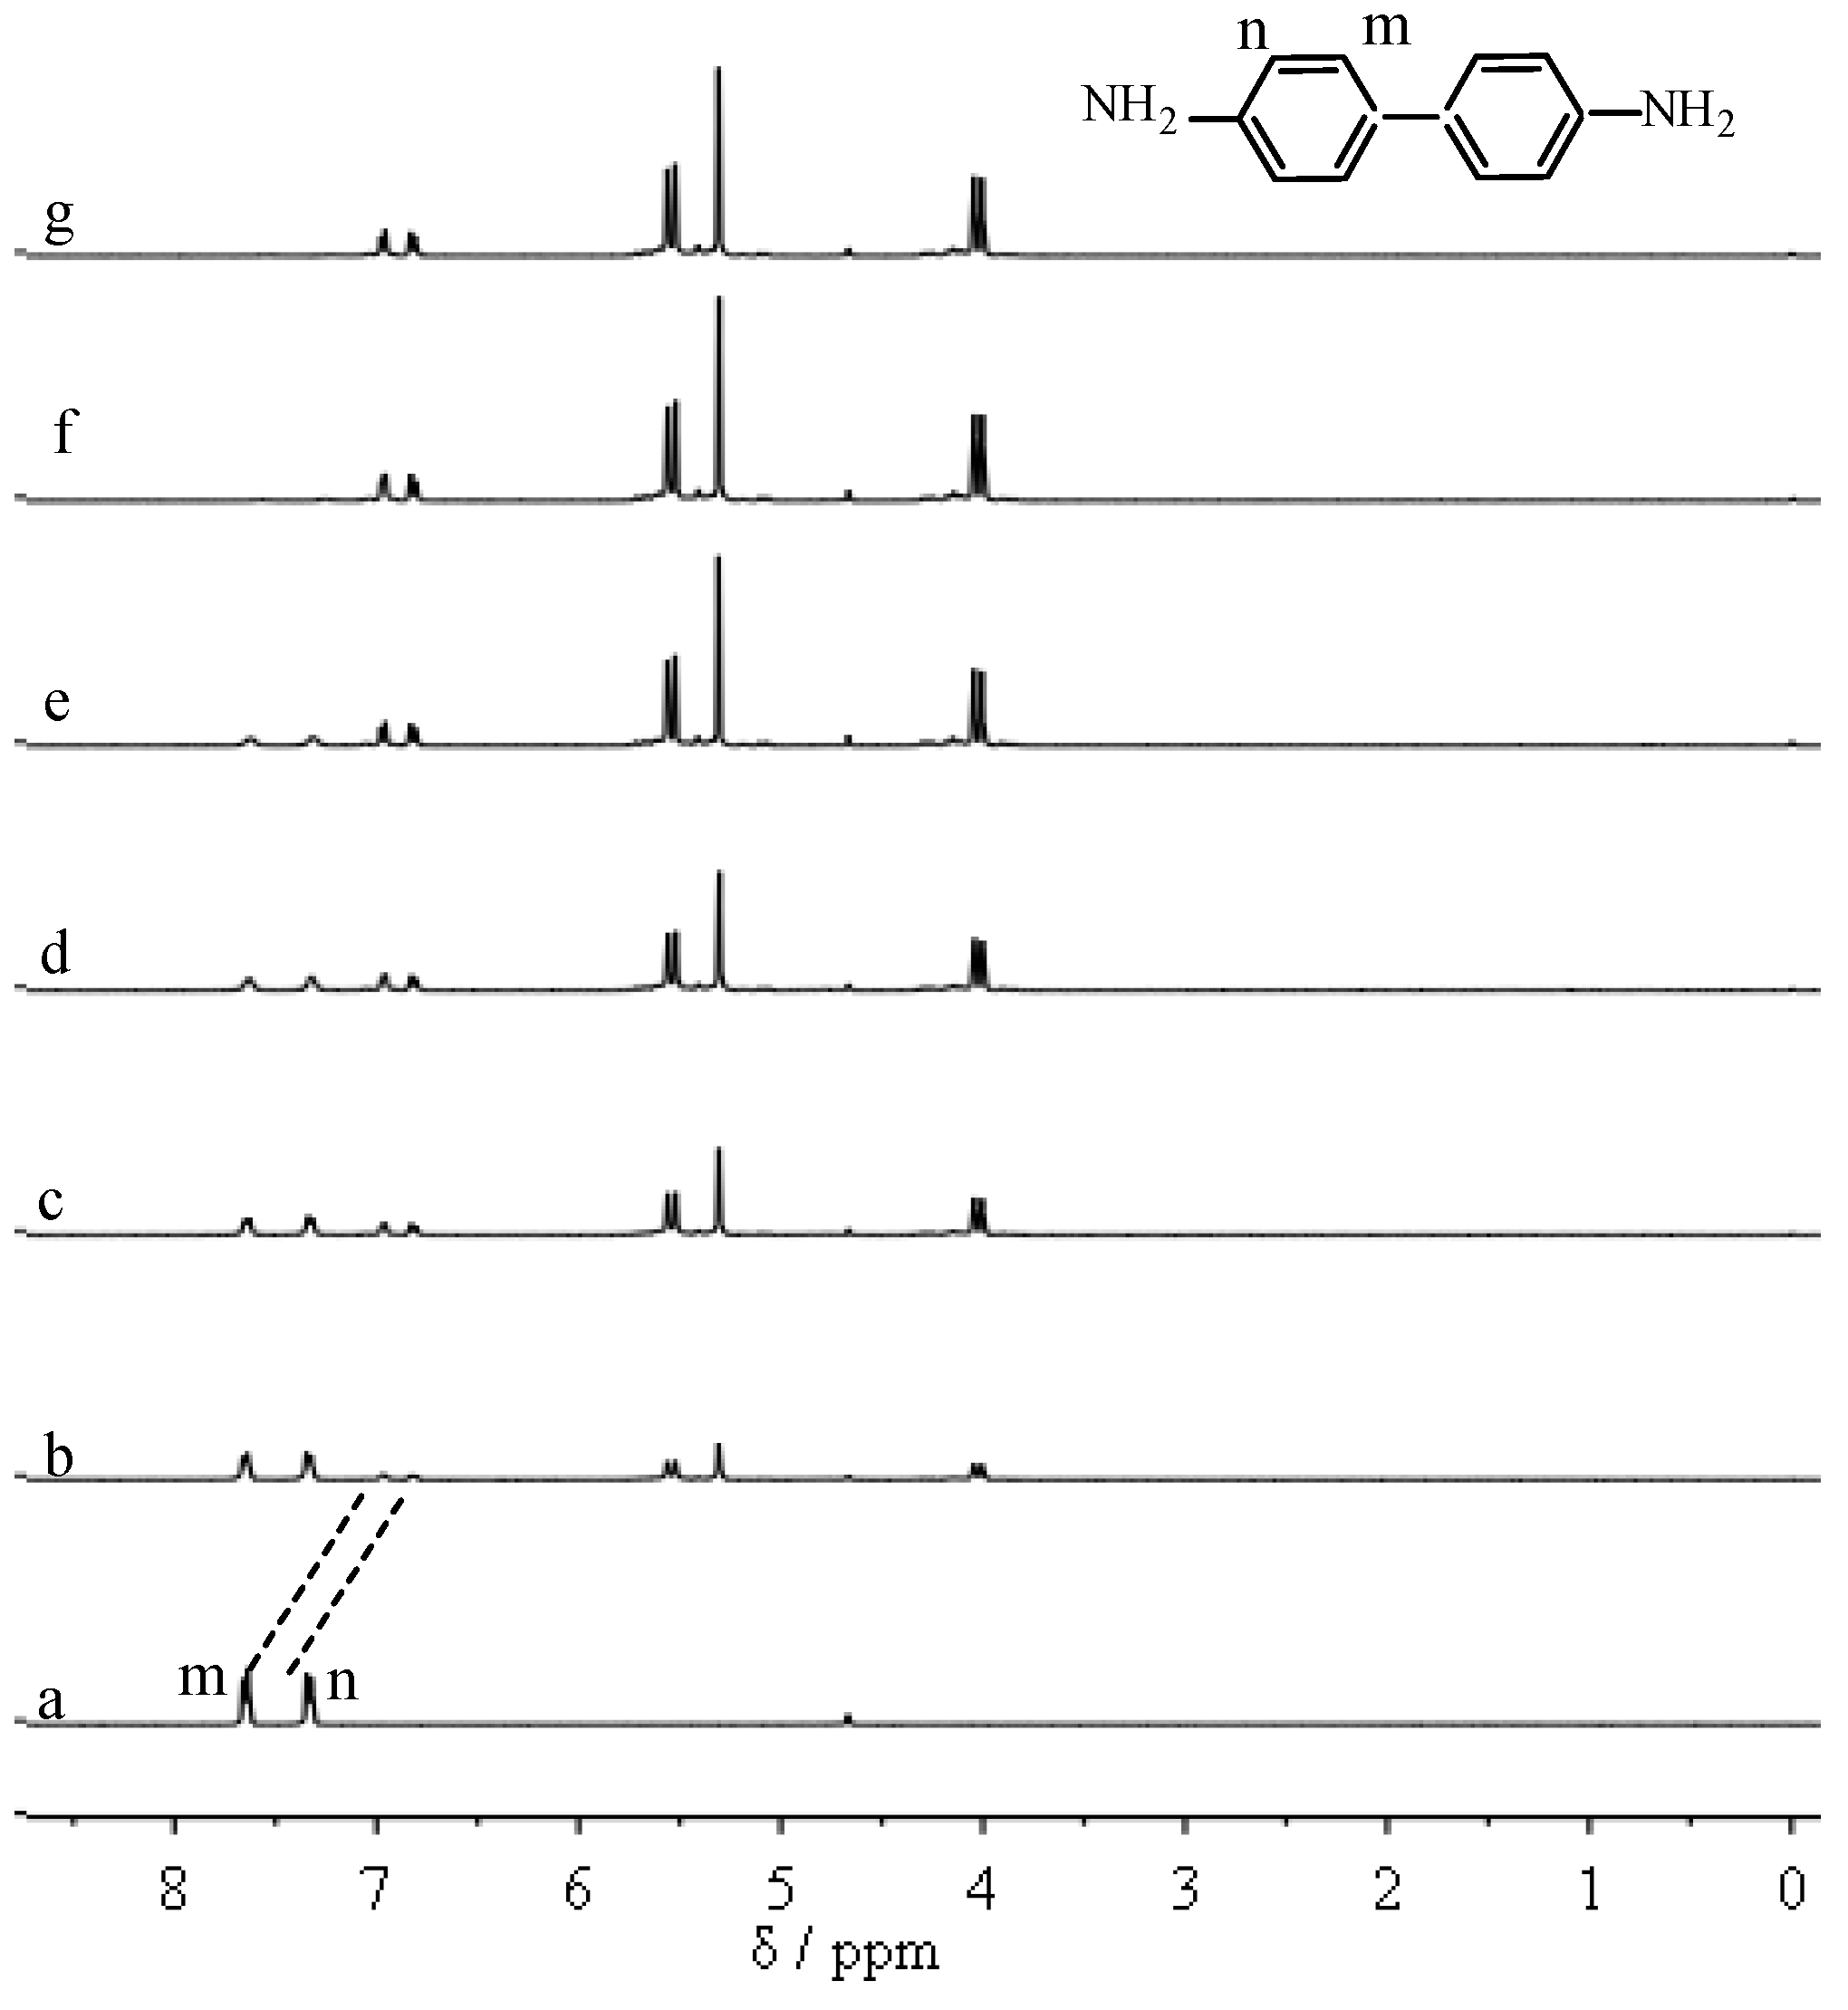
Figure 2. The 1H NMR (400 MHz) titration of NA with Q[7] in D2O (a 1:0.1; b 1:0.2; c 1:0.4; d 1:0.6; e 1:0.8; f 1:1; g 1:1.2).
Coatings 12 01100 g002
Figure 3. (A) The UV-vis spectrometry of the solution of AN with adding Q[7] at different concentrations. (B) The maximum absorption peak corresponding to the ratio of N(Q[7])/N(AN).
Coatings 12 01100 g003
Figure 4. (A) The fluorescence spectroscopy of the solution of AN with adding Q[7] at different concentrations. (B) The fluorescence intensity at maximum fluorescence emission wavelength corresponding to the ratio of N(Q[7])/N(AN).
Coatings 12 01100 g004
Figure 5. Model of interaction between Q[7] and AN.
Coatings 12 01100 g005
Figure 6. The 1H NMR titration of 0.1 mM solution of (a) free guest MDA; (b) N(Q[7])/N(MDA) = 2; (c) N(Q[7])/N(MDA) = 4.
Coatings 12 01100 g006
Figure 7. (A) The UV-vis spectrometry of the solution of MDA with adding Q[7] at different concentrations. (B) The maximum absorption peak corresponding to the ratio of N(Q[7])/N(MDA).
Coatings 12 01100 g007
Figure 8. (A) The fluorescence spectroscopy of the solution of MDA with adding Q[7] at different concentrations. (B) The fluorescence intensity at maximum fluorescence emission wavelength corresponding to the ratio of N(Q[7])/N(MDA).
Coatings 12 01100 g008
Figure 9. Model of interaction between Q[7] and MDA.
Coatings 12 01100 g009
Figure 10. The variation in ΔF with time upon addition of Q[7] (0.1 mmol·L−1).
Coatings 12 01100 g010
Figure 11. The variations in ΔF and ΔD with time upon addition of AN. (AN: 0.1 mmol·L−1; Q[7]: 0.1 mmol·L−1).
Coatings 12 01100 g011
Figure 12. Variations in ΔF and ΔD with time upon addition of MDA; (MDA: 0.1 mmol·L−1; Q[7]: 0.1 mmol·L−1).
Coatings 12 01100 g012
Figure 13. ΔF and ΔD of quartz in the solution after adding MDA and Q[7] successively.
Coatings 12 01100 g013
Figure 14. AFM 3D images before and after the interaction of MDA and Q[7] (A): MDA (B): MDA + Q[7] (CQ[7] = 10−4 mol/L, CMDA = 10−3 mol/L).
Coatings 12 01100 g014
Publisher’s Note: MDPI stays neutral with regard to jurisdictional claims in published maps and institutional affiliations.