Article

Magnetite Deposition Behavior on Alloy 600 and Alloy 690 Tubes in Simulated PWR Secondary Water

1
Materials Safety Technology Development Division, Korea Atomic Energy Research Institute, Daejeon 34057, Korea
2
Department of Materials Science and Engineering, Chungnam National University, Daejeon 34134, Korea
3
Central Research Institute, Korea Hydro & Nuclear Power Co., Ltd., Daejeon 34101, Korea
*
Author to whom correspondence should be addressed.
Coatings 2022, 12(9), 1231; https://doi.org/10.3390/coatings12091231
Submission received: 4 July 2022 / Revised: 19 August 2022 / Accepted: 20 August 2022 / Published: 24 August 2022
(This article belongs to the Section Surface Characterization, Deposition and Modification)

Abstract

:
Fouling due to magnetite deposition has been a major concern for steam generator (SG) tubing of pressurized water reactors (PWRs). Alloy 690 SG tubes are now used for new plants or are scheduled to replace old Alloy 600 tubes of operating plants. The purpose of this study is to investigate the magnetite deposition behavior on the two different SG tube materials: Alloy 600 and Alloy 690. Deposition tests were conducted under a sub-cooled nucleate flow boiling condition in simulated secondary water of a PWR at 270 °C. After these tests, we observed that the tube surfaces were covered with deposits composed of porous magnetite particles. We found approximately 30% more magnetite deposits on Alloy 600 than on Alloy 690. The electrostatic repulsive force between the magnetite particles and the Alloy 600 surface was only half of that between the magnetite particles and the Alloy 690 surface, resulting in an increase in the deposit mass.

1. Introduction

In the secondary water system of pressurized water reactors (PWRs), corrosion products are released from the surfaces of carbon steel piping and components due to flow-accelerated corrosion. The released corrosion products are transported into steam generators (SGs) and accumulate on the outer surfaces of SG tubing and other SG structural components to form deposits with a porous structure [1,2,3,4]. Deposits on the internal components of the SG are mainly composed of magnetite particles [5,6].
Magnetite deposits accumulated in SGs can deteriorate the performance and integrity of the SG [6,7,8,9,10,11,12,13]. The porous deposits have a lower thermal conductivity than the SG tubing [6,7,8]; therefore, the heat transfer capability of the SG tubing decreases, and the temperature of the SG tube wall increases. Chemical impurities in the secondary water concentrate within the porous deposits to form an aggressive environment, thereby causing various types of corrosion damage: intergranular attack, stress corrosion cracking (SCC), pitting, and denting [9,10,11,12]. The increased tube wall temperature accelerates the corrosion rate of the SG tube materials and the concentration of chemical impurities. In addition, deposits at the inlet of the SG tube supporting plate flow paths can induce high velocity regions and transverse velocity, which can cause flow-induced vibrations and SG tube cracks [13]. Therefore, the accumulation of magnetite deposits onto SG tubes has been a major concern in PWRs.
Recently, investigations on the magnetite deposition onto the surface of SG tubes have been reported from the viewpoint of water chemistry factors such as pH control amines and chemical impurities [14,15,16]. These studies found that the amount of magnetite deposits is strongly dependent on the pH control agents and is reduced in the order of ethanolamine > morpholine > ammonia [14]. Lee et al. [15] reported that dimethylamine was beneficial to mitigate SG tube fouling compared to ethanolamine and 3-methoxypropylamine. The ingress of sodium chloride as an impurity into feedwater decreased the particle size and quantity of magnetite deposits [16]. As mentioned above, the effects of various pH agents and impurity on the magnetite deposition behavior on SG tubes have been well established.
However, magnetite deposition on different SG tube materials has yet to be studied. There are three kinds of SG tube materials: Ni-based Alloy 600 and Alloy 690 and Fe-based Alloy 800. Since Alloy 690 has an excellent resistance to SCC, this alloy is currently used for new plants or is scheduled to replace old Alloy 600 tubes in operating PWRs. The transportation of corrosion products into SGs and the subsequent deposition onto the tube surfaces inevitably occur, irrespective of the SG tube materials. As a result, the deposit-related degradation of SG tubing continues to be a major issue for PWRs [17].
In this study, we investigate the magnetite deposition behavior of two different SG tubing materials (Alloy 600 and Alloy 690) in the simulated secondary water of a PWR. Magnetite deposition tests were conducted under a sub-cooled nucleate boiling (SNB) condition using a circulation loop system that can closely simulate the secondary condition of an SG at 270 °C and 60 bars. Before the tests, the surface characteristics (surface roughness and wettability) of the tubes were measured. After the deposition tests, the deposits were characterized using various analytical techniques, and the amount of deposits was also evaluated. The mechanism of the difference in the magnetite deposition behavior between Alloy 600 and Alloy 690 SG tubes was discussed from the viewpoint of the boiling behavior on the tube surfaces and zeta potentials of each SG tubing material and the magnetite nanoparticles.

2. Materials and Methods

2.1. Tube Specimen Preparation

High temperature mill annealed Alloy 600 tubing and thermally treated Alloy 690 tubing were used as the SG tube specimens. Alloy 600 tubing and Alloy 690 tubing were manufactured by Valinox Nucléaire (Montbard, France). The tubing has a nominal outer diameter of 19.05 mm, a wall thickness of 1.07 mm, and total length of 500 mm. One side of the tube specimen was welded with an Alloy 600 cap. The chemical compositions of the two different SG tube materials were determined by an inductively coupled plasma optical emission spectroscope (ICP-OES) (Thermo Scientific, Cambridge, UK). The chemical compositions of both SG tube materials are given in Table 1.

2.2. Surface Characterization of Specimens

The surface roughness of both SG tubes was measured within a surface area of 800 μm × 800 μm in two-dimensional standard mode using an optical surface profiler (m-Surf, Nanofocus AG, Oberhausen, Germany). The surface roughness parameters were obtained from this profile according to ISO 4287 and 11,562 standards [18,19]. The arithmetic average roughness (Ra) is used in this study.
The contact angles of the Alloy 600 and Alloy 690 tube materials were measured using a contact angle analyzer (Phoenix 300 Plus, SEO, Seoul, Korea) under an atmospheric condition at 25 °C. The contact angle, a measure of wettability, is measured on a flat surface. Therefore, the outer surfaces of SG tube segments were abraded with silicon carbide paper to make a flat surface. The surface roughness significantly affects the static contact angle. Accordingly, the Ra of the flat samples was controlled to be about 0.20~0.21 μm by surface finishing with 600-grit paper, similar to that of the as-received SG tubes. A 3 μL droplet of deionized water was placed by a syringe vertically down onto the surface of the specimen. After that, the droplet image was captured by a camera. The static contact angle was determined using image analysis software. Contact angle measurements were conducted at three different points on the sample surface and repeated four times at each point.

2.3. Zeta Potential Measurements

The zeta potential of magnetite particles and two different SG tube materials was measured using a Malvern Zetasizer Nano ZS90 system (Malvern Panalytical Ltd., Malvern, UK). Magnetite particles with a mean diameter of 5 nm were diluted in high-purity demineralized water with a resistivity of 18.3 MΩ to a concentration of 5 mg/L. The pH of the solution was controlled to pH 10.0 at 25 °C using ethanolamine (ETA). The solution was injected into a zeta potential cell kit consisting of a pair of Pd electrodes. When an electric field was applied to the two Pd electrodes, the electrophoretic mobility of the particles was obtained from the electrophoretic light scattering (ELS) method. The measured mobility was used to obtain the zeta potential ( ζ ) by Henry’s equation [20], described as follows:
ζ = 3 μ U E 2 ε f ( κ )
where μ is the viscosity, UE is the electrophoretic mobility, ε is the dielectric constant, and f(k) is the Henry coefficient. In a previous study, the absorption index of magnetite particles was obtained from 0.1 to 0.01 [21]. The refractive index of magnetite nanoparticles was widely used as 2.42 [22,23]. In this study, the absorption and refractive indexes of the magnetite particles were assumed to be 0.01 and 2.42, respectively.
The surface zeta potentials of the Alloy 600 and Alloy 690 tube materials were evaluated. The surface roughness significantly affects the surface zeta potential as well as the contact angle [24]. Therefore, the samples for the surface zeta potential measurement were prepared by the same method used for the contact angle measurement. The prepared specimen was mounted between two Pd electrodes and immersed in a solution containing tracer magnetite particles at pH 10.0 at 25 °C using ETA. The apparent tracer mobility was measured at four different distances from the sample surface. The surface zeta potentials of the flat samples were obtained by a linear extrapolation method. All zeta potential measurements were performed at 25 °C and repeated three times.

2.4. Magnetite Deposition Loop System

Figure 1 shows a detailed schematic of a circulation loop system for magnetite deposition on SG tubes. The loop system is made up of three major parts: (1) a solution tank, (2) a Fe ion source tank, and (3) a test section. The main tank of a 100 L capacity was filled with high-purity demineralized water with a high resistivity of 18.3 MΩ. During the deposition test, the pH of the test solution was maintained at 10.0 at 25 °C with ETA, which is a representative pH control agent used in the PWR secondary system [25]. The Fe ion source tank with a 50 L capacity was filled with 260 ppm Fe (II)-acetate. The dissolved oxygen (DO) concentration of the solution in the main and Fe ion source tanks was controlled to be less than 5 ppb by 99.99% nitrogen gas purging.
As shown in Figure 1, except for three major parts, the loop system also consisted of a high-pressure (HP) diaphragm pump, a metering pump for injecting the Fe ion source into the test section, filters, a back-pressure regulator (BPR), a pH meter, a DO meter, thermo-couples, band and line heaters, and a chiller. The pressure of the test section was regulated at 60 bars (saturation pressure at 270 °C). The flow rate of the test section was controlled at 15.6 L/h. The band and line heaters around the test section and the cartridge heater inserted in the SG tube were operated to reach the tube surface temperature to 270 °C. To meet the SNB condition on the SG tube surface, the cartridge heater was run with a heat flux of 30 W/cm2. When all these conditions were stabilized, we started to add the Fe ion source into the test section at a flow rate of 60 mL/h, thereby maintaining the Fe ion concentration adjacent to the SG tube surface at 1 ppm. The magnetite deposition test of each tube was performed for two weeks (336 h) without shutdown.

2.5. Microstructural Analysis and Amount of Magnetite Deposits

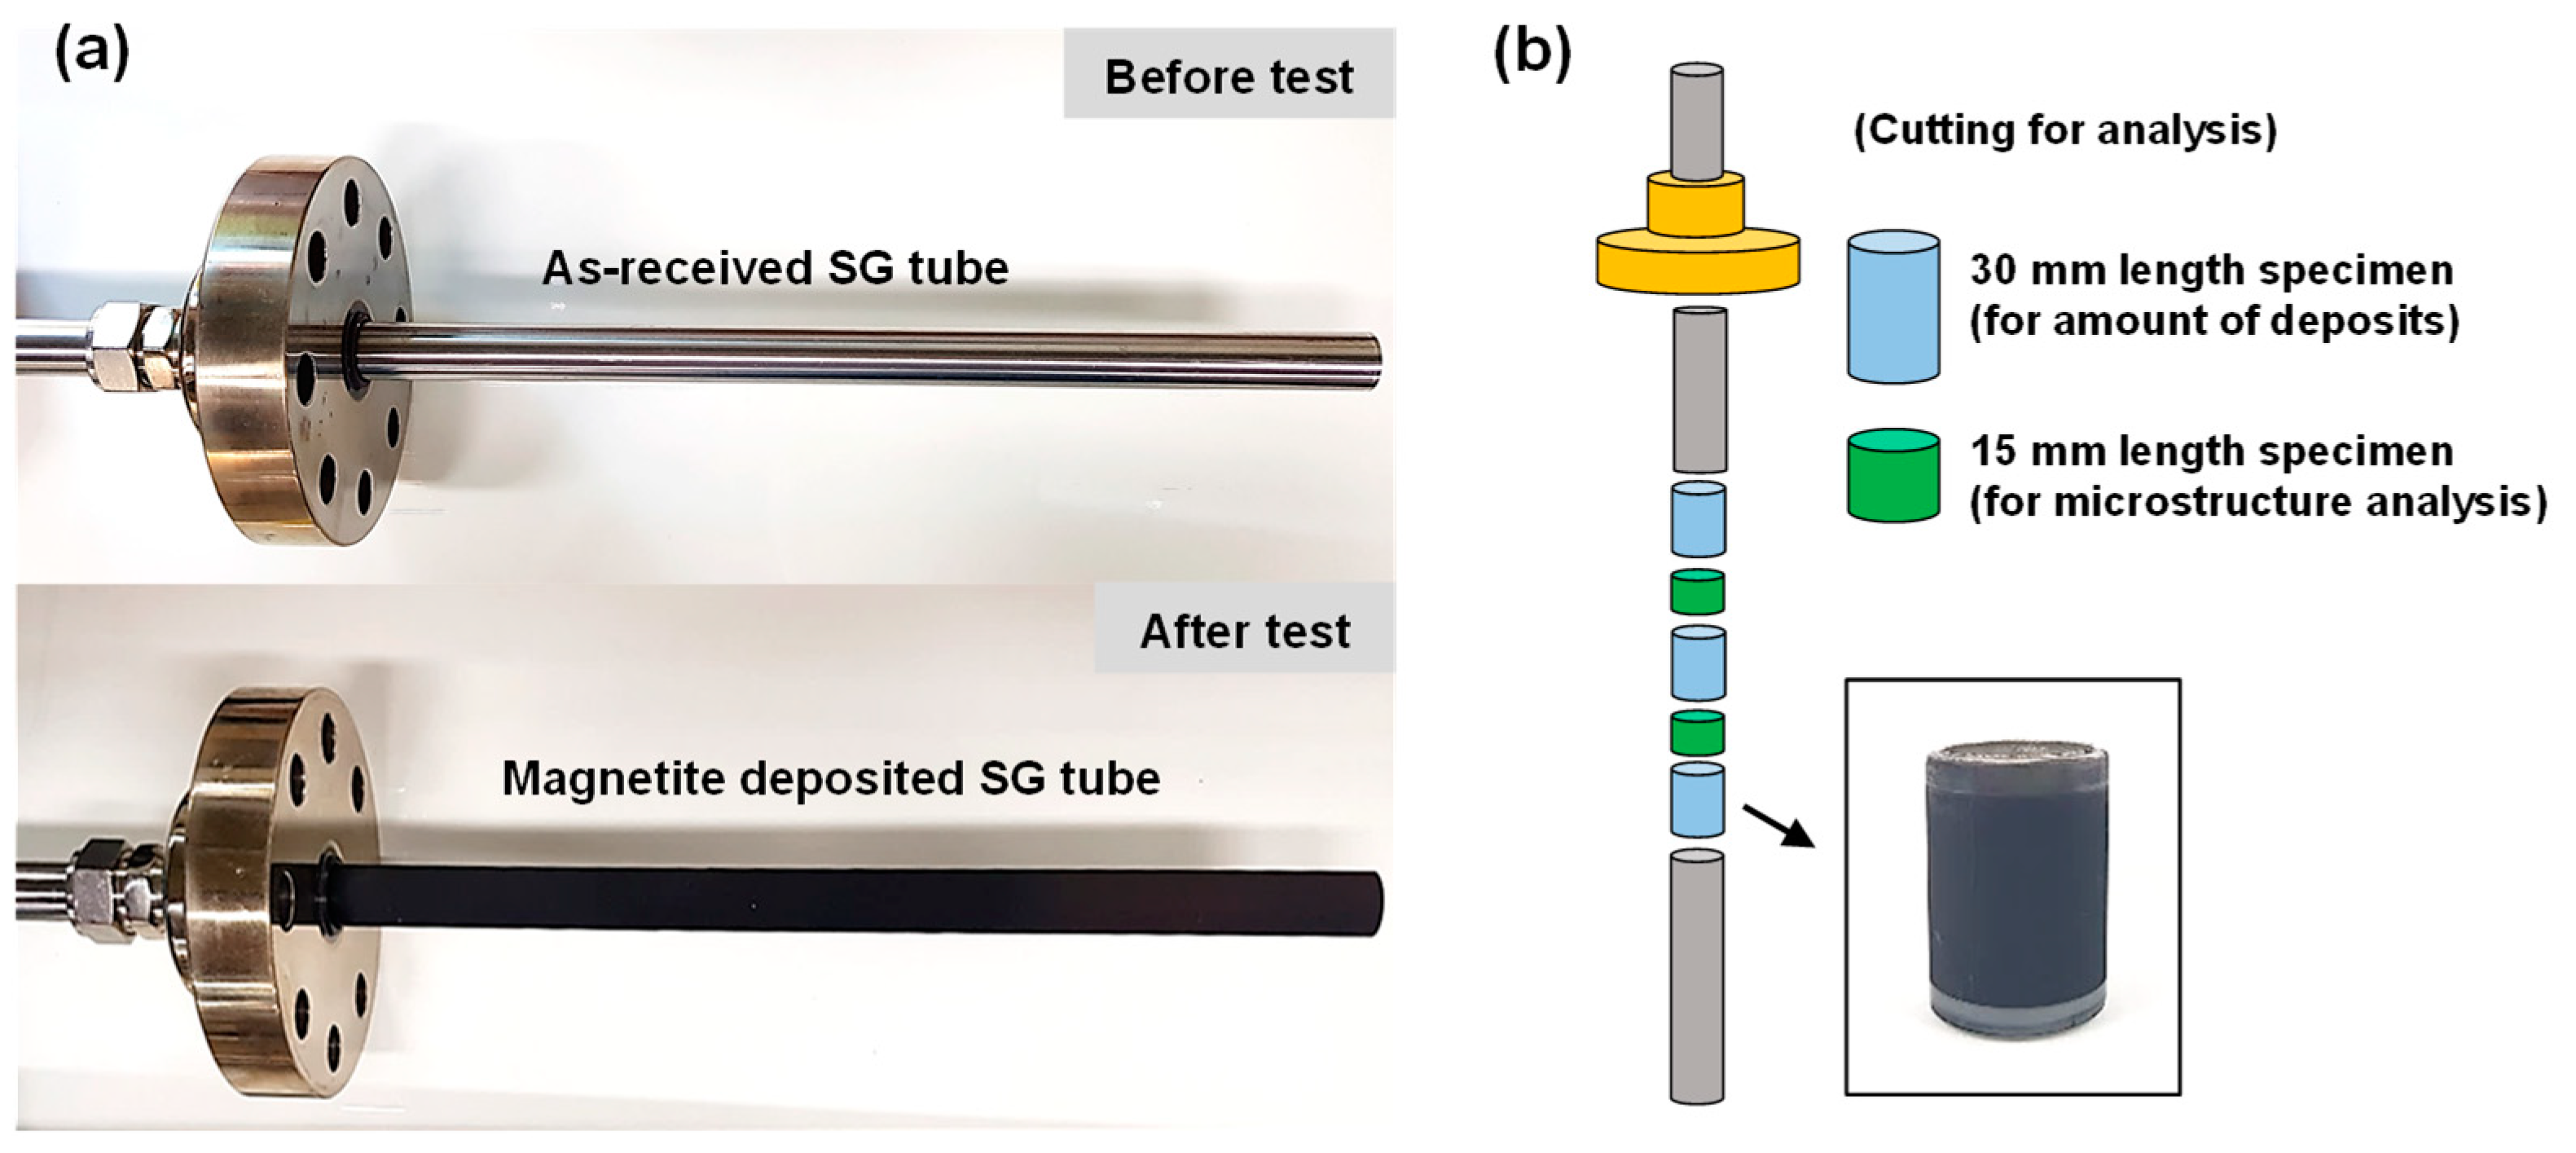
The magnetite deposited tubes were cut into tubular segments with three dimensions using a tube cutter (Figure 2). Two tubular samples with a length of 15 mm were used to characterize the deposits. The morphology of the deposits was analyzed using a scanning electron microscope (SEM, FEI Company, Hillsboro, OR, USA). In addition, the deposits were cross-sectioned using a focused ion beam (FIB)-SEM system LYRA3 (TESCAN, Brno, Czech Republic) with a gallium ion beam at an accelerating voltage of 30 kV. The chemical composition of the deposits was analyzed by an FIB-SEM with an attached energy-dispersive X-ray spectrometer (EDS) with an energy resolution of 125 eV. A high-resolution X-ray diffractometer (HR-XRD, Rigaku, Tokyo, Japan) with Cu-Kα radiation (λ = 1.5406 Å) was used to characterize the microstructure of the deposits in powder form. X-ray diffraction data were obtained in the 2-theta range of 20°–70° at a scan rate of 2°/min. The measured diffraction patterns were fitted and indexed using the Jade 9 software package (version 9, Material Data, Inc., Livermore, CA, USA). The two-dimensional porosity of the deposits was calculated using image analysis software. A minimum of 15 images taken at 5 different regions was used to calculate the porosity.
Three tubular specimens with a length of 30 mm were used to measure the amount of deposits. The deposits on SG tubes were dissolved by immersing the segments in the following solution according to the chemical cleaning process of Electric Power Research Institute/Steam Generator Owners Group (EPRI/SGOG). The chemical cleaning is as follows: step (1) the solution was prepared by mixing 20 wt.% diammonium ethylenediaminetetraacetic acid ((NH4)2EDTA), 1 wt.% hydrazine (N2H4), and 1 wt.% corrosion inhibitor (CCI-801). After that, the pH of the solution was adjusted to 7.0 at 25 °C by the addition of ammonia solution (NH4OH). This mixed solution was developed for magnetite removal by EPRI and has been applied to many SGs [26,27,28,29]. After the tubular segments were chemically cleaned in the solution at 93 °C for 10 h, the concentration of metallic ions dissolved in the solution was measured by ICP-OES using a Thermo Scientific iCAP 7000 (Thermo Scientific, Cambridge, UK) with an uncertainty of 2%.
In previous studies, the corrosion rates of nuclear materials were evaluated by general corrosion tests in an EDTA-based chemical cleaning solution. Lee and Sung [30] showed that the corrosion rate of Alloy 600 was extremely low (maximum 2.3 mils) and was within the EPRI recommendation (<10 mils). Han et al. [31] found that the corrosion rate of stainless steel 316L was very low in a 20% EDTA-based cleaning solution. In this work, except for Fe, the Cr and Ni elements were not detected in the ICP-OES results. Therefore, it was confirmed that the corrosion of the surface of the SG tube did not occur during the magnetite removal process. Finally, the amount of deposits was calculated by converting the weight of the identified iron oxide (magnetite in this study) using the ICP-OES results.

3. Results and Discussion

3.1. Surface Characteristics of SG Tubes before Deposition Tests

The boiling behavior of a heated metal surface is greatly influenced by its surface properties such as roughness and wettability. The reason for this is that the roughness value and wettability are closely related to the number of bubble departures and the bubble nucleation site density on the heated surface [32,33,34,35,36,37]. Hence, the surface roughness values and contact angles of as-received Alloy 600 and Alloy 690 tubes were measured using the surface profiler and contact angle analyzer.
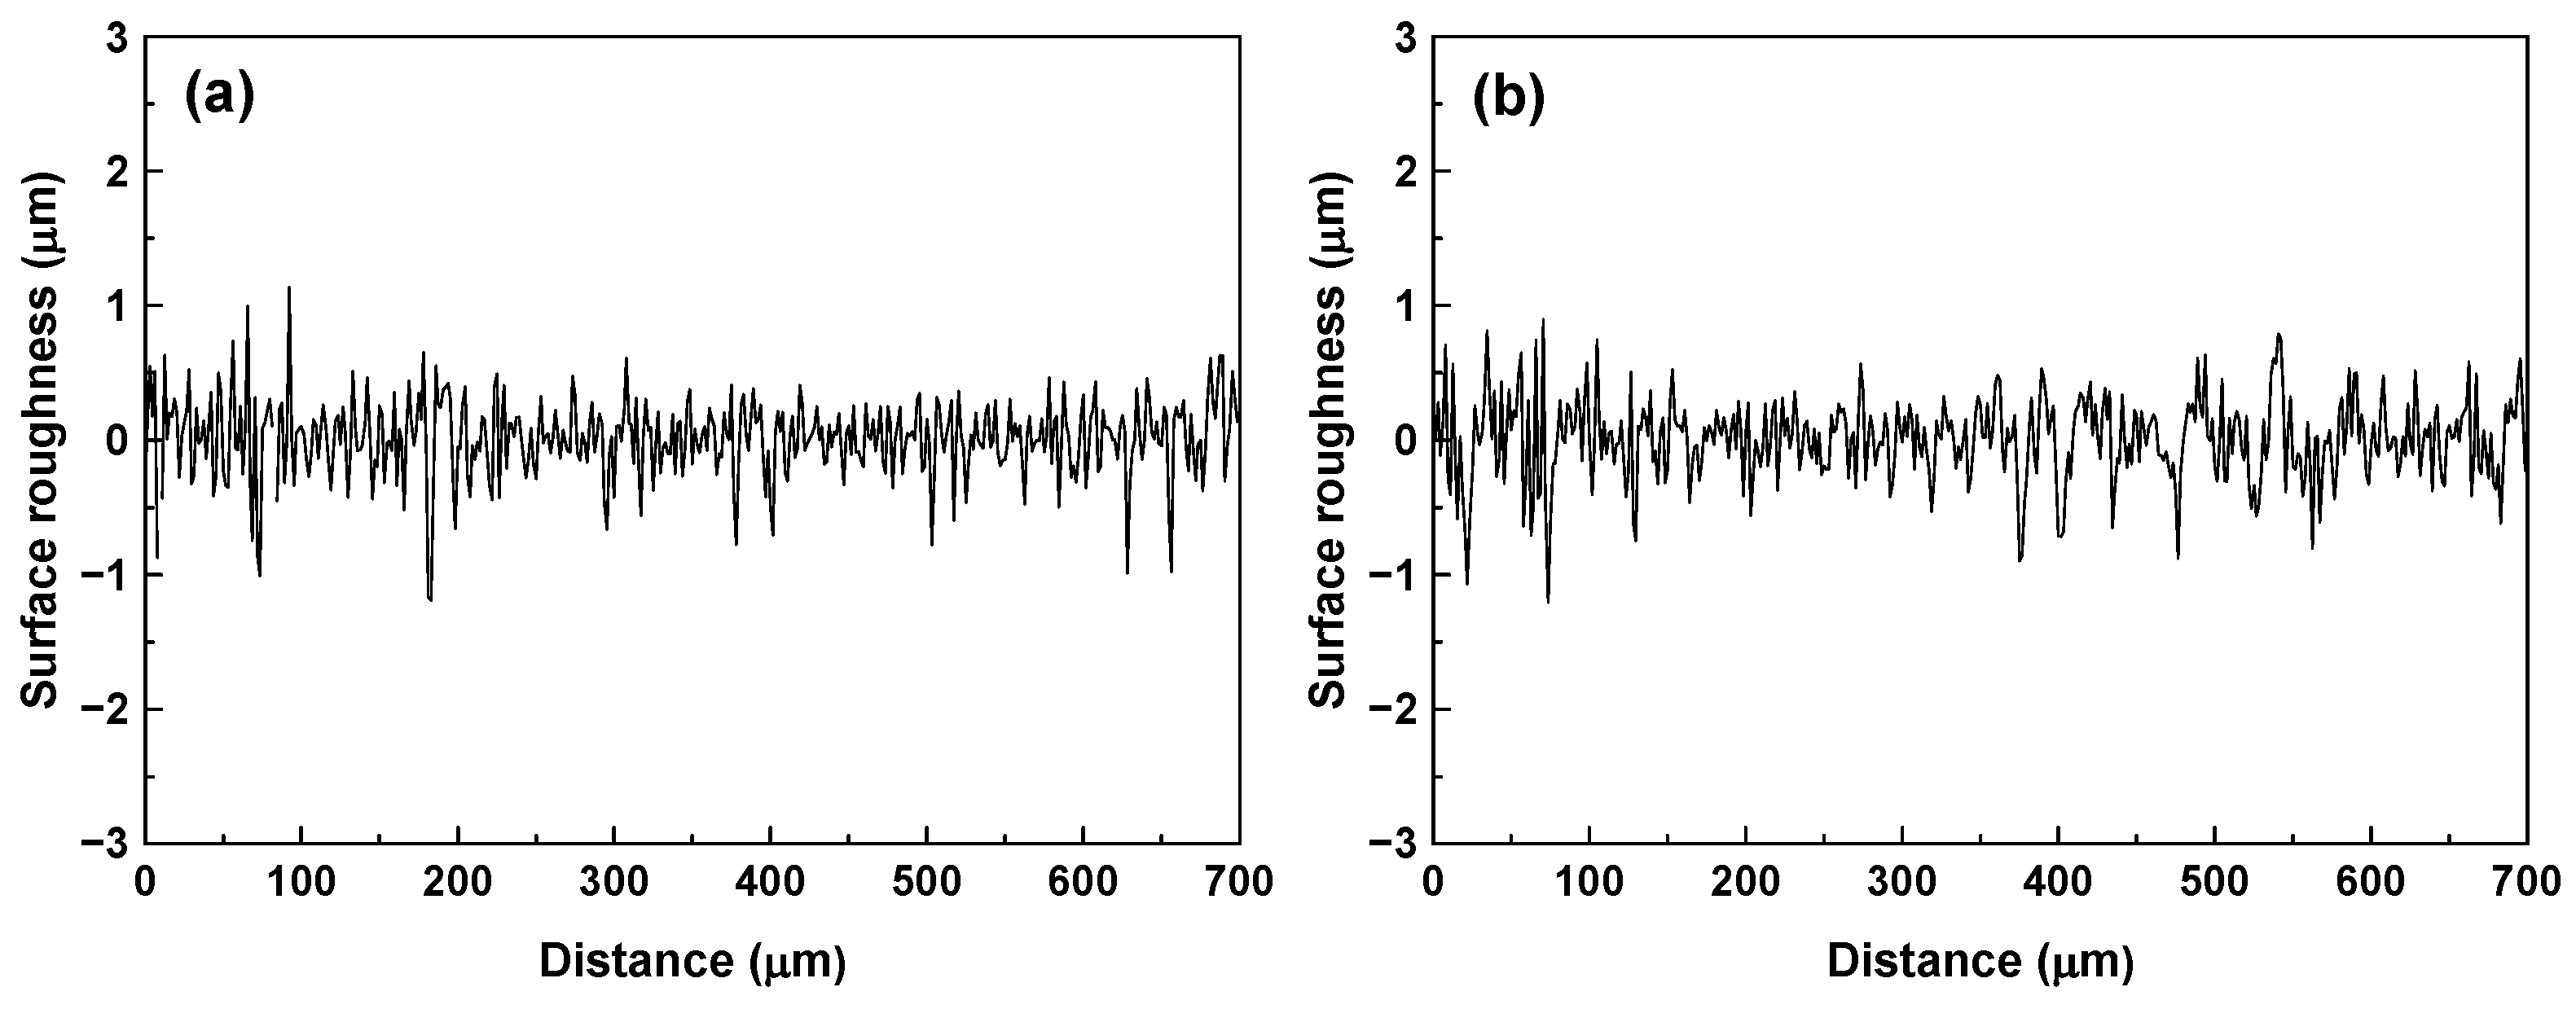
Figure 3 shows the measured surface profiles of Alloy 600 and Alloy 690 tubes. The Ra values were 0.21 μm for Alloy 600 and 0.20 μm for Alloy 690, indicating that the surface roughness of both SG tubes was almost the same.
Figure 4 shows the water droplet images and corresponding static contact angles on the surface of both SG tubing materials. The contact angles on both materials were nearly the same: 79.3° ± 1° for Alloy 600 and 79.5° ± 2° for Alloy 690, indicating that there is no difference in the wettability between the two materials. SNB is enhanced on a rougher surface [32,33,34] and on a more hydrophobic surface [35,36,37]. Furthermore, an increased SNB results in an increase in the deposition rate of corrosion products on the heated surface [38,39,40]. Therefore, based on the roughness and contact angle measurements, it is reasonable to conclude that the boiling and deposition behavior on the surfaces of both SG tubes will not be affected by at least the above two surface factors.
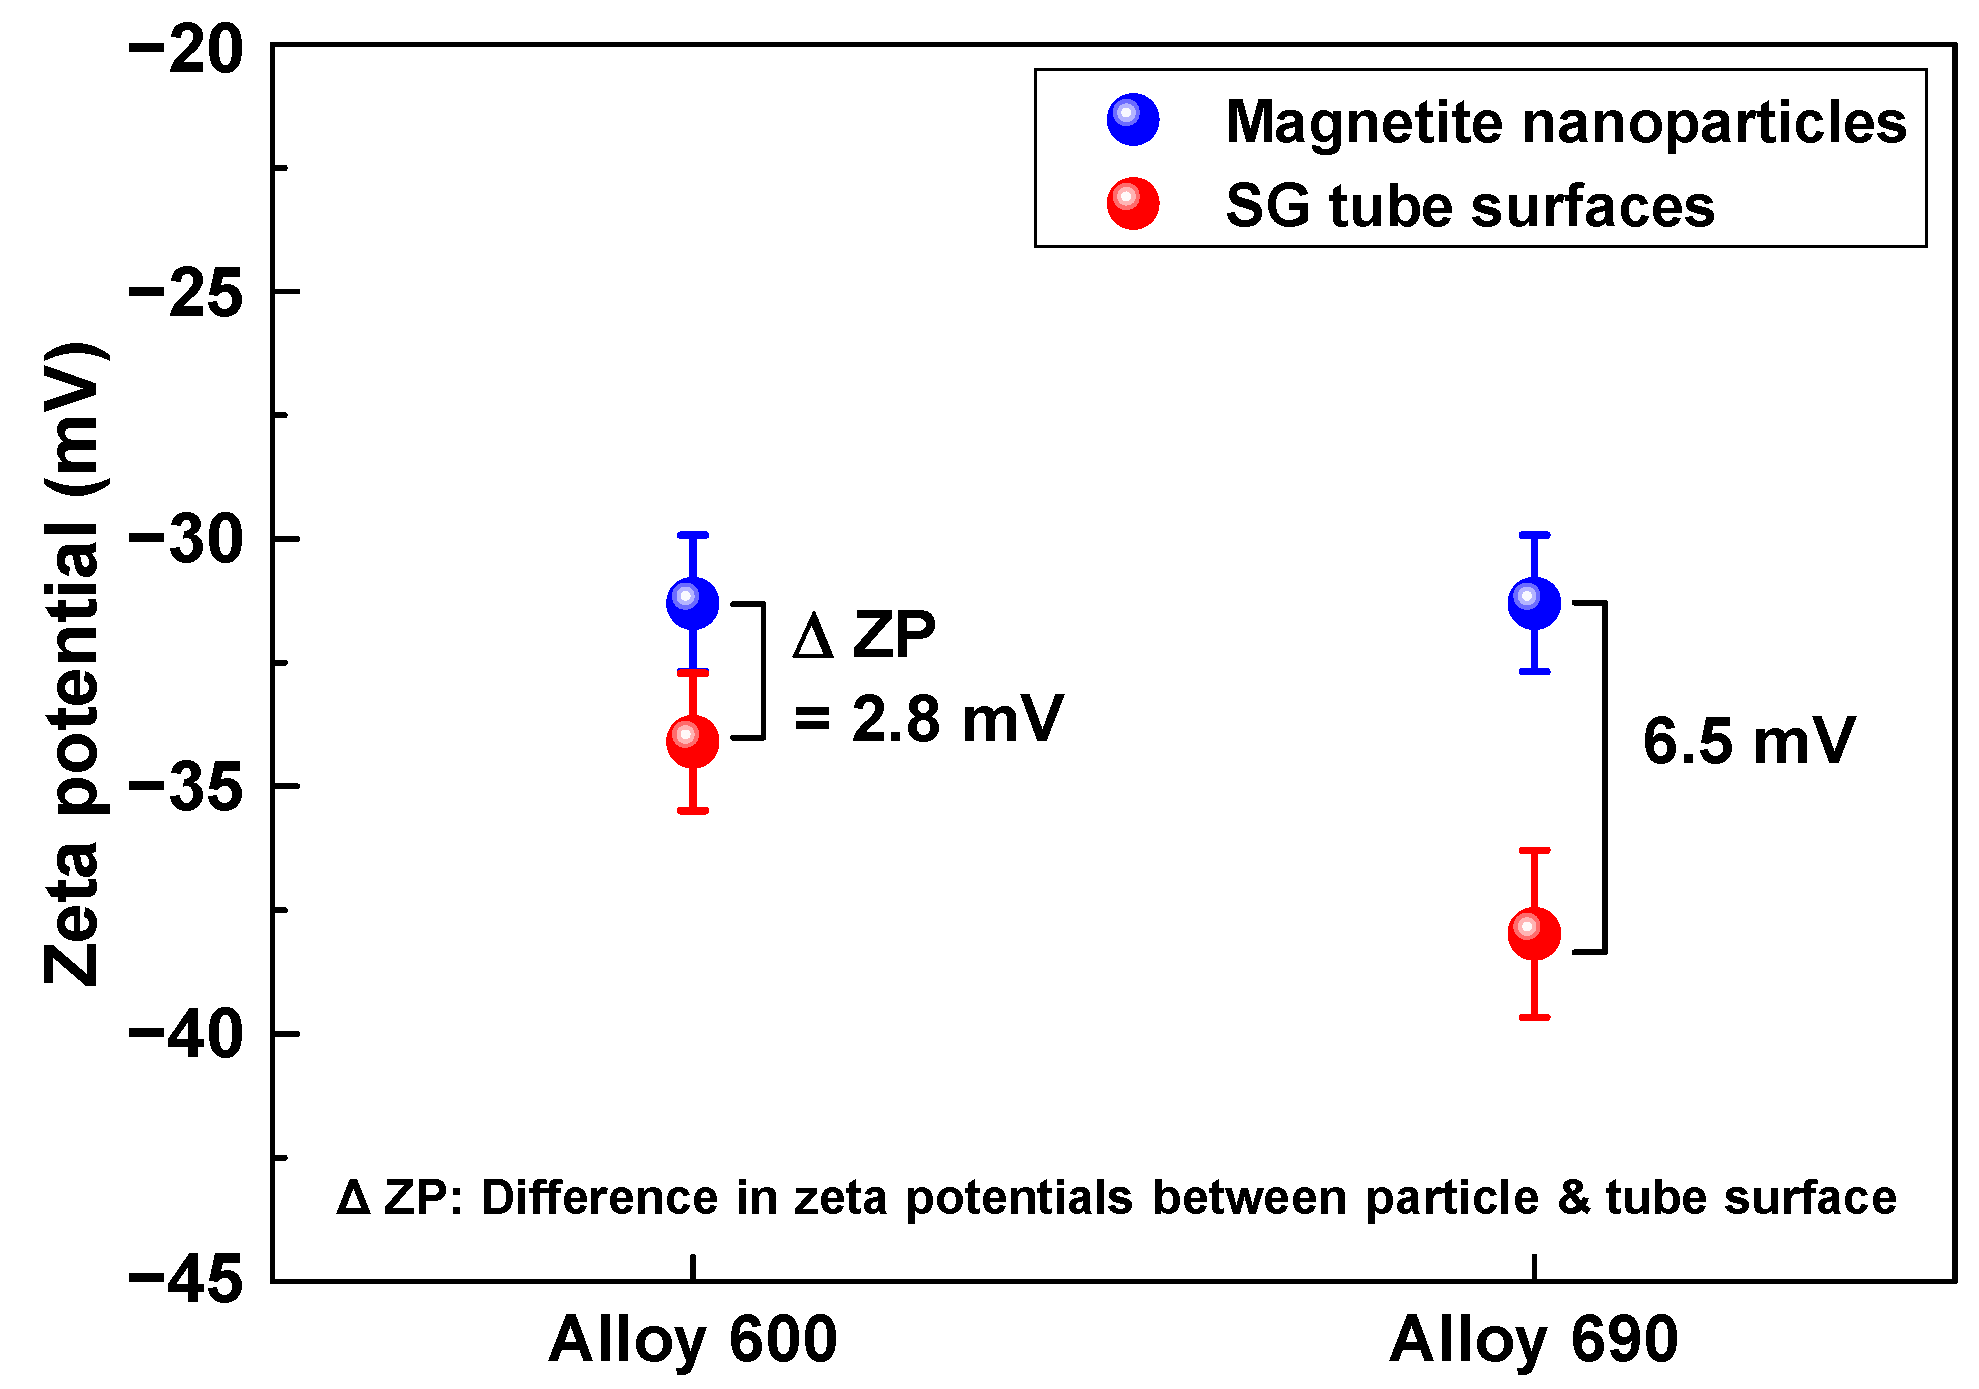
Figure 5 presents the zeta potential of magnetite particles and the surface zeta potentials of Alloy 600 and Alloy 690 flat specimens at 25 °C. The zeta potential of magnetite particles was measured to be −31.3 mV. The surface zeta potentials of Alloy 600 and Alloy 690 flat specimens were measured to be −34.2 and −37.8 mV, respectively. The development of surface electrostatic charge on magnetite particles and SG tubes in PWR secondary water could be attributed to surface hydration or dehydration according to the following chemical reactions [6]:
MOHSurf + H2O → MOSurf + H3O+ (hydration, negative surface charge)
MOHSurf + H3O+ → M(OH2)+ + H2O (dehydration, positive surface charge)
where M is a magnetite particle or the SG tube surface. Chemical reaction (R1) indicates that the surface hydration results in the formation of a negative surface charge. Reaction (R2) shows the dehydration results in the formation of a positive surface charge. The two chemical processes compete with each other, and, thus, the surface is actually covered by both positive and negative sites [6]. If more sites are negative, the material will have a net negative charge. However, the converse is true if more sites are positive. The net surface charge is called the zeta potential. In general, SG tube surfaces collect OH (hydroxyl) groups under PWR secondary conditions and are hence negatively charged and have a negative zeta potential [6].
Zeta potential is a measure of the electrostatic charge on suspended particles and on the SG tube surface. Particles with a zeta potential that is opposite in sign (+/− or −/+) to that of the tube surface will be attracted to the surface and are expected to deposit in the absence of other factors [41]. That is, where zeta potential signs are opposite, an attractive force exist between them. However, particles and tube surfaces with zeta potentials that have like signs (+/+ or −/−) will be repelled [41]. That is, where the zeta potential of a metal surface has the same sign as that of the particles, a repulsive force acts between the metal and the particles. Some researchers have presented that the number of particles deposited on a metal surface is strongly affected by the difference in the zeta potentials of the metal surfaces and particles [14,15,16,24].
In this study, the zeta potential of the magnetite nanoparticle and the surface zeta potentials of Alloy 600 and Alloy 690 were all negatively charged. This means that the repulsive force acts between them. The zeta potential difference between the Alloy 600 surface and particles was 2.8 mV, while the zeta potential difference between the Alloy 690 surface and particles was 6.5 mV. This indicates that the electrostatic repulsive force between the magnetite particles and the Alloy 600 tube surface is much smaller than that between the particles and the Alloy 690 tube surface. As the ΔZP becomes greater, more energy is required to attach the particles to the surfaces. Accordingly, it is expected that the amount of magnetite deposits on the Alloy 690 surface will decrease compared with that on Alloy 600.

3.2. Characterization of Deposits on SG Tubes after Deposition Tests

Figure 6 shows the surface morphologies of the deposits of two different SG tubes after the deposition tests. The deposit layer had a non-uniform surface appearance. A number of pores were also observed in the deposits, and their size ranged up to several tens of micrometers (Figure 6a,c). These pores were formed by bubble growth and are referred to as steam chimneys. The pores in the SG tube deposits could be separated into two types: fluid micro-pores and steam chimneys [6]. A fluid micro-pore is a small pore with a size of about 1 μm or less. A steam chimney is a large pore with a size of approximately 6 μm or more [6]. In particular, pores larger than about 10 μm could have a detrimental effect on the heat transfer capability of the tubes [6]. Furthermore, the large pores increase the concentration of impurities around the SG tube surface, which accelerates the SCC and localized corrosion [6,12]. As shown in Figure 6b,d, regardless of the SG tubing materials, the deposits consisted of numerous particles with a polyhedral and round shape. The polyhedral particles were about 0.3~2.0 μm in size, while the size of round particles ranged from several tens to hundreds of nanometers.
Figure 7 presents the analysis results of deposit particles on SG tubes obtained using an image analyzer. The aspect ratio of particles on Alloy 600 was slightly smaller than that on Alloy 690 (Figure 7a). The aspect ratio of the particles on both alloys was in a range from 1.01 to 1.12. This indicates that the deposit particles on both alloys had a roughly spherical shape. As shown in Figure 7b, the mean diameter of the particles on the Alloy 600 tube (about 0.403 μm) was relatively smaller than that of the Alloy 690 tube (about 0.474 μm). However, the distribution of the mean diameter of particles was almost the same. On the other hand, the particle size distribution is slightly different (Figure 7c). About 69% of the deposit particles on Alloy 600 were smaller than 0.35 µm. About 10% of the particles on Alloy 600 were larger than 0.95 µm. Meanwhile, in the case of the Alloy 690 specimen, about 51% of the deposit particles were smaller than 0.35 µm, and about 15% of the particles were larger than 0.95 µm.
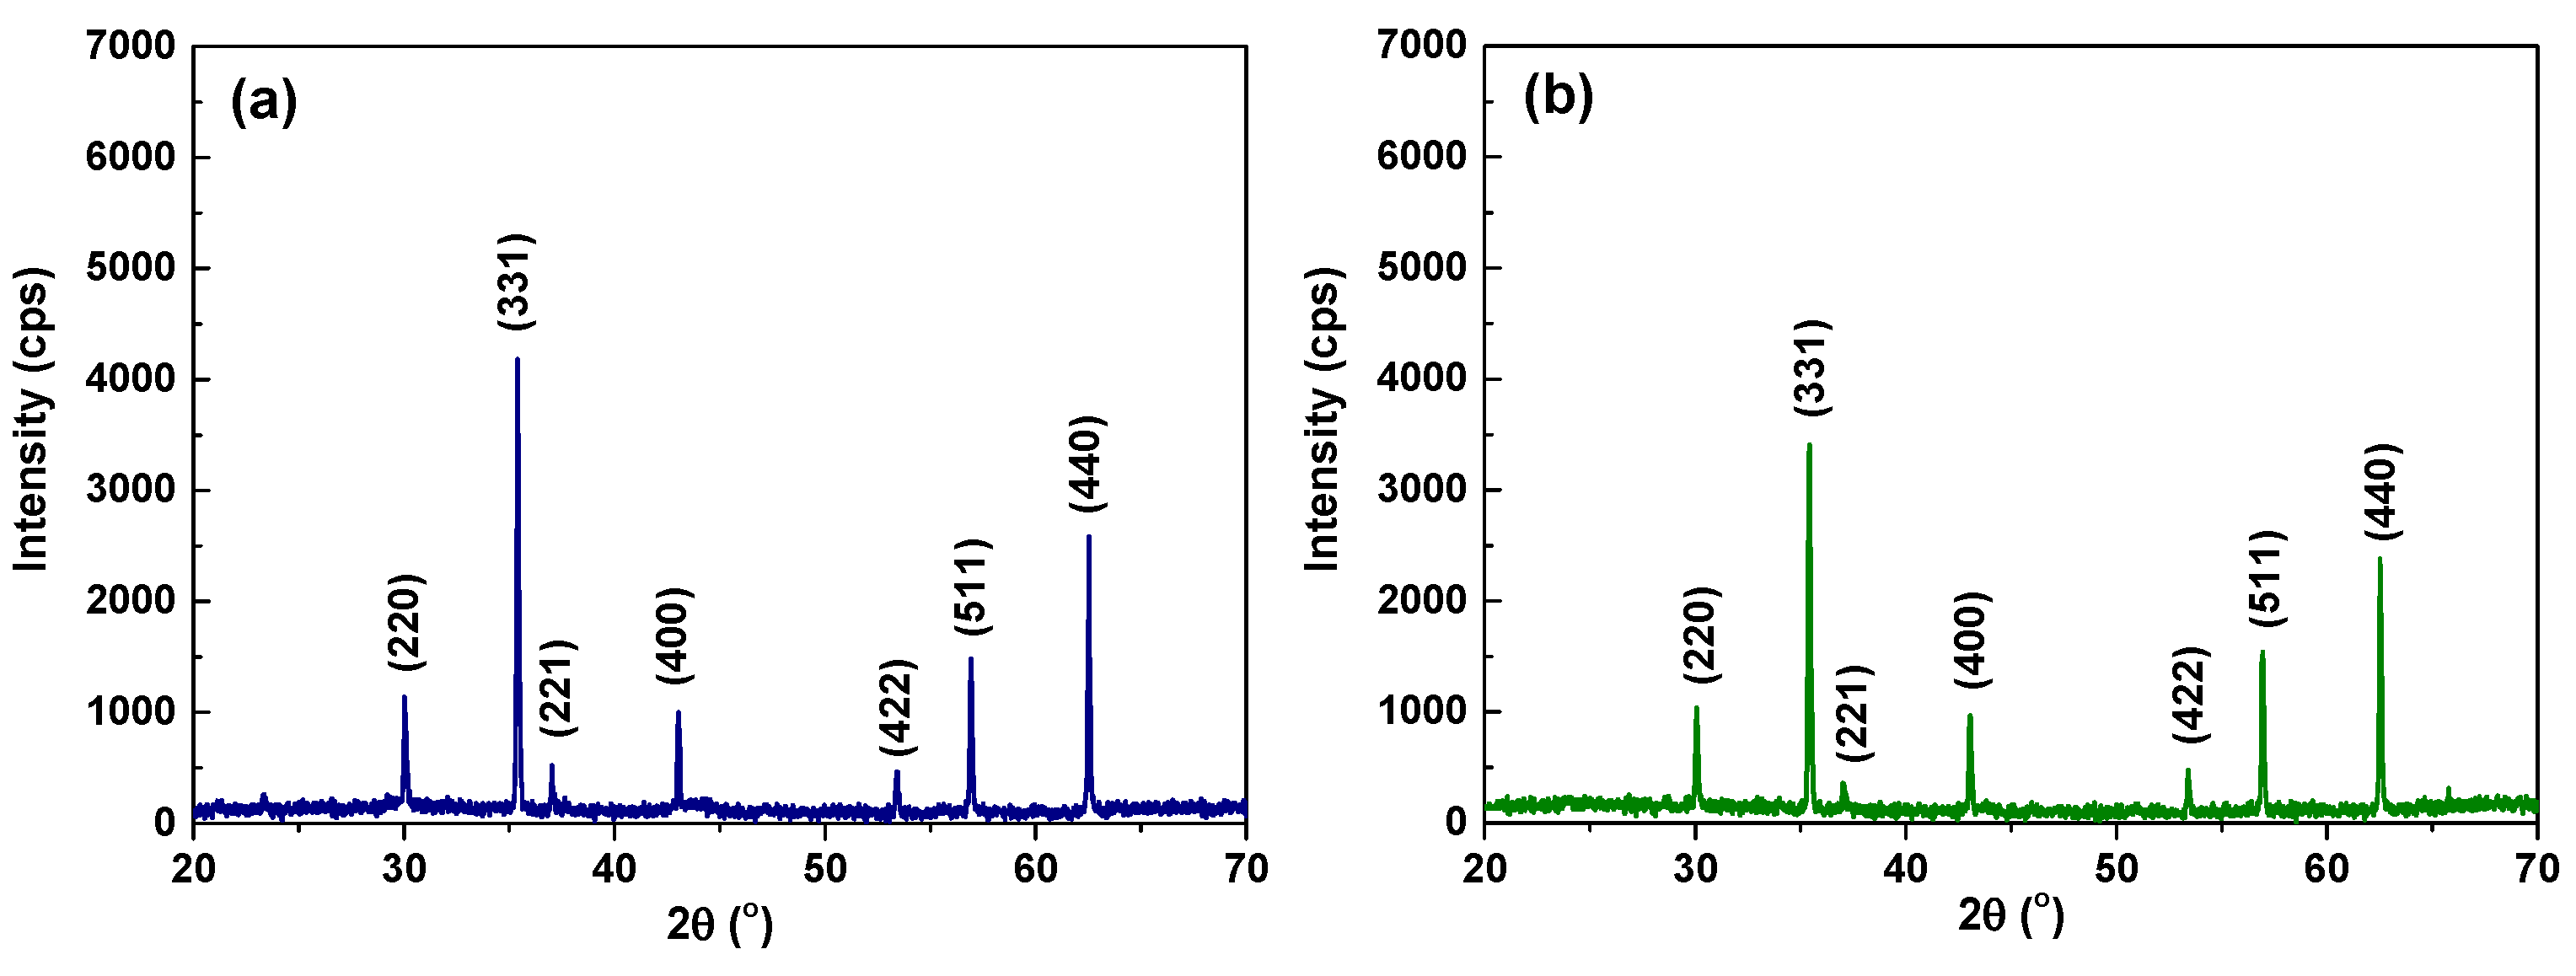
Figure 8 presents the XRD patterns of deposit particle on SG tubes. The XRD patterns of the particles deposited on both tubes closely matched that of pure magnetite (PDF No. 88-0866) with a crystalline structure.
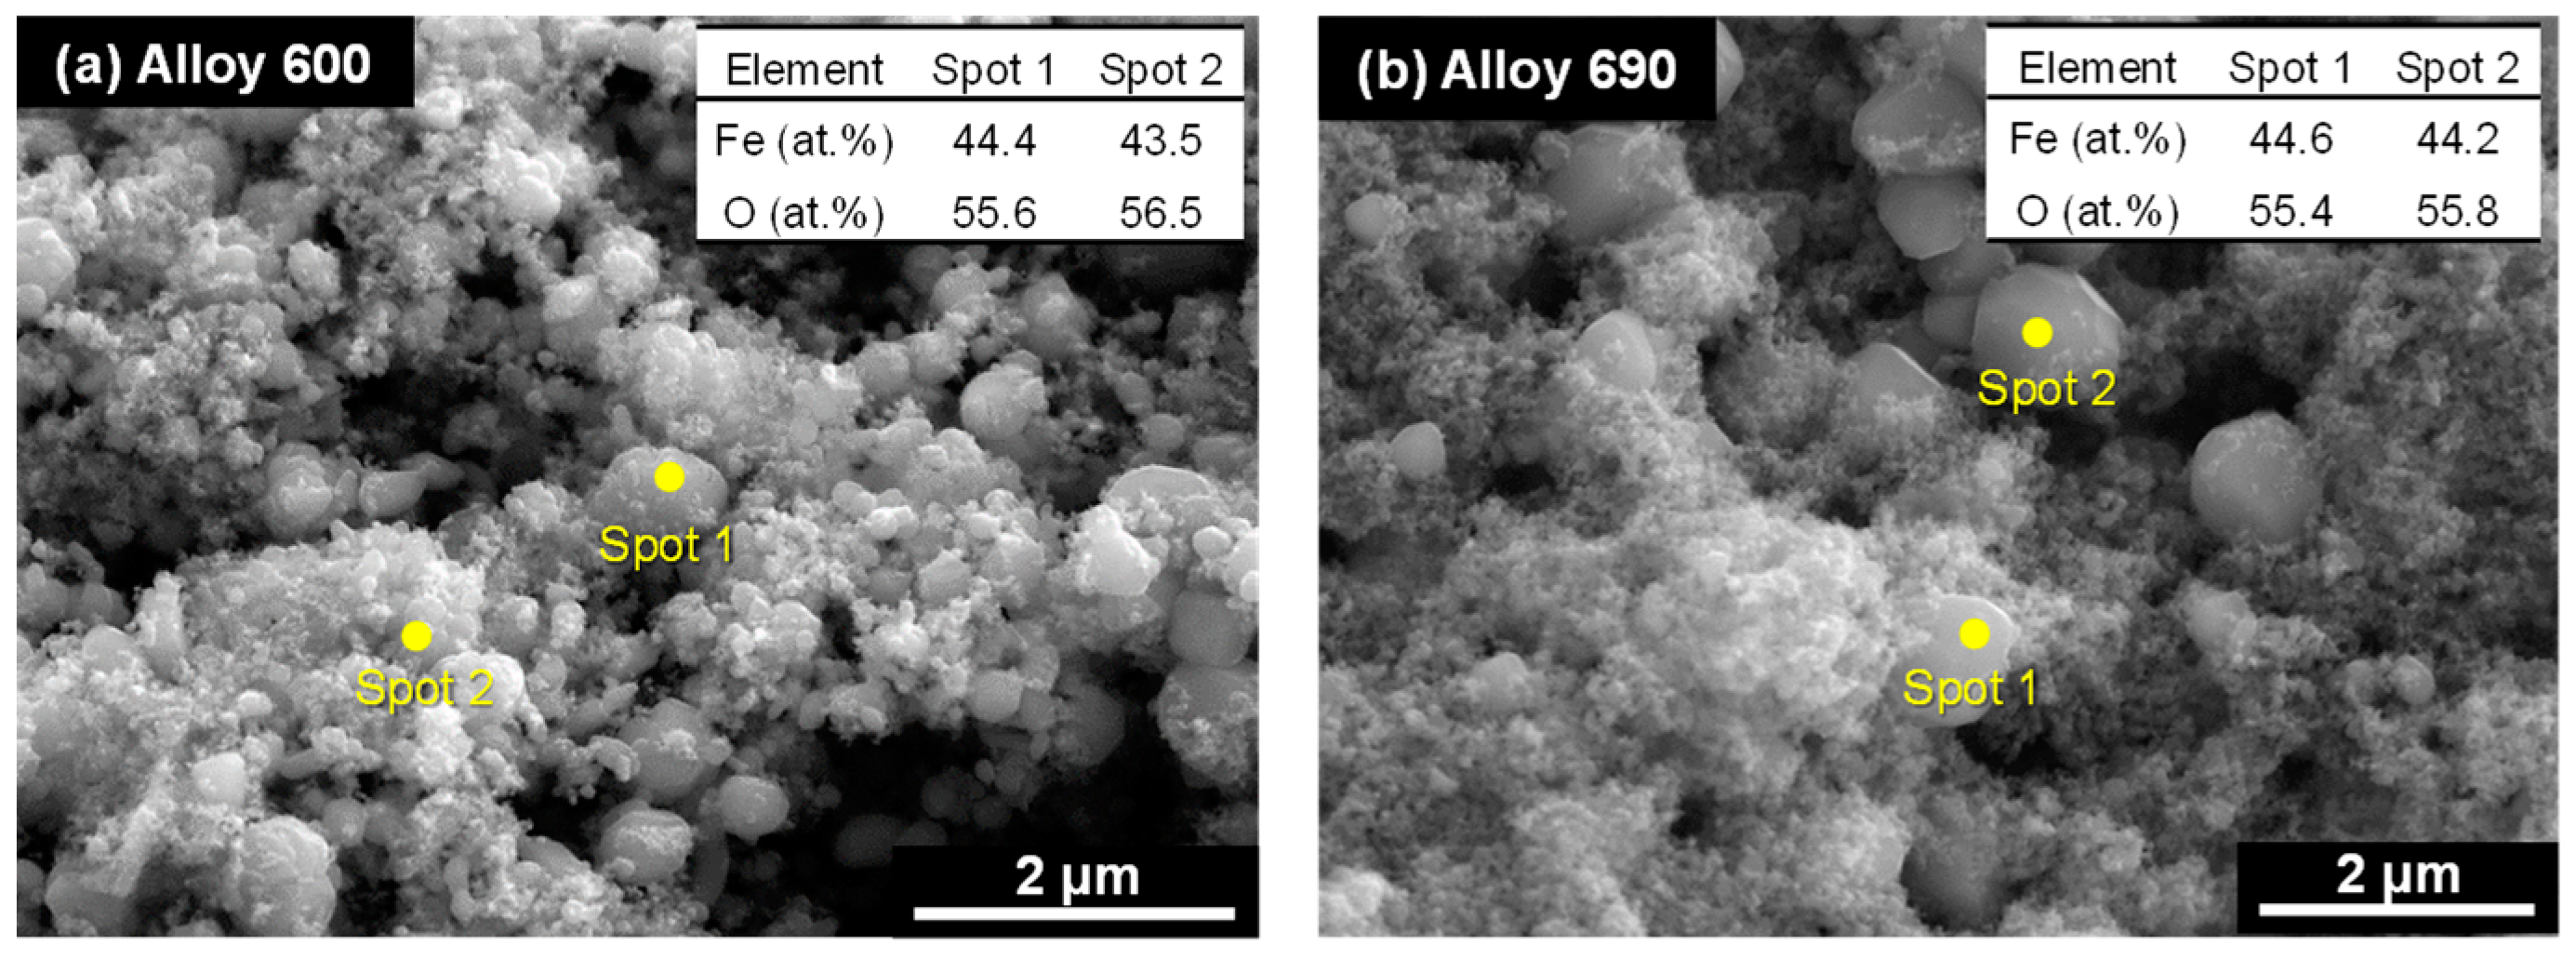
Figure 9 presents the typical chemical compositions of the deposit particles on SG tubes using SEM-EDS analysis. The results indicated that the particles were magnetite. The XRD and SEM-EDS results show that the deposit particles were identified as magnetite regardless of the SG tubing materials. In previous studies, the real SG tube deposits in operating PWRs mainly consist of approximately 90–95% magnetite with a polyhedral shape [5,6]. Therefore, the deposition tests in this study accurately simulated the composition as well as the morphology of actual deposits.
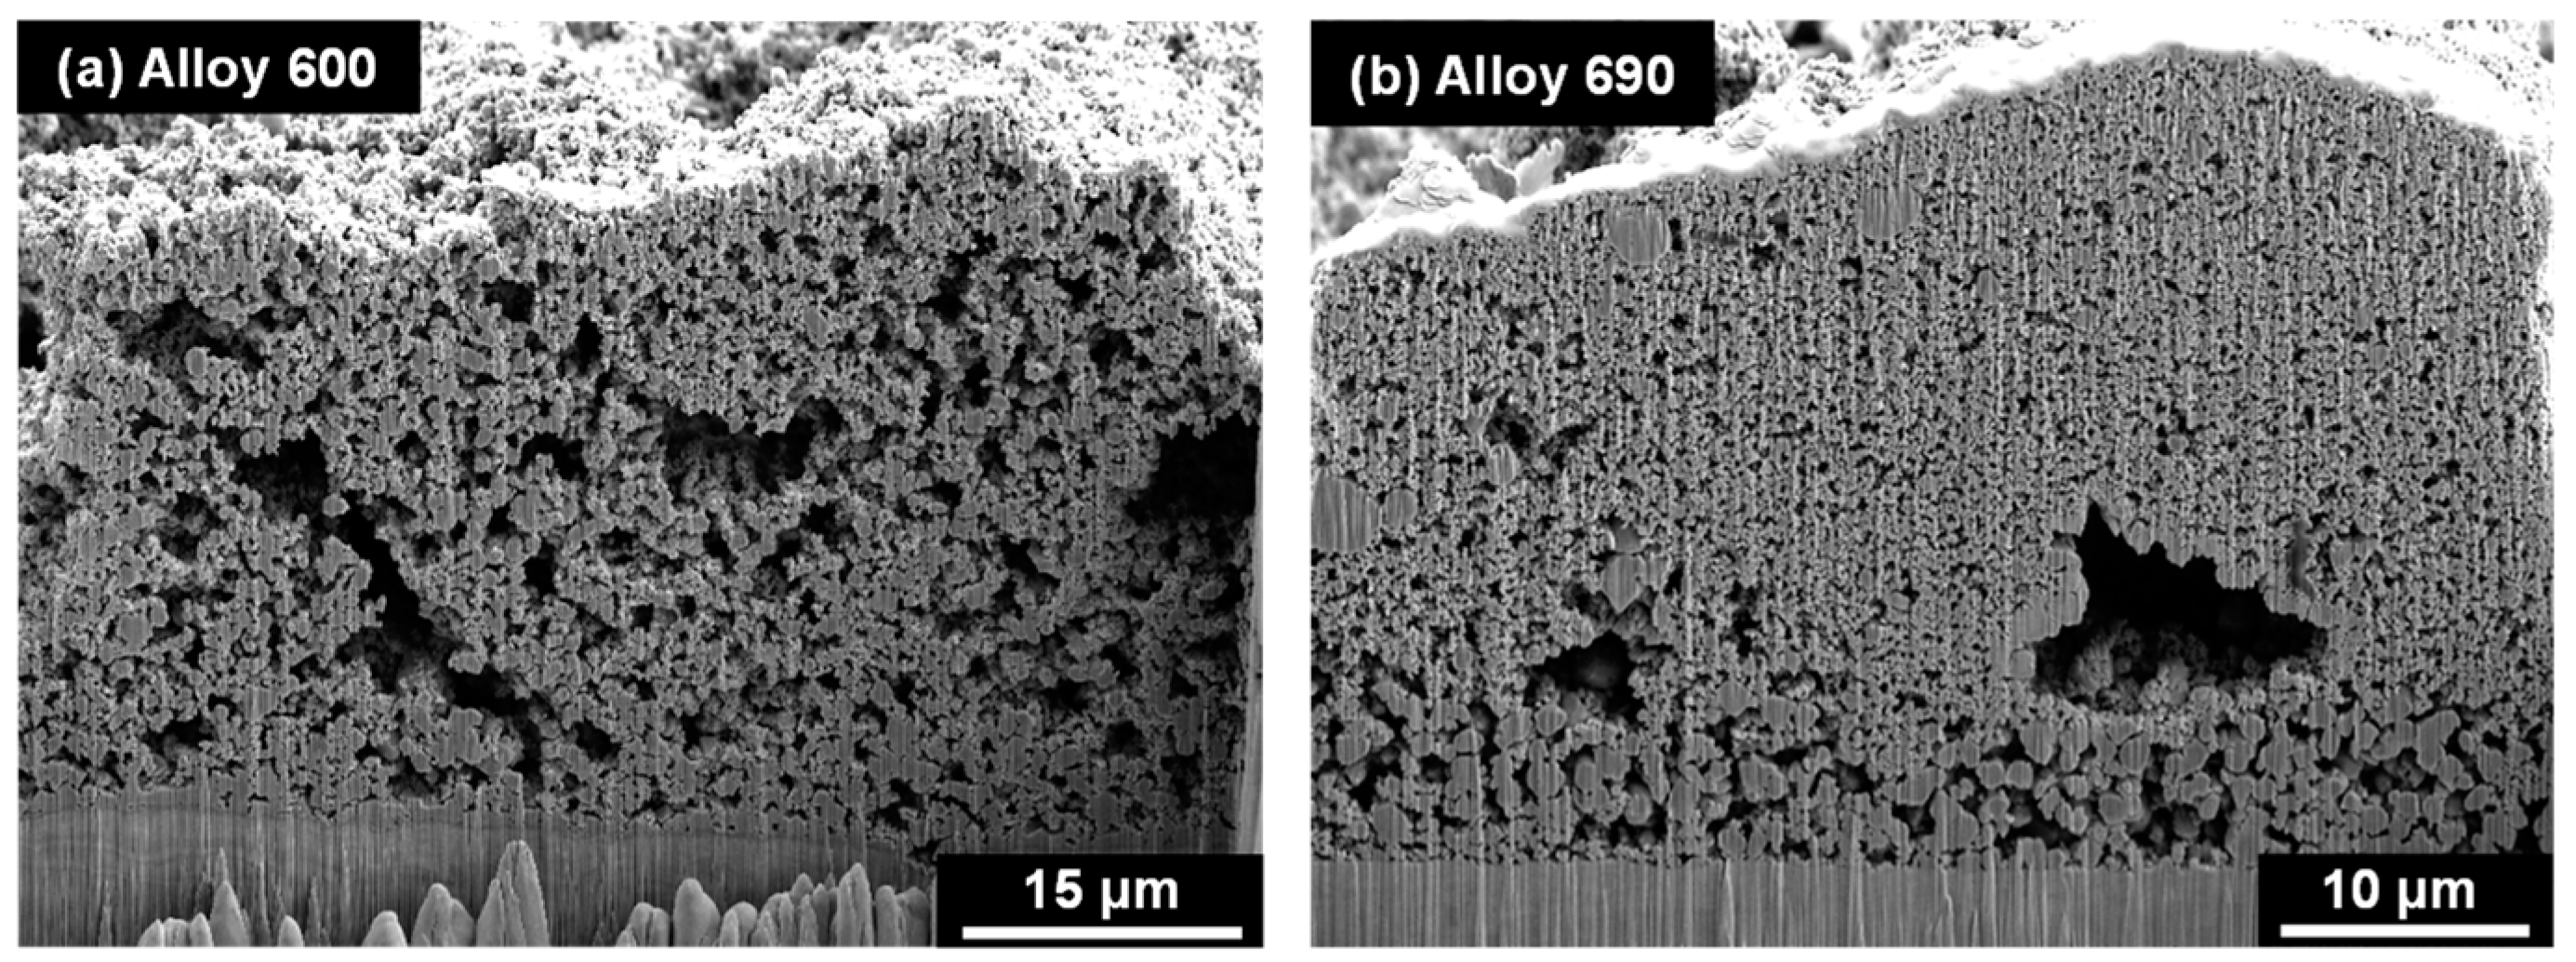
Figure 10 presents cross-sectional SEM images of magnetite deposits on SG tubes. Based on the results at three different locations, the thickness of the deposits on the Alloy 600 tube was approximately 35–50 μm. In contrast, the deposits on the Alloy 690 tube were much thinner—about 25–35 μm—than that on Alloy 600. However, as seen in Figure 6 and Figure 10, the thickness of the deposit layer is not uniform over the tube surface. Hence, the amount of deposits on SG tubes should be evaluated by using ICP-OES. A large number of pores existed within the deposits, as expected from Figure 6. It appears that the deposits on Alloy 600 are more porous than those on Alloy 690.
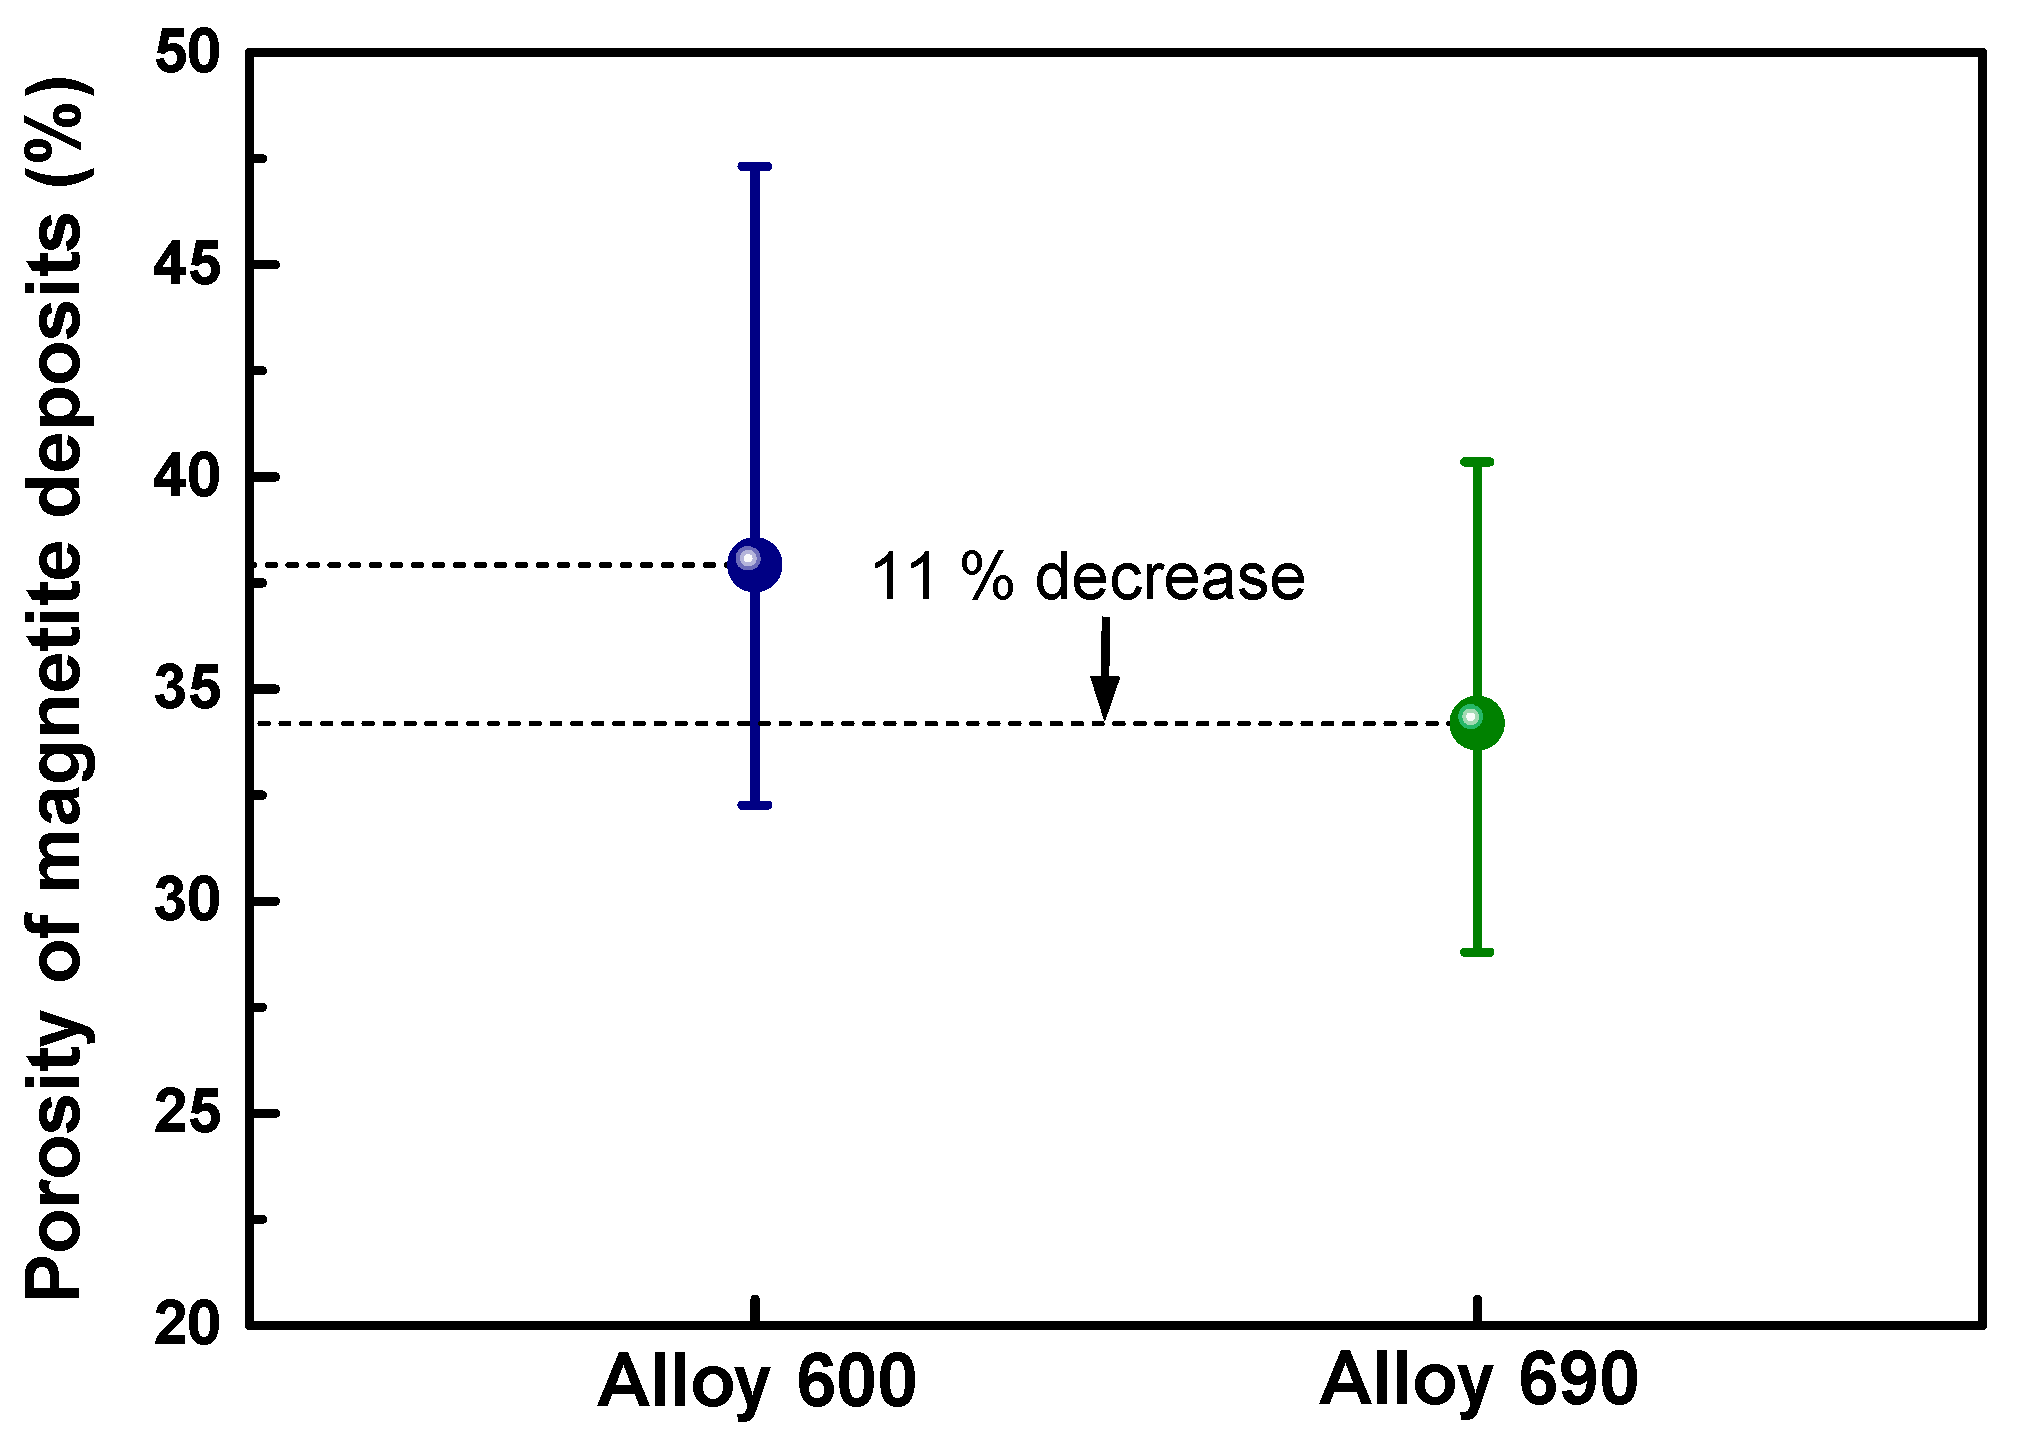
Figure 11 presents the porosity of the magnetite deposits on both of the SG tubes determined. The average porosity of the deposits on Alloy 600 and Alloy 690 was 37.9% and 34.1%, respectively. The larger the porosity of a material is, the lower its heat transfer capability will be [42]. Based on these results, the heat transfer efficiency of an Alloy 600 tube will be lower than that of an Alloy 690 tube if the amount of magnetite deposits on both tubes is equal. Furthermore, the pores act as local sites where aggressive impurities are concentrated [6,12]. The concentrated impurities inside the pores can negatively affect the SG tube integrity. Cl and S in the pores of deposits on the SG tube surface cause localized corrosion, chloride-induced SCC, and sulfur-induced corrosion [43,44]. In addition, metallic Cu and Pb particles concentrated in the pores act as a cathode in a galvanic cell with the SG tube, thereby increasing the corrosion rate of the anodic SG tube [12]. Therefore, in terms of the SG integrity, according to the porosity of the deposits, Alloy 690 is more advantageous than Alloy 600.

3.3. Amount of Magnetite Deposits

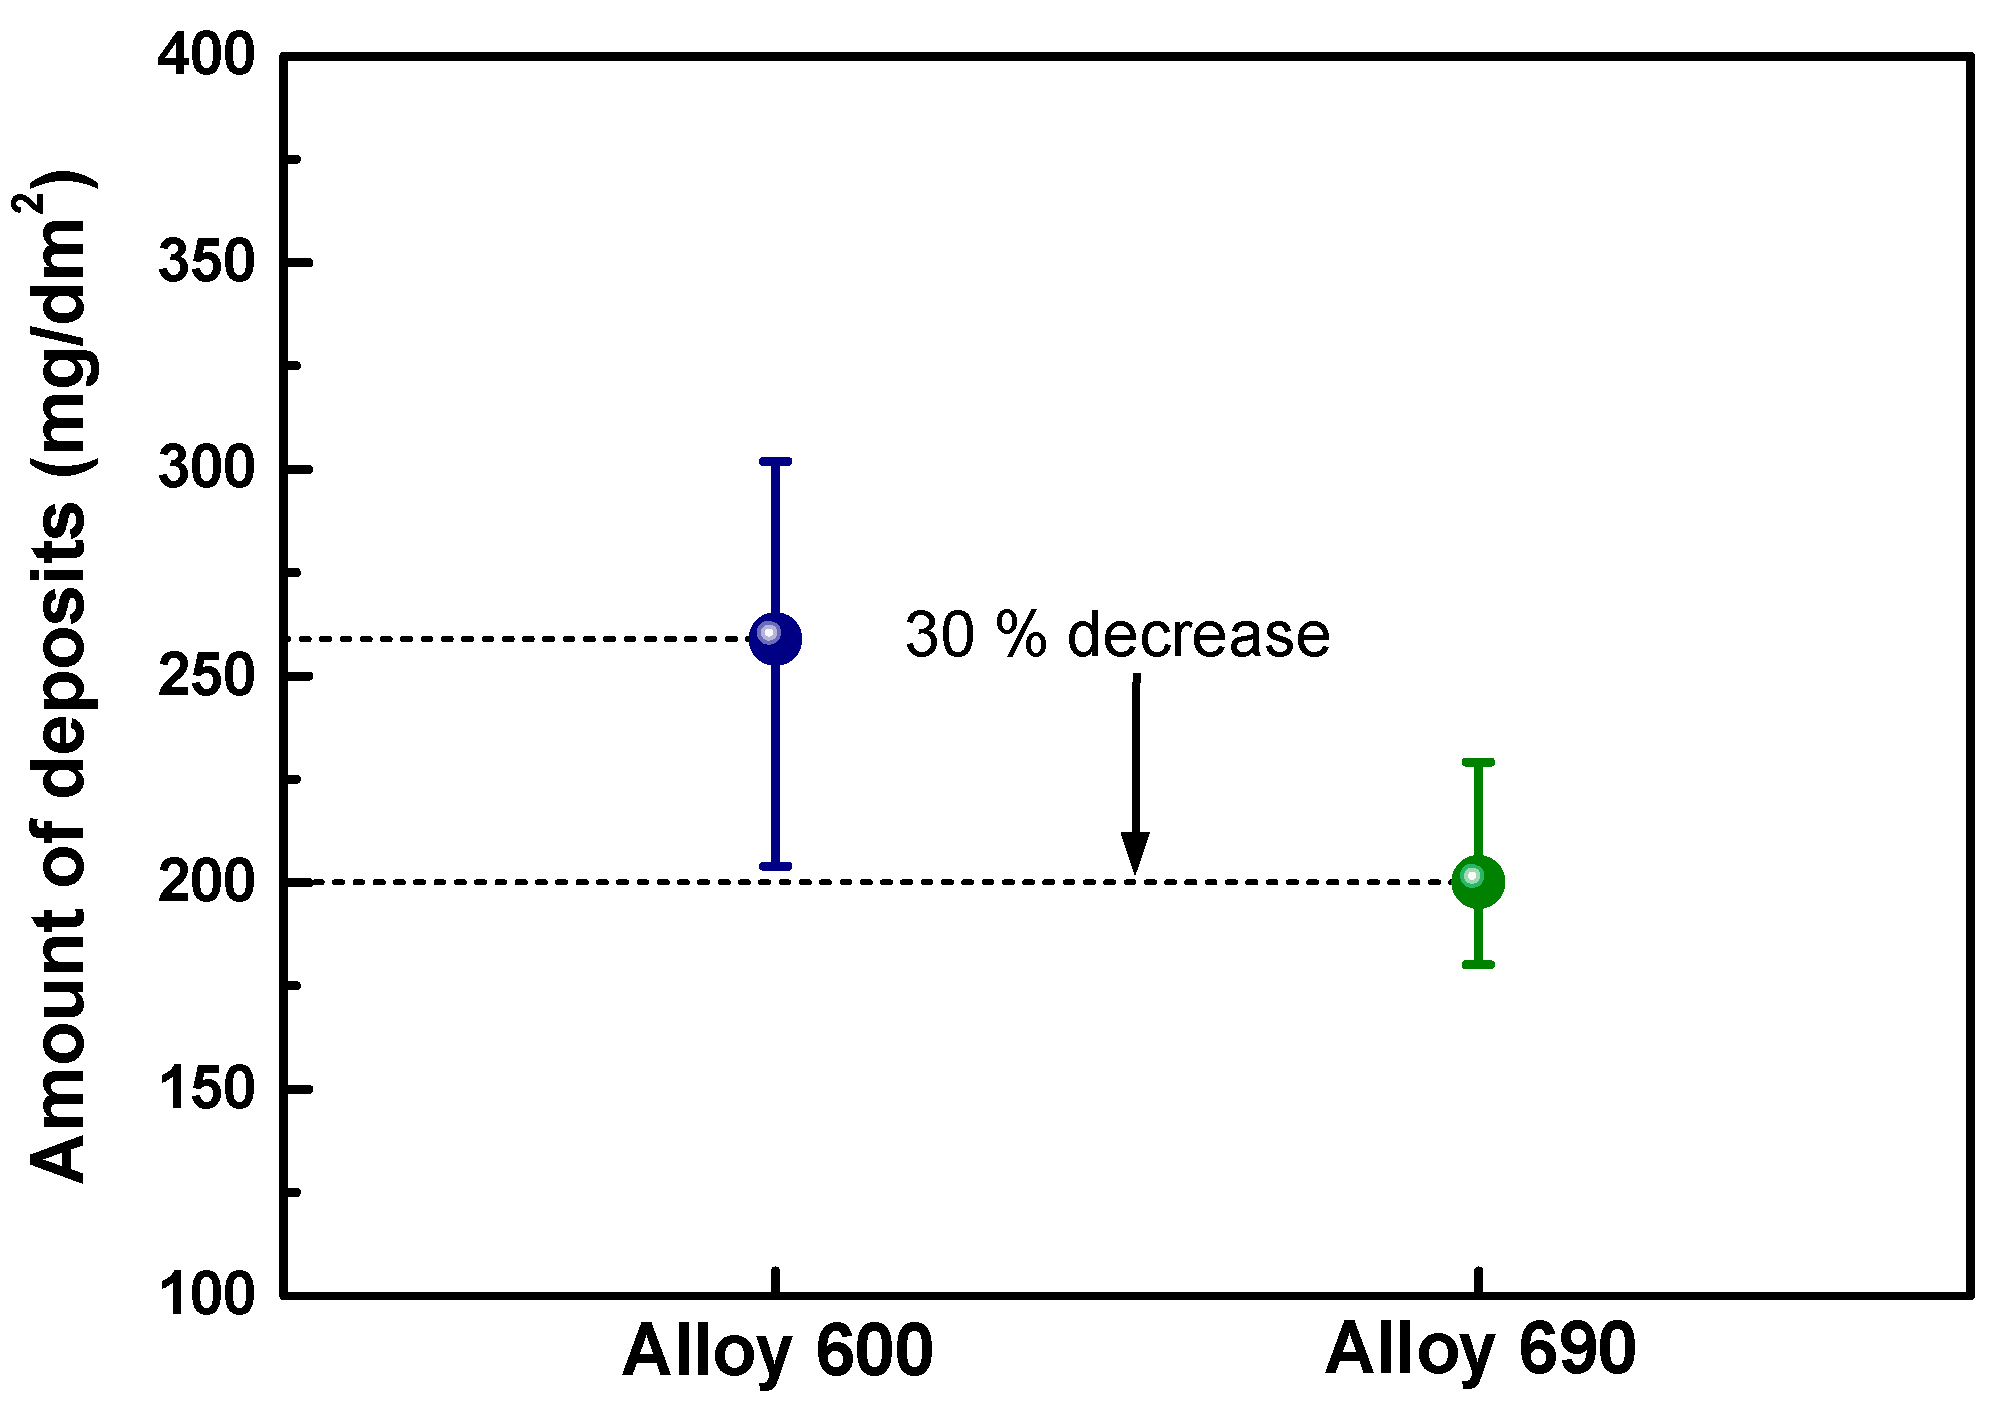
Figure 12 shows the amount of magnetite deposits on two different SG tubes. The amount of deposits on the Alloy 600 and Alloy 690 tubes was about 259.3 mg/dm2 and 200.1 mg/dm2, respectively. The amount of deposits on the Alloy 600 tube increased by approximately 30% compared to that of the Alloy 690 tube. This indicates that the magnetite deposition behavior was significantly affected by the SG tubing materials.

4. Discussion

In previous research, some parameters affecting the deposition of colloid particles on metal surface have been reported. The parameters include thermal hydraulic conditions (temperature, pressure, heat flux, velocity), water chemistry conditions (pH value, pH agent, DO), factors related to the particles (size, concentration, zeta potential, solubility), and surface characteristics (surface zeta potential, wettability, surface roughness) [6,14,15,16,45].
In this study, the mechanism underlying the difference in magnetite deposition behavior between Alloy 600 and Alloy 690 SG tubes is discussed with the degree of SNB and the zeta potential because the other factors were carefully controlled to be the same during the tests. SNB behavior occurs when the bulk liquid temperature is maintained below the saturation temperature and the metal surface temperature is higher than the saturation temperature. Under the SNB condition in PWRs, the deposition model of magnetite deposits on the heat transfer surface could be explained in four steps [46]: (step 1) vapor bubbles grow; (step 2) the magnetite particles suspended in the water adhere to the interface between the vapor bubbles and the water; (step 3) the magnetite particles are moved into the micro-layer evaporation area beneath the bubbles; and (step 4) evaporation into the bubbles removes the water from the magnetite particles. Finally, the particles could agglomerate to form magnetite deposits by electrostatic or Van Der Waals forces [46]. These repetitive processes could increase the amount of magnetite deposits on the SG tube.
As discussed earlier, the surface roughness and wettability of the Alloy 600 and 690 tubes were nearly the same; therefore, they would not affect the SNB and the deposition behavior on the surfaces of both SG tubes in this work. The nucleation site density of vapor bubbles increased with increasing surface temperature or with increasing heat flux [47,48,49,50]. In this study, all the results were obtained under the same conditions, except for the use of two different SG tubing materials. Therefore, it is clear that any changes in the results including the SNB behavior originated from the different SG tubing materials. During all the deposition tests, the temperature of the cartridge heater and flowing water around the SG tube was maintained at 308 and 270 °C, respectively. However, the surface temperature of the Alloy 600 tube will be higher than that of Alloy 690 because Alloy 600 has a 10% higher thermal conductivity than Alloy 690 [51,52]. Accordingly, the degree of SNB on the surface of Alloy 600 will enhance compared to that on Alloy 690. It is expected that the amount of deposits on the Alloy 600 tube will increase.
The particle deposition on the metal surface is greatly dependent on the electrostatic force between the particles and metal surface [45,53]. As shown in Figure 5, the zeta potential of magnetite particles and the surface zeta potentials of both SG tubes are all negatively charged, and, thus, there is a repulsive force between the particles and the SG tube surface. In the initial deposition process, the zeta potential difference between the particles and the SG tube surface acts as the electrostatic force. The repulsive force between the particles and the SG tube surface is much smaller for the Alloy 600 tube (2.9 mV) than for the Alloy 690 tube (6.5 mV). Therefore, the amount of magnetite deposits in the Alloy 600 will be increased. As the bare tube surface is covered with magnetite deposits, the effect of the surface zeta potential of SG tubes on the magnetite deposition would be decreased. Once the SG tube surface was entirely covered with the first magnetite deposit layer, the zeta potential of the SG tube surface would no longer affect the subsequent magnetite deposition. In this deposition process, the electrostatic force between the already deposited magnetite layer and the particles in water would then be a main parameter in the growth of deposits.

5. Conclusions

(1) Deposits on both the Alloy 600 and Alloy 690 tubes were composed of magnetite particles with a large polyhedral shape of about 0.3~2.0 μm and a small round shape of several tens to hundreds of nanometers. The average porosity of the deposits on the Alloy 600 and Alloy 690 tubes was 37.9% and 34.1%, respectively.
(2) The amount of magnetite deposits on the Alloy 600 tube increased by approximately 30% compared to those on the Alloy 690 tube. This is because the difference in the zeta potentials between the magnetite particles and the bare surface of the Alloy 600 tube is only half of that of the Alloy 690 tube, resulting in a smaller electrostatic repulsive force in the deposition of magnetite particles in the early stage of deposition. In addition, the increase in the deposit mass on Alloy 600 is attributed to an increased SNB due to the relatively high thermal conductivity of Alloy 600.
(3) The surface roughness and wettability of both SG tubes were almost the same: 0.21 μm and 79.3° ± 1° for Alloy 600 and 0.20 μm and 79.5° ± 2° for Alloy 690, respectively. Therefore, it is confirmed that the deposition behavior on the tubes was not affected by these two factors.
(4) Magnetite deposition tests revealed that Alloy 690 SG tubing is more resistant to fouling compared to Alloy 600 tubing. Therefore, it is expected that thermal performance degradation due to fouling is mitigated in SGs equipped with Alloy 690 tubing.

Author Contributions

Study design, S.-H.J.; methodology, S.-H.J.; analysis, Y.-B.L. and K.-H.L.; writing—original draft, S.-H.J.; writing—review and editing, S.-H.J. and D.-H.H.; supervision, S.-H.J. All authors have read and agreed to the published version of the manuscript.

Funding

This work was supported by the National Research Foundation of Korea (NRF) grant funded by the Korean government (NRF-2021M2E4A1037979 and RS-2022-00143316).

Institutional Review Board Statement

Not applicable.

Informed Consent Statement

Not applicable.

Data Availability Statement

Not applicable.

Conflicts of Interest

The authors declare no conflict of interest.

References

  1. Prince, A.A.M.; Velmurugan, S.; Narasimhan, S.V.; Ramesh, C.; Murugesan, N.; Raghavan, P.S.; Gopalan, R.J. Dissolution behaviour of magnetite film formed over carbon steel in dilute organic acid media. J. Nucl. Mater. 2001, 289, 281–290. [Google Scholar] [CrossRef]
  2. Ramesh, C.; Murugesan, N.; Prince, A.A.M.; Velmurugan, S.; Narasimhan, S.V.; Ganesan, V. Applied of polymer electrolyte based hydrogen sensor to study corrosion of carbon steel in acid medium. Corros. Sci. 2001, 43, 1865–1875. [Google Scholar] [CrossRef]
  3. Varrin, R.D., Jr. Deposit Accumulation in PWR Steam Generators. In Steam Generators for Nuclear Power Plants; Woodhead Publishing: Cambridge, UK, 2017; Chapter 11; pp. 323–363. [Google Scholar]
  4. Turner, C.W.; Khumsa-Ang, K. Corrosion Product Transport and Fouling in Nuclear Steam Generators. In Steam Generators for Nuclear Power Plants; Woodhead Publishing: Cambridge, UK, 2017; Chapter 9; pp. 215–271. [Google Scholar]
  5. Jeon, S.-H.; Hong, S.; Kwon, H.-C.; Hur, D.H. Characteristics of steam generator tube deposits in an operating pressurized water reactor. J. Nucl. Mater. 2018, 507, 371–380. [Google Scholar] [CrossRef]
  6. Varrin, R.D., Jr. Characterization of PWR Steam Generator Deposits; EPRI Report TR-106048; EPRI: Palo Alto, CA, USA, 1996. [Google Scholar]
  7. Klimas, S.J.; Miller, D.G.; Semmler, J.; Turner, C.W. The effect of the removal of steam generator tube ID deposits on heat transfer. In Proceedings of the 3th International Heat Exchanger and Steam Generator Conference, AECL, Toronto, ON, Canada, 21–24 June 1998; p. 11985. [Google Scholar]
  8. Turner, C.W.; Klimas, S.J.; Brideau, M.G. Thermal resistance of steam-generator tube deposits under single-phase forced convection and flow-boiling heat transfer. Can. J. Chem. Eng. 2000, 78, 53–60. [Google Scholar] [CrossRef]
  9. Gonzalez, F.; Spekkens, P. Corrosion of Inconel 600 under steam generator sludge piles. In Proceedings of the 4th International Symposium on Environmental Degradation of Materials in Nuclear Power Systems-Water Reactors, Jekyll Island, GA, USA, 6–10 August 1989; pp. 6–10. [Google Scholar]
  10. Paine, J.P.N.; Hobart, S.A.; Sawochka, S.G. Predicting steam generator crevice chemistry. In Proceedings of the 5th International Symposium on Environmental Degradation of Materials in Nuclear Power Systems-Water Reactors, Monterey, CA, USA, 25–29 August 1991; pp. 739–744. [Google Scholar]
  11. Millet, P.J.; Fenton, J.M. A detailed model of localized concentration processes in porous deposits of SGs. In Proceedings of the 5th International Symposium on Environmental Degradation of Materials in Nuclear Power Systems-Water Reactors, Monterey, CA, USA, 25–29 August 1991; pp. 745–751. [Google Scholar]
  12. Jeon, S.-H.; Song, G.D.; Hur, D.H. Micro-galvanic corrosion of steam generator materials within pores of magnetite flakes in alkaline solutions. Metals 2018, 8, 899. [Google Scholar] [CrossRef] [Green Version]
  13. Yang, G.; Pointeau, E.; Tevissen, E.; Chagnes, A. A review on clogging of recirculating steam generators in pressurized-water reactors. Prog. Nucl. Energy 2017, 97, 182–196. [Google Scholar] [CrossRef] [Green Version]
  14. Lee, J.-M.; Jeon, S.-H.; Kim, K.-S.; Han, J.O.; Hur, D.H. Effects of pH control agents on magnetite deposition on steam generator tubes. Ann. Nucl. Energy 2020, 143, 729. [Google Scholar] [CrossRef]
  15. Lee, Y.-B.; Lee, J.-M.; Hur, D.H.; Lee, J.-H.; Jeon, S.-H. Effects of advanced amines on magnetite deposition of steam generator tubes in secondary system. Coatings 2021, 11, 514. [Google Scholar] [CrossRef]
  16. Lee, J.-M.; Jeon, S.-H.; Han, J.O.; Hur, D.H. Effects of NaCl on magnetite deposition on the outer surfaces of steam generator tubes. Ann. Nucl. Energy 2021, 151, 107886. [Google Scholar] [CrossRef]
  17. Wolfe, R. Steam Generator Management Program: Steam Generator Deposit Characterization Sourcebook; EPRI Report TR-3002002794; EPRI: Palo Alto, CA, USA, 2014. [Google Scholar]
  18. ISO 4287; Geometrical Product Specifications (GPS)-Surface Texture: Profile Method-Terms, Definitions and Surface Texture Parameters. International Organization for Standardization (ISO): Geneva, Switzerland, 1997.
  19. ISO 11562; Geometrical Product Specifications (GPS)-Surface Texture: Profile Method-Metrological Characteristics of Phase Correct Filters. International Organization for Standardization (ISO): Geneva, Switzerland, 1996.
  20. Kaszuba, M.; Corbett, J.; Watson, F.M.; Jones, A. High-concentration zeta potential measurements using light-scattering techniques. Philos. Trans. R. Soc. A 2010, 368, 4439–4451. [Google Scholar] [CrossRef] [Green Version]
  21. Levitin, E.Y.; Kokodiy, N.G.; Timanjuk, V.A.; Vedernikova, I.O.; Chan, T.M. Measurement of the size and refractive index of Fe3O4 nanoparticles. Inorg. Meter. 2014, 50, 817–820. [Google Scholar] [CrossRef]
  22. Tang, L.; Casas, J.; Venkataramasubramani, M. Magnetic nanoparticle mediated enhancement of localized surface plasmon resonance for ultrasensitive bioanalytical assay in human blood plasma. Anal. Chem. 2013, 85, 1431–1439. [Google Scholar] [CrossRef] [PubMed] [Green Version]
  23. Dudchenko, N.; Pawar, S.; Perelshtein, I.; Fixler, D. Magnetite nanoparticles: Synthesis and application in optics and nanoparticles. Materials 2022, 15, 2601. [Google Scholar] [CrossRef] [PubMed]
  24. Shim, H.-S.; Park, M.-S.; Baek, S.H.; Hur, D.H. Effect of aluminum oxide coated on fuel cladding surface on crud deposition in simulated PWR primary water. Ann. Nucl. Energy 2018, 121, 607–614. [Google Scholar] [CrossRef]
  25. Fruzzetti, K. Pressurized Water Reactor Secondary Water Chemistry Guidelines-Revision 8; EPRI Report 3002010645; EPRI: Palo Alto, CA, USA, 2017. [Google Scholar]
  26. Wolfe, R. Steam Generator Management Program: Steam Generator Deposit Removal Strategies Sourcebook; EPRI TR-30020050902015; EPRI: Palo Alto, CA, USA, 2015. [Google Scholar]
  27. Helyer, M.L.; Glaves, C.L. Chemical Cleaning of PWR Steam Generator Sludge Piles; NP-4708; EPRI: Palo Alto, CA, USA, 1986. [Google Scholar]
  28. Forch, H.; Oliver, T.; Hertle, W. Chemical cleaning of PWR steam generators with a low temperature process. Nucl. Eng. Des. 1993, 147, 115–118. [Google Scholar] [CrossRef]
  29. Puzzuoli, F.V.; Leinonen, P.J.; Lowe, G.A.; Murchie, B. Steam generator cleaning campaigns at Bruce A: 1993–1996. In Proceedings of the 4th International Conference on CANDU Maintenance, Toronto, ON, Canada, 16–18 November 1997. [Google Scholar]
  30. Lee, H.C.; Sung, K.B. Analysis of Chemical cleaning for the Top of Tubesheet of NPP’s steam generator. J. Korean Acad.—Ind. Coop. Soc. 2013, 14, 2043–2048. [Google Scholar]
  31. Han, J.; Kim, S.J.; Lee, Y.K.; Hur, D.H. Chemical cleaning of magnetite deposits on the flow mini-channels of printed circuit heat exchanger in an EDTA-based solution. Materials 2022, 15, 1471. [Google Scholar] [CrossRef]
  32. Jone, B.J.; McHale, J.P.; Garimella, S.V. The influence of surface roughness on nucleate pool boiling heat transfer. J. Heat Transf. 2009, 131, 121009. [Google Scholar] [CrossRef] [Green Version]
  33. McHale, J.P.; Garimella, S.V. Bubble nucleation characteristics in pool boiling of a wetting liquid on smooth and rough surfaces. Int. J. Multiph. Flow 2010, 36, 249–260. [Google Scholar] [CrossRef] [Green Version]
  34. Alam, T.; Lee, P.S.; Yap, C.R. Effects of surface roughness on flow boiling in silicon microgap heat sinks. Int. J. Heat Mass Transf. 2013, 64, 28–41. [Google Scholar] [CrossRef]
  35. Cheedarala, R.K.; Park, E.; Kong, K.; Park, Y.B.; Park, H.W. Experimental study on critical heat flux of highly efficient soft hydrophilic CuO-chitosan nanofluid templates. Int. J. Heat Mass Transf. 2016, 100, 396–406. [Google Scholar] [CrossRef]
  36. Harada, T.; Nagakura, H.; Okawa, T. Dependence of bubble behavior in subcooled boiling on surface wettability. Nucl. Eng. Des. 2010, 240, 3949–3955. [Google Scholar] [CrossRef]
  37. Yang, L.X.; Chao, Y.M.; Jia, L.; Li, C.B. Wettability and boiling heat transfer study of black silicon surface produced using the plasma immersion ion implantation method. Appl. Therm. Eng. 2016, 99, 253–261. [Google Scholar] [CrossRef]
  38. Park, M.-S.; Shim, H.-S.; Baek, S.H.; Kim, J.G.; Hur, D.H. Effects of oxidation states of fuel cladding surface on crud deposition in simulated primary water of PWRs. Ann. Nucl. Energy 2017, 103, 275–281. [Google Scholar] [CrossRef]
  39. Baek, S.H.; Shim, H.-S.; Kim, J.G.; Hur, D.H. Effect of chemical etching of fuel cladding surface on crud deposition behavior in simulated primary water of PWRs at 328 °C. Ann. Nucl. Energy 2018, 116, 69–77. [Google Scholar] [CrossRef]
  40. Baek, S.H.; Shim, H.-S.; Kim, J.G.; Hur, D.H. Effects of heat flux on fuel crud deposition and sub-cooled nucleate boiling in simulated PWR primary water at 13 MPa. Ann. Nucl. Energy 2019, 133, 178–185. [Google Scholar] [CrossRef]
  41. Shields, K.J. State-of-Knowledge on Deposition Part 1: Parameters Influencing Deposition in Fossil Units; EPRI Report 1004194; EPRI: Palo Alto, CA, USA, 2002. [Google Scholar]
  42. Smith, D.S.; Alzina, A.; Bourret, J.; Nait-Ali, B.; Pennec, F.; Tessier-Doyen, N.; Otsu, K.; Matsubara, H.; Elser, P.; Gonzenbach, U.T. Thermal conductivity of porous materials. J. Mater. Res. 2013, 28, 2260–2272. [Google Scholar] [CrossRef] [Green Version]
  43. Song, G.D.; Jeon, S.H.; Kim, J.G.; Hur, D.H. Synergistic effect of chloride ions and magnetite on the corrosion of Alloy 690 in alkaline solutions. Corros. Sci. 2017, 131, 71–80. [Google Scholar] [CrossRef]
  44. Xia, D.H.; Behnamian, Y.; Luo, J.L. Review—Factors influencing sulfur induced corrosion on the secondary side in pressurized water reactors (PWRs). J. Electrochem. Soc. 2019, 166, 49–64. [Google Scholar] [CrossRef]
  45. Fruzzetti, K. Multivariable Assessment of Flow Accelerated Corrosion and Steam Generator Fouling, Literature Review; EPRI Report 1003619; EPRI: Palo Alto, CA, USA, 2003. [Google Scholar]
  46. Iwahori, T. Role of surface chemistry in crud deposition on heat transfer surface. Corrosion 1979, 35, 345–350. [Google Scholar] [CrossRef]
  47. Chang, S.H.; Bang, I.C.; Baek, W.P. A photographic study on the near-wall bubble behavior in subcooled flow boiling. Int. J. Therm. Sci. 2002, 41, 609–618. [Google Scholar] [CrossRef]
  48. Gaertner, R.F. Photographic study of nucleate pool boiling on a horizontal surface. ASEM J. Heat Transf. 1965, 17, 17–29. [Google Scholar] [CrossRef]
  49. Sakurai, A.; Shiotsu, M.; Hata, K.; Fukuda, K. Photographic study on transitions from non-boiling and nucleate boiling regime to film boiling due to increasing heat inputs in liquid nitrogen and water. Nucl. Eng. Des. 2000, 200, 39–54. [Google Scholar] [CrossRef]
  50. Nishikawa, K.; Fujita, Y.; Uchida, S.; Ohta, H. Effect of surface configuration on nucleate boiling heat transfer. Int. J. Heat Mass Trans. 1984, 27, 1559–1571. [Google Scholar]
  51. Ryu, W.S.; Park, D.G.; Song, U.S.; Park, J.S.; Ahn, S.B. Effects of irradiation on thermal conductivity of Alloy 690 at low neutron fluence. Nucl. Eng. Technol. 2013, 45, 219–222. [Google Scholar] [CrossRef] [Green Version]
  52. Kim, Y.S.; Kim, S.S.; Kim, D.W. Production Method for Alloy 690 Ordered Alloy of Improved Thermal Conductivity, and Alloy 690 Ordered Alloy Produced Thereby. U.S. Patent 20160145730A1, 26 May 2016. [Google Scholar]
  53. Essi, J.; Konsta, S.; Timo, S. Determining Zeta Potential of Magnetite Particles in PWR Secondary Side Water Treated with Ammonia or Ethanolamine by Using Streaming Potential Technique. In Proceedings of the 20th NPC International Conference, Brighton, UK, 2–7 October 2016; p. 151. [Google Scholar]
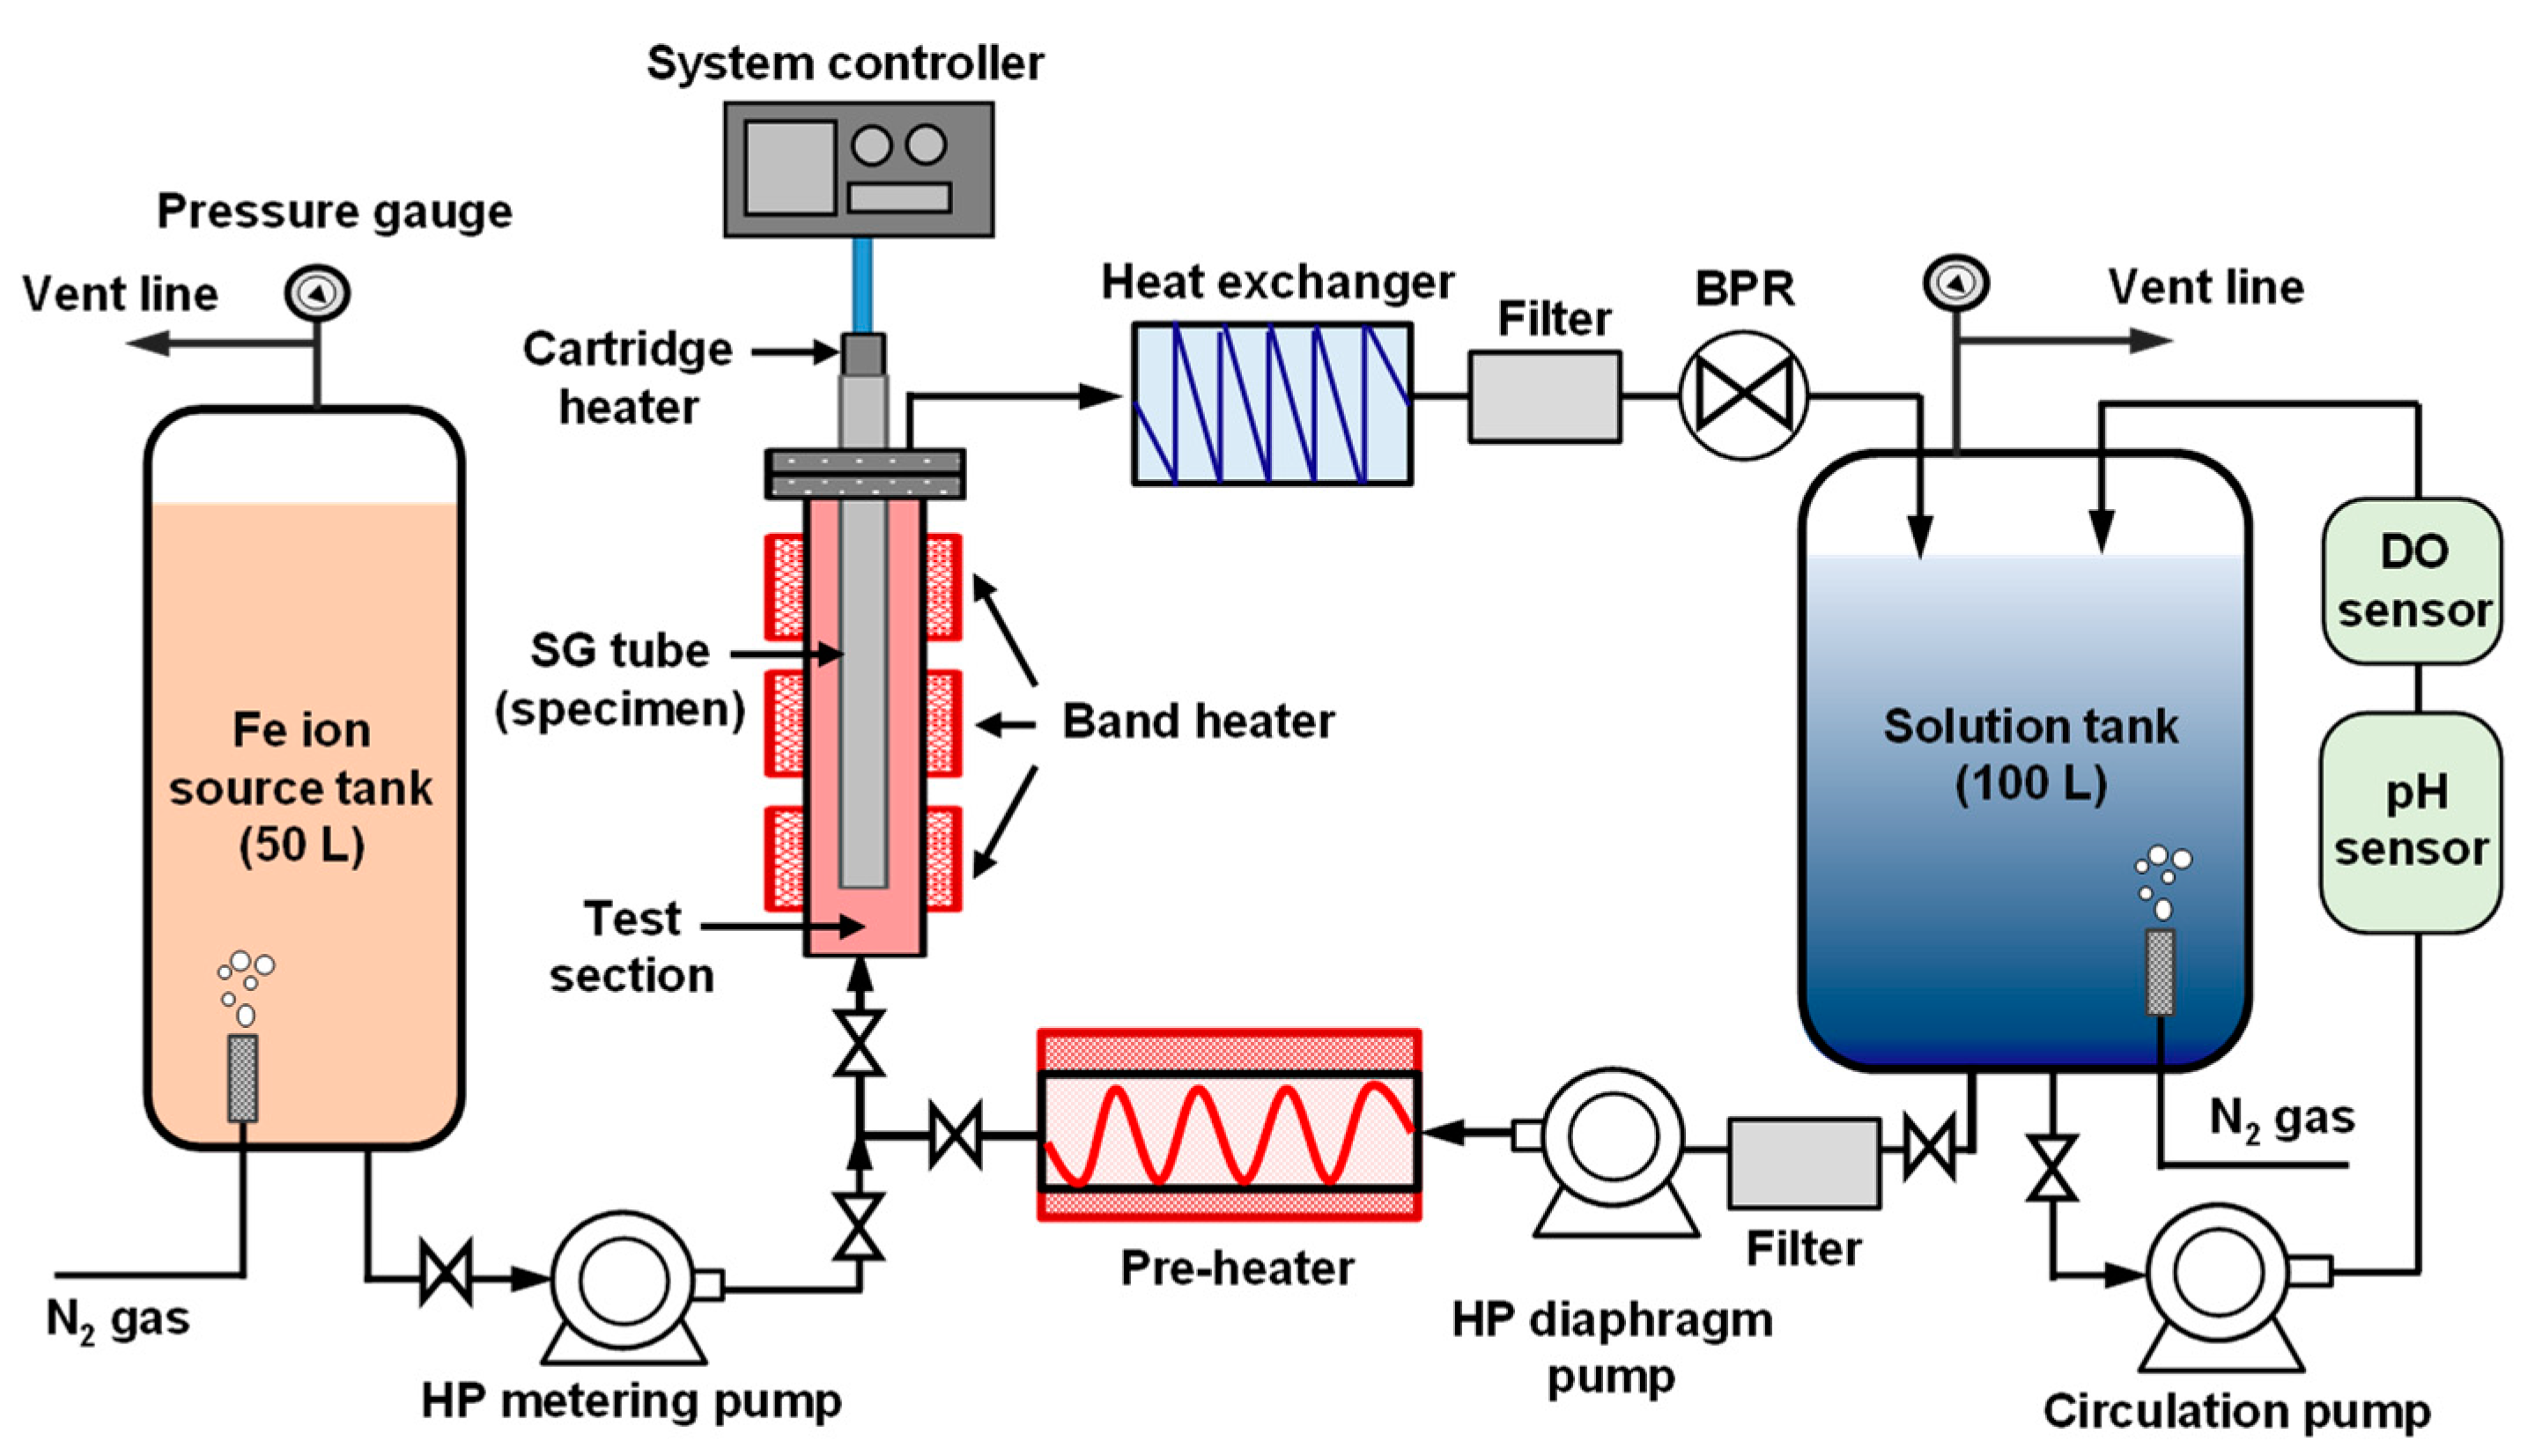
Figure 1. Schematic of the magnetite deposition loop system.
Coatings 12 01231 g001
Figure 2. Images of as-received and magnetite-deposited SG tube specimens (a) and schematic of the specimen cutting (b).
Coatings 12 01231 g002
Figure 3. Surface roughness profiles of SG tubes: (a) Alloy 600 and (b) Alloy 690.
Coatings 12 01231 g003
Figure 4. Static contact angles measured on SG tubes: (a) Alloy 600 and (b) Alloy 690.
Coatings 12 01231 g004
Figure 5. Zeta potential of magnetite particles and surface zeta potentials of Alloy 600 and Alloy 690 flat specimens.
Coatings 12 01231 g005
Figure 6. Low- and high-magnification SEM images of SG tube surfaces after the deposition tests: (a,b) Alloy 600 and (c,d) Alloy 690.
Coatings 12 01231 g006
Figure 7. Deposit analysis of 300 randomly selected deposit particles: (a) aspect ratio, (b) mean diameter, and (c) size distribution.
Coatings 12 01231 g007
Figure 8. XRD patterns of deposits on SG tubes: (a) Alloy 600 and (b) Alloy 690.
Coatings 12 01231 g008
Figure 9. SEM-EDS analysis of deposits of SG tubes: (a) Alloy 600 and (b) Alloy 690.
Coatings 12 01231 g009
Figure 10. SEM cross-section images of magnetite deposits on two different SG tubes obtained using the FIB technique: (a) Alloy 600 and (b) Alloy 690.
Coatings 12 01231 g010
Figure 11. Porosity of magnetite deposits on SG tubes obtained using an image analyzer.
Coatings 12 01231 g011
Figure 12. Amount of magnetite deposits on SG tubes using ICP-OES analysis.
Coatings 12 01231 g012
Table 1. Chemical compositions of Alloy 600 and Alloy 690 tube materials (wt.%).
TubesNiCrFeCSiMnTiAlCuCo
Alloy 60076.0115.207.820.020.260.210.250.170.0340.02
Alloy 69059.5429.3110.090.020.300.290.250.17<0.01<0.01
Publisher’s Note: MDPI stays neutral with regard to jurisdictional claims in published maps and institutional affiliations.