Abstract
Medical tools and implants used in clinics can be contaminated with bacteria even with disinfection treatment. To avert this situation, titanium (Ti) plates modified with a MoS2(S)–Ag3PO4 coating were designed to kill Staphylococcus aureus (S. aureus) and Escherichia coli (E. coli) effectively under near-infrared (NIR) light irradiation. The introduction of Ag3PO4 nanoparticles (NPs) reduced the bandgap of MoS2 and suppressed the recombination of the photogenerated electron–hole pairs. Therefore, Ti–MoS2(S)–Ag3PO4 exhibited a higher photocatalytic performance, leading to the generation of more radical oxygen species (ROS). Furthermore, cooperating with the good photothermal performance of MoS2, the MoS2(S)–Ag3PO4 coating exhibited a high antibacterial efficacy of 99.76 ± 0.15% and 99.85 ± 0.09% against S. aureus and E. coli, respectively, for 15 min in vitro. Moreover, the MoS2(S)–Ag3PO4 coating had no apparent toxicity to cells. The proposed strategy may provide new insights for rapidly eradicating bacteria on medical tools and superficial implants.
1. Introduction
Titanium (Ti) and Ti-based materials have the advantages of being non-toxic and light weight, with high biocompatibility, and are ideal materials for implantation [1]. However, it is quite common for bacterial infection to lead to the failure of orthopedic implantation surgery, despite most of the surgical environments meeting the sterility standards [2,3]. Even when systemic antibiotic therapy is given prophylactically before and after surgery, a second surgery is sometimes conducted to replace the infected implants. Therefore, it is urgent to endow medical tools and implants, including open surgery and superficial implants, with antimicrobial ability. Traditional strategies including loading antibiotics [4,5], antimicrobial peptides [6], and inorganic nanoparticles [7] have been carried out; however, the long-term use of these strategies may cause bacterial resistance [8,9]. To solve the bacterial resistance problem, both photodynamic and photothermal antibacterial strategies that can inactivate bacteria have emerged [10]. Reactive oxygen species (ROS)-based photodynamic therapy (PDT) and hyperthermia-based photothermal therapy (PTT) are effective methods to exterminate microorganisms (including viruses and bacteria) in the short term [11]. In particular, the energy of the photothermal effect is diffused to the surface of the instrument in the form of localized heat, thereby destroying microorganisms [12,13].
Since the emergence of graphene, 2D layered materials, including transition metal chalcogenides and other 2D compounds, have attracted attention [14]. Molybdenum disulfide (MoS2) is a photoresponsive 2D layered material that has a similar structure to graphene. Moreover, MoS2 has a large specific surface area, a wide spectral response, and a narrow bandgap, which favors light absorption [15]. Nevertheless, the photocatalytic effect of MoS2 is severely limited by carrier recombination. Combining a wider bandgap semiconductor is an effective strategy to promote charge separation. Trisilver phosphate (Ag3PO4) is a prospective candidate material with a direct bandgap (2.43 eV) [16]. Furthermore, Ag3PO4 is slightly soluble in water and can slowly release Ag+ to inhibit bacterial growth. In addition, MoS2 provides the advantage of photothermal properties, which, paired with photodynamic performances, can effectively kill bacteria in the short term [17]. It is known that Mo is one of the essential trace minerals and S is one of the essential chemical elements in the human body, which has enabled MoS2 to be applied in the biomedical field, including for anticancer therapy and antibacterial therapy [18]. However, the antibacterial therapy of an MoS2(S)–Ag3PO4 coating on Ti implants under 808 nm NIR light irradiation has not been studied.
In this study, an MoS2(S) coating was prepared by laser cladding processing and the chemical vapor deposition (CVD) method, and Ag3PO4 nanoparticles, which were prepared using the ion-exchange method, were loaded on the Ti–MoS2(S) to form the MoS2(S)–Ag3PO4 coating (Scheme 1). We hypothesized that the MoS2(S)–Ag3PO4 coating could give the Ti implants excellent antibacterial activity. Under the irradiation of 808 nm NIR light, Ti–MoS2(S)–Ag3PO4 eradicated S. aureus and E. coli in the short term. In addition, the Ag released by Ti–MoS2(S)–Ag3PO4 was low and exhibited low toxicity to mammalian cells.
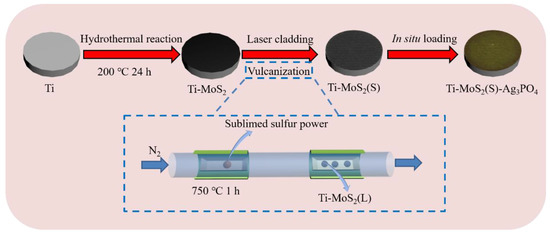
Scheme 1.
The process of Ti-MoS2(S)–Ag3PO4 coating synthesis.
2. Materials and Methods
Materials: Anhydrous ethanol, disodium hydrogen phosphate (Na2HPO4·12H2O), sublimed sulfur (S, 99.95%), sodium molybdate (Na2MoO4), silver nitrate (AgNO3), and thioacetamide (CH3CSNH2) were all acquired from Aladdin (Shanghai, China). Medically pure Ti plates were purchased from Baosteel Group Corp, (Shanghai, China).
2.1. Pretreatment of Ti Plates
The Ti plates were mechanically polished using SiC sandpaper (grain sizes #80, #240, #400, and #800); then, they were rinsed with deionized water and absolute ethanol for 5 min.
2.2. MoS2 Coating Preparation
The MoS2 coating was prepared using the following steps [19]. Firstly, 40 mg CH3CSNH2 and 20 mg Na2MoO4 were dispersed in 40 mL deionized water and then sonicated for 5 min. The above solution was moved to a 100 mL Teflon-lined stainless-steel autoclave containing Ti plates and then heated to 200 °C for 24 h. After cooling, the Ti plates were lifted from the 100 mL Teflon-lined stainless-steel autoclave and washed with deionized water to gain a black MoS2 coating, which was called Ti–MoS2. Secondly, the precoated samples were placed on the working plate of the nanosecond pulse laser. Laser cladding was carried out by a CW 2 kW Nd: YAG laser, with the optimal parameters of scanning speed = 50 mm/s, frequency = 20 kHz, and power = 35 W. After laser cladding, the corresponding Ti plates were named Ti–MoS2(L). Lastly, the Ti–MoS2(L) was sulfureted using the CVD method [18]. The sulfur powder (0.3 g) and Ti–MoS2(L) were set in a tube furnace, separately. The tube furnace was heated to 750 °C for 1 h in a N2 atmosphere and then cooled to room temperature naturally. The corresponding Ti plate was named Ti–MoS2(S).
2.3. Preparation of MoS2(S)–Ag3PO4 Coating
The MoS2(S)–Ag3PO4 coating was prepared using the following steps. Ti–MoS2(S) was immersed in 7 mL of 1 mg/mL Na2HPO4·12H2O for 30 min. Then, 3 mL of 1 mg/mL AgNO3 solution was dropped into the above solution and stirred for 30 min in the dark. The obtained Ti plates were then dried in an oven at 60 °C for 5 min. The corresponding Ti plates were named Ti–MoS2(S)–Ag3PO4.
2.4. Characterization
An X-ray diffractometer (XRD, D8 Advanced, Bruker, Frankfurt, Germany) with Cu Kα radiation (λ = 1.54051 Å) was applied to measure the crystallization of the samples. Element analysis of the samples was measured by X-ray photoelectron spectroscopy (XPS, Axis Supra, Kratos, Manchester, UK). A scanning electron microscope (SEM, S-4800, Hitachi, Tokyo, Japan) equipped with an energy dispersive X-ray spectrum (EDS, X-max20, Oxford Instruments, High Wycombe, UK) was applied to observe the samples and bacteria morphologies. A Japanese Shimadzu UV-2700 (Kyoto, Japan) spectrophotometer in the measurement range from 200 to 850 nm was applied to measure the ultraviolet−visible light (UV-vis) diffuse reflectance (DRS) optical properties of all samples. A fluorolog-3 fluorescence spectrophotometer (HORIBA, Kyoto, Japan) with an excitation wavelength of 365 nm was applied to measure the steady state photoluminescence (PL) of the samples. Electron spin resonance (ESR, JES-FA200, JEOL USA, Peabody, MA, USA) spectroscopy was applied to detect the ROS of all samples by a capture agent (5,5-Dimethyl-1-pyrroline N-oxide). An electrochemical workstation (INTERFACE 1000, Gamry Instrument, Warminster, PA, USA) with a standard three-electrode system was applied to conduct transient photocurrent response measurement, electrochemical impedance spectroscopy (EIS), and linear sweep voltammetry (LSV).
2.5. Photothermal Performance
The photothermal performance of the samples was measured using an FLIR thermal camera (E50, Teledyne FLIR, Wilsonville, OR, USA). Each sample (including Ti, Ti–MoS2(S), and Ti–MoS2(S)–Ag3PO4) was irradiated with 808 nm NIR light for 3 min (0.4 W·cm−2), with temperatures recorded every 10 s.
2.6. Ag Ions Release
Two Ti–MoS2(S)–Ag3PO4 samples saturated in 0.5 mL of deionized water were stored in the dark at 37 °C for 21 days. The solutions were removed at 0.5, 1, 2, 3, 5, 7, 10, 14, and 21 d, and another 0.5 mL of deionized water was added. The concentration of the Ag ions’ release was measured using an ICP-OES (Vista-MP, Varian, Palo Alto, CA, USA).
2.7. In Vitro Antimicrobial Tests
The spread plate method was conducted to assess the antimicrobial performance of the samples. The typical bacteria, including Gram-positive S. aureus (ATCC 25923) and Gram-negative E. coli (ATCC 8099), that were acquired from the typical strain preservation center in the United States, were cultured separately using Luria−Bertain (LB) media at 37 °C [17]. All samples (including Ti, Ti–MoS2(S), and Ti–MoS2(S)–Ag3PO4) were sterilized with ultraviolet (UV) irradiation and medicinal alcohol for 0.5 h. Then, 10 μL of the diluted bacterial solution (1 × 10⁷ CFU/mL) was dropped on each sample (including Ti, Ti–MoS2(S), and Ti–MoS2(S)–Ag3PO4).
Each sample was irradiated by 808 nm NIR light (0.4 W/cm2) for 5 min and then maintained at about 52 °C for another 10 min by lowering the light power. Each of the samples had a matched sample without irradiation. Lastly, each 20 µL of the diluted liquid was coated on the agar plate and incubated at 37 °C for 20 h. The number of bacterial colonies on the plate was calculated to determine the antibacterial rate of each sample according to the following equation: Antibacterial ratio (%) = (number of colonies on the Ti plate − number of colonies in experimental group)/(number of colonies on the Ti plate) × 100%.
The bacterial morphology changes were scrutinized by SEM. After the above irradiation process, the corresponding samples with bacteria were placed in a 96-well plate with 200 μL 2.5% glutaraldehyde for 4 h in the dark. After washing the samples with PBS (pH = 7.4) three times, the bacteria dehydration was conducted with 10%, 30%, 50%, 70%, 90%, and 100% ethanol solution for 15 min. After drying at 4 °C in a refrigerator, the bacterial morphology was observed by SEM.
2.8. Biocompatibility Evaluation In Vitro
The biocompatibility of the samples was assessed by an MTT method using MC3T3-E1 (ATCC CRL-2593) cells, which were acquired from Nankai University. All the samples (including Ti, Ti–MoS2(S), and Ti–MoS2(S)–Ag3PO4) were sterilized in the same way as for the in vitro antibacterial test. Afterwards, all the samples were immersed in Dulbecco’s modified eagle medium (DMEM), then the MC3T3-E1 cells (cell density 1 × 10⁵ cells·mL−1) were cultured by the above extraction solution for 1, 3, and 7 days in a 5% CO2 incubator at 37 °C. After culturing for different days, the medium was taken out, and MTT solution (0.5 mg/mL) was added; then, it was cultured for 4 h at 37 °C. The MTT solution was replaced by DMSO and then shocked to dissolve the crystals for 5 min. Finally, the absorption of the cell viability at 490 nm was examined on a microplate reader, which provided the optical density (OD).
2.9. Statistical Analysis
All the quantitative data were analyzed by one-way ANOVA (GraphPad Prism 8.0.2) and express ed as means ± standard deviations with n = 3. p values < 0.05 were considered statistically significant.
3. Results
3.1. Morphologies and Structure
The morphologies of the Ti–MoS2, Ti–MoS2(L), Ti–MoS2(S), and Ti–MoS2(S)–Ag3PO4 are shown in Figure 1. The optical images of the above samples showed a range of color variations, as shown in Figure 2A–D. It was clearly observed that the MoS2 nanospheres were spread evenly over the MoS2 nanosheets, as shown in Figure 1A. After the laser cladding, Ti–MoS2(L) became slightly white, and many small nanoparticles appeared over the MoS2 nanospheres (Figure 2B); these may have been molybdenum oxide [17]. Therefore, it was necessary to revulcanize the Ti–MoS2(L). After the vulcanization process, Ti–MoS2(S) turned back to black to some extent, and it was obvious that the total quantity of small nanoparticles over the MoS2 nanospheres was reduced (Figure 1C). The corresponding EDS spectra shown in Figure 2E–G further proved that the sulfuration of Ti–MoS2(L) was successful. Figure 1D,E shows that the Ag3PO4 nanoparticles were evenly distributed over the MoS2 nanosheets and nanospheres, and the size of the Ag3PO4 nanoparticles was about 10–50 nm. According to the EDS spectra shown in Figure 2H, it was observed that the Ag3PO4 nanoparticles successfully loaded on the MoS2 coating. The cross- sectional image of Ti-MoS2(S)–Ag3PO4 is in Figure S1.
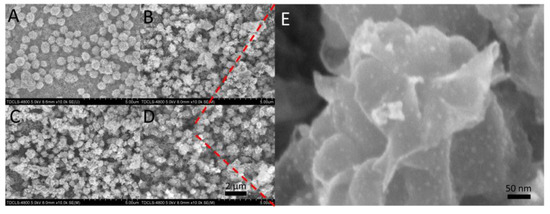
Figure 1.
Morphologies of the synthesized materials: FE-SEM image of (A) Ti–MoS2, (B) Ti–MoS2(L), (C) Ti–MoS2(S), and (D) Ti–MoS2(S)–Ag3PO4; (Scale bar: 50 nm) (E) High magnification image of D. (Scale bar: 2 μm).
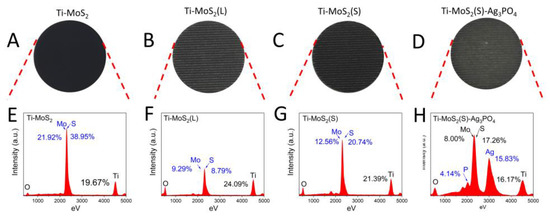
Figure 2.
The images and elements of the synthesized materials: photographs of (A) Ti–MoS2, (B) Ti–MoS2(L), (C) Ti–MoS2(S), and (D) Ti–MoS2(S)–Ag3PO4. Energy dispersive spectroscopy of (E) Ti–MoS2, (F) Ti–MoS2(L), (G) Ti–MoS2(S), and (H) Ti–MoS2(S)–Ag3PO4.
X-ray diffraction (XRD) and X-ray photoelectron spectroscopy (XPS) were carried out to determine the phase composition, elemental composition, and bonding information of the all samples. The characteristic peaks at 2θ values of 14.4° corresponded to the (002) crystal planes of MoS2 in the XRD pattern of Ti–MoS2, as shown in Figure 3A, indicating successful synthesis of the MoS2 on the Ti plates [20]. After the laser cladding and vulcanization, the diffraction peaks of Ti–MoS2(L) and Ti–MoS2(S) were almost unchanged. Then, the MoS2 powder was scraped off from the Ti–MoS2(S), as shown in Figure S2, and was almost the same as the MoS2 powder of Ti–MoS2. The characteristic peaks at 2θ values of 33.3° corresponded to the (210) crystal planes of Ag3PO4 in the XRD pattern of Ti–MoS2(S)–Ag3PO4, suggesting the Ag3PO4 was successfully loaded onto Ti–MoS2(S) [16]. The XPS survey scan, shown in Figure 3B, showed that the peaks of Mo, S, Ag, P, and O were found from the Ti–MoS2(S)–Ag3PO4, whereas the Ti–MoS2(S) was composed of Mo and S. As shown in Figure 3C, the high-resolution scan of Ag 3d found from the Ti–MoS2(S)–Ag3PO4 demonstrated that the Ag 3d contained peaks of Ag 3d3/2 at 374.46 eV and Ag 3d5/2 at 368.48 eV, which belonged to the Ag [21]. No extra peaks belonging to the Ag0 appeared [22,23]. The binding energy value of P 2p, as shown in Figure 3D, was 134.05 eV, which indicated the existence of phosphorus (P5+) in Ag3PO4 [24]. The high-resolution scans of the Mo 3d detected from the Ti–MoS2(S), as shown in Figure 3E, showed that the Mo 3d contained peaks of Mo 3d5/2 at 228.98 eV and Mo 3d3/2 at 230.68 eV, which belonged to the Mo4+ [25]. Combined with the S 2p detected from the Ti–MoS2(S), as shown in Figure 3F, this indicates that the MoS2 synthesized by the hydrothermal process was the 2H phase. In addition, the peaks of Mo 3d5/2 at 231.98 eV and Mo 3d3/2 at 234.98 eV belonged to the Mo5+, and the peaks of Mo 3d5/2 at 232.58 eV and Mo 3d3/2 at 235.58 eV belonged to the Mo6+ [26]. The appearance of Mo5+ and Mo6+ can be caused by laser cladding. Meanwhile, the peaks of S 2p3/2 at 158.98 eV and S 2p1/2 at 162.88 eV belonged to the S2−, and the peaks of S 2p3/2 at 164.28 eV and S 2p1/2 at 168.68 belonged to the S6−, as shown in Figure 3F, suggesting that the sulfuration was successful [27].
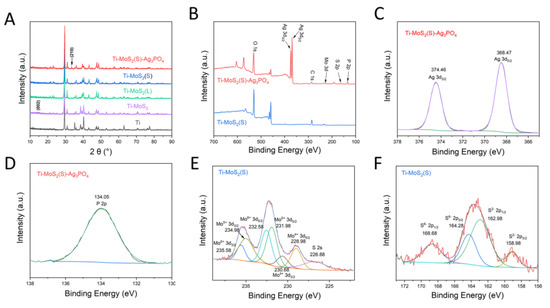
Figure 3.
(A) XRD patterns of Ti, Ti–MoS2, Ti–MoS2(L), Ti–MoS2(S), and Ti–MoS2(S)–Ag3PO4. (B) XPS survey spectrum of Ti–MoS2(S) and Ti–MoS2(S)–Ag3PO4. (C) High-resolution scans for the Ag 3d electrons of the Ti–MoS2(S)–Ag3PO4. (D) High-resolution scans for the P 2p electrons of Ti–MoS2(S)–Ag3PO4. (E) High-resolution scans for the Mo 3d electrons of Ti–MoS2(S). (F) High-resolution scans for the S 2p electrons of Ti–MoS2(S).
3.2. Photocatalytic Property
The UV–vis absorption spectra of Ti–MoS2(S) and Ti–MoS2(S)–Ag3PO4 are shown in Figure 4A. Ti–MoS2(S) and Ti–MoS2(S)–Ag3PO4 both exhibited a strong light absorption over 550 nm, and the absorption intensity of Ti–MoS2(S)–Ag3PO4 was slightly lower. The bandgap of the samples can be calculated using the Tauc plot equation [28].
where α is the absorption coefficient, B is a proportionality constant, h is Planck’s constant, ν is the photon’s frequency, Eg is the bandgap, and n is directly related to the type of semiconductor (n = 1/2 and n = 2 for direct and indirect transitions, respectively). As shown in Figure 4B, although the direct bandgap was calculated as 2.37 eV for Ag3PO4 (inset curve in Figure 4B), the 808 nm laser could not excite the pure Ag3PO4. Furthermore, the bandgap of the Ti–MoS2(S) was 1.51 eV, and the bandgap of the Ti–MoS2(S)–Ag3PO4 decreased to 1.39 eV due to the addition of the Ag3PO4 NPs, suggesting that Ti–MoS2(S) combined with Ag3PO4 reduced the bandgap and enhanced the absorption edge of MoS2.
(αhν)1/n = B (hν − Eg)
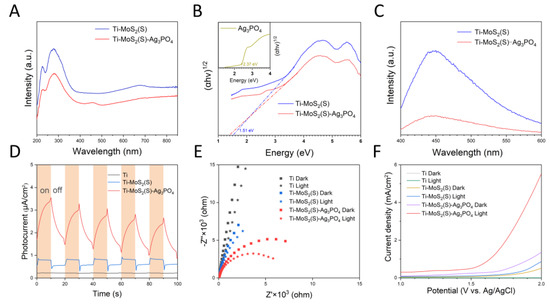
Figure 4.
(A) The UV–vis–NIR absorption curves and (B) bandgap of Ti–MoS2(S) and Ti–MoS2(S)–Ag3PO4. (C) Steady state photoluminescence spectra of Ti–MoS2(S) and Ti–MoS2(S)–Ag3PO4. (D) Photocurrent curves, (E) electrochemical impedance spectroscopy, and (F) linear voltammetry sweep photocurrent curves of Ti, Ti–MoS2(S), and Ti–MoS2(S)–Ag3PO4.
Simultaneously, the separation and transfer capability of the photoinduced charge carrier is another critical factor affecting the photocatalytic properties of materials. Obviously, Ti–MoS2(S) had a peak at 445 nm in the PL spectra (Figure 4C), and the PL intensity of Ti–MoS2(S)–Ag3PO4 was lower, indicating the modification of Ag3PO4 on Ti–MoS2(S) was propitious for the separation and transfer efficiency of the photoinduced charge carrier [29]. The photocurrent density under 808 nm NIR light illumination further proved this result. As displayed in Figure 4D, Ti–MoS2(S)–Ag3PO4 showed the highest photocurrent response among the three samples, which was in line with the PL results. Both electrochemical impedance spectroscopy (EIS) and linear sweep voltammetry (LSV) are important photoelectrochemical measurements to assess the interfacial electron transfer in the samples under 808 nm NIR light [30]. In Figure 4E, Ti–MoS2(S)–Ag3PO4 shows smaller semicircles than the Ti–MoS2(S) and Ti groups, indicating that Ti–MoS2(S)–Ag3PO4 had the lowest impedance. Ti–MoS2(S)–Ag3PO4 under 808 nm NIR light irradiation exhibited lower impedance than that of non-NIR light irradiation, suggesting that Ti–MoS2(S)–Ag3PO4 had the smallest charge transfer resistance, and the 808 nm NIR light enhanced the transfer efficiency of the photoinduced charge carriers. As can be seen from Figure 4F, the current density of Ti–MoS2(S)–Ag3PO4 under 808 nm NIR light in the LSV spectra was more enhanced than that of the Ti–MoS2(S) and Ti groups. According to the above results, Ti–MoS2(S)–Ag3PO4 can promote the movement of the photoinduced charge carrier and inhibit the photoinduced charge carrier recombination under the irradiation of 808 nm NIR light.
The photogenerated charges can react with the surrounding water or oxygen to generate ROS, which is beneficial for materials to enhance the bacteria-killing ability [31,32]. Figure 5A shows the amount of ROS production using the 2′,7′-Dichlorofluorescein diacetate (DCFH-DA), which can trap ROS and be detected by excitation with 488 nm irradiation; the emission was detected at 525 nm. Therefore, Ti–MoS2(S)–Ag3PO4 further enhanced the production of ROS compared to Ti–MoS2(S) and Ti, illustrating that 808 nm NIR light can excite Ti–MoS2(S)–Ag3PO4 to produce ROS effectively. The electron spin resonance (ESR) spectrum is a useful way to ascertain ROS types [33,34]. As can be seen in Figure 5B,C, •OH and •O2− were detected with 5,5-dimethyl-1-pyrroline N-oxide (DMPO) as a trapping agent under the irradiation of 808 nm NIR light, while both showed no signals in the dark, suggesting that 808 nm NIR light can excite Ti–MoS2(S)–Ag3PO4 to produce •OH and •O2−.

Figure 5.
(A) ROS generation with DCFH fluorescence probe (the error bars represent means ± SD, n = 3); ESR spectra of the (B) superoxide radical and (C) hydroxyl radical obtained from Ti–MoS2(S)–Ag3PO4.
3.3. Photothermal Property
As can be seen in Figure 6, the photothermal properties of the samples were determined from the photothermal heating curves under the irradiation of 808 nm NIR light. After irradiation with 808 nm NIR light for 3 min (Figure 6A), the final temperatures of the Ti–MoS2(S)–Ag3PO4 and Ti–MoS2(S) were approximately 67.8 and 62.4 °C, respectively. Both Ti–MoS2(S)–Ag3PO4 and Ti–MoS2(S) exhibited better photothermal effects in comparison with Ti, indicating that the MoS2 nanospheres and nanosheets displayed an extraordinary photothermal performance under the irradiation of 808 nm NIR light. Furthermore, Ti–MoS2(S)–Ag3PO4 was subjected to 808 nm NIR light for three cycles, as shown in Figure 6B, demonstrating that Ti–MoS2(S)–Ag3PO4 had a stable on–off and photothermal effect. According to the above results, Ti–MoS2(S)–Ag3PO4 not only possesses excellent photothermal efficiency but also is a stable and recyclable photothermal material.
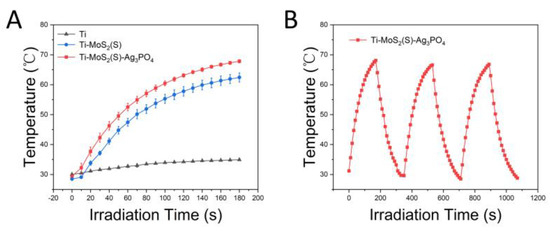
Figure 6.
Photothermal properties of Ti, Ti–MoS2(S), and Ti–MoS2(S)–Ag3PO4 under 808 nm light irradiation, (power density: 0.4 W·cm−2): (A) photothermal heating curve of Ti, Ti–MoS2(S), and Ti–MoS2(S)–Ag3PO4 (the error bars represent means ± SD, n = 3); (B) temperature heating and cooling profiles of Ti–MoS2(S)–Ag3PO4.
3.4. In Vitro Antibacterial Activity
The antibacterial performance of all samples was evaluated by the spread plate method against S. aureus and E. coli. As can be seen in Figure 7A,C, the number of colonies in the plate reflected the strong antibacterial ability of the samples. Ti–MoS2(S) and Ti–MoS2(S)–Ag3PO4 had no antibacterial activity in the dark environment for 15 min because of the negligible reduction in the bacterial colonies. Under 808 nm NIR light radiation, the Ti group exhibited no antibacterial potency; it was evident that 808 nm NIR light had no effect on E. coli and S. aureus in the short term. Furthermore, Ti–MoS2(S) had an antibacterial efficiency of 61.70 ± 7.03% and 63.40 ± 2.51% against S. aureus and E. coli, respectively. Ti–MoS2(S)–Ag3PO4 had the highest antibacterial efficiency of 99.48 ± 0.19% and 99.77 ± 0.09% against S. aureus and E. coli, respectively (Figure 7B,D). It was evident that photothermy and the ROS produced by Ti–MoS2(S)–Ag3PO4 had a strong effect on E. coli and S. aureus in the short term. To explore the stability of the coating, image of Ti–MoS2(S)–Ag3PO4 after the sterilization step was observed under SEM (Figure S3), and three circling antimicrobial tests in vitro was conducted with S. aureus (Figure S4).
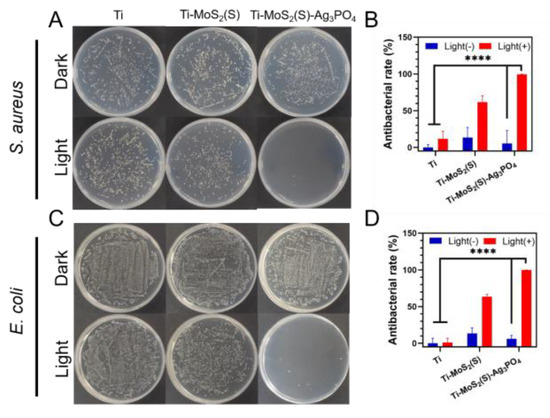
Figure 7.
The antibacterial ability of the samples after 808 nm NIR light irradiation or staying in the dark for 15 min. The spread plate of (A) S. aureus and (B) E. coli; the antibacterial efficiency of the samples against (C) S. aureus and (D) E. coli. The error bars indicate means ± SD, **** p < 0.0001.
In addition, SEM was carried out to observe the morphology of bacteria, as shown in Figure 8. The bacteria in the dark groups had a smooth surface and intact morphology without 808 nm NIR light, except the E. coli cells in the MoS2 group, indicating that a small quantity of the Ag3PO4 nanoparticles on the Ti plate had little toxicity to bacteria in the short term. However, the E. coli cells in the Ti–MoS2(S) group were dented in the middle of the cells and smooth at both ends. After 808 nm NIR light irradiation for 15 min, the Ti–MoS2(S) and Ti groups had similar results for S. aureus cells, suggesting that 808 nm NIR light and the photothermy of MoS2 had little influence on the S. aureus cells. Furthermore, the E. coli cells in the Ti–MoS2(S) group after 808 nm NIR light irradiation for 15 min had the same results as the Ti–MoS2(S) group in the dark, suggesting that the nanostructure of MoS2 may interfere with the growth of the E. coli cells. In contrast, the E. coli cells were obviously deformed more severely on the Ti–MoS2(S)–Ag3PO4 with 808 nm NIR light (the area indicated by the red arrow), and some of the flattened S. aureus cell membranes were laid on the Ti–MoS2(S)–Ag3PO4 after 808 nm NIR light (the area indicated by the red circle). The surface wettability of the samples was investigated by contact angle measurements in Figure S5, indicating that E. coli exhibited larger on Ag3PO4 NPs coated samples. As described previously, these results were basically compatible with the spread plate results.
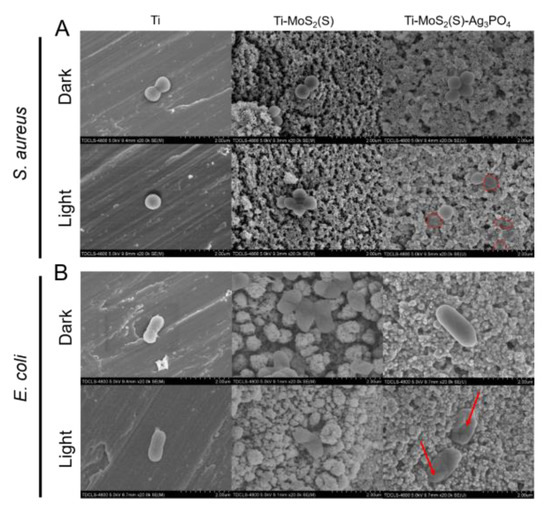
Figure 8.
The FE-SEM images of bacteria cells after the irradiation of 808 nm NIR light or staying in the dark for 15 min. (A) S. aureus (B) E. coli. (Scale bar: 2 μm).
Based on the results above, the antibacterial mechanisms of the Ti–MoS2(S)–Ag3PO4 are as follows: during 808 nm NIR irradiation, the hyperthermia (about 52 °C) produced by the Ti–MoS2(S)–Ag3PO4 appeared on the surface of Ti plates and the top solution, which increased permeability of bacterial membranes and even destroyed the membrane protein. Furthermore, the ROS (such as •OH and •O2−) generated by the Ti–MoS2(S)–Ag3PO4 entered the bacteria cell and induced oxidative stress, which disrupted bacterial metabolism and even caused cell death.
3.5. In Vitro Cytotoxicity Test
Due to the Ag released by Ti–MoS2(S)–Ag3PO4, the sample biocompatibility was implemented by the methyl thiazolyl tetrazolium (MTT) method [35]. As shown in Figure 9A, Ti–MoS2(S)–Ag3PO4 and Ti–MoS2(S) both displayed good biocompatibility after coculturing for 1, 3, and 7 d. In detail, the viability of Ti–MoS2(S)–Ag3PO4 was close to that of Ti, and the viability of Ti–MoS2(S) was slightly higher than that of Ti after culturing for 1 and 3 d. In particular, the viability of Ti–MoS2(S)–Ag3PO4 and Ti–MoS2(S) was further increased compared to that of Ti after culturing for 7 d. Furthermore, the release concentration of Ag+ slowly reached 1.66 ppm after 7 days, as shown in Figure 9B, suggesting that Ag+ at this concentration did not have a cytotoxic effect and can allow the proliferation according to the above results [36,37].
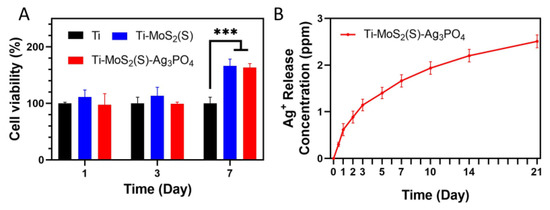
Figure 9.
(A) Cell viability by MTT test for 1, 3, and 7 d; (B) release of Ag ions from Ti–MoS2(S)–Ag3PO4 at 37 °C for 21 days (the error bars represent means ± SD, n = 3, *** p < 0.001).
4. Conclusions
In summary, the synthesized Ti–MoS2(S)–Ag3PO4 under the irradiation of 808 nm NIR light effectively eradicated bacteria on superficial implants or medical tools in the short term. Combining MoS2(S) and Ag3PO4 enhanced the separation efficiency of the photogenerated carriers and boosted the charge transfer, which improved the photodynamic performance of Ti–MoS2(S)–Ag3PO4. In addition, the photothermal property of MoS2 was not degraded after loading the Ag3PO4 nanoparticles on Ti–MoS2(S). Relying on the photodynamic effect to cooperate with the photothermal performance of the MoS2(S)–Ag3PO4 coating, Ti–MoS2(S)–Ag3PO4 exhibited the best antibacterial efficiency of 99.48 ± 0.19% and 99.77 ± 0.09% against S. aureus and E. coli, respectively, for 15 min. Furthermore, the MTT assay proved that Ti–MoS2(S)–Ag3PO4 had good biocompatibility in vitro, even compared to pure Ti. Therefore, the MoS2(S)–Ag3PO4 coating can be regarded as a potential material to address the problem of implant infection in clinics.
Supplementary Materials
The following supporting information can be downloaded at: https://www.mdpi.com/article/10.3390/coatings12091263/s1, Figure S1: XRD patterns of MoS2 powder scraped off from Ti–MoS2, Ti–MoS2(S), and Ag3PO4 NPs prepared in the same condition without Ti–MoS2(S); Figure S2: FE–SEM image of Ti–MoS2(S)–Ag3PO4 after the sterilization step. (scale bar: 500 nm); Figure S3: the antibacterial activities of the samples after 808 nm NIR light irradiation or staying in dark for 15 min. The antibacterial efficiency of the samples against S. aureus in the (A) second circle and (B) third circle. The error bars indicate means ± SD, n = 3; Figure S4: contact angle of Ti, Ti–MoS2(S), and Ti–MoS2(S)–Ag3PO4. (n = 3, *** p < 0.001, **** p < 0.0001); Figure S5: FESEM images of the cross-section of Ti-MoS2(S)–Ag3PO4.
Author Contributions
These authors contributed equally: H.X., D.W. and A.T. Conceptualization, H.X.; Data curation, Y.X. and H.G.; Formal analysis, H.X.; Funding acquisition, D.W.; Investigation, A.T.; Methodology, A.T. and Z.L.; Project administration, D.W.; Resources, D.W.; Supervision, J.M.; Validation, H.G.; Visualization, Y.X.; Writing—original draft, H.X.; Writing—review and editing, Z.L. and J.M. All authors have read and agreed to the published version of the manuscript.
Funding
This work was financially supported by the Natural Foundation of Tianjin (Grant No. 20JCZDJC00580) and Tianjin key Program of the Health Committee (Grant No. ZC20215).
Institutional Review Board Statement
Not applicable.
Informed Consent Statement
Not applicable.
Data Availability Statement
Not applicable.
Conflicts of Interest
The authors declare no conflict of interest.
References
- Attar, H.; Ehtemam-Haghighi, S.; Kent, D.; Dargusch, M.S. Recent Developments and Opportunities in Additive Manufacturing of Titanium-Based Matrix Composites: A Review. Int. J. Mach. Tools Manuf. 2018, 133, 85–102. [Google Scholar] [CrossRef]
- Tan, L.; Li, J.; Liu, X.; Cui, Z.; Yang, X.; Zhu, S.; Li, Z.; Yuan, X.; Zheng, Y.; Yeung, K.W.K.; et al. Rapid Biofilm Eradication on Bone Implants Using Red Phosphorus and Near-Infrared Light. Adv. Mater. 2018, 30, e1801808. [Google Scholar] [CrossRef] [PubMed]
- Campoccia, D.; Montanaro, L.; Arciola, C.R. A Review of the Biomaterials Technologies for Infection-Resistant Surfaces. Biomaterials 2013, 34, 8533–8554. [Google Scholar] [CrossRef] [PubMed]
- Qiao, Y.; Liu, X.; Li, B.; Han, Y.; Zheng, Y.; Yeung, K.W.K.; Li, C.; Cui, Z.; Liang, Y.; Li, Z.; et al. Treatment of MRSA-Infected Osteomyelitis Using Bacterial Capturing, Magnetically Targeted Composites with Microwave-Assisted Bacterial Killing. Nat. Commun. 2020, 11, 4446. [Google Scholar] [CrossRef]
- Ji, H.; Dong, K.; Yan, Z.; Ding, C.; Chen, Z.; Ren, J.; Qu, X. Bacterial Hyaluronidase Self-Triggered Prodrug Release for Chemo-Photothermal Synergistic Treatment of Bacterial Infection. Small 2016, 12, 6200–6206. [Google Scholar] [CrossRef]
- Lazar, V.; Martins, A.; Spohn, R.; Daruka, L.; Grezal, G.; Fekete, G.; Szamel, M.; Jangir, P.K.; Kintses, B.; Csorgo, B.; et al. Antibiotic-Resistant Bacteria Show Widespread Collateral Sensitivity to Antimicrobial Peptides. Nat. Microbiol. 2018, 3, 718–731. [Google Scholar] [CrossRef] [PubMed]
- Li, J.; Li, Z.; Liu, X.; Li, C.; Zheng, Y.; Yeung, K.W.K.; Cui, Z.; Liang, Y.; Zhu, S.; Hu, W.; et al. Interfacial Engineering of Bi2S3/Ti3C2TX MXene Based on Work Function for Rapid Photo-Excited Bacteria-Killing. Nat. Commun. 2021, 12, 1224. [Google Scholar] [CrossRef]
- Tan, L.; Li, J.; Liu, X.; Cui, Z.; Yang, X.; Yeung, K.W.K.; Pan, H.; Zheng, Y.; Wang, X.; Wu, S. In Situ Disinfection through Photoinspired Radical Oxygen Species Storage and Thermal-Triggered Release from Black Phosphorous with Strengthened Chemical Stability. Small 2018, 14, 1703197. [Google Scholar] [CrossRef]
- Jampilek, J.; Kralova, K. Advances in Nanostructures for Antimicrobial Therapy. Materials 2022, 15, 2388. [Google Scholar] [CrossRef]
- Li, M.; Li, L.; Su, K.; Liu, X.; Zhang, T.; Liang, Y.; Jing, D.; Yang, X.; Zheng, D.; Cui, Z.; et al. Highly Effective and Noninvasive Near-Infrared Eradication of a Staphylococcus aureus Biofilm on Implants by a Photoresponsive Coating within 20 Min. Adv. Sci. 2019, 6, 1900599. [Google Scholar] [CrossRef] [Green Version]
- Li, Y.; Liu, X.; Tan, L.; Cui, Z.; Jing, D.; Yang, X.; Liang, Y.; Li, Z.; Zhu, S.; Zheng, Y.; et al. Eradicating Multidrug-Resistant Bacteria Rapidly Using a Multi-Functional g-C3N4@ Bi2S3 Nanorod Heterojunction with or without Antibiotics. Adv. Funct. Mater. 2019, 29, 1900946. [Google Scholar] [CrossRef]
- Lishchynskyi, O.; Shymborska, Y.; Stetsyshyn, Y.; Raczkowska, J.; Skirtach, A.G.; Peretiatko, T.; Budkowski, A. Passive Antifouling and Active Self-disinfecting Antiviral Surfaces. Chem. Eng. J. 2022, 446, 137048. [Google Scholar] [CrossRef] [PubMed]
- Kumar, P.; Roy, S.; Sarkar, A.; Jaiswal, A. Reusable MoS2-modified Antibacterial Fabrics with Photothermal Disinfection Properties for Repurposing of Personal Protective Masks. ACS Appl. Mater. Interfaces 2021, 13, 12912–12927. [Google Scholar] [CrossRef] [PubMed]
- Liu, X.; Hersam, M.C. Interface Characterization and Control of 2D Materials and Heterostructures. Adv. Mater. 2018, 30, e1801586. [Google Scholar] [CrossRef] [PubMed]
- Gopalakrishnan, D.; Damien, D.; Shaijumon, M.M. MoS2 Quantum Dot-Interspersed Exfoliated MoS2 Nanosheets. ACS Nano 2014, 8, 5297–5303. [Google Scholar] [CrossRef]
- Yi, Z.; Ye, J.; Kikugawa, N.; Kako, T.; Ouyang, S.; Stuart-Williams, H.; Yang, H.; Cao, J.; Luo, W.; Li, Z.; et al. An Orthophosphate Semiconductor with Photooxidation Properties under Visible-Light Irradiation. Nat. Mater. 2010, 9, 559–564. [Google Scholar] [CrossRef]
- Hong, L.; Liu, X.; Tan, L.; Cui, Z.; Yang, X.; Liang, Y.; Li, Z.; Zhu, S.; Zheng, Y.; Yeung, K.W.K.; et al. Rapid Biofilm Elimination on Bone Implants Using Near-Infrared-Activated Inorganic Semiconductor Heterostructures. Adv. Healthc. Mater. 2019, 8, 1900835. [Google Scholar] [CrossRef]
- Fu, J.; Zhu, W.; Liu, X.; Liang, C.; Zheng, Y.; Li, Z.; Liang, Y.; Zheng, D.; Zhu, S.; Cui, Z.; et al. Self-Activating Anti-Infection Implant. Nat. Commun. 2021, 12, 6907. [Google Scholar] [CrossRef]
- Zhu, M.; Liu, X.; Tan, L.; Cui, Z.; Liang, Y.; Li, Z.; Yeung, K.W.K.; Wu, S. Photo-Responsive Chitosan/Ag/MoS2 for Rapid Bacteria-Killing. J. Hazard. Mater. 2020, 383, 121122. [Google Scholar] [CrossRef]
- Sheng, B.; Liu, J.; Li, Z.; Wang, M.; Zhu, K.; Qiu, J.; Wang, J. Effects of Excess Sulfur Source on the Formation and Photocatalytic Properties of Flower-Like MoS2 Spheres by Hydrothermal Synthesis. Mater. Lett. 2015, 144, 153–156. [Google Scholar] [CrossRef]
- Liu, Y.; Fang, L.; Lu, H.; Li, Y.; Hu, C.; Yu, H. One-Pot Pyridine-Assisted Synthesis of Visible-Light-Driven Photocatalyst Ag/Ag3PO4. Appl. Catal. B Environ. 2012, 115, 245–252. [Google Scholar] [CrossRef]
- Fahmy, A.; Friedrich, J.; Poncin-Epaillard, F.; Debarnot, D. Plasma Polymerized Allyl Alcohol/O2 Thin Films Embedded with Silver Nanoparticles. Thin Solid Film. 2016, 616, 339–347. [Google Scholar] [CrossRef]
- Fahmy, A.; Jácome, L.A.; Schönhals, A. Effect of Silver Nanoparticles on the Dielectric Properties and the Homogeneity of Plasma Poly (acrylic acid) Thin Films. J. Phys. Chem. C 2020, 124, 22817–22826. [Google Scholar] [CrossRef]
- Xu, J.-W.; Gao, Z.-D.; Han, K.; Liu, Y.; Song, Y.-Y. Synthesis of Magnetically Separable Ag3PO4/TiO2/Fe3O4 Heterostructure with Enhanced Photocatalytic Performance under Visible Light for Photoinactivation of Bacteria. ACS Appl. Mater. Interfaces 2014, 6, 15122–15131. [Google Scholar] [CrossRef]
- Manikandan, A.; Ilango, P.R.; Chen, C.-W.; Wang, Y.-C.; Shih, Y.-C.; Lee, L.; Wang, Z.M.; Ko, H.; Chueh, Y.-L. A Superior Dye Adsorbent towards the Hydrogen Evolution Reaction Combining Active Sites and Phase-Engineering of (1T/2H) MoS2/A-MoO3 Hybrid Heterostructured Nanoflowers. J. Mater. Chem. A 2018, 6, 15320–15329. [Google Scholar] [CrossRef]
- Lee, D.; Jang, J.H.; Song, W.; Moon, J.; Kim, Y.; Lee, J.; Jeong, B.; Park, S. In situ Work-function Measurement during Chemical Transformation of MoS2 to MoO3 by Ambient-pressure X-ray Photoelectron Spectroscopy. 2D Mater. 2020, 7, 025014. [Google Scholar] [CrossRef]
- Xu, L.; Li, D.; Zhou, W.; Ding, Y.; Wu, Y.; Xu, J.; Duan, X. High-Efficiency Electrodeposition of Polyindole Nanocomposite Using MoS2 Nanosheets as Electrolytes and Their Capacitive Performance. Arab. J. Chem. 2020, 13, 6061–6071. [Google Scholar] [CrossRef]
- Raja, A.; Chaves, A.; Yu, J.; Arefe, G.; Hill, H.M.; Rigosi, A.F.; Berkelbach, T.C.; Nagler, P.; Schuller, C.; Korn, T.; et al. Coulomb Engineering of the Bandgap and Excitons in Two-Dimensional Materials. Nat. Commun. 2017, 8, 15251. [Google Scholar] [CrossRef]
- Etacheri, V.; Seery, M.K.; Hinder, S.J.; Pillai, S.C. Highly Visible Light Active TiO2−XNX Heterojunction Photocatalysts. Chem. Mater. 2010, 22, 3843–3853. [Google Scholar] [CrossRef]
- Li, J.; Liu, X.; Tan, L.; Liang, Y.; Cui, Z.; Yang, X.; Zhu, S.; Li, Z.; Zheng, Y.; Yeung, K.W.K.; et al. Light-Activated Rapid Disinfection by Accelerated Charge Transfer in Red Phosphorus/ZnO Heterointerface. Small Methods 2019, 3, 1900048. [Google Scholar] [CrossRef]
- Liu, C.; Kong, D.; Hsu, P.C.; Yuan, H.; Lee, H.W.; Liu, Y.; Wang, H.; Wang, S.; Yan, K.; Lin, D.; et al. Rapid Water Disinfection Using Vertically Aligned MoS2 Nanofilms and Visible Light. Nat. Nanotechnol. 2016, 11, 1098–1104. [Google Scholar] [CrossRef] [PubMed]
- Li, Y.; Zhang, W.; Niu, J.; Chen, Y. Mechanism of Photogenerated Reactive Oxygen Species and Correlation with the Antibacterial Properties of Engineered Metal-Oxide Nanoparticles. ACS Nano 2012, 6, 5164–5173. [Google Scholar] [CrossRef] [PubMed]
- Jiang, H.Y.; Zhou, P.; Wang, Y.; Duan, R.; Chen, C.; Song, W.; Zhao, J. Copper-Based Coordination Polymer Nanostructure for Visible Light Photocatalysis. Adv. Mater. 2016, 28, 9776–9781. [Google Scholar] [CrossRef] [PubMed]
- Laine, D.F.; Blumenfeld, A.; Cheng, I.F. Mechanistic Study of the ZEA Organic Pollutant Degradation System: Evidence for H2O2, HO•, and the Homogeneous Activation of O2 by FeIIEDTA. Ind. Eng. Chem. Res. 2008, 47, 6502–6508. [Google Scholar] [CrossRef]
- He, L.; Brasino, M.; Mao, C.; Cho, S.; Park, W.; Goodwin, A.P.; Cha, J.N. DNA-Assembled Core-Satellite Upconverting-Metal-Organic Framework Nanoparticle Superstructures for Efficient Photodynamic Therapy. Small 2017, 13, 1700504. [Google Scholar] [CrossRef]
- Lai, Y.; Dong, L.; Zhou, H.; Yan, B.; Chen, Y.; Cai, Y.; Liu, J. Coexposed Nanoparticulate Ag Alleviates the Acute Toxicity Induced by Ionic Ag+ In Vivo. Sci. Total Environ. 2020, 723, 138050. [Google Scholar] [CrossRef]
- Xu, Q.; Li, S.; Wan, Y.; Wang, S.; Ma, B.; She, Z.; Guo, L.; Gao, M.; Zhao, Y.; Jin, C.; et al. Impacts of Silver Nanoparticles on Performance and Microbial Community and Enzymatic Activity of a Sequencing Batch Reactor. J. Environ. Manag. 2017, 204, 667–673. [Google Scholar] [CrossRef]
Publisher’s Note: MDPI stays neutral with regard to jurisdictional claims in published maps and institutional affiliations. |
© 2022 by the authors. Licensee MDPI, Basel, Switzerland. This article is an open access article distributed under the terms and conditions of the Creative Commons Attribution (CC BY) license (https://creativecommons.org/licenses/by/4.0/).