Article

Hydrothermal Synthesis of Nitrogen-Doped and Excitation-Dependent Carbon Quantum Dots for Selective Detection of Fe3+ in Blood Plasma

1
Department of Molecular Biology and Genetics, Ataturk University, Erzurum 25240, Turkey
2
Department of Nanoscience and Nanoengineering, Ataturk University, Erzurum 25240, Turkey
3
Department of Chemical Engineering, Ataturk University, Erzurum 25240, Turkey
4
Department of Pharmacology, Ataturk University, Erzurum 25240, Turkey
*
Authors to whom correspondence should be addressed.
Coatings 2022, 12(9), 1311; https://doi.org/10.3390/coatings12091311
Submission received: 3 August 2022 / Revised: 26 August 2022 / Accepted: 31 August 2022 / Published: 8 September 2022
(This article belongs to the Special Issue Nanoparticles for Energy, Sensing and Biomedical Applications)

Abstract

:
In the last two decades, fluorescent carbon quantum dots (CQDs) have attracted intense interest as a new fluorescent nanomaterial with unique properties. This material offers significant advantages compared with conventional dyes and inorganic QD systems, and is used extensively in many different fields, especially in bioimaging and sensor applications. Despite all the positive values they offer, the production of CQD systems with excitation wavelength-dependent nature and high quantum yield (QY) is still a scientific challenge. In this study, we proposed the fabrication of CQD through a facile and easy-to-tune hydrothermal method using cheap and biocompatible precursors such as urea and lactic acid. The effect of experimental parameters including synthesis time, temperature, and mass ratio of the precursors, were determined to obtain the highest QY (48%). The as-prepared nitrogen-doped (N-doped) CQDs exhibited robust stability in the dark and in a wide range of pH values with excitation wavelength-dependent properties. Additionally, CQDs showed remarkable sensitivity and selectivity in the sensing of Fe3+ in blood plasma with a linear correlation in the range of 0–1000 μM, indicating the high potential of CQDs in practical applications. Lastly, cytotoxicity and antibacterial activity tests demonstrated the low toxicity and high biocompatibility of proposed CQDs. Considering the facile and efficient synthetic method, easy-to-tune optical properties, excitation-dependent nature, high fluorescence activity, and low cytotoxicity, we strongly anticipate that N-doped CQDs could provide unique advantages in various biomedical applications including diagnosis, bioimaging, and biosensors.

Graphical Abstract

1. Introduction

Since their discovery in 2004, carbon quantum dots (CQDs) have attracted wide attention and have been employed in various applications worldwide [1,2,3,4]. CQDs are a new class of zero-dimensional carbon-based nanomaterials with a size, in general, of less than 10 nm, and exhibit strong fluorescent activity [5]. Despite the similarities in their size and photoelectrochemical characteristics, CQDs differ in their surface microstructure and surface chemical groups. CQDs, as spherical nanoparticles with a carbon-based skeleton, have many oxygen-containing groups on the surface [6]. The size, chemical content, and surface groups of CQDs can be finely tuned to manipulate their electronic structure and resultant fluorescent properties. CQDs not only inherit the excellent optical properties of conventional inorganic semiconductor QDs, but eliminate their shortcomings in terms of cytotoxicity, environmental toxicity, and biohazard. In addition, CQDs provide unique advantages such as good solubility in water, high chemical stability, photobleaching resistance, easy functionalization of the surface structure, and enabling large-scale production [7]. With their extraordinary structure and properties, they have been widely used in many fields including biological and chemical sensor applications, nanomedicine, bioimaging, and photoelectrocatalysis [4,8,9].
To date, significant progress has been made in the synthesis and application of CQDs. Both top-down and bottom-up approaches are employed for the fabrication of CQDs. In top-down fabrication methods, bulk carbon precursors such as graphite, dried wax, and carbon rods are transformed into nanosized materials [2,10,11,12,13]. The synthesis of CQDs through a top-down approach involves electrochemical oxidation, laser ablation, arc-discharge, and high-energy ball milling methods [14,15,16,17]. However, in bottom-up approaches, molecules and polymers are converted into carbon-based materials by dehydration and subsequent carbonization [18]. Bottom-up methods are easier to implement and can be used for large-scale production of CQDs. This approach covers many methods including hydrothermal, solvothermal, microwave-assisted methods, ultrasonic-assisted methods, combustion, and chemical vapor deposition (CVD) [19,20,21,22,23,24,25,26,27,28,29]. Of these approaches, the hydrothermal method is one of the most widely used procedures due to its simplicity, low cost, and employment of cheap and easily accessible precursors, enabling the synthesis of CQDs with high quantum yield (QY) [30,31,32]. Additionally, many experimental parameters including synthesis time, temperature, and the ratio of the precursors can be manipulated to tune the optical characteristics of CQDs [2,33].
Despite the extraordinary nature of CQDs and significant progress in fabrication protocols, limited studies have created fluorescence activity with high QY (>25%) and robust stability [34]. To eliminate these drawbacks, surface passivation/functionalization and element doping approaches have been proposed and implemented [35,36,37]. The surface passivation/functionalization methods dictate the usage of expensive and time-consuming protocols, produce CQDs with larger sizes, and do not enable proper large-scale fabrication [38,39]. The doping of CQDs with heteroatoms such as nitrogen, phosphorus, sulfur, etc., is the most preferred and effective method to overcome such limitations. Additionally, doping with heteroatom may lead to the emergence of new energy levels to form trap states resulting in excitation-dependent fluorescence characteristics [40,41]. In heteroatom doping, nitrogen (N) is the most utilized element due to its similar atomic size to C and high chemical reactivity, which improve the optical performance [42,43,44]. Although there have been some reports on the synthesis of N-doped CQDs, further studies are highly necessary to clarify the phenomena behind these nanosystems with high QY and excitation-dependent emission characteristics.
Ferric ion (Fe3+) is an essential element for human beings and has important roles in many physiological activities such as the action of enzymes, hemoglobin synthesis, electron transfer, and oxygen transportation [2,45,46,47]. Iron deficiency is the most common dietary deficiency worldwide and may create symptoms such as tiredness, lack of energy, shortness of breath, pale skin, and limitations in motor and mental growth as well as various disorders and physiological damage in humans [48,49]. On the other hand, the excessive presence of iron may result in diseases such as hemochromatosis due to the iron storage ailment. For the detection of Fe3+ ions, many analytical techniques such as inductively coupled plasma mass spectrometry, atomic absorption spectrometry, and electrochemical method have been employed [50,51]. Unfortunately, these methods require expensive and sophisticated devices and highly experienced technical staff for complicated sample preparation procedures and operations [50]. Hence, CQDs with high QY, robust stability, and flexible synthesis procedures may provide unique advantages in the quantitative and qualitative detection of Fe3+ ions. To date, many studies have been performed to detect Fe3+ ions in biological samples using CQDs [50,51,52,53,54,55,56,57,58,59,60,61,62]. In addition to CQDs, other nanoparticle systems such as graphene QDs, inorganic QDs, MgO, and gold nanoparticles have been extensively employed in the detection of Fe3+ ions [63,64,65,66,67,68,69]. The detection of Fe3+ ions using CQDs mainly depends on fluorescence quenching which is correlated with the amount of ions in the medium. Despite recent studies, low-cost, facile, scalable procedures to fabricate CQDs with high QY and excitation-dependent emission characteristics are highly demanded for sensing Fe3+ ions.
In this work, we employed a simple yet facile hydrothermal method for the synthesis of N-doped CQDs using urea and lactic acid as precursors. To the best of our knowledge, this is the first study where urea and lactic acid have been utilized in the fabrication of CQDs. The effect of synthesis time, temperature, and the ratio of precursors were evaluated systematically via UV-visible absorption and fluorescence spectra of as-prepared CQDs. For all cases, CQDs with high QY, high solubility, low cytotoxicity, high stability, and excitation-dependent emission nature were produced. The CQDs prepared in optimized conditions were further analyzed via electron microscopy (TEM), X-ray diffraction (XRD) spectroscopy, Fourier transform infrared spectroscopy (FT-IR), and X-ray photoelectron spectroscopy (XPS). The CQDs exhibited high selectivity against Fe3+ ions and a linear correlation for a wide concentration range in both water and blood plasma. The cytotoxicity and antibacterial tests showed the low cytotoxicity and high biocompatibility of CQDs for biomedical applications.

2. Experimental Section

2.1. Production and Characterization of CQDs through Hydrothermal Method

For the synthesis of CQDs, we employed a hydrothermal procedure that covered the employment of lactic acid (carbon source) and urea (nitrogen and carbon source) as precursors. For this, a proper amount of urea and lactic acid was dissolved in 10 mL of deionized water and mixed in a magnetic stirrer until it reached a homogeneous consistency. Then, the solution was transferred to a Teflon-lined stainless steel reactor (40 mL) and incubated in a preheated autoclave. For the optimization, we manipulated some synthesis parameters including reaction time (3–24 h), temperature (140–220 °C), and mass ratio of urea (≥99.5%) to lactic acid (92.0%) (1:1 (1 M:1 M), 1:3 (0.5 M:1.5 M) and 3:1 (1.5 M:0.5 M)). After incubation, the reactor was cooled to room temperature and centrifuged at 18,659 RCF (14,000 RPM) for 30 min to separate the aggregate structures. Unreacted impurities were removed by dialysis membrane (MW cut-off 1000 Da) for 24 h. To test reproducibility, each synthesis was repeated three times and average results were provided in the report. The as-prepared CQDs were characterized by UV-vis absorption spectroscopy (Shimadzu, UV–1800, Kyoto, Japan), fluorescence spectroscopy (Agilent Cary Eclipse, Santa Clara, CA, USA), TEM (Hitachi HighTech HT7700, Tokyo, Japan), XRD (PANalytical Empyrean, Malvern, UK), FT-IR (Bruker VERTEX 70v, Billerica, MA, USA) and XPS (Specs-Flex XPS, Berlin, Germany). In addition, the quantum efficiency was calculated to determine the fluorescence activity of the produced CQD systems. Quantum yield was determined based on the approach by Jiang et al. [70].

2.2. pH Stability of the CQDs

Since most of the metal ions were required to be detected in high basic or acidic conditions, we performed some studies to evaluate the stability of CQDs in a wide pH range. To test pH stability, the optical nature of CQDs was measured in the pH range of 3 to 9. To manipulate the pH of CQD suspension, a concentrated solution (1 M) of hydrochloric acid (HCl, 37%, Sigma-Aldrich, St. Louis, MO, USA) and sodium hydroxide (NaOH, 98%, Sigma-Aldrich) was employed. After 30 min, the change in optical properties was determined through fluorescence and UV-vis spectra.

2.3. Sensing of Metal Ions

In this part, we employed various metal salts to determine if there was any selective detection of metal ions through the variation in fluorescence spectra. For this, FeCl3·6H2O, SrCl2, Al2(SO4)3, CdCl2, SbCl3, AgNO3, CdSO4, BaCl2, and MnSO4 were employed. The stock of each metal solution was prepared by dissolving a proper amount of metal salt in PBS buffer (pH = 9.4) with a metal ion concentration of 10 mg/mL. Then, a proper amount of metal ion solutions was added to the as-prepared CQD suspension. After 30 min of incubation, fluorescence and UV-vis spectra of the mixture were collected.

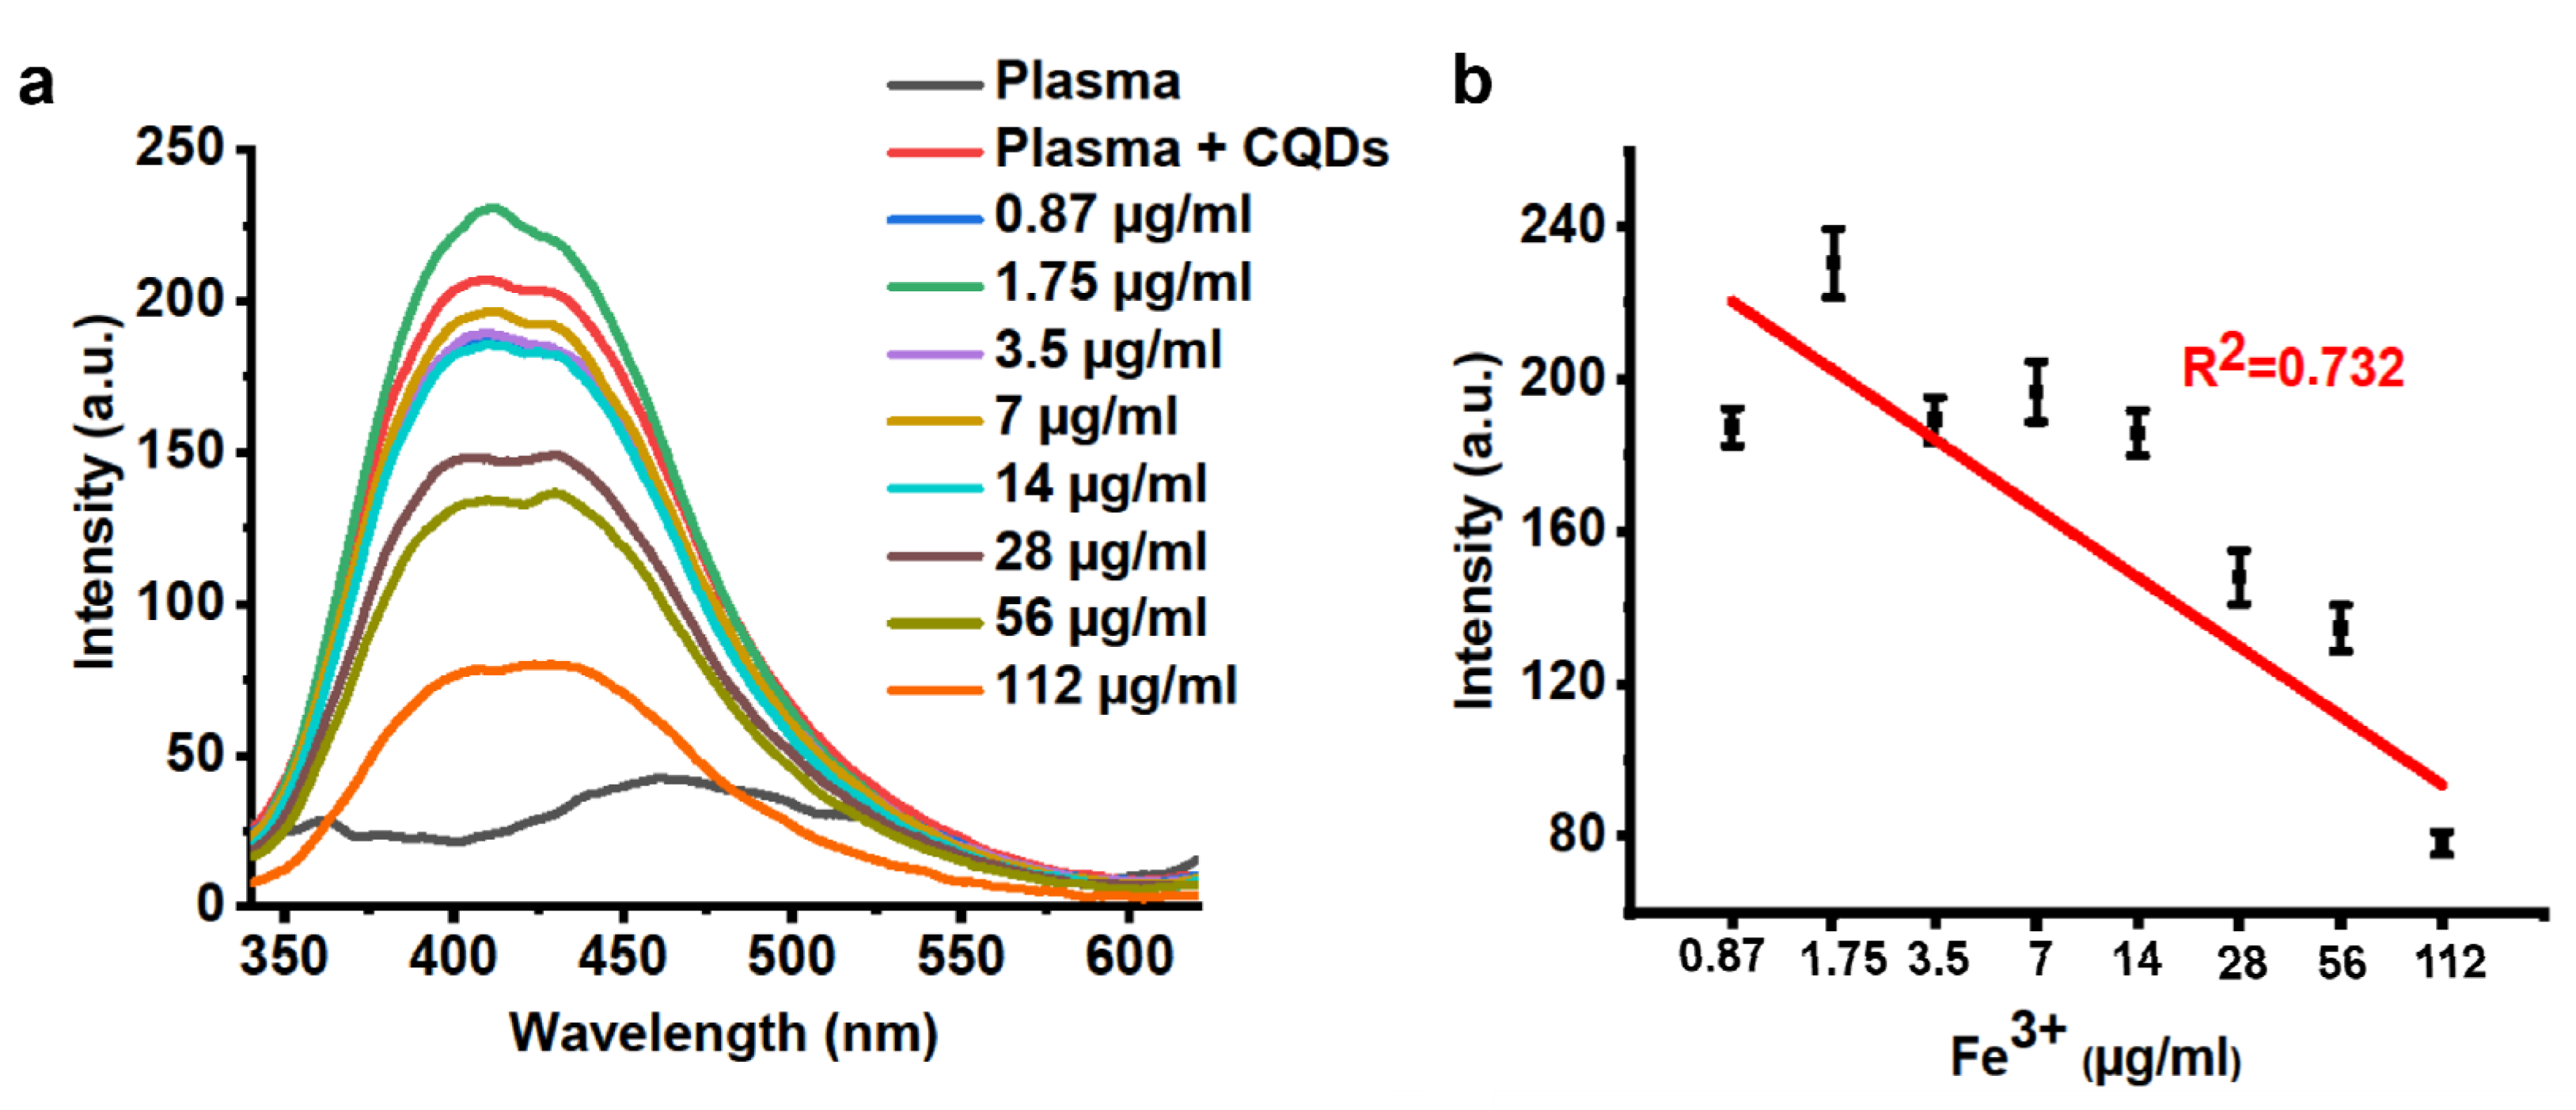
2.4. Sensing of Fe3+ Ions in Blood Plasma

Firstly, the blood, collected from a healthy male individual, was centrifuged at 4000 RPM for 10 min. The cells were removed and the plasma, as the supernatant, was obtained using a Pasteur pipette. Then, 2 mL of CQD suspension was added to 1 mL of diluted plasma (×4). A proper amount of Fe+3 solution was added to the plasma–CQD mixture and incubated for 30 min. The change in optical properties was determined through fluorescence and UV-vis spectra.

2.5. Cytotoxic Activity of CQDs

Cytotoxic effects of the CQDs were investigated in MRC5 (healthy lung fibroblast) and A549 (lung cancer) cell lines. In this context, cells obtained from the cell bank available in DAYTAM, were employed. A549 cells were grown in F-12K medium containing 1% antibiotic–antimycotic mixture (10,000 U/mL potassium penicillin, 10,000 µg/mL streptomycin sulfate and 25 µg/mL amphotericin B), 1% L-glutamine and 10% fetal bovine serum. MRC 5 cells were treated with EMEM medium containing 1% antibiotic–antimycotic mixture (10,000 U/mL potassium penicillin, 10,000 µg/mL streptomycin sulfate and 25 µg/mL amphotericin B), 1% l-glutamine and 10% fetal bovine serum. All cells were grown and stocked in an incubator at 37 °C with 5% CO2 and 90% humidity until the cell density reached 80%. When the cells became confluent, they were seeded in 96-well plates in (5–20) × 104 numbers and kept for 24–48 h to attain the appropriate density for cytotoxicity experiments. Afterward, the as-prepared CQDs in the concentration range of 30–1000 ppm were exposed to the cells. Cells grown in the sole growth medium were used as the negative control, and cells treated with 250 µM of hydrogen peroxide (H2O2) were considered as the positive control. Cytotoxic effects were determined by the MTT [3-(4,5-dimethylthiazol-2-yl)-2,5-diphenyl tetrazolium bromide] method which is based on mitochondrial activity measurement. After removal of the medium, each well was washed with dPBS to prevent CQD from interfering with MTT. For this, a 100 µL of medium containing 5 mg/mL of MTT was added to each well and incubated at 37 °C for 4–12 h. Afterward, the upper liquid in the wells was discarded and 150 µL of DMSO was added to the wells to dissolve the formazan crystals. Measurements were performed through a microplate reader (Biotek Epoch, Agilent, Santa Clara, CA, USA) at 570 nm to determine changes in cell proliferation.

2.6. Antimicrobial Activity of CQDs

Firstly, LB agar was poured into sterile Petri dishes in equal volumes and allowed to cool. Then, the frozen cells (E. coli) started to dissolve slightly and 50 µL was dropped onto a solid medium and inoculated. Afterward, it was left in an oven at 37 °C for 24 h. The next day, the formation of the colony was observed. The liquid medium was prepared and the cells were taken from the solid medium to the liquid medium with the help of a loop. It was left in a shaker at 37 °C at 100 rpm for 24 h. For the antibacterial test, 125 µL of medium and 75 µL of bacteria were added to each well. A proper amount of CQDs was placed on it and pipetting was performed thoroughly. Then, the 96-well plate was left in an oven at 37 °C for 36 h in daylight or dark. Lastly, antimicrobial activity was detected using a microplate reader at 600 nm.

3. Results and Discussion

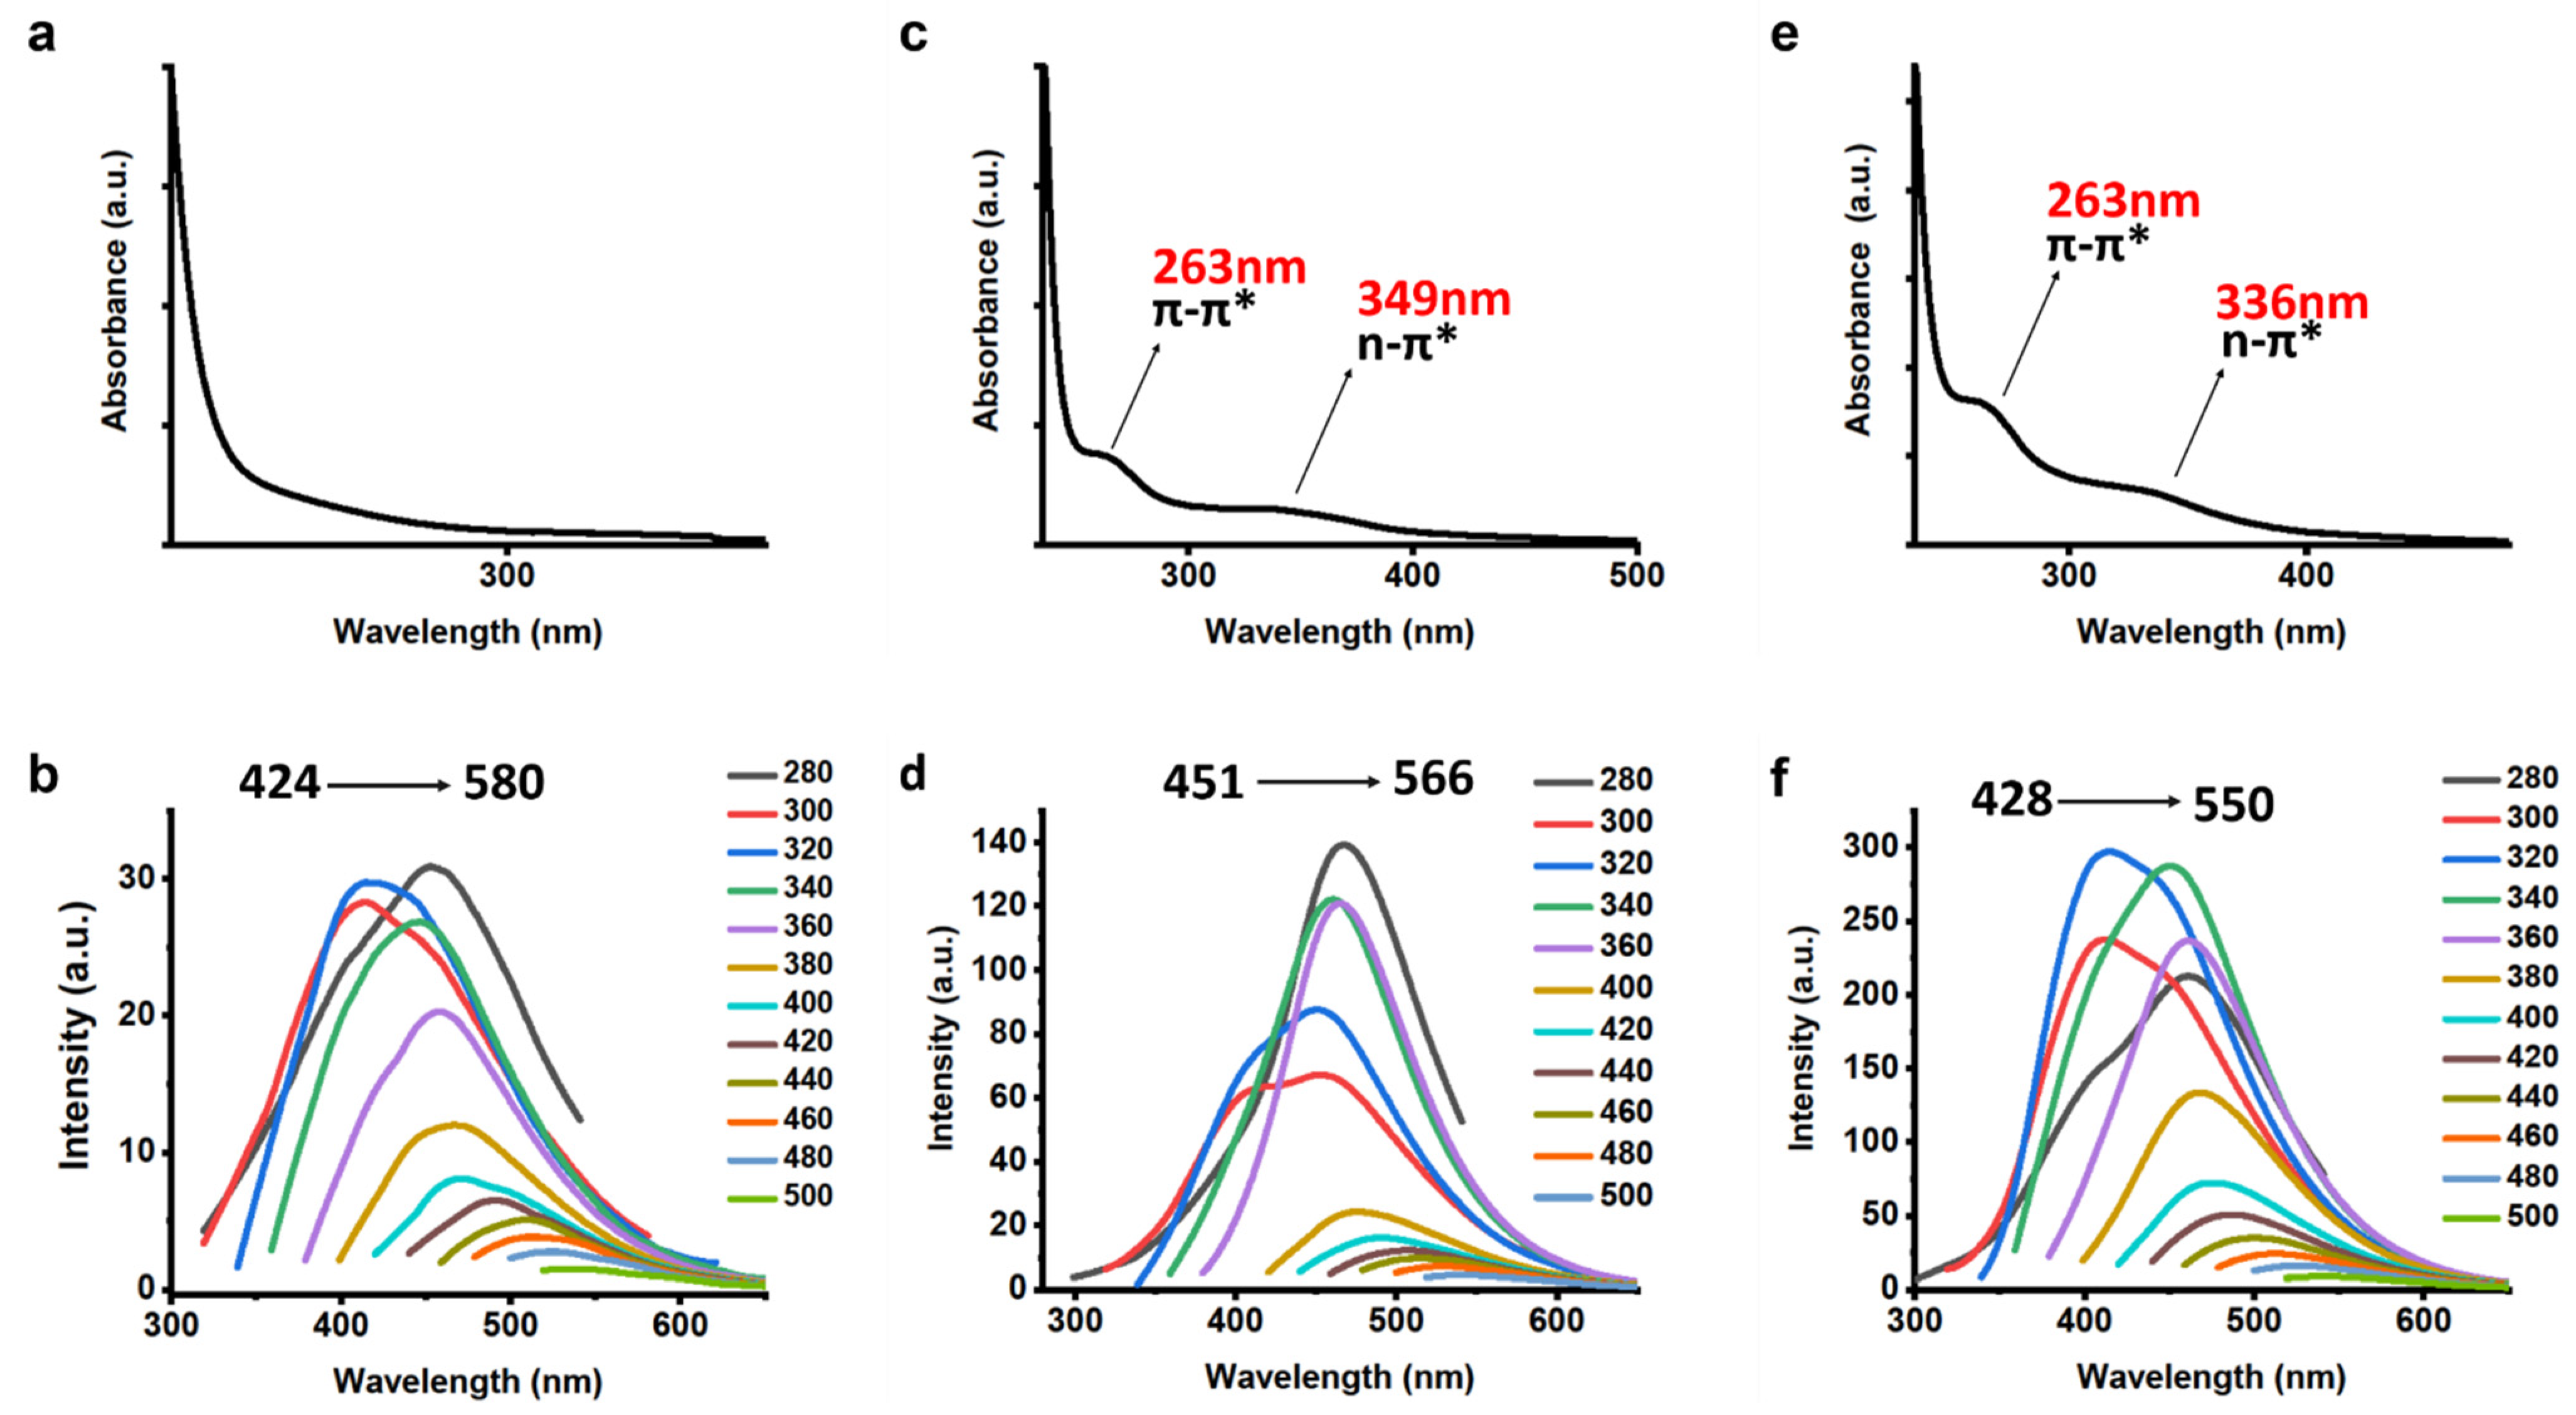
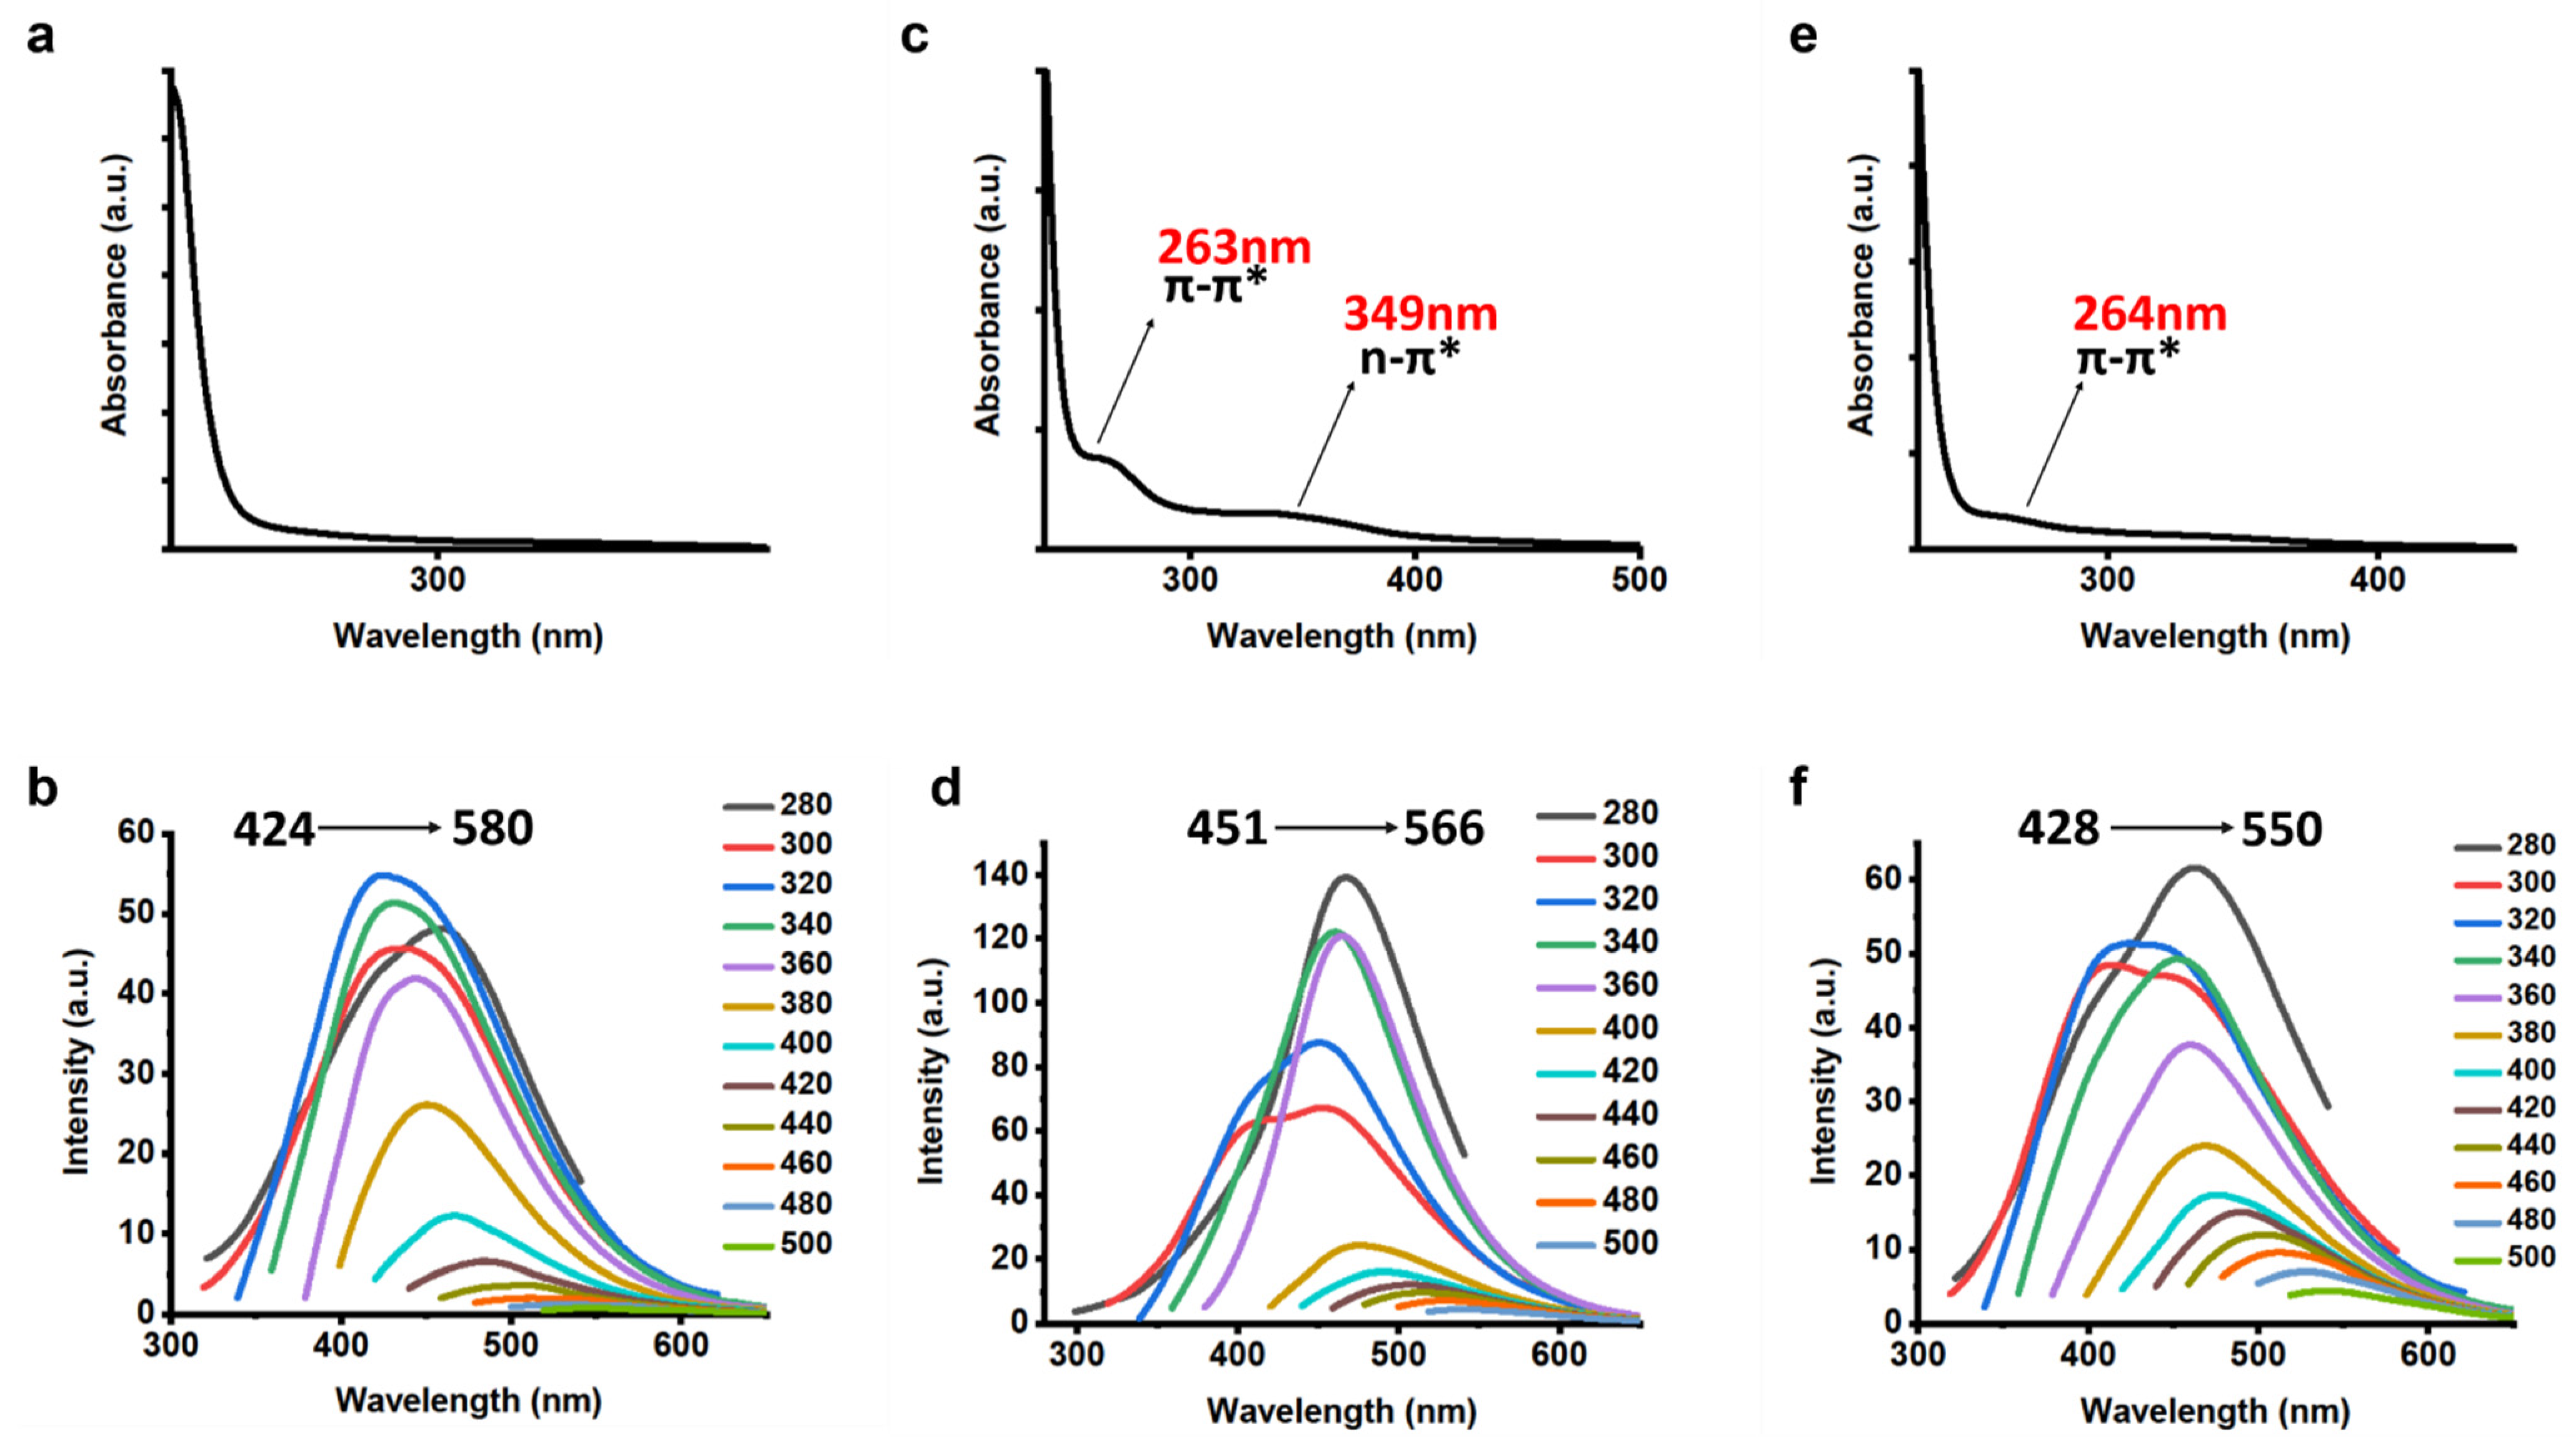
3.1. Characterization of CQDs

In the first part, we investigated the effects of some experimental parameters such as synthesis time, temperature, and mass ratio of precursors, in detail. For this, we employed UV-vis absorption and PL spectroscopy to evaluate the as-synthesized CQDs.

3.2. Effect of Experimental Parameters

Firstly, we manipulated the synthesis time in the range of 3–24 h at a constant synthesis temperature (180 °C) and ratio of precursors (1:1 M:M). The optical properties including UV-vis absorption and PL spectra are summarized in Figure 1 for each synthesis. From UV−vis spectra, we observed a weak shoulder ranging from 251 to 263 nm indicating a π-π* transition band (Figure 1a,c,e). This band was mainly due to the presence of aromatic C–C bonds in the structure of CQDs [71,72]. As the synthesis time increased, the π-π* transition band became more apparent. The maxima of the shoulder shifted to higher bandgaps. This issue was attributed to the low carbonization of precursors at a lower synthesis time [32]. Additionally, a broad peak at around 340 nm indicated the presence of n-π* transition of C=O bonds as well as surface groups such as N-related functional-surface ones [73,74]. The fluorescent characteristics of the CQDs were evaluated through a detailed PL analysis using different excitation wavelengths in a wide range of 280–500 nm (Figure 1b,d,f). For all runs, the functional-surface groups in CQDs created trap states with different energy levels and led to an excitation-dependent nature of CQDs. The increase in the excitation wavelengths resulted in a shift in fluorescence maxima from 428 to 574 nm. For the case of 3 h (Figure 1b), remarkably lower fluorescence activity was detected compared with higher synthesis times (Figure 1d,f). In line with UV-vis data, it was obvious that the lower synthesis time could not provide substantial carbonization and resultant fluorescence activity. However, the increase in synthesis time provided a significant improvement in fluorescence emission. No remarkable difference was observed for the cases of 12 and 24 h runs. It seemed that for these synthesis times, the precursors were sufficiently carbonized to fabricate CQDs with a high fluorescence activity.
Secondly, we tuned the synthesis temperature ranging from 140 to 220 °C at a constant synthesis time (12 h) and ratio of precursors (1:1 M:M). Similar to the previous part, UV-vis absorption and PL spectra were collected, and are summarized in Figure 2 for each run. Interestingly, no absorption maxima were detected (Figure 2a) for the CQDs prepared at a lower temperature (140 °C). It seemed that the low synthesis temperature led to insufficient carbonization and resultant relatively poor fluorescence activity (Figure 2b) [75]. However, for the cases of 180 and 220 °C (Figure 2c,e), π-π* transition (aromatic C-C bonds), n-π* transition bands (C=O bonds), and N-related functional-surface or other surface groups were observed at around 260 and 340 nm, respectively. In line with the previous subsection, the CQDs showed an excitation-dependent nature for all synthesis temperatures (Figure 2b,d,f) with fluorescence maxima in the range of 413–576 nm under different excitation wavelengths. The increase in synthesis temperature (Figure 2d,f) dramatically enhanced the fluorescence emission activity (approximately four and nine times higher for the cases of 180 and 220 °C, respectively). It was obvious that the increase in the synthesis time created satisfactory carbonization of the precursors and high fluorescence activity. The highest fluorescence for the case of 220 °C (Figure 2f) may be attributed to the enhanced carbonization (compare Figure 2c,e).
Lastly, we determined the optical properties of as-prepared CQDs under different ratios of the precursor using UV-vis and PL spectra (Figure 3). No absorption maxima were detected (Figure 3a) for the case of a 1:1 M:M ratio of precursors. Accordingly, relatively low PL activity (Figure 3b) was observed, which was attributed to the low content of the precursors. However, the increase in the urea or lactic acid content (Figure 3c,e) resulted in the emergence of π-π* transition (aromatic C–C bonds), n-π* transition bands (C=O bonds), and N-related functional-surface or other surface groups which were observed at around 260 and 350 nm, respectively. Interestingly, the PL spectra of CQDs for each run showed an excitation-dependent nature with fluorescence maxima in the range of 424–580 nm under different excitation wavelengths (Figure 3b,d,f). In this set, the highest fluorescence activity (Figure 3d) was observed for the case of 1:3 M:M (higher lactic acid content). The high content of lactic acid created improved the emergence of more π-π* and n-π* transition bands (compare Figure 3c,e) and resultant fluorescence activity.
After determining synthesis time, temperature, and the ratio of precursors on some optical properties such as UV-vis absorption and PL spectra, we performed the following further analyses for CQDs at the optimized conditions.

3.3. Further Characterization of CQDs

At this stage, we employed various techniques (Figure 4) to evaluate the further characterization of CQDs. For this, CQDs were prepared at optimized conditions: 12 h of synthesis time, 220 °C of synthesis temperature, and 1:3 M:M of the ratio of precursors. From the optic images collected, the CQD suspension with a pale brown color in daylight showed a bright blue emission under UV lamp (365 nm) irradiation (Figure 4a). The normalized fluorescence emission spectra indicated that the increase in the excitation wavelengths in the range of 280–500 nm led to an obvious redshift in fluorescence maxima from 411 to 542 nm (Figure 4b). The strong emission of CQDs yielded a high quantum yield of 48% obtained at 360 nm excitation wavelength through the data summarized in Figure S1 using quinine sulfate as reference material. The obtained quantum yield value was highly comparable with other CQD studies in the literature (see Table S1). The morphology and size examination of CQDs via TEM images exhibited the presence of nanomaterials in mostly spherical form ranging from 2 to 10 nm with an average diameter of 5.6 ± 4 nm (Figure 4c). The XRD pattern (Figure 4d) of the CQDSs exhibited a broad peak at 20.1° corresponding to the (002) plane (JCPDS card No. 26-1076). This structure indicated the amorphous carbon was composed in a highly random fashion [76,77]. The interlayer spacing (d) of the (002) plane was found to be 4 ± 0.3 Å, which was greater than bulk graphite (3.3 Å) confirming the amorphous or semi-crystalline characteristic of the CQDs.
For further analysis of the molecular structure and chemical composition of CQDs, we performed FT-IR spectroscopy (Figure 4e). The bands observed at 3186, 3047, 1562, 1425, 1314, 1110, and 1035 cm−1 were assigned to υ (-OH), υ (-NH), δ (C=C), υ (C-H), υ (C=O), υ (C-N), and υ (C-O-C), respectively [78]. Some hydrophilic groups including υ (-OH), υ (-NH), and υ (C=O) confirmed the high stability of CQDs in water [79,80,81]. Additionally, δ (C=C), υ (C-H), and υ (C-N) groups proved the polyaromatic structure of CQDs [82,83]. FT-IR spectra of precursors (urea and lactic acid) (see Figure S2) further proved the substantial carbonization of the precursors under the experimental conditions. The bonding structures and surface composition dots were evaluated via a detailed XPS analysis (Figure 4f–h,j). The full XPS survey spectra provided three major peaks at around 285, 401, and 531 eV, assigned to C1s, N1s, and O1s, respectively (Figure 4f). The elemental content of the CQDs for C/N/O was detected as 56.7/7.8/35.5. It seems that the proposed hydrothermal approach led to the co-carbonization of urea and lactic acid in the structure of the resultant CQDs, to some extent. High-resolution XPS spectra for C1s exhibited three peaks, corresponding to C-C/C=C, C-N/C-O, and C=O bonds at 284.5, 285.9, and 288.1 eV, respectively (Figure 4g). Two prominent peaks were fitted in O1s high-resolution spectra (Figure 4h) at 531.5 and 535.6 eV, which indicated the presence of C=O and C-OH groups, respectively. Lastly, N1s spectra (Figure 4j) was convoluted to three peaks at 399.4, 401.0, and 405.1 eV, assigned to pyrrolic-N, graphitic-N and chemisorbed-N, respectively [84]. In summary, the detailed data and evaluation confirmed that we sufficiently prepared CQDs with a graphite core with a high degree of defects and disorders through the hydrothermal method using urea and lactic acid as precursors, and nitrogen was incorporated into the structure successfully.
The stability of CQDs for a long period at different storage conditions determines their usage in practical applications. For this, we performed the stability test for as-prepared CQDs in daylight or dark conditions. PL (Figures S3 and S4) and UV-vis absorption spectra (Figure S5) were collected at different time intervals and the change in fluorescence intensity over time is summarized in Figure 4k. In daylight, after 15 days of storage, the fluorescence activity decreased remarkably (see Figure 4k and Figure S4). However, even after 60 days, CQDs preserved their fluorescence emission when they were stored in the dark (see Figure 4k and Figure S3). It must be noted that in addition to the activity, no change was detected in the excitation-dependent nature of CQDs (Figure S3). From UV-vis spectra (Figure S5), a significant decrease was detected in the π-π* and n-π* band transition of CQDs stored in daylight for 60 days in comparison with freshly-prepared samples. This phenomenon mainly may be attributed to the structural changes in the material over time.
In various practical applications including metal ion detection, the stability of CQDs in a wide range of pH values is a major concern that must be considered. Therefore, we tested the stability of our CQDs at different pH values using PL spectra (Figure 4l,m). Only for a pH value of 3, was a noticeable decrease observed in PL activity. However, for pH values in the range of 4–9, the change was acceptable, indicating the proper usage of the material under given conditions.

3.4. Sensing of Fe3+ Ions

After the detailed evaluation of CQDs, we tested their sensing ability for different metal ions. The presence of various functional groups such as -OH, -COOH and -NH2 on the surface of the dots may provide sensing characteristics for metal ions. For this, firstly, we combined the CQD suspension with various metal ions such as Sr2+, Al3+, Cd2+, Sb3+, Ag+, Ba2+, Mn2+, and Fe3+ at a fixed concentration (125 µM) in deionized water (Figure 5). The selectivity test (Figure 5a) exhibited a higher tendency of Fe3+ ions to quench the fluorescence activity of CQDs compared with the other metal ions. The high selectivity of as-prepared CQDs towards the detection of Fe3+ may be attributed to the stronger affinity of these ions than the other metal ions. Further, to determine the sensitivity of dots in the sensing of Fe3+ ions, we performed fluorescence titrations in the presence of metal ions with different concentrations (Figure 5b–d). The fluorescence intensity of the CQDs was gradually quenched when the concentrations of Fe3+ ions increased from 0 to 1000 μM. No remarkable shift was detected in the PL spectra after the addition of metal ions (Figure 5c). A linear correlation (Figure 5d) with a highly acceptable R2 value (0.96) was noticed for a wide concentration range of Fe3+. These data indicate the high potential of CQDs in the detection of Fe3+ ions in practical applications. The limit of detection value (7.8 μM) was highly compatible with the other type of CQDs given in the literature (see Table S1). Additionally, we measured the UV-vis absorption spectra of CQDs (Figure 5e) after the addition of Fe3+ ions. However, no significant change was detected in their optical properties. Furthermore, we tested the promising prospective application for Fe3+ ions detection in actual samples such as blood plasma (Figure 6). In a wide concentration range of Fe3+ ions, the blood plasma samples exhibited a gradual quench with a linear correlation. The selectivity and sensitivity studies proved the high potential of CQDs in the detection of Fe3+ ions in biological samples.

3.5. Cytotoxicity and Antibacterial Activity of CQDs

The potential usage of nanoparticles in biomedical applications is highly dependent on their cytotoxicity. Therefore, in this study, we employed a standard MTT assay to determine the toxicity of CQDs on both MRC5 and A549 cell lines. The viability of each cell line after 24 h incubation with different concentrations of CQDs ranging from 30 to 1000 ppm was evaluated, and is summarized in Figure 7a. CQDs exhibited similar toxic effects on both cell lines in a concentration-dependent manner. Even at the maximum concentration (1000 ppm), cell viability values were found to be 73.8% and 81.1% for MRC5 and A549, respectively. Cell viability tests proved the low toxicity and high biocompatibility of prepared CQDs. These results were significantly comparable/compatible with the other type of carbon-based fluorescent materials given in the literature (see and compare Table S2).
Lastly, we tested the antibacterial activity of CQDs against Escherichia coli strains at different concentrations in daylight and dark (Figure 7b,c). OD at 600 nm, indicating bacterial activity, exhibited antibacterial activity in a concentration-dependent manner both in daylight and dark. However, in daylight, CQDs showed higher antibacterial activity than in the dark. These phenomena can be attributed to the photoexcited state processes and redox characteristics of CQDs which are responsible for their antimicrobial properties [85,86,87,88].

4. Conclusions

In summary, we fabricated N-doped CQDs with significantly high QY (48%) and excitation-dependent characteristics through a low-cost, simple, and flexible method. In the synthesis, we employed a facile and efficient hydrothermal method using cheap, simple, and biocompatible precursors such as urea and lactic acid. The effect of fabrication parameters including synthesis time, temperature, and mass ratio of precursors were examined in detail through UV-vis and fluorescence spectroscopy. CQDs exhibited good sensitivity and selectivity in the sensing of Fe3+. A linear correlation was observed in the decrease in fluorescence intensity of the CQDs as the concentrations of Fe3+ ions increased from 0 to 1000 μM, indicating the high potential of CQDs in practical applications. Additionally, cytotoxicity and antibacterial activity tests showed the low toxicity and high biocompatibility of proposed CQDs. Combining its facile and efficient synthetic method, easy-to-tune optical properties, excitation-dependent nature, high fluorescence activity, and low cytotoxicity, it is anticipated that N-doped CQDs could provide unique advantages in various biomedical applications such as diagnosis, bioimaging, and biosensors.

Supplementary Materials

The following supporting information can be downloaded at: https://www.mdpi.com/article/10.3390/coatings12091311/s1, Figure S1: Integrated fluorescent intensity vs. absorbance of CQDs and reference. Quinine sulfate was selected as a reference for the calculation of quantum yield, Figure S2: FT-IR spectra of lactic acid and urea, Figure S3: The stability of CQDs stored in dark through the fluorescent spectra collected at different excitation wavelengths intensity for different time intervals, Figure S4: The stability of CQDs stored under daylight through the fluorescent spectra collected at different excitation wavelengths intensity for different time intervals, Figure S5: The stability of CQDs stored in dark (b) and daylight (c) through the UV-vis spectra collected on the 60th day of storage. For the comparison, UV-vis spectra for freshly-prepared CQD were provided in (a); Table S1: QY and LOD values of different CQDs prepared through hydrothermal synthesis, Table S2: The IC50 values of CQDs prepared using different precursors for different cell lines. References [89,90,91,92,93,94,95,96,97,98,99,100,101,102,103,104,105,106] are cited in the Supplementary Materials.

Author Contributions

Conceptualization, S.A. and O.U.; methodology, S.A., O.U., A.G. and T.T.; software, S.A. and O.U.; validation, S.A. and O.U.; formal analysis, S.A. and O.U.; investigation, S.A., O.U., A.G. and T.T.; resources, A.Y. and M.Y.; data curation, S.A., O.U., A.G. and T.T.; writing—original draft preparation, S.A., O.U., A.Y. and M.Y.; writing—review and editing, A.Y. and M.Y.; visualization, A.Y. and M.Y.; supervision A.Y. and M.Y.; project administration, A.Y. and M.Y.; funding acquisition, A.Y. and M.Y. All authors have read and agreed to the published version of the manuscript.

Funding

This work was supported by Ataturk University Scientific Research Project Coordination Unit (AU-BAP-FYL-2022-11107).

Institutional Review Board Statement

Not applicable.

Informed Consent Statement

Not applicable.

Data Availability Statement

Not applicable.

Acknowledgments

The authors kindly acknowledge the East Anatolia High Technology Application and Research Center (DAYTAM) at Ataturk University for providing laboratory spaces and characterization devices.

Conflicts of Interest

The authors declare no conflict of interest.

References

  1. Chan, M.H.; Liu, R.S. Carbon Nitride Quantum Dots and Their Applications. In Phosphors, Up Conversion Nano Particles, Quantum Dots and Their Applications; Springer: Singapore, 2016; Volume 2, pp. 485–502. [Google Scholar] [CrossRef]
  2. Chan, K.K.; Yap, S.H.K.; Yong, K.T. Biogreen Synthesis of Carbon Dots for Biotechnology and Nanomedicine Applications. Nano-Micro Lett. 2018, 10, 72. [Google Scholar] [CrossRef] [PubMed]
  3. Mintz, K.J.; Zhou, Y.; Leblanc, R.M. Recent Development of Carbon Quantum Dots Regarding Their Optical Properties, Photoluminescence Mechanism, and Core Structure. Nanoscale 2019, 11, 4634–4652. [Google Scholar] [CrossRef] [PubMed]
  4. Xu, X.; Ray, R.; Gu, Y.; Ploehn, H.J.; Gearheart, L.; Raker, K.; Scrivens, W.A. Electrophoretic Analysis and Purification of Fluorescent Single-Walled Carbon Nanotube Fragments. J. Am. Chem. Soc. 2004, 126, 12736–12737. [Google Scholar] [CrossRef] [PubMed]
  5. Semeniuk, M.; Yi, Z.; Poursorkhabi, V.; Tjong, J.; Jaffer, S.; Lu, Z.H.; Sain, M. Future Perspectives and Review on Organic Carbon Dots in Electronic Applications. ACS Nano 2019, 13, 6224–6255. [Google Scholar] [CrossRef] [PubMed]
  6. Lim, S.Y.; Shen, W.; Gao, Z. Carbon Quantum Dots and Their Applications. Chem. Soc. Rev. 2015, 44, 362–381. [Google Scholar] [CrossRef] [PubMed]
  7. Yang, S.; Sun, J.; Li, X.; Zhou, W.; Wang, Z.; He, P.; Ding, G.; Xie, X.; Kang, Z.; Jiang, M. Large-Scale Fabrication of Heavy Doped Carbon Quantum Dots with Tunable-Photoluminescence and Sensitive Fluorescence Detection. J. Mater. Chem. A 2014, 2, 8660–8667. [Google Scholar] [CrossRef]
  8. Yuan, F.; Li, S.; Fan, Z.; Meng, X.; Fan, L.; Yang, S. Shining Carbon Dots: Synthesis and Biomedical and Optoelectronic Applications. Nano Today 2016, 11, 565–586. [Google Scholar] [CrossRef]
  9. Sun, X.; Lei, Y. Fluorescent Carbon Dots and Their Sensing Applications. TrAC-Trends Anal. Chem. 2017, 89, 163–180. [Google Scholar] [CrossRef]
  10. Li, H.; He, X.; Kang, Z.; Huang, H.; Liu, Y.; Liu, J.; Lian, S.; Tsang, C.H.A.; Yang, X.; Lee, S.T. Water-Soluble Fluorescent Carbon Quantum Dots and Photocatalyst Design. Angew. Chem. Int. Ed. 2010, 49, 4430–4434. [Google Scholar] [CrossRef]
  11. Liu, H.; Ye, T.; Mao, C. Fluorescent Carbon Nanoparticles Derived from Candle Soot. Angew. Chem. Int. Ed. 2007, 46, 6473–6475. [Google Scholar] [CrossRef]
  12. Qiao, Z.A.; Wang, Y.; Gao, Y.; Li, H.; Dai, T.; Liu, Y.; Huo, Q. Commercially Activated Carbon as the Source for Producing Multicolor Photoluminescent Carbon Dots by Chemical Oxidation. Chem. Commun. 2010, 46, 8812–8814. [Google Scholar] [CrossRef] [PubMed]
  13. Tao, H.; Yang, K.; Ma, Z.; Wan, J.; Zhang, Y.; Kang, Z.; Liu, Z. In Vivo NIR Fluorescence Imaging, Biodistribution, and Toxicology of Photoluminescent Carbon Dots Produced from Carbon Nanotubes and Graphite. Small 2012, 8, 281–290. [Google Scholar] [CrossRef] [PubMed]
  14. Cao, L.; Wang, X.; Meziani, M.J.; Lu, F.; Wang, H.; Luo, P.G.; Lin, Y.; Harruff, B.A.; Veca, L.M.; Murray, D.; et al. Carbon Dots for Multiphoton Bioimaging. J. Am. Chem. Soc. 2007, 129, 11318–11319. [Google Scholar] [CrossRef] [PubMed]
  15. Gonçalves, H.; Jorge, P.A.S.; Fernandes, J.R.A.; Esteves da Silva, J.C.G. Hg(II) Sensing Based on Functionalized Carbon Dots Obtained by Direct Laser Ablation. Sens. Actuators B Chem. 2010, 145, 702–707. [Google Scholar] [CrossRef]
  16. Hu, S.; Liu, J.; Yang, J.; Wang, Y.; Cao, S. Laser Synthesis and Size Tailor of Carbon Quantum Dots. J. Nanopart. Res. 2011, 13, 7247–7252. [Google Scholar] [CrossRef]
  17. Wang, L.; Chen, X.; Lu, Y.; Liu, C.; Yang, W. Carbon Quantum Dots Displaying Dual-Wavelength Photoluminescence and Electrochemiluminescence Prepared by High-Energy Ball Milling. Carbon 2015, 94, 472–478. [Google Scholar] [CrossRef]
  18. Zhu, S.; Song, Y.; Zhao, X.; Shao, J.; Zhang, J.; Yang, B. The Photoluminescence Mechanism in Carbon Dots (Graphene Quantum Dots, Carbon Nanodots, and Polymer Dots): Current State and Future Perspective. Nano Res. 2015, 8, 355–381. [Google Scholar] [CrossRef]
  19. Gao, M.X.; Liu, C.F.; Wu, Z.L.; Zeng, Q.L.; Yang, X.X.; Wu, W.B.; Li, Y.F.; Huang, C.Z. A Surfactant-Assisted Redox Hydrothermal Route to Prepare Highly Photoluminescent Carbon Quantum Dots with Aggregation-Induced Emission Enhancement Properties. Chem. Commun. 2013, 49, 8015–8017. [Google Scholar] [CrossRef]
  20. Guo, Y.; Chen, Y.; Cao, F.; Wang, L.; Wang, Z.; Leng, Y. Hydrothermal Synthesis of Nitrogen and Boron Doped Carbon Quantum Dots with Yellow-Green Emission for Sensing Cr(VI), Anti-Counterfeiting and Cell Imaging. RSC Adv. 2017, 7, 48386–48393. [Google Scholar] [CrossRef] [Green Version]
  21. Yan, L.; Yang, Y.; Ma, C.Q.; Liu, X.; Wang, H.; Xu, B. Synthesis of Carbon Quantum Dots by Chemical Vapor Deposition Approach for Use in Polymer Solar Cell as the Electrode Buffer Layer. Carbon 2016, 109, 598–607. [Google Scholar] [CrossRef]
  22. Kuo, T.R.; Sung, S.Y.; Hsu, C.W.; Chang, C.J.; Chiu, T.C.; Hu, C.C. One-Pot Green Hydrothermal Synthesis of Fluorescent Nitrogen-Doped Carbon Nanodots for in Vivo Bioimaging. Anal. Bioanal. Chem. 2016, 408, 77–82. [Google Scholar] [CrossRef] [PubMed]
  23. Li, M.; Yu, C.; Hu, C.; Yang, W.; Zhao, C.; Wang, S.; Zhang, M.; Zhao, J.; Wang, X.; Qiu, J. Solvothermal Conversion of Coal into Nitrogen-Doped Carbon Dots with Singlet Oxygen Generation and High Quantum Yield. Chem. Eng. J. 2017, 320, 570–575. [Google Scholar] [CrossRef]
  24. Mitra, S.; Chandra, S.; Pathan, S.H.; Sikdar, N.; Pramanik, P.; Goswami, A. Room Temperature and Solvothermal Green Synthesis of Self Passivated Carbon Quantum Dots. RSC Adv. 2013, 3, 3189–3193. [Google Scholar] [CrossRef]
  25. Choi, Y.; Kang, B.; Lee, J.; Kim, S.; Kim, G.T.; Kang, H.; Lee, B.R.; Kim, H.; Shim, S.H.; Lee, G.; et al. Integrative Approach toward Uncovering the Origin of Photoluminescence in Dual Heteroatom-Doped Carbon Nanodots. Chem. Mater. 2016, 28, 6840–6847. [Google Scholar] [CrossRef]
  26. Wang, Y.; Zhuang, Q.; Ni, Y. Facile Microwave-Assisted Solid-Phase Synthesis of Highly Fluorescent Nitrogen-Sulfur-Codoped Carbon Quantum Dots for Cellular Imaging Applications. Chem. A Eur. J. 2015, 21, 13004–13011. [Google Scholar] [CrossRef]
  27. Li, H.; He, X.; Liu, Y.; Huang, H.; Lian, S.; Lee, S.T.; Kang, Z. One-Step Ultrasonic Synthesis of Water-Soluble Carbon Nanoparticles with Excellent Photoluminescent Properties. Carbon 2011, 49, 605–609. [Google Scholar] [CrossRef]
  28. Li, H.; He, X.; Liu, Y.; Yu, H.; Kang, Z.; Lee, S.T. Synthesis of Fluorescent Carbon Nanoparticles Directly from Active Carbon via a One-Step Ultrasonic Treatment. Mater. Res. Bull. 2011, 46, 147–151. [Google Scholar] [CrossRef]
  29. Ma, Z.; Ming, H.; Huang, H.; Liu, Y.; Kang, Z. One-Step Ultrasonic Synthesis of Fluorescent N-Doped Carbon Dots from Glucose and Their Visible-Light Sensitive Photocatalytic Ability. New J. Chem. 2012, 36, 861–864. [Google Scholar] [CrossRef]
  30. Shen, J.; Zhu, Y.; Yang, X.; Zong, J.; Zhang, J.; Li, C. One-Pot Hydrothermal Synthesis of Graphene Quantum Dots Surface-Passivated by Polyethylene Glycol and Their Photoelectric Conversion under near-Infrared Light. New J. Chem. 2012, 36, 97–101. [Google Scholar] [CrossRef]
  31. Liu, J.J.; Li, D.; Zhang, K.; Yang, M.; Sun, H.; Yang, B. One-Step Hydrothermal Synthesis of Nitrogen-Doped Conjugated Carbonized Polymer Dots with 31% Efficient Red Emission for In Vivo Imaging. Small 2018, 14, 1703919. [Google Scholar] [CrossRef]
  32. Karadag, S.N.; Ustun, O.; Yilmaz, A.; Yilmaz, M. The fabrication of excitation-dependent fluorescence boron/nitrogen co-doped carbon quantum dots and their employment in bioimaging. Chem. Phys. 2022, 562, 111678. [Google Scholar] [CrossRef]
  33. Hwang, E.; Lee, B. Synthesis of a Fluorescence Sensor Based on Carbon Quantum Dots for Detection of Bisphenol A in Aqueous Solution. Korean J. Chem. Eng. 2022, 39, 1324–1332. [Google Scholar] [CrossRef]
  34. Kim, S.; Yoo, B.K.; Choi, Y.; Kim, B.S.; Kwon, O.H. Time-Resolved Spectroscopy of the Ensembled Photoluminescence of Nitrogen- and Boron/Nitrogen-Doped Carbon Dots. Phys. Chem. 2018, 20, 11673–11681. [Google Scholar] [CrossRef] [PubMed]
  35. Zhang, Y.Q.; Ma, D.K.; Zhuang, Y.; Zhang, X.; Chen, W.; Hong, L.L.; Yan, Q.X.; Yu, K.; Huang, S.M. One-Pot Synthesis of N-Doped Carbon Dots with Tunable Luminescence Properties. J. Mater. Chem. 2012, 22, 16714–16718. [Google Scholar] [CrossRef]
  36. Dong, Y.; Pang, H.; Yang, H.B.; Guo, C.; Shao, J.; Chi, Y.; Li, C.M.; Yu, T. Carbon-Based Dots Co-Doped with Nitrogen and Sulfur for High Quantum Yield and Excitation-Independent Emission. Angew. Chem. Int. Ed. 2013, 52, 7800–7804. [Google Scholar] [CrossRef] [PubMed]
  37. Qu, D.; Zheng, M.; Zhang, L.; Zhao, H.; Xie, Z.; Jing, X.; Haddad, R.E.; Fan, H.; Sun, Z. Formation Mechanism and Optimization of Highly Luminescent N-Doped Graphene Quantum Dots. Sci. Rep. 2014, 4, 5294. [Google Scholar] [CrossRef]
  38. Sun, Y.-P.; Zhou, B.; Lin, Y.; Wang, W.; Fernando, K.S.; Pathak, P.; Meziani, M.J.; Harruff, B.A.; Wang, X.; Wang, H. Quantum-Sized Carbon Dots for Bright and Colorful Photoluminescence. J. Am. Chem. Soc. 2006, 128, 7756–7757. [Google Scholar] [CrossRef]
  39. Sun, Y.P.; Wang, X.; Lu, F.; Cao, L.; Meziani, M.J.; Luo, P.G.; Gu, L.; Monica Veca, L. Doped Carbon Nanoparticles as a New Platform for Highly Photoluminescent Dots. J. Phys. Chem. C 2008, 112, 18295–18298. [Google Scholar] [CrossRef]
  40. Xu, J.; Cui, K.; Gong, T.; Zhang, J.; Zhai, Z.; Hou, L.; Zaman, F.U.; Yuan, C. Ultrasonic-Assisted Synthesis of N-Doped, Multicolor Carbon Dots toward Fluorescent Inks, Fluorescence Sensors, and Logic Gate Operations. Nanomaterials 2022, 12, 312. [Google Scholar] [CrossRef]
  41. Wang, H.; Sun, P.; Cong, S.; Wu, J.; Gao, L.; Wang, Y.; Dai, X.; Yi, Q.; Zou, G. Nitrogen-Doped Carbon Dots for “Green” Quantum Dot Solar Cells. Nanoscale Res. Lett. 2016, 11, 27. [Google Scholar] [CrossRef]
  42. Li, H.; Su, D.; Gao, H.; Yan, X.; Kong, D.; Jin, R.; Liu, X.; Wang, C.; Lu, G. Design of Red Emissive Carbon Dots: Robust Performance for Analytical Applications in Pesticide Monitoring. Anal. Chem. 2020, 92, 3198–3205. [Google Scholar] [CrossRef] [PubMed]
  43. Wang, Y.; Hu, X.; Li, W.; Huang, X.; Li, Z.; Zhang, W.; Zhang, X.; Zou, X.; Shi, J. Preparation of Boron Nitrogen Co-Doped Carbon Quantum Dots for Rapid Detection of Cr(VI). Spectrochim. Acta Part A Mol. Biomol. Spectrosc. 2020, 243, 118807. [Google Scholar] [CrossRef] [PubMed]
  44. Yang, Z.; Xu, T.; Zhang, X.; Li, H.; Jia, X.; Zhao, S.; Yang, Z.; Liu, X. Nitrogen–Doped Carbon Quantum Dots as Fluorescent Nanosensor for Selective Determination and Cellular Imaging of ClO. Spectrochim. Acta Part A Mol. Biomol. Spectrosc. 2022, 271, 120941. [Google Scholar] [CrossRef] [PubMed]
  45. Coates, T.D. Physiology and Pathophysiology of Iron in Hemoglobin-Associated Diseases. Free Radic. Biol. Med. 2014, 72, 23–40. [Google Scholar] [CrossRef] [PubMed]
  46. Carpenter, C.; Payne, S.M. Regulation of Iron Transport Systems in Enterobacteriaceae in Response to Oxygen and Iron Availability. J. Inorg. Biochem. 2014, 133, 110–117. [Google Scholar] [CrossRef]
  47. Proos Vedin, N.; Lundberg, M. Protein Effects in Non-Heme Iron Enzyme Catalysis: Insights from Multiscale Models. J. Biol. Inorg. Chem. 2016, 21, 645–657. [Google Scholar] [CrossRef]
  48. Baker, R.D.; Greer, F.R. Diagnosis and Prevention of Iron Deficiency and Iron-Deficiency Anemia in Infants and Young Children (0–3 Years of Age). Pediatrics 2021, 126, 1040–1050. [Google Scholar] [CrossRef]
  49. Torti, S.V.; Torti, F.M. Iron and Cancer: More Ore to Be Mined. Nat. Rev. Cancer 2013, 13, 342–355. [Google Scholar] [CrossRef]
  50. Shangguan, J.; Huang, J.; He, D.; He, X.; Wang, K.; Ye, R.; Yang, X.; Qing, T.; Tang, J. Highly Fe3+-Selective Fluorescent Nanoprobe Based on Ultrabright N/P Codoped Carbon Dots and Its Application in Biological Samples. Anal. Chem. 2017, 89, 7477–7484. [Google Scholar] [CrossRef]
  51. Gong, X.; Lu, W.; Paau, M.C.; Hu, Q.; Wu, X.; Shuang, S.; Dong, C.; Choi, M.M.F. Facile Synthesis of Nitrogen-Doped Carbon Dots for Fe3+ Sensing and Cellular Imaging. Anal. Chim. Acta 2015, 861, 74–84. [Google Scholar] [CrossRef]
  52. Liu, W.; Diao, H.; Chang, H.; Wang, H.; Li, T.; Wei, W. Green Synthesis of Carbon Dots from Rose-Heart Radish and Application for Fe3+ Detection and Cell Imaging. Sens. Actuators B Chem. 2017, 241, 190–198. [Google Scholar] [CrossRef]
  53. Aslandaş, A.M.; Balci, N.; Arik, M.; Şakiroğlu, H.; Onganer, Y.; Meral, K. Liquid Nitrogen-Assisted Synthesis of Fluorescent Carbon Dots from Blueberry and Their Performance in Fe3+ Detection. Appl. Surf. Sci. 2015, 356, 747–752. [Google Scholar] [CrossRef]
  54. Ge, L.; Yu, H.; Ren, H.; Shi, B.; Guo, Q.; Gao, W.; Li, Z.; Li, J. Photoluminescence of Carbon Dots and Their Applications in Hela Cell Imaging and Fe3+ Ion Detection. J. Mater. Sci. 2017, 52, 9979–9989. [Google Scholar] [CrossRef]
  55. Yang, R.; Guo, X.; Jia, L.; Zhang, Y.; Zhao, Z.; Lonshakov, F. Green Preparation of Carbon Dots with Mangosteen Pulp for the Selective Detection of Fe3+ Ions and Cell Imaging. Appl. Surf. Sci. 2017, 423, 426–432. [Google Scholar] [CrossRef]
  56. Song, Y.; Zhu, C.; Song, J.; Li, H.; Du, D.; Lin, Y. Drug-Derived Bright and Color-Tunable N-Doped Carbon Dots for Cell Imaging and Sensitive Detection of Fe3+ in Living Cells. ACS Appl. Mater. Interfaces 2017, 9, 7399–7405. [Google Scholar] [CrossRef]
  57. Lu, W.; Gong, X.; Nan, M.; Liu, Y.; Shuang, S.; Dong, C. Comparative Study for N and S Doped Carbon Dots: Synthesis, Characterization and Applications for Fe3+ Probe and Cellular Imaging. Anal. Chim. Acta 2015, 898, 116–127. [Google Scholar] [CrossRef]
  58. Chandra, S.; Laha, D.; Pramanik, A.; Ray Chowdhuri, A.; Karmakar, P.; Sahu, S.K. Synthesis of Highly Fluorescent Nitrogen and Phosphorus Doped Carbon Dots for the Detection of Fe3+ Ions in Cancer Cells. Luminescence 2016, 31, 81–87. [Google Scholar] [CrossRef]
  59. Liu, Y.; Duan, W.; Song, W.; Liu, J.; Ren, C.; Wu, J.; Liu, D.; Chen, H. Red Emission B, N, S-Co-Doped Carbon Dots for Colorimetric and Fluorescent Dual Mode Detection of Fe3+ Ions in Complex Biological Fluids and Living Cells. ACS Appl. Mater. Interfaces 2017, 9, 12663–12672. [Google Scholar] [CrossRef]
  60. Rong, M.; Feng, Y.; Wang, Y.; Chen, X. One-Pot Solid Phase Pyrolysis Synthesis of Nitrogen-Doped Carbon Dots for Fe3+ Sensing and Bioimaging. Sensors Actuators, B Chem. 2017, 245, 868–874. [Google Scholar] [CrossRef]
  61. Molkenova, A.; Amangeldinova, Y.; Aben, D.; Sayatova, S.; Atabaev, T.S. Quick Synthesis of Fluorescent Nitrogen-Doped Carbon Nanoparticles for Selective and Sensitive Fe(III) Detection in Water. Sens. Bio-Sens. Res. 2019, 23, 100271. [Google Scholar] [CrossRef]
  62. Li, Y.; Liu, Y.; Shang, X.; Chao, D.; Zhou, L.; Zhang, H. Highly Sensitive and Selective Detection of Fe3+ by Utilizing Carbon Quantum Dots as Fluorescent Probes. Chem. Phys. Lett. 2018, 705, 1–6. [Google Scholar] [CrossRef]
  63. Maity, M.; Bera, K.; Pal, U.; Khamaru, K.; Maiti, N.C. Sensing of Iron(III) Ion via Modulation of Redox Potential on Biliverdin Protected Silver Nanosurface. ACS Appl. Nano Mater. 2018, 1, 6099–6111. [Google Scholar] [CrossRef]
  64. Jain, A.; Wadhawan, S.; Kumar, V.; Mehta, S.K. Colorimetric Sensing of Fe3+ Ions in Aqueous Solution Using Magnesium Oxide Nanoparticles Synthesized Using Green Approach. Chem. Phys. Lett. 2018, 706, 53–61. [Google Scholar] [CrossRef]
  65. Li, J.; Wang, Q.; Guo, Z.; Ma, H.; Zhang, Y.; Wang, B.; Bin, D.; Wei, Q. Highly Selective Fluorescent Chemosensor for Detection of Fe3+ Based on Fe3O4@ZnO. Sci. Rep. 2016, 6, 23558. [Google Scholar] [CrossRef] [PubMed]
  66. Xu, Y.; Wang, X.; Zhang, W.L.; Lv, F.; Guo, S. Recent Progress in Two-Dimensional Inorganic Quantum Dots. Chem. Soc. Rev. 2018, 47, 586–625. [Google Scholar] [CrossRef] [PubMed]
  67. Zhu, X.; Zhang, Z.; Xue, Z.; Huang, C.; Shan, Y.; Liu, C.; Qin, X.; Yang, W.; Chen, X.; Wang, T. Understanding the Selective Detection of Fe3+ Based on Graphene Quantum Dots as Fluorescent Probes: The Ksp of a Metal Hydroxide-Assisted Mechanism. Anal. Chem. 2017, 89, 12054–12058. [Google Scholar] [CrossRef]
  68. Tripathy, S.K.; Woo, J.Y.; Han, C.S. Colorimetric Detection of Fe(III) Ions Using Label-Free Gold Nanoparticles and Acidic Thiourea Mixture. Sens. Actuators, B Chem. 2013, 181, 114–118. [Google Scholar] [CrossRef]
  69. Wang, L.; Ma, W.; Xu, L.; Chen, W. Undefined Nanoparticle-Based Environmental Sensors. Elsevier 2010, 70, 265–274. [Google Scholar]
  70. Jiang, K.; Sun, S.; Zhang, L.; Lu, Y.; Wu, A.; Cai, C.; Lin, H. Red, Green, and Blue Luminescence by Carbon Dots: Full-Color Emission Tuning and Multicolor Cellular Imaging. Angew. Chem. Int. Ed. 2015, 54, 5360–5363. [Google Scholar] [CrossRef]
  71. Wu, P.; Li, W.; Wu, Q.; Liu, Y.; Liu, S. Hydrothermal Synthesis of Nitrogen-Doped Carbon Quantum Dots from Microcrystalline Cellulose for the Detection of Fe3+ Ions in an Acidic Environment. RSC Adv. 2017, 7, 44144–44153. [Google Scholar] [CrossRef] [Green Version]
  72. Jiang, Y.; Han, Q.; Jin, C.; Zhang, J.; Wang, B. A Fluorescence Turn-off Chemosensor Based on N-Doped Carbon Quantum Dots for Detection of Fe3+ in Aqueous Solution. Mater. Lett. 2015, 141, 366–368. [Google Scholar] [CrossRef]
  73. Liu, R.; Li, H.; Kong, W.; Liu, J.; Liu, Y.; Tong, C.; Zhang, X.; Kang, Z. Ultra-Sensitive and Selective Hg2+ Detection Based on Fluorescent Carbon Dots. Mater. Res. Bull. 2013, 48, 2529–2534. [Google Scholar] [CrossRef]
  74. Zhuo, Y.; Miao, H.; Zhong, D.; Zhu, S.; Yang, X. One-Step Synthesis of High Quantum-Yield and Excitation-Independent Emission Carbon Dots for Cell Imaging. Mater. Lett. 2015, 139, 197–200. [Google Scholar] [CrossRef]
  75. Wu, Q.; Li, W.; Wu, P.; Li, J.; Liu, S.; Jin, C.; Zhan, X. Effect of Reaction Temperature on Properties of Carbon Nanodots and Their Visible-Light Photocatalytic Degradation of Tetracyline. RSC Adv. 2015, 5, 75711–75721. [Google Scholar] [CrossRef]
  76. Shaikh, A.F.; Tamboli, M.S.; Patil, R.H.; Bhan, A.; Ambekar, J.D.; Kale, B.B. Bioinspired Carbon Quantum Dots: An Antibiofilm Agents. J. Nanosci. Nanotechnol. 2018, 19, 2339–2345. [Google Scholar] [CrossRef]
  77. Asghar, K.; Qasim, M.; Das, D. One-Pot Green Synthesis of Carbon Quantum Dot for Biological Application. AIP Conf. Proc. 2017, 1832, 50117. [Google Scholar] [CrossRef]
  78. P, K.; Cherian, A.R.; Sirimahachai, U.; Thadathil, D.A.; Varghese, A.; Hegde, G. Detection of Picric Acid in Industrial Effluents Using Multifunctional Green Fluorescent B/N-Carbon Quantum Dots. J. Environ. Chem. Eng. 2022, 10, 107209. [Google Scholar] [CrossRef]
  79. Pan, L.; Sun, S.; Zhang, L.; Jiang, K.; Lin, H. Near-Infrared Emissive Carbon Dots for Two-Photon Fluorescence Bioimaging. Nanoscale 2016, 8, 17350–17356. [Google Scholar] [CrossRef]
  80. Serhan, M.; Sprowls, M.; Jackemeyer, D.; Long, M.; Perez, I.D.; Maret, W.; Tao, N.; Forzani, E. Total Iron Measurement in Human Serum with a Smartphone. In Proceedings of the 2019 AIChE Annual Meeting, Orlando, FL, USA, 10–15 November 2019; pp. 1–3. [Google Scholar] [CrossRef]
  81. Ding, H.; Wei, J.S.; Zhong, N.; Gao, Q.Y.; Xiong, H.M. Highly Efficient Red-Emitting Carbon Dots with Gram-Scale Yield for Bioimaging. Langmuir 2017, 33, 12635–12642. [Google Scholar] [CrossRef]
  82. Zhou, J.; Yang, Y.; Zhang, C.Y. A Low-Temperature Solid-Phase Method to Synthesize Highly Fluorescent Carbon Nitride Dots with Tunable Emission. Chem. Commun. 2013, 49, 8605–8607. [Google Scholar] [CrossRef]
  83. Chen, B.B.; Li, R.S.; Liu, M.L.; Zhang, H.Z.; Huang, C.Z. Self-Exothermic Reaction Prompted Synthesis of Single-Layered Graphene Quantum Dots at Room Temperature. Chem. Commun. 2017, 53, 4958–4961. [Google Scholar] [CrossRef] [PubMed]
  84. Guo, C.; Li, Y.; Xu, Y.; Xiang, Q.; Sun, L.; Zhang, W.; Li, W.; Si, Y.; Luo, Z. A Highly Nanoporous Nitrogen-Doped Carbon Microfiber Derived from Bioresource as a New Kind of ORR Electrocatalyst. Nanoscale Res. Lett. 2019, 14, 22. [Google Scholar] [CrossRef] [PubMed]
  85. Al Awak, M.M.; Wang, P.; Wang, S.; Tang, Y.; Sun, Y.P.; Yang, L. Correlation of Carbon Dots’ Light-Activated Antimicrobial Activities and Fluorescence Quantum Yield. RSC Adv. 2017, 7, 30177–30184. [Google Scholar] [CrossRef]
  86. Meziani, M.J.; Dong, X.; Zhu, L.; Jones, L.P.; Lecroy, G.E.; Yang, F.; Wang, S.; Wang, P.; Zhao, Y.; Yang, L.; et al. Visible-Light-Activated Bactericidal Functions of Carbon “Quantum” Dots. ACS Appl. Mater. Interfaces 2016, 8, 10761–10766. [Google Scholar] [CrossRef] [PubMed]
  87. Lin, F.; Bao, Y.-W.; Wu, F.-G. Carbon Dots for Sensing and Killing Microorganisms. C J. Carbon Res. 2019, 5, 33. [Google Scholar] [CrossRef]
  88. Anand, A.; Unnikrishnan, B.; Wei, S.C.; Chou, C.P.; Zhang, L.Z.; Huang, C.C. Graphene Oxide and Carbon Dots as Broad-Spectrum Antimicrobial Agents-a Minireview. Nanoscale Horiz. 2019, 4, 117–137. [Google Scholar] [CrossRef]
  89. Khan, Z.M.S.H.; Rahman, R.S.; Shumaila; Islam, S.; Zulfequar, M. Hydrothermal treatment of red lentils for the synthesis of fluorescent carbon quantum dots and its application for sensing Fe3+. Opt. Mater. (Amst). 2019, 91, 386–395. [Google Scholar] [CrossRef]
  90. Li, G.; Lv, N.; Bi, W.; Zhang, J.; Ni, J. Nitrogen-doped carbon dots as a fluorescence probe suitable for sensing Fe3+ under acidic conditions. New J. Chem. 2016, 40, 10213–10218. [Google Scholar] [CrossRef]
  91. Hong, D.; Deng, X.; Liang, J.; Li, J.; Tao, Y.; Tan, K. One-step hydrothermal synthesis of down/up-conversion luminescence F-doped carbon quantum dots for label-free detection of Fe3+. Microchem. J. 2019, 151, 104217. [Google Scholar] [CrossRef]
  92. Lu, M.; Duan, Y.; Song, Y.; Tan, J.; Zhou, L. Green preparation of versatile nitrogen-doped carbon quantum dots from watermelon juice for cell imaging, detection of Fe3+ ions and cysteine, and optical thermometry. J. Mol. Liq. 2018, 269, 766–774. [Google Scholar] [CrossRef]
  93. Wang, C.; Shi, H.; Yang, M.; Yan, Y.; Liu, E.; Ji, Z.; Fan, J. Facile synthesis of novel carbon quantum dots from biomass waste for highly sensitive detection of iron ions. Mater. Res. Bull. 2020, 124, 110730. [Google Scholar] [CrossRef]
  94. Zhao, S.; Song, X.; Chai, X.; Zhao, P.; He, H.; Liu, Z. Green production of fluorescent carbon quantum dots based on pine wood and its application in the detection of Fe3+. J. Clean. Prod. 2020, 263, 121561. [Google Scholar] [CrossRef]
  95. Wu, F.; Yang, M.; Zhang, H.; Zhu, S.; Zhu, X.; Wang, K. Facile synthesis of sulfur-doped carbon quantum dots from vitamin B1 for highly selective detection of Fe3+ ion. Opt. Mater. (Amst). 2018, 77, 258–263. [Google Scholar] [CrossRef]
  96. Deng, X.; Feng, Y.; Li, H.; Du, Z.; Teng, Q.; Wang, H. N-doped carbon quantum dots as fluorescent probes for highly selective and sensitive detection of Fe3+ ions. Particuology 2018, 41, 94–100. [Google Scholar] [CrossRef]
  97. Gao, X.; Zhou, X.; Ma, Y.; Qian, T.; Wang, C.; Chu, F. Facile and cost-effective preparation of carbon quantum dots for Fe3+ ion and ascorbic acid detection in living cells based on the “on-off-on” fluorescence principle. Appl. Surf. Sci. 2019, 469, 911–916. [Google Scholar] [CrossRef]
  98. Malavika, J.P.; Shobana, C.; Ragupathi, M.; Kumar, P.; Lee, Y.S.; Govarthanan, M.; Selvan, R.K. A sustainable green synthesis of functionalized biocompatible carbon quantum dots from Aloe barbadensis Miller and its multifunctional applications. Environ. Res. 2021, 200, 111414. [Google Scholar] [CrossRef]
  99. Tan, A.; Yang, G.; Wan, X. Ultra-high quantum yield nitrogen-doped carbon quantum dots and their versatile application in fluorescence sensing, bioimaging and anti-counterfeiting. Spectrochim. Acta-Part A Mol. Biomol. Spectrosc. 2021, 253, 119583. [Google Scholar] [CrossRef]
  100. Mahani, M.; Karimi-Mazidi, P.; Khakbaz, F.; Torkzadeh-Mahani, M. Carbon quantum dots—Annexin V probe: photoinduced electron transfer mechanism, phosphatidylserine detection, and apoptotic cell imaging. Microchim. Acta 2022, 189, 69. [Google Scholar] [CrossRef]
  101. Huo, X.; Liu, L.; Bai, Y.; Qin, J.; Yuan, L.; Feng, F. Facile synthesis of yellowish-green emitting carbon quantum dots and their applications for phoxim sensing and cellular imaging. Anal. Chim. Acta 2022, 1206, 338685. [Google Scholar] [CrossRef]
  102. Wang, C.; Shi, H.; Yang, M.; Yao, Z.; Zhang, B.; Liu, E.; Hu, X.; Xue, W.; Fan, J. Biocompatible sulfur nitrogen co-doped carbon quantum dots for highly sensitive and selective detection of dopamine. Colloids Surf. B Biointerfaces 2021, 205, 111874. [Google Scholar] [CrossRef]
  103. Wei, Y.; Chen, L.; Zhao, S.; Liu, X.; Yang, Y.; Du, J.; Li, Q.; Yu, S. Green-emissive carbon quantum dots with high fluorescence quantum yield: Preparation and cell imaging. Front. Mater. Sci. 2021, 15, 253–265. [Google Scholar] [CrossRef]
  104. Yu, C.; Qin, D.; Jiang, X.; Zheng, X.; Deng, B. N-doped carbon quantum dots from osmanthus fragrans as a novel off-on fluorescent nanosensor for highly sensitive detection of quercetin and aluminium ion, and cell imaging. J. Pharm. Biomed. Anal. 2021, 192, 113673. [Google Scholar] [CrossRef] [PubMed]
  105. Xu, O.; Wan, S.; Zhang, Y.; Li, J.; Zhu, X. A unique dual-excitation carbon quantum dots: Facile synthesis and application as a dual-“on-off-on” fluorescent probe. Sens. Actuators B Chem. 2021, 340, 129904. [Google Scholar] [CrossRef]
  106. Wang, C.; Yang, M.; Shi, H.; Yao, Z.; Liu, E.; Hu, X.; Guo, P.; Xue, W.; Fan, J. Carbon quantum dots prepared by pyrolysis: Investigation of the luminescence mechanism and application as fluorescent probes. Dye Pigment. 2022, 204, 110431. [Google Scholar] [CrossRef]
Figure 1. UV-vis and fluorescence spectra collected at different excitation wavelengths of CQDs prepared at different synthesis times: 3 h (a,b), 12 h (c,d), and 24 h (e,f). The synthesis temperature and the ratio of precursors were set as 180 °C and 1:1 M:M, respectively.
Coatings 12 01311 g001
Figure 2. UV-vis and fluorescence spectra collected at different excitation wavelengths of CQDs prepared at different synthesis temperatures: 140 °C (a,b), 180 °C (c,d), and 220 °C (e,f). The synthesis time and the ratio of precursors were set as 12 h and 1:1 M:M, respectively.
Coatings 12 01311 g002
Figure 3. UV-vis and fluorescence spectra collected at different excitation wavelengths of CQDs prepared at different ratios of precursors: 1:1 M:M (a,b), 1:3 M:M (c,d), and 3:1 M:M (e,f). The synthesis time and temperature were set as 12 h and 180 °C, respectively.
Coatings 12 01311 g003
Figure 4. Further characterization of CQDs through various methods. Optic images of CQD suspension under daylight and a 365-nm UV-lamb (a), normalized fluorescence spectra at optimum synthesis conditions under different excitation wavelengths (b), representative TEM image and particles size distribution (c), XRD spectra (d), FT-IR spectra (e), XPS survey spectra and elemental ratio (f), high-resolution C1s spectra (g), O1s spectra (h), N1s spectra (j), the change of fluorescence intensity (ex: 320 nm) of CQDs stored under daylight and dark conditions (k), the fluorescence spectra at different pH values (l), and relevant normalized PL intensity (m).
Coatings 12 01311 g004
Figure 5. Fluorescence intensity of CQD suspension in the presence of 125 µM of different metal ions (a). The change in PL intensity (b), spectra (c), the linear relationship between intensity and concentrations (d), and relevant UV-vis spectra (e), in the presence of Fe3+ ions at different concentrations. The PL data were collected at ex: 320 nm. All analyses were repeated three times and average results were represented.
Coatings 12 01311 g005
Figure 6. The change in PL spectra (a), and the linear relationship between intensity and concentrations (b), of CQDs in blood plasma in the presence of Fe3+ ions at different concentrations. The PL data were collected at ex: 320 nm. All analyses were repeated three times and average results were represented.
Coatings 12 01311 g006
Figure 7. Cell viability of the A549 and MRC5 cells (a), and antimicrobial activity of CQDs against Escherichia coli strains at different concentrations in daylight (b), and dark (c).
Coatings 12 01311 g007
Publisher’s Note: MDPI stays neutral with regard to jurisdictional claims in published maps and institutional affiliations.

