Article

An Investigation for Minimizing the Wear Loss of Microwave-Assisted Synthesized g-C3N4/MoS2 Nanocomposite Coated Substrate

1
Centre for Advanced Studies, Lucknow 226031, Uttar Pradesh, India
2
Department of Mechanical Engineering, G.L. Bajaj Institute of Technology and Management, Greater Noida 201306, Uttar Pradesh, India
3
Department of Chemical Engineering, Indian Institute of Technology, Tirupati 517619, Andhra Pradesh, India
4
Department of Mechanical Engineering, Indian Institute of Technology (ISM), Dhanbad 826004, Jharkhand, India
*
Authors to whom correspondence should be addressed.
Coatings 2023, 13(1), 118; https://doi.org/10.3390/coatings13010118
Submission received: 14 December 2022 / Revised: 3 January 2023 / Accepted: 5 January 2023 / Published: 8 January 2023

Abstract

:
Mechanical components frequently come into contact against one another causing friction that produces heat at the contact area and wear of the components that shortens part life and increases energy consumption. In the current study, an attempt was made to optimize the parameters for the pin-on-disc wear tester. The experiments were carried out in ambient thermal conditions with varying sliding speeds (0.5 m/s, 0.75 m/s, and 1.0 m/s) and applied loads (5 N, 10 N, and 15 N) for pure molybdenum disulfide with 9% and 20% weight percentage of graphitic carbon nitride (g-C3N4) in molybdenum-disulfide (MoS2)-nanocomposite-coated steel substrate. Analysis of variance (ANOVA) was used to determine the outcome of interaction between various constraints. To identify the minimum wearing conditions, the objective was defined as the criterion ‘smaller is better’. The maximum impact of the applied load on the coefficient of friction and wear depth was estimated to be 59.6% and 41.4%, respectively, followed by sliding speed. The optimal condition for the minimum coefficient of friction and wear was determined to be 15 N for applied load, 0.75 m/s for sliding speed, and weight percentage of 9 for g-C3N4 in MoS2 nanocomposite. At the 95% confidence level, applied load was assessed to have the most significant effect on the coefficient of friction, followed by sliding speed and material composition, whereas material composition considerably impacts wear, followed by loading and sliding speed. These parameters show the effect of mutual interactions. Results from the Taguchi method and response surface methodology are in good agreement with the experimental results.

1. Introduction

The fundamental reasons for breakdown in many moving parts employed in mechanical work are friction and wear. A significant amount of energy is expended to eliminate frictional resistance. A result of friction is wear and heat, which can lead to noise emissions, material fatigue, mechanical losses, surface deterioration, and shorter component service life [1]. The cost of maintenance, machinery, and fitting due to wear and tear with frictional problems has an impact on a company’s economy [2]. Enhancing the tribological characteristics of the contacted surfaces is a primary technique to reduce energy usage. Enhancing the tribological characteristics of the mating surfaces is a primary technique to reduce energy usage. The need for improved lubricants is increasing due to its properties including the capacity for use throughout a wider temperature range, higher loads and speeds, and durability with operational life [3]. For fulfilling the demands of machinery in harsh situations, unique and efficient friction-resistant lubricants with high-load-bearing additives must be developed [4].
Two-dimensional nanoparticles have a larger specific surface area than other nanomaterials for absorbing onto a substrate’s surface, which reduces or eliminates friction between the contacted surfaces [5]. Molybdenum disulfide (MoS2) was discovered as a potential 2D transition-metal chalcogenide (TMD) due to its chemical stability and can be used as a coating material. Lower fiction is caused by a weakened Van der Waals attraction connecting the sulfur lamella [6]. The lubrication effect is produced by the molybdenum disulfide’s layers, which effectively slide across each other and align parallel to the relative movement while sliding. The lamella, on the other hand, is particularly resistant to asperity penetration due to the strong ionic interaction between molybdenum and sulfur atoms [7]. Molybdenum disulfide in pure form, on the other hand, easily absorbs moisture and could be oxidized in any environment containing either molecular or atomic oxygen [8]. This produces a rapid growth in the frictional coefficient and deterioration in the durability of the frictional surface [9,10]. As a result of these limitations, its practicality is constrained and limited. Improving the coefficient of friction and wear life of molybdenum sulfide used as a lubricant (solid) in various domains of areas is becoming a serious problem. Increasing the wear behavior of MoS2 for practical usage as a lubricant in various industries while retaining a low frictional coefficient is currently recognized as a significant concern [11].
Using a four-ball tribometer, the tribological characteristics of the nanoparticle mixture consisting of lubricating oil and MoS2 under different friction conditions were examined and modeled. The MoS2 particles’ influence on the coefficient of friction and severe load of the lubricating mixture was due to the easier adsorption of MoS2 particles on the sliding surfaces of the ball and the creation of MoO3, which was a protective and lubricating coating. This was made feasible by the relatively simple oxidation of MoS2 during the sliding process, which occurred after its release and passage through the valley onto the contact metal surfaces and their separation at the interface [12]. Nanoparticles developed on the highly-oriented pyrolytic (HOP) MoS2 and graphite were utilized for a model to examine the dependency of frictional forces on the contact area. The power dissipation required for nanoparticle translation was linearly dependent on the contacting area in between the substrate and MoS2 nanoparticles [13].
Graphitic carbon nitride (g-C3N4), which has weakened forces (Van Der Waals) in between the layer and tri-s-triazine unit, is now used in a range of disciplines [14,15]. For improving frictional performance, graphitic carbon nitride is often added to the lubricating medium. The bonding of graphitic carbon nitride with the octadecylamine, for example, led into the creation of boundary layers on surfaces, which improved the resistance to wear of material [16]. Duan et al. [17] selected g-C3N4 as a basic oil additive since it significantly increases thermoset polyimide wear resistance. Zhu et al. [18] developed g-C3N4/PVDF composites and observed that the g-C3N4 filler improved composite wearing.
Austenitic steel, which has a strong corrosion resistance, is the most commonly utilized substrate material. However, when analyzed in a tribological investigation, performance suffers due to various types of wear. Surface modification is probably the most often utilized strategy for mitigating these issues. Carbonitriding, nitriding, carburizing, coating or cladding, and other methods are commonly employed to improve the surface qualities of steel substrate [19]. Microwave radiation heats the substance at the molecular scale, resulting in uniform volume heating. Because the heating begins at the molecule across the bulk, the process is far faster than conventional methods of heating in which heating of the material is dependent on the traditional modes of transmission of heat [20]. However, microwave energy’s adaptability in processing metal components is difficult due to the coefficient of absorption for metallic substance radiation at 2.45 Ghz being substantially lower at ambient temperature [21]. Cladding is often defined by partial substrate dilution and the formation of metallurgical adhesion between the deposit and substrate. Gupta et al. [22] developed a novel technique in surface improvement techniques via microwave cladding. Microwave hybrid heating (MHH) was used to create clads using tungsten-carbide-based powder (WC10Co2Ni) over steel substrate [22]. The homogeneous distribution of the clad element across the substrate eliminates interfacial flaws and fractures. This contributes to improving the material’s microstructure [23].
To analyze the tribological characteristics of friction set, a scientific method is required due to the intricacy of the wearing process. Design of the experiment (DOE) is among the most essential statistical analyses for investigating various process parameters by minimizing the number of multiple trials. The Taguchi method provides the most cost-effective technique for the design of experiments since it is possible to construct a strong design by using expensive parts with high quality materials or even adjusting process factors, but these solutions are rarely effective [24]. Dr. Genichi Taguchi created a range of unique statistical tools, concepts, and methodologies for increasing product quality, most of which are subjected to the statistical theory of DOE [25]. Taguchi describes how he developed his methodology by using a design of experiment to develop a system that can endure a wide range of conditions and fluctuations as well as lowering the target value to limit fluctuation [26]. The Taguchi method was chosen because it is a cost-effective method [27]. Optimization is the process of determining the effective or most efficient use of any condition or resource [28]. The Taguchi design method removes superfluous experimentation from the process. ANOVA analysis is then performed. As a result, the critical characteristics that determine the wear rate are identified. ANOVA is also required to identify how much of any wear process parameter contributes to material wear loss [29,30]. As a consequence, when combined with analysis of variance (ANOVA), Taguchi’s testing method provides a robust instrument for analyzing the effect of various process parameters [31,32,33,34].
The aim of this study is to achieve the optimal results in terms of establishing a minimum coefficient of friction and wear depth by analyzing the impact of various process parameters, such as applied load and sliding speed, on different coating material compositions under dry sliding conditions for g-C3N4/MoS2-nanocomposite-coated substrate with different weight percentages of g-C3N4 in the nanocomposite, which has never been performed before. The findings of this study give insight on the selection of a combination of parameters to achieve the minimum wear and the coefficient of friction.

2. Materials and Methods

For the tribological investigations on coating, a pin-on-disc POD testing apparatus (TR20LEPHM400, DUCOM Instruments, Bangalore, India) was used. Figure 1 depicts the experimental setup for the testing. The counterpart pin is made of AISI304 grade stainless steel and listed in Table 1 together with the substrate’s composition, which was determined by energy dispersive X-ray analysis.
The ambient temperature was nearly 24 degrees Celsius, and the relative humidity (RH) was around 30%. This environment was used for all of the studies. Microwave-assisted synthesized pure molybdenum disulfide (MoS2) with 9% and 20% weight percentage of graphitic carbon nitride (g-C3N4) in MoS2 nanocomposite was taken as coating material for the analysis. Separately, synthesized MoS2 powder and g-C3N4/MoS2 nanocomposite were dissolved and dispersed in absolute ethanol (99.9%). After 30 min of ultrasonication, the solution was then deposited on the substrate with a spin coater (Holmarc, CAS, Lucknow, India).
At low rotating speed, the coating solution spreads across the substrates, and at high rotating speed, coated films were formed. First, the substrate was placed on the spin chuck. Turning on the vacuum liner kept the substrate in place. A preset volume of coating material was dispensed onto the substrate disc with a disposable pipette to coat it. After applying the coating solution, the substrate was spun, and the lid was fixed on the spin-coating. The MoS2 and g-C3N4/MoS2 nanomaterial suspensions were coated on the substrate once the solution was completely suspended. The thickness of the coating on substrate was then calculated from SEM analysis of the cross section of the coated substrate and found to be approximately 4.5 µm as shown in Figure 2.
Tribological experiments were carried out on POD tester with varying sliding speeds (0.5 m/s, 0.75 m/s, and 1.0 m/s) and applied loads (5 N, 10 N, and 15 N). The radius of the disc and pin utilized in the test were 31.75 mm and 4 mm, respectively.
After studying past research on the effect of input parameters on output parameters and the prediction of responses, the Taguchi method and response surface method was chosen for the prediction of response parameters. The objective of this analysis was to determine the correlation between the operating and the response parameters of the nanocomposite-coated disc and counterpart pin. As shown in Table 2, the signal-to-noise (SN) ratio was selected as a performance metric. This ratio evaluates the output’s convergence to such an objective under various noise situations. The following was the formula:
S N = 10   log 1 n y i 2
where ‘n’ represents the observation number and ‘yi’ represents the data. The noise is denoted by the variable ‘N.’ The letter ‘S’, on the other hand, represents the signal. SN ratios were determined with the experiment purpose of ‘smaller is better’ in order to reduce frictional coefficient and depth of wear between the surfaces. The response was calculated using the results of adjusting a process parameter. The optimal wear conditions of a microwave-aided synthesized nanocomposite-coated steel disc were identified. The noise was decreased by altering the dependent variables. It was challenging to adjust the external variables to alter noise. These consist of applied load, sliding speed, and material composition. The procedure determines the optimal process variables for decreasing the wear depth and coefficient of friction. The interactions between the factors were also taken into account.
The orthogonal arrays were utilized to build the experiment design and engineering optimization. The detected input factors and related levels are listed in Table 3. The levels were chosen as per the specification of the instrument available at the center.

3. Results and Discussion

3.1. Design of Experiment (DOE)

The most fundamental strategy for simultaneous examination of the numerous components affecting the process is the design of experiment. It not only limits the number of trials that must be conducted, but it also specifies the research projects required to reach the objective. Effective factor identification was required to evaluate the methodological approach [32,33,34]. Employing a Taguchi L-9 array, the combination of parameters used in the process for each experiment in the present investigation was obtained. Wear depth was estimated using the pin-on-disc tribometer, which was equipped with a linear-variable differential transformer (LVDT) sensor with a range of up to 2000 µm with least count of 0.1 micron and accuracy of 1 ± 1% of calculated wear. Table 4 contains the parameters of all 27 trials as well as the experimental results for coefficient of friction and wear in a previous investigation [35].

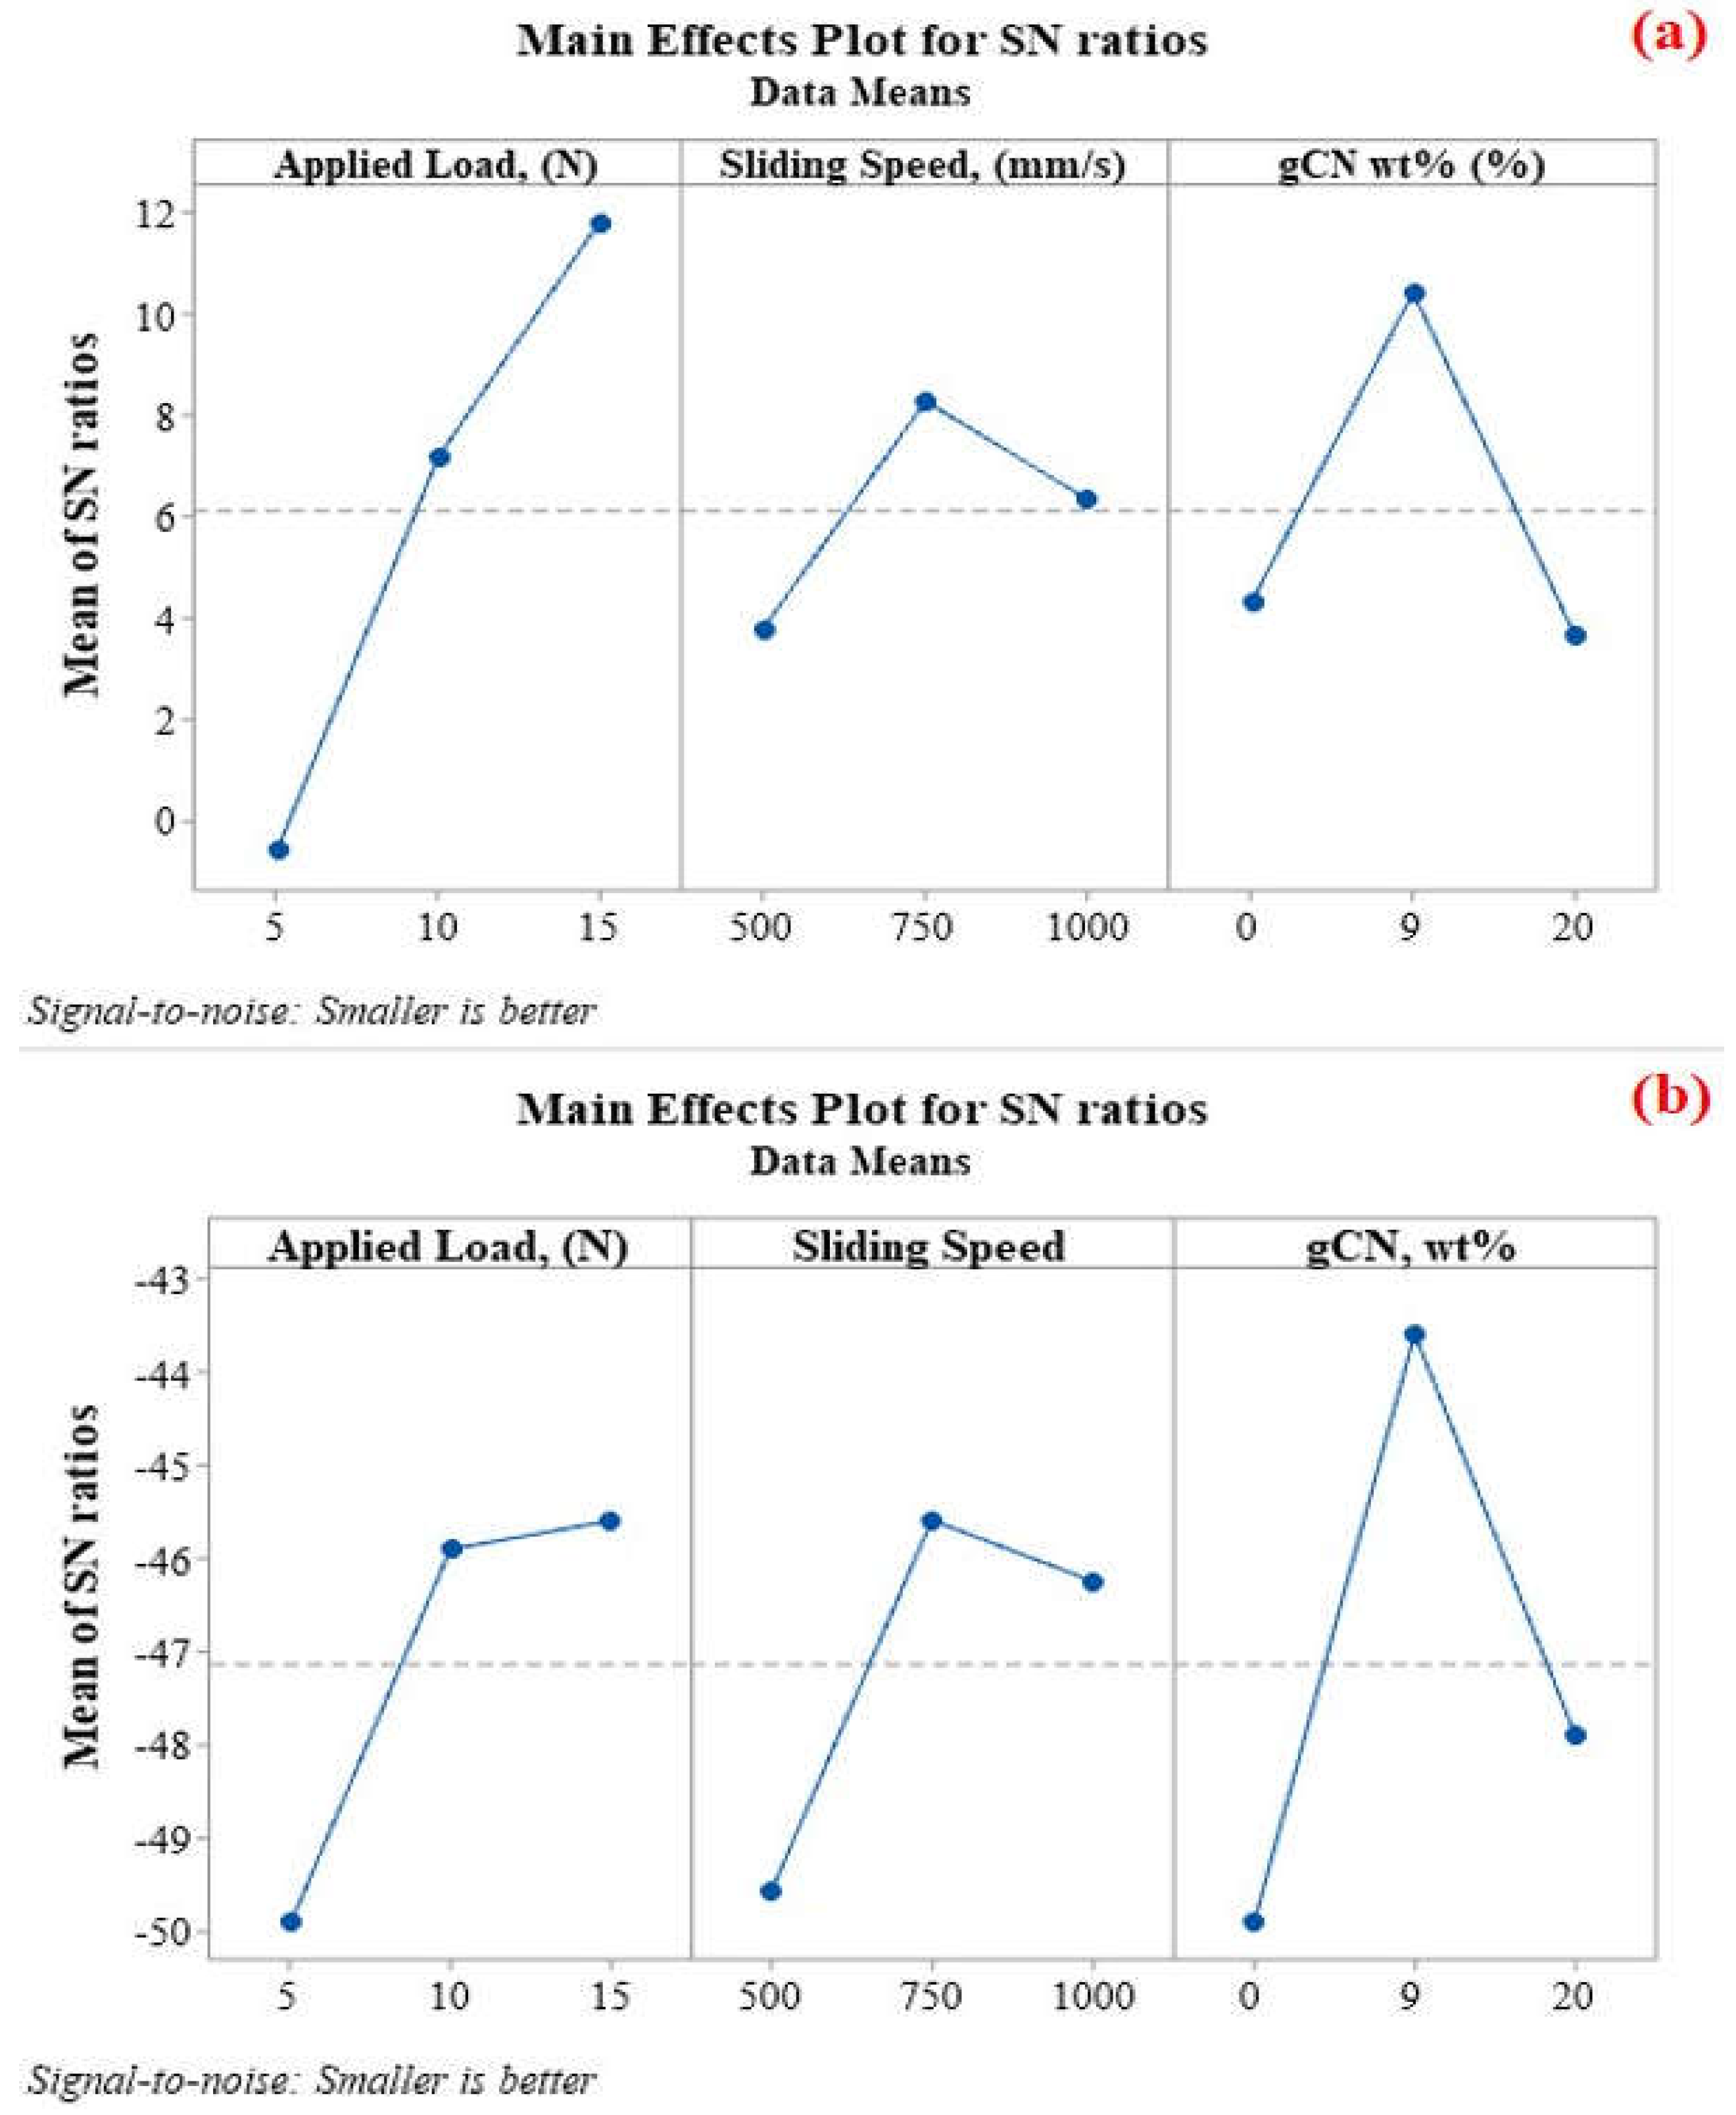
3.2. Signal-to-Noise (SN) Analysis of Wear Depth and Coefficient of Friction

The purpose of the study was to determine the critical parameters impacting the wear mechanism as well as the related conditions for minimum wear depth and coefficient of friction. Figure 3 depicts the normal probability plot of the experiment. Because there was no indication of skew in the probability line, the line indicates the normality of the data distribution. Aside from the factors of interest, the graph shows no slope. This means that there was no influence of any unknown variables or other substantial variables influencing the response.
Figure 4 shows the main effects plot for the experiment. The slope of the plots showed that the applied load and weight percentage of g-C3N4 in the composite have the significant impact on the COF and wear, respectively, for the current experimentation state. As a result, any small variation in these parameters results in a significant difference in the COF and wear of the substrate.Therefore, substantial changes to this parameter are restricted. It can be seen from Figure 4 that the sliding speed was the least impacting parameter. With the associated optimum environment and wear mechanism, the effect of wear on control limits was investigated. Based on the SN ratios and data means, as reported in Table 5, the impact of input conditions was examined. The levels for every factor were established with the concept that they would indicate the range needed for the analysis, from low loading conditions to high. The ‘data means’ were the factor means for every factor and level combination, as presented in Table 5. The quantity of effects or the delta was calculated by subtracting the highest to lowest averages for any factor. When examining rank in the response table, it is simpler to understand which factor has the greatest impact.
The factor with the largest delta value has been assigned rank 1, followed by the factor with the second largest delta and so on. The SN ratio for input parameter behavior was statistically significant. In Table 5, each delta, rank, and factor level’s signal-to-noise ratio is given in each row. The table has a column for each factor. The same method as before was used to calculate delta and rank. In the experiment, the applied load had the greatest influence on the coefficient of friction, followed by sliding speed and g-C3N4 weight percentage. Figure 4a,b and Figure 5 depict the principal design of control for the SN ratio, data means, and the interaction effects with controlling inputs. The main impression curves’ bends indicate how each parameter has an impact. The most important factor was the one with the highest elevation of the line. The applied load for COF and g-C3N4 weight percentage for wear depth were shown to be the most important factors in Figure 4a,b.
The interaction plots of the present investigation are shown in Figure 5. All of the input variables have an interaction effect on the output variable. Because of this, the variations in the results generated is not due to one of the input parameters alone but rather to the combined effects of all input parameters that are taken into account. Any interaction plot can be used to determine the existence of effects from any non-parallel factor. A non-parallel interaction indicates weak interaction; complimentary interaction indicates a strong relationship. According to the findings of this investigation, the applied load for coefficient of friction and wt.% of g-C3N4 in nanocomposite had the most significant effects on response. Figure 5 and the contour plots in Figure 6a–c show how the various inputs interact and have an impact on wear depth and coefficient of friction, respectively. Figure 5 illustrates how the applied load surpassed the variance in other inputs. Examining how each factor’s deviation affects the COF and wear depth is simple and intuitive when using the contour map.

3.3. Analysis of Variance (ANOVA) for Wear Depth and Coefficient of Friction

ANOVA is a statistical method used to estimate processes and examine mean differences. It is used to determine the test’s statistical significance. It is used to investigate the effect of applied load, sliding velocity, and graphitic carbon nitride weight percentage in nanocomposite on output COF and wear depth in a controlled manner. The difference between averages divided by the difference across yields was used to calculate the F-value (factor value). A significant difference among specimen average with the variation of the parameters confirms the higher F-value. The related probability value was lower if the factor value was higher. The p-value reflects the probability of any error. Table 6 shows the correlations between the data after they were corrected at three levels. Sources from Table 6 were utilized to figure out which parameter regulates the other parameter and how significantly each single factor contributed. A confidence level of 95% was employed in this study. The source that contributed to this performance metric was statistically significant, with p-values < 0.05. The following equations were utilized in the analysis of variance [36,37,38]:
P Q T = P S L + P S S S + P S w t
P Q T = 1 n d i 2 d 2 n
P S v = k = 1 t S d i 2 t d 2 n
where n is the number of repititions, Sdi2 is the addition of the experimental trials involving constants v at a level k, d is the resultant data for all the test trails, PQT is the total addition of squares, PSL is the applied load addition on squares, PSSS is the sliding speed addition on squares, and PSwt is the weight percentage of g-C3N4-addition of squares.
The analysis of variance (ANOVA) table can be seen in Table 6, and it is evident from table that each of the parameters taken into consideration has a significant effect on wear behavior. The much more significant parameters for COF and wear depth were applied load and graphitic carbon nitride in nanocomposite, respectively. This could be attributed to the reason that as the applied load rises, the pressure at the contact between the pin and disc rises, resulting in a lubricating characteristic of g-C3N4/MoS2. Additionally, the wt.% of g-C3N4 enhances to the wear preservation of the coating as the MoS2 could be quickly oxidized due to theheat generated between the surfaces. Because the material of the coating (i.e., nanocomposite) was removed in powder form, the eliminated material adhered to the disc surface, reducing the raw surface contact and reducing wear. Finally, due to the support of molybdenum disulfide and its nanocomposite with graphitic carbon nitride in the lubricating mechanism, the sliding speed has the lowest impact on wear.The wear of the coating material was most significantly impacted by the applied load. As a consequence, during the wear, the applied load, followed by the other parameters, were critical control components to consider. The COF and wear depth were only slightly impacted by the interaction between the different inputs, i.e., applied load, sliding speed, and nanocomposite composition.

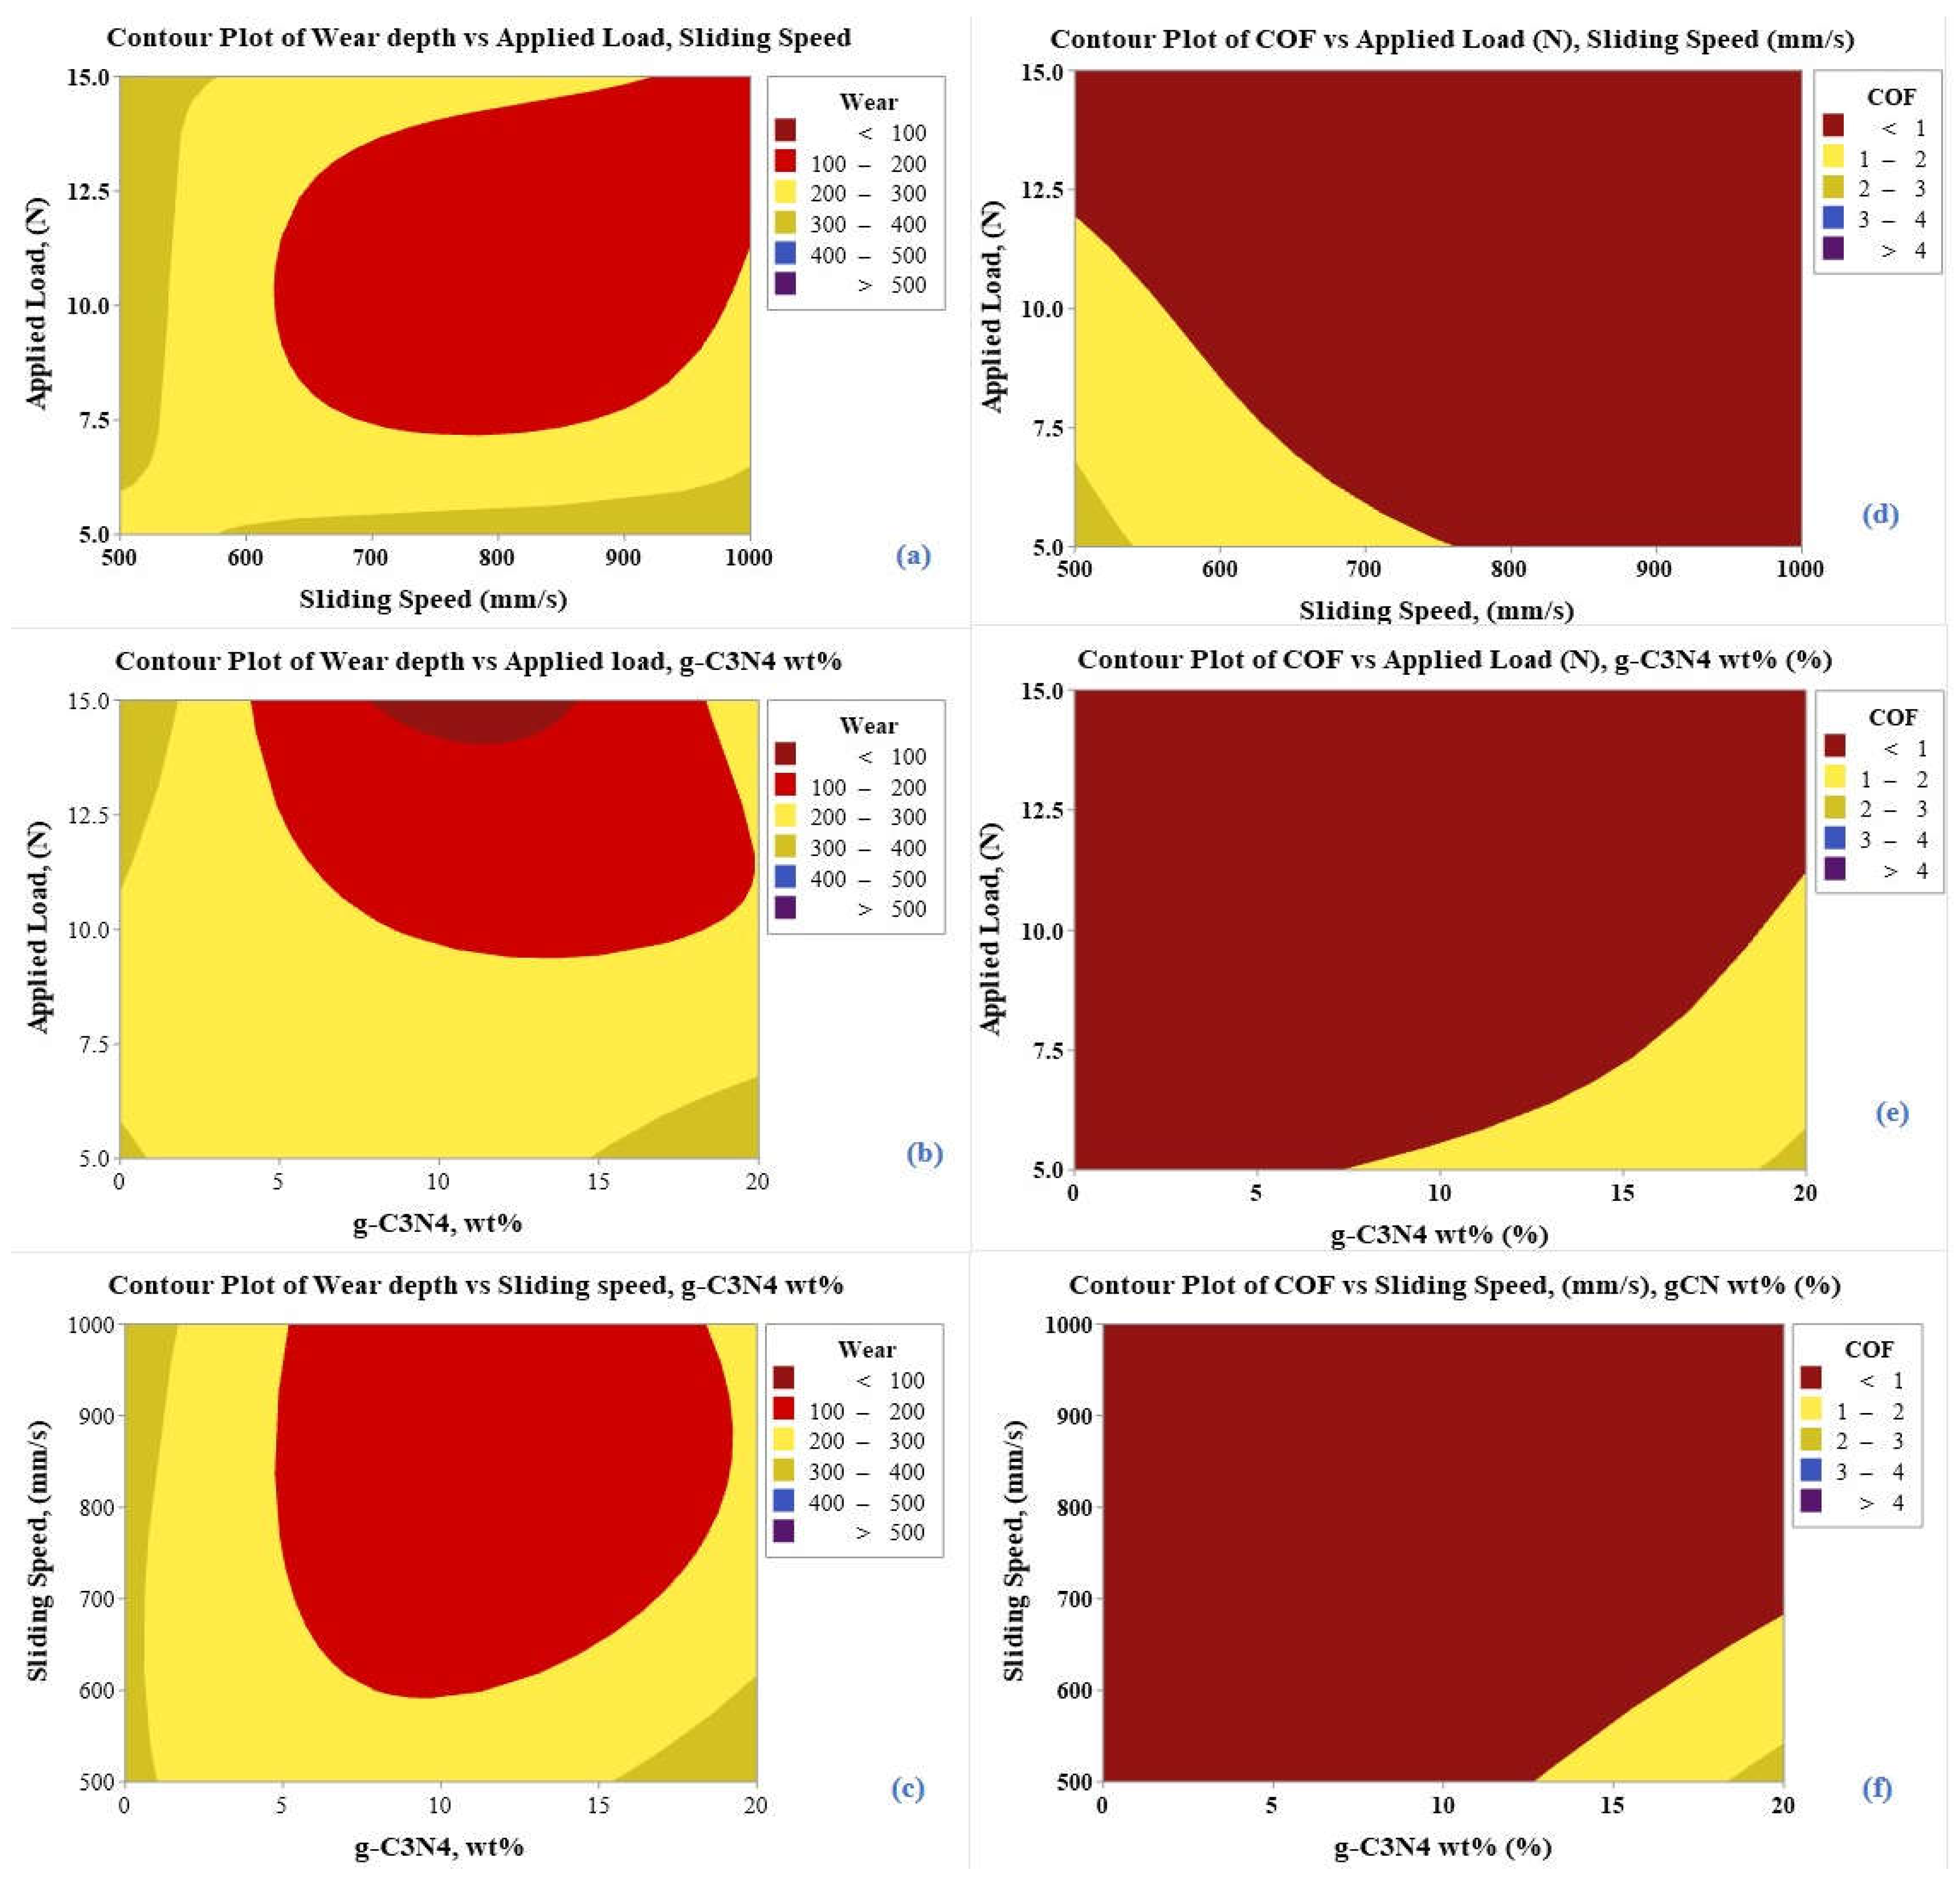
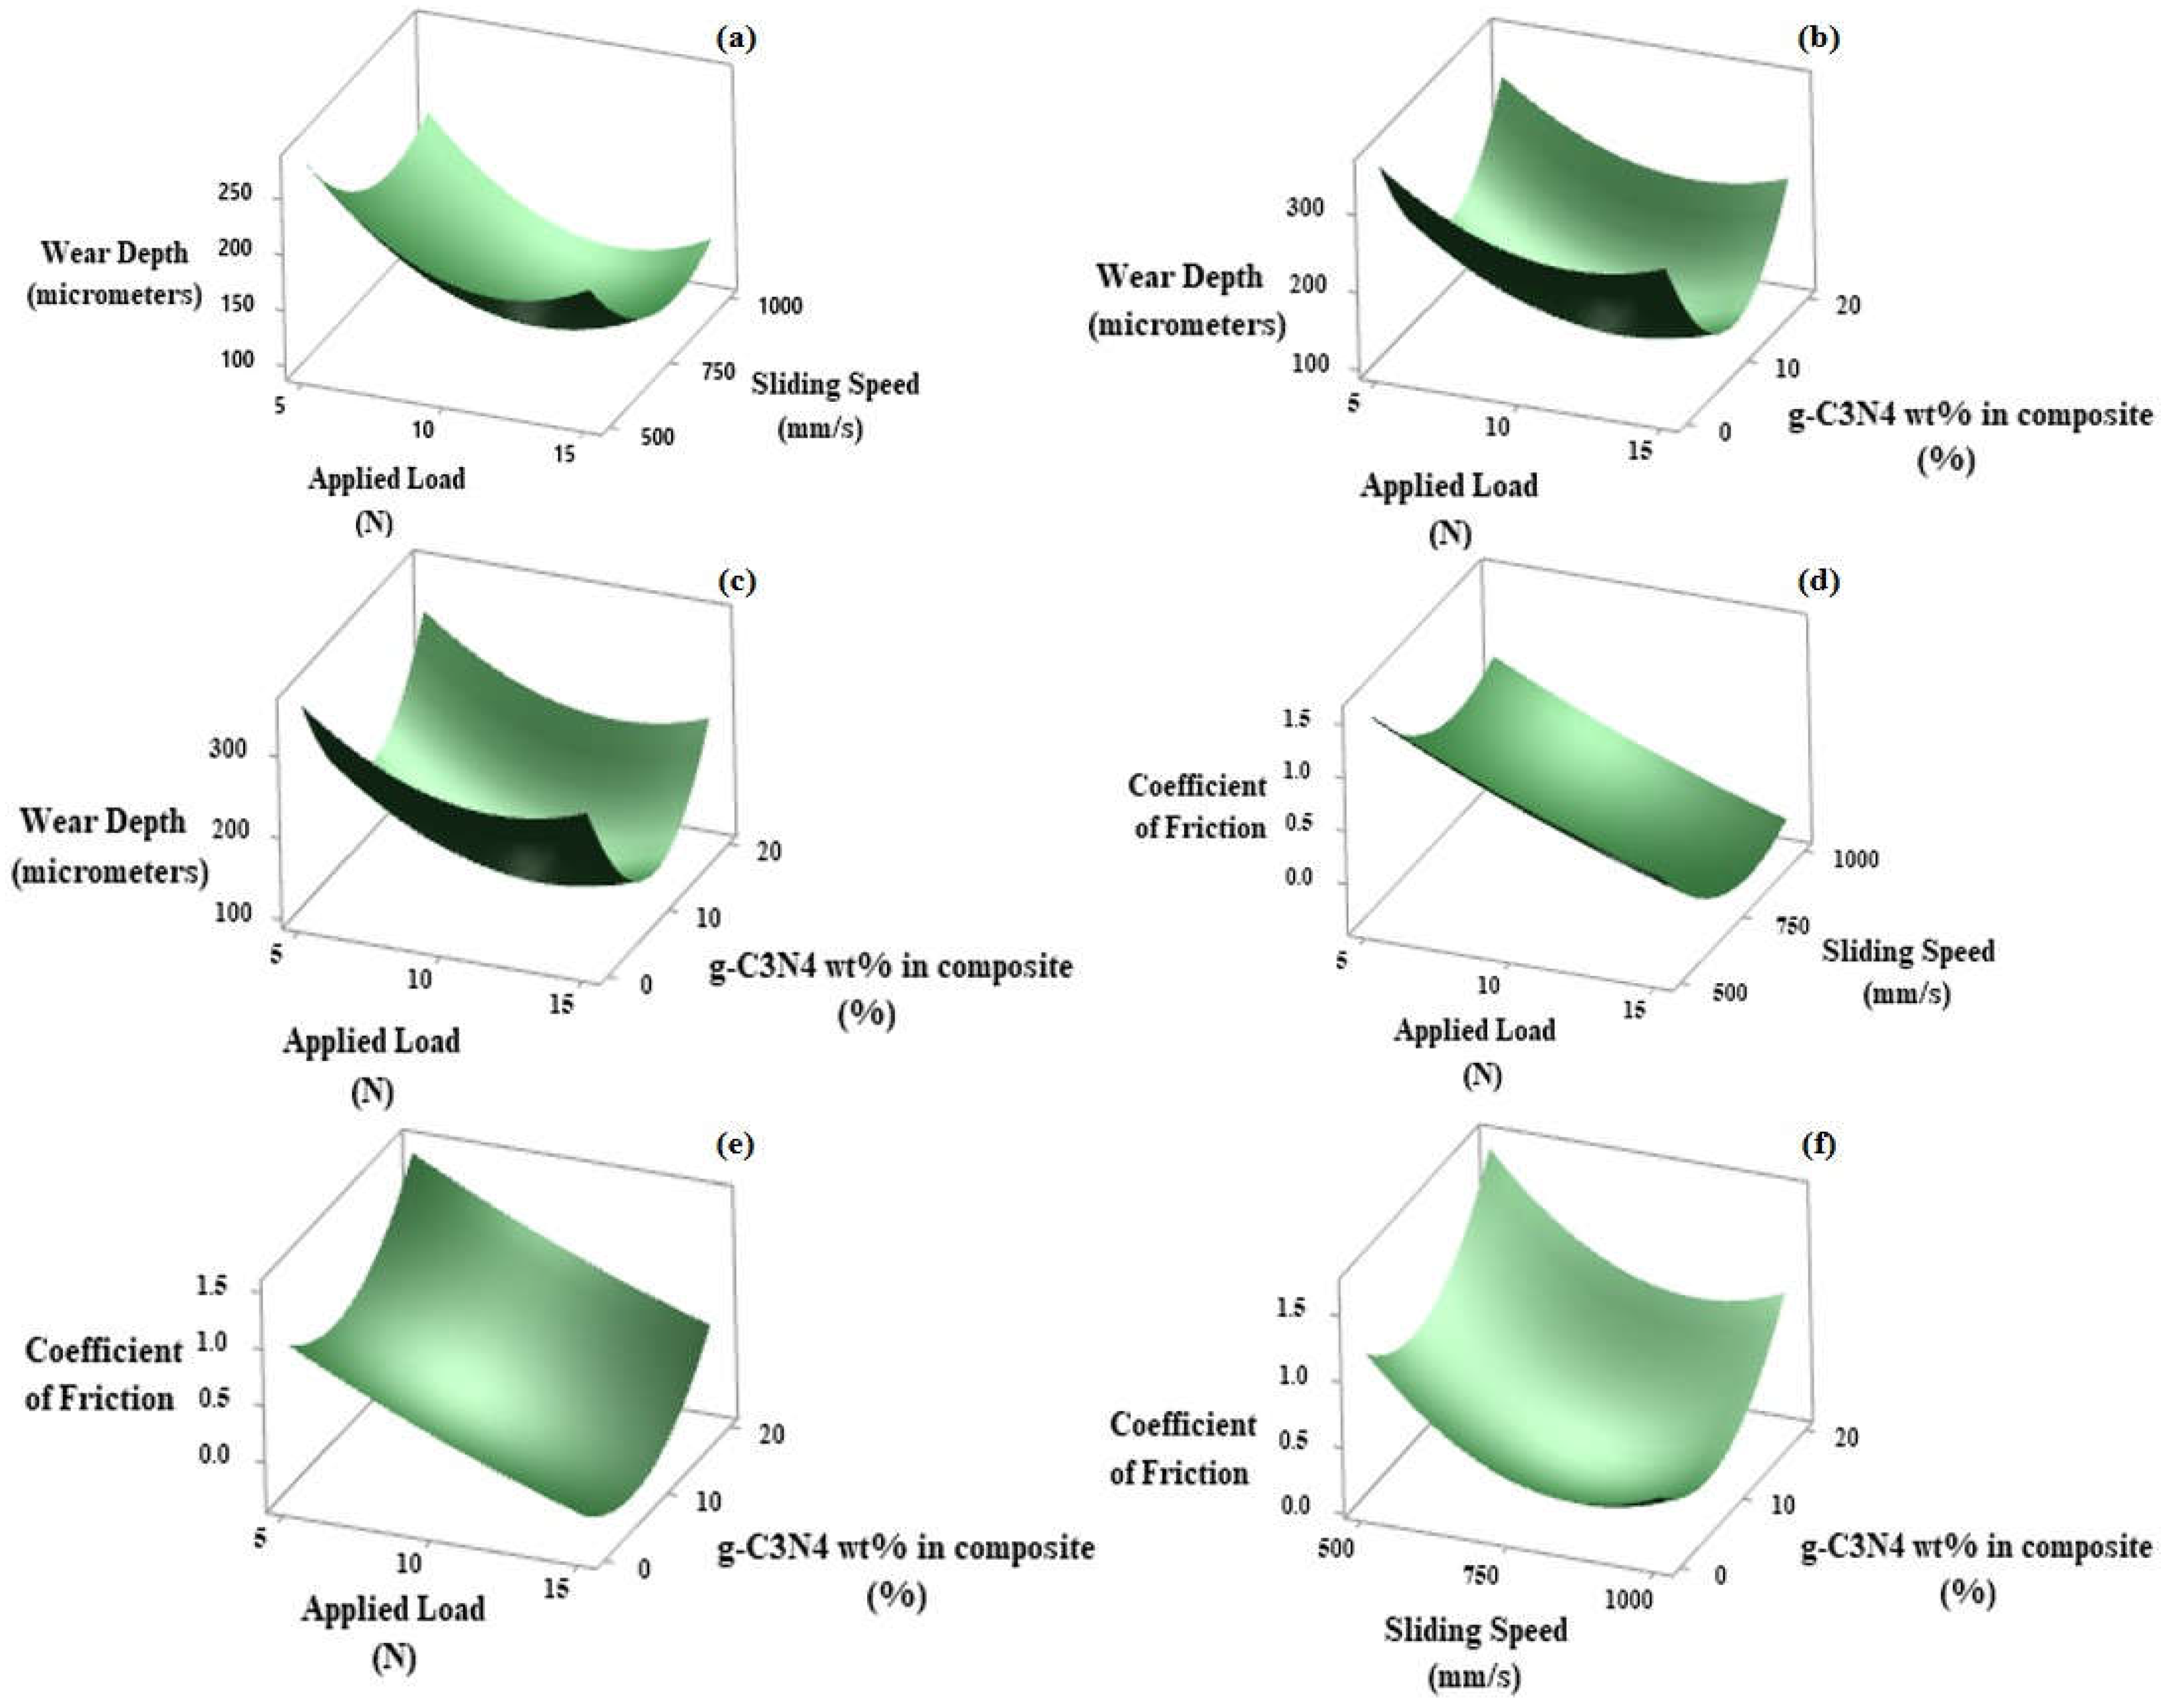
3.4. Modeling through Response Surface Methodology (RSM)

RSM is a multipurpose technique that can be used to construct mathematical models to predict responses, analyze surface responses using response surface curves to help explain how an input parameter affects a response parameter, analyze variance in process parameter values, and determine the optimal parameter. In order to analyze the data, determine the significance of parameters for the model, calculate the mean response, and find the optimal operating condition for the control variables which assist in achieving a minimum or maximum response over a particular interested region, a linear and second-degree model was used in this paper.
As a result, the model was created for analyzing variance to assess the significance and stability of response as well as the process parameters. This was performed after obtaining the response parameters (Table 4).
The equations below address the mathematical model which was developed by using the MINITAB-19 to analyze the response parameters:
COF = 462 − (7.10 × Load_Applied, (N)) − (0.142 × Sliding_Speed (m/s))
− (1.85 × g-C3N4 wt.% (%))
Wear = 1069 − 48.3 Load_Applied, (N) − 1.25 Sliding_Speed (m/s) − 29.6 gC3N4 wt.% (%)
+ 2.06 Load_Applied, (N) × Load_Applied, (N) + 0.000740 Sliding_Speed, (m/s) × Sliding_Speed, (m/s) +
1.363 g-C3N4 wt.% (%) × g-C3N4 wt.% (%)
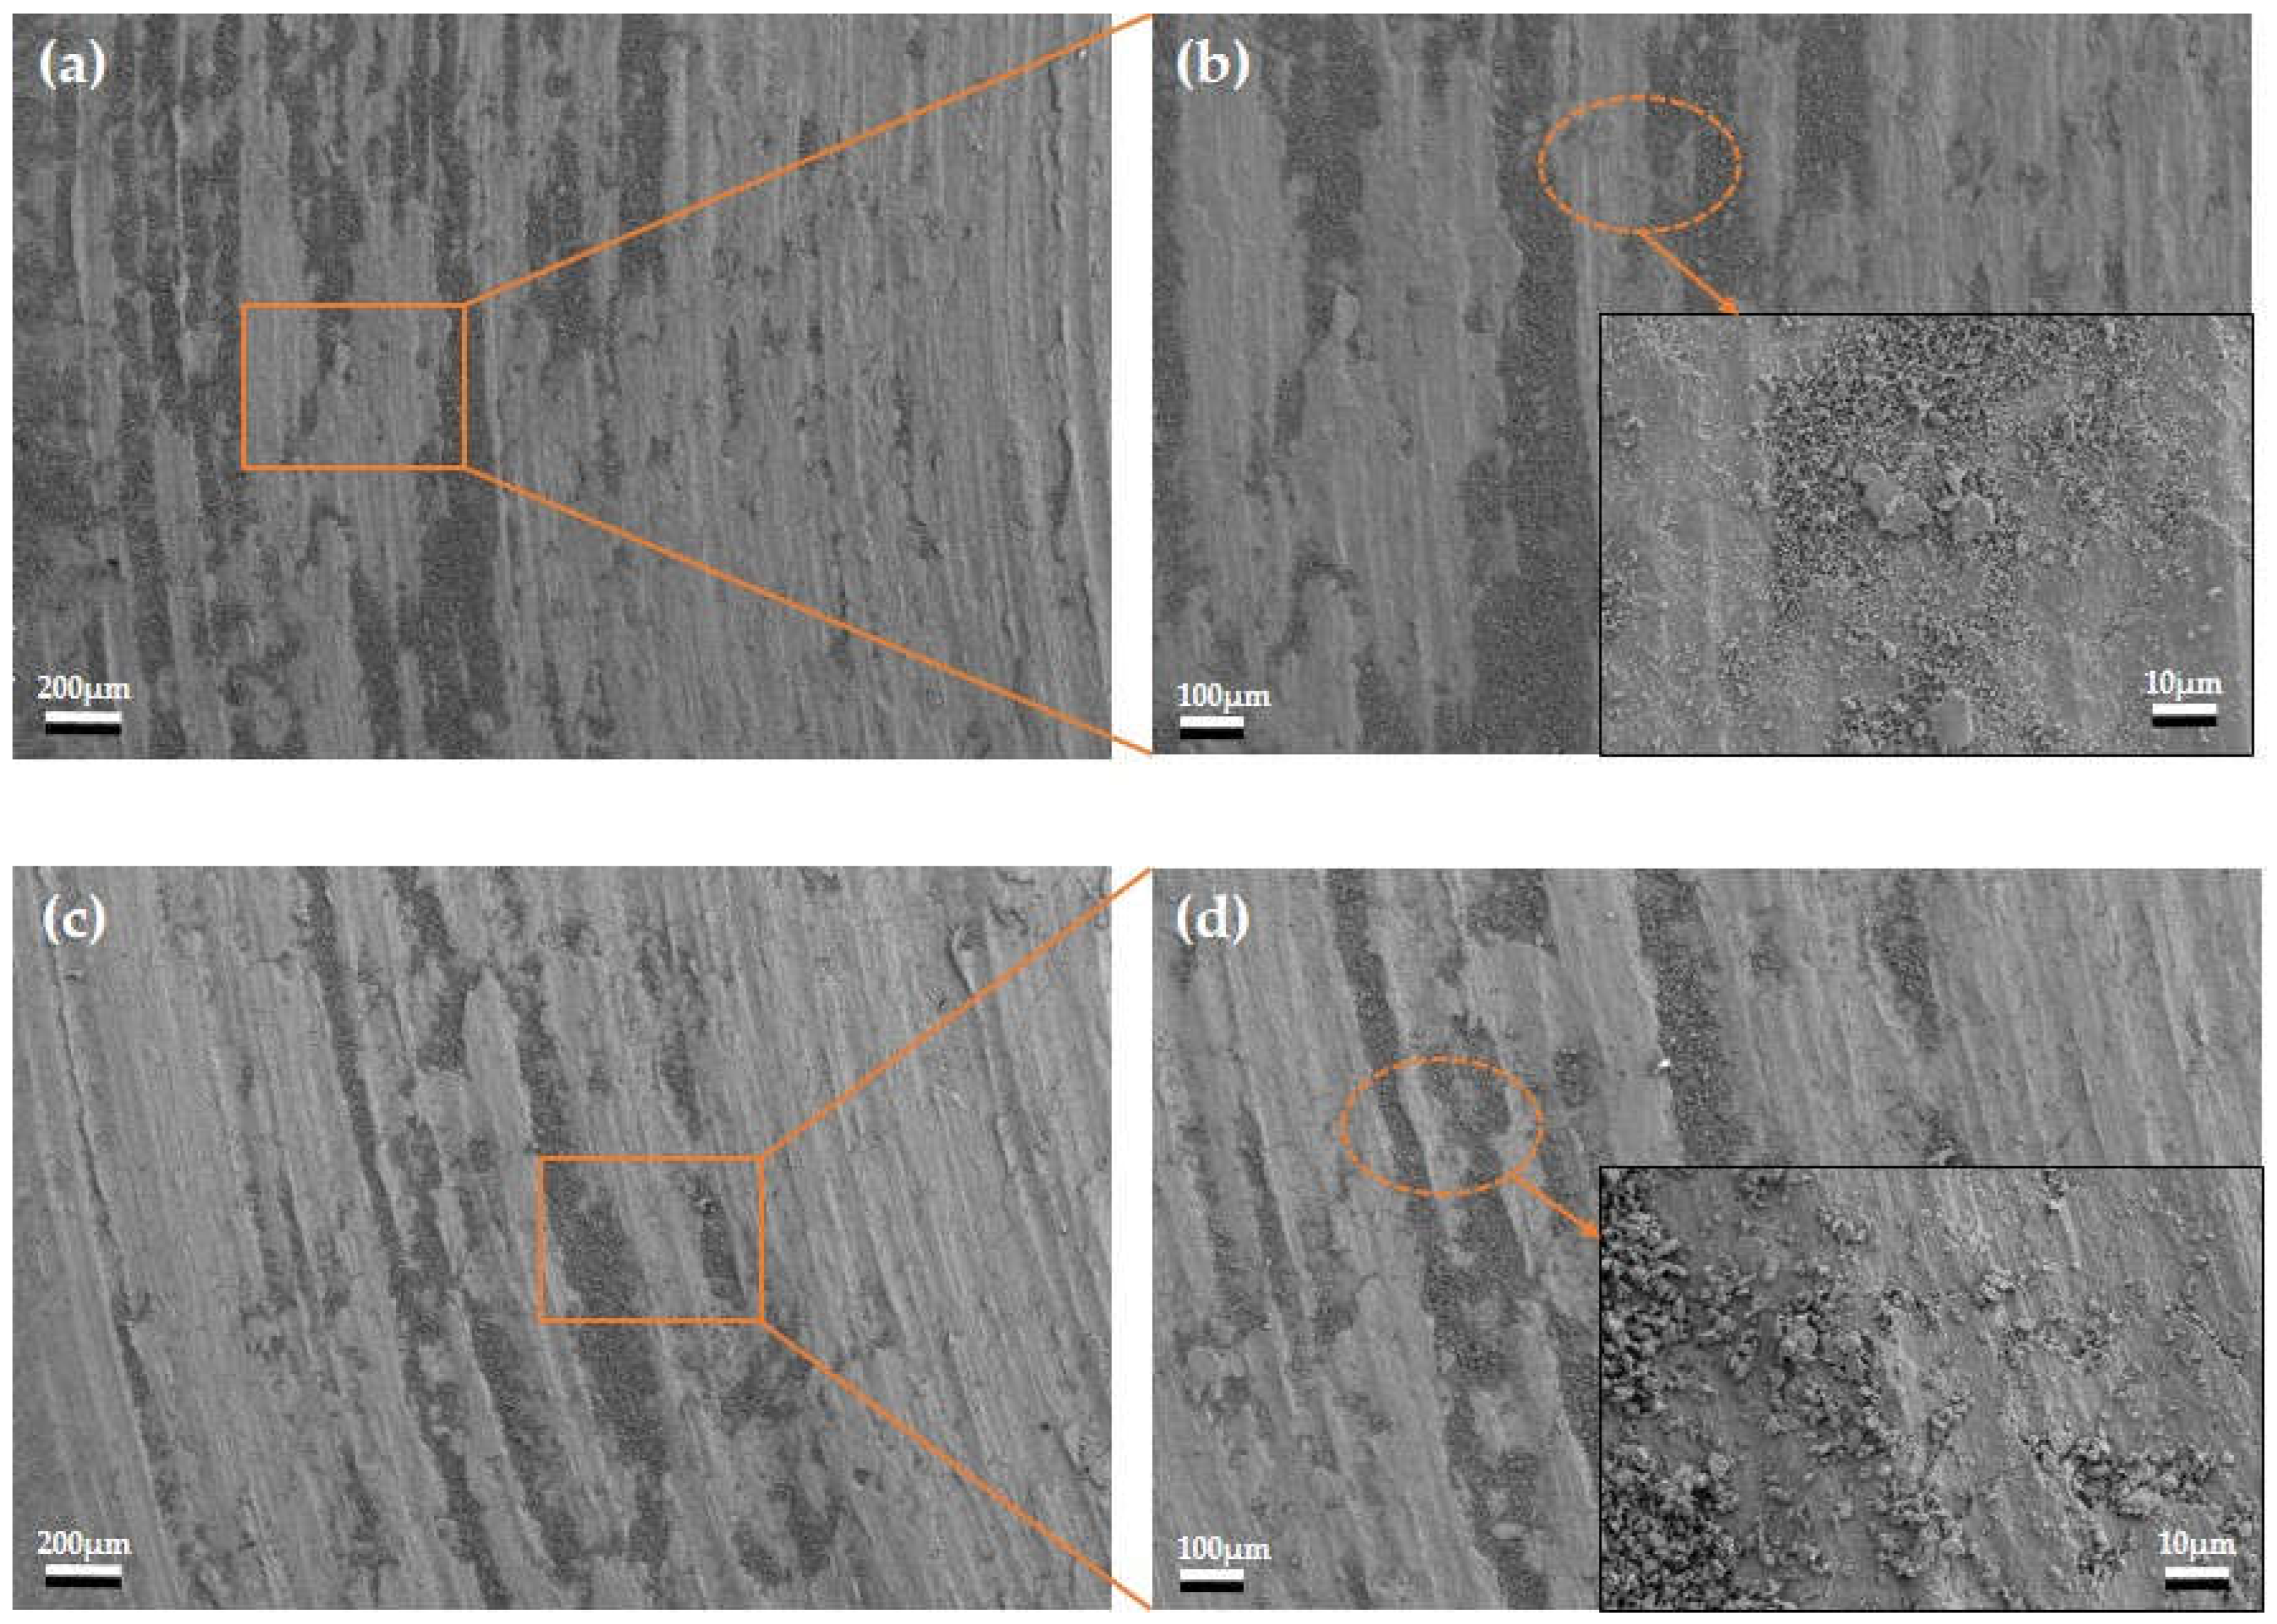
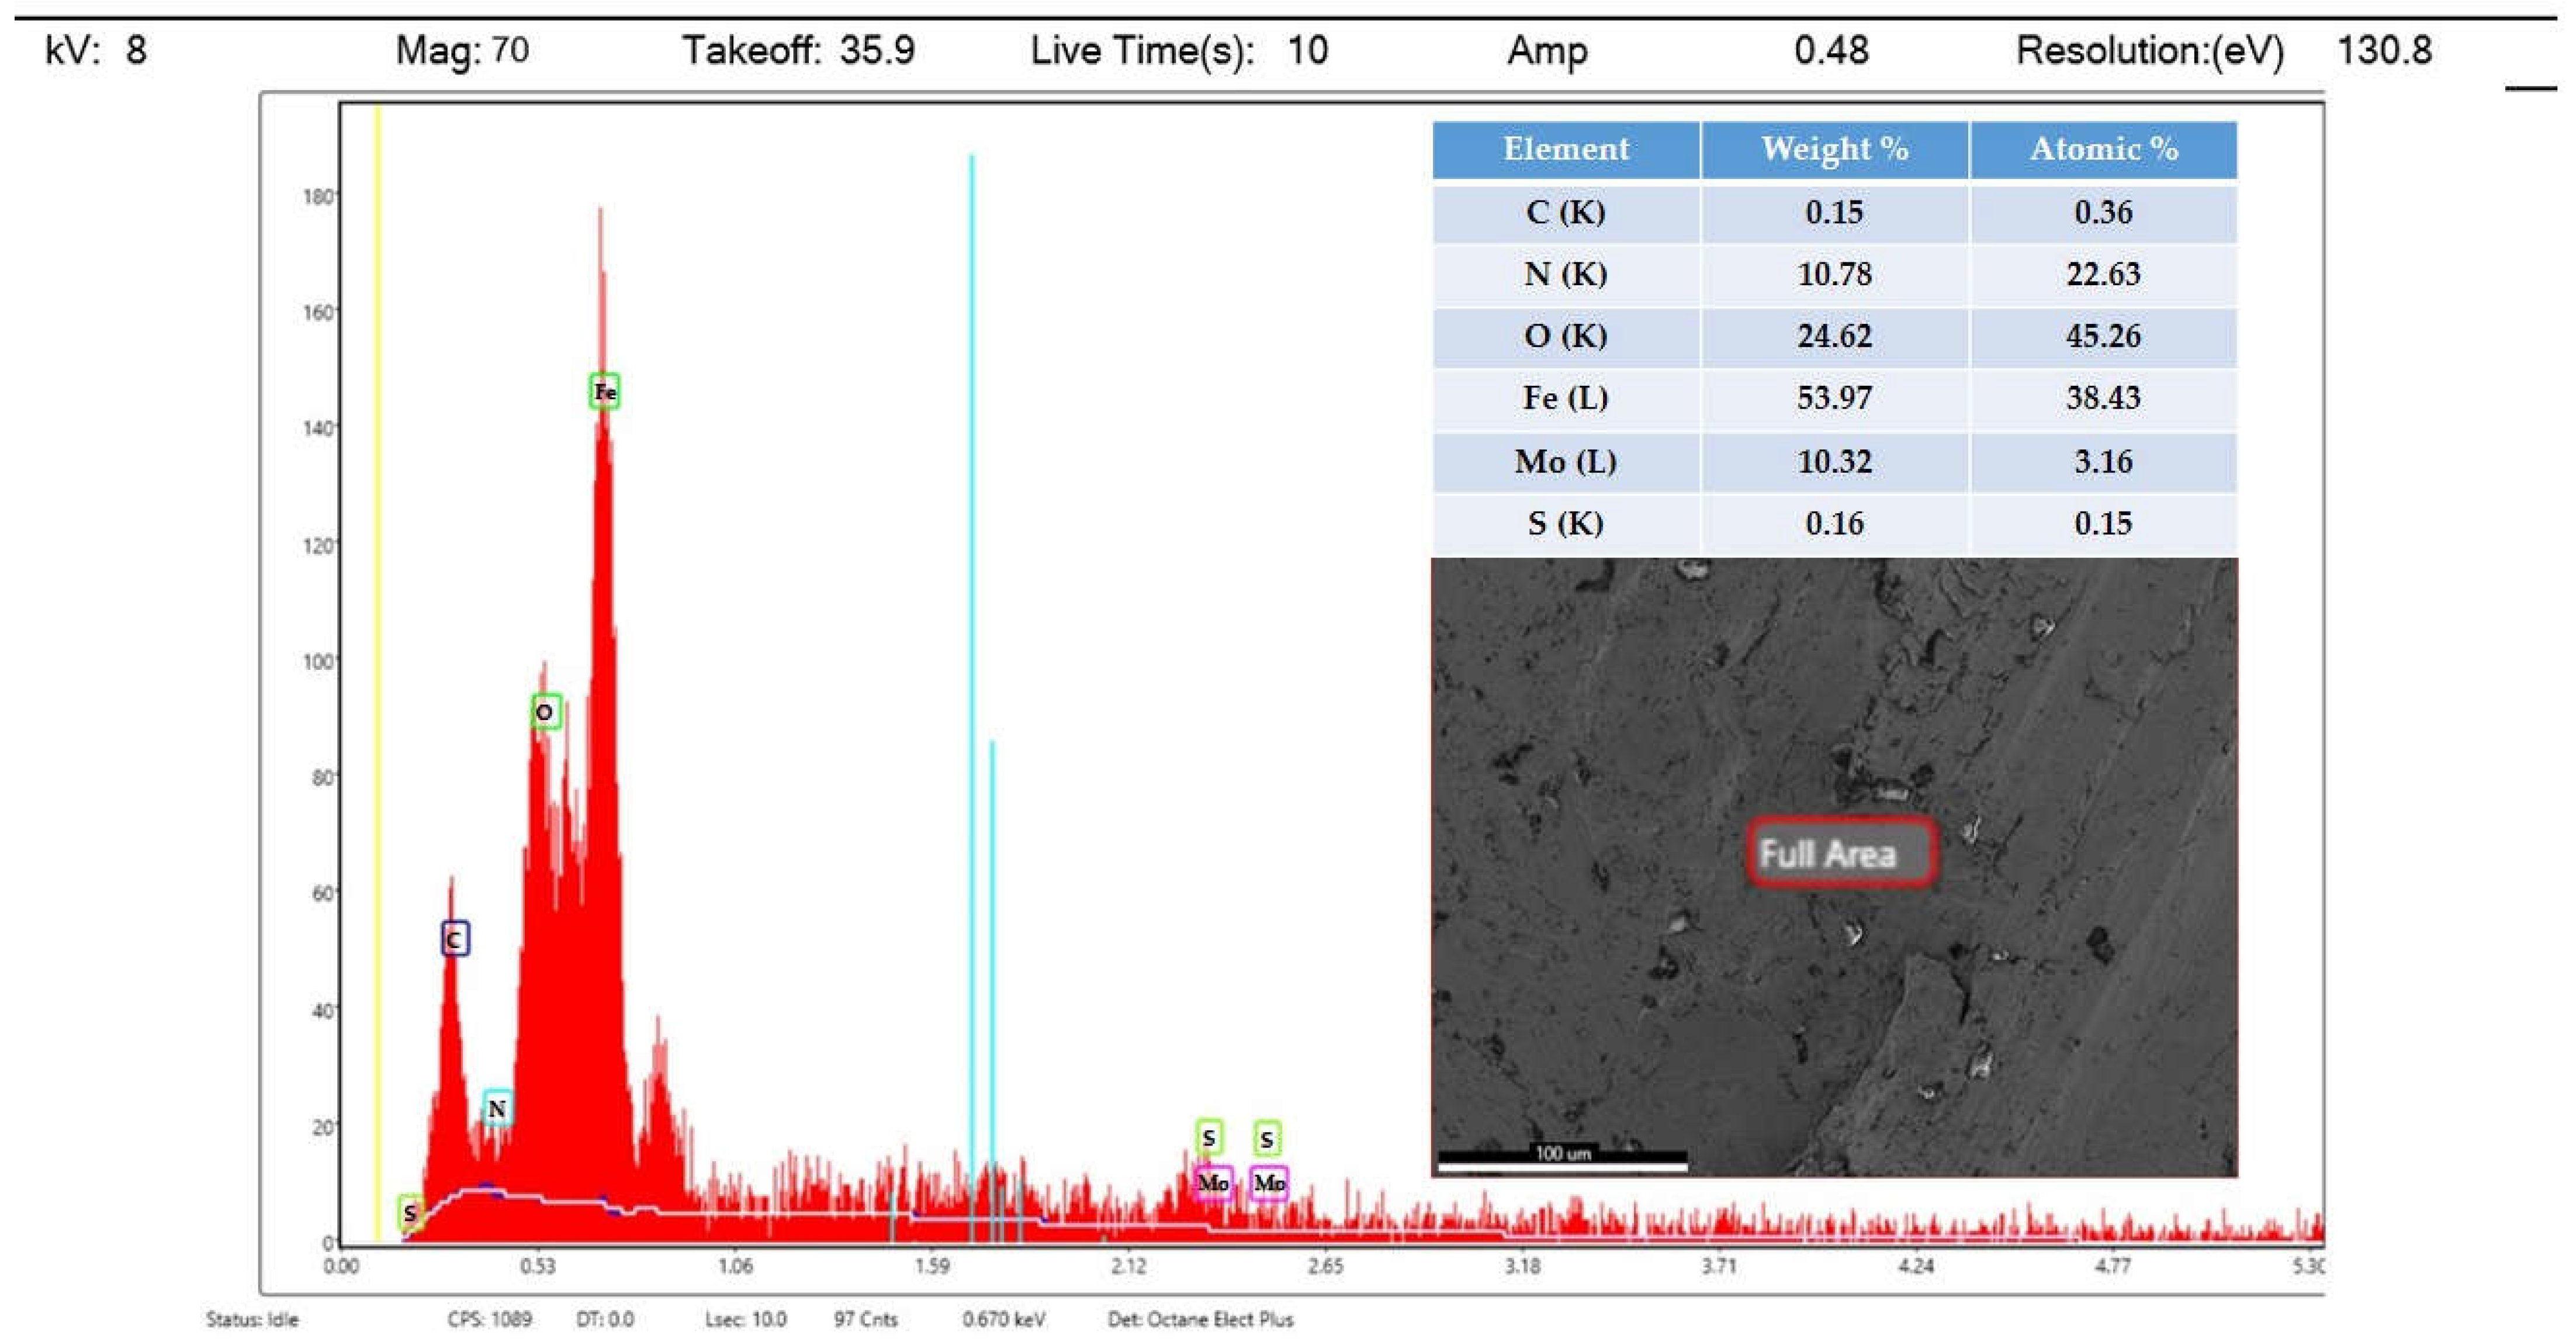
The aforementioned regression model aids in the prediction of the response parameters, i.e., wear depth and coefficient of friction. The influence and significance of the parameters and related factors on the parameters for response must now be examined using the variance analysis (ANOVA) for response surface methodology. The probability value (p-value) for the factors must be below 0.05 to fulfill the criterion of a factor that was significant criteria as the ANOVA was performed at 95% confidence level. Table 7 provides the ANOVA analysis for response surface methodology, which summarizes the degree of freedom, sum of squares, p-value, and F-value of response parameters in MoS2 and g-C3N4/MoS2 nanocomposite.
The ANOVA analysis for the coefficient of friction and wear depth is shown in Table 7 to examine the significance of the process factors and their influence on response parameters, namely frictional coefficient and wear depth. Load applied on coated substrate has a significant effect on COF, roughly 59.6%, which was the greatest between all parameters with their factors. Additionally, in Table 7, the ANOVA analysis for wear depth is shown for analyzing the significance of process parameters with the impact on the response parameter, i.e., wear depth. It can be seen from Table 7 that the applied load and sliding speed makes a significant impact on wear depth, approximately 41.4 % and 41.2%, which was the greatest among the other process parameters with their factors.
As analysis of variance studied the effect of parameters used for process on the parameters for response, similarly, variation in the parameters for response by changing inputs can be studied by response surface plots. Figure 7 depicts the response surface curve at applied load, sliding speed, and g-C3N4 weight percentage in nanocomposite. Figure 7a–c shows variation in wear depth with applied load, sliding speed, and weight percentage of g-C3N4 in g-C3N4/MoS2 nanocomposite, and it can be analyzed that at applied load 15N, sliding speed 0.75 m/s, and 9 wt.% of g-C3N4, minimum wear depth was found. Figure 7d–f show variation in coefficient of friction with the factors and as the same combination for that of wear depth, and it was found minimized at 15 N applied load, 0.75 m/s sliding speed, and 9% of weight percentage in g-C3N4/MoS2 nanocomposite due to the combined effects of response parameters and their interactions as the study was to optimize the wear depth with COF generated in the wear process.
Attributed to the reason that molybdenum disulfide can quickly oxidize at high temperatures between the pin and disc surfaces while used in pure form, and MoS2 predominates when the wt.% of g-C3N4 in the composite increases, the reduction in wear depth and coefficient of friction were higher in the case of g-C3N4 at a wt.% of 9 in nanocomposite.
A response optimizer for experimentation was developed by response surface method and is depicted in Figure 8. The optimization of the process parameters to achieve the lower COF and wear depth is illustrated by the red-colored line, which was approximately same as obtained by the Taguchi method.
The optimum results for response factors (i.e., coefficient of friction and wear depth) obtained from the Taguchi method and response surface methodology (RSM) with experimental results are summarized in Table 8. In all methods, the results are very comparable with each other. A minor difference was found while predicting the responses through Taguchi and RSM. The coefficient of friction varies by approx. 13% and 15% and wear depth by approx. 5% and 12% from the experimental findings while predicting the COF and wear depth through Taguchi and response surface methods, respectively.

3.5. Wear Mechanism

Figure 9 shows FESEM images of the worn surfaces of an uncoated steel substrate disc and a g-C3N4/MoS2 (9 wt.%)-nanocomposite-coated steel substrate disc, after a wear test at 0.75 m/s sliding speed and 15 N applied stress. Figure 9 depicts the amount of wear loss caused by plastic deformation and ploughing. The wearing was heavily influenced by abrasive wear. Several deep scratches and craters, as well as small micro cracks with sheared off asperities of pin material, were detected while inspecting the worn surface. Figure 9a also shows some sheets that indicate the creation of an oxide layer during wear.
Figure 10 and Figure 11 show the EDX elemental analysis results of a worn disc coated with pure MoS2 and g-C3N4/MoS2 (9 wt.%) nanocomposite, respectively. The results of EDX in Figure 11 corroborate the conclusion that the groove included g-C3N4/MoS2 and that the elements were carbon, nitrogen, molybdenum, and sulfur.
Some oxygen elements were also detected in the EDX mapping in Figure 10 as a result of the oxidation of molybdenum disulfide into molybdenum oxide owing to excessive heating while wearing, however it can be seen from Figure 11 that oxidation was decreased to some extent when g-C3N4 was added in the nanocomposite.
Figure 12 shows the FESEM image of worn out of corresponding pin. Worn surfaces of the counterpart pin used for the tribo test against the g-C3N4/MoS2 (9 wt.%)-nanocomposite-coated disc (Figure 12a) and FESEM images of the counterpart pin used for the pure MoS2-coated disc (Figure 12b) are depicted. The images indicate that rubbing a pin against a pure MoS2-coated disc causes it to wear off unevenly and roughly. This is because the MoS2 was highly oxidized by the heat created by the rubbing of the pin against the disc and the creation of its oxide. The depiction also illustrates ploughing and abrasive wear grooves on the pin. However, when g-C3N4 was included in the nanocomposite, the wear of the pin was found to be less than when the pin was rubbed against the disc coated with pure MoS2, and a comparably smaller quantity of coating was transferred from disc to pin, ensuring adequate adhesion. The worn area on the pin used for the wear test against the g-C3N4/MoS2 (9 wt.%)-nanocomposite-coated disc was about 7.671 mm2, which was 23% less than the worn area on the pin used for the pure MoS2-coated substrate. This demonstrated that the inclusion of g-C3N4 has a considerable impact on wear reduction.
The results of an energy-dispersive X-ray spectroscopy examination of the pin surface that was rubbed against the g-C3N4/MoS2 (9 wt.%)-nanocomposite-coated disc are depicted in Figure 13, confirming that the material transferred from the disc to the pin surface after the wear test was the g-C3N4/MoS2 nanocomposite.

4. Conclusions

The current effort was aimed at the determination of appropriate process parameters for a pin-on-disc (POD) wear tester to analyze the coating material that may result in a low frictional coefficient between the mating surfaces of pin and disc and minimum wear of the substrate disc. For this, discs were coated at different weight percentages of g-C3N4 in molybdenum disulphide (MoS2), and coated discs were tested using a pin-on-disc machine wear testing machine under different operating parameters, such as applied load ranges from 5 to 15 N and sliding speed from 0.5 to 1.0 m/s. The Taguchi method was used to develop a design of experiment and the ANOVA method was employed to find the significance of the process parameters. The results obtained from the RSM method were used to build the mathematical model. After a prolonged wear test, worn surfaces showed evidence of abrasive wear with ploughing, and there was a transfer of coating from the substrate disc to the counterpart pin. The following are the major findings of this study:
  • The created model was significant since it has a high R squared value and a p value that is less than 0.05 for various parameter combinations.
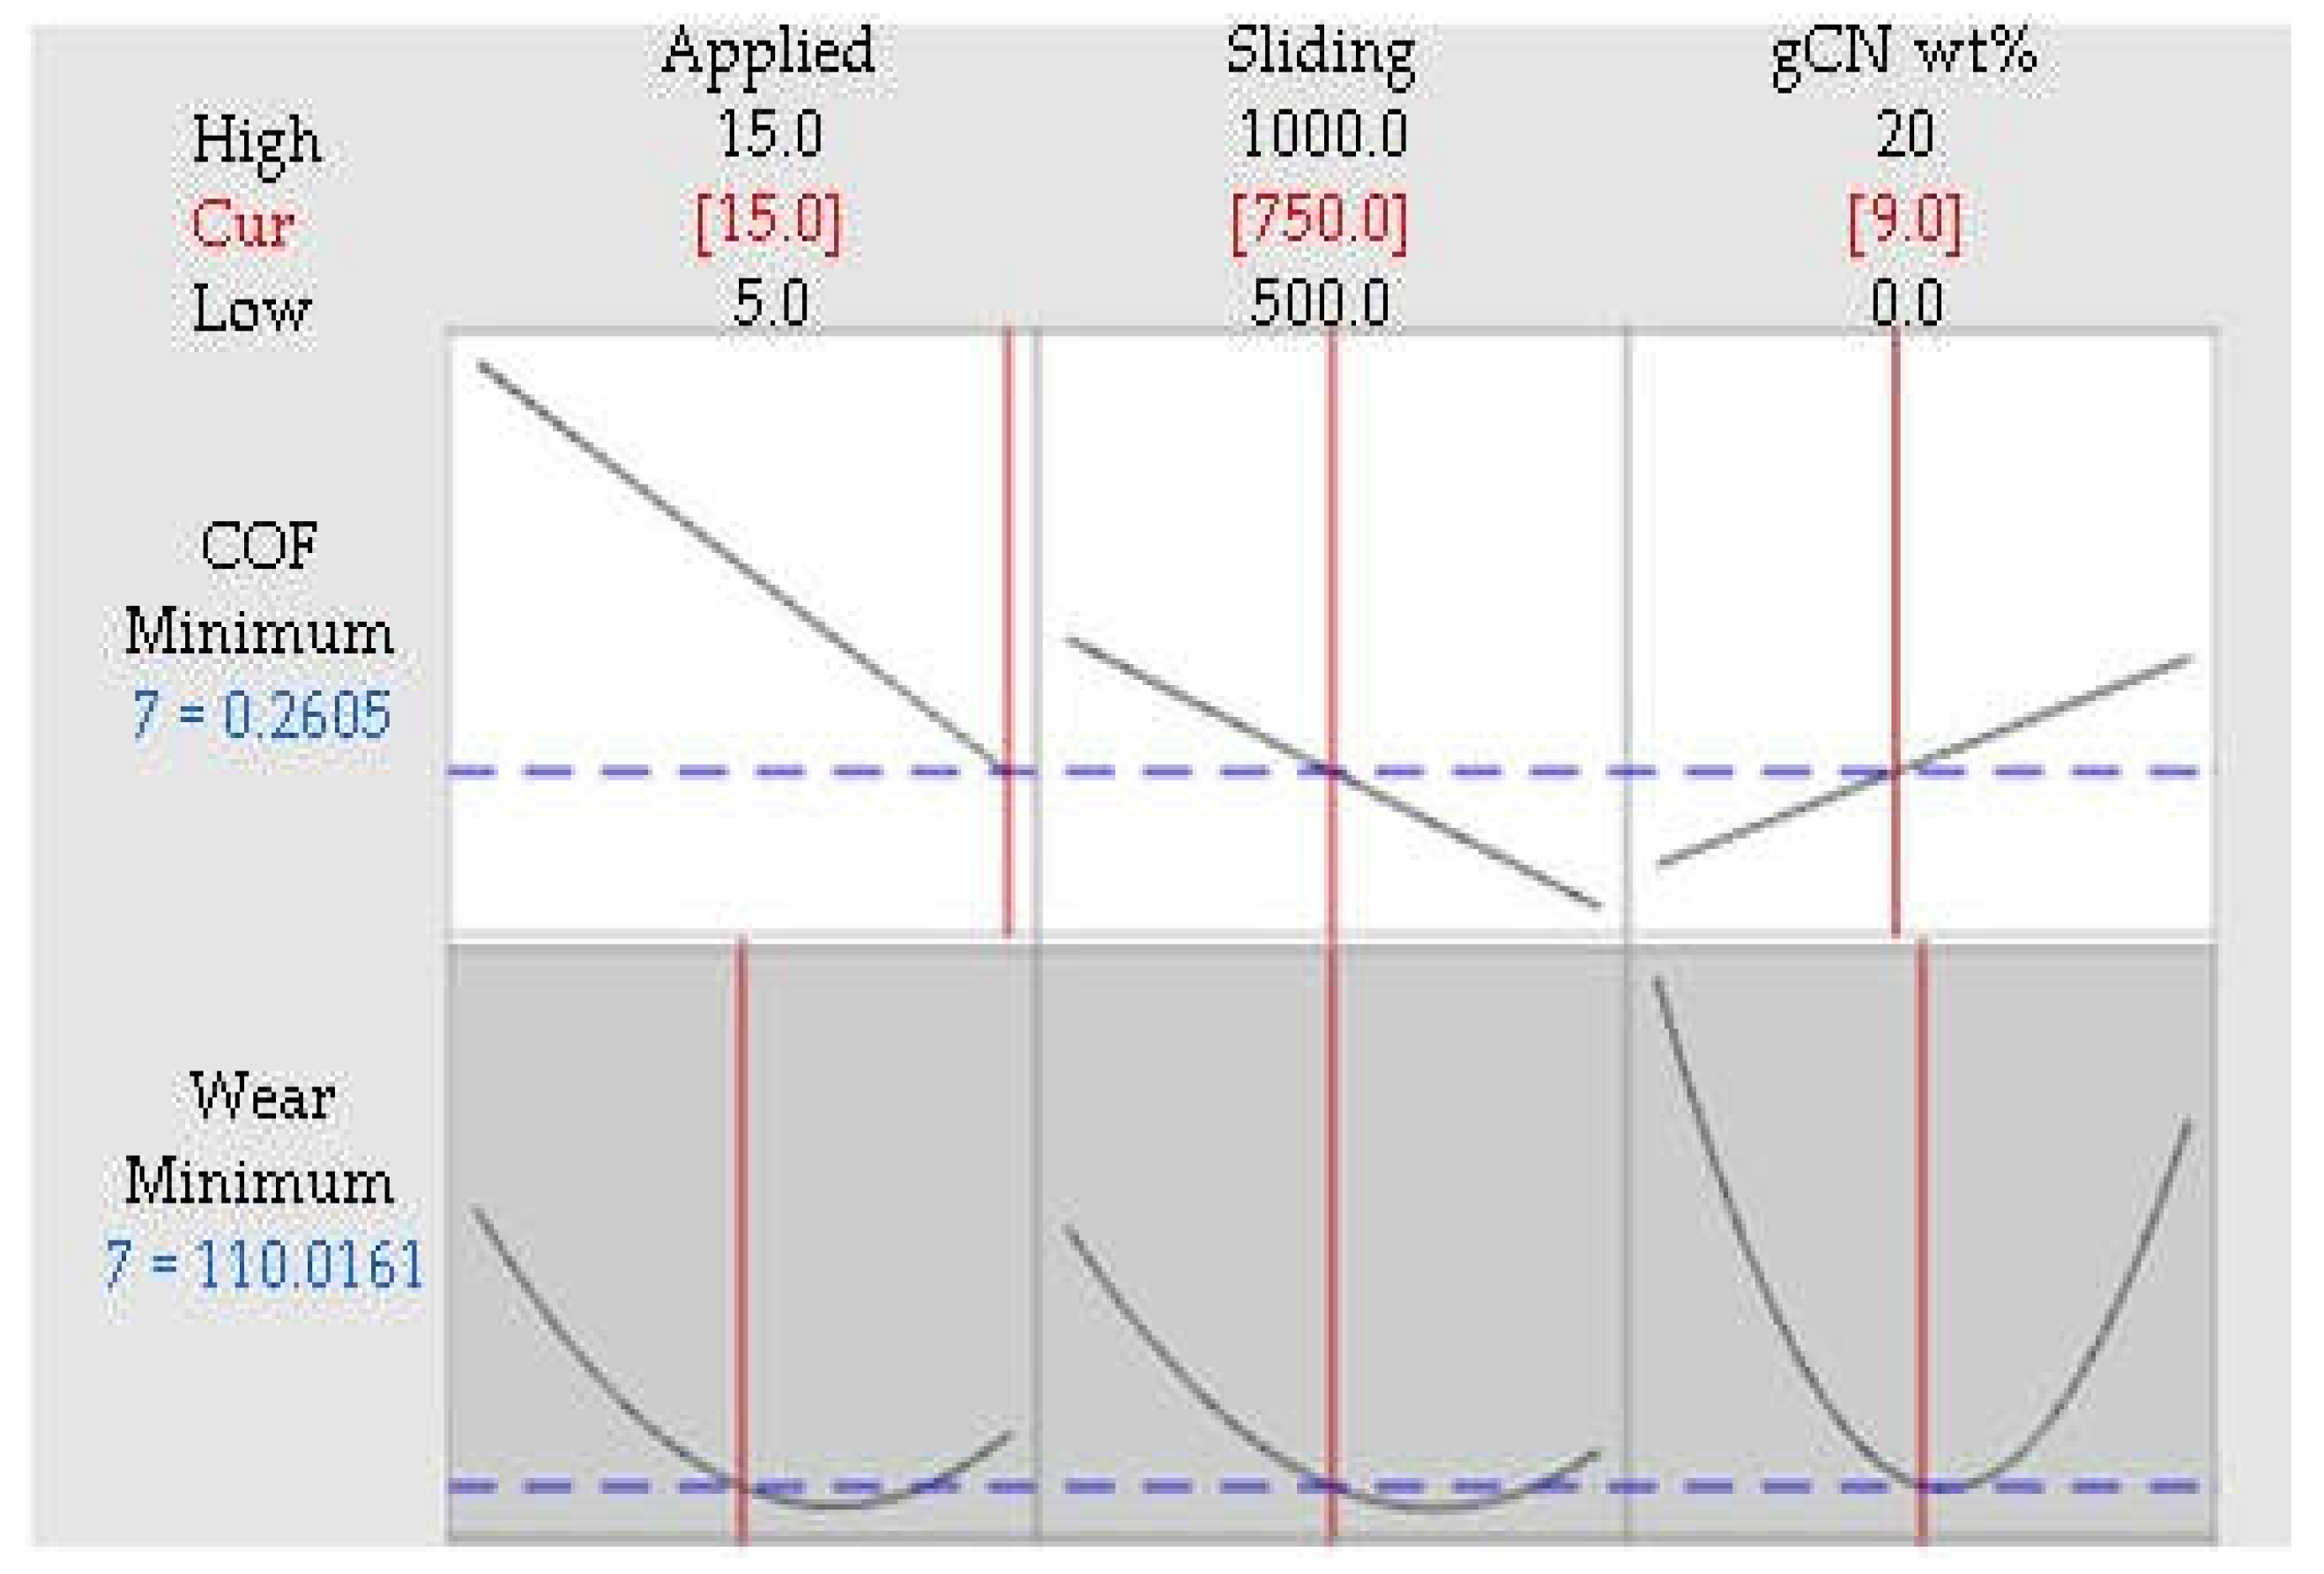
  • The coefficient of friction and wear depth for any alternative values of the parameters being evaluated can be predicted using the optimization plot that was created using RSM.
  • According to the ANOVA table, applied load had significant effects on coefficient of friction, followed by sliding speed and material composition, whereas wear was significantly influenced by material composition, then by applied load and sliding speed. Other parameters demonstrate the impact of their interactions. As a result, changing one parameter changes how another parameter responds.
  • According to the optimal condition and response table, the loading of 15 N, speed of 0.75 m/s, and the weight percentage of 9 were found to be the values that caused the least amount of wear loss in the present investigation.
  • Attributed to the reason that molybdenum disulfide can quickly oxidize at high temperatures between the pin and disc surfaces while used in pure form, and MoS2 predominates when the wt.% of graphitic carbon nitride in the composite increases, the reduction in depth of wear and frictional coefficient were higher in the case of g-C3N4 at a wt.% of 9 in nanocomposite.
  • The applied load had the largest impact on the frictional coefficient and wear depth, that is 59.6% and 41.4%, respectively, followed by sliding speed.
  • In comparison to pure MoS2 (wt.% 0 of g-C3N4) with weight percentages 9 and 20 of graphitic carbon nitride in the synthesized nanocomposite, the wt.% 9 of graphitic carbon nitride exhibits the least wear owing to its composition itself. The superior coating material for reduced friction and wear was determined to be the graphitic carbon nitride (wt.% 9) in the synthesized nanocomposite with MoS2.
  • Results from the Taguchi method and response surface methodology were in good agreement with experimentation findings, which confirms its industrial application for predicting the output responses which save more time and effort. A confirmatory test can also be performed if the input parameter combinations were different than the available inputs.
  • Availability of the variety in process parameters (input data) and the experimental results (responses) makes the methodology limited, as without the previous results one cannot apply any prediction method.
  • In future work, this g-C3N4/MoS2 nanocomposite shall be tested for higher loads and sliding speeds.

Author Contributions

M.S.—Conceptualization, Writing; A.K.S. (Anuj Kumar Sharma)—Review and editing; A.K.S. (Ashish Kumar Srivastava)—methodology, validation, N.S.—Review and editing; A.R.D.—supervison; All authors have read and agreed to the published version of the manuscript.

Funding

This research received no external funding.

Institutional Review Board Statement

Not applicable.

Informed Consent Statement

Not applicable.

Data Availability Statement

Not applicable.

Conflicts of Interest

The authors declare no conflict of interest.

References

  1. Tung, S.C.; McMillan, M.L. Automotive tribology overview of current advances and challenges for the future. Tribol. Int. 2004, 37, 517–536. [Google Scholar] [CrossRef]
  2. Holmberg, K.; Andersson, P.; Erdemir, A. Global energy consumption due to friction in passenger cars. Tribol. Int. 2012, 47, 221–234. [Google Scholar] [CrossRef]
  3. Srivastava, A.K.; Dwivedi, S.; Saxena, A.; Kumar, D.; Dixit, A.R.; Singh, G.K.; Bhutto, J.K.; Verma, R. Tribological Characteristics of Al359/Si3N4/Eggshell Surface Composite Produced by Friction Stir Processing. Coatings 2022, 12, 1362. [Google Scholar] [CrossRef]
  4. Wu, Y.Y.; Tsui, W.C.; Liu, T.C. Experimental analysis of tribological properties of lubricating oils with nanoparticle additives. Wear 2007, 262, 819–825. [Google Scholar] [CrossRef]
  5. Srivastava, A.K.; Sharma, B.; Saju, B.R.; Shukla, A.; Saxena, A.; Maurya, N.K. Effect of Graphene nanoparticles on microstructural and mechanical properties of aluminum based nanocomposites fabricated by stir casting. World J. Eng. 2020, 17, 859–866. [Google Scholar] [CrossRef]
  6. Berman, D.; Erdemir, A.; Sumant, A.V. Graphene: A new emerging lubricant. Mater. Today 2014, 17, 31–42. [Google Scholar] [CrossRef]
  7. Dallavalle, M.; Sändig, N.; Zerbetto, F. Stability, dynamics, and lubrication of MoS2 platelets and nanotubes. Langmuir 2012, 28, 7393–7400. [Google Scholar] [CrossRef] [PubMed]
  8. Cizaire, L.; Vacher, B.; Le Mogne, T.; Martin, J.; Rapoport, L.; Margolin, A.; Tenne, R. Mechanisms of ultra-low friction by hollow inorganic fullerene-like MoS2 nanoparticles. Surf. Coat. Technol. 2002, 160, 282–287. [Google Scholar] [CrossRef]
  9. Curry, J.F.; Wilson, M.A.; Luftman, H.S.; Strandwitz, N.C.; Argibay, N.; Chandross, M.; Sidebottom, M.A.; Krick, B.A. Impact of microstructure on MoS2 oxidation and friction. ACS Appl. Mater. Interfaces 2017, 9, 28019–28026. [Google Scholar] [CrossRef]
  10. Donnet, C.; Martin, J.; Le Mogne, T.; Belin, M. Super-low friction of MoS2 coatings in various environments. Tribol. Int. 1996, 29, 123–128. [Google Scholar] [CrossRef]
  11. Li, H.; Wang, J.; Gao, S.; Chen, Q.; Peng, L.; Liu, K.; Wei, X. Superlubricity between MoS2 monolayers. Adv. Mater. 2017, 29, 1701474. [Google Scholar] [CrossRef]
  12. Ilie, F.; Cristescu, A.-C. A Study on the Tribological Behavior of Molybdenum Disulfide Particles as Additives. Coatings 2022, 12, 1244. [Google Scholar] [CrossRef]
  13. Ilie, F. Energy Dissipation during Adhesion and Friction at the Atomic Scale of MoS2 Nanoparticles on the Surface of MoS2. J. Adv. Microsc. Res. 2013, 8, 270–275. [Google Scholar] [CrossRef]
  14. Zhang, Y.; Jin, Z.; Su, Y.; Wang, G. Charge separation and electron transfer routes modulated with Co-Mo-P over g-C3N4 photocatalyst. Mol. Catal. 2019, 462, 46–55. [Google Scholar] [CrossRef]
  15. Xu, Z.D.; Xin, J.B.; Fan, R.X.; Wang, K.; Yang, J. A simple approach to fabricate CN/MoS2 nanocomposite and its application as a lubricant additive. Dig. J. Nanomater. Biostruct. 2018, 13, 731–741. [Google Scholar]
  16. Ajay, K.; Thakre, G.D.; Arya, P.K.; Jain, A.K. 2D Structured Nano-Sheets of Octadecylamine Grafted Graphitic-Carbon Nitride (g-C3N4) as Lubricant Additives. Macromol. Symp. 2017, 376, 1700009. [Google Scholar]
  17. Duan, C.; Yuan, D.; Yang, Z.; Li, S.; Tao, L.; Wang, Q.; Wang, T. High wear-resistant performance of thermosetting polyimide reinforced by graphitic carbon nitride (g-C3N4) under high temperature. Compos. Part A Appl. Sci. Manuf. 2018, 113, 200–208. [Google Scholar] [CrossRef]
  18. Zhu, L.; Wang, Y.; Hu, F.; Song, H. Structural and friction characteristics of g-C3N4/PVDF composites. Appl. Surf. Sci. 2015, 345, 349–354. [Google Scholar] [CrossRef]
  19. Gupta, D.; Bhovi, P.M.; Sharma, A.K.; Dutta, S. Development and characterization of microwave composite cladding. J. Manuf. Process. 2012, 14, 243–249. [Google Scholar] [CrossRef]
  20. Sharma, A.; Aravindhan, S.; Krishnamurthy, R. Microwave glazing of alumina–titania ceramic composite coatings. Mater. Lett. 2001, 50, 295–301. [Google Scholar] [CrossRef]
  21. Leonelli, C.; Veronesi, P.; Denti, L.; Gatto, A.; Iuliano, L. Microwave assisted sintering of green metal parts. J. Mater. Process. Technol. 2008, 205, 489–496. [Google Scholar] [CrossRef]
  22. Gupta, D.; Sharma, A.K. Microwave cladding: A new approach in surface engineering. J. Manuf. Process. 2014, 16, 176–182. [Google Scholar] [CrossRef]
  23. Somani, N.; Kumar, K.; Gupta, N. Review on microwave cladding: A new approach. In Advances in Materials Processing; Springer: Singapore, 2020; pp. 77–90. [Google Scholar]
  24. Kumar, N.; Singh, R.K.; Srivastava, A.K.; Nag, A.; Petru, J.; Hloch, S. Surface Modification and Parametric Optimization of Tensile Strength of Al6082/SiC/Waste Material Surface Composite Produced by Friction Stir Processing. Coatings 2022, 12, 1909. [Google Scholar] [CrossRef]
  25. Taguchi, G.; Phadke, M.S. Quality engineering through design optimization. In Quality Control, Robust Design, and the Taguchi Method; Springer: Boston, MA, USA, 1989; pp. 77–96. [Google Scholar]
  26. Montgomery, D.C.; Woodall, W.H. A discussion on statistically-based process monitoring and control. J. Qual. Technol. 1997, 29, 121. [Google Scholar] [CrossRef]
  27. Joshua, J.J.; Andrews, A.A.E. Design of experiments to optimize casting process of aluminum alloy 7075 in addition of TiO2 using Taguchi method. Mater. Today Proc. 2020, 33, 3353–3358. [Google Scholar] [CrossRef]
  28. Chiang, K.-T.; Liu, N.-M.; Tsai, T.-C. Modeling and analysis of the effects of processing parameters on the performance characteristics in the high pressure die casting process of Al–SI alloys. Int. J. Adv. Manuf. Technol. 2009, 41, 1076–1084. [Google Scholar] [CrossRef]
  29. Liati, A.; Schreiber, D.; Lugovyy, D.; Gramstat, S.; Eggenschwiler, P.D. Airborne particulate matter emissions from vehicle brakes in micro-and nano-scales: Morphology and chemistry by electron microscopy. Atmos. Environ. 2019, 212, 281–289. [Google Scholar] [CrossRef]
  30. Kumar, S.; Ghosh, S.K. Statistical and computational analysis of an environment-friendly MWCNT/NiSO4 composite materials. J. Manuf. Process. 2021, 66, 11–26. [Google Scholar] [CrossRef]
  31. Dwivedi, R.; Singh, R.K.; Kumar, S.; Srivastava, A.K. Parametric optimization of process parameters during the friction stir processing of Al7075/SiC/waste eggshell surface composite. Mater. Today Proc. 2021, 47 Pt 13, 3884–3890. [Google Scholar] [CrossRef]
  32. Veličković, S.; Stojanović, B.; Babić, M.; Bobic, I. Optimization of tribological properties of aluminum hybrid composites using Taguchi design. J. Compos. Mater. 2017, 51, 2505–2515. [Google Scholar] [CrossRef]
  33. Pattanaik, A.; Satpathy, M.P.; Mishra, S.C. Dry sliding wear behavior of epoxy fly ash composite with Taguchi optimization. Eng. Sci. Technol. Int. J. 2016, 19, 710–716. [Google Scholar] [CrossRef] [Green Version]
  34. Li, G.; Hao, S.; Gao, W.; Lu, Z. The Effect of Applied Load and Rotation Speed on Wear Characteristics of Al-Cu-Li Alloy. J. Mater. Eng. Perform. 2022, 31, 5875–5885. [Google Scholar] [CrossRef]
  35. Saxena, M.; Sharma, A.K.; Srivastava, A.K.; Singh, R.K.; Dixit, A.R.; Nag, A.; Hloch, S. Microwave-Assisted Synthesis, Characterization and Tribological Properties of a g-C3N4/MoS2 Nanocomposite for Low Friction Coatings. Coatings 2022, 12, 1840. [Google Scholar] [CrossRef]
  36. Mustapha, A.N.; Zhang, Y.; Zhang, Z.; Ding, Y.; Yuan, Q.; Li, Y. Taguchi and ANOVA analysis for the optimization of the microencapsulation of a volatile phase change material. J. Mater. Res. Technol. 2021, 11, 667–680. [Google Scholar] [CrossRef]
  37. Reddy, V.V.; Mandava, R.K.; Rao, V.R.; Mandava, S. Optimization of dry sliding wear parameters of Al 7075 MMC’s using Taguchi method. Mater. Today Proc. 2022, 62, 6684–6688. [Google Scholar] [CrossRef]
  38. Taguchi, G.; Rafanelli, A.J. Taguchi on robust technology development: Bringing quality engineering upstream. J. Electron. Packag. 1994, 116, 161. [Google Scholar] [CrossRef]
Figure 1. The experimental setup for tribological investigation.
Coatings 13 00118 g001
Figure 2. Coating thickness measurement from scanning electron microscopy.
Coatings 13 00118 g002
Figure 3. Normal probability plot of residuals when response is SN ratio (a) COF and (b) wear depth.
Coatings 13 00118 g003
Figure 4. The main effect plots for SN ratios (a) COF and (b) wear depth at different parameters, such as applied load, sliding speed, and g-C3N4 weight percentage in nanocomposite.
Coatings 13 00118 g004
Figure 5. Interaction effect of load, sliding distance, and sliding speed on the wear rate of friction material at different operating conditions (a) COF and (b) wear depth.
Coatings 13 00118 g005
Figure 6. Contour plot for wear depth and coefficient of friction for (a,d) applied load vs. sliding speed; (b,e) applied load vs. weight percent of g-C3N4 in composite; (c,f) applied load vs. weight percent of g-C3N4 in composite.
Coatings 13 00118 g006
Figure 7. Response surface for wear depth and coefficient of friction for (a,d) applied load vs. sliding speed; (b,e) applied load vs. weight percent of g-C3N4 in composite; (c,f) applied load vs. weight percent of g-C3N4 in composite.
Coatings 13 00118 g007
Figure 8. Plot for optimization for wear COF and wear.
Coatings 13 00118 g008
Figure 9. FESEM images of worn disc surface for (a,b) pure MoS2 disc and (c,d) g-C3N4/MoS2 (9 wt.%) nanocomposite coated disc.
Coatings 13 00118 g009
Figure 10. EDX elemental mapping of MoS2-coated disc after wear test at 15 N applied load and 0.75 m/s sliding speed.
Coatings 13 00118 g010
Figure 11. EDX elemental mapping of g-C3N4/MoS2 (9 wt.%) nanocomposite coated disc after wear test at 15 N applied load and 0.75 m/s sliding speed.
Coatings 13 00118 g011
Figure 12. FESEM images of worn pin surface (a) of counterpart pin for g-C3N4/MoS2 (9 wt.%) nanocomposite-coated disc and (b) of counterpart pin for MoS2 coated disc.
Coatings 13 00118 g012
Figure 13. EDX elemental analysis of selected full area of pin surface used against g-C3N4/MoS2 (9 wt.%) nanocomposite coated disc tested at 0.75 m/s sliding speed and 15 N applied load.
Coatings 13 00118 g013
Table 1. Composition of disc and pin material [35].
DiscElementsCFeNiCuSiWPMoVCrMn
Weight %9.4354.90.120.712.559.720.149.065.737.10.53
PinElementsSPCMoCuSiMnNiCrFe
Weight %0.020.0270.0650.130.140.31.788.118.271.2
Table 2. Signal-to-noise (SN) ratios with the objectives and their meanings [36].
SN RatioObjectiveMeaning
10   log 1 n 1 y i 2 ‘Larger was better’Maximization of response
10   log μ σ 2 ‘Nominal was the best’Shifts to a target parameter
10   log 1 n y i 2 ‘Smaller was better’Minimization of response
Table 3. Control factors with respective levels for analyzing wear behavior of the coating material.
LevelFactors
Load Applied
(N)
Sliding Speed
(m/s)
Weight Percentage of gC3N4 in Nanocomposite (%)
1 50.50
2 100.759
3 151.020
Table 4. Design of experiment (DOE) with experimental results.
Factor-1Factor-2Factor-3Response-1Response-2
S.N.Applied Load
(N)
Sliding Speed
(m/s)
g-C3N4 wt.%
(%)
COFWear Depth
(micrometers)
150.500.994267.64
250.591.604243.85
350.5204.222315.67
450.7501.167336.72
550.7590.403262.86
650.75201.542413.73
751.000.403333.47
851.091.278255.67
951.0200.748450.20
10100.501.285333.79
11100.590.110349.34
12100.5202.890389.67
13100.7500.389112.41
14100.7590.228144.49
15100.75200.181105.20
16101.001.108425.73
17101.090.138100.10
18101.0200.597135.70
19150.500.380355.60
20150.590.222128.30
21150.5200.086479.12
22150.7500.190513.40
23150.7590.22698.2
24150.75200.384184.60
25151.000.624331.35
26151.090.145112.1
27151.0200.452123.30
Table 5. Response table for SN ratio for COF, wear depth, and the corresponding rank of process parameters.
For Coefficient of FrictionFor Wear Depth
LevelApplied Load Sliding Speedg-C3N4 wt.%Applied LoadSliding Speedg-C3N4 wt.%
11.37341.31030.7267320.0318.1334.5
20.76960.52330.4838232.9236.5178.9
30.30100.61031.2336249.0247.4288.6
Delta1.07240.78700.749887.081.6155.6
Rank123231
Combination157509157509
Mean0.25655692.4630 µm
Table 6. Analysis of variance (ANOVA) for signal-to-noise (SN) ratios.
For Coefficient of FrictionFor Wear Depth
SourceSum of SquaresDegree of FreedomMean of SquareF-Valuep-ValueSum of SquaresDegree of FreedomMean of SquareF-Valuep-Value
Applied Load707.822353.9125.600.030104.93252.474.990.039
Sliding Speed90.91245.4560.720.51682.79241.403.940.065
g-C3N4 wt.%249.912124.9531.980.201188.24294.128.950.009
Applied Load × Sliding Speed,192.26448.0640.760.579116.13429.032.760.103
Applied Load × g-C3N4 wt.%256.27464.0681.010.455150.87437.723.590.059
Sliding Speed × g-C3N4 wt.%23.2545.8120.090.98246.26411.561.100.419
Table 7. ANOVA analysis of pin-on-disc wear test on g-C3N4/MoS2-nanocomposite-coated steel substrate.
For Coefficient of FrictionFor Wear Depth
SourceSum of SquaresDegree of FreedomMean of SquareF-Valuep-ValueSum of SquaresDegree of FreedomMean of SquareF-Valuep-Value
Model8.68861.864703.260.0211,92,321631,5002.190.088
Linear8.68832.845614.970.01054,669318,2231.270.313
Applied Load5.175615.175629.050.00722,667122,6671.570.224
Sliding Speed2.205012.205003.850.06422,530122,5301.560.225
g-C3N4 wt.%1.156211.156212.020.1719472194720.660.427
Square2.499830.833281.460.256137,653345,8843.190.046
Applied Load × Applied Load0.027510.027470.050.82915,948115,9481.110.305
Sliding Speed × Sliding Speed1.145811.145812.000.17212,844112,8440.890.356
g-C3N4 wt.% (%) × g-C3N4 wt%1.326611.326562.320.143108,8601108,8607.560.012
Table 8. Calculated coefficient of friction and wear depth from different methods.
Coefficient of Friction
Parameters/MethodApplied Load,
(N)
Sliding Speed,
(m/s)
g-C3N4 wt.%
(%)
Output Response
Experimental [28]150.7590.226
Taguchi150.7590.256
RSM150.7590.2605
Wear Depth
Experimental [28]150.75998.2 µm
Taguchi150.75992.46 µm
RSM150.759110.01 µm
Disclaimer/Publisher’s Note: The statements, opinions and data contained in all publications are solely those of the individual author(s) and contributor(s) and not of MDPI and/or the editor(s). MDPI and/or the editor(s) disclaim responsibility for any injury to people or property resulting from any ideas, methods, instructions or products referred to in the content.

