Article

Effect of Mesogenic Phase and Structure of Liquid Crystals on Tribological Properties as Lubricant Additives

1
Laboratory for Advanced Lubricating Materials, Shanghai Advanced Research Institute, Chinese Academy of Sciences, Shanghai 201210, China
2
School of Environmental Science and Engineering, Liaoning University of Engineering and Technology, Fuxin 123032, China
3
Business School, Shanghai Jian Qiao University, Shanghai 201306, China
*
Authors to whom correspondence should be addressed.
Coatings 2023, 13(1), 168; https://doi.org/10.3390/coatings13010168
Submission received: 9 December 2022 / Revised: 9 January 2023 / Accepted: 10 January 2023 / Published: 12 January 2023

Abstract

:
To develop a high-performance additive that can meet different operating conditions, three liquid crystals (LCs) were developed as additives for a base oil. The structures and thermal stabilities of the obtained LCs were characterized by nuclear magnetic resonance (NMR), Fourier transform infrared (FT-IR) spectroscopy, mass spectroscopy (MS), and thermogravimetric analysis (TGA). The effects of mesogenic-phase temperature ranges on tribological properties were analyzed using differential scanning calorimetry (DSC) and polarized optical microscopy (POM). UMT-TriboLab friction and wear tester was used to study the friction-reducing properties of LCs. The width of wear marks was observed by a Contour GT-K 3D profiler to illustrate the anti-wear performance of LCs. The friction surface was characterized by scanning electron microscopy (SEM) and Raman spectroscopy. It was demonstrated that, in comparison with the base oil, the addition of LCs caused a remarkable reduction in the coefficient of friction (21.57%) and wear width (31.82%). In addition, LCs show better tribological abilities in the mesogenic-phase temperature ranges. According to the results, we demonstrated that LCs can be used as lubricant additives, especially for several operating conditions under specific temperatures.

1. Introduction

With the increased mechanization of modern society, energy loss caused by friction and wear has been constantly increased [1,2,3]. Friction can be greatly reduced by using lubricants, thus lowering the energy waste [4,5,6]. Lubricants can form a stabilized film of lubrication on the surface of the mechanical part and prevent direct contact with the micro-convexity of the metal surface [7]. Additives, which can tune the tribological behavior of the oil-based lubricant, are a type of important materials that help develop different lubricants for different working scenarios [8,9]. Therefore, there is a need to explore high-performance lubricant additives for meeting the growing lubrication requirements resulting from the development of mechanical society.
Liquid crystals (LCs) are special materials with rheological properties, having the fluidity of a liquid-crystal (LC) and the anisotropy of a single crystal, which can be a long-range ordered arrangement at the molecular level [10,11,12]. Moreover, due to the low viscosities of LCs, they can effectively fill the contact surface during the sliding process, resulting in reduced friction [13]. Because of these properties, LCs are considered new tribological materials with applications in the field of lubrication. LCs are characterized by excellent heat resistance and chemical stability, as well as an orderly transformation of molecular orientation and arrangement order when stimulated by an external electric or magnetic field or temperature [14]. Due to LCs’ controllable nature, they can serve as potential materials for tribological properties in a specific temperature range. Existing research reported that the use of LCs can significantly improve the tribological properties of a base oil when used as lubricant additives. Yang’s team [15] reported that 1,3-diketone EPND (1-(4-ethyl phenyl) nonane-1,3-dione), a nematic LC lubricant additive with excellent tribological properties, is particularly suitable for the severe operating conditions of low load and friction. Additionally, Mokshin [16] reported that cholesteryl stearate and fatty acid cholesterol esters LCs were used as lubricant additives. The tribological properties of LCs were evaluated, and the addition of LCs was found to significantly reduce the coefficient of friction (COF). Ghosh and colleagues [17] blended three different series of LCs with polydecyl acrylate as lubricant additives. The study indicated that the addition of very small amounts of LCs could significantly improve the additive properties of polydecyl acrylate. Among the various types of LCs, cyanobiphenyl-type LCs were focused on due to their ability to form ordered molecular films on the friction surface [18].
The rigid structure in the molecule of a cyanobiphenyl-type LC provides orderliness, and the alkyl chains in the molecule offer the mobility of mesocrystals [19]. Related experiments have demonstrated that cyanobiphenyl-type LCs subjected to an applied electric field can increase their viscosity in the direction perpendicular to the wear surface, which facilitates the formation of a boundary lubrication state [18]. In addition to the electric field, the tribological properties of LCs have been affected by their structure. Polar molecules such as benzene rings, ester groups with longer alkyl chains, or ether groups in the structure usually exhibit better tribological properties, and the addition of flexible groups also improves the solubility of the compounds in base oil [20,21]. Additionally, the fluorinated substituent can be placed in a terminal position and within a terminal chain in the LC structure, and the addition of a fluorinated substituent can cause a remarkably steric effect by improving the melting point and mesogenic-phase temperature ranges [22]. On this basis, we designed and synthesized cyanobiphenyl-type LCs to evaluate their effects on tribological properties.
In this research, the objective was to investigate the effect of the structure of cyanobiphenyl-type LC molecules and mesogenic-phase temperature ranges on their tribological properties. Three cyanobiphenyl-type LCs were designed and synthesized. The structures of the LCs were verified with Fourier transform infrared (FT-IR) spectroscopy, nuclear magnetic resonance (NMR) spectra, and mass spectroscopy (MS). The thermal stability was analyzed using a thermogravimetric analyzer (TGA). The characteristics of LCs were obtained using differential scanning calorimetry (DSC) and polarized optical microscopy (POM) to investigate the influence of the mesogenic-phase temperature range on the tribological properties. The influence of the structures and mesogenic-phase temperature ranges of LCs were evaluated on their tribological properties and the related lubrication mechanism was analyzed. This work provides a novel idea for developing new LC friction materials.

2. Experimental

2.1. Chemicals

Ethyl 6-bromohexanoate, 4′-hydroxy-4-biphenylcarbonitrile, 4′-hydroxy-4-biphenylcarboxylic acid, ethanol, dichloromethane (DCM), N, N-dimethylformamide (DMF), 4-Dimethylaminopyridine (DMAP), (S)-2-Octanol, hydrogen peroxide, potassium sulfate, magnesium Sulfate, ethyl acetate (EA), petroleum ether (PE) triethylamine (TEA), tetrahydrofuran (THF), and 1-(3-Dimethylaminopropyl)-3-ethylcarbodiimide Hydrochloride (EDCI) were obtained from Titan Scientific Co., Ltd., Shanghai, China. The 4-(Trifluoromethyl) phenol, methyl chloroformate, triphenyl phosphite, sodium hydroxide, potassium carbonate, ammonia water, and potassium iodide (KI), were purchased from Sinopharm Chemical Reagent Co., Ltd., Shanghai, China. The 4-(2-Methoxyethyl) phenol was purchased from Shanghai Aladdin Bio-Chem Technology Co., Ltd., Shanghai, China. Zinc dialkyl dithiophosphates (ZDDP) were obtained from Huihua Chemical Co., Ltd., Dongguan, China. The base oil used in the experiment was palmester 3970 (TTO) from Taiko Palm-Oleo Co. Ltd., Shanghai, China. All the above reagents can be used directly without further purification treatment.

2.2. Measurements

FT-IR was achieved using a Paragon 1000 (PerkinElmer, Waltham, MA, USA) with a measurement range from 4000 to 1000 cm−1. Bruker Avance III HD (400 MHz) spectrometer (Bruker, Billerica, MA, USA) for the analysis of 1H and 13C NMR spectrometer. Mass spectroscopy analysis was characterized using a MALDI TOF 7090 mass spectrometer (Bruker, Billerica, MA, USA). The SDT-Q600 Simultaneous TGA/DSC (TA instrument, New Castle, DE, USA) was used to characterize the thermal properties in a nitrogen atmosphere. The temperature was increased from 30 °C to 800 °C at a speed of 10 °C/min. The mesogenic-phase temperature range of the LCs was achieved with a TA DSC 25 (TA instrument, New Castle, DE, USA), and the textures were obtained with a XP-330C POM (Shanghai Caikon, Shanghai, China). The width of the wear marks on the steel plates surface after the test were measured with a Contour GT-K 3D profiler (Bruker, Billerica, MA, USA). The analysis of deposits on the wear surface following experimentation was performed using a LabRAM HR800 Raman spectrometer (Horiba Jobin Yvon, Pairs, France). The scanning electron microscope (SEM) was obtained from SU8010 (Hitachi, Tokyo, Japan).

2.3. Synthesis of ethyl 6-(4-cyanobiphenyl-4-yloxy) Hexanoate (Intermediate 1)

Anhydrous potassium carbonate (15 g, 108.5 mmol) was powdered and dissolved in 50 mL DMF. It was then poured into glassware and stirred under nitrogen protection to 50 °C. KI was added and stirred at 50 °C for 48 h. Next, 4-hydroxy-4-biphenylcarbonitrile (20 g, 102.5 mmol), ethyl 6-bromohexanoate (27.3 g, 123 mmol), and KI (0.5 g, 3 mmol) were added and stirred at 50 °C with 48 h. At the end of the reaction, the DMF was removed by spinning. The resultant residue was washed three times with water and finally recrystallized using 100 mL of ethanol to obtain a white powder.

2.4. Synthesis of 6-(4-cyanobiphenyl-4-yloxy) Hexanoate Acid (Intermediate 2)

Intermediate 1 (31.9 g, 94.54 mmol) was dissolved in ethanol in glassware and stirred at room temperature. Sodium hydroxide (6 g, 150 mmol) was then added, stirred for 10 min, and raised to reflux. This reaction lasted for 6 h. After finishing, the pH was adjusted to 2–4, and a large number of solids were precipitated. After extraction, the result was washed with 500 mL of water and extracted again to achieve the crude product. A white powder was obtained by recrystallizing it with 200 mL of ethanol.

2.5. Synthesis of (R)-octan-2-yl 4’-((methoxycarbonyl) oxy-[1,1-biphenyl]-4-carboxylate (Intermediate 3)

4′-hydroxy-4-biphenylcarboxylic acid (30.4 g, 141 mmol) was dissolved in 250 mL of water in glassware and stirred under an ice bath. The aqueous sodium hydroxide solution was poured into a dropping funnel and slowly dripped into the glassware. Subsequently, 30 mL of methyl chloroformate was added on a dropwise basis over 30 min and stirred overnight at room temperature. This reaction was followed by filtration to obtain the residue, which was recrystallized with 500 mL of EA to give a white powder (4′-(methoxycarbonyl) biphenyl-4-carboxylic acid).
4′-(methoxycarbonyl) biphenyl-4-carboxylic acid (16.32 g, 63.75 mmol), (s)-2-octanol (7.1 g, 54.52 mmol), and triphenyl phosphite (21 g, 67.68 mmol) were added to 120 mL of THF and stirred at −10 °C under nitrogen. DIAD was dissolved in 60 mL of THF and slowly dropped into glassware. After 5 h, the reaction gradually rose to room temperature and lasted for 36 h. The product was dissolved with 250 mL of DCM, extracted using 200 mL of 15% hydrogen peroxide, 200 mL of potassium sulfate solution, and 200 mL of water, in turn. After drying with anhydrous magnesium sulfate and removing the solvent, the purified product ((R)-octyl-2-yl 4′-((methoxycarbonyl) oxy)-[1,1′-biphenyl]-4-carboxylic acid ester) was obtained using column chromatography.
(R)-octyl-2-yl 4′-((methoxycarbonyl) oxy)-[1,1′-biphenyl]-4-carboxylic acid ester was dissolved in ethanol in glassware. The reaction was monitored by thin-layer chromatography with the addition of 100 mL of ammonia water. After the reaction, the solvent was removed, and 200 mL water was added for extraction. The residue was then recrystallized using EA and PE. It was then placed in a refrigerator and filtered to obtain a white powder ((R)-octyl-2-yl 4′-((methoxycarbonyl)oxy)-[1,1′-biphenyl]-4-carboxylate, intermediate 3).

2.6. Synthesis of LCs

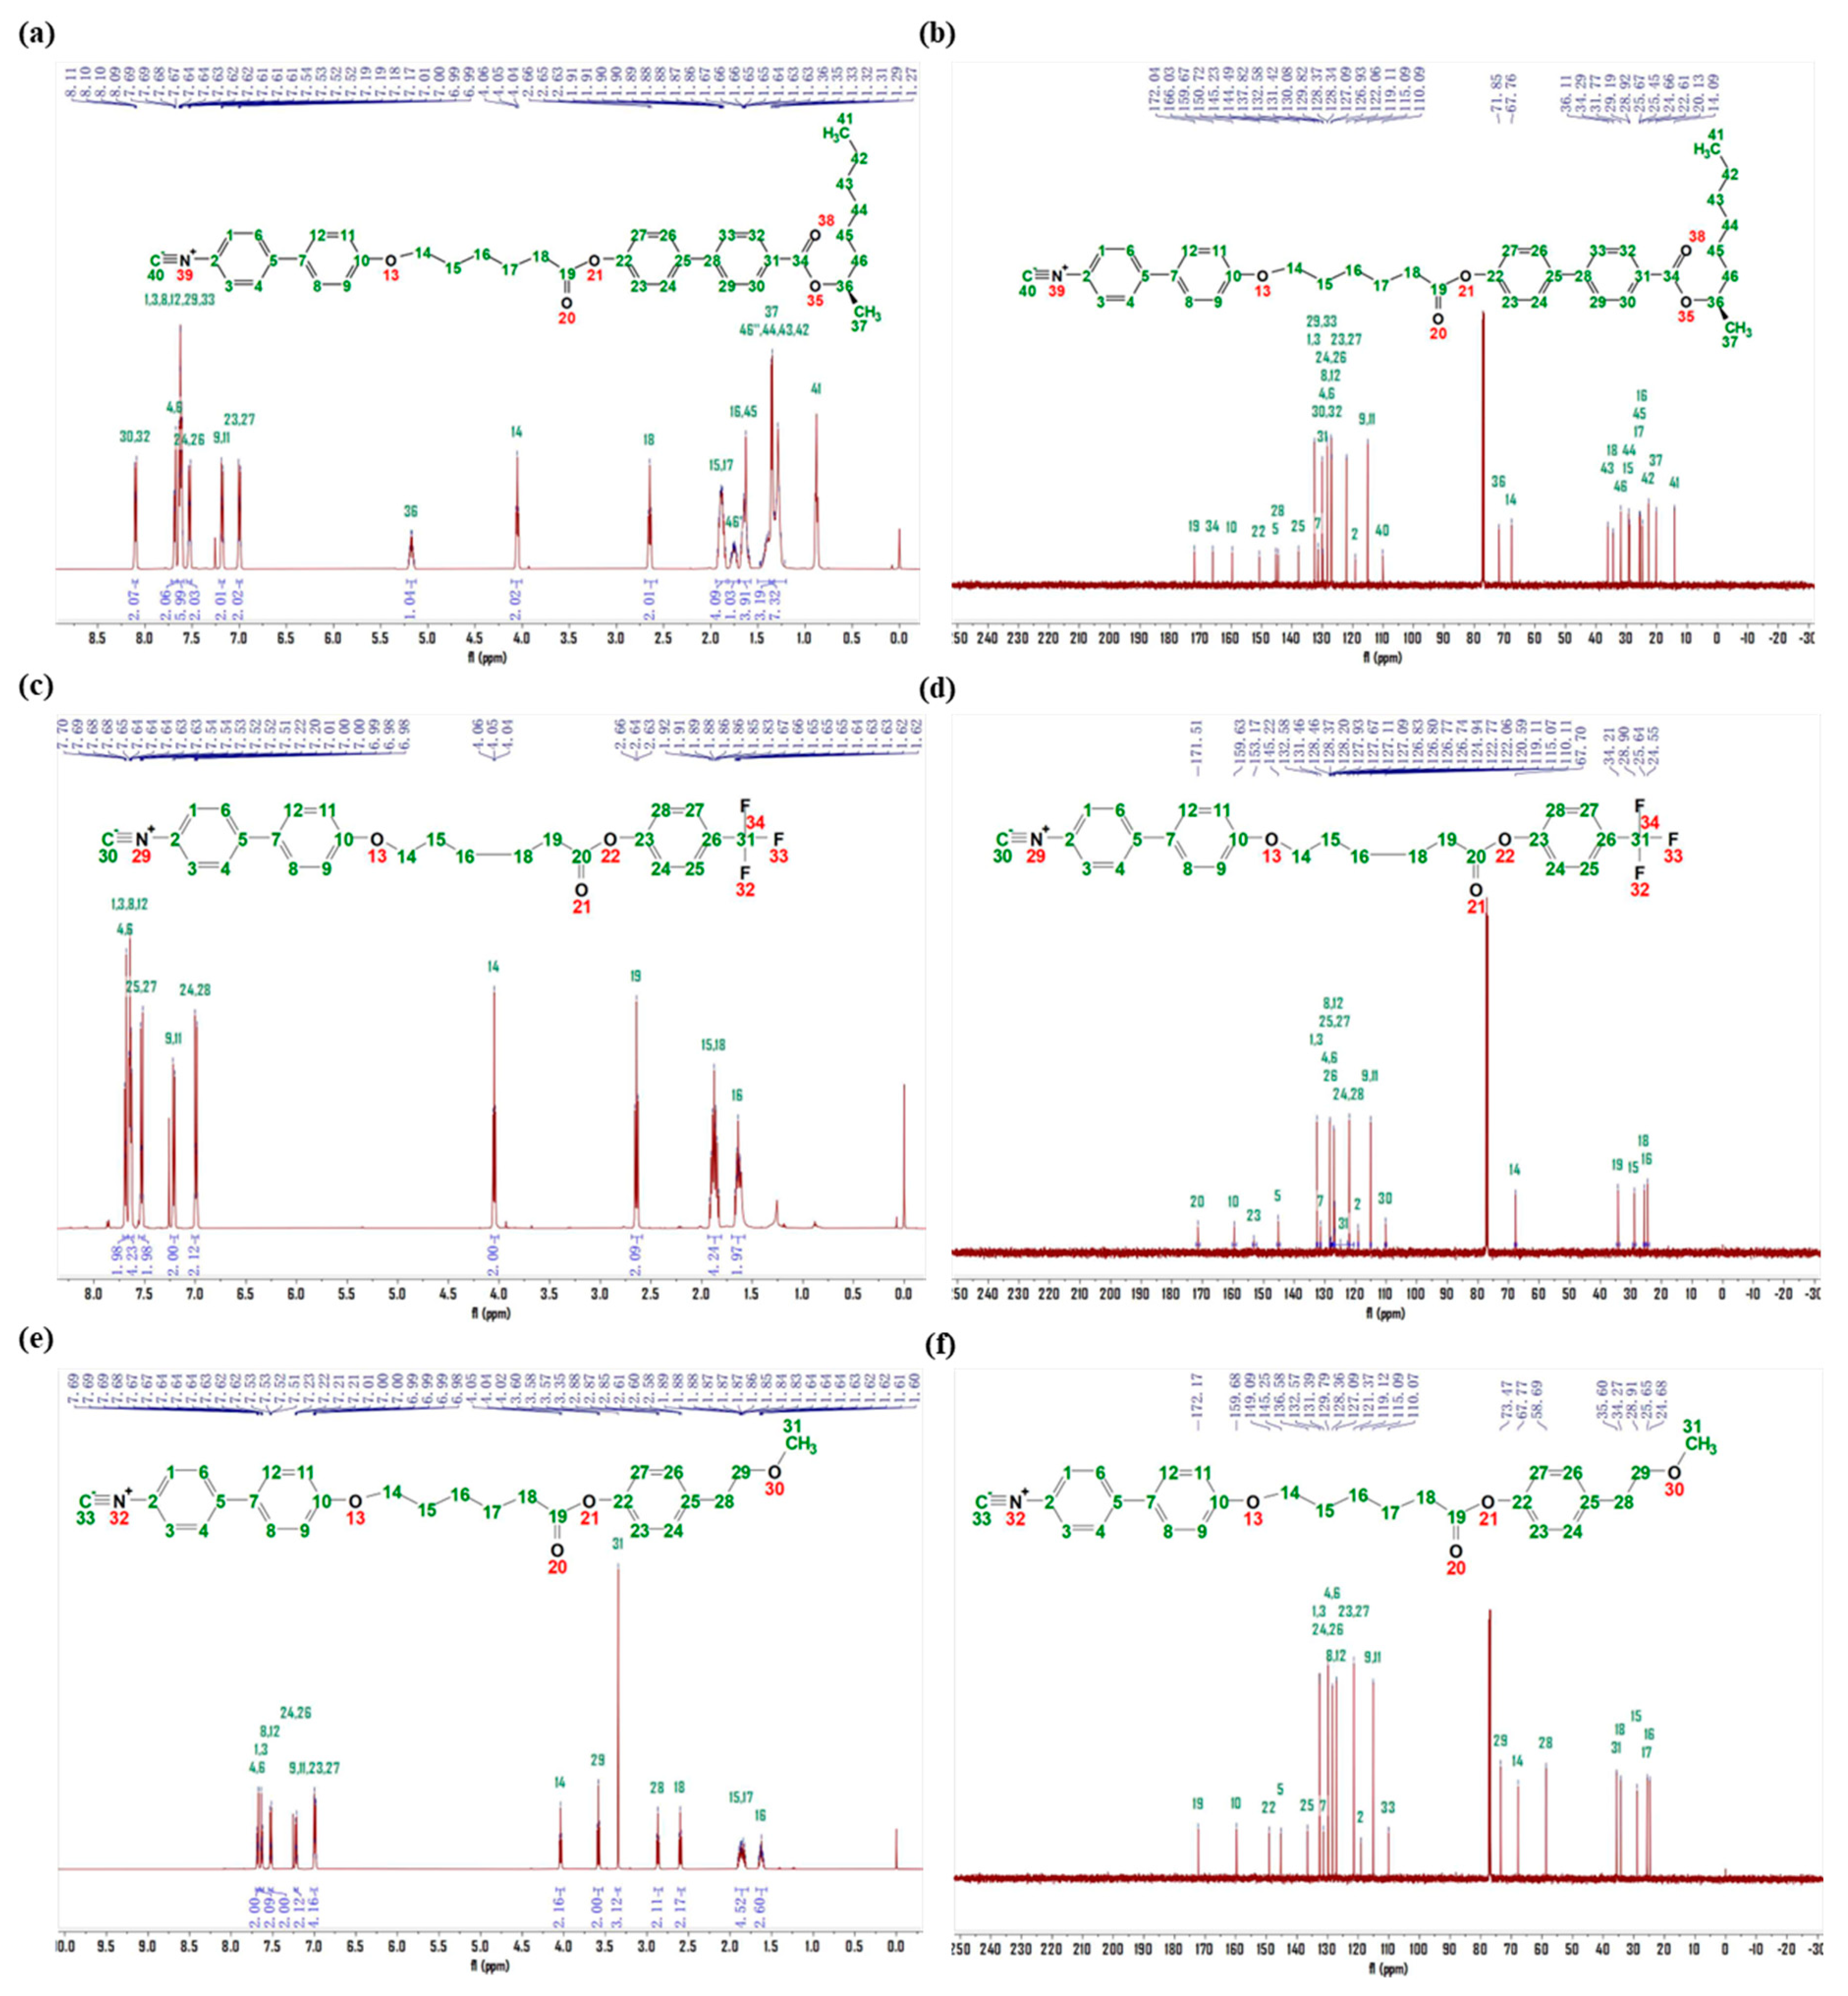
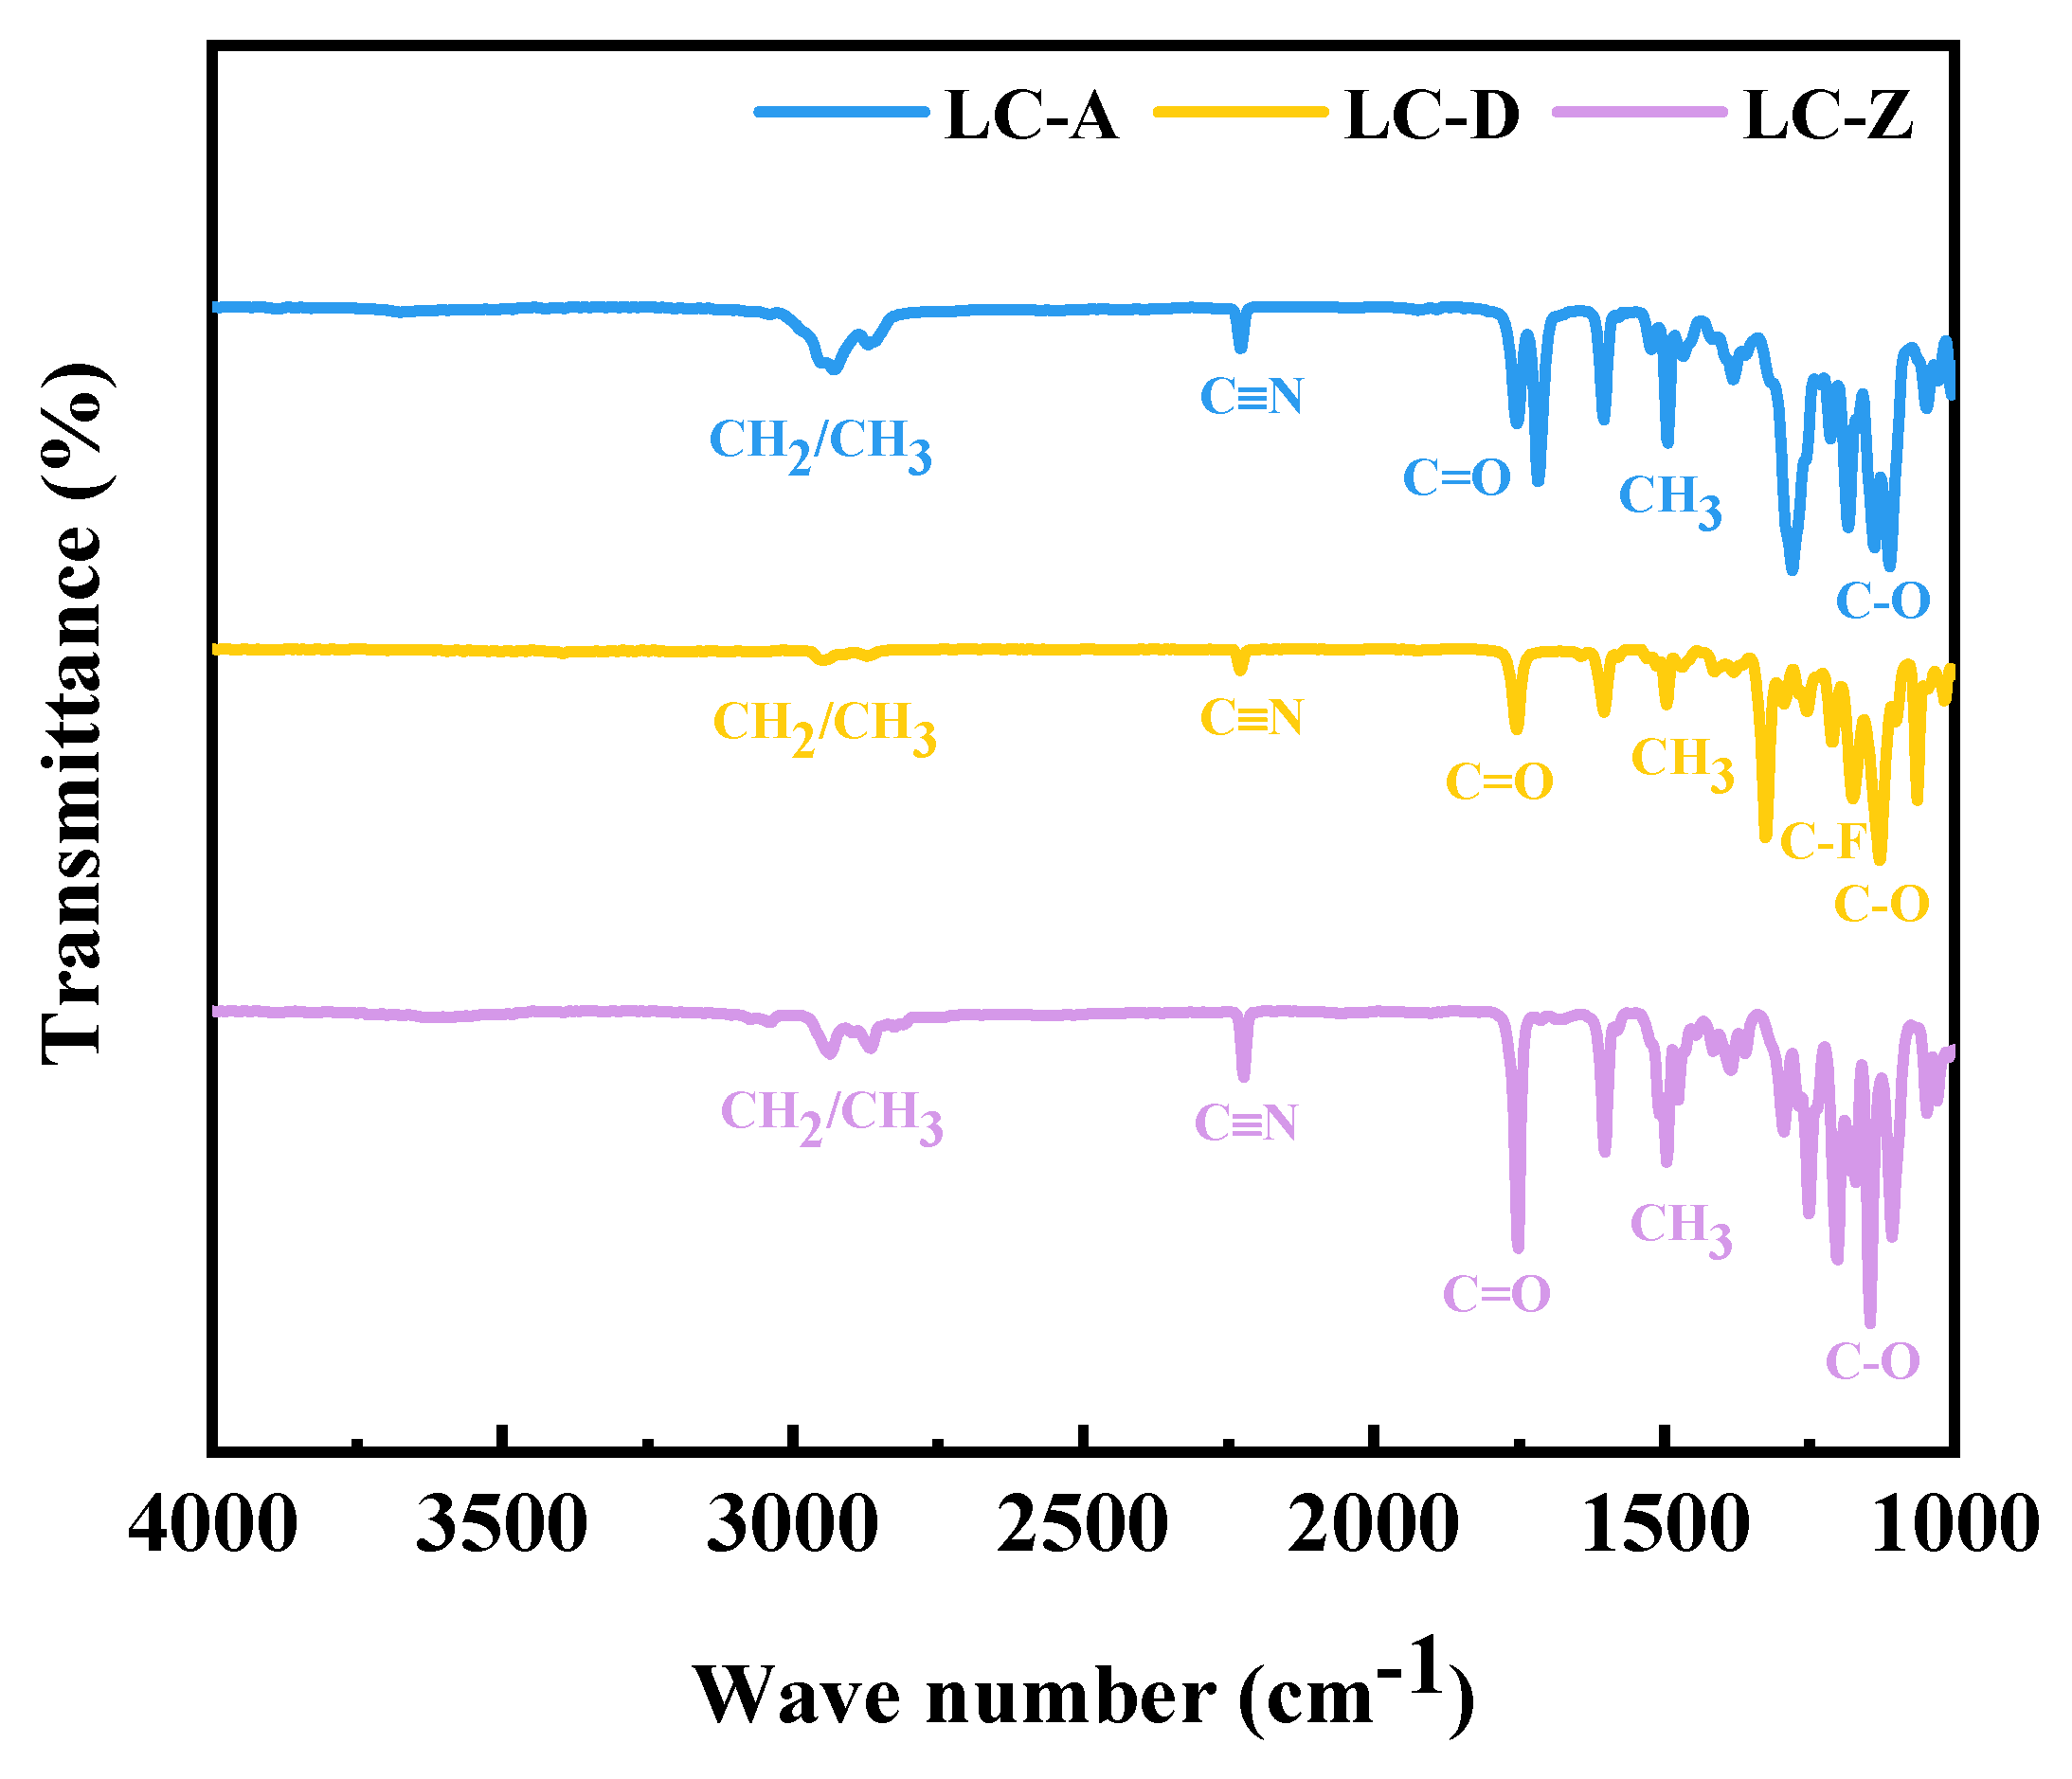
2.6.1. Synthesis of LC-A

Intermediate 2 (2.27 g, 7.35 mmol) and EDCI (2.38 g, 12.26 mmol) were added to 100 mL of DCM with stirring. The reaction solution was white and turbid. TEA was added dropwise and warmed up to 30 °C to improve solubility; it stopped heating to room temperature after dissolution. Intermediate 3 (2 g, 6.13 mmol) and DMAP (0.22 g, 1.84 mmol) were dissolved in 50 mL of DCM, heated, stirred until completely dissolved, and poured into a dropping funnel. The above solution was slowly dropped into glassware to maintain the reaction for 24 h. Next, 5 mL of water was added and stirred for 30 min, and 300 mL of water was added to adjust the pH to 2 after removing the solvent. Finally, the LC-A (3.28 g, 72.36%) was obtained by column chromatography. 1H NMR and 13C NMR spectra are shown in Figure 1a,b and FT-IR is shown in Figure 2. 1H NMR (CDCl3, 500 MHz) δ 8.13–8.08 (m, 2H, 30, 32), 7.68 (d, J = 8.4 Hz, 2H, 4, 6), 7.66–7.59 (m, 6H, 1, 3, 8, 12, 29, 33), 7.56–7.51 (m, 2H, 24, 26), 7.21–7.16 (m, 2H, 9, 11), 7.03–6.97 (m, 2H, 23, 27), 5.17 (h, J = 7.0, 6.3 Hz, 1H, 36), 4.05 (t, J = 6.3 Hz, 2H, 14), 2.65 (t, J = 7.4 Hz, 2H, 18), 1.95–1.83 (m, 4H, 15, 17), 1.81–1.71 (m, 1H, 46’), 1.70–1.58 (m, 4H, 16, 45), 1.35 (d, J = 6.3 Hz, 3H, 37), 1.50–1.20 (m, 7H, 46’’, 44, 43, 42). 13C NMR (CDCl3,125 MHz) δ 172.04 (19), 166.03 (34), 159.67 (10), 150.72 (22), 145.23 (5), 144.49 (28), 137.82 (25), 132.58 (1, 3), 131.42 (7), 130.08 (29, 33), 129.82 (31), 128.37 (4, 6), 128.34 (30, 32), 127.09 (8, 12), 126.93 (24, 26), 122.06 (23, 27), 119.11 (2), 115.09 (9, 11), 110.09 (40), 71.85 (36), 67.76 (14), 36.11 (43), 34.29 (18), 31.77 (46), 29.19 (15), 28.92 (44), 25.67 (17), 25.45 (45), 24.66 (16), 22.61 (42), 20.13 (37), 14.09 (41). MS(ESI): calcd C40H43NO5 [M + H]+ 618.31, found 618.32. FT-IR (ATR): 2928, 2866, 2226, 1754, 1718, 1604, 1496, 1380, 1282, 1181, and 1116 cm−1.

2.6.2. Synthesis of LC-D

LC-D was obtained in a method analogous to LC-A using intermediate 2 (5.5 g, 17.78 mmol) and 4-(Trifluoromethyl) phenol (3.46 g, 21.33 mmol) as reactants with a white powder product (8.06 g, 73.28%). 1H NMR and 13C NMR spectra are shown in Figure 1c,d and FT-IR is shown in Figure 2. 1H NMR (CDCl3, 500 MHz) δ 7.69 (d, J = 8.4 Hz, 2H, 4, 6), 7.67–7.61 (m, 4H, 1, 3, 8, 12), 7.56–7.50 (m, 2H, 25, 27), 7.21 (d, J = 8.4 Hz, 2H, 9, 11), 7.03–6.97 (m, 2H, 24, 28), 4.05 (t, J = 6.3 Hz, 2H, 14), 2.64 (t, J = 7.4 Hz, 2H, 19), 1.94–1.80 (m, 4H, 15, 18), 1.70–1.57 (m, 2H, 16). 13C NMR (CDCl3, 125 MHz) δ 171.51 (20), 159.63 (10), 153.17 (23), 145.22 (5), 132.58 (1, 3), 131.46 (7), 128.37 (4, 6), 128.07 (q, J = 32.8 Hz, 26), 127.09 (8, 12), 126.79 (q, J = 3.7 Hz, 25, 27), 123.85 (q, J = 273.1 Hz, 31), 122.06 (24, 28), 119.11 (2), 115.07 (9, 11), 110.11 (30), 67.70 (14), 34.21 (19), 28.90 (15), 25.64 (18), 24.55 (16). MS(ESI): calculated C26H22F3NO3 [M + Na]+ 476.16, found 476.14. FT-IR (ATR): 2948, 2866, 2226, 1752, 1604, 1494, 1328, 1174, 1126, and 1062 cm−1.

2.6.3. Synthesis of LC-Z

LC-Z was obtained in a method analogous to LC-A using intermediate 2 (2.03 g, 6.56 mmol) and 4-(2-Methoxyethyl) phenol (1.2 g, 7.87 mmol) as reactants with a white powder product (2.08 g, 71.5%). 1H NMR and 13C NMR spectra are shown in Figure 1e,f and FT-IR is shown in Figure 2. 1H NMR (CDCl3, 500 MHz) δ 7.70–7.67 (m, 2H, 4, 6), 7.65–7.61 (m, 2H, 1, 3), 7.55–7.50 (m, 2H, 8, 12), 7.24–7.20 (m, 2H, 24, 26), 7.04–6.97 (m, 4H, 9, 11, 23, 27), 4.04 (t, J = 6.3 Hz, 2H, 14), 3.58 (t, J = 7.0 Hz, 2H, 29), 3.35 (s, 3H, 31), 2.87 (t, J = 7.0 Hz, 2H, 28), 2.60 (t, J = 7.4 Hz, 2H, 18), 1.93–1.78 (m, 5H, 15, 17), 1.69–1.56 (m, 3H, 16). 13C NMR (CDCl3, 125 MHz) δ 172.17 (19), 159.68 (10), 149.09 (22), 145.25 (5), 136.58 (25), 132.57 (1, 3), 131.39 (7), 129.79 (24, 26), 128.36 (4, 6), 127.09 (8, 12), 121.37 (23, 27), 119.12 (2), 115.09 (9, 11), 110.07 (33), 73.47 (29), 67.77 (14), 58.69 (28), 35.60 (31), 34.27 (18), 28.91 (15), 25.65 (17), 24.68 (16). MS(ESI): calculated C28H29NO4 [M + NH4]+ 461.21, found 461.24. FT-IR (ATR): 2932, 2864, 2224, 1754, 1604, 1494, 1386, 1294, 1250, 1204, 1144, and 1108 cm−1.

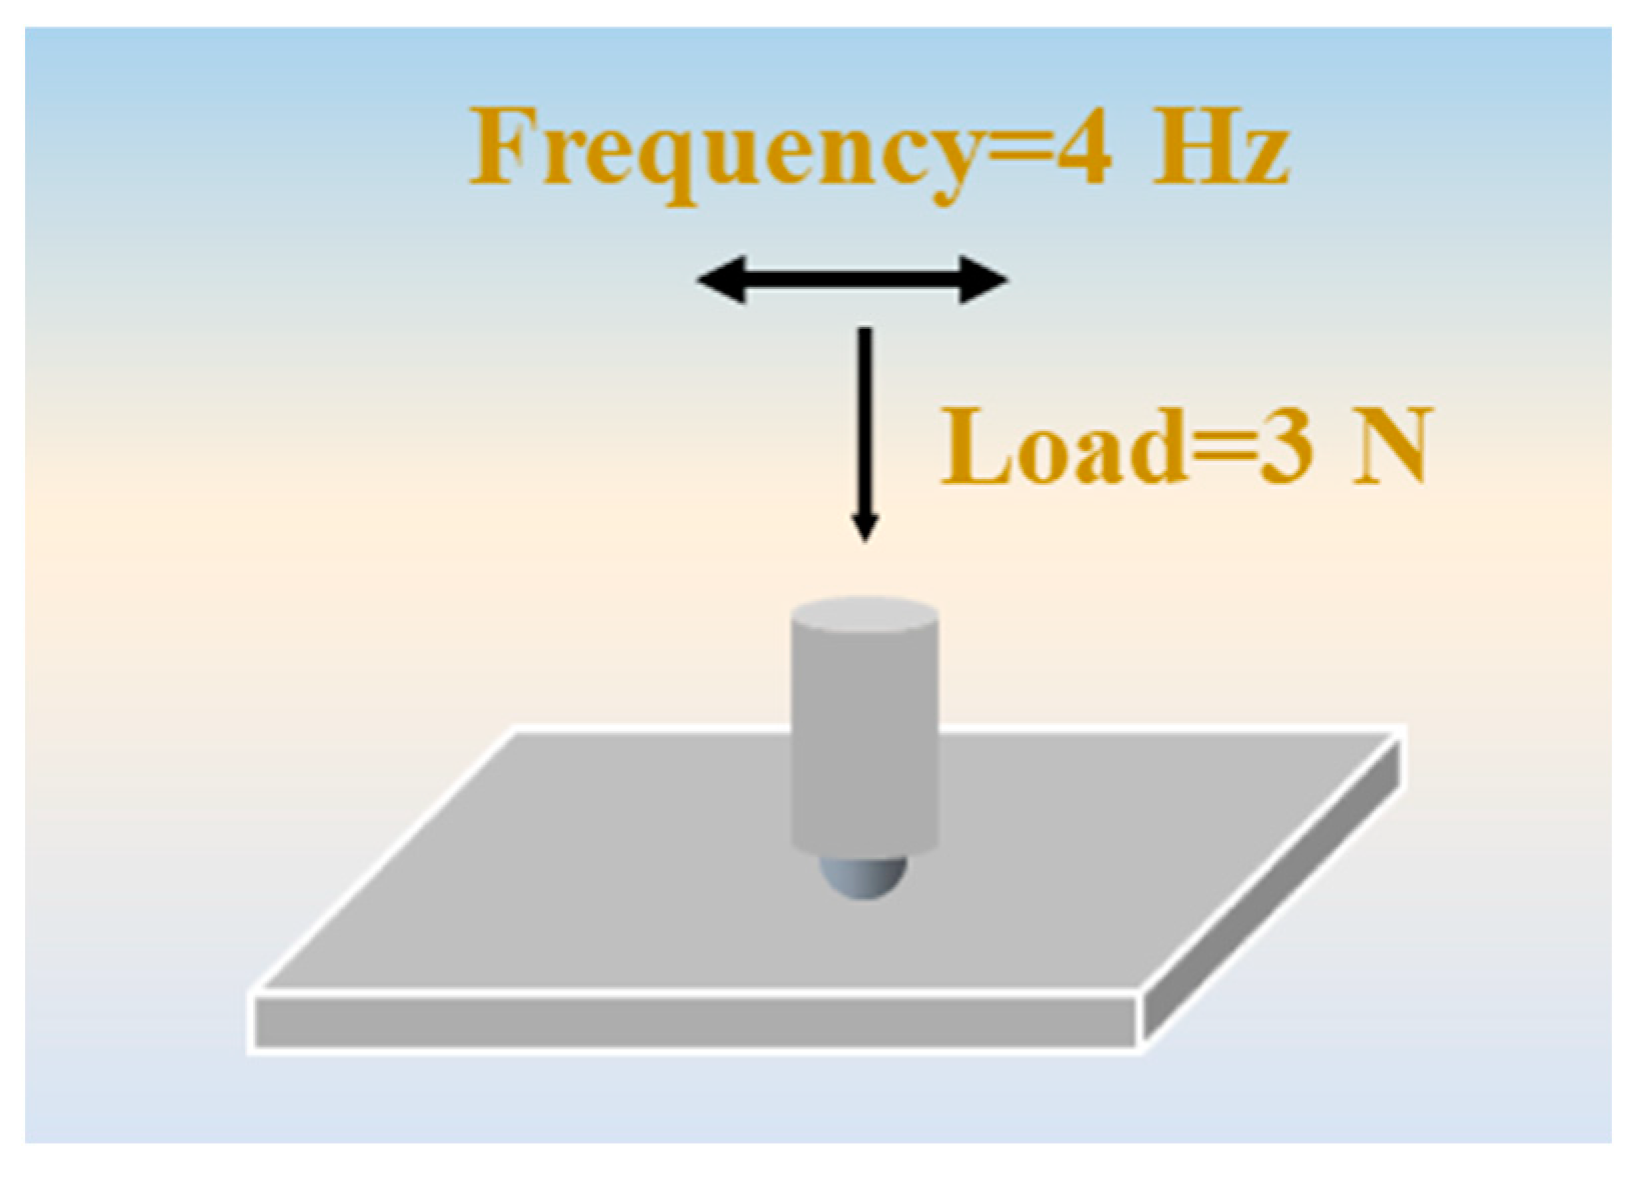
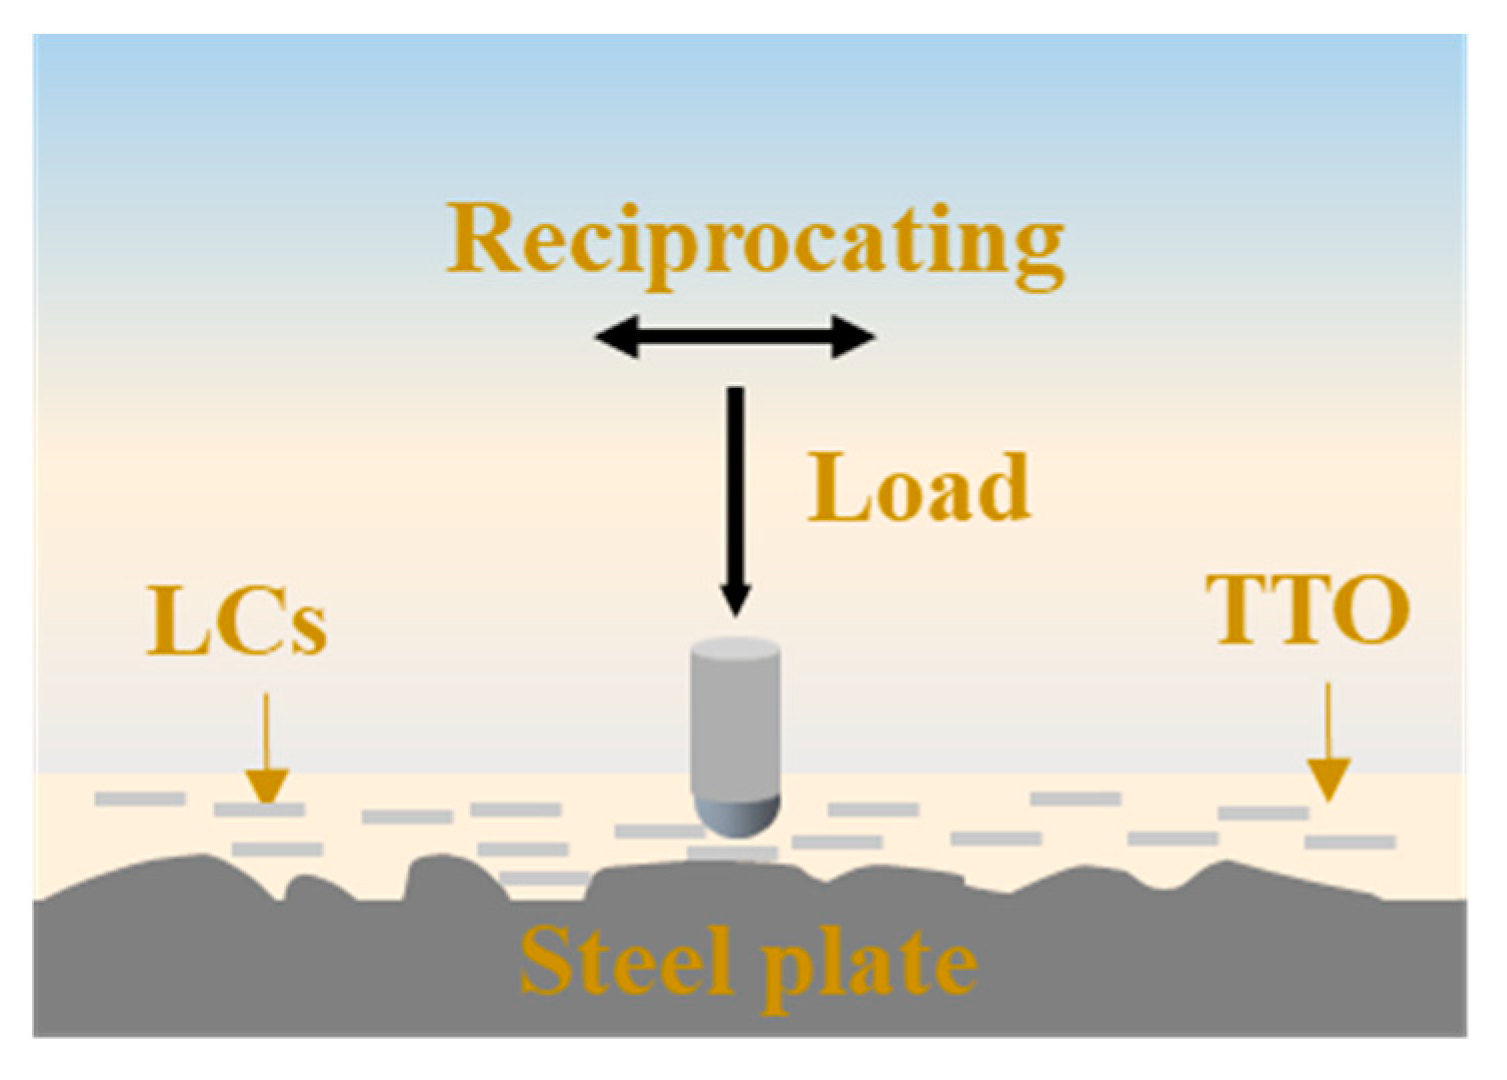
2.7. Tribological Test and Characterization of Worn Surface

To verify the effect of the mesogenic-phase temperature ranges on the tribological properties of LCs, LCs were evaluated in a point-to-point contact mode with a UMT-TriboLab friction and wear tester (Bruker, Billerica, MA, USA). The steel ball and steel plate used in the experiment were made of 304 stainless steel, and the diameter of the steel ball was 8 mm. The experimental parameters are shown in Table 1 and the model schematic is shown in Figure 3. Tests were conducted at 25 °C, 50 °C, 75 °C, 100 °C, 125 °C, 150 °C, 175 °C, and 200 °C. Before each test, the steel ball and steel plate were sonicated using a mixture of ethanol and petroleum ether; the procedure lasted for 30 min. A computer was used to record the curve of the coefficient of friction and the sliding time. During the test, the friction-pair was completely immersed in the base oil with or without additives. Each experiment was repeated at least twice to make the experimental results accurate.
After the test, the steel plates were cleaned using petroleum ether. The width of the wear surface was characterized by a Contour GT-K 3D profiler. Finally, the wear surfaces were characterized using Raman and SEM spectrometers to illustrate the mechanism of action of LCs as lubricant additives.

3. Results and Discussion

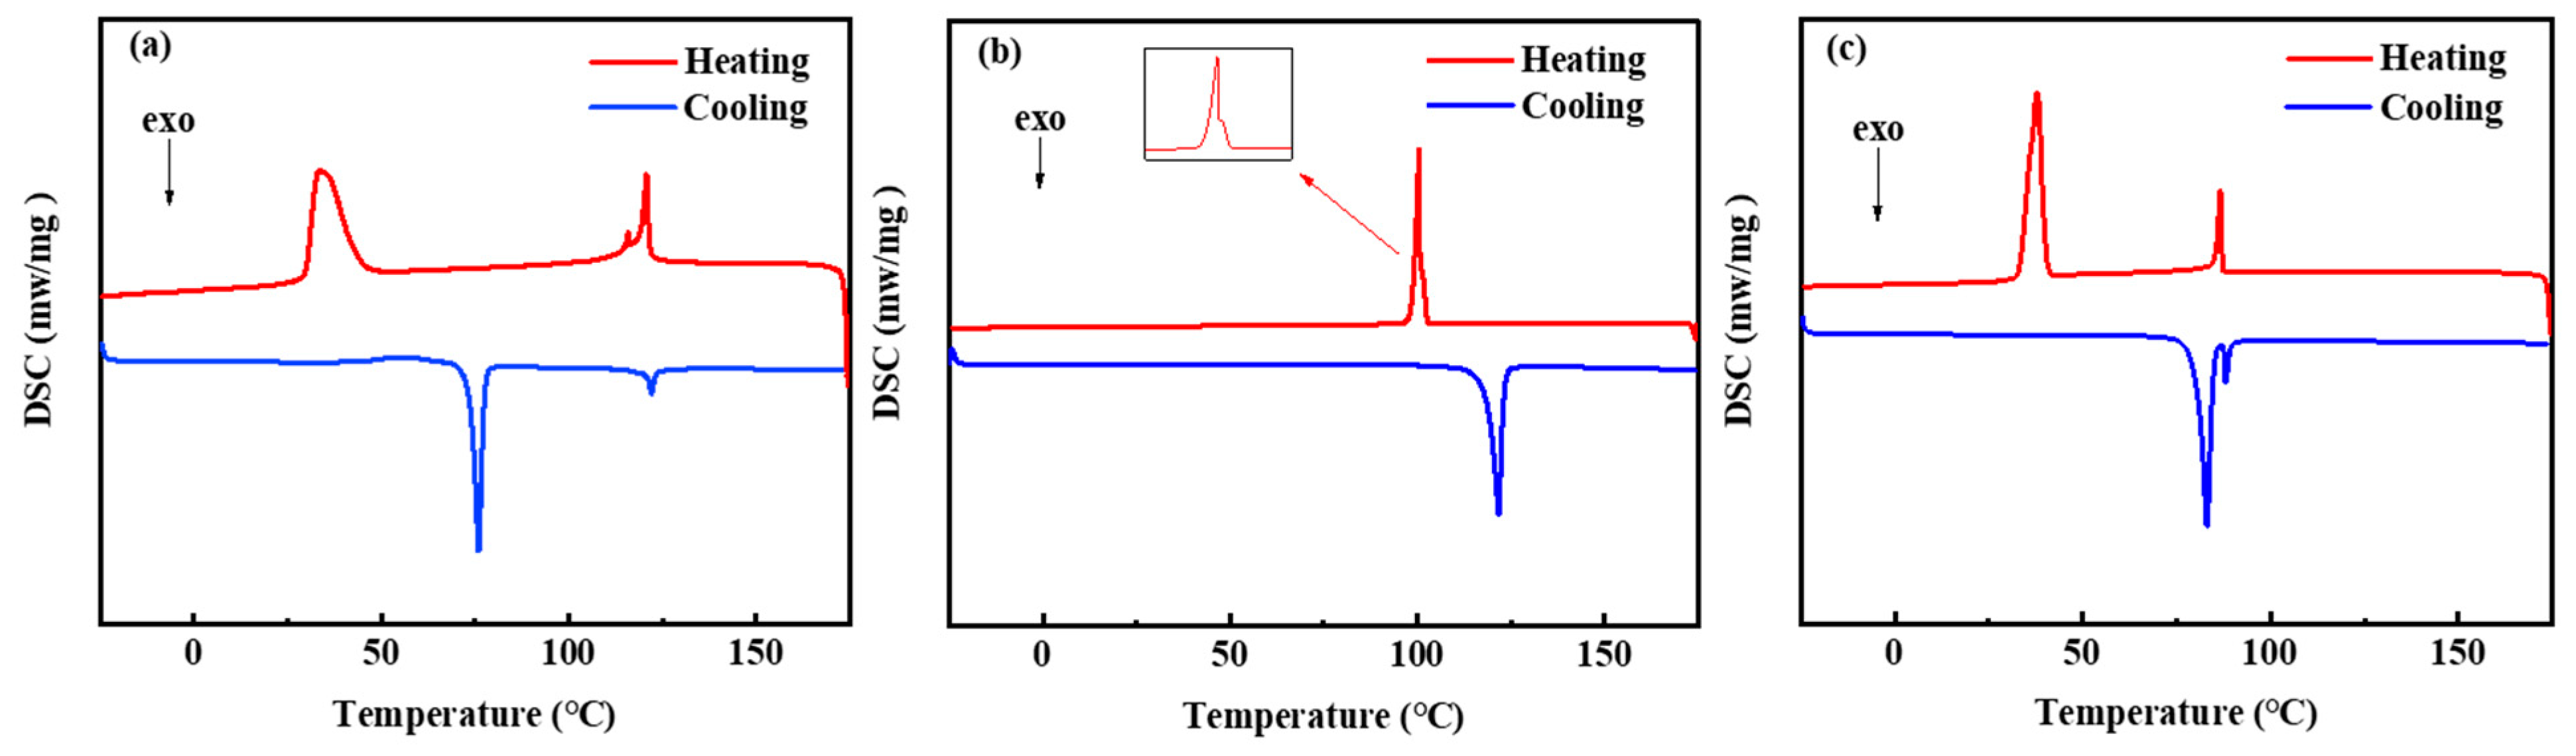
3.1. Mesogenic-Phase Behaviors of the Synthesized LCs

DSC and POM were used to characterize the LCs properties. DSC thermograms of the three LCs, from which the three LCs exhibit characteristics, are shown in Figure 4. LC-D exhibits the corresponding LC properties only in the heating cycle, and the mesogenic-phase temperature range is narrow. LC-A and LC-Z display mesophases as well as wide mesogenic-phase temperature ranges in both heating and cooling cycles. Therefore, compared to LC-D, LC-A and LC-Z have almost symmetrical mesophases and wider mesogenic-phase temperature ranges. From Figure 4a, LC-A shows three heat absorption peaks during the heating process. The first peak corresponds to the melting temperature (Tm), which refers to the temperature at which LC-A was melted by heat into the LC phase; the second peak indicates that the phase transition occurred in the smectic C phase of LC-A; and the third peak shows the disappearance of the LC phase while entering the isotropic liquid phase, which is indicated using the clearing point (Td). LC-D and LC-Z have two heat absorption peaks, corresponding to Tm and Td, respectively. The phase-transition temperature and the mesogenic-phase temperature range of the three LCs during the heating process are shown in Table 2. The Tm of LC-A, LC-D, and LC-Z are 33.7 °C, 100.5 °C, and 37.8 °C, respectively. Depending on the mesophase temperature range, the order of the LCs is LC-A > LC-Z > LC-D, which is closely related to the molecular structure of the LCs. When compared with LC-D, LC-A and LC-Z show superior LC properties due to their longer chain lengths. Moreover, the two ester groups in the LC-A structure make it easier to form a smectic phase with a wider mesogenic-phase temperature range. Figure 5 shows the optical textures of the LCs, which were observed using POM. From Figure 5a, LC-A shows a schlieren texture at 65.9 °C. From Figure 5b, LC-D exhibits a fan-shaped focal conic texture at 100.6 °C, while Figure 5c shows the focal conic texture of LC-Z at 56.5 °C. The three synthetic LCs exhibit a colorful LC texture.

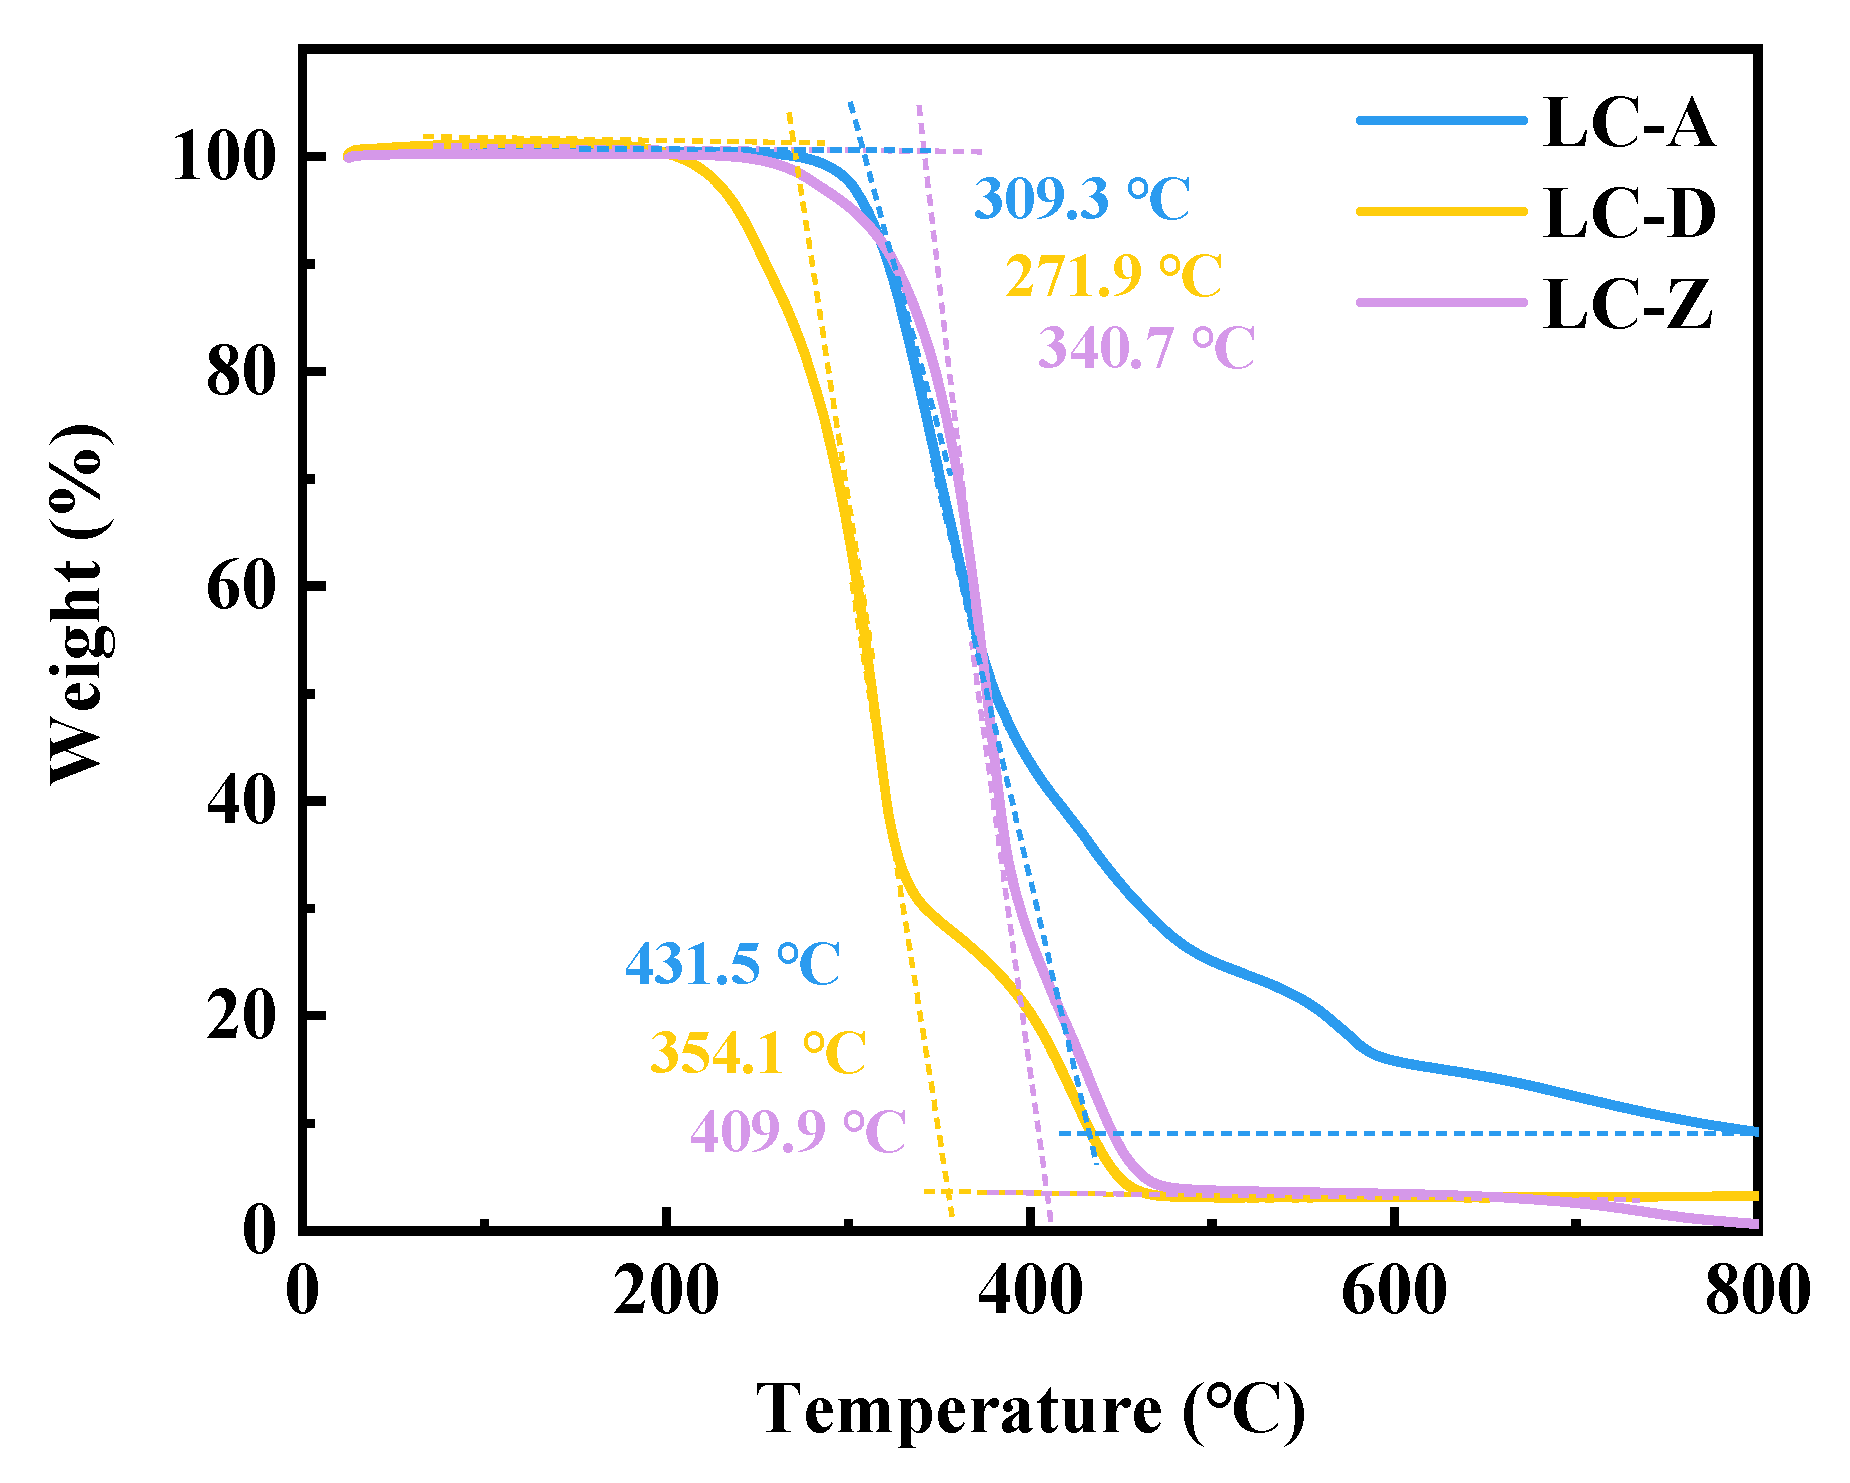
3.2. Analysis of Thermal Stability

Thermal stability is an index used to evaluate the anti-decomposition and anti-aging qualities of a lubricant, and good thermal stability is necessary for lubricant additives. The thermogravimetric analysis curve of TGA is shown in Figure 6. The initial decomposition temperatures of LC-A, LC-D, and LC-Z were 309.3 °C, 271.9 °C, and 340.7 °C, respectively, mainly due to the decomposition of ether bonds and ester groups in the structure of LCs. When compared with LC-D and LC-Z, LC-A contains two ester groups in its structure, which may be the reason for its second decomposition starting at 400 °C. LC-D starts its second decomposition around 340 °C, probably due to the presence of trifluoromethyl in its molecular structure. In addition, the final decomposition temperatures of the three LCs were 431.5 °C, 354.1 °C, and 409.9 °C, respectively. The analytical results show that LCs have excellent thermal stability due to their molecular structure, having the potential to be used as lubricant additives.

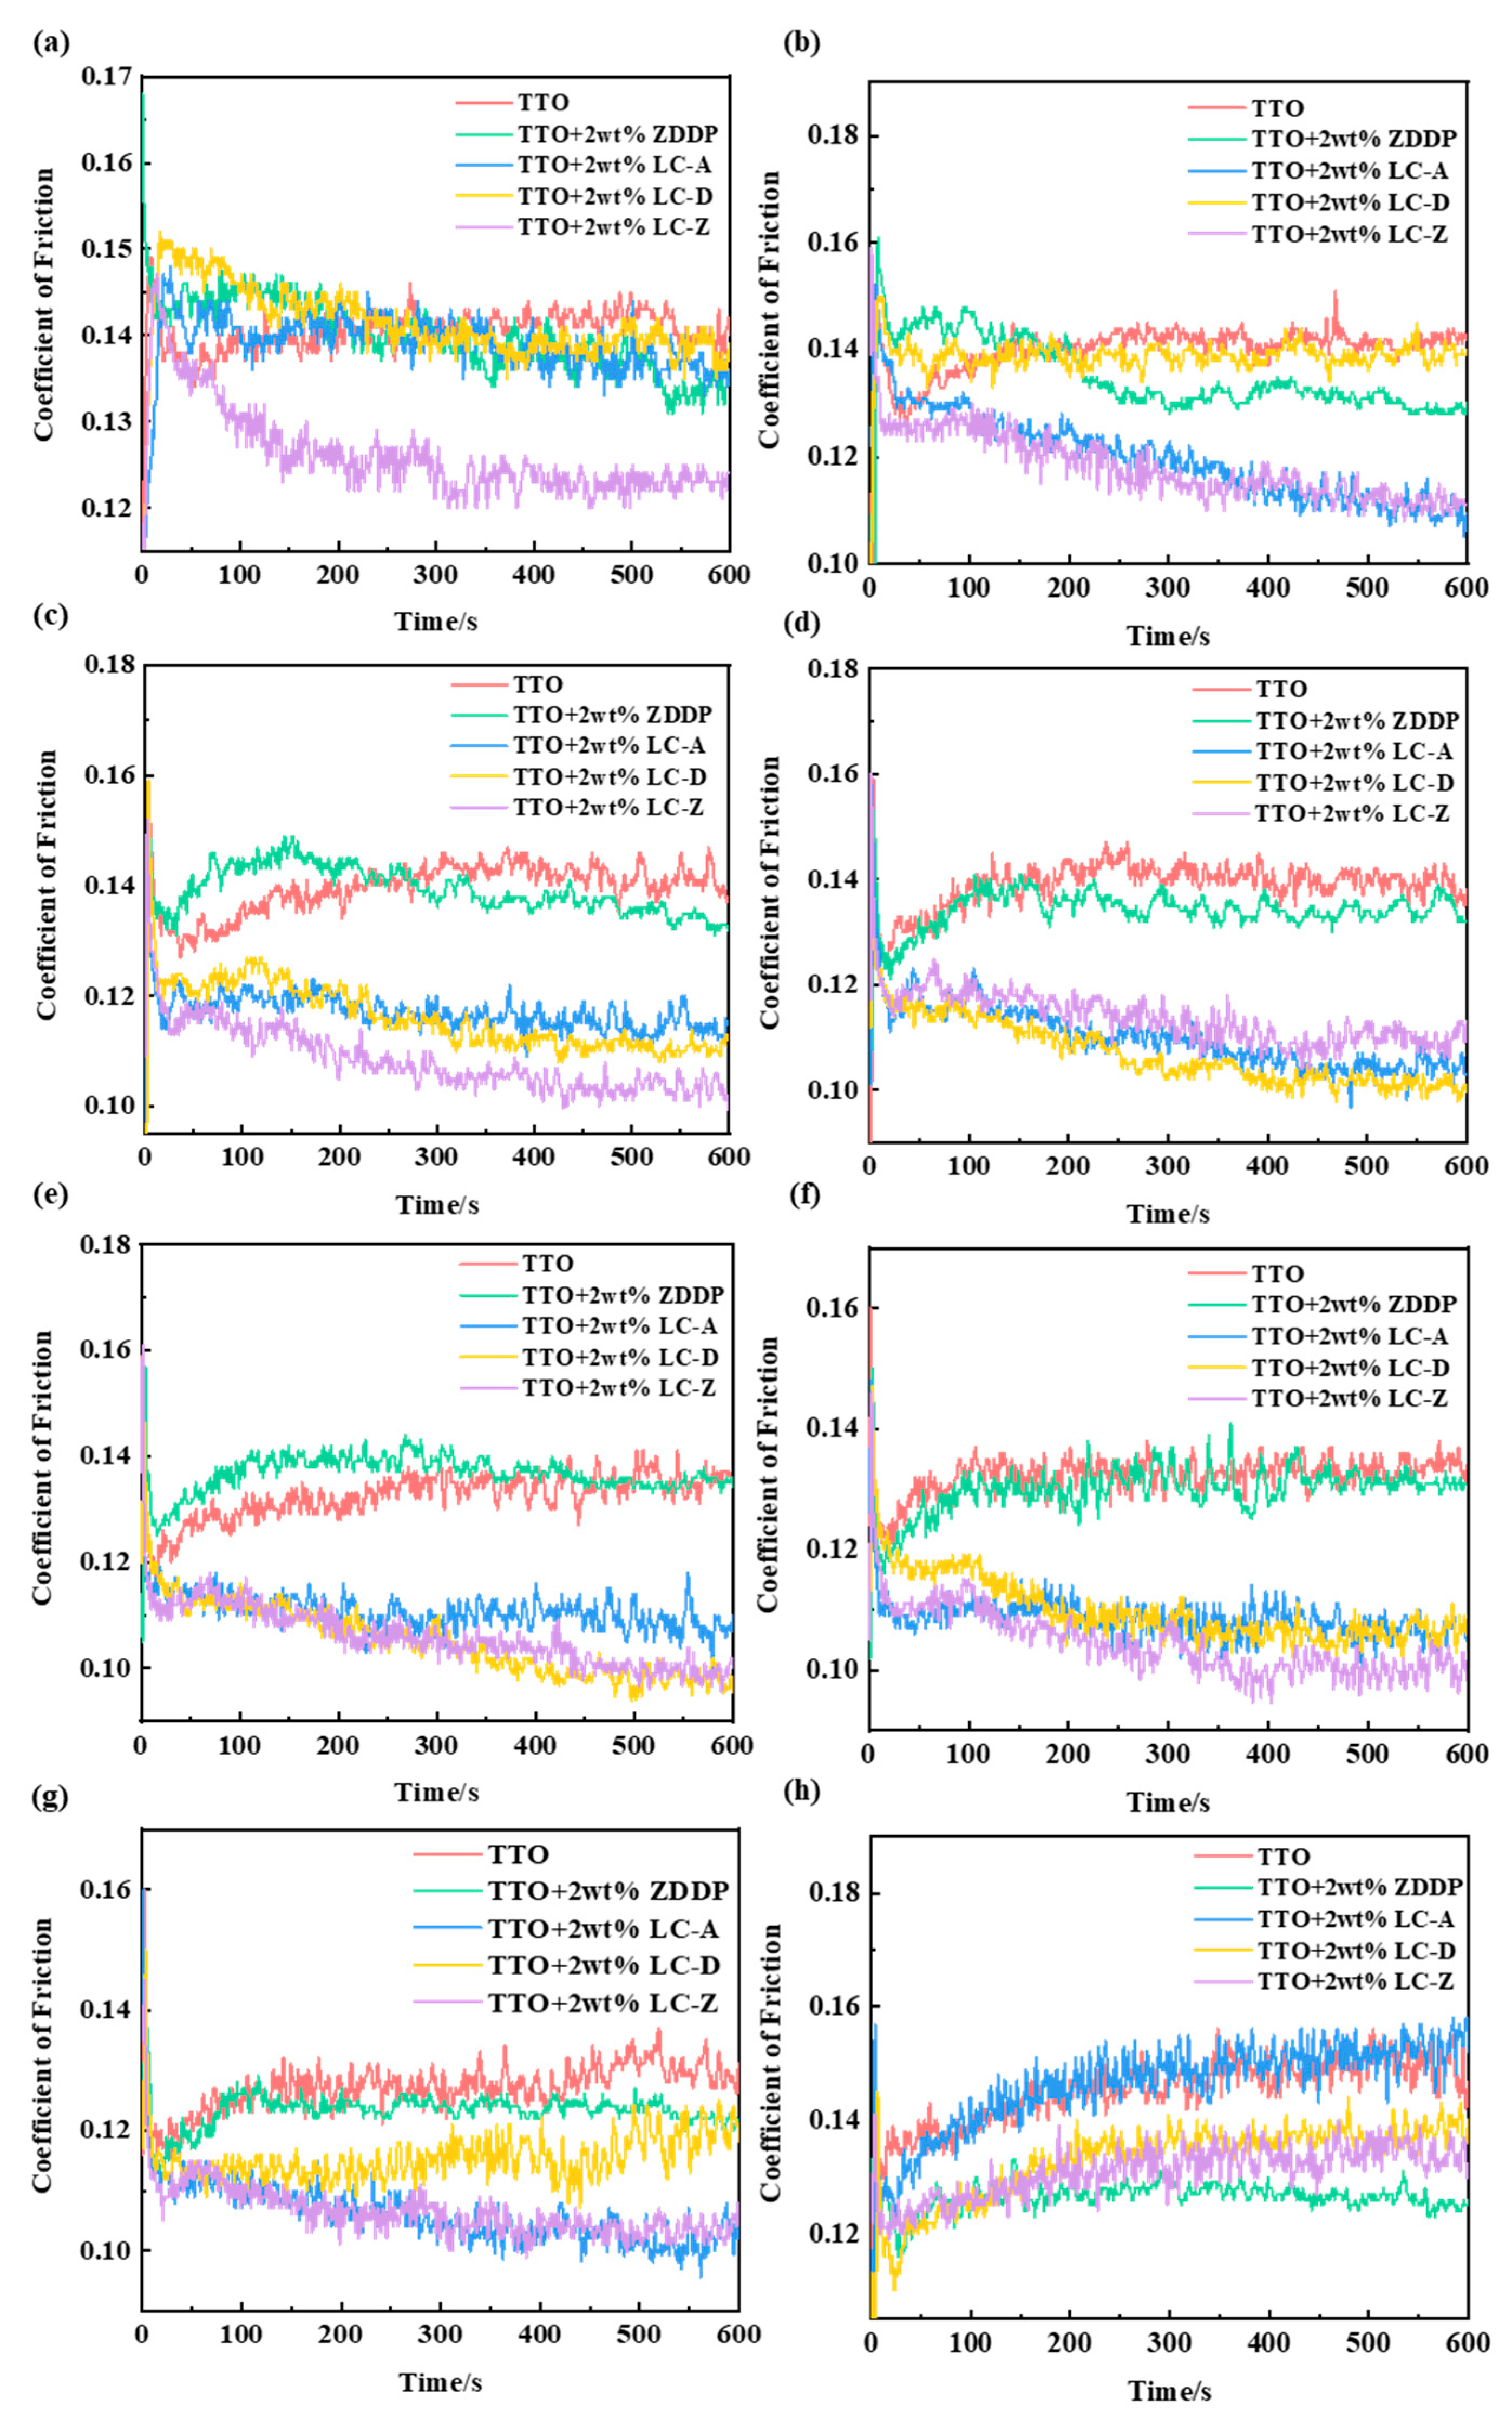
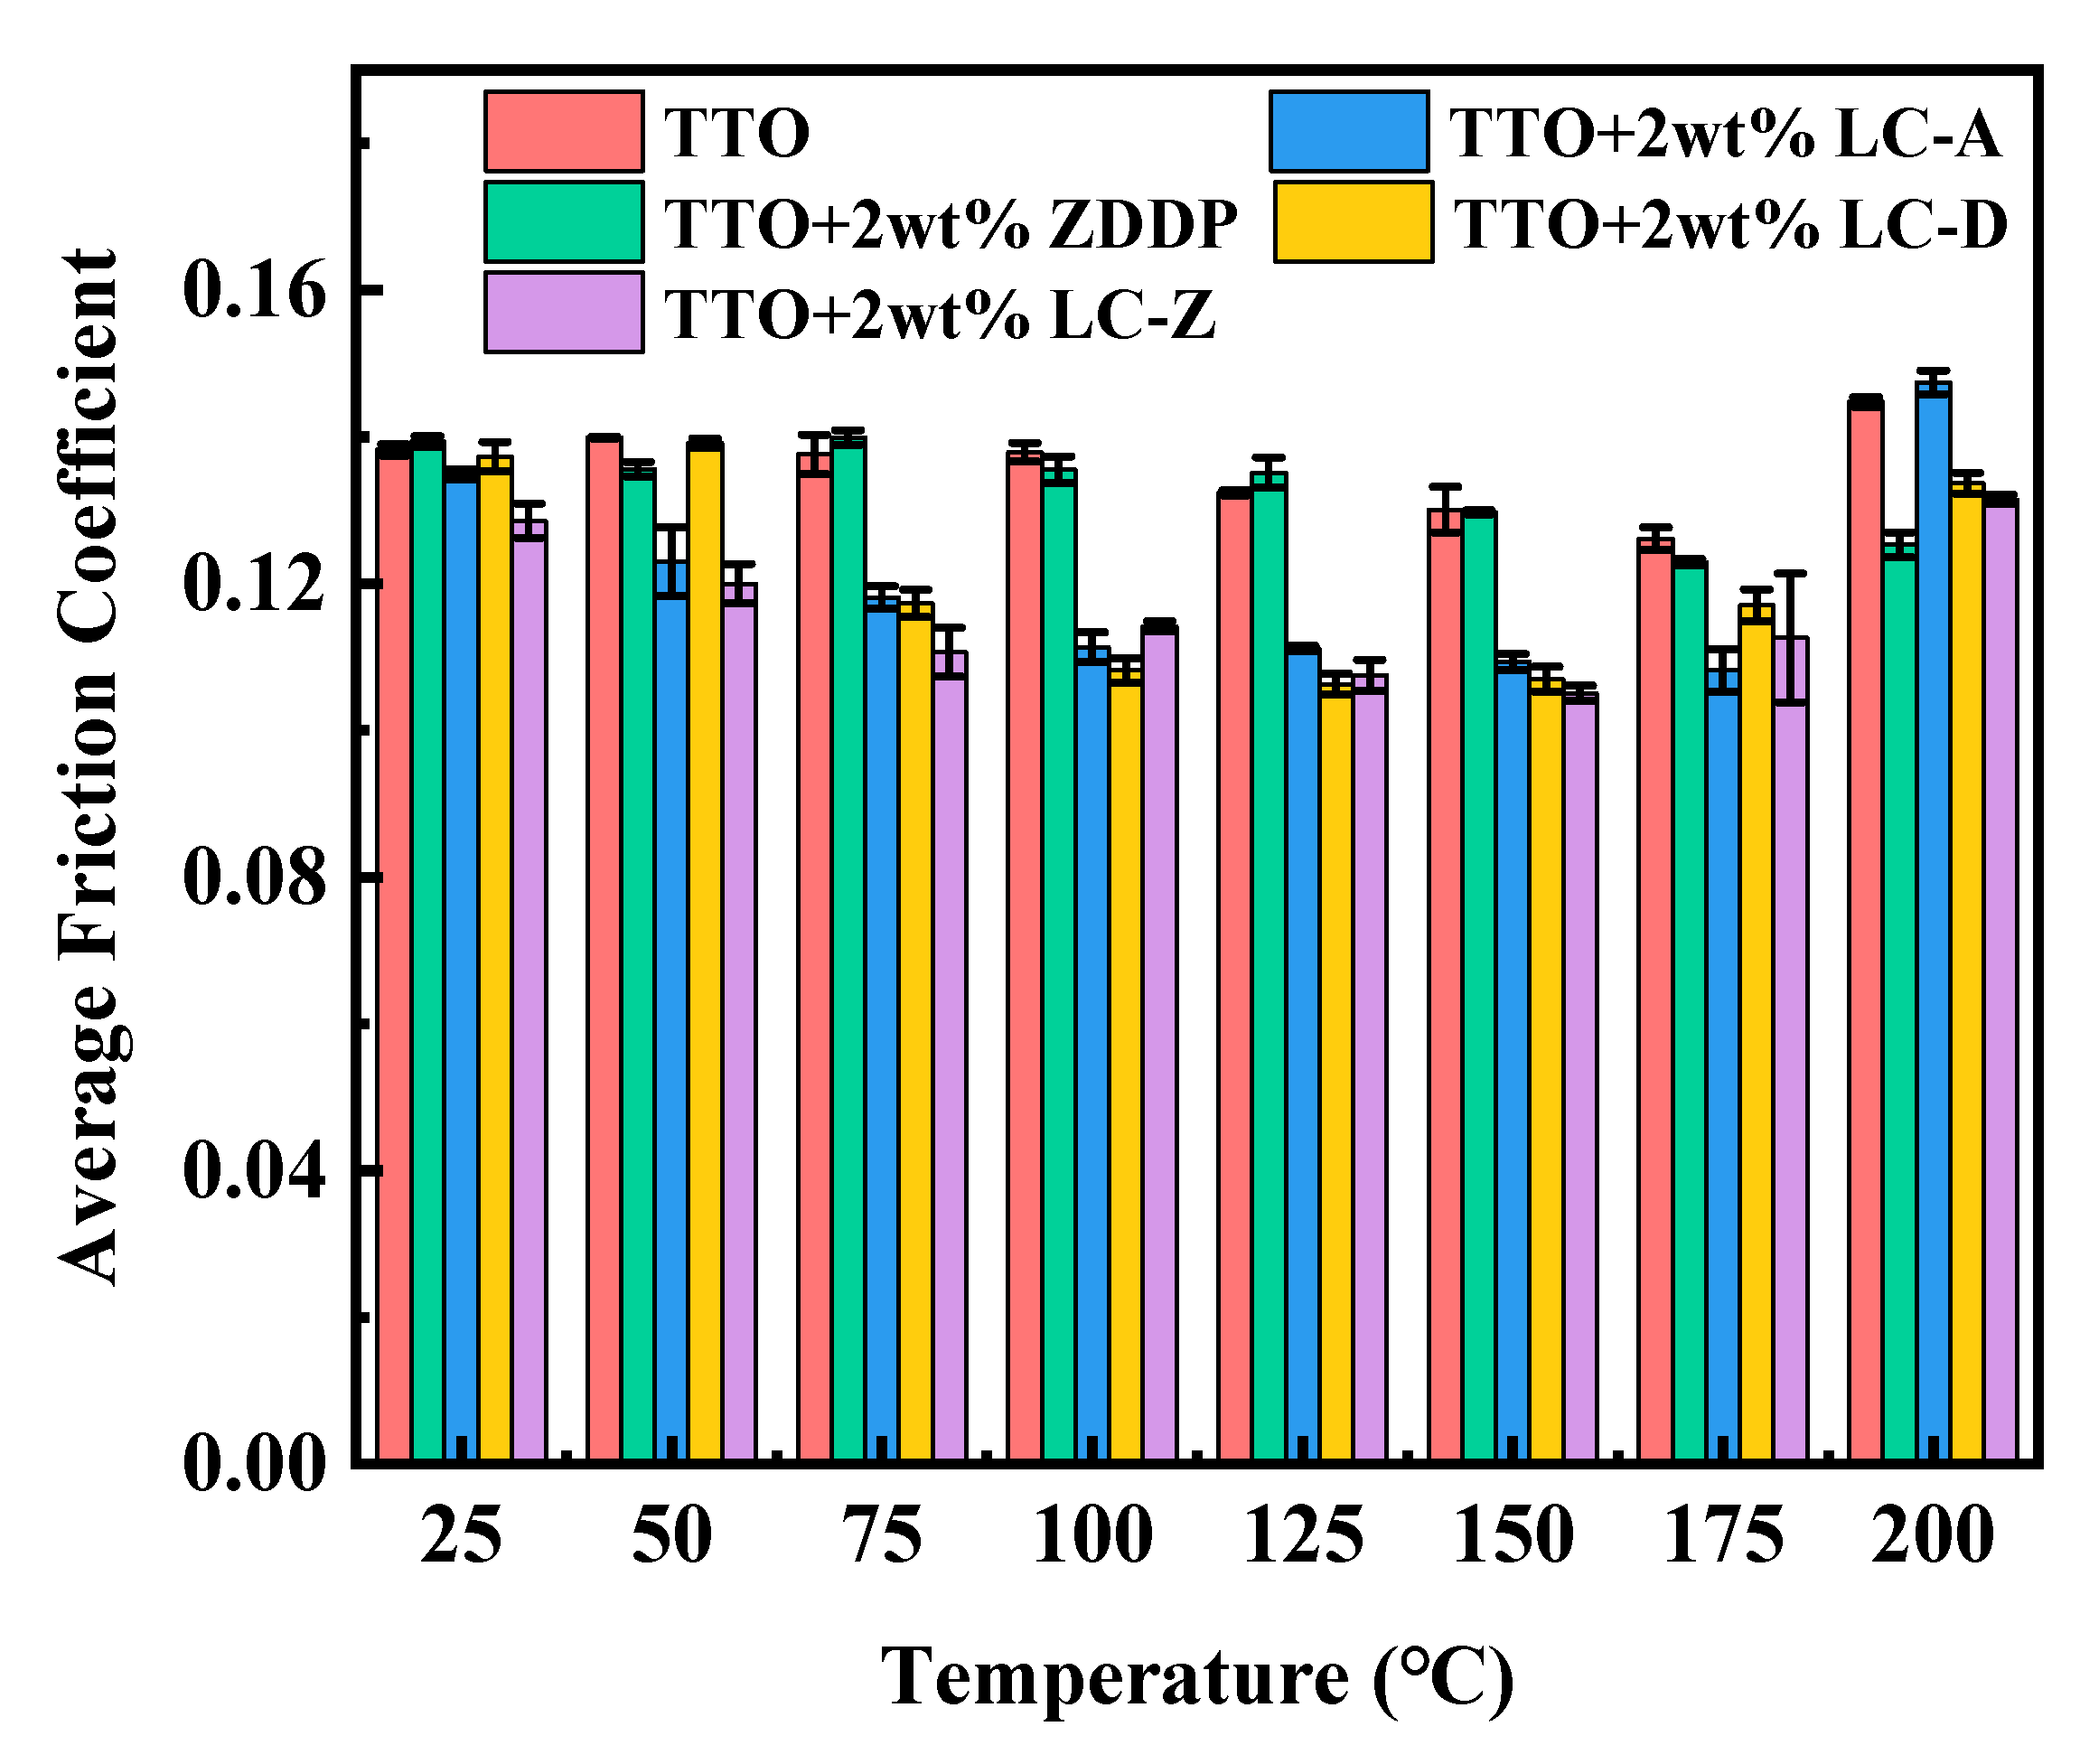
3.3. Anti-friction Analysis

The feasibility of LCs as lubricant additives was investigated using a UMT friction and wear tester. TTO was selected as the base oil, and 2 wt% of LCs were added as an additive. A comparison was made with the commercial lubricant additive ZDDP, thus illustrating the anti-friction effect. Figure 7 and Figure 8 display the friction coefficient curves and average friction coefficient over a temperature range for pure TTO and TTO containing 2 wt% ZDDP, LC-A, LC-D, and LC-Z, respectively. The tested temperature points were 25 °C, 50 °C, 75 °C, 100 °C, 125 °C, 150 °C, 175 °C, and 200 °C. From Figure 7 and Figure 8, pure TTO exhibited bad friction-reduction performance in the tested temperature range and its performance was less affected by an increasing temperature. When compared to the samples of TTO with LCs added, the friction coefficient curves show an increasing trend in general with large fluctuations. In contrast, the oil containing LCs had a lower average friction coefficient in a specific temperature range, and the friction coefficient curves showed less fluctuation and an overall decreasing trend, especially in the range of 75–150 °C. It is noteworthy that there are differences in the mesogenic-phase temperature ranges in which the three LCs have friction-reducing effects. As can be seen from Figure 8, LC-A can reduce the average friction coefficient of TTO at 25–175 °C; LC-D has the ability to reduce friction from 75–200 °C, and LC-Z can achieve a certain friction reduction effect across the whole temperature range of the test. Additionally, LC-A and LC-D have the best friction-reduction effects at 100 °C, with reductions of 19.25% and 21.57% when compared to the base oil, respectively. LC-Z showed the best performance in anti-friction at 75 °C, with a reduction of 19.59%. When combined with the DSC, the anti-friction properties of the LCs were very closely connected with the mesogenic-phase temperature ranges, and the optimum temperatures for their tribological properties were close to or within this range. Among them, LC-D has a mesophase temperature range of 100.5 °C to 100.9 °C. The narrower intermediate-phase temperature range may limit the range in which it can exert its friction-reducing effect. Compared with LC-D, LC-A and LC-Z have a wider intermediate-phase temperature range and can be used as additives to reduce the average friction coefficient over a wider temperature range. According to the analysis, it can be speculated that the phase-change temperature range of LCs is an influential factor on their friction-reduction performance, and the temperature range which exerts the friction-reduction effect will be wider than the phase-change temperature range in general. In addition, ZDDP is the most widely used and effective lubricant additive. As can be seen from Figure 7 and Figure 8, the trend of tribological performance with temperature remains insignificant when ZDDP is added to the base oil. The LC additives displayed superior friction-reduction performances compared to ZDDP, and the effect of friction-reduction was influenced by temperature. Even at 175 °C, the LCs’ average friction coefficients remained superior when compared with ZDDP, which demonstrates that LCs can be used in lubricant applications. It is worth noting that each LC compound has its corresponding optimal temperature interval, within which the LC additives can improve the friction-reduction performance of the oil and yet can be applied to several operating conditions under specific temperatures, thus enabling the controllability of the oil temperature.

3.4. Anti-Wear Analysis

The width of the wear scar was characterized by a Contour GT-K 3D profiler to illustrate the anti-wear performance of LCs as lubricant additives. The average of the three measurements was calculated to illustrate the width of the wear scars. The results are shown in Figure 9. All LC additives exhibited superior anti-wear performance at different temperatures when compared with TTO. Even at 50–175 °C, the anti-wear performance of the three LC additives was significantly better than that of the commercially available additive ZDDP. It is noteworthy that, compared with LC-D, the addition of LC-Z resulted in a smaller width of wear marks on the steel plate over a wide temperature range of 25 to 75 °C. Among them, the width of wear marks at 75 °C was reduced by 31.82%. The addition of LC-A can also significantly improved the anti-wear performance of the oil, with a 25.78% reduction in the width of wear marks at 75 °C, which may be caused by the longer chain length of LC-A and LC-Z, resulting in wide-mesophase temperature ranges. It can be seen from Figure 9 that LC-D has good anti-friction properties throughout the temperature range, especially at 125 °C, with a 30.07% reduction in width of the wear scars, which is probably due to the presence of trifluoromethyl in its structure. In addition, the three LC additives can dramatically enhance the anti-wear performance of TTO in a wide temperature range of 25 to 175 °C, which is consistent with the following conclusion: the temperature interval in which the LC additives have tribological performance effects is wider than their mesophase temperature ranges. Therefore, the chemical structure and mesophase temperature ranges of LC additives are critical factors affecting their anti-wear performance.

3.5. Surface Analysis
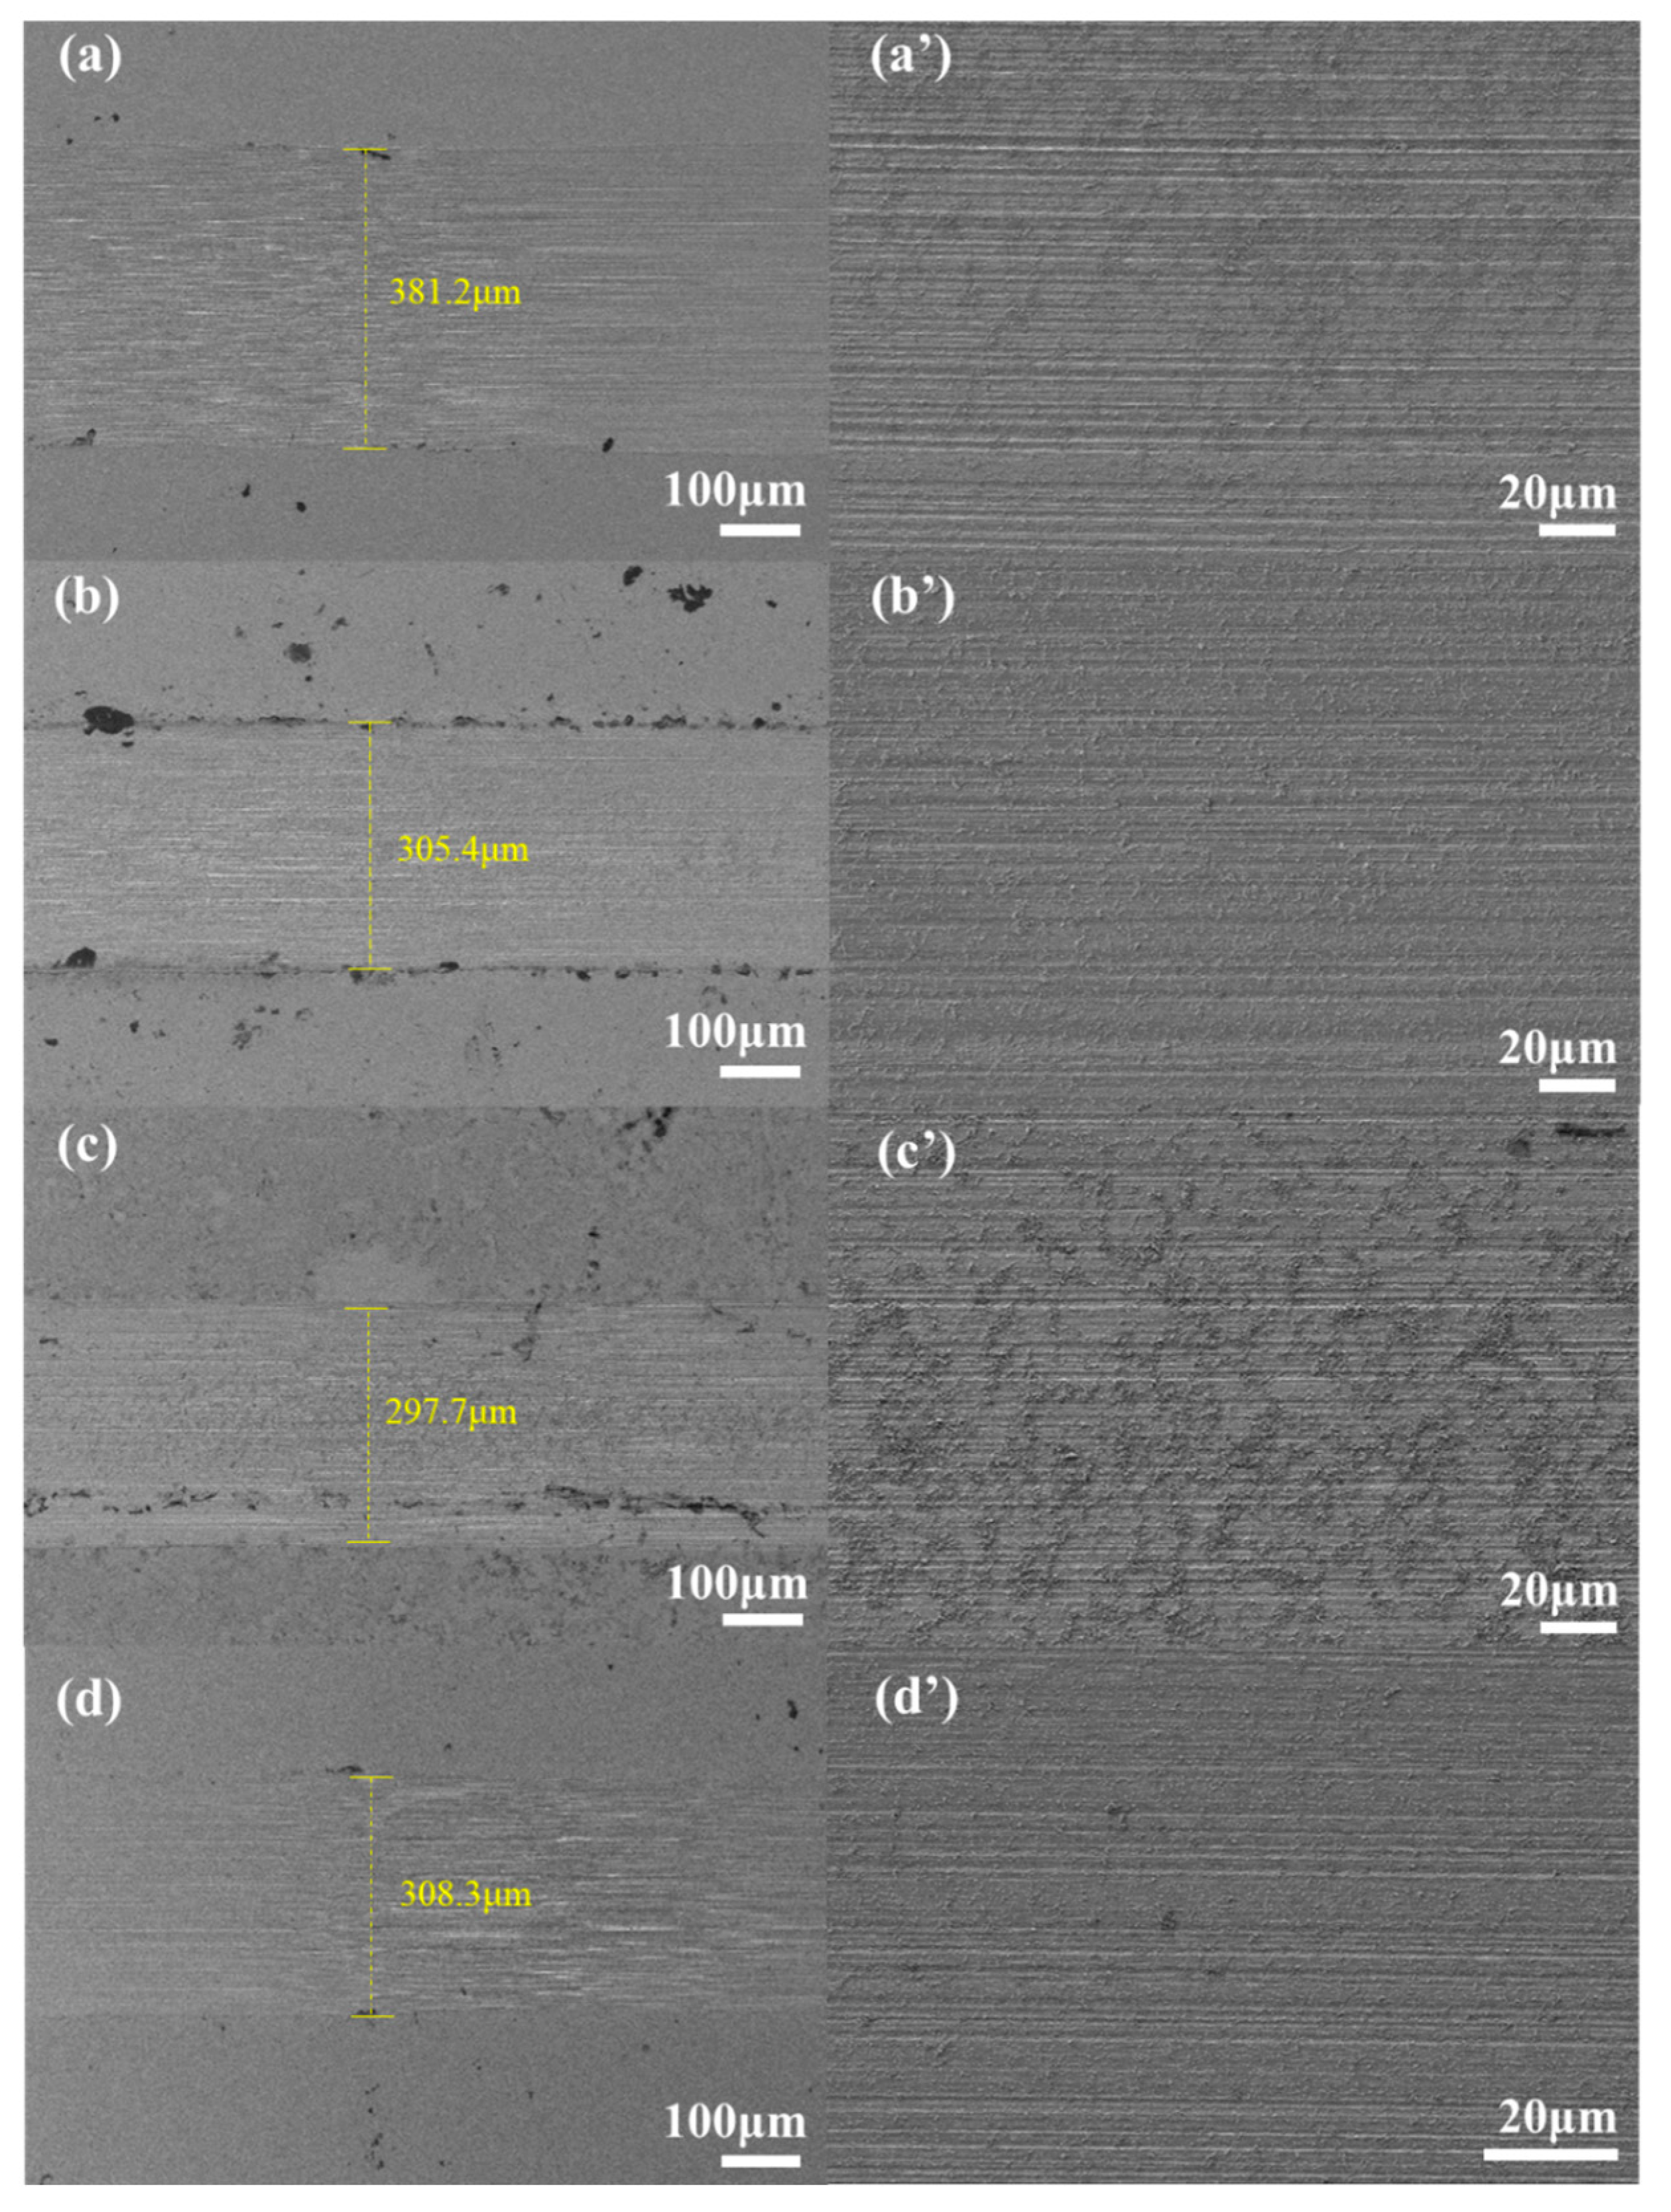
3.5.1. SEM Analysis

The morphology of the wear surface was further observed with SEM. Figure 10 shows the SEM images and the width of wear scars at 100 °C. As can be seen from Figure 10, the wear scars were deeper with pure TTO lubrication and an obvious furrow appeared, indicating that no stable lubrication film was formed on the wear surface. The addition of LC additives can reduce the degree of wear on the wear surface and form a stable lubricating film, so as to improve the anti-wear properties of the base oil. The width of the wear marks of pure TTO is 381.2 μm, and the width of the wear marks of the three LC additives are 305.4 μm, 297.7 μm, and 308.3 μm, respectively. Compared to pure TTO, the anti-wear effects of LCs are 19.89%, 21.88%, and 19.11%, respectively. The anti-wear effect of LC-A is better than LC-Z, which was in line with the mesophase temperature ranges. The anti-wear effect of LC-D was significantly better than the other two LC additives, which was probably due to the presence of trifluoromethyl in its structure, which forms a stable lubricating film and leads to the improvement of the anti-wear properties of the oil. It can be seen from Figure 10c,c’, that there was a slight corrosive wear on the wear surface of LC-D, which may be due to the chemical reaction between the free fluorine atoms and iron elements on the wear surface.

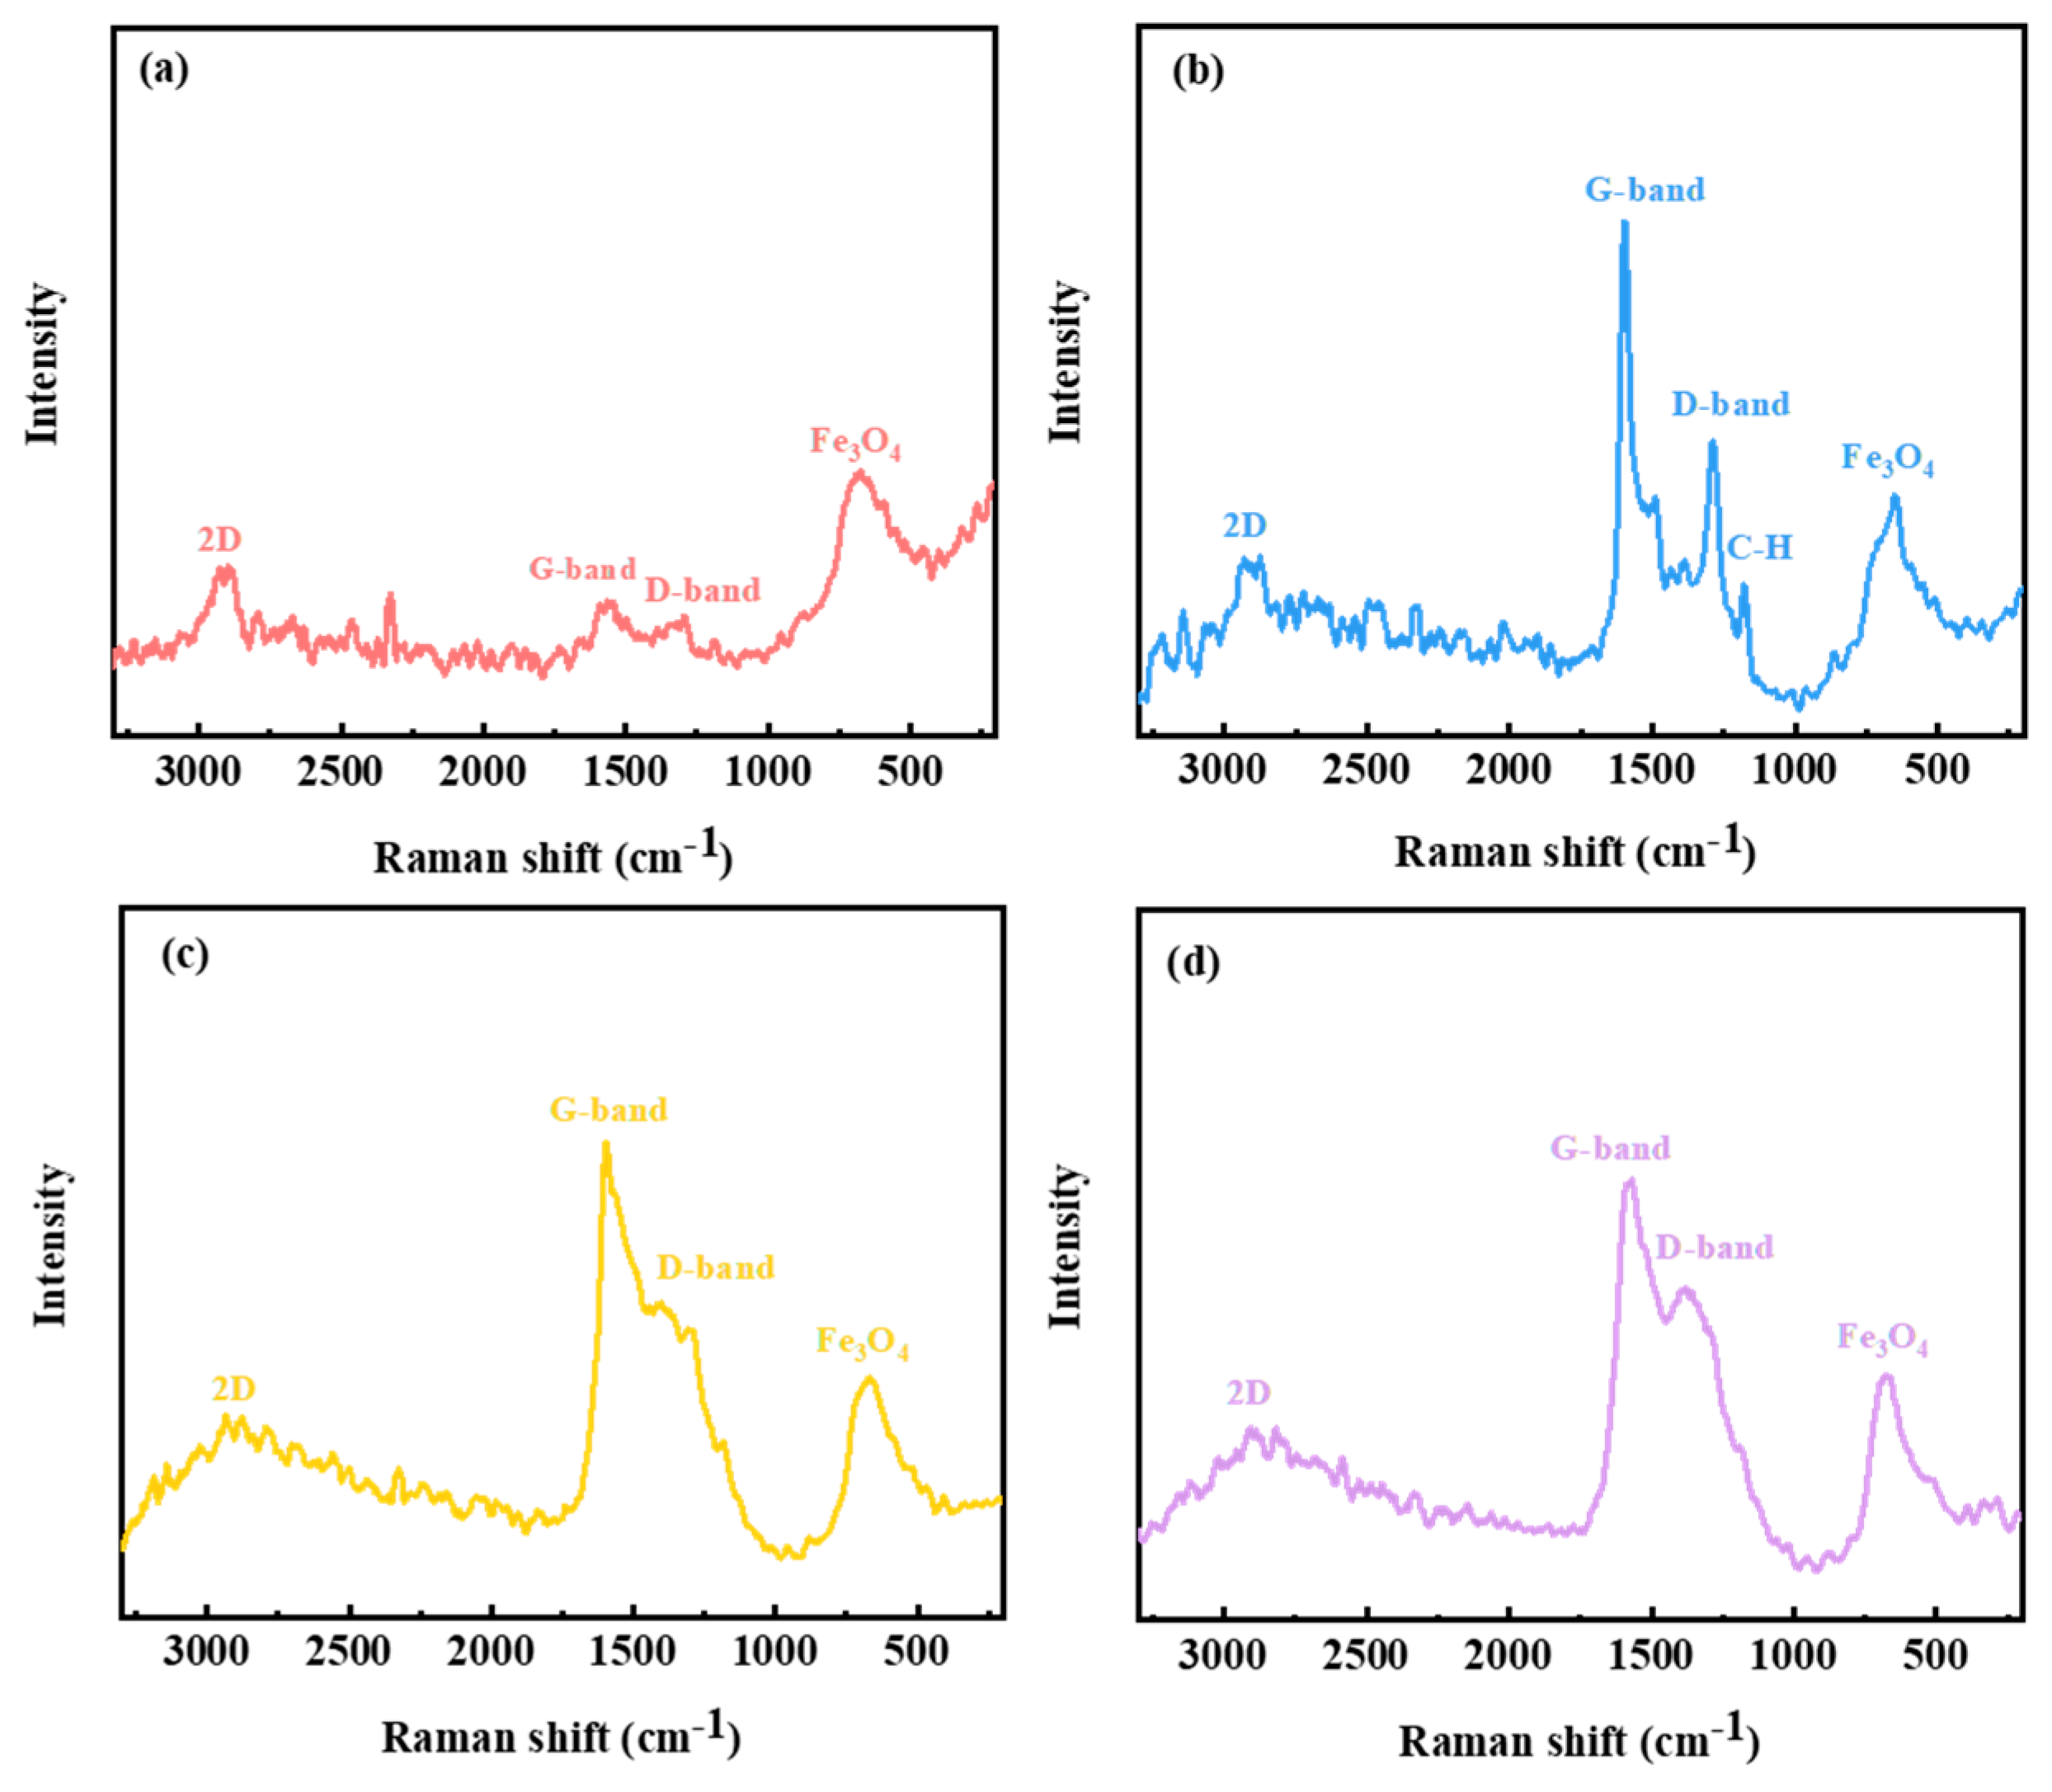
3.5.2. Raman Spectroscopy Analysis

The lubrication mechanism of the worn surface was analyzed using Raman spectroscopy. After the test, we cleaned the steel plates with petroleum ether. The wear marks on the surfaces of the steel plates were characterized with Raman spectroscopy to illustrate the mechanism of action of LCs as lubricant additives. Figure 11 shows the Raman spectra after the UMT-TriboLab friction and wear tester, excited by the 532 nm laser. We can see that the strong peak at 663 cm−1 is Fe3O4, the peaks at 1357 cm−1 and 1573 cm−1 belong to the D and G peaks, respectively, and the strong peak at 2890 cm−1 is associated is with the 2D peak. From Figure 11a, the surface lubricated by base oil mainly contains Fe3O4, and the signals of the D peak and G peak are weak, which indicates that the carbon content in the base oil is relatively low. The surface of the friction marks after adding LCs is dominated by Fe3O4, D peak and G peak, and has an obvious 2D peak. It can be confirmed that a carbon film and iron oxide film were formed on the friction surface, which played a role in reducing friction and increasing anti-wear properties. Significantly, the characteristic group with LC additives can be observed on the wear surface lubricated with 2 wt% LC-A, which indicates that the LCs has a strong adsorption ability on the metal surface and can generate a lubricant film with the chemical reaction on it. Figure 12 shows the schematic representation of the lubrication mechanism. It can be hypothesized that LC additives can form a lubricant film on the surface, preventing the direct contact of the rough surfaces and thus achieving the effect of friction-reduction and anti-wear.

4. Conclusions

  • Three LCs were synthesized and characterized for their structures and thermal stability. The results indicate that they have excellent thermal stability. The LCs’ properties were examined, and it was found that three LCs exhibited good mesogenic-phase behavior and that the chain length was an essential factor affecting the width of the mesogenic-phase temperature ranges. Among the LCs, LC-A showed the longest chain length and the widest mesogenic-phase temperature range.
  • The synthesized LCs were used as lubricant additives to investigate tribological behavior. The three LCs showed excellent friction-reduction and anti-wear properties when compared to the base oil. Furthermore, the tribological properties of the LCs were very closely connected with their mesogenic-phase temperature ranges, and the best tribological properties of LCs are found in or close to the temperature range.
  • To analyze the lubrication mechanism of LCs, it is found that the addition of LCs additive can reduce the width of wear marks and the surface furrow, which can form a lubricant film on the wear surface and prevent the direct contact of frictional pairs on the sliding surface, leading to the improvement of tribological properties of the base oil.

Author Contributions

Conceptualization, W.H. and J.L.; methodology, W.H. and S.F.; validation, H.W.; formal analysis, H.W. and Y.J.; investigation, H.W.; data curation, H.W.; writing—original draft preparation, H.W. and W.H.; writing—review and editing, W.H. and J.L. All authors have read and agreed to the published version of the manuscript.

Funding

This research was funded by the Youth Innovation Promotion Association (2019288), the Shanghai Pudong New Area Science and Technology Development Fund (PKJ2019-C01), and the Strategic Priority Research Program of the Chinese Academy of Sciences (XDA21021202).

Institutional Review Board Statement

Not applicable.

Informed Consent Statement

Not applicable.

Data Availability Statement

Data is contained within the article.

Conflicts of Interest

The authors declare no conflict of interest.

References

  1. Guo, H.; Adukure, A.R.; Iglesias, P. Effect of Ionicity of Three Protic Ionic Liquids as Neat Lubricants and Lubricant Additives to a Biolubricant. Coatings 2019, 9, 713. [Google Scholar] [CrossRef] [Green Version]
  2. Liao, M.; Nicolini, P.; Du, L.; Yuan, J.; Wang, S.; Yu, H.; Tang, J.; Cheng, P.; Watanabe, K.; Taniguchi, T.; et al. UItra-low friction and edge-pinning effect in large-lattice-mismatch van der Waals heterostructures. Nat. Mater. 2022, 21, 47–53. Available online: https://www.nature.com/articles/s41563-021-01058-4 (accessed on 6 January 2023). [CrossRef]
  3. Wang, J.; Li, Z.; Xu, Y.; Hu, W.; Zheng, G.; Zheng, L.; Ren, T. Synthesis and Tribological Behavior of Bridged Bicyclic Polymers as Lubricants. Ind. Eng. Chem. Res. 2022, 169, 107458. [Google Scholar] [CrossRef]
  4. Uzoma, P.C.; Hu, H.; Khadem, M.; Penkov, O.V. Tribology of 2D Nanomaterials: A Review. Coatings 2020, 10, 897. [Google Scholar] [CrossRef]
  5. Wang, Y.; Zhang, T.; Qiu, Y.; Guo, R.; Xu, F.; Liu, S.; Ye, Q.; Zhou, F. Nitrogen-doped porous carbon nanospheres derived from hyper-crosslinked polystyrene as lubricant additives for friction and wear reduction. Tribol. Int. 2022, 169, 107458. [Google Scholar] [CrossRef]
  6. Yaqoob, H.; Teoh, Y.H.; Sher, F.; Jamil, M.A.; Nuhanovi, M.; Razmkhah, O.; Erten, B. Tribological behaviour and lubricating mechanism of tire pyrolysis oil. Coatings 2021, 11, 386. [Google Scholar] [CrossRef]
  7. Pandey, P.; Somers, A.; Hait, S.; Ramakumar, S. Synthesis of oil miscible novel silane functionalised imidazoline-based ILs as lubricant additives: Characterization and tribological evaluations. Tribol. Int. 2022, 70, 25. Available online: https://link.springer.com/article/10.1007/s11249-022-01567-6 (accessed on 6 January 2023). [CrossRef]
  8. Zhang, X.J.; Liu, X.X.; Zhang, X.H.; Tian, Y.; Meng, Y.G. Ordering of the 7CB liquid crystal induced by nanoscale confinement and boundary lubrication. Liq. Cryst. 2012, 39, 1305–1313. [Google Scholar] [CrossRef]
  9. Peng, J.F.; Shen, M.X.; Cai, Z.B. Nano Diesel Soot Particles Reduce Wear and Friction Performance Using an Oil Additive on a Laser Textured Surface. Coatings 2018, 8, 89. [Google Scholar] [CrossRef] [Green Version]
  10. Zhang, Z.; Demir, K.G.; Gu, G.X. Developments in 4D-printing: A review on current smart materials, technologies, and applications. Int. J. Smart. Nano. Mat. 2019, 10, 205–224. [Google Scholar] [CrossRef]
  11. Jeong, U.; Yin, Y. Smart and responsive micro and nanostructured materials. Adv. Funct. Mater. 2020, 30, 1907059. [Google Scholar] [CrossRef]
  12. Huang, C.Y. Effect of Thicknesses of Liquid Crystal Layers on Shift of Resonance Frequencies of Metamaterials. Coatings 2021, 11, 578. [Google Scholar] [CrossRef]
  13. Guo, Y.M.; Li, J.S.; Zhou, X.J.; Tang, Y.Z.; Zeng, X.Q. Formulation of lyotropic liquid crystal emulsion based on natural sucrose ester and its tribological behavior as novel lubricant. Friction 2022, 10, 1879–1892. Available online: https://link.springer.com/article/10.1007/s40544-021-0565-6 (accessed on 6 January 2023). [CrossRef]
  14. Chiang, W.F.; Lu, Y.Y.; Chen, Y.P.; Lin, X.Y.; Huang, C.Y. Passively Tunable Terahertz Filters Using Liquid Crystal Cells Coated with Metamaterials. Coatings 2021, 11, 381. [Google Scholar] [CrossRef]
  15. Yang, J.; Yuan, Y.; Li, K.; Amann, C.W.; Yuan, C.Q.; Neville, A. Ultralow friction of 5CB liquid crystal on steel surfaces using a 1,3-diketone additive. Wear 2021, 480–481, 203934. [Google Scholar] [CrossRef]
  16. Mokshin, V. Tribological capabilities of chiral nematic liquid crystal additives in mineral motor oil. Adv. Mech. Eng. 2020, 12, 1–9. [Google Scholar] [CrossRef]
  17. Ghosh, P.; Upadhyay, M.; Das, M.K. Studies on the additive performance of liquid crystal blended polyacrylate in lubricating oil. Liq. Cryst. 2013, 41, 30–35. [Google Scholar] [CrossRef]
  18. Nakano, K. Scaling Law on Molecular Orientation and Effective Viscosity of Liquid-Crystalline Boundary Films. Tribol. Lett. 2003, 14, 17–24. [Google Scholar] [CrossRef]
  19. Novotná, V.; Hamplová, V.; Kapar, M.; Glogarová, M. New chlorine-substituted ferroelectric liquid crystals with four aromatic rings in the mesogenic core. Liq. Cryst. 2002, 29, 1435–1439. [Google Scholar] [CrossRef]
  20. Gao, M.; Ma, L.; Luo, J.B. Effect of alkyl chain length on the orientational behavior of liquid crystals nano-film. Tribol. Lett. 2016, 62, 24. [Google Scholar] [CrossRef]
  21. Qiao, X.X.; Zhang, X.J.; Guo, Y.B.; Yang, S.K.; Tian, Y.; Meng, Y.G. Boundary layer viscosity of CNT-doped liquid crystals: Effects of phase behavior. Rheol. Acta. 2013, 52, 939–947. [Google Scholar] [CrossRef]
  22. Hird, M. Fluorinated liquid crystals—Properties and applications. Chem. Soc. Rev. 2007, 36, 2070. [Google Scholar] [CrossRef] [PubMed]
Figure 1. (a) 1H NMR of LC-A; (b) 13C NMR of LC-A; (c) 1H NMR of LC-D; (d) 13C NMR of LC-D; (e) 1H NMR of LC-Z; and (f) 13C NMR of LC-Z.
Coatings 13 00168 g001
Figure 2. Fourier transform infrared of LC-A, LC-D, and LC-Z.
Coatings 13 00168 g002
Figure 3. Model schematic of UMT-TriboLab friction and wear tester.
Coatings 13 00168 g003
Figure 4. DSC thermograms of LCs: (a) LC-A; (b) LC-D; and (c) LC-Z.
Coatings 13 00168 g004
Figure 5. (a) Schlieren texture of LC-A at 65.9 °C; (b) fan-shaped focal conic texture of LC-D at 100.6 °C; and (c) focal conic texture of LC-Z at 56.5 °C.
Coatings 13 00168 g005
Figure 6. Thermogravimetric analysis curve of LC-A, LC-D, and LC-Z.
Coatings 13 00168 g006
Figure 7. The friction coefficients of TTO and TTO containing 2 wt% ZDDP, LC-A, LC-D, and LC-Z at different temperature points: (a) at 25 °C; (b) at 50 °C; (c) at 75 °C; (d) at 100 °C; (e) at 125 °C; (f) at 150 °C; (g) at 175 °C; and (h) at 200 °C.
Coatings 13 00168 g007
Figure 8. Average friction coefficient of pure TTO and TTO with 2 wt% ZDDP, LC-A, LC-D, and LC-Z under different temperature points.
Coatings 13 00168 g008
Figure 9. Width of wear scars of pure TTO and TTO with 2 wt% ZDDP, LC-A, LC-D, and LC-Z under different temperature points.
Coatings 13 00168 g009
Figure 10. SEM images of the wear surface after UMT tests at 100 °C: (a,a’) are TTO; (b,b’) are 2 wt% LC-A added to TTO; (c,c’) are 2 wt% LC-D added to TTO; and (d,d’) are 2 wt% LC-Z added to TTO.
Coatings 13 00168 g010
Figure 11. Raman spectra at wear marks after UMT: (a) TTO; (b)TTO + 2 wt% LC-A; (c) TTO + 2 wt% LC-D; and (d)TTO + 2 wt% LC-Z.
Coatings 13 00168 g011
Figure 12. The schematic representation of the lubrication mechanism.
Coatings 13 00168 g012
Table 1. Experimental parameters of the UMT-TriboLab friction and wear tester.
Load (N)Frequency (Hz)Time (min)Stroke Length (mm)
341010
Table 2. Phase-transition temperature of LCs.
SamplesTm (°C)Td (°C)ΔT 1 (°C)
LC-A33.7120.887.1
LC-D100.5100.90.4
LC-Z37.886.648.8
Disclaimer/Publisher’s Note: The statements, opinions and data contained in all publications are solely those of the individual author(s) and contributor(s) and not of MDPI and/or the editor(s). MDPI and/or the editor(s) disclaim responsibility for any injury to people or property resulting from any ideas, methods, instructions or products referred to in the content.

