Abstract
This article discusses the possibilities of two methods for monitoring Physical Vapor Deposition (PVD) process parameters: multi-grid probe, which makes it possible, in particular, to determine the energy distribution of ions of one- or two-component plasma and spectrum analyzer of the glow discharge plasma electromagnetic radiation signal based on the Prony–Fourier multichannel inductive spectral analysis sensor. The energy distribution curves of argon ions in the low-voltage operation mode of ion sources with closed electron current have been analyzed. With a decline in the discharge current, the average ion energy decreases, and the source efficiency (the ratio of the average ion energy W to the discharge voltage U) remains approximately at the same level of W/U ≈ 0.68, …, 0.71 in the operating voltage range of the source. The spectrum analyzer system can obtain not only the spectra at the output of the sensor, but also the deconvolution of the spectrum of the electromagnetic radiation signal of the glow discharge plasma. The scheme of a spectrum analyzer is considered, which can be used both for monitoring and for controlling the processing process, including in automated PVD installations.
1. Introduction
1.1. Method of Physical Vapor Deposition and Issues of Process Diagnostics
The processes of ion-plasma treatment and the deposition of coatings through the Physical Vapor Deposition (PVD) technology are actively used in various industries with the aim to increase surface hardness, resistance to wear and corrosion, and control of tribological parameters and optical properties of the products [1,2,3,4,5].
The PVD methods are an effective way to improve the working efficiency and prolong service life of metal-cutting tools and various parts of tool, chemical, machine-building, automotive, aviation, and medical industries. The methods of ion-plasma treatment of surfaces have a number of advantages over other coating deposition methods, including Chemical Vapor Deposition (CVD), spraying with electricity, thermal spraying, as well as electrolytic and galvanic methods [4,5]. In particular, the PVD method provides perfect adhesion to a wide range of various materials, both conductive and dielectric ones. The advantages of the PVD method also include the possibility of depositing high-quality coatings at considerably low temperatures (compared to the CVD methods), the possibility of using a wide range of coating compositions and structures, and the possibility of effectively controlling the parameters of a coating during its deposition [4,5].
When any method of surface modification and coating deposition is used, the key task is to ensure the quality and reproducibility of the results of the technology process carried out in accordance with the selected method. The PVD methods are based on the impact of high-energy flows of gas or metal plasma on the products. This exposure changes the structure and properties of the coating surface and its energy state, the degree of which depends on the type and mode of the treatment. The result of such exposure depends on many parameters that are difficult to control, including the chemical and phase composition and the structural state of the substrate material, which change during the exposure to the plasma flow [6,7,8]. The listed parameters directly depend on the energy characteristics of the plasma flow. When developing new technological devices for the deposition of PVD coatings and ion-plasma surface treatment, as well as for the control of the technology ion-plasma processes, it is necessary to use the methods of diagnostics and dynamic measurement of various physical properties of the surface and the parameters of plasma flows. Some of these methods are considered below.
1.2. Key Methods of Operational Control of the Deposition Process Parameters
The development of the PVD technologies and the modification of surfaces of solid bodies requires the study methods providing for the quick control of the state of the process and the results obtained at various stages of technology cycles.
Although the process of ion-plasma treatment of surfaces by the PVD method applies such standard control techniques as measurement of the arc current and bias voltage, the composition and pressure of the reaction gas, and the turntable rotation speed [9,10]. Due to the complexity of the ion-plasma treatment process and the variety of influencing factors, the mentioned control parameters are often not enough to ensure unambiguous reproducibility of the process results. The results of ion-plasma treatment are significantly affected by such factors as the spatial arrangement of samples, sizes and weight of technological equipment, the cathode wear degree, the condition of inner surface of the chamber, and a number of other parameters, the direct control of which is difficult or impossible [6,11,12,13,14,15,16,17]. Thus, there is a need for dynamic control of the plasma parameters and the state of the modified surface.
With regard to the operational control over the parameters of the ion-plasma treatment and the state of modified surfaces, the following considerably effective methods may be considered [18,19,20,21,22,23,24,25,26,27,28,29,30]:
- Langmuir probe methods [19,20,21,22];
- application of a charged particle energy analyzer (multigrid probe) [23,24,25];
- and use of a broadband spectrum analyzer based on a multichannel inductive sensor and Prony–Fourier (PF) spectral analysis.
Various technological ion-plasma processes of surface treatment and coating deposition in vacuum are determined mainly by the parameters of the plasma acting on the surface and the temperature of the very workpieces. Therefore, due to a change in the parameters of the environment, one technological cycle can cover various processes: an increase of the ion energy makes it possible to conduct ion cleaning, and a decrease of the ion energy ensures the deposition of coatings. The energy of ions bombarding the surface of the substrate is one of the most important parameters to be measured and controlled during the development of cleaning and etching technologies for various materials, as well as the PVD technologies [31,32,33,34,35,36]. The plasma density (concentration) and the temperature of electrons and ions determine the equilibrium temperature of the treated workpieces and, consequently, the diffusion processes and the processes of crystal structure growth on the surface of the treated workpieces.
The main parameters of the low temperature plasma generated by various electric discharges used in the technological processes of treating the surfaces of the workpieces in vacuum (glow discharge, magnetron discharge, vacuum arc discharge with a sacrificial cathode, etc.) include plasma density, electron temperature, ion energy, and ion current density on the surface of the workpieces [37,38]. The non-equilibrium nature and high-power density make plasma a considerably complex object to control and study.
There is a large number of diagnostic methods for determining various parameters of both high temperature and low temperature plasma. Of them, the most widely used are electromagnetic, spectral, microwave, and probe methods [39,40,41,42,43].
The spectral methods give accurate information for optically thin plasma, while for optically dense plasma, the information content of the method is low. Some alternative diagnostic methods are discussed in [44,45,46].
One of the most common methods used in scientific research and in the industrial practice are microwave methods [38,39,40]. Scattering of external high-frequency electromagnetic radiation on free electrons leads to a change in the frequency of scattering wave, the measurements of which determine the distribution function of particles according to their speeds, density, temperature, and directed velocity. Probe methods of diagnostics are the most common and easy to implement, allowing to determine the main parameters of ion-plasma flows necessary for the control of the PVD technological processes.
Physical processes in technological installations are often oscillatory in nature, so the universal model proposed by Bulgakov [47] can be used to describe them, and the Prony method [48,49] is the most acceptable for model identification in terms of physical adequacy and accuracy of approximation.
Estimating the parameters of an exponential signal is an important task, since the response of a linear system to an impulse action is the sum of just such signals. Thus, by evaluating the parameters of the signals at the output of the system, it is possible to solve the problem of identifying the system and its state. The use of the Fourier transform for this purpose does not always give acceptable results. This is due to the fact that the Fourier transform is intended to estimate the signal spectrum, not the frequency, and, moreover, in the classical version it is not statistically stable [50].
For non-stationary oscillations, spectral analysis is required, with which you can:
- perform spectral estimation of segments of time series without side effects in time windows of limited duration;
- use a non-stationary time series model (for example, increasing or decreasing in the time window);
- determine own frequency spectrum of a segment of the time series;
- and determine damping at natural frequencies.
Considering the above requirements, it seems promising to use the Prony method to determine the time-dependent damping spectra of non-stationary oscillations. When identifying the similarity of segments of a time series, there are not a number of restrictions inherent in the Fourier transform of time series [50].
The Langmuir probe measurements [19,20,21,22,41,51,52,53,54,55,56,57,58,59] are widely used low temperature plasma diagnostic methods. This method makes it possible to determine the main parameters of the low temperature plasma in the local region, including electron temperature, electron density, and ion current density, and, in some cases, to approximately estimate the ion temperature. Probe measurements are reliable, provided that the lengths of the particle path exceed the dimensions of the probe. Interpretation of data in the presence of considerably large magnetic fields and collisions is complicated. In accordance with the method Langmuir probe measurements, a small electrode—a probe—is placed in the plasma (to reduce disturbances caused in the plasma, the probe should be small) and its current-voltage curve is taken (the probe current value depending on its voltage), which is called the plasma probe characteristics. Probes can be in the form of a flat disk, a cylinder, or a sphere. A typical diameter is from 10−3 to 10−1 cm for a cylindrical probe and from 10−2 to 10−1 cm for a spherical probe. To take the plasma probe characteristics, it is important that the electrons have the energy distribution close to Maxwellian distribution, which is provided by the plasma of vacuum stationary discharges used in technological processes. The scope of the method for gas pressure covers the range from 10−2 to 102 Pa and from 107 to 105 cm3—for the concentration of charged particles.
This article discusses the possibilities of two methods for monitoring PVD process parameters:
- multi-grid probe, which makes it possible, in particular, to determine the energy distribution of ions of one- or two-component plasma generated by a vacuum arc evaporator;
- and spectrum analyzer of the glow discharge plasma electromagnetic radiation signal based on the Prony–Fourier multichannel inductive spectral analysis sensor.
2. Materials and Methods
2.1. The Langmuir Probe Measurements
To determine the parameters of the ionic component, a charged particle energy analyzer (multigrid probe) was used [60,61,62,63,64,65]. Figure 1 exhibits the method for measuring the energy of charged particles using a retarding potential energy analyzer [66].
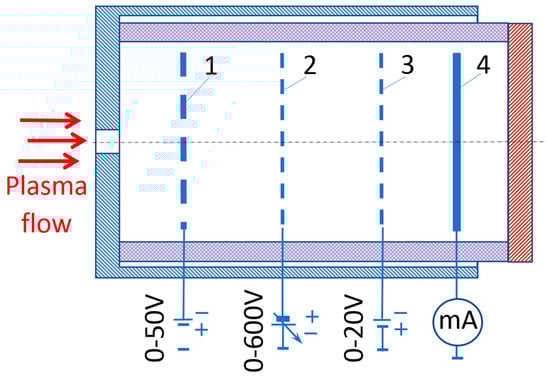
Figure 1.
Schematic diagram of multigrid analyzer probe [59]. 1—electron-intercepting grid, 2—analyzing (retarding) grid, 3—antidynatron grid, 4—collector.
In the course of measurements, the plasma enters the analyzer through the hole, and the increasing retarding potential, which decelerates the ions, is applied to the analyzing grid 2, while the electrons are intercepted by the grid 1. The ions with energy higher than the retarding potential barrier of the grid 2 form the current of the collector 4. Based on the measurement results, a retarding parameter—a curve of the collector current depending on the retarding potential—is being plotted. To determine the energy distribution function of particles (differential energy spectrum), it is necessary to differentiate the resulting retarding curve. To improve the accuracy of measurement, an antidynatron grid is used in the probe to suppress the secondary emission of electrons that occurs under the action of ion bombardment of the collector surface.
The disadvantages of the described method include:
- high sensitivity of the probe to its contamination;
- and when working with metal plasma, probes quickly fail, or their readings change due to the dust deposited on the input grid; the application of probes is complicated in the presence of considerably large magnetic fields in the plasma.
At high plasma densities, when the free paths of electrons and ions are short, the probe method is practically not applicable.
From the point of view of vacuum technologies for modifying surfaces of solid bodies, the advantage of the probe methods of analysis is in the possibility of integrating the probes, due to their small sizes, into the technological volumes and the possibility of carrying out operational control and adjusting the technological process.
A multigrid probe was used to determine the energy distributions of ions in the two-component plasma, generated by a vacuum arc evaporator with two evaporating electrodes similar to those described by Zelenkov et al. [67]. The device consists of an evaporable cathode, an evaporable anode, and a passive (non-evaporable) anode (see Figure 2).
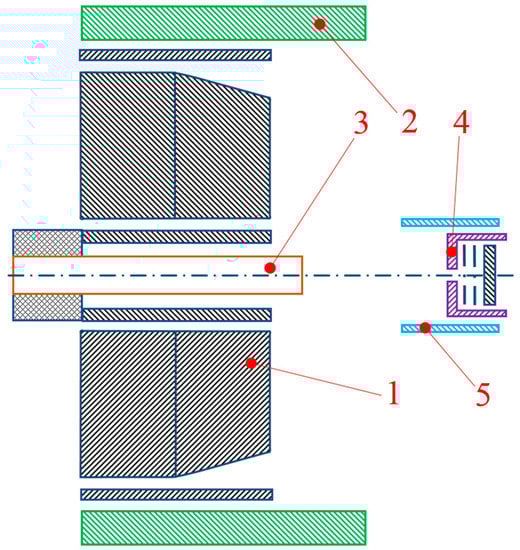
Figure 2.
Scheme of multigrid probe [67]. 1—cathode, 2—passive anode, 3—evaporable anode, 4—probe (energy analyzer), 5—screen.
2.2. Broadband Spectrum Analyzer
An effective method for analyzing the plasma electromagnetic radiation signal (in particular, the glow discharge plasma) is to use a broadband spectrum analyzer based on a multichannel inductive sensor, analog-to-digital converter (ADC), and Prony–Fourier (PF) spectral analysis. The mentioned spectrum analyzer may be used both for monitoring and for controlling the ion-plasma process of surface treatment of solid bodies, including in automated technological environments, with high reproducibility of results. Changes in the shape, amplitudes, and frequencies of the recorded electromagnetic pulses during the treatment process are closely related to the pulsations of the current in the discharge during the technological process of treatment. In particular, such method may be used to determine the moment when the PVD unit reaches the operating mode, to control the stages of surface thermal activation and coating deposition, as well as to promptly respond to deviations from the specified parameters of the technological process.
The wide use in recent decades of the resonance methods for the study of substances in gaseous, liquid, and solid states is justified by their universality [68,69,70,71,72,73]. The concept of resonance means an increase in the response of an oscillating system to a periodic external action when its frequency approaches one of the natural frequencies of the system. All oscillating systems are able to resonate and may have a very different nature. In the substances, such systems may be electrons, electron shells of atoms, magnetic and electric moments of atoms and molecules, impurity centers in crystals and individual crystals, as well as their groups. However, in all cases, the general picture of the resonance is preserved, that is, near the resonance, the amplitude of the oscillations and the energy, transferred to the oscillatory system from the outside, increase. This increase stops when the energy losses compensate for its gain.
Resonance methods can be attributed to the most sensitive and accurate methods for studying the substances (and, consequently, affecting them) [68,69,70]. The resonance methods allow obtaining various types of information about the chemical composition, structure, symmetry, and internal interactions between the structural units of a substance. A substance, depending on its internal structure, has its own unique set of natural oscillation frequencies (frequency or energy spectrum). Natural frequencies fk can be in a wide range from 102 to 1022 Hz. Such sets of frequencies is a kind of visiting card of the substance. Electromagnetic radiation is a common and effective type of periodic external action. The frequencies of electromagnetic waves are in the ranges of 102…108 Hz (radio waves), 109, …, 1011 Hz (radio microwaves), 1013, …, 1014 Hz (infrared light), 1015 Hz (visible light), 1015, …, 1016 Hz (ultraviolet light), 1017, …, 1020 Hz (X-ray emission), and 1020, …, 1022 Hz (γ-radiation).
Many researchers have proved [74,75,76,77] that the energy processes in plasma are of broadband nature with the frequency spectrum of 104, …, 1020 Hz, as a result of which it is almost impossible to cover it with one sensitive element. To meet this challenge, it is proposed to use a set of sensitive elements with some overlap of the probable frequency range of the process. Each of the elements may be considered as a linear filter tuned to the specific frequency subrange. In mathematical terms, this can be described as follows:
where Ωn is the frequency spectrum of the process; Ωi is a potential fragment of the process spectrum contained in the signal at the output of the ith sensitive element (of the coil).
where ar, is the amplitude; fk is the frequency; t is the time (sec); δk is the attenuation factor.
A computational experiment was carried out in order to check the efficiency of the spectral analysis process. A model signal, which is the sum of cosine waves and noise, was used as a test signal:
The values of natural frequencies and their corresponding amplitudes, which are the parameters of the model, are contained in Table 1.

Table 1.
Values of natural frequencies and their corresponding amplitudes, which are the parameters of the model.
To carry out experimental studies, a broadband spectrum analyzer of electromagnetic radiation from glow discharge plasma with time-frequency signal separation was developed. The spectrum analyzer (Figure 3) consists of a multichannel measuring unit, an analog-to-digital converter (ADC), and a software module, carrying out the Prony–Fourier (PF) spectral analysis [78,79,80,81,82,83,84].
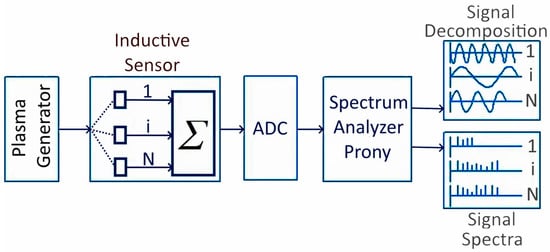
Figure 3.
Structural diagram of the broadband Prony spectrum analyzer of electromagnetic radiation from glow discharge plasma.
The measuring unit is made in the form of a set of 18 inductive sensors, which are coils of copper wire, evenly spaced along the periphery of a disk made of dielectric material. During the investigation, the measuring unit was installed at the viewing window of the vacuum chamber of the PVD unit [85,86,87]. To reduce the influence of external noise on the sensor, a screen in the form of a Faraday cup with grounding is installed on the unit body [84,85,86].
The measuring unit is a distributed system with multiple inputs which number is equal to the number of coils and one output. To identify the transfer function from each input to the output, a special procedure was developed, embedded in the software module. Each coil of the measuring unit possesses a set of natural frequencies and perceives (resonates) a certain spectrum of electromagnetic radiation of the glow discharge plasma, thus acting as a physical bandpass filter. Further, the signals coming from all the sensor coils are summed up and fed through one channel to the ADC and then to the Prony spectrum analyzer, which performs the frequency-time separation of the signal. At the output of the Prony spectrum analyzer, signal frequency estimates, an analytical Fourier spectrum, an analytical energy spectrum of a signal, and its analytical time decomposition over specified frequency ranges can be obtained.
3. Results and Discussion
3.1. Analysis of the Energy Distribution of Ions in Two-Component Plasma Using a Multigrid Probe
The retarding characteristics of ions were obtained at the pressure in the vacuum chamber of ~6 × 10⁻³ Pa and titanium cathode currents reaching 180 A and 300 A. The magnitude of the magnetic field near the cathode surface did not exceed 8 × 10⁻⁴ T. The probe was installed at a distance of 150 mm from the cathode cutoff. Figure 4 exhibits the energy distribution of titanium ions.
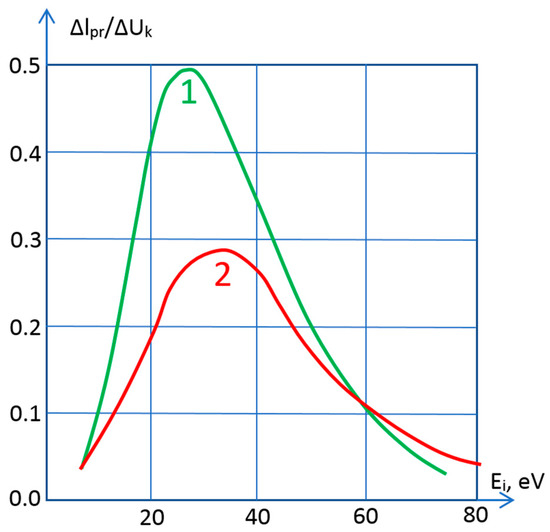
Figure 4.
Energy distribution of titanium ions. 1—discharge current of 180 A, 2—discharge current of 300 A.
At arc currents of 150, …, 180 A, the average energy of titanium ions was ~35, …, 40 eV, and at current of 300 A, the ion energy decreased to ~30 eV. The average ion energy decreases, as with an increase in the arc discharge current, the number of high-energy ions in the plasma flow decreases, and the energy of titanium ions shifts to lower values. This occurs due to an increase in the evaporation rate and plasma concentration and, consequently, the degree of plasma flow randomness in the near-cathode region due to an increase in the number of particle collisions.
In case of sublimating materials with high saturated vapor pressure (C, Cr), an evaporable anode was made in the form of a rod. An anode in the form of a crucible made of refractory materials was used in case of substances with low vapor pressure. In the describe case, the anode was a rod 6 mm in diameter made of spectrally pure carbon. To isolate graphite plasma ions from the two-component plasma, a screen was installed in front of the probe diaphragm, at a distance of 50 mm from the cathode surface, under a floating potential, which prevented titanium ions generated by the cathode spot from entering the analyzer. The probe characteristics were taken at two values of the electron current to the evaporable anode: 70 A and 120 A. In both cases, the cathode current was 150 A. The burning voltage of the arc discharge with the evaporable graphite anode was 40–43 V when the anode current varied from 50 to 150 A, respectively. The energy distribution curves of carbon ions generated by the evaporable anode are exhibited in Figure 3.
The energy spectrum of the ions of the cathode material almost coincides with the spectrum of ions during the operation of the arc evaporator in the normal mode without a sacrificial anode.
The estimative analysis of the spectrum of carbon ions generated by the anode (Figure 5) finds that with an increase in the anode current, the average energy of carbon ions decreases noticeably. Therefore, when the anode current is 70 A, the average ion energy reaches ~15, …, 18 eV, and as the current increases to 120 A, it decreases to ~9, …, 10 eV.
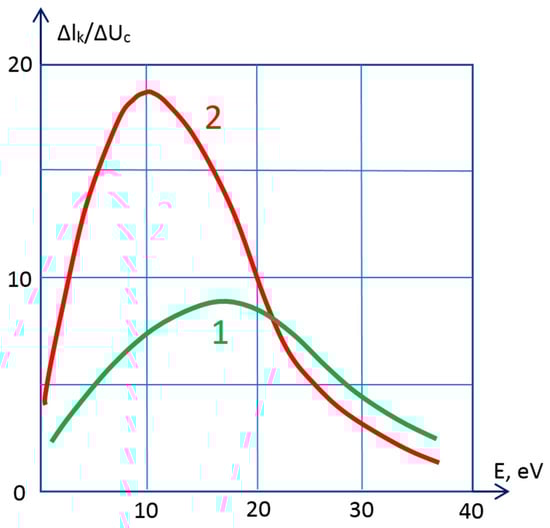
Figure 5.
Energy distribution of carbon ions. 1—anode current of 70 A, 2—anode current of 120 A.
The effect of the decrease in the energy of graphite ions may occur, as with an increase in the anode current, the temperature of the anode surface, the rate of evaporation of graphite, and, consequently, the density of plasma and vapor increase. The growth of the plasma density and, importantly, vapor density leads to a decrease in the degree of plasma ionization and an increase in the randomness of particle motion in the plasma flow due to an increase in the number of collisions of ions with particles having thermal velocities. This is confirmed by the fact that at low anode currents, not exceeding 70 A, the average energy of graphite ions correlates well with the anode potential.
3.2. Plotting Curves of the Distribution of Argon Ions Using a Source of Gas Ions with Closed Electron Current
Gas ion sources with a closed electron current are an effective tool for the implementation of ionic surface treatment processes [88,89,90,91,92]. Technological ion sources are used for cleaning and activating the surface of products before applying thin-film coatings, ion assistance in the processes of coating deposition, ion-beam etching, and shaping.
There is a high-voltage mode of operation of ion sources with the discharge voltage from 600 to 3000 V and higher and a low-voltage mode with the voltage usually up to 300–500 V. The first mode is usually applied in the processes of depositing thin layers by target sputtering and for cleaning and etching surfaces. The second mode is used in the processes of coating deposition with etching and in the processes of ion cleaning. The energy of accelerated ions generated by a source is determined by the operating voltage of the discharge. Figure 6 depicts the energy distribution curves of argon ions depending on the discharge voltage for the low-voltage mode of operation of the ion source, obtained using a multigrid probe [93,94,95].
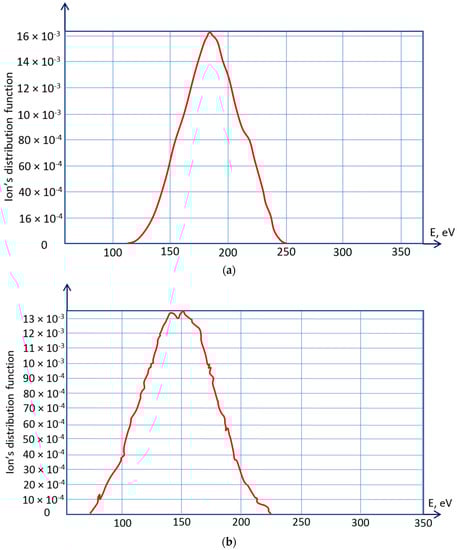
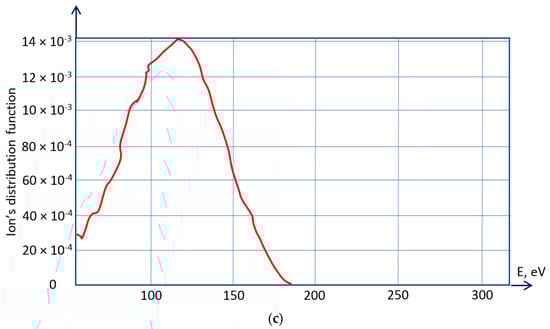
Figure 6.
Distribution curves of argon ions depending on the energy of the low-voltage ion source. At discharge voltage of: (a) −250 V, (b) −230 V, (c) −200 V.
It can be noted from the curves that the average ion energy decreases with a decline in the discharge current, and the source efficiency (the ratio of the average ion energy W to the discharge voltage U) remains approximately at the same level in the operating voltage range of the source ions.
For carrying out the processes of coating deposition with etching, an energy value from 100 to 200 eV is sufficient. A built-in multigrid probe analyzer of ion energy may be used to adjust the technological processes of ion processing. For some ion treatment processes (for example, surface cleaning), the above ion energy is not enough. To increase the energy of the bombarding ions and improve the efficiency of etching and cleaning, a negative potential (bias potential) can be applied to the substrate.
3.3. Spectrum Analyzer of the Signal of Electromagnetic Radiation of Glow Discharge Plasma Based on Multichannel Inductive Sensor
Figure 7 exhibits a graphical relationship between the oscillatory process synthesized in accordance with relationship (3) and Table 1.
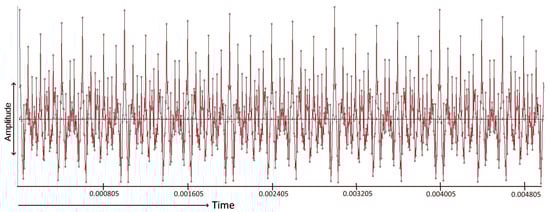
Figure 7.
Relationship between the synthesized test signal of the oscillatory process and the time.
Since the linear bandpass filters in the model signal are tuned to the following frequency subranges: (5, …, 18), (18, …, 40), (40, …, 120) kHz, then its analytical decomposition is tuned to the corresponding subranges. The results of the analytical modal decomposition are presented in Figure 8. The left side of the figure shows graphs displaying all modes from the corresponding specified frequency, and the right side of the spectrum is A2, squared Prony amplitudes [85,87].
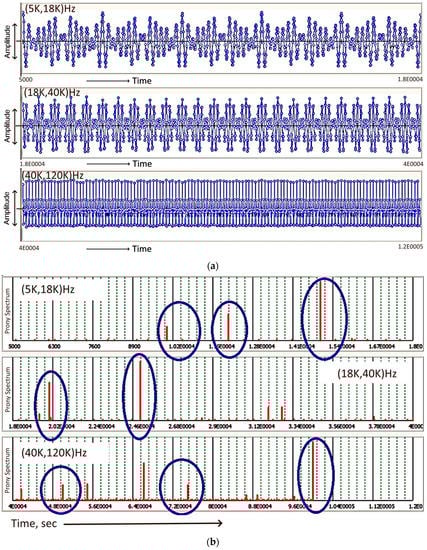
Figure 8.
Decomposition of the signal by the frequency subbands of the sensors. (a) time signal, (b) its A2—the Prony spectrum. Model signal modes are circled with blue ovals [79,80].
Modes of the model signal are selected on the A2 Prony spectrum (circled with blue ovals), and the remaining methods correspond to the random component or are mathematical models, that is, they are not actually present in the signal, but appear as a result of signal approximation.
Figure 9 shows a stabilization diagram for the frequency estimates of the model signal. The stabilization diagram in this case of estimates of natural frequencies shows the stability of the appearance of a mode with the corresponding natural frequency for a given order (maximum number of modes) of the approximation model (1). Physical modes i.e., actually present in the signal are characterized by vertical lines already after the number of modes equal to 15. The stabilization diagram clearly showed modes with model frequencies, namely: 10, 12, 15, 20, 25, 50, 75, and 100 kHz.
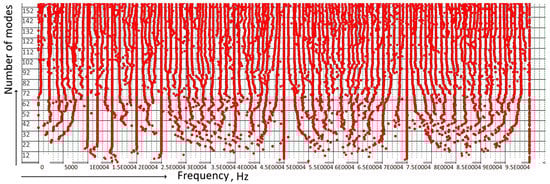
Figure 9.
Stabilization diagram for frequency estimates of the model process. The horizontal axis exhibits frequency, and the vertical axis—the number of modes (model complexity), i.e., the number of components in the approximation model, which may be much larger than in the original test model.
Figure 10 shows the analytical Fourier spectrum of the total model time signal, the spectral lines of which correspond with high accuracy to the original natural frequencies of the model. The analytical Fourier spectrum (Prony–Fourier spectrum) is the result of the analytical integration of the signal model (1) obtained as a result of the Prony approximation procedure [86,87]. The analytical Prony–Fourier spectrum has an increased resolution compared to conventional discrete Fourier transforms.
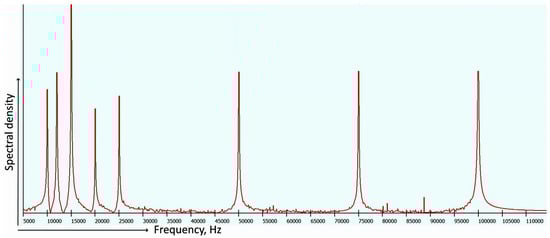
Figure 10.
Spectrum of the total model signal.
Figure 11 shows a graphical dependence of the recorded changes in the electromagnetic radiation of the glow discharge plasma, obtained at the output of the ADC during the processing in the PVD installation, and in Figure 12a,b, respectively, the analytical Fourier spectrum (spectral density) and the analytical energy spectrum of the signal after processing in the Prony spectrum analyzer.
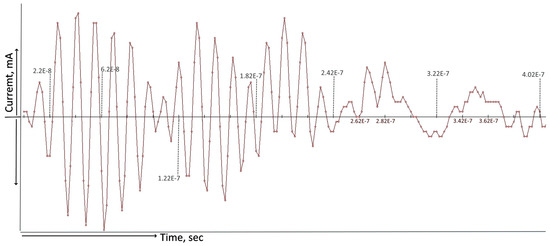
Figure 11.
Graphical relationship between the changes in the electromagnetic radiation from the glow discharge plasma obtained at the output of the ADC.
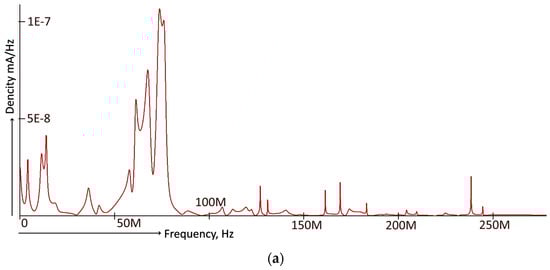
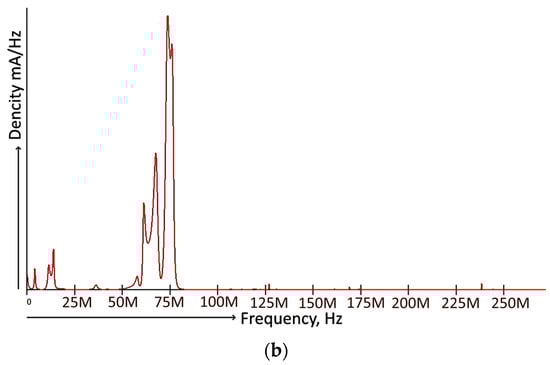
Figure 12.
(a) Analytical Fourier spectrum of the signal at the output of the Prony spectrum analyzer (relationship between the amplitude spectrum of the signal (density mA/Hz) and frequency, Hz) and (b) its energy spectrum.
An analysis of the spectra presented in Figure 12 shows that their structure is saturated and contains several clearly distinguishable frequencies, i.e., at a qualitative level, it is quite consistent with the ongoing physical processes. For final conclusions about the effectiveness of the proposed scheme of the spectrum analyzer, additional experimental studies are planned.
4. Conclusions
The article describes the main advantages and disadvantages of the methods in relation to the continuity of vacuum technological processes directed to modification of surfaces of solid bodies.
- The advantage of the probe methods for plasma diagnostics is the information content and ease of their adaptation to technological equipment.
- The possibility of determining the energy distribution of ions in the two-component plasma has been described. The energy distribution curves of ions in the two-component plasma generated by a vacuum arc evaporator with sacrificial cathode and anode have been plotted.
- Energy distribution curves of argon ions in the low-voltage mode of operation of ion sources with a closed electron current have been analyzed. The average ion energy decreases with a decline in the discharge current, and the source efficiency (the ratio of the average ion energy W to the discharge voltage U) remains approximately at the same level of W/U ≈ 0.68, …, 0.71 in the operating voltage range of the source.
- A scheme of a spectrum analyzer is proposed, which can be used both for monitoring and for controlling the processing process, including in automated PVD installations.
- The proposed magnetic induction method for monitoring the glow discharge plasma parameters can be used to determine the moment the PVD facility enters the operating mode and completes the process steps, as well as to perform operational intervention in the process, taking into account changes in electromagnetic pulses.
- The proposed electromagnetic radiation signal spectrum analyzer based on a multichannel inductive sensor makes it possible to analyze broadband plasma electromagnetic radiation signals with the possibility of obtaining not only spectra at the sensor output, but also deconvolution of the glow discharge plasma electromagnetic radiation signal spectrum.
Thus, it can be argued that the proposed scheme of the spectrum analyzer is fundamentally operable, however, its verification requires specially planned experiments.
Author Contributions
Conceptualization, S.D. and A.V.; methodology, V.Z.; investigation, S.D., C.S. and V.Z.; resources, S.G.; data curation, A.V.; writing—original draft preparation, A.V., S.D. and V.Z.; writing—review and editing, A.V.; project administration, S.G.; funding acquisition, S.G. All authors have read and agreed to the published version of the manuscript.
Funding
This work was supported financially by the Ministry of Science and Higher Education of the Russian Federation (project No FSFS-2021-0003).
Institutional Review Board Statement
Not applicable.
Informed Consent Statement
Not applicable.
Data Availability Statement
Not applicable.
Conflicts of Interest
The authors declare no conflict of interest.
References
- Helmersson, U.; Lattemann, M.; Bohlmark, J.; Ehiasarian, A.P.; Gudmundsson, J.T. Ionized physical vapor deposition (IPVD): A review of technology and applications. Thin Solid Film. 2006, 513, 1–24. [Google Scholar] [CrossRef]
- Mehran, Q.M.; Fazal, M.A.; Bushroa, A.R.; Rubaiee, S. A Critical Review on Physical Vapor Deposition Coatings Applied on Different Engine Components. Crit. Rev. Solid State Mater. Sci. 2018, 43, 158–175. [Google Scholar] [CrossRef]
- Baptista, A.; Silva, F.; Porteiro, J.; Míguez, J.; Pinto, G. Sputtering physical vapour deposition (PVD) coatings: A critical review on process improvement andmarket trend demands. Coatings 2018, 8, 402. [Google Scholar] [CrossRef]
- Choy, K.L. Chemical vapour deposition of coatings. Prog. Mater. Sci. 2003, 48, 57–170. [Google Scholar] [CrossRef]
- Grigoriev, S.; Vereschaka, A.; Milovich, F.; Tabakov, V.; Sitnikov, N.; Andreev, N.; Sviridova, T.; Bublikov, J. Investigation of multicomponent nanolayer coatings based on nitrides of Cr, Mo, Zr, Nb, and Al. Surf. Coat. Technol. 2020, 401, 126258. [Google Scholar] [CrossRef]
- Lewis, A.S.; Brown, S.D.; Tutwiler, R.L. Unified control approach for an electron beam physical vapour deposition process. Int J. Robot. Autom. 2000, 15, 145–151. [Google Scholar]
- Metel, A.S.; Grigoriev, S.N.; Melnik, Y.A.; Bolbukov, V.P. Broad beam sources of fast molecules with segmented cold cathodes and emissive grids. Instrum. Exp. Tech. 2012, 55, 122–130. [Google Scholar] [CrossRef]
- Metel, A.; Grigoriev, S.; Melnik, Y.; Panin, V.; Prudnikov, V. Cutting Tools Nitriding in Plasma Produced by a Fast Neutral Molecule Beam. Jpn. J. Appl. Phys. 2011, 50, 08JG04. [Google Scholar] [CrossRef]
- Volosova, M.A.; Grigor’ev, S.N.; Kuzin, V.V. Effect of Titanium Nitride Coating on Stress Structural Inhomogeneity in Oxide-Carbide Ceramic. Part 4. Action of Heat Flow. Refract. Ind. Ceram. 2015, 56, 91–96. [Google Scholar] [CrossRef]
- Vereschaka, A.; Tabakov, V.; Grigoriev, S.; Sitnikov, N.; Milovich, F.; Andreev, N.; Sotova, C.; Kutina, N. Investigation of the influence of the thickness of nanolayers in wear-resistant layers of Ti-TiN-(Ti,Cr,Al)N coating on destruction in the cutting and wear of carbide cutting tools. Surf. Coat. Technol. 2020, 385, 125402. [Google Scholar] [CrossRef]
- Colombo, D.A.; Echeverría, M.D.; Moncada, O.J.; Massone, J.M. PVD TiN and CrN coated austempered ductile iron: Analysis of processing parameters influence on coating characteristics and substrate microstructure. ISIJ Int. 2012, 52, 121–126. [Google Scholar] [CrossRef]
- Grigoriev, S.; Vereschaka, A.; Zelenkov, V.; Sitnikov, N.; Bublikov, J.; Milovich, F.; Andreev, N.; Mustafaev, E. Specific features of the structure and properties of arc-PVD coatings depending on the spatial arrangement of the sample in the chamber. Vacuum 2022, 200, 111047. [Google Scholar] [CrossRef]
- Grigoriev, S.; Vereschaka, A.; Zelenkov, V.; Sitnikov, N.; Bublikov, J.; Milovich, F.; Andreev, N.; Sotova, C. Investigation of the influence of the features of the deposition process on the structural features of microparticles in PVD coatings. Vacuum 2022, 202, 111144. [Google Scholar] [CrossRef]
- Khoroshikh, V.M.; Leonov, S.A.; Belous, V.A. Influence of substrate geometry on ion-plasma coating deposition process. In Proceedings of the International Symposium on Discharges and Electrical Insulation in Vacuum, ISDEIV 2, Bucharest, Romania, 15–19 September 2008; Volume 4676863, pp. 591–594. [Google Scholar]
- Grigoriev, S.N.; Melnik, Y.A.; Metel, A.S.; Panin, V.V.; Prudnikov, V.V. Broad beam source of fast atoms produced as a result of charge exchange collisions of ions accelerated between two plasmas. Instrum. Exp. Tech. 2009, 52, 602–608. [Google Scholar] [CrossRef]
- Grigoriev, S.N.; Teleshevskii, V.I. Measurement problems in technological shaping processes. Meas. Tech. 2011, 54, 744–749. [Google Scholar] [CrossRef]
- Grigoriev, S.; Melnik, Y.; Metel, A. Broad fast neutral molecule beam sources for industrial scale beam-assisted deposition. Surf. Coat. Technol. 2002, 156, 44–49. [Google Scholar] [CrossRef]
- Bagotsky, V.S. Fundamentals of Electrochemistry; Willey Interscience: Hoboken, NJ, USA, 2006. [Google Scholar]
- Popov, T.K.; Dimitrova, M.; Ivanova, P.; Kovačič, J.; Gyergyek, T.; Dejarnac, R.; Stöckel, J.; Pedrosa, M.A.; López-Bruna, D.; Hidalgo, C. Advances in Langmuir probe diagnostics of the plasma potential and electron-energy distribution function in magnetized plasma. Plasma Sources Sci. Technol. 2016, 25, 033001. [Google Scholar] [CrossRef]
- Bilik, N.; Anthony, R.; Merritt, B.A.; Aydil, E.S.; Kortshagen, U.R. Langmuir probe measurements of electron energy probability functions in dusty plasmas. J. Phys. D 2015, 48, 105204. [Google Scholar] [CrossRef]
- Tanışlı, M.; Şahin, N.; Demir, S. An investigation on optical properties of capacitive coupled radio-frequency mixture plasma with Langmuir probe. Optik 2017, 142, 153–162. [Google Scholar] [CrossRef]
- Seo, D.-C.; Chung, T.-H. Observation of the transition of operating regions in a low-pressure inductively coupled oxygen plasma by Langmuir probe measurement and optical emission spectroscopy. J. Phys. D 2001, 34, 2854–2861. [Google Scholar] [CrossRef]
- Yuan, Y.; Bansky, J.; Engemann, J.; Brockhaus, A. Ion energy determination for r.f. plasma and ion beam using a multigrid retarding field analyser. Surf. Coat. Technol. 1995, 74–75 Pt 1, 534–538. [Google Scholar] [CrossRef]
- Mišina, M.; Musil, J. Plasma diagnostics of low pressure microwave-enhanced d.c. sputtering discharge. Surf. Coat. Technol. 1995, 74–75 Pt 1, 450–454. [Google Scholar] [CrossRef]
- Kitami, H.; Miyashita, M.; Sakemi, T.; Aoki, Y.; Kato, T. Quantitative analysis of ionization rates of depositing particles in reactive plasma deposition using mass-energy analyzer and Langmuir probe. Jpn. J. Appl. Phys. 2015, 54 (Suppl. S1), 01AB05. [Google Scholar] [CrossRef]
- Powers, E.J.; Caldwell, G.S. Fast-fourier-transform spectral-analysis techniques as a plasma fluctuation diagnostic tool. IEEE Trans. Plasma Sci. IEEE Nucl. Plasma Sci. Soc. 1975, 2, 261–272. [Google Scholar]
- Krebbers, R.; Liu, N.; Jahromi, K.E.; Nematollahi, M.; Harren, F.J.M.; Cristescu, S.M.; Khodabakhsh, A. Fourier transform spectroscopy based on a mid-infrared supercontinuum source for plasma study. Opt. InfoBase Conf. Pap. 2022, MF3C.4. [Google Scholar]
- Xie, W.; Jiang, W.; Gao, Y. Spectral analysis of Ar plasma-arc under different experimental parameters. Optik 2013, 124, 420–424. [Google Scholar] [CrossRef]
- Grigoriev, S.N.; Kozochkin, M.P.; Sabirov, F.S.; Kutin, A.A. Diagnostic Systems as Basis for Technological Improvement. Proc. CIRP 2012, 1, 599–604. [Google Scholar] [CrossRef]
- Grigoriev, S.; Metel, A. Plasma- and beam- assisted deposition methods. In Nanostructured Thin Films and Nanodispersion Strengthened Coatings; Nato Science Series, Series II: Mathematics, Physics and Chemistry; Springer: Dordrecht, The Netherland, 2004; Volume 155, pp. 147–154. [Google Scholar]
- Metel, A.S.; Grigoriev, S.N.; Melnik, Y.A.; Panin, V.V. Filling the vacuum chamber of a technological system with homogeneous plasma using a stationary glow discharge. Plasma Phys. Rep. 2009, 35, 1058–1067. [Google Scholar] [CrossRef]
- Abramov, A.S.; Vinogradov, A.Y.; Kosarev, A.I.; Smirnov, A.S.; Orlov, K.E.; Shutov, M.V. Study of ion bombardment of amorphous silicon films during plasma-chemical deposition in a high-frequency discharge. JTF 1998, 68, 52. [Google Scholar]
- Hamers, E.A.G.; Fontcuberta, I.; Morral, A.; Niikura, C.; Brenot, R.; Roca, I.; Cabarrocas, P. Contribution of ions to the growth of amorphous, polymorphous, and microcrystalline silicon thin films. J. Appl. Phys. 2000, 88, 3674–3688. [Google Scholar] [CrossRef]
- Pelhos, K.; Donnelly, V.M.; Kornblit, A.; Green, M.L.; van Dover, R.B.; Manchanda, L.; Hu, Y.; Morris, M.; Bower, E. Etching of high-k dielectric Zr1-xAlxOy films in chlorine-containing plasmas. J. Vac. Sci. Technol. A 2001, 19, 1361–1366. [Google Scholar] [CrossRef]
- Sungauer, E.; Pargon, E.; Mellhaoui, X.; Ramos, R.; Cunge, G.; Vallier, L.; Joubert, O.; Lill, T. Etching mechanisms of HfO2, SiO2, and poly-Si substrates in BCl3 plasmas. J. Vac. Sci. Technol. B 2007, 25, 1640–1646. [Google Scholar] [CrossRef]
- Pearton, S.J.; Abernathy, C.R.; Ren, F.; Lothian, J.R.; Wisk, P.W.; Katz, A. Dry and wet Etching Characteristics of InN, AIN, and GaN Deposited by Electron Cyclotron Resonance Metalorganic Molecular Beam Epitaxy. J. Vac. Sci. Technol. A 1993, 11, 1772. [Google Scholar] [CrossRef]
- Metel, A.; Bolbukov, V.; Volosova, M.; Grigoriev, S.; Melnik, Y. Equipment for deposition of thin metallic films bombarded by fast argon atoms. Instrum. Exp. Tech. 2014, 57, 345–351. [Google Scholar] [CrossRef]
- Hartfuss, H.J.; Geist, T.; Hirsch, M. Heterodyne methods in millimetre wave plasma diagnostics with applications to ECE, interferometry and reflectometry. Plasma Phys. Control Fusion 1997, 39, 1693–1769. [Google Scholar] [CrossRef]
- Thiry, D.; Konstantinidis, S.; Cornil, J.; Snyders, R. Plasma diagnostics for the low-pressure plasma polymerization process: A critical review. Thin Solid Film. 2016, 606, 19–44. [Google Scholar] [CrossRef]
- Williams, C.B.; Amais, R.S.; Fontoura, B.M.; Jones, B.T.; Nóbrega, J.A.; Donati, G.L. Recent developments in microwave-induced plasma optical emission spectrometry and applications of a commercial Hammer-cavity instrument. TrAC Trends Anal. Chem. 2019, 116, 151–157. [Google Scholar] [CrossRef]
- Schwabedissen, A.; Benck, E.C.; Roberts, J.R. Comparison of electron density measurements in planar inductively coupled plasmas by means of the plasma oscillation method and Langmuir probes. Plasma Sources Sci. Technol. 1998, 7, 119–129. [Google Scholar] [CrossRef]
- Welzel, S.; Hempel, F.; Hübner, M.; Lang, N.; Davies, P.B.; Röpcke, J. Quantum cascade laser absorption spectroscopy as a plasma diagnostic tool: An overview. Sensors 2010, 10, 6861–6900. [Google Scholar] [CrossRef]
- Benedikt, J.; Hecimovic, A.; Ellerweg, D.; Von Keudell, A. Quadrupole mass spectrometry of reactive plasmas. J. Phys. D 2012, 45, 403001. [Google Scholar] [CrossRef]
- Liu, C.; Ying, P. Theoretical study of novel B-C-O compounds with non-diamond isoelectronic. Chin. Phys. B 2022, 31, 026201. [Google Scholar] [CrossRef]
- Cheng, M.; Yan, X.; Cui, Y.; Han, M.; Wang, X.; Wang, J.; Zhang, R. An eco-friendly film of pH-responsive indicators for smart packaging. J. Food Eng. 2022, 321, 110943. [Google Scholar] [CrossRef]
- Wu, Y.; Zhao, Y.; Han, X.; Jiang, G.; Shi, J.; Liu, P.; Khan, M.Z.; Huhtinen, H.; Zhu, J.; Jin, Z.; et al. Ultra-fast growth of cuprate superconducting films: Dual-phase liquid assisted epitaxy and strong flux pinning. Mater. Today Phys. 2021, 18, 100400. [Google Scholar] [CrossRef]
- Bulgakov, B.V. Fluctuations; Publishing House of Technical and Theoretical Literature: Moscow, Russia, 1954; p. 891. [Google Scholar]
- Hauer, J.F.; Scharf, L.L. Initial results in prony analysis of power system response signals. IEEE Trans. Power Syst. 1990, 5, 80–89. [Google Scholar] [CrossRef]
- Hauer, J.F. Application of prony analysis to the determination of modal content and equivalent models for measured power system response. IEEE Trans. Power Syst. 1991, 6, 1062–1068. [Google Scholar] [CrossRef]
- Lobos, T.; Rezmer, J. Real-time determination of power system frequency. IEEE Trans. Instrum. Meas. 1997, 46, 877–881. [Google Scholar] [CrossRef]
- Lebedev, Y.A. Electrical Probes in Reduced Pressure Plasma; Institute of Petrochemical Synthesis, A.V. Topchiev RAS: Moscow, Russia, 2003. [Google Scholar]
- Raiser, Y.P. Physics of the Gas Discharge; Intellect Publishing House: Dolgoprudny, Russia, 2009. [Google Scholar]
- Demidov, V.I.; Kolokolov, N.B.; Kudryavtsev, A.A. Probe Methods for Studying Low-Temperature Plasma; Energoatomizdat: Moscow, Russia, 1996. [Google Scholar]
- Mott-Smith, H.; Langmuir, I. The theory of collectors in gaseous discharges. Phys. Rev. 1926, 28, 727–763. [Google Scholar] [CrossRef]
- Godyak, V.A.; Piejak, R.B.; Alexandrovich, B.M. Measurement of electron energy distribution in low-pressure RF discharges. Plasma Sources Sci. Technol. 1992, 1, 36–58. [Google Scholar] [CrossRef]
- Godyak, V.A.; Demidov, V.I. Probe measurements of electron-energy distributions in plasmas: What can we measure and how can we achieve reliable results? J. Phys. D 2011, 44, 233001. [Google Scholar] [CrossRef]
- Demidov, V.I.; Ratynskaia, S.V.; Rypdal, K. Electric probes for plasmas: The link between theory and instrument. Rev. Sci. Instrum. 2002, 73, 3409. [Google Scholar] [CrossRef]
- Irfan, Z.; Bashir, S.; Butt, S.H.; Hayat, A.; Ayub, R.; Mahmood, K.; Akram, M.; Batool, A. Evaluation of electron temperature and electron density of laser-Ablated Zr plasma by Langmuir probe characterization and its correlation with surface modifications. Laser Part. Beams 2020, 38, 84–93. [Google Scholar] [CrossRef]
- Li, P.; Hershkowitz, N.; Wackerbarth, E.; Severn, G. Experimental studies of the difference between plasma potentials measured by Langmuir probes and emissive probes in presheaths. Plasma Sources Sci. Technol. 2020, 29, 025015. [Google Scholar] [CrossRef]
- Kimura, H.; Odajima, K.; Sugie, T.; Maeda, H. Application of multigrid energy analyzer to the scrape-off layer plasma in DIVA. Jpn. J. Appl. Phys. 1979, 18, 2275–2281. [Google Scholar] [CrossRef]
- Ingram, S.G.; Braithwaite, N.S.J. Ion and electron energy analysis at a surface in an RF discharge. J. Phys. D 1988, 21, 1496. [Google Scholar] [CrossRef]
- Bohm, C.; Perrin, J. Retarding-field analyzer for measurements of ion energy distributions and secondary electron emission coefficients in low-pressure radio frequency discharges. Rev. Sci. Instrum. 1993, 64, 31. [Google Scholar] [CrossRef]
- Tonks, L.; Mott-Smith, H.M., Jr.; Langmuir, I. Flow of ions through a small orifice in a charged plate. Phys. Rev. 1926, 28, 104. [Google Scholar] [CrossRef]
- Cubric, D.; Kholine, N.; Konishi, I. Electron optics of spheroid charged particle energy analyzers. Nucl. Instrum. Methods Phys. Res. 2011, 645, 234–240. [Google Scholar] [CrossRef]
- Walker, C.G.H.; Zha, X.; El Gomati, M.M. A parallel acquisition charged particle energy analyser using a magnetic field. Surf. Interface Anal. 2017, 49, 34–46. [Google Scholar] [CrossRef]
- Veselovzorov, A.N.; Dlugach, E.D.; Pogorelov, A.A.; Svirsky, E.B.; Smirnov, V.A. Study of the formation of ion flows in variable electric fields of a stationary plasma engine. Tech. Phys. 2013, 83, 37–42. [Google Scholar]
- Dorodnov, A.M.; Zelenkov, V.V.; Kuznetsov, A.N. Stationary vacuum arc with two evaporated electrodes. Ther. Phys. High Temp. 1997, 35, 983–1008. [Google Scholar]
- Mohd Bahar, A.A.; Zakaria, Z.; Md Isa, A.A.; Ruslan, E.; Alahnomi, R.A. A review of characterization techniques for materials’ properties measurement using microwave resonant sensor. J. Telecommun. Electron. Comput. Eng. 2015, 7, 1–6. [Google Scholar]
- Itoh, T.; Yamamoto, Y.S. Between plasmonics and surface-enhanced resonant Raman spectroscopy: Toward single-molecule strong coupling at a hotspot. Nanoscale 2021, 13, 1566–1580. [Google Scholar] [CrossRef] [PubMed]
- Hafez, M.G.; Iqbal, S.A.; Asaduzzaman, N.; Hammouch, Z. Dynamical behaviors and oblique resonant nonlinear waves with dual-power law nonlinearity and conformable temporal evolution. Discrete Cont. Dyn. Syst.-S 2021, 14, 2245–2260. [Google Scholar] [CrossRef]
- Lewandowski, W.; Vaupotič, N.; Pociecha, D.; Górecka, E.; Liz-Marzán, L.M. Chirality of Liquid Crystals Formed from Achiral Molecules Revealed by Resonant X-Ray Scattering. Adv. Mater. 2020, 32, 1905591. [Google Scholar] [CrossRef]
- Mitrano, M.; Wang, Y. Probing light-driven quantum materials with ultrafast resonant inelastic X-ray scattering. Commun. Phys. 2020, 3, 184. [Google Scholar] [CrossRef]
- Cao, Y.; Feng, C.; Jakli, A.; Zhu, C.; Liu, F. Deciphering chiral structures in soft materials via resonant soft and tender X-ray scattering. Giant 2020, 2, 100018. [Google Scholar] [CrossRef]
- Pace, D.C.; Shi, M.; Maggs, J.E.; Morales, G.J.; Carter, T.A. Exponential frequency spectrum in magnetized plasmas. Phys. Rev. Lett. 2008, 101, 085001. [Google Scholar] [CrossRef]
- Pace, D.C.; Shi, M.; Maggs, J.E.; Morales, G.J.; Carter, T.A. Exponential frequency spectrum and Lorentzian pulses in magnetized plasmas. Phys. Plasmas 2008, 15, 122304. [Google Scholar] [CrossRef]
- Milaniak, N.; Audet, P.; Griffiths, P.R.; Massines, F.; Laroche, G. Interpretation of artifacts in Fourier transform infrared spectra of atmospheric pressure dielectric barrier discharges: Relationship with the plasma frequency between 300 Hz and 15 kHz. J. Phys. D 2020, 53, 015201. [Google Scholar] [CrossRef]
- Viktorov, M.E.; Ilichev, S.D. Method for Studying the Dynamics of Fast Frequency Sweeping Events in the Spectra of Non-Thermal Electromagnetic Plasma Emission. Radiophys. Quant. Electron. 2019, 62, 286–292. [Google Scholar] [CrossRef]
- Vladimirov, S.N.; Maydanovskiy, A.S. Comparative Analysis of Natural Fluctuations in Two Classes of Self-Excited Oscillatory Systems. Sov. J. Commun. Technol. Electron. 1987, 32, 69–75. [Google Scholar]
- Lv, H.; Liu, H.; Tan, Y.; Sun, Z. Improved methodology for identifying Prony series coefficients based on continuous relaxation spectrum method. Mater. Struct. 2019, 52, 86. [Google Scholar] [CrossRef]
- Xia, X.; Luo, A.; Luo, S.; Xu, J. Harmonic current detection based on improved extended Prony spectrum estimation. Dianli Zidonghua Shebei/Electr. Power Autom. Equip. 2010, 30, 6–11, 21. [Google Scholar]
- Marple Jr, S.L. Digital Spectral Analysis with Applications. J. Acoust. Soc. Am. 1989, 86, 2043. [Google Scholar] [CrossRef]
- Kirenkov, V.V.; Gusarov, S.V.; Dosko, S.I.; Volkov, N.V. Method for diagnosing the state of mechanical systems based on modal analysis in the time domain. Bull. Mstu Stank. 2012, 1, 90. [Google Scholar]
- Kukharenko, B.G. Spectral analysis technology based on fast Prony transform. Inform. Technol. 2008, 4, 38–42. [Google Scholar]
- Dosko, S.I.; Logvin, V.A.; Sheptunov, S.A.; Yuganov, E.V. Identification of the induction sensor model and deconvolution of the input signal spectrum. Sci.-Intensive Technol. Mech. Eng. 2018, 12, 32–38. [Google Scholar]
- Grigoriev, S.N.; Gurin, V.D.; Volosova, M.A.; Cherkasova, N.Y. Development of residual cutting tool life prediction algorithm by processing on CNC machine tool. Materwiss. Werksttech. 2013, 44, 790–796. [Google Scholar] [CrossRef]
- Grigoriev, S.N.; Sinopalnikov, V.A.; Tereshin, M.V.; Gurin, V.D. Control of parameters of the cutting process on the basis of diagnostics of the machine tool and workpiece. Meas. Tech. 2012, 55, 555–558. [Google Scholar] [CrossRef]
- Grigoriev, S.N.; Vereschaka, A.A.; Fyodorov, S.V.; Sitnikov, N.N.; Batako, A.D. Comparative analysis of cutting properties and nature of wear of carbide cutting tools with multi-layered nano-structured and gradient coatings produced by using of various deposition methods. Int. J. Adv. Manuf. Technol. 2017, 90, 3421–3435. [Google Scholar] [CrossRef]
- Alekseev, V.V.; Zelevkov, V.V.; Krivoruchko, M.M.; Keem, J.E. Ion Sorces. U.S. Patent 2004/0195521 A1, 7 October 2004. [Google Scholar]
- Han, C.; Rok Ahn, J.; Jung Ahn, S.; Joon Park, C. Optimization of closed ion source for a high-sensitivity residual gas analyzer. J. Vac. Sci. Technol. A 2014, 32, 021603. [Google Scholar] [CrossRef]
- Zhurin, V.V. Industrial Ion Sources: Broadbeam Gridless ion Source Technology; Wiley: Hoboken, NJ, USA, 2011; p. 326. [Google Scholar]
- Arnold, T.; Pietag, F. Ion beam figuring machine for ultra-precision silicon spheres correction. Precis Eng. 2015, 41, 119–125. [Google Scholar] [CrossRef]
- Shvydkiy, G.V.; Zadiriev, I.I.; Kralkina, E.A.; Vavilin, K.V. Acceleration of ions in a plasma accelerator with closed electron drift based on a capacitive radio-frequency discharge. Vacuum 2020, 180, 109588. [Google Scholar] [CrossRef]
- Hufner, S. Photoelectron Spectroscopy: Principles and Application; Springer: New York, NY, USA, 2003; p. 684. [Google Scholar]
- Roberts, A.J.; Macak, K.; Takahashi, K. Test of the Consistency of Angle Resolved XPS Data for Depth Profile Reconstruction using the Maximum Entropy Method. J. Surf. Anal. 2009, 15, 291–294. [Google Scholar] [CrossRef]
- Lu, S.; Yin, Z.; Liao, S.; Yang, B.; Liu, S.; Liu, M.; Yin, L.; Zheng, W. An asymmetric encoder–decoder model for Zn-ion battery lifetime prediction. Energy Rep. 2022, 8, 33–50. [Google Scholar] [CrossRef]


Disclaimer/Publisher’s Note: The statements, opinions and data contained in all publications are solely those of the individual author(s) and contributor(s) and not of MDPI and/or the editor(s). MDPI and/or the editor(s) disclaim responsibility for any injury to people or property resulting from any ideas, methods, instructions or products referred to in the content. |
© 2023 by the authors. Licensee MDPI, Basel, Switzerland. This article is an open access article distributed under the terms and conditions of the Creative Commons Attribution (CC BY) license (https://creativecommons.org/licenses/by/4.0/).