Abstract
In this study, the nature of the electrical transport and structural changes resulting from the systematic substitution of Al2O3 with K2O in 40P2O5-(25−x)Al2O3-35Na2O-xK2O, where x = 5.0, 7.5, 10.0, 12.5, and 15.0 mol% (PANxK), is investigated. The impact of the changes in glass structure and its correlation to electrical properties is presented. The mixed alkali effect (MAE) is observed due to the presence of two different alkali oxides, resulting in a non-monotonic trend in the studied glass properties. The infrared spectra show the shift and diminishing of the bands related to the P–O–P/P–O–Al bridges with increasing K2O content and changes in bands related to depolymerization of the glass network, which is confirmed by the trend of the Tg values. The minimum value of DC conductivity is obtained for glass with x = 12.5 mol%. With the overall increase in alkali content, the number of non-bridging oxygens increases, also affecting the conductivity values. Frequency-dependent conductivity spectra analyzed by Summerfield, Baranovskii-Cordes and Sidebottom scaling procedures revealed interesting features and signature of the MAE in the short-range dynamics of the potassium and sodium ions, both for individual glass composition and glass series as a whole. This study showed the impact of MAE and local glass structure on the electrical features and the prevailing of one effect over the other as a function of the glass composition. MAE dominates in a wider range, but with the significant increase in alkali content, MAE is consequently overpowered.
1. Introduction
Aluminophosphate glasses have remarkable functional properties which make them attractive for various fields of application, from optical and laser technology, and electrochemical devices, to nuclear waste immobilization and biomedicine [1,2,3]. Generally, the addition of aluminium oxide to phosphate glass increases the density, glass transition temperature, elastic modulus, and refractive index, improves chemical durability, and decreases the thermal expansion coefficient [4,5,6,7,8].
Furthermore, glasses containing two different alkali oxides have attracted considerable interest because of their interesting transport properties. In particular, the systematic replacement of one alkali oxide by another results in the non-monotonic change in ionic conductivity, known as the mixed alkali effect (MAE) [5,9,10,11,12,13,14,15,16,17]. The mixed alkali effect has been detected in various families of oxide glasses, including phosphate, borate [14], silicate [16], and aluminosilicate [15] glasses.
The physical origin of the non-monotonic trend in ionic conductivity in mixed alkali glasses has been extensively studied [11,18,19,20,21,22]. With the presumption of random distribution of different cation species in the glass matrix, ion jumps to a site adapted for another ion are hindered or blocked due to structural or energy mismatches, resulting in MAE in transport properties. One of the widely used MAE descriptions is the dynamic structure model (DSM) [23,24,25,26,27]. In DSM, an A ion will be prone to jump to a vacancy that was previously occupied by the same ion due to a correctly adjusted environment and will decline to jump to a vacant site previously occupied by a B ion, where the environment has to relax to accommodate the A ion. The probability of one ion being near a convenient site decreases with decreasing concentration [10]. Above the glass transition temperature, the site mismatch energies are considerably reduced due to the rapidly relaxing surroundings [28]. These ionic motions and structural relaxations in the glass network are responsible for changes in transport and other properties [23,24,25,26].
It has been primarily sodium and lithium ions that have been studied in ionically conducting aluminium phosphate glasses [10,11,12]. As a network modifier in phosphate glasses, aluminium forms P-O-Al bonds. As aluminium content increases, more covalent linkages are formed between Al and O, resulting in increased network strength [4,29]. Combining aluminium oxide with alkali oxide facilitates the incorporation of aluminium oxide in a wide range of compositions, which makes these glass systems interesting from an electrical property point of view.
This work aims to further investigate the quaternary glass system P2O5-Al2O3-Na2O-K2O that shows to be suitable for thermal device applications [5]. In this glass series, the potassium oxide gradually increases at the expense of Al2O3, while keeping the sodium oxide content constant at 35 mol%, which enables us to examine the potassium- and sodium-ion conductivity in correlation to the structural changes resulting from the depolymerization process in glass networks upon changes in the Al2O3 content. In addition, Impedance Spectroscopy was used to characterize these glasses in a wide range of temperatures and frequencies. The scaling properties of conductivity spectra, examined by application of Summerfield, Baranovskii-Cordes, and Sidebottom procedures, provided additional valuable information on the short-range dynamics of ions as well as on their translational movements (DC conductivity).
2. Materials and Methods
A series of glasses with batch composition 40P2O5-(25−x)Al2O3-35Na2O-xK2O, with x = 5.0, 7.5, 10.0, 12.5, 15.0 mol% was prepared by melt quenching technique which is described in detail in Ref. [5]. In summary, homogeneous mixtures of reagent grade precursors were melted at 1350 °C for 30 min, quenched between graphite plates, and heat-treated for 48 h at 350 °C to remove internal stresses.
Archimedes’ method, using distilled water as the immersion liquid, was employed to determine the glass density, ρ, at room temperature (RT) on the bulk samples. An average density was determined by measuring three samples of each glass composition. As a result, the molar volume of the glass is determined by VM = M/ρ, where M is the average molar weight of the glass. A Perkin Elmer Spectrum Two FT-IR Spectrometer was used at RT to record the spectrum of powder samples in the 4000–400 cm−1 region by using the Attenuated Total Reflectance (ATR) technique.
Using an impedance analyser (Novocontrol Alpha-AN Dielectric Spectrometer) at temperatures ranging from −90 to 240 °C, complex impedance was measured at frequencies from 0.01 Hz to 1 MHz. Temperatures were controlled to within 0.2 °C of accuracy. The complex non-linear least-squares (CNLLSQ) fitting procedure was applied to model the experimental impedance data. DC conductivity was calculated using the resistance values derived from the fitting procedures, R, and electrode dimensions (d is sample thickness and A is electrode area), σDC = d/(R × A).
A Keysight B2985A electrometer was used to measure thermally stimulated depolarization current using Novocontrol WinTSC 2.04 software. All glasses were polarized at 210 °C for 35 min, applying a voltage of 200 V, and the temperature range in which the depolarization current was measured was from −30 °C to 210 °C.
3. Results & Discussion
3.1. Physical Properties and Structure of Glasses
The composition of glasses, [K]/[K+Na] ratio, density, ρ, molar volume, VM, number density of mobile ions, Nv, and molar O/P ratio values are listed in Table 1. With the increase in K2O content up to 15.0 mol%, (increase in [K]/[K+Na] ratio), the glass density decreases linearly from 2.63 to 2.59 g cm−3, see Figure 1a, which is attributed to the substitution of the heavier oxide Al2O3 with K2O. Simultaneously, the molar volume increases with increasing K2O content.

Table 1.
Composition and selected physical parameters for 40P2O5-(25−x)Al2O3-35Na2O-xK2O, x = 5.0, 7.5, 10.0, 12.5 and 15.0 mol%, glasses.
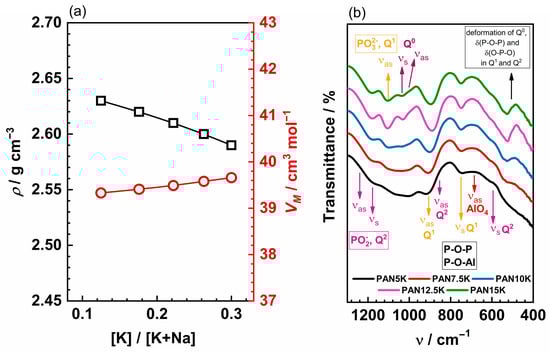
Figure 1.
(a) The density, ρ, and the molar volume, VM, as a function of the [K]/[K+Na] ratio and (b) IR-ATR spectra of glasses 40P2O5-(25−x)Al2O3-35Na2O-xK2O, with x = 5.0, 7.5, 10.0, 12.5, 15.0 mol%.
The addition of K2O and a simultaneous decrease in Al2O3 creates weaker and less packed glass network since the P-O-Al bonds are more covalent than P-O-P and P-O-K bonds [5]. Furthermore, a decrease in Tg from 413 to 381 °C, which occurs with increasing K2O content and the above-mentioned changes in the glass network, is yet another indicator of the network depolymerization [5]. In aluminophosphate glasses with an O/P ratio ≤3.5 the aluminium coordination is octahedral, whereas tetrahedrally coordinated Al is abundant in glasses with an O/P ratio greater than 3.5 [7,30,31]. The studies on AlP-based glasses that contain different types of alkali oxides and their mixtures, reveal that the structural changes induced by the addition of aluminium to the glass can affect the ionic conductivity of the glass [10,12,32]. IR-ATR spectra for all glasses are shown in Figure 1b and the band assignation is given in the Table 2.
IR-ATR spectra of all studied glasses consist of a medium-intense wide band in the range 800–1300 cm−1, a weak band in the range 700–800 cm−1 and a strong broad band between 400–700 cm−1. The wide band located in the higher wavenumber region, above 800 cm−1, contains several signals characteristic of symmetric and asymmetric stretching vibrations of Q2, Q1 and Q0 phosphate units that are associated with different alumina polyhedral units [33,34]. Signals attributed to asymmetric [6,35,36,37,38,39] and symmetric [6,35,39,40] stretching modes of PO2− groups in metaphosphate chains are found in the range 1150–1300 cm−1, whereas the band between 1060–1150 cm−1 corresponds to the symmetric stretching vibration of terminal PO32− groups in pyrophosphate anions [6,35,38,39,41]. Furthermore, the band in the spectral range of 965–1060 cm−1 consists of signals assigned to the orthophosphate asymmetric [6,35,39,42] and symmetric [6,35,40] stretching vibrations. The asymmetric stretching vibrations of P–O–P bridges in Q2 [6,35,39,41,42,43] and Q1 [6,35,39,41,42,43] units form a strong band in the range of 810–960 cm−1 along with the signals corresponding to stretching modes of P–O–Al bridging bonds connecting PO4 tetrahedra of Q2 and Q1 with AlO4 tetrahedra [33,34]. In the middle region, below 800 cm−1, the weak band with knee centred at ~690–750 cm−1 is a superposition of signals corresponding to the symmetric stretching vibration of P–O–P and P–O–Al bridges in Q1 (P2O7)4− dimer units (~750 cm−1), [6,33,34,35,36,39,40,41,43,44] as well as to stretching modes of O–Al–O bonds in AlO4 tetrahedra (~690 cm−1) [7,33,34,41,45]. Additionally, the symmetric stretching vibrations of P–O–P in Q2 units are located around 630 cm−1 [33,34,35,36,38,39,41,42,43]. Finally, the signals attributed to the bending of P–O–P and O–P–O bonds in Q2 and Q1 units contribute to the strong wide band in the lower wavenumber region together with the deformation modes of Q0 units and stretching modes of octahedral AlO6 [6,35,36,38,39,40,41,42,43,44].
Table 2.
IR-ATR assignation for the glass series 40P2O5-(25−x)Al2O3-35Na2O-xK2O, x = 5.0, 7.5, 10.0, 12.5 and 15.0 mol%.
Table 2.
IR-ATR assignation for the glass series 40P2O5-(25−x)Al2O3-35Na2O-xK2O, x = 5.0, 7.5, 10.0, 12.5 and 15.0 mol%.
| ν/cm−1 | Assignation | References |
|---|---|---|
| 1150–1300 | νas (PO−) and νs (PO−) in Q2 | [6,35,36,37,38,39,40] |
| 1060–1150 | νas (PO−) in Q1 | [6,35,38,39,40] |
| 965–1060 | νas (PO−) and νs (PO−) in Q0 | [6,35,39,40,42] |
| 810–960 | νas (P–O–P)/ν(P–O–Al) connecting PO4 tetrahedra in Q2 and Q1 with AlO4 tetrahedra | [6,33,34,35,39,41,42,43] |
| 690–750 | superposition of signals νs (P–O–P)/ν(P–O–Al) in Q1 units and νas/s (O–Al–O) in AlO4 tetrahedra | [6,7,33,34,35,36,39,40,41,43,44,45] |
| 630 | νs (P–O–P) in Q2 | [33,34,35,36,38,39,41,42,43] |
| <630 | bending (O–P–O/P–O–P) in Q2/Q1, deformation modes Q0 and stretching modes of octahedral AlO6 | [6,35,36,38,39,40,41,42,43,44] |
The gradual replacement of Al2O3 with K2O leads to the narrowing of the bands and a decrease in the number of bands attributed to vibrations of phosphate units connected to alumina units. This change is especially pronounced in the high-wavenumber region where three bands centred at ~1180 cm−1, ~1105 cm−1 and ~1030 cm−1 become well distinguished for higher K2O content (x > 10 mol%). This further indicates that the addition of K2O causes cleavage of P–O–Al bridging bonds and the depolymerization of phosphate chains which in turn produces more non-bridging oxygen and P–O–K bonds. This result agrees well with the thermal properties of these glasses and a decrease in their Tg value as shown in Table 1. In addition, the shift of the band related to P–O–P/P–O–Al bridges in Q1 and Q2 units from ~920 cm−1 to ~890 cm−1 with increasing K2O content can be correlated with the breaking of these bonds and formation of the weaker P–O–K bonds. The gradual narrowing of the band around 705 cm−1 related to the vibrations of P–O–P/P–O–Al bonds and diminishing of the signal at ~690 cm−1 related to AlO4 tetrahedra also suggests that an increase in K2O amount depolymerizes phosphate network by breaking the P–O–P and P–O–Al bridging bonds. At last, the rapid rise in the sharp band between 480–580 cm−1 related to the deformation of Q0 orthophosphate units also points to the depolymerization of the glass matrix. The changes observed in the IR-ATR spectra upon the substitution of Al2O3 for K2O are consistent with the results of Raman studies of the given glasses [5] and indicate depolymerization of the glass network upon the increase in K2O content. Moreover, a study of sodium and potassium AlP glasses showed that Al3+ is mainly six-coordinated when Al2O3 concentration is low, while it is mainly four-coordinated at higher concentrations [7,10,31]. In the PANxK glasses, the Al2O3 concentration is relatively high, ranging from 10 to 20 mol%. Therefore, we can conclude that AlO4 units constitute the dominating aluminium polyhedra in these glasses.
3.2. Ionic Conductivity-Long Range Transport (DC)
The conductivity isotherms of the glass PAN5K are shown in Figure 2a and are typical spectra for all PANxK glasses. Typically, isotherms exhibit two features: a plateau at lower frequencies corresponding to DC conductivity and dispersion at higher ones. The dispersive behaviour is more pronounced at lower temperatures and lower frequencies and shifts to the higher frequencies with the increase in temperature. As shown in Figure 2a, the low-frequency region of the spectra shows a slight decrease in conductivity above 180 °C in addition to the above-mentioned spectral features. This effect is called the electrode polarization and results from the accumulation of the potassium and sodium ions at the blocking gold electrodes.
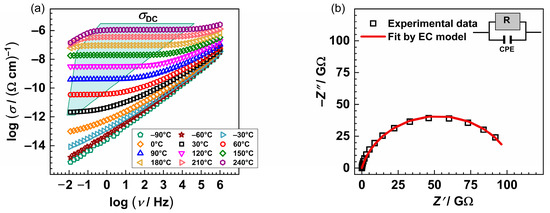
Figure 2.
(a) Conductivity spectra and (b) Nyquist plot of the PAN5K sample @30 °C. The symbols (open squares) denote experimental values, whereas the solid red line in (b) corresponds to the best fit. The corresponding equivalent circuit model, comprised of the parallel combination of the resistor (R) and the constant-phase element (CPE), is used to fit an individual spectrum’s data.
The complex impedance plot typical for investigated glasses consists of a depressed semicircle and additionally, for the temperatures at which the electrode polarization effect occurs, a low-frequency segment. The equivalent circuit representing such a depressed semicircle is a parallel combination of resistor (R) and constant-phase element (CPE). The experimental data are in excellent agreement with the theoretical curves, see Figure 2b, obtained by software [46]. Figure 3a shows the dependence of DC conductivity at various temperatures as a function of the [K]/[K+Na] ratio. In the PANxK glass series, where the amount of Na2O is held constant, and K2O varies between 5 and 15 mol%, it can be observed that the conductivity changes non-monotonically showing a minimum for the sample with 12.5 %mol K2O. This suggests that the addition of a second alkali ion, K+, causes a significant reduction in the mobility of the Na+ ion. Such reduction in ion mobility occurs whenever the second alkali ion differs in size from the first one, resulting in a negative mixed alkali effect (MAE) [22]. Moreover, with the increase in the total amount of alkali ions, the above-mentioned depolymerization of the glass network increases, resulting in more non-bridging oxygens (NBOs). Therefore, it is likely that NBOs act as cation traps causing mobile cations to bind, thus negatively affecting mobility and overall conductivity. However, for the glass sample with the highest amount of K2O (PAN15K), there is a slight increase in DC conductivity, as a result of the overpowering effect of the charge carrier concentration over MAE. Furthermore, with the increase in temperature, the conductivity values within the glass series get almost equal leading to the reduced MAE. This result confirms that with the increase in temperature, the site mismatch energies are considerably reduced due to the rapidly relaxing surroundings of mobile ions. An interesting feature is observed in the optical properties of this glass series where thermo-optical coefficient (dn/dT) also decreases as a function of the K2O/Al2O3 ratio. The relation between electrical and optical properties is not yet clear but it is probably connected to electronic polarizability as discussed by Filho et al. [5].
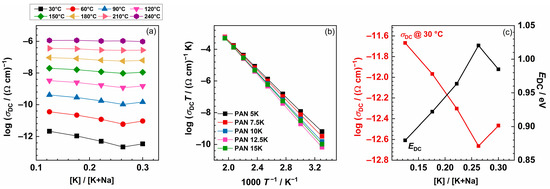
Figure 3.
(a) DC conductivity at various temperatures as a function of the [K]/[K+Na] ratio. (b) Arrhenius plot of DC conductivity of 40P2O5-(25−x)Al2O3-35Na2O-xK2O, x = 5.0, 7.5, 10.0, 12.5, 15.0 mol% glasses and (c) DC conductivity at 30 °C and activation energy for DC conductivity as a function of [K]/[K+Na] ratio.
Arrhenius temperature dependence of the DC conductivity is evident for all glasses, implying that the ionic transport is characterised by the activation energy. For each glass, the activation energy of the DC conductivity, EDC, is calculated from the slope of log(σDCT) versus 1000/T, Figure 3b. The values for DC conductivity @30 °C for all glasses are between 2.15 × 10⁻¹² (Ω cm)−1 and 2.17 × 10⁻¹³ (Ω cm)−1, and activation energy changes from 0.88 to 1.02 eV, as the concentration of K2O is increasing, see Figure 3c. As mentioned earlier, the lowest conductivity value, and hence the highest activation energy, is obtained for the glass with 12.5 mol% of K2O. In comparison, glass with the composition 46.0Na2O–8.6Al2O3–45.4P2O5 has an activation energy of 0.69 eV [10], which is lower than that for the glass PAN15K, 0.96 eV, where the total amount of alkali ions is 50 mol%, and Al2O3 is 10 mol%. Moreover, the DC conductivity of the mixed alkali glass is always smaller than the conductivity of a binary glass with the same total alkali content, as shown in glass composition y[xLi2O–(1−x)Na2O]–(1−y)B2O3, investigated by Cramer et al. [32].
A detailed analysis of the frequency dependence of conductivity and its scaling properties was undertaken in the next step to gain more insights into alkali ion transport in this glass system.
3.3. Scaling Properties of Conductivity Spectra and the Short-Range Transport
When the time-temperature superposition principle (“TTSP”) is valid, the conductivity spectra possess a temperature-independent shape and can be superimposed to a “master curve”. The TTSP implies that the temperature increase causes an acceleration of the dynamic processes in the glass and thus a shift on the frequency axis toward higher values. The validity of the TTSP for the real part of the complex conductivity σ’ can be expressed by a function σ’/σDC = f(ν/ν0), where ν0 is an individual scaling parameter for each conductivity isotherm. The frequently used Summerfield scaling procedure is expressed as [47]:
The validity of Summerfield indicates that temperature does not affect conduction mechanisms other than accelerating (as temperature increases) or decelerating (as temperature decreases) the dynamics of charge carriers. Figure 4 shows conductivity spectra scaled according to this procedure. As the K2O content in the glass system increases, there is an observed gradual increase in deviation from the Summerfield scaling. Deviations from Summerfield scaling are associated with the change in the number density of charge carriers and/or the number of pathways available for conduction transport with temperature [47,48]. In our study, it is possible to obtain a master curve for the sample PAN5K, which contains the least amount of potassium ions. However, with increasing the concentration of potassium ions the MAE increases, and ions which are differently thermally activated participate in the conduction process, resulting in an inability to construct the conductivity master curve. One should bear in mind that, in the studied glass system, the overall charge carrier concentration is changing, the ratio between potassium and sodium ion is never reaching the value of 1, which has an impact of the nature of MAE and scaling properties which are different from that of typical MAE glasses represented in literature [10,11,12,18,19]. Moreover, in glasses with varying charge carrier concentration, it was found that the superposition of individual master curves using Summerfield scaling does not yield a super master curve. In the glass system xNa2O–(1−x)B2O3, investigated by Roling et al. [49], a super master curve was not obtained, and an additional shift along the x-axis was needed. Furthermore, in the glass system [xLi2O–(1−x)Na2O]–0.7B2O3, Summerfield super master curve was not obtained [32].
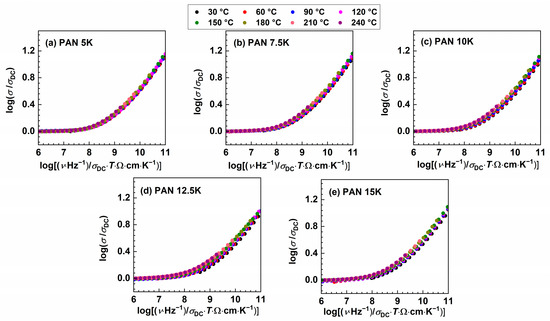
Figure 4.
Conductivity spectra scaled according to Summerfield scaling procedure for (a) PAN5K, (b) PAN7.5K, (c) PAN10K, (d) PAN12.5K, and (e) PAN5K glasses.
The inability to construct the master curve might imply that the spectral shape remains identical but the shift along x-axis is required or that the shape of the frequency-dependent conductivity changes with temperature. Additionally, “structural peculiarities” could result in different conduction pathways, giving rise to the deviation from the Summerfield scaling [50], hence smaller deviation is observed in the glass sample with the lower amount of potassium ions, PAN7.5K. To further probe the origin of the deviation from Summerfield scaling, it is instructive to include an additional scaling factor for the frequency scale, which depends on temperature [50,51]. The scaling relation:
known as Baranovskii–Cordes relation contains the temperature-dependent scaling factor (Figure 5). The factor α indicates the type of interaction between charge carriers, charge carriers and glass matrix, and it was found that it increases as the strength of these interactions increases. Therefore, it depends on both, the alkali oxide concentration and type of the alkali ions present in the glass [52], and the values required for the superposition of the isotherms decrease with increasing alkali oxide content [53]. In this study, the α value varies from 0.02 for PAN5K to −0.58 for PAN12.5K, following a non-linear trend, which could also be related to the impact of MAE on the dynamic of ions in the glass system. Murugavel et al. [52] showed that with the increase in alkali oxide concentration, α value decreases, which implies that interionic interactions are not a decisive factor determining the scaling properties of the AC conductivity spectra, but structural peculiarities are responsible for deviations from Summerfield scaling procedure.
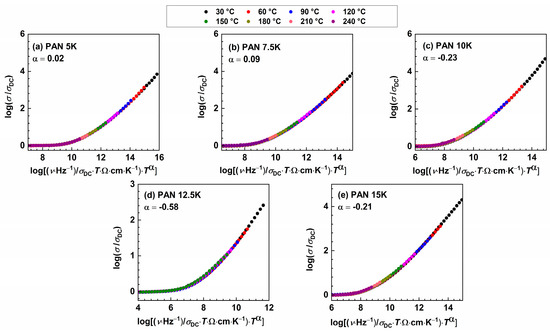
Figure 5.
Conductivity spectra scaled according to Baranovskii-Cordes scaling procedure for (a) PAN5K, (b) PAN7.5K, (c) PAN10K, (d) PAN12.5K, and (e) PAN15K glasses.
Although the master curves were obtained by the Baranovskii-Cordes scaling procedure, we see in Figure 6 that the super master curve was not obtained, which is not surprising due to changes in the number density of charge carriers’ as well as structural changes in the glass network. However, the super master curve can be obtained by shifting each master curve along the x-axis, with sample PAN5K taken as a referent one. With the increase in potassium concentration and the decrease in Al3+ ions, master curves are shifted to the lower x-axis values. The master curve of the sample PAN12.5K shows a maximum shift value which could be related to the MAE and short-range dynamics of the potassium and sodium ions. This is in good agreement with the previously discussed effect on the DC conductivity trend, see Figure 3c, and the simultaneous decrease in Al2O3 concentration in the glass series.
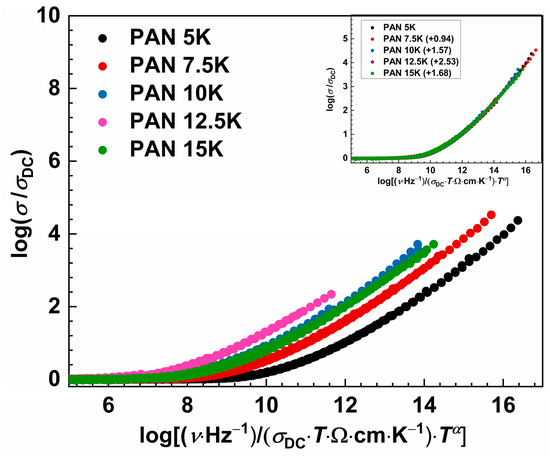
Figure 6.
Master-curves of the conductivity isotherms using the Baranovskii-Cordes scaling procedure for studied glass series. Inset: individual master curves of all glasses shifted along the x-axis to overlap with the reference master-curve of PAN5K glass.
To address the simultaneous change in the typical hopping distance of the mobile species by changing their number density, a different scaling procedure was proposed by Sidebottom [48,54]. This scaling procedure is expressed in the form:
where ε0 and Δε represent the permittivity of free space and dielectric strength determined from the permittivity spectra as a difference between low-frequency static permittivity plateau, ε′s, and constant value at higher frequencies, ε′∞. When it is not possible to determine Δε, from the experimental permittivity spectra due to the early onset of electrode polarization, dielectric strength can be calculated from the conductivity spectra using the relation: Δεcalc = σDC/(f0ε0), where f0 denotes the onset frequency of conductivity dispersion defined at 2σDC. As expected, Sidebottom scaling yields conductivity master curves for all samples, see Figure 7, and no additional shift is needed to obtain the super-master curve, see Figure 8.
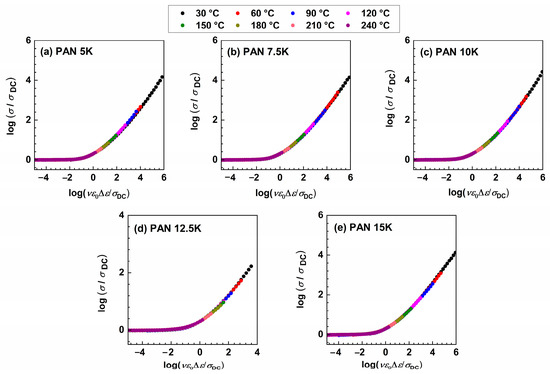
Figure 7.
Conductivity spectra scaled according to Sidebottom scaling procedure for (a) PAN5K, (b) PAN7.5K, (c) PAN10K, (d) PAN12.5K, and (e) PAN15K glasses.
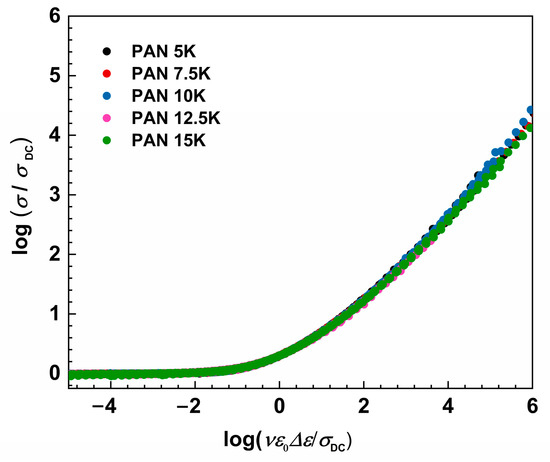
Figure 8.
Construction of super master-curve of the conductivity isotherms using Sidebottom scaling procedure for studied glass series.
Further, to gain insights into the spatial scale of the dynamics of the charge carriers in this glass system, their hopping length known as Sidebottom length, L, has been calculated [55]:
where f0 denotes the onset frequency of conductivity dispersion defined at 2σDC, Nv is the number density of mobile ions (see Table 1), q is the charge, T is temperature, and kB is the Boltzmann constant. Figure 9 shows the variation of Sidebottom length as a function of the [K]/[K+Na] ratio.
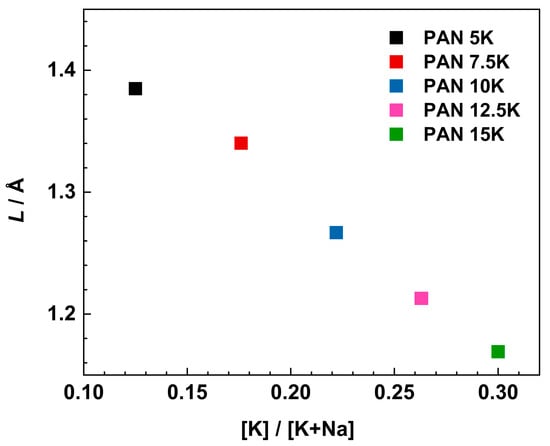
Figure 9.
Variation of Sidebottom length as a function of [K]/[K+Na] ratio.
With increasing [K]/[K+Na] ratio from 0.12 to 0.30, the Sidebottom length decreases from 1.38 to 1.17 Å. These values are typical for glasses with moderately high amounts of alkali oxide [55]. We can observe that with the increase in alkali content, there is a decrease in Sidebottom length, L. Furthermore, the increase in alkali concentration and decrease in Sidebottom length indicates a greater influence of depolymerized structure and MAE on the dynamics of the charge carrier ions, and not the charger carrier concentration itself. Moreover, with the increase in the concentration of charge carriers, sodium and potassium ions, ranging from 1.23 × 1022 cm−3 for PAN5K to 1.52 × 1022 cm−3 for PAN15K sample, there is still a drop in conductivity, alluding to the negative influence of the mixed alkali effect on the conductivity property, and the significant influence of the glass structure especially increased concentration of NBOs at a higher concentration of alkali oxides.
3.4. Depolarization Measurements
In Figure 10, the thermally stimulated depolarization current density of measured glasses is shown. For a better visualization of the spectra, an enlargement of the low-temperature range is presented. As mentioned, all samples were polarized at 210 °C for 35 min, applying a voltage of 200 V. All measured glasses show a peak of thermally active depolarization current in the range from 46 to 76 °C.
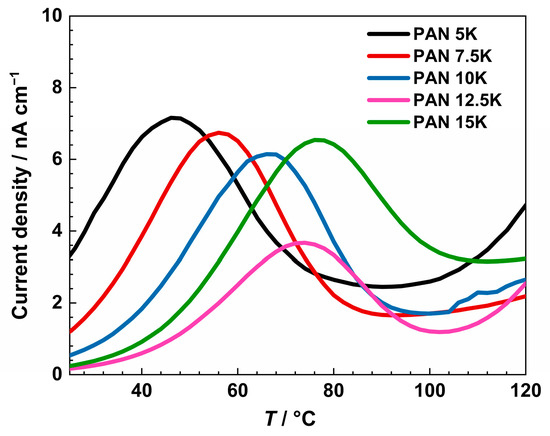
Figure 10.
Thermally stimulated depolarization current density of PANxK series of glasses from thermally stimulated depolarization measurements.
The observed peak can be assigned to the depolarization of the bulk glass due to K+ and Na+ ion transport [56]. The current density values are the highest for the sample PAN5K, to compare, the conductivity is the highest for the same sample. By introducing K2O up to 12.5 mol%, the peak temperature increases and the current density drops, alluding to the negative influence of mixed alkali oxides on electrical properties. With the further increase in potassium ion concentration, the current density decreases, reaching a minimum for the sample PAN12.5K. Then, the sample PAN15K shows an increase in current density, implying overpowering effect of the overall concentration of alkali ions. Regarding the temperature of the depolarization peak, with an increase in potassium ions, and consequently the overall alkali concentration, temperature values show an increasing trend in the glass series. With an increase in potassium ion concentration, higher temperatures are necessary to obtain a depolarization peak due to the larger radius of potassium ions, and slower transport throughout the glass network than more mobile and smaller sodium ions [57].
4. Conclusions
In the studied glass system of 40P2O5-(25−x)Al2O3-35Na2O-xK2O where x = 5.0, 7.5, 10.0, 12.5, 15.0 mol%, structural and electrical properties are investigated and interpreted. With an increase in the proportion of potassium ions, i.e., an overall increase in the concentration of alkali ions, depolymerization of the network occurs, resulting in a higher concentration of non-bridging oxygens (NBOs). An overall increase in the concentration of alkali ions leads to a decrease in conductivity, due to the mixed alkali effect (MAE), and a minimum is reached for glass with a total amount of alkali ions is 47.5 mol% (glass PAN12.5K). The electrical characterization in a wide temperature and frequency range shows that the mobility of potassium and sodium ions in these glasses is affected by cation traps related to an increase in NBO concentration, as a result of structural changes that occur with the decrease in Al2O3. As for the scaling properties, Summerfield scaling is not found valid for all glasses; there is an increase in deviation as the K2O amount increases. This effect could be related to the significant amounts of different types of alkali ions and their differently thermally activated mobilities. With the incorporation of a temperature-dependent factor (Baranovskii-Cordes scaling), individual conductivity master curves were obtained, but a super master curve was not yielded. To obtain a super master curve additional shifts are needed. In the latter procedure, the maximum shift value is observed for glass sample PAN12.5K, confirming the influence of the mixed alkali effect on short-range dynamics of the potassium and sodium ions. Sidebottom scaling procedure showed its universality by obtaining master- and super master-curves without additional shifts. The characteristic hopping length of mobile ions, known as Sidebottom length, gradually decreases with the increase in K2O concentration in studied glasses. Results from TSDC measurements follow the conductivity trend, showing the minimum current density for the sample PAN12.5K, and the shift of the depolarization peak to higher temperatures with an increase in potassium ion concentration. In conclusion, two effects influence the properties of the PANxK glass series: (i) the mixed alkali effect and the increase in non-bridging oxygens and (ii) overall alkali concentration. With the increase in potassium concentration, there is an increase in the extent of mixed alkali effect, a greater number of NBOs affecting the cation transport by bonding the alkali ions causing a decrease in overall DC conductivity up to 12.5 mol% K2O. However, for the glass with the highest amount of K2O (PAN15K), there is a slight increase in DC conductivity, as a result of the overpowering effect of total charge carrier concentration over mixed alkali effect and cation mobility. The conductivity trend is additionally confirmed with depolarization current measurements.
Author Contributions
Conceptualization, M.R. and L.P.; methodology, M.R., S.M., J.P., J.C.F., A.A.A., A.C.A.S., N.O.D., A.Š. and L.P.; software, M.R., S.M. and L.P.; validation, M.R., S.M., J.P., A.Š. and L.P.; formal analysis M.R., S.M. and L.P.; investigation, M.R., S.M., J.C.F., A.A.A., A.C.A.S., N.O.D., J.P., A.Š. and L.P.; writing (original draft preparation), M.R. and L.P.; writing (review and editing), M.R., S.M., A.Š. and L.P.; visualization, M.R. and L.P.; supervision, J.P. and L.P.; project administration, A.Š. and L.P.; funding acquisition, A.Š. and L.P. All authors have read and agreed to the published version of the manuscript.
Funding
This work was supported by the Croatian Science Foundation; POLAR-ION-GLASS project IP-2018-01-5425. This work was also supported by grants from CNPq (Conselho Nacional de Desenvolvimento Científico e Tecnológico Brazil), CAPES (Coordenação de Aperfeiçoamento de Pessoal de Nível Superior (Finance code 001), Brazil) and FAPEMIG (Fundação de Amparo à Pesquisa do Estado de Minas Gerais). L.P. thanks for the donation from the Croatian Academy of Science and Arts (HAZU) 2019 and 2022.
Institutional Review Board Statement
Not applicable.
Informed Consent Statement
Not applicable.
Data Availability Statement
Not applicable.
Acknowledgments
J.P. acknowledges the support of project CIuK co-financed by the Croatian Government and the European Union through the European Regional Development Fund-Competitiveness and Cohesion Operational Programme (Grant KK.01.1.1.02.0016).
Conflicts of Interest
The authors declare no conflict of interest.
References
- Bingham, P.A.; Hand, R.J.; Hannant, O.M.; Forder, S.D.; Kilcoyne, S.H. Effects of Modifier Additions on the Thermal Properties, Chemical Durability, Oxidation State and Structure of Iron Phosphate Glasses. J. Non-Cryst. Solids 2009, 355, 1526–1538. [Google Scholar] [CrossRef]
- Manupriya; Thind, K.S.; Singh, K.; Sharma, G.; Rajendran, V. Influence of Addition of Al2O3 on Physical, Structural, Acousticaland in-Vitro Bioactive Properties of Phosphate Glasses. Phys. Status Solidi Appl. Mater. Sci. 2009, 206, 1447–1455. [Google Scholar] [CrossRef]
- Narayanan, M.K.; Shashikala, H.D. Thermal and Optical Properties of BaO-CaF2-P2O5 Glasses. J. Non-Cryst. Solids 2015, 422, 6–11. [Google Scholar] [CrossRef]
- Moguš-Milanković, A.; Gajović, A.; Šantić, A.; Day, D.E. Structure of Sodium Phosphate Glasses Containing Al2O3 and/or Fe2O3. Part I. J. Non-Cryst. Solids 2001, 289, 204–213. [Google Scholar] [CrossRef]
- Filho, J.C.; Zilio, S.C.; Messias, D.N.; Pilla, V.; Almeida Silva, A.C.; Dantas, N.O.; Andrade, A.A. Effects of Aluminum Substitution by Potassium in the P2O5–Al2O3–Na2O–K2O Phosphate Glasses. J. Alloys Compd. 2020, 815, 152359. [Google Scholar] [CrossRef]
- Moreau, F.; Durán, A.; Muñoz, F. Structure and Properties of High Li2O-Containing Aluminophosphate Glasses. J. Eur. Ceram. Soc. 2009, 29, 1895–1902. [Google Scholar] [CrossRef]
- Pershina, S.V.; Raskovalov, A.A.; Antonov, B.D.; Yaroslavtseva, T.V.; Reznitskikh, O.G.; Baklanova, Y.V.; Pletneva, E.D. Extreme Behavior of Li-Ion Conductivity in the Li2O-Al2O3-P2O5 Glass System. J. Non-Cryst. Solids 2015, 430, 64–72. [Google Scholar] [CrossRef]
- Souissi, F.Z.; Ettoumi, H.; Barré, M.; Toumi, M. Preparation and Electrical Conductivity of Potassium Phosphate Glasses Containing Al2O3. J. Non-Cryst. Solids 2018, 481, 585–589. [Google Scholar] [CrossRef]
- Calahoo, C.; Xia, Y.; Zhou, R. Influence of Glass Network Ionicity on the Mixed-Alkali Effect. Int. J. Appl. Glass Sci. 2020, 11, 396–414. [Google Scholar] [CrossRef]
- Behrends, F.; Eckert, H. Mixed-Alkali Effects in Aluminophosphate Glasses: A Re-Examination. J. Phys. Chem. C 2011, 3, 17175–17183. [Google Scholar] [CrossRef]
- Viviani, D.; Faivre, A.; Levelut, C.; Smaïhi, M. Structural Change in Li and Na Aluminophosphate Glasses: Evidence of a “Structural Mixed Alkali Effect. J. Phys. Chem. B 2006, 110, 7281–7288. [Google Scholar] [CrossRef] [PubMed]
- Faivre, A.; Viviani, D.; Phalippou, J. Mixed Alkali Effect in Li and Na Aluminophosphate Glasses: Influence of the Cation Environment. Solid State Ion. 2005, 176, 325–332. [Google Scholar] [CrossRef]
- Crovace, M.C.; Soares, V.O.; Rodrigues, A.C.M.; Peitl, O.; Raucci, L.M.S.C.; de Oliveira, P.T.; Zanotto, E.D. Understanding the Mixed Alkali Effect on the Sinterability and in Vitro Performance of Bioactive Glasses. J. Eur. Ceram. Soc. 2021, 41, 4391–4405. [Google Scholar] [CrossRef]
- Kojima, S. Mixed-Alkali Effect in Borate Glasses: Thermal, Elastic, and Vibrational Properties. Solids 2020, 1, 16–30. [Google Scholar] [CrossRef]
- Lodesani, F.; Menziani, M.C.; Hijiya, H.; Takato, Y.; Urata, S.; Pedone, A. Structural Origins of the Mixed Alkali Effect in Alkali Aluminosilicate Glasses: Molecular Dynamics Study and Its Assessment. Sci. Rep. 2020, 10, 2906. [Google Scholar] [CrossRef]
- Onodera, Y.; Takimoto, Y.; Hijiya, H.; Taniguchi, T.; Urata, S.; Inaba, S.; Fujita, S.; Obayashi, I.; Hiraoka, Y.; Kohara, S. Origin of the Mixed Alkali Effect in Silicate Glass. NPG Asia Mater. 2019, 11, 75. [Google Scholar] [CrossRef]
- Wilkinson, C.J.; Potter, A.R.; Welch, R.S.; Bragatto, C.; Zheng, Q.; Bauchy, M.; Affatigato, M.; Feller, S.A.; Mauro, J.C. Topological Origins of the Mixed Alkali Effect in Glass. J. Phys. Chem. B 2019, 123, 7482–7489. [Google Scholar] [CrossRef]
- Tsuchida, J.E.; Ferri, F.A.; Pizani, P.S.; Martins Rodrigues, A.C.; Kundu, S.; Schneider, J.F.; Zanotto, E.D. Ionic Conductivity and Mixed-Ion Effect in Mixed Alkali Metaphosphate Glasses. Phys. Chem. Chem. Phys. 2017, 19, 6594–6600. [Google Scholar] [CrossRef]
- Swenson, J.; Adams, S. Mixed Alkali Effect in Glasses. Phys. Rev. Lett. 2003, 90, 155507. [Google Scholar] [CrossRef]
- Ngai, K.L.; Wang, Y.; Moynihan, C.T. The Mixed Alkali Effect Revisited: The Importance of Ion-Ion Interactions. J. Non-Cryst. Solids 2002, 307–310, 999–1011. [Google Scholar] [CrossRef]
- Maass, P. Towards a Theory for the Mixed Alkali Effect in Glasses. J. Non-Cryst. Solids 1999, 255, 35–46. [Google Scholar] [CrossRef]
- Day, D.E. Mixed Alkali Glasses—Their Properties and Uses. J. Non-Cryst. Solids 1976, 21, 343–372. [Google Scholar] [CrossRef]
- Bunde, A.; Maass, P. Transport Anomalies in Glasses. Phys. A Stat. Mech. Appl. 1993, 200, 80–94. [Google Scholar] [CrossRef]
- Bunde, A.; Ingram, M.D.; Maass, P.; Ngai, K.L. Mixed Alkali Effects in Ionic Conductors: A New Model and Computer Simulations. J. Non-Cryst. Solids 1991, 131–133, 1109–1112. [Google Scholar] [CrossRef]
- Bunde, A.; Ingram, M.D.; Maass, P. The Dynamic Structure Model for Ion Transport in Glasses. J. Non-Cryst. Solids 1994, 172–174, 1222–1236. [Google Scholar] [CrossRef]
- Bunde, A.; Ingram, M.D.; Russ, S. A New Interpretation of the Dynamic Structure Model of Ion Transport in Molten and Solid Glasses. Phys. Chem. Chem. Phys. 2004, 6, 3663–3668. [Google Scholar] [CrossRef]
- Dyre, J.C.; Maass, P.; Roling, B.; Sidebottom, D.L. Fundamental Questions Relating to Ion Conduction in Disordered Solids. Rep. Prog. Phys. 2009, 72, 046501. [Google Scholar] [CrossRef]
- Swenson, J.; Matic, A.; Karlsson, C.; Börjesson, L.; Meneghini, C.; Howells, W.S. Random Ion Distribution Model: A Structural Approach to the Mixed-Alkali Effect in Glasses. Phys. Rev. B—Condens. Matter Mater. Phys. 2001, 63, 1–4. [Google Scholar] [CrossRef]
- Faivre, A.; Despetis, F.; Duffours, L.; Colombel, P. Effect of CaO and Al2O3 Addition on the Properties of K2O–Na2O–P2O5 Glass System. Int. J. Appl. Glass Sci. 2019, 10, 162–171. [Google Scholar] [CrossRef]
- Brow, R.K. Nature of Alumina in Phosphate Glass: I, Properties of Sodium Aluminophosphate Glass. J. Am. Ceram. Soc. 1993, 76, 913–918. [Google Scholar] [CrossRef]
- Wegner, S.; van Wüllen, L.; Tricot, G. The Structure of Aluminophosphate Glasses Revisited: Application of Modern Solid State NMR Strategies to Determine Structural Motifs on Intermediate Length Scales. J. Non-Cryst. Solids 2008, 354, 1703–1714. [Google Scholar] [CrossRef]
- Cramer, C.; Brückner, S.; Gao, Y.; Funke, K. Ion Dynamics in Mixed Alkali Glasses. Phys. Chem. Chem. Phys. 2002, 4, 3214–3218. [Google Scholar] [CrossRef]
- Stefanovsky, S.V.; Stefanovsky, O.I.; Kadyko, M.I.; Presniakov, I.A.; Myasoedov, B.F. The Effect of Fe2O3 Substitution for Al2O3 on the Phase Composition and Structure of Sodium-Aluminum-Iron Phosphate Glasses. J. Non-Cryst. Solids 2015, 425, 138–145. [Google Scholar] [CrossRef]
- Stefanovsky, S.V.; Stefanovsky, O.I.; Kadyko, M.I. FTIR and Raman Spectroscopic Study of Sodium Aluminophosphate and Sodium Aluminum-Iron Phosphate Glasses Containing Uranium Oxides. J. Non-Cryst. Solids 2016, 443, 192–198. [Google Scholar] [CrossRef]
- Moustafa, Y.M.; El-Egili, K. Infrared Spectra of Sodium Phosphate Glasses. J. Non-Cryst. Solids 1998, 240, 144–153. [Google Scholar] [CrossRef]
- Attafi, Y.; Liu, S. Conductivity and Dielectric Properties of Na2O-K2O-Nb2O5-P2O5 Glasses with Varying Amounts of Nb2O5. J. Non-Cryst. Solids 2016, 447, 74–79. [Google Scholar] [CrossRef]
- Chu, C.M.; Wu, J.J.; Yung, S.W.; Chin, T.S.; Zhang, T.; Wu, F.B. Optical and Structural Properties of Sr-Nb-Phosphate Glasses. J. Non-Cryst. Solids 2011, 357, 939–945. [Google Scholar] [CrossRef]
- Rair, D.; Rochdi, A.; Majjane, A.; Jermoumi, T.; Chahine, A.; Touhami, M.E. Synthesis and Study by FTIR, 31P NMR and Electrochemical Impedance Spectroscopy of Vanadium Zinc Phosphate Glasses Prepared by Sol–Gel Route. J. Non-Cryst. Solids 2016, 432, 459–465. [Google Scholar] [CrossRef]
- Ferraa, S.; Barebita, H.; Moutataouia, M.; Nimour, A.; Elbadaoui, A.; Baach, B.; Guedira, T. Effect of Barium Oxide on Structural Features and Thermal Properties of Vanadium Phosphate Glasses. Chem. Phys. Lett. 2021, 765, 138304. [Google Scholar] [CrossRef]
- Sene, F.F.; Martinelli, J.R.; Gomes, L. Synthesis and Characterization of Niobium Phosphate Glasses Containing Barium and Potassium. J. Non-Cryst. Solids 2004, 348, 30–37. [Google Scholar] [CrossRef]
- Belkébir, A.; Rocha, J.; Esculcas, A.P.; Berthet, P.; Gilbert, B.; Gabelica, Z.; Llabres, G.; Wijzen, F.; Rulmont, A. Structural Characterisation of Glassy Phases in the System Na2O-Al2O3-P2O5 by MAS and Solution NMR, EXAFS and Vibrational Spectroscopy. Spectrochim. Acta—Part Mol. Biomol. Spectrosc. 1999, 55, 1323–1336. [Google Scholar] [CrossRef]
- Moutataouia, M.; Iaataren, J.; Lamire, M. Effect of Mixed Iron and Sodium on the Thermal Stability and Spectroscopic Properties of Vanadium Phosphate Glasses. Glass Phys. Chem. 2020, 46, 497–509. [Google Scholar] [CrossRef]
- Choudhary, B.P.; Singh, N.B. Characterization of Fe3+-Doped Silver Phosphate Glasses. Bull. Mater. Sci. 2016, 39, 1651–1663. [Google Scholar] [CrossRef]
- Assem, E.E.; Elmehasseb, I. Structure, Magnetic, and Electrical Studies on Vanadium Phosphate Glasses Containing Different Oxides. J. Mater. Sci. 2011, 46, 2071–2076. [Google Scholar] [CrossRef]
- Khodadadi, A.; Farahmandjou, M.; Yaghoubi, M. Investigation on Synthesis and Characterization of Fe-Doped Al2O3 Nanocrystals by New Sol-Gel Precursors. Mater. Res. Express 2019, 6, 025029. [Google Scholar] [CrossRef]
- Žic, M. An Alternative Approach to Solve Complex Nonlinear Least-Squares Problems. J. Electroanal. Chem. 2016, 760, 85–96. [Google Scholar] [CrossRef]
- Summerfield, S.; Butcher, P.N. Universal Behaviour of AC Hopping Conductivity in Disordered Systems. J. Non-Cryst. Solids 1985, 77–78, 135–138. [Google Scholar] [CrossRef]
- Šantić, A.; Nikolić, J.; Pavić, L.; Banhatti, R.D.; Mošner, P.; Koudelka, L.; Moguš-Milanković, A. Scaling Features of Conductivity Spectra Reveal Complexities in Ionic, Polaronic and Mixed Ionic-Polaronic Conduction in Phosphate Glasses. Acta Mater. 2019, 175, 46–54. [Google Scholar] [CrossRef]
- Roling, B.; Happe, A.; Funke, K.; Ingram, M.D. Carrier Concentrations and Relaxation Spectroscopy: New Information from Scaling Properties of Conductivity Spectra in Ionically Conducting Glasses. Phys. Rev. Lett. 1997, 78, 2160–2163. [Google Scholar] [CrossRef]
- Kumar, M.M.; Ye, Z.G. Deviations from the Summerfield Scaling in the Piezoelectric PbZr0.57Ti0.43O3. arXiv 2005. e-prints. [Google Scholar]
- Baranovskii, S.D.; Cordes, H. On the Conduction Mechanism in Ionic Glasses. J. Chem. Phys. 1999, 111, 7546–7557. [Google Scholar] [CrossRef]
- Murugavel, S.; Roling, B. Ac Conductivity Spectra of Alkali Tellurite Glasses: Composition-Dependent Deviations from the Summerfield Scaling. Phys. Rev. Lett. 2002, 89, 195902. [Google Scholar] [CrossRef] [PubMed]
- Roling, B.; Martiny, C.; Murugavel, S. Ionic Conduction in Glass: New Information on the Interrelation between the “Jonscher Behavior” and the “Nearly Constant-Loss Behavior” from Broadband Conductivity Spectra. Phys. Rev. Lett. 2001, 87, 085901. [Google Scholar] [CrossRef] [PubMed]
- Sidebottom, D.L. Universal Approach for Scaling the Ac Conductivity in Ionic Glasses. Phys. Rev. Lett. 1999, 82, 3653–3656. [Google Scholar] [CrossRef]
- Sklepić, K.; Banhatti, R.D.; Tricot, G.; Mošner, P.; Koudelka, L.; Moguš-Milanković, A. Insights from Local Network Structures and Localized Diffusion on the Ease of Lithium Ion Transport in Two Mixed Glass-Former Systems. J. Phys. Chem. C 2017, 121, 17641–17657. [Google Scholar] [CrossRef]
- Mariappan, C.; Roling, B. Investigation of Bioglass–Electrode Interfaces after Thermal Poling. Solid State Ion. 2008, 179, 671–677. [Google Scholar] [CrossRef]
- Hong, C.-M.; Day, D.E. Thermally Stimulated Polarization and Depolarization Current (TSPC/TSDC) Techniques for Studying Ion Motion in Glass. J. Mater. Sci. 1979, 14, 2493–2499. [Google Scholar] [CrossRef]


Disclaimer/Publisher’s Note: The statements, opinions and data contained in all publications are solely those of the individual author(s) and contributor(s) and not of MDPI and/or the editor(s). MDPI and/or the editor(s) disclaim responsibility for any injury to people or property resulting from any ideas, methods, instructions or products referred to in the content. |
© 2023 by the authors. Licensee MDPI, Basel, Switzerland. This article is an open access article distributed under the terms and conditions of the Creative Commons Attribution (CC BY) license (https://creativecommons.org/licenses/by/4.0/).