Article

Novel Thermal Barrier Coatings with Phase Composite Structures for Extreme Environment Applications: Concept, Process, Evaluation and Performance

1
Curtiss-Wright Corporation, East Windsor, CT 06088, USA
2
IMR Test Labs, Curtiss-Wright Corporation, Lansing, NY 14882, USA
*
Author to whom correspondence should be addressed.
Coatings 2023, 13(1), 210; https://doi.org/10.3390/coatings13010210
Submission received: 28 November 2022 / Revised: 16 December 2022 / Accepted: 13 January 2023 / Published: 16 January 2023
(This article belongs to the Special Issue Coatings for Extreme Environments)

Abstract

:
In this paper, a novel concept in the field of phase composite ceramics has been proposed and applied for creating the topcoats of durable thermal barrier coatings (TBCs), which is one of the most critical technologies for advanced high-efficiency gas turbine engines in extreme environments. The phase composite ceramic TBCs were designed to demonstrate superior and comprehensive performance-related merits, benefits, and advantages over conventional single-phase TBCs with a topcoat of 8YSZ or Gd2Zr2O7, including thermal phase stability, thermal shock durability, low thermal conductivity, and solid particle erosion resistance. In this paper, we review and summarize the development work conducted so far related to the phase composite ceramic concept, coatings processing, and experimental investigation into TBC behaviors at elevated temperatures (typically, ≥1250 °C) using different evaluation and characterization methods, including isothermal sintering, a burner rig test, a solid particle-impinging erosion test, and a CMAS corrosion test. Two-phase (t’+c) zirconia-based TBCs demonstrated improved thermal shock and erosion resistance in comparison to conventional single-phase (t’), 8YSZ TBC, and Gd2Zr2O7 TBC, when used separately. Additionally, a triple-phase (t’+c+YAG) TBC sample demonstrated superior CMAS resistance. The TBC’s damage modes and failure mechanisms for thermal phase stability, thermal cycling resistance, solid particle erosion behavior, and CMAS infiltration are also characterized and discussed in detail, in terms of microstructural characterization and performance evaluation.

1. Introduction

The application of protective coatings to resist extreme environments, such as high-temperature, corrosive and harsh conditions, is essential for advanced gas turbine engines and nuclear power plants [1,2]. The increased efficiency of gas turbines necessitates the development of thermal barrier coatings (TBCs) to enable higher entry operation temperatures and larger thermal gradients. In order to increase efficiency in gas turbine engines, advanced thermal barrier coatings (TBCs) are needed that can endure higher temperatures and greater thermal gradients. Consequently, there is a requirement for the development of new materials, particularly topcoat ceramics with improved thermal stability, durability, and low thermal conductivity (Low-K), for use in TBCs. These coatings are extensively used for the thermal and environmental protection of superalloy components that are located in hot turbine sections, such as combustors, fuel nozzles, blades, and vanes [3,4]. The development and manufacture of advanced thermal barrier coatings (TBCs) with superior properties, such as low thermal conductivity, are essential to further increase the operating temperature levels of turbine engines beyond their current limits without exceeding those of the underlying superalloy components or the internal cooling system. As superalloys approach their theoretical limits, the development and manufacture of advanced TBCs with superior properties, such as low thermal conductivity, are critical and vital for developing new-generation turbine engines with significant improvements in fuel efficiency and low emissions [5,6]. The development of novel TBC materials, processes, and coatings for extreme environments has attracted extensive scientific interest and industrial attention in terms of improving the current YSZ-TBC properties and performance, based on thermal stability, thermal shock resistance, sintering resistance with Low-K properties, erosion resistance, CMAS (calcium–magnesia–alumina–silicate) corrosion resistance, and so on.
The history of the ceramic materials utilized in thermal barrier coatings (TBCs) mirrors the challenge of balancing desirable properties such as phase stability, thermal conductivity, fracture toughness, and durability, with cost considerations. As shown in Figure 1, achieving a comprehensive balance between all these factors is difficult. This challenge has spurred the development of new ceramic materials that can reconcile multiple functions, performance characteristics, process requirements, and economic demands for advanced TBCs. Initially developed in the mid-1970s, zirconia–yttria TBC contained up to 20 wt. % of yttria and a single cubic phase (c), with good phase stability and low conductivity. It was later determined that greater ceramic toughness and durability could be achieved by lowering the yttria content to 6~8 wt. %, but the researchers then sacrificed phase stability and thermal conductivity [7,8]. Since then, 7~8 wt. % yttria partially stabilized zirconia (8YSZ) has been the ceramic of choice for thermal barrier coatings (TBCs), due to its metastable tetragonal phase (t’), high toughness and relatively high thermal conductivity of 2.0~2.3 W/m K, for fully dense samples, and 0.9~1.2 W/m K for 10%~15% porosity at approximately 1000 °C [9,10,11]. Based on the above history review of zirconia-based TBCs, it is concluded that the phase structure and its unique properties, such as phase thermal stability and toughness, play an important role in TBCs’ durability and performance, especially for advanced TBCs that are utilized in extreme environments.
The impingement of solid particles on a thermal barrier coating (TBC) at high velocity is a common cause of extreme environmental strain. Particle erosion can lead to severe deterioration and the loss of TBCs in gas turbine engines, which are employed in both commercial and military aircrafts, as well as in power generation systems. These engines may ingest erosive particles from the polluted atmosphere, incompletely combusted fuel and soot at low ground altitudes, stormy dust clouds, and even volcanic ash at higher altitudes. Other potential sources of particle impact and erosion include the spallation of built-up carbon soot, damaged coatings, or fragments from components within the engine itself. Generally, there are two primary types of particle impact damages: (1) class 1—foreign object damage (FOD), where high-velocity impact caused by bird strikes, tire debris, and other foreign objects with a relatively large size and mass can cause severe damage to components and may lead to potential safety issues; (2) class 2—solid particle erosion (SPE).
Particles of micron size that impact on the surfaces of components or coatings can result in microscale deterioration, such as erosion, fracture, cracking, deformation and/or hardening. This erosive wear behavior in a material typically falls into three categories: Mode I for ductile materials such as metals and alloys; Mode II for brittle materials such as ceramics; Mode III, which is observed in certain polymers. These modes generally show that higher rates of erosion occur at lower impinging angles (Mode I) or higher impinging angles (Mode II), respectively. Ultimately, these impacts can lead to the localized removal of coating materials and subsequent functional failure [12]. Mode-III erosion is particularly pertinent for composite materials. Researchers have studied the erosive wear resistance of yttria-stabilized zirconia (YSZ) and lanthanum zirconate (LZO) coatings, which are prospective Low-K thermal barrier coatings (TBCs). Ramachandran et al. evaluated the erosion responses of these TBCs in relation to porosity, the velocity of the erodent, and the impact angle [13]. Furthermore, Mahade et al. studied the erosion performance of gadolinium zirconate (GZO) and its composite TBCs produced by suspension plasma spray (SPS) [14,15,16] and found that the material composition and microstructural design had a major impact on their erosion behaviors. In most of the cases, the increase in YSZ phase content and coating density for those TBCs showed better erosion resistance.
The extreme aggressiveness of CMAS-related corrosion and the attack on TBCs at elevated temperatures has triggered an increasing need for the development of CMAS-resistant materials and coatings. This is essential for applications involving higher temperature ranges beyond 1200 °C, such as gas turbine engines with increased combustion chamber temperatures or operation in particle (silicate sand, ash, and dust)-contaminated environments. Ingestion, adhesion, and the infiltration of molten CMAS in TBCs can lead to more severe degradation and the early failure of the coating due to its adhesive nature on surfaces. Therefore, mitigating the impact of molten CMAS in TBCs is paramount [17,18,19]. The conventional 8YSZ-TBC material is typically zirconia-based and is particularly vulnerable to high-temperature CMAS attack. Generally, molten CMAS adheres to the TBC surfaces and penetrates into the TBC through cracks and pores in APS-TBCs and the grain boundaries in EB-PVD TBCs. Subsequently, CMAS may cause harmful changes in the chemical and mechanical properties of the TBCs. Upon cooling and solidifying of the molten CMAS, the TBC layer becomes rigid. This change induces the strain responsible for TBC cracking, delamination, and even spallation, which can be attributed to the thermal expansion mismatch between the TBC and CMAS. The TBC that is chemically modified by CMAS penetration and chemical reaction can also become unstable in its phase structure and further reduce its longevity. The mechanisms of CMAS attack and damages had been investigated and identified [20,21,22]. Researchers have utilized many approaches to improve TBC CMAS resistance by modifying the TBC chemistry [23,24,25]. Common methods include: (i) adding solute dopants, such as Al3+ and Ti4+, to a TBC as to elicit the crystallization of a penetrating CMAS glass front, subsequently arresting its progress and sequentially slowing down the CMAS migration inward; (ii) adding active oxides to TBC as to capture the molten CMAS by promoting the interaction; (iii) changing and inhibiting interaction via specific additives to alter the basicity of the CMAS/TBC system; (iv) using zirconate material as a topcoat.
The aforementioned examination of TBC research and development highlighted key aspects of producing novel TBCs designed for high-temperature, extreme environments. We have suggested the concept of using phase composite ceramics as the topcoat for these innovative TBC systems, which were applied in the fabrication of dual-phase and tri-phase TBCs using the air plasma spray process [26,27,28]. The phase composite TBCs have been proven to offer many advantages over conventional single-phase TBCs, in terms of coating durability, phase thermal stability, thermal shock resistance, solid particle resistance, and low thermal conductivity, as well as CMAS corrosion resistance. This review paper aims to provide an overview of the phase composite concept and explore the details of the coating process, via characterization and evaluation methods. Moreover, further insight into the beneficial performance of this novel type of TBC as a promising coating system for gas turbine engines operating in extreme environments is also provided. Finally, a scientific understanding of how these coatings improve performance is presented, with a focus on the potential mechanisms behind them.

2. Experimental Work

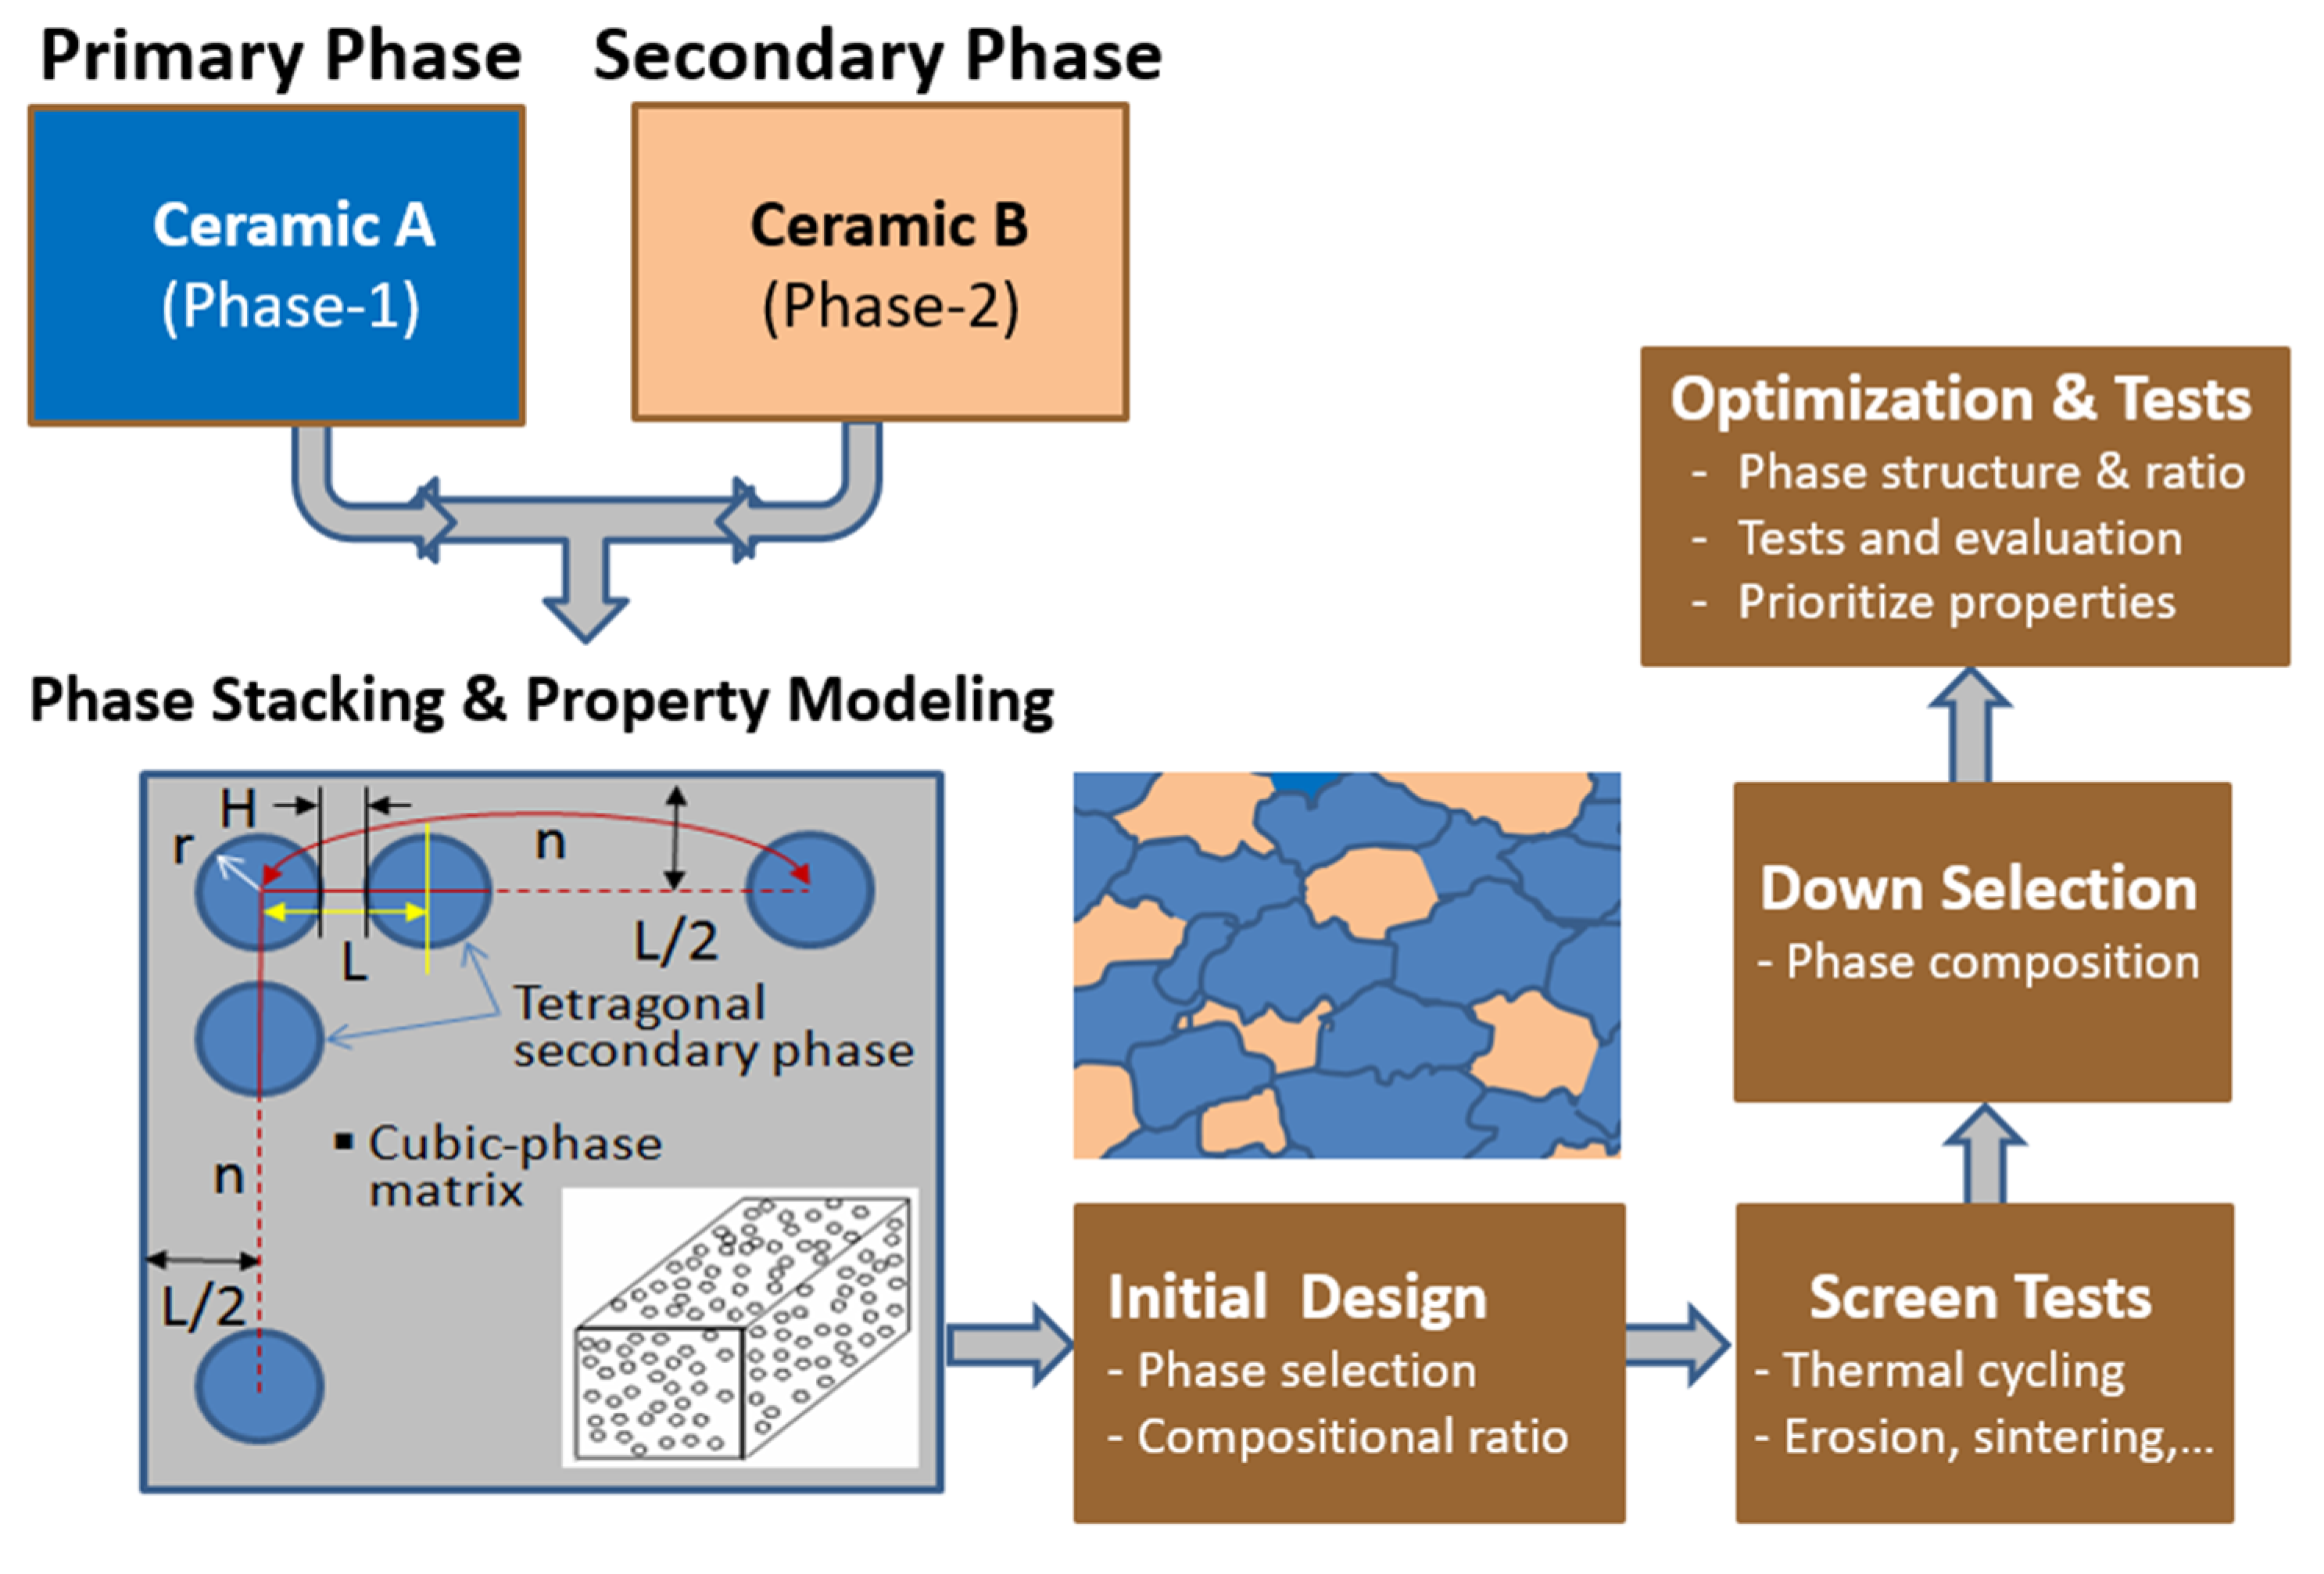
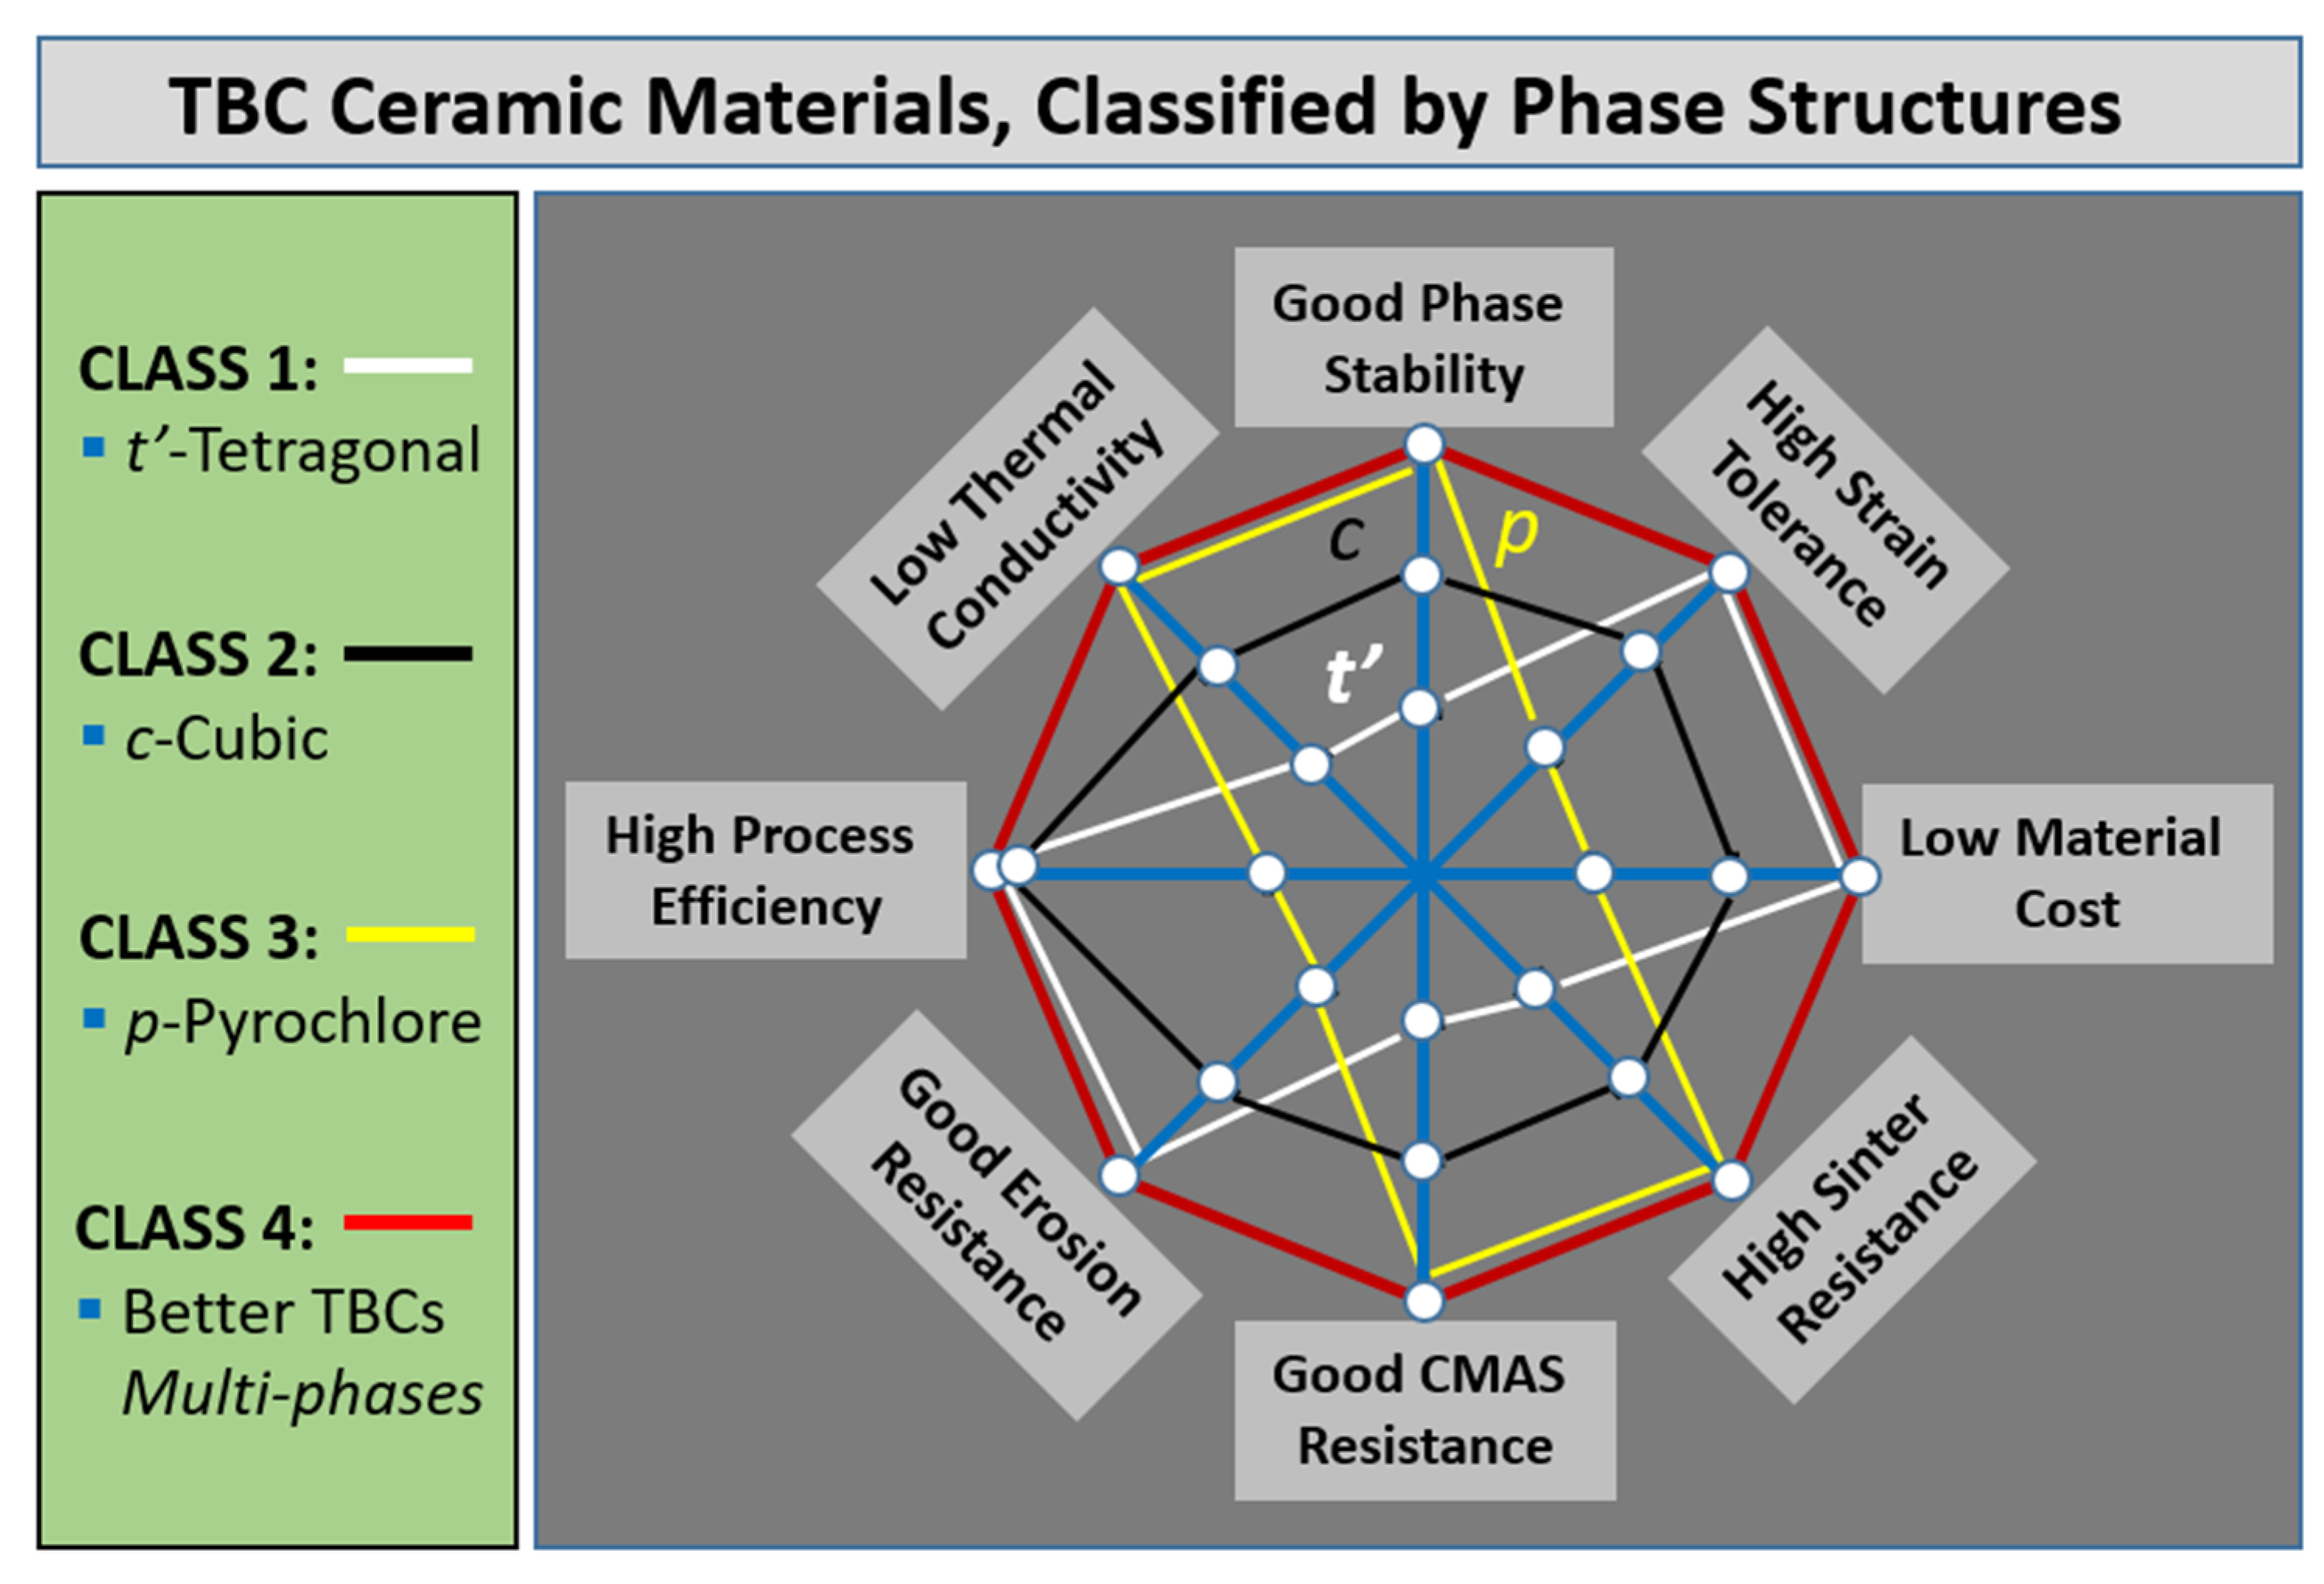
2.1. The Concept of Phase Composite Ceramics

The functional properties of many materials are mostly dependent on their crystalline structures and/or grain structures, rather than their chemical compositions. Typical examples include carbon materials with a face-centered cubic crystal structure (FCC) for extremely high hardness, as in a diamond, compared with stacked layers with a hexagonal arrangement for soft graphite; boron nitride (BN) materials with a hexagonal phase (h-BN) for soft lubricant properties, compared with a cubic phase (c-BN) for high hardness properties. In addition to the concept of compositional design for a functional material that has been widely adopted, here, another concept of phase composite design is considered regarding the topcoat of novel TBCs. In this concept, the term “phase” means either a crystalline structure (c, t, α, …) or grain structure (single crystal, nanostructure, amorphous, …), while the term “composite” means a designed material composed of at least two different phases.
As depicted in Figure 1, this work aimed to achieve better TBCs that are able to meet those requirements of multiple properties in extreme environments, typically, turbine engine operation at higher temperatures. The key properties that have attracted the most interest in terms of improvement are thermal capability, phase stability, sintering resistance, low thermal conductivity, and thermal cyclic resistance, also including, but not limited to, erosion resistance and CMAS resistance. Obviously, the current TBCs, based on 8YSZ zirconia or zirconate (such as GZO or LZO), cannot meet some or most of the requirements given above. In an attempt to design, process and test, a procedure was followed for the development of a two-phase composite TBC, as shown in Figure 2. In this example, a cubic phase (c) zirconia was selected as the primary phase, mainly based on its superior properties of lower thermal conductivity, high thermal stability, and CMAS resistance; a tetragonal phase structure (t’) zirconia was selected as a secondary component, in consideration of its superiority in terms of good thermal cyclic resistance, high strain tolerance, and good erosion resistance. Then, a simple model was used to calculate and predict some of the structural, physical, and thermal properties of the composite ceramic, such as stacking density, elastic modulus, and thermal conductivity. The input parameters included powder material properties, particle sizes and distribution, and the stacking spatial distance and such. After the initial material design was determined, the material was processed as a coating and tested. Finally, the material and coating were optimized and down-selected for some of their specific properties. In the present work, a two-phase zirconia TBC and three-phase zirconia + YAG TBC will be introduced.

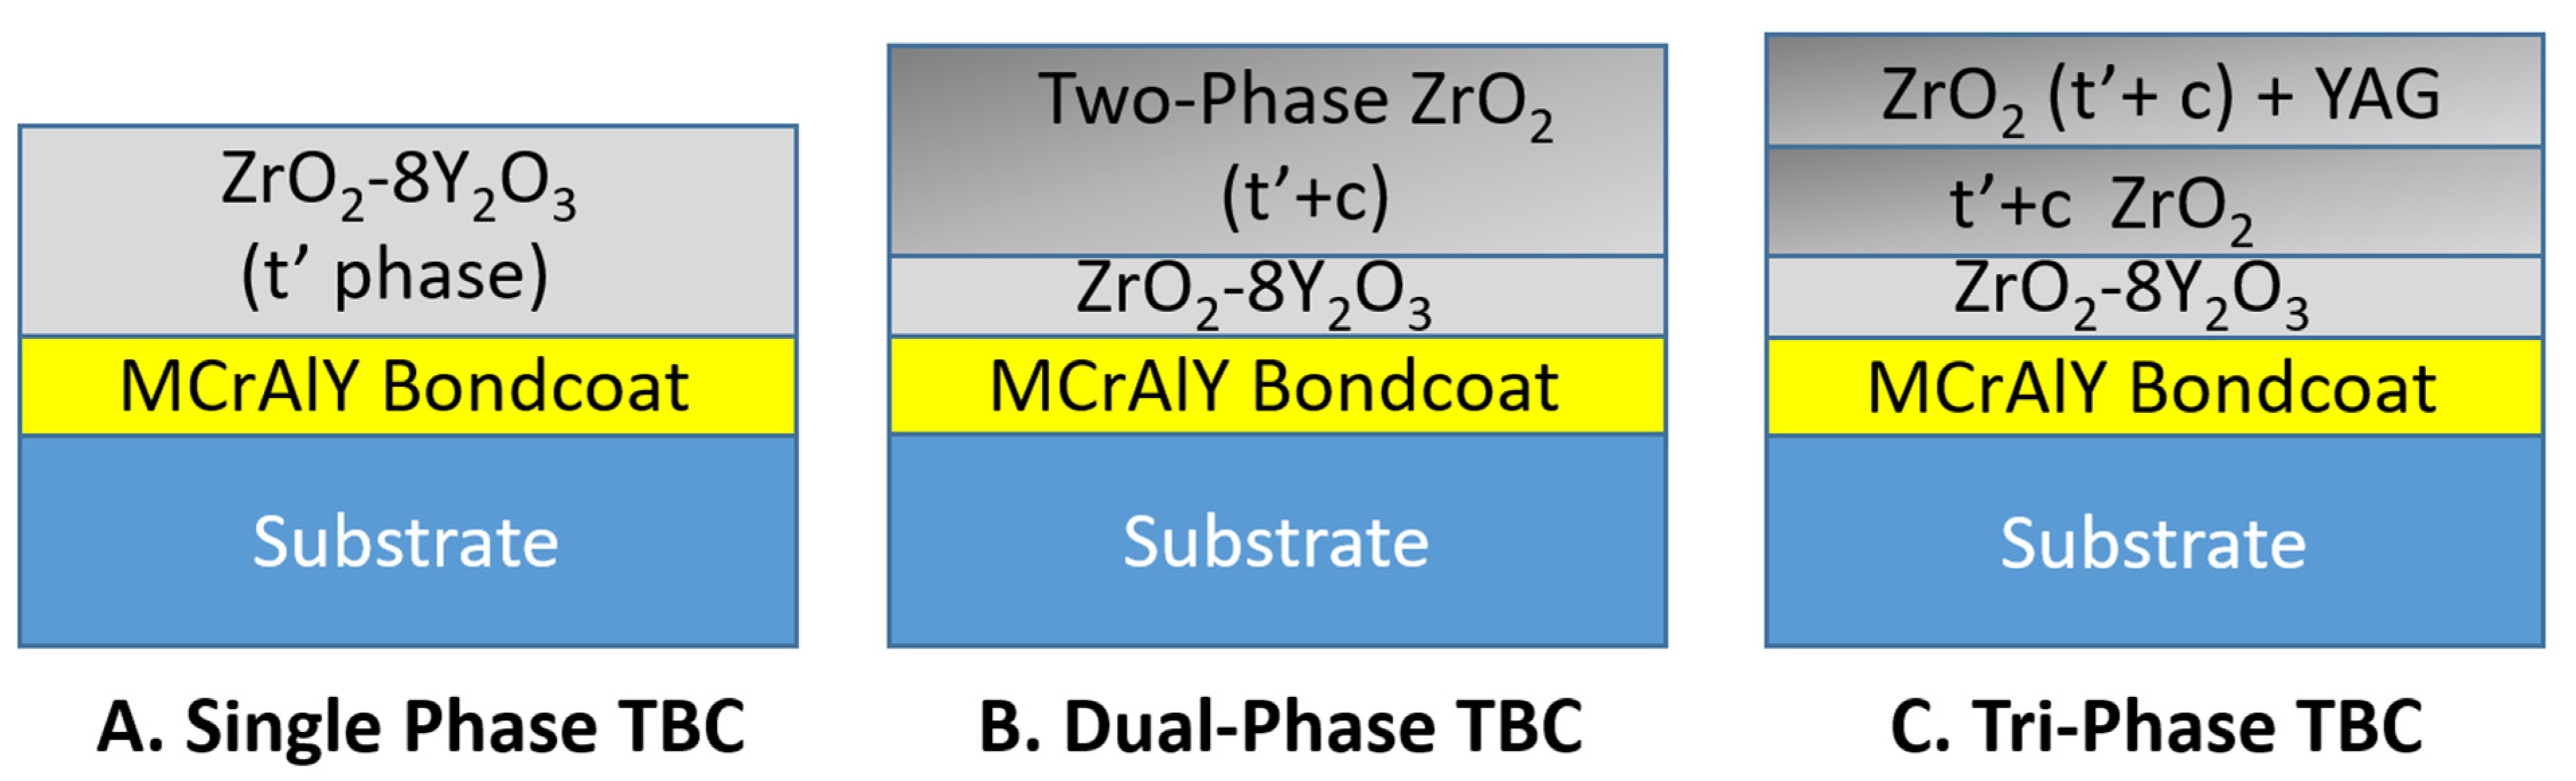
2.2. Process for Producing Dual-Phase TBC Coating

TBC specimens with a two-phase structure of tetragonal (t’) and cubic (c) zirconia were designed and fabricated by Curtiss-Wright Surface Technologies (‘‘CWST’’) using an F4 plasma torch (Metco, Westbury, NY, USA) for ceramic topcoats and a Jet Kote-3000 HVOF torch (Stellite, Goshen, IN, USA) for the metallic CoNiCrAlY bondcoat (CO-210-24, Praxair, Concord, NH, USA). The specimens were sprayed onto Haynes 188 substrates. A rough CoNiCrAlY flash layer over the dense alloy bondcoat was applied via an HVOF process to improve the interface bonding between the bondcoat and the topcoat. An interlayer of t’-phase zirconia was also deposited over the bondcoat as a compositional transition and strain buffer layer, prior to applying the composite phase topcoat. The spray parameters of the topcoat were optimized, based on desirable targets such as spray distance, feeding rate, coating porosity, deposition rate, and process efficiency. The phase composite of TBC with the optimized process has a porosity of 13%~15% and a topcoat thickness of about 200 µm. In order to compare the results, several other types of TBC specimens were also prepared. They included a denser two-phase TBC with ~10% porosity, single tetragonal-phase TBC, single cubic-phase TBC, and Gd2Zr2O7 TBC (porosity: 10%~12%. Powder source: Trans-Tech, Adamstown, MD, USA). All the TBCs have an interlayer of t’-phase zirconia with a thickness of about 120 µm and a porosity of 10%~12%. The cross-sectional microstructure of a typical two-phase TBC sample is shown in Figure 3, and all the TBC specimens for dual-phase TBCs testing are given in Table 1.

2.3. Process for Producing Tri-Phase TBC Coating

CWST utilized an F4-gun air plasma spray method to further develop the two-phase TBCs into three-phase TBCs, by applying a ceramic topcoat and the same metallic CoNiCrAlY bond coat (CO-210-24, Praxair Surface Technology, Concord, NH, USA) onto Haynes 188 disk substrates. Additionally, an interlayer of t’ phase zirconia was deposited over the bond coat prior to applying the composite topcoat. For the tri-phase TBC sample, a mixture of the dual-phase TBC and the third-phase “yttrium–aluminum–garnet” (YAG) material was applied as a top layer, as schematically shown in Figure 4. The optimal spray parameters were employed for fabricating the ceramic layers of the TBCs. All the TBC specimens for tri-phase TBCs testing are given in Table 1.

2.4. Thermal Stability Study

The thermal stability of a selection of TBCs was investigated by isothermally heating the samples at 1300 °C for either 50 or 100 h in an uninterrupted cycle. This study aimed to evaluate the effects of thermal aging on the microstructure, phase stability, and physical and mechanical properties of the coating. The specimens were placed in Al2O3 crucibles inside a muffle box furnace that maintained the temperatures with ±25 °C accuracy. After reaching the target temperature, the furnace powered off and allowed natural cooling to room temperature. Observations of the changes in the microstructures, phase structures, fracture morphologies, porosity, and hardness post-heating were made from cross-sectioned sintered samples. Additionally, the thermal conductivity of selected TBCs, before and after the thermal aging tests, were measured using the laser-flashing method. All the TBC specimens for dual-phase TBCs testing are given in Table 1.

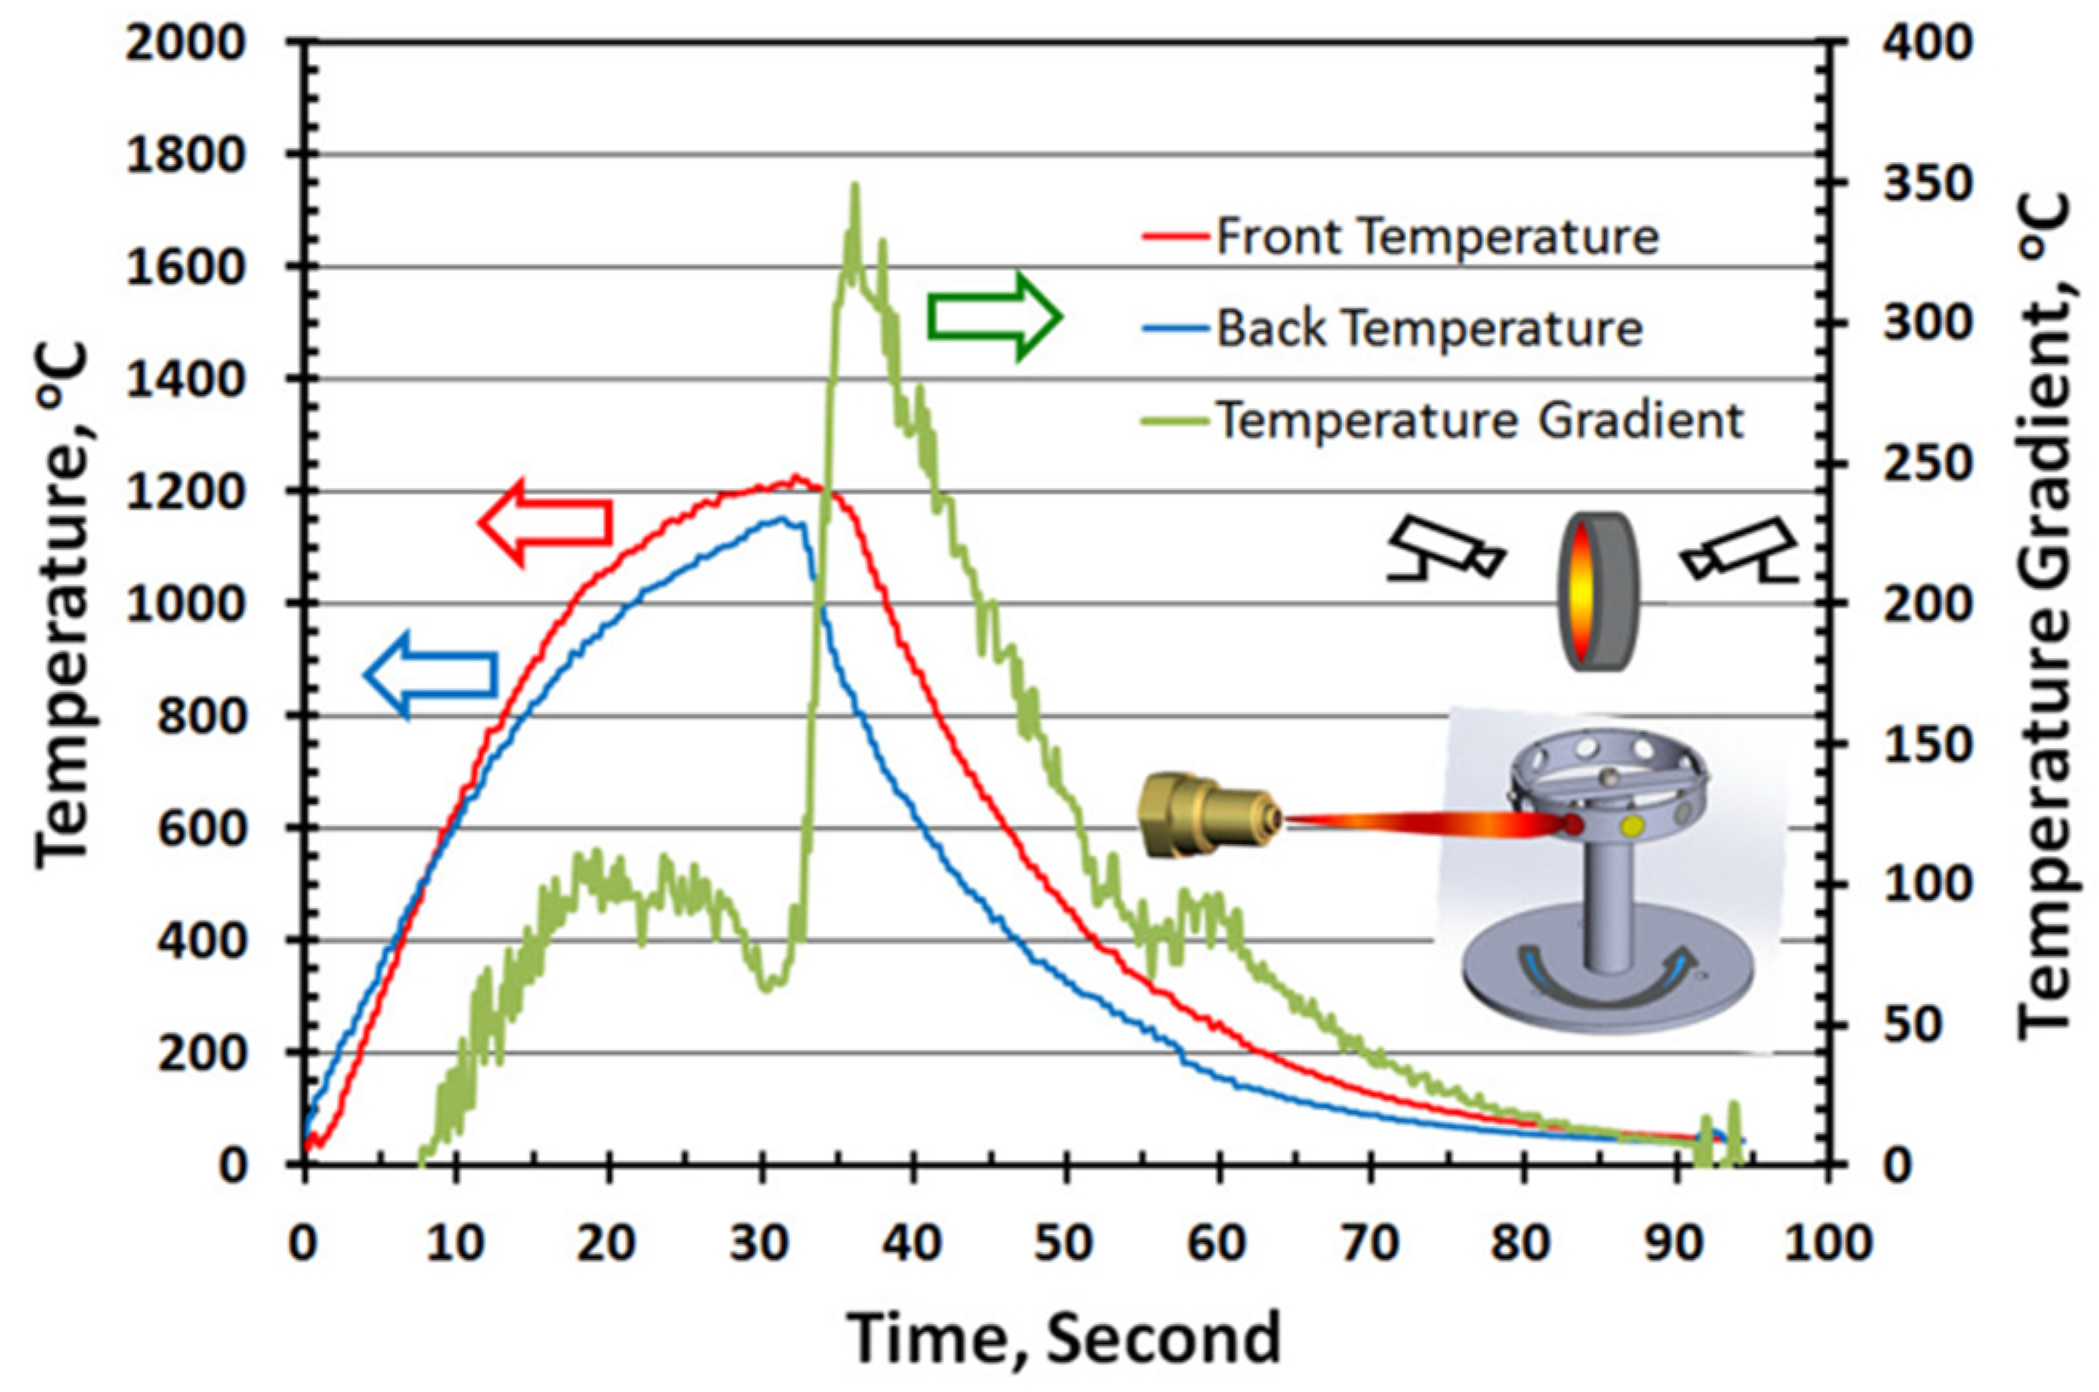
2.5. Thermal Shock Test

A thermal shock test for selected TBCs was performed to evaluate their thermal shock resistance by following up a burner-rig test procedure, using a high-velocity flame torch test-rig setup, to evaluate TBC behaviors in simulated conditions for engine operation under high heat flux and high gas velocity. As illustrated in Figure 5, a high-energy combustion torch (Metco 6P-II, Westbury, NY, USA) was employed to generate sufficient heat input to achieve a homogeneous surface temperature at a maximum of 1200 °C, along with a high-velocity gas impact on the TBC surfaces. The torch utilized acetylene fuel and oxygen to generate a uniform heating zone on 25-millimeter-diameter disk specimens, coupled with a high-velocity gas stream via an accelerating nozzle. The samples were affixed to a cylindrical sample holder attached to an index rotation turntable. Temperatures on the TBC samples’ front and rear surfaces were monitored continuously by two digital pyrometers (Extech; accuracy: ±(3% rdg + 2 °C)) which were accurately focused onto the test sample surfaces, with set focus distances. As shown in Figure 5, a thermal cycle was performed, consisting of 30 s of heating to a peak temperature of 1200 °C, followed by 60 s of forced air cooling to below 100 °C, with the torch being moved to an adjacent sample and two air jets providing cooling from both the front and rear sides. The maximum thermal gradient between the front and rear surfaces was measured at 350 °C when the torch was moved away from the heated sample. Thermal images on the tested sample surfaces were taken after 1000, 1500, and 2000 cycles, respectively, in order to calculate the percentage spallation area for each sample. It is generally accepted that a spallation percentage that is greater than 30% indicates coating failure. The selected TBC specimens for thermal shock testing are given in Table 1.

2.6. Solid Particle Erosion Test

Solid particle erosion tests were conducted using a modified test rig (Curtiss-Wright Surface Technologies, East Windsor, CT, USA) in accordance with the ASTM G76 standard. The impingement angle was maintained at a 100-mm standoff distance and varied from 20° to 90°, in increments of 15°. Irregularly shaped alumina particles of approximately 50 µm average grit size were used as the erodent material. Specimen pre- and post-test thicknesses and weights were measured to determine the coating removal depth and the rate of erosion. These rates were determined via three methods: Method 1—the maximum depth of coating removal per erosion time (µm/s); Method 2—the mass loss of coating per erosion time (g/s). Post-test surface examination was conducted using both optical and SEM methods; Method 3—the mass loss of coating per erodent usage (g/g);

2.7. CMAS Corrosion Test

CMAS corrosion tests were performed by applying CMAS sand to the surfaces of the selected TBC samples listed in Table 1. The CMAS sand was obtained from a commercial source (AFRL-02 test dust, PTI Inc., Arden Hills, MN, USA). Composition analysis of the CMAS sand revealed that it comprised 34% quartz, 30% gypsum, 17% aplite, 14% dolomite, and 5% salt; the DSC/DTA scans data showed that the melting temperature was 1150~1200 °C [29]. The sand was mixed with alcohol to form a slurry and was then brushed evenly over the surfaces of the TBC samples at a controlled dosage of 35 ± 2 mg/cm2. For some TBC samples, varying dosages of 5, 15, and 35 mg/cm2 were employed. All the CMAS-deposited TBC samples were tested in a box furnace under isothermal conditions at 1250 ± 25 °C for different durations. The test samples were heated to the desired temperature at a rate of 50 °C/min and were then kept inside the furnace until it cooled down to room temperature, upon completion of the tests.

3. Results and Discussion

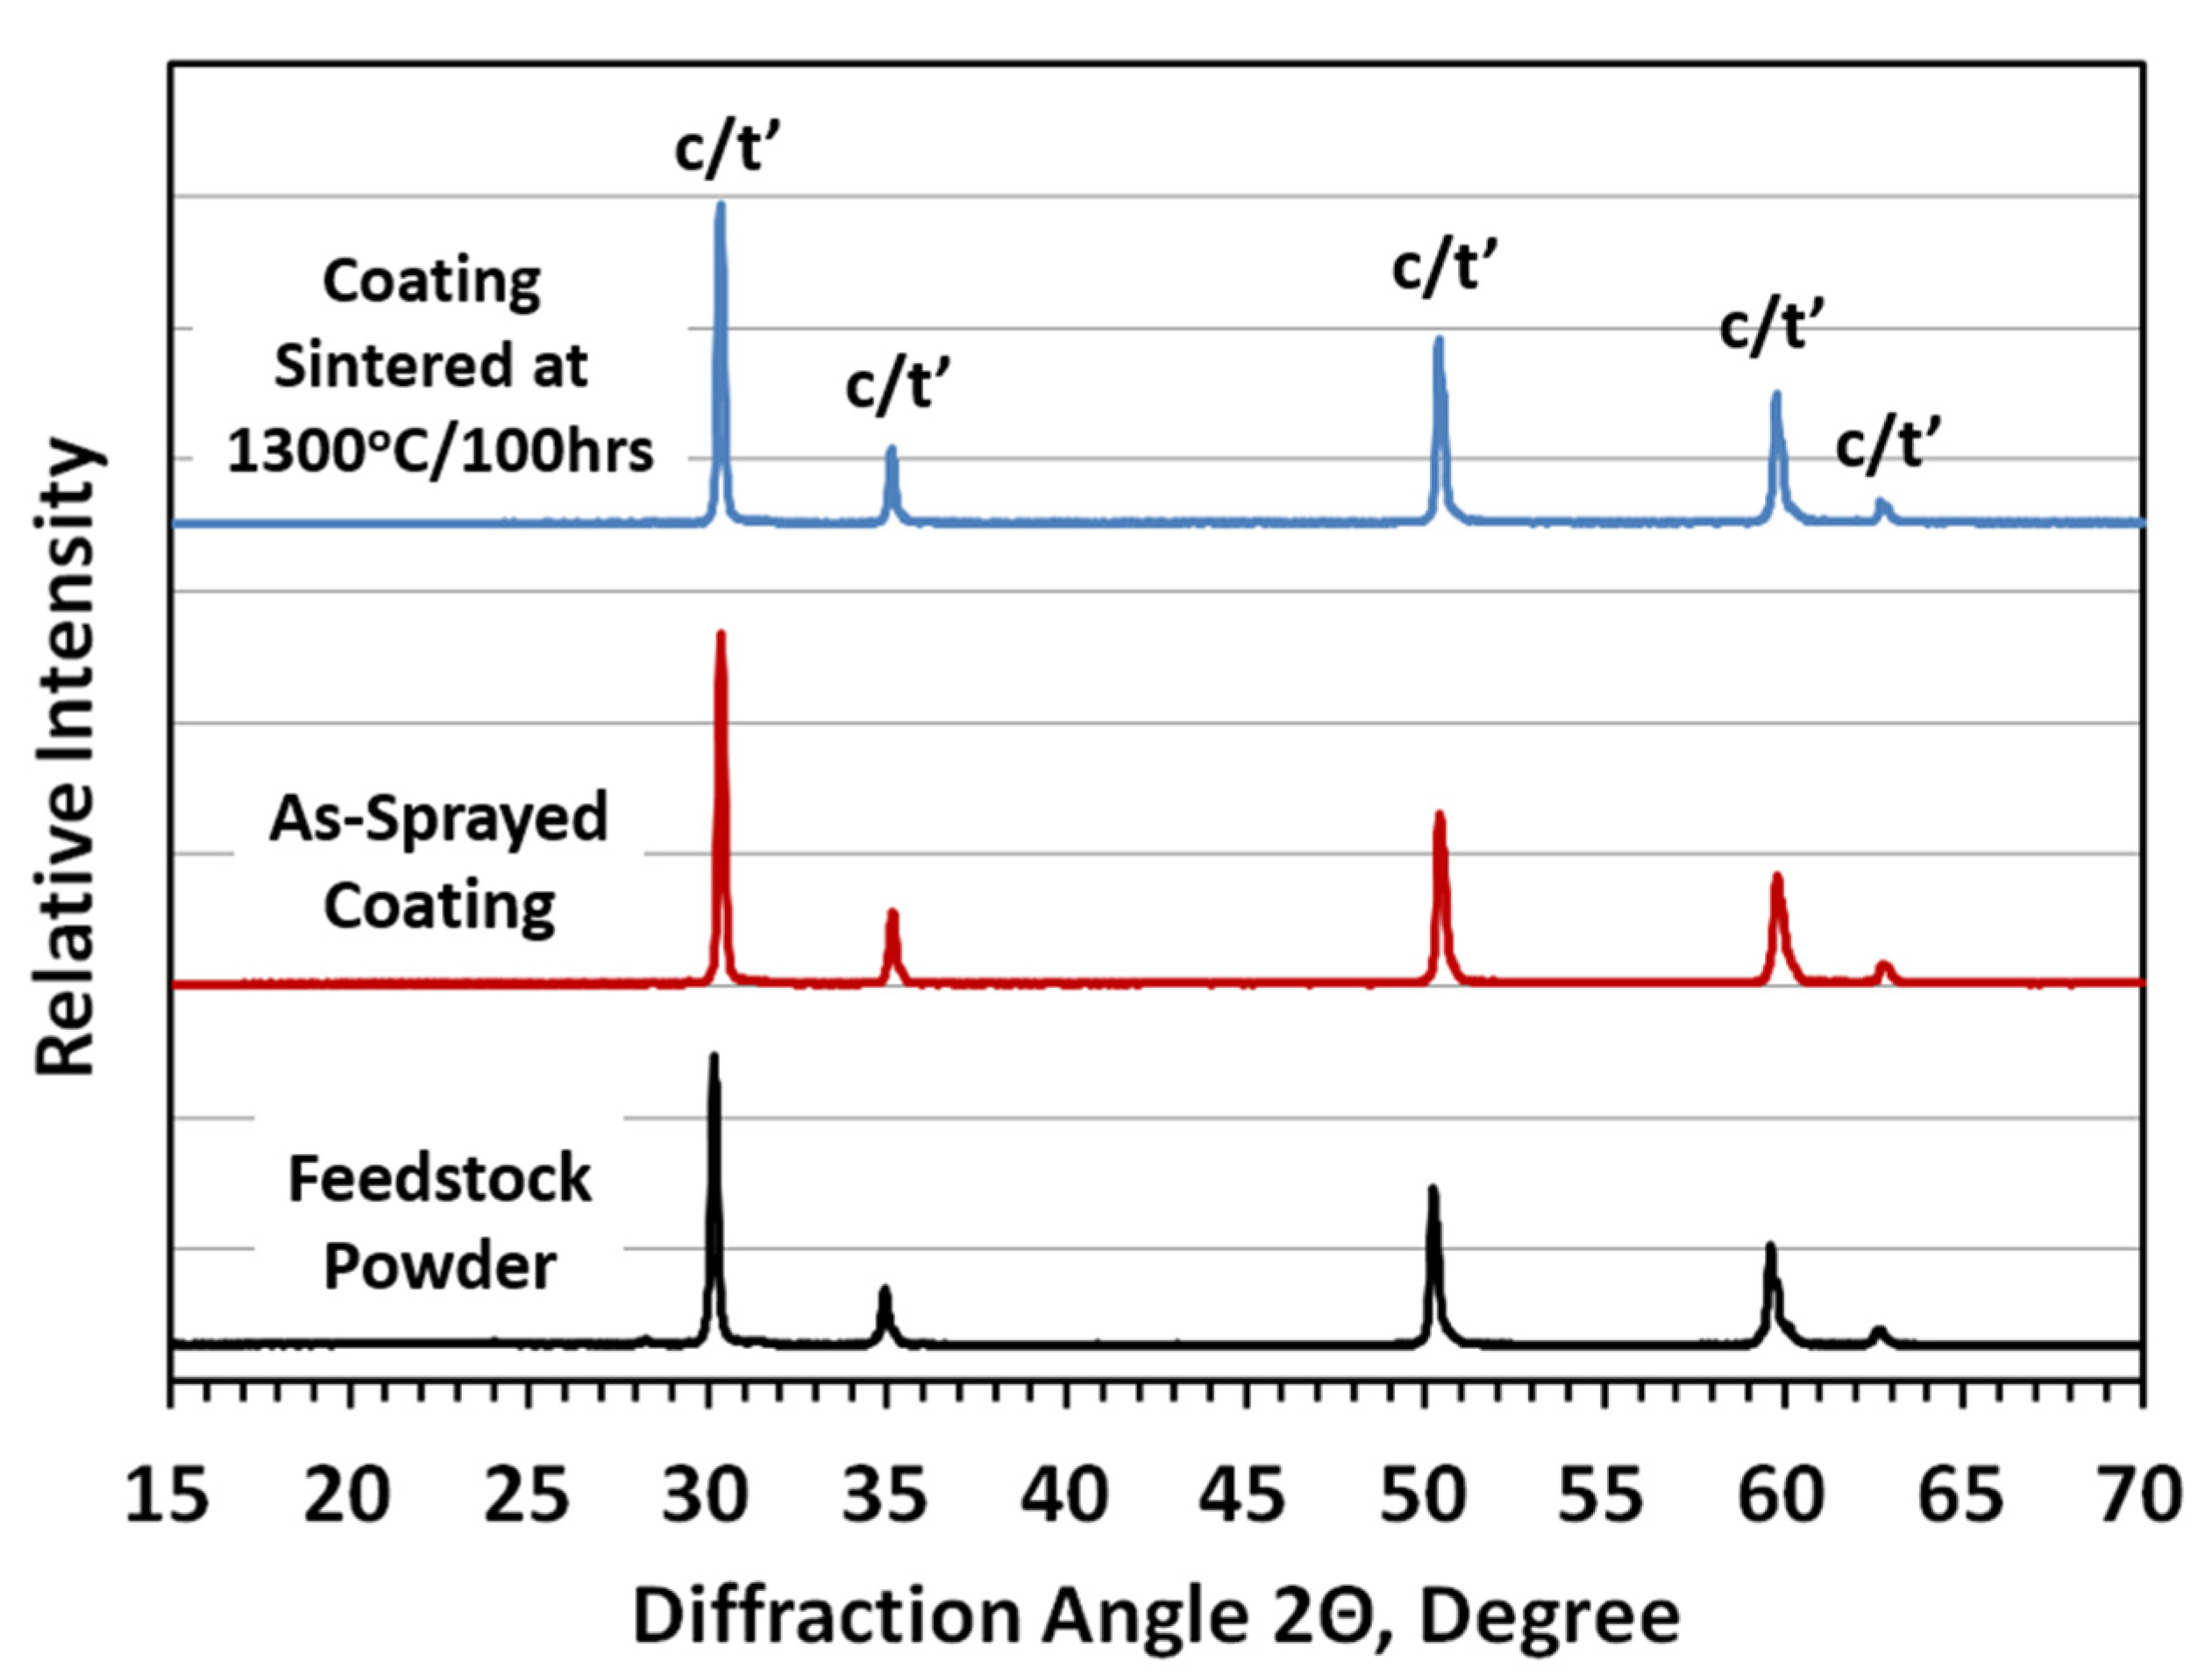
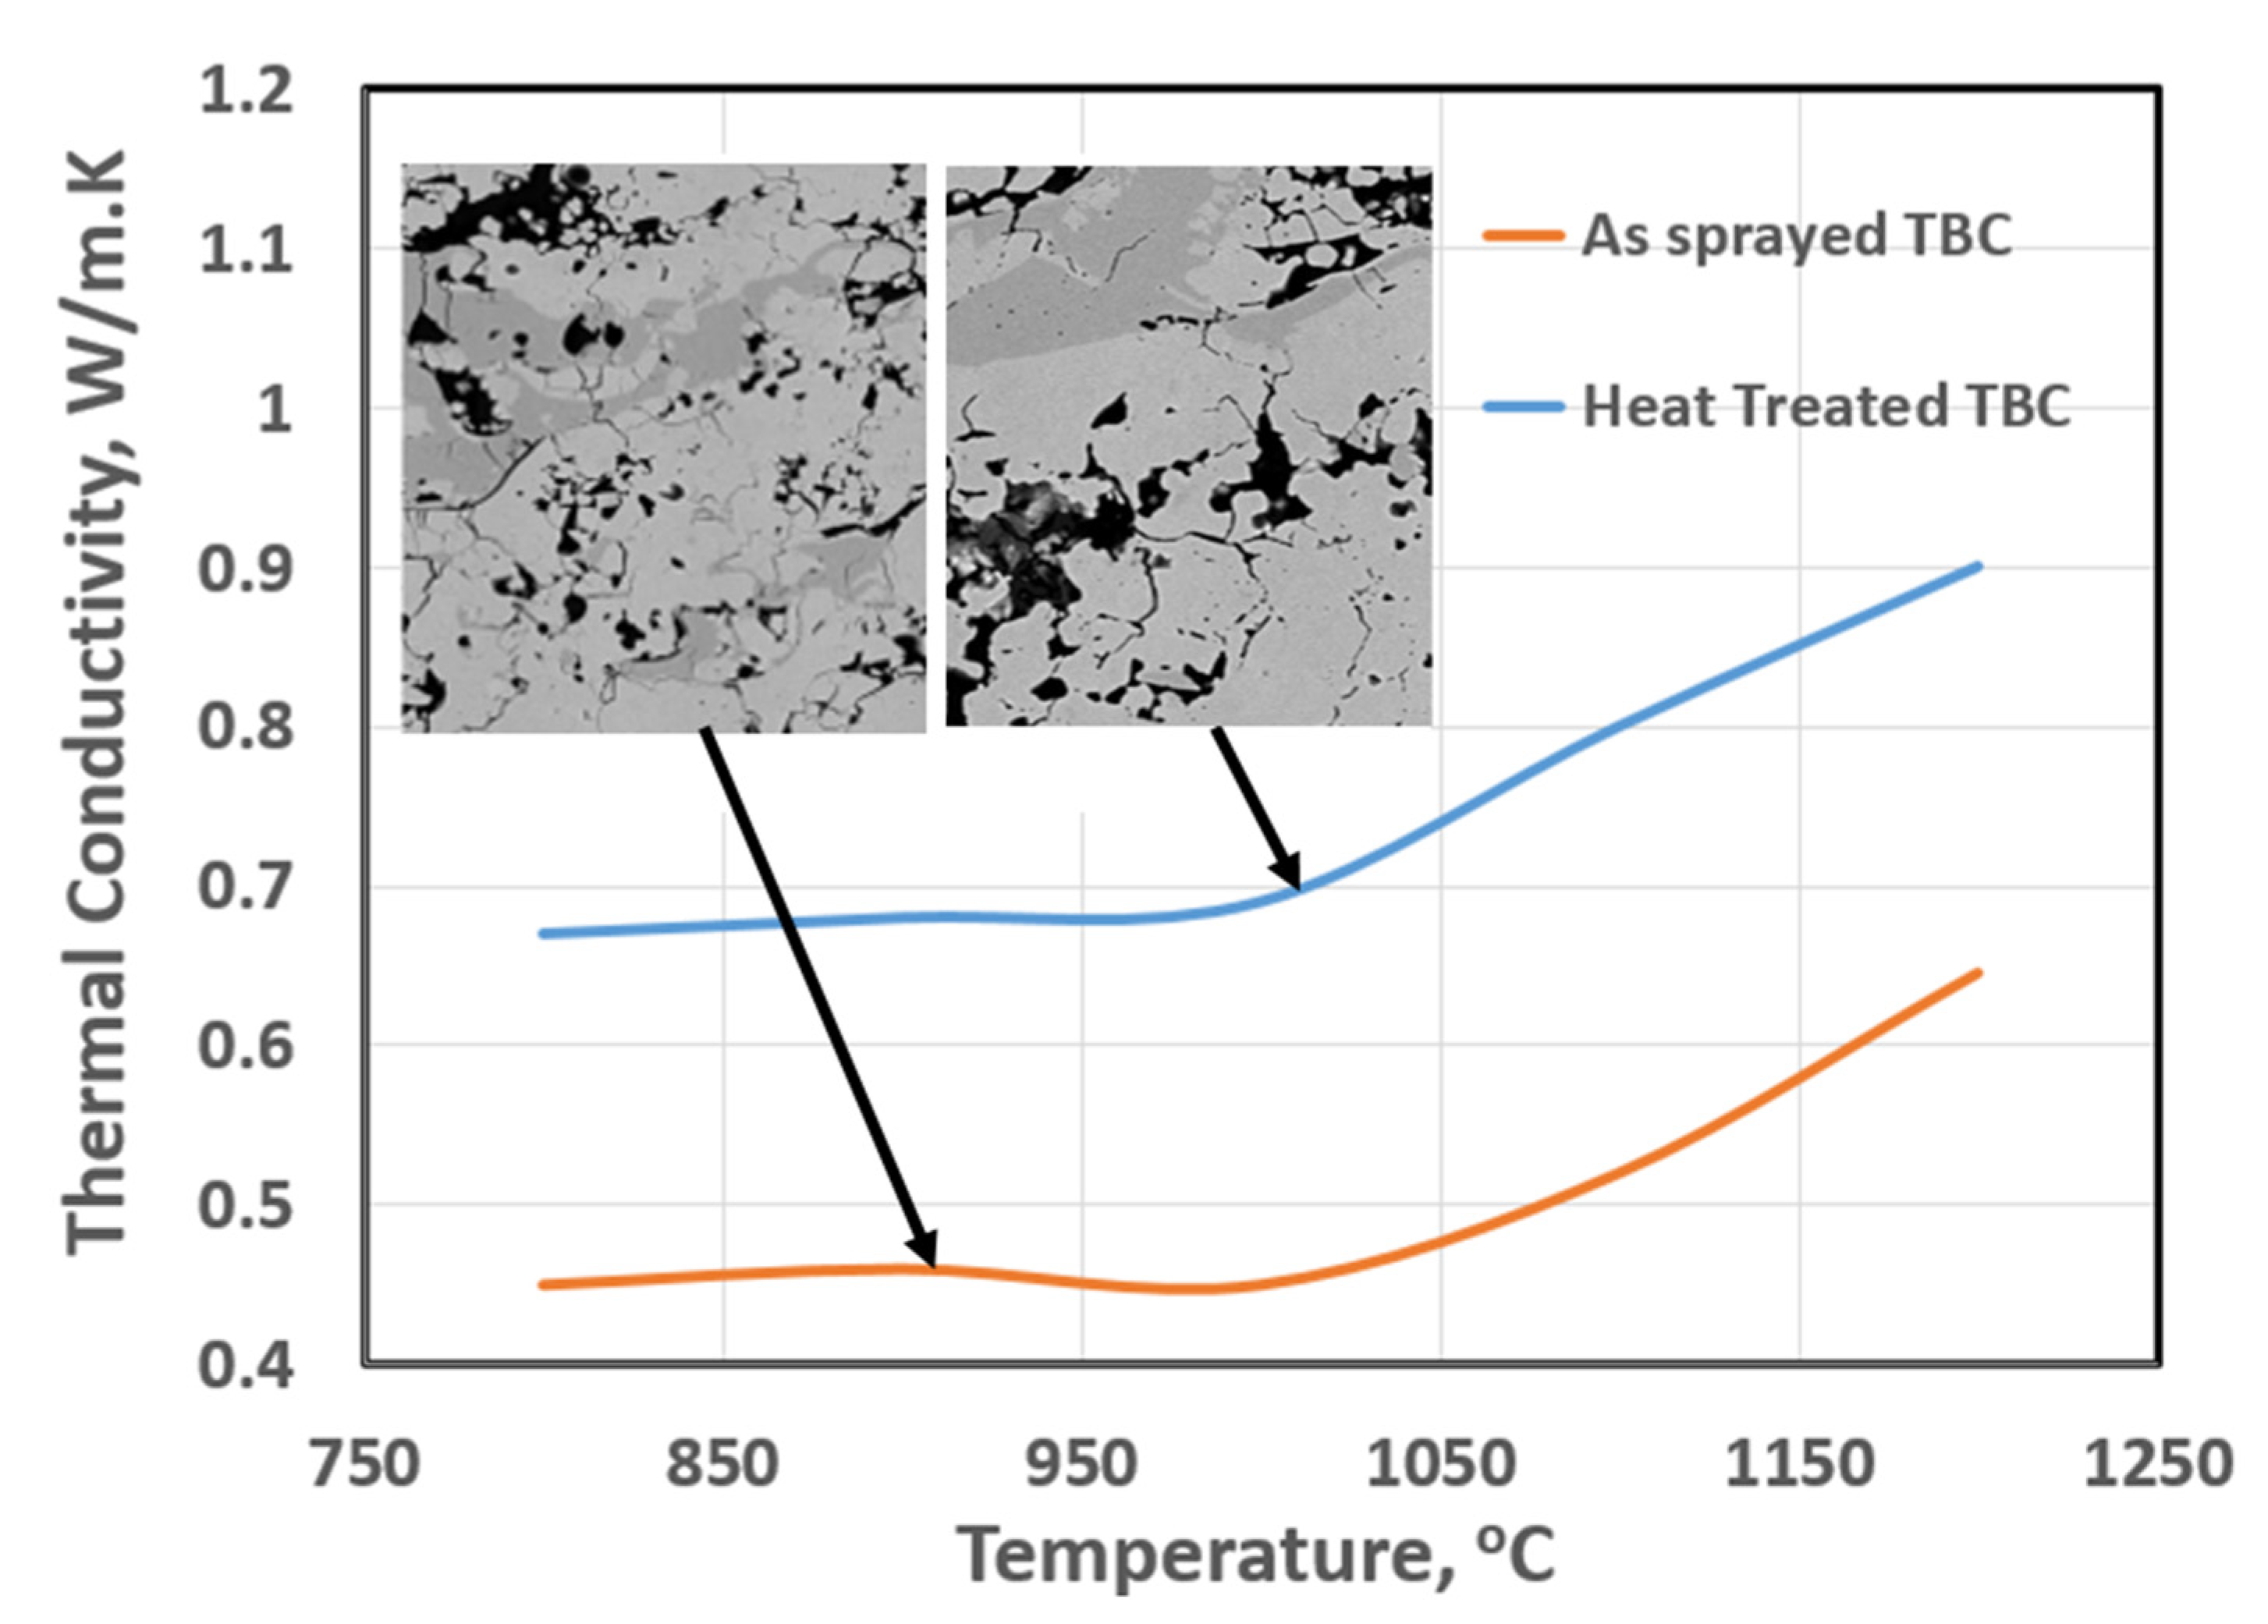
3.1. Thermal Stability and Sintering Behavior

The topcoat of two-phase TBC has a typically lamellar splat microstructure, with some randomly distributed pores, agglomerated porous clusters, and microcracks, as presented in Figure 3. After the isothermal aging test at 1300 °C, the microstructure of the two-phase ZrO2 TBC was examined, then the main microstructural features were characterized by SEM image analyses, as shown in Figure 6. The main findings of the sintering experiment include: (i) agglomerated fine particles were strongly sintered together, resulting in the disappearance of clusters and of pores within the clusters. (ii) The large pores at inter-splat boundaries remained or became spherical and larger. (iii) The splat boundaries were distinct after sintering, indicating that overall. sintering did not take place but was instead limited to localized areas, such as agglomerated particle/pore clusters, grain boundaries, and individual splats. Additionally, the lamellar grains underwent spheroidization and homogenization, while microcracks were healed and small-sized pores were annihilated within the porous clusters.
XRD spectra for the two-phase ZrO2 feedstock and TBCs before and after the thermal exposure are presented in Figure 7, covering diffraction angles at 2θ from 15° to 70°. The X-ray diffraction (XRD) spectra showed that the feedstock powder and as-sprayed topcoat both contained tetragonal (t’) and cubic (c) phases. After thermal exposure, no evidence of phase transformation to a new monoclinic phase was detected via software analysis. This indicates that the two-phase composite ceramic and topcoat demonstrate good thermal stability, which is further confirmed by the XRD results.
To investigate the coating changes in terms of physical properties, a microhardness of HV0.3 (load: 300 g) was recorded on the cross-sections of some TBC topcoats after thermal exposure for 100 h. The HV0.3 average value of the single-phase 8YSZ topcoat (t’) has increased significantly, from 607 to 949, by 56%; the HV0.3 value of another single-phase 20YSZ topcoat (c) has increased, from 590 to 860, by 46%. In contrast, the HV0.3 value of the two-phase ZrO2 topcoat (t’+c) is about 570 at the beginning of exposure, and 779 after 100 h, increasing by 37%, which has the lowest HV0.3 increase percentage among the tested TBCs. Additionally, ceramic sintering is responsible for TBC failure, due to the loss of fracture toughness and strain tolerance of the ceramics [30,31]. The fracture toughness of the as-sprayed TBCs was evaluated using Vickers micro-indentation techniques and Palmqvist crack equations. The results showed KIC values of 1.19 MPa m1/2 and 0.72 MPa m1/2 for two-phase zirconia TBC and Gd2Zr2O7 zirconate TBC, respectively. It is evident that the zirconia TBC has superior fracture toughness, which, in turn, provides better thermal and mechanical strain tolerance than the GZO TBC.
The thermal conductivity, K, of the two-phase TBC was measured up to about 1200 °C before and after the thermal aging at 1300 °C for 25 h, as shown in Figure 8. The K values for as-sprayed TBC are about 0.45~0.65 W/m K, in the temperature range of 1000~1200 °C, which demonstrates the merit of low thermal conductivity, as in other representative Low-K TBC systems [32,33,34]. With the thermal aging and sintering of the TBCs, it is expected that a negative impact on thermal conductivity will happen, which can partially be attributed to the coating densification. The dependence of the thermal conductivity of YSZ on temperature can be explained by a theory considering the effect of the scattering of phonons by point defects (oxygen vacancies and solute) and by the “hopping” of oxygen vacancies. It also considers an increase in the effective thermal conductivity at high temperatures, due to radiation. For the porous coating, it is believed that some pores will be annihilated and result in an increase in K value above 1000 °C. Based on microstructural observation, inspection, and analysis of the thermal behaviors of the tested TBCs, the phase composite TBC exhibited its superiority in terms of thermal stability, sintering resistance and low thermal conductivity capability.

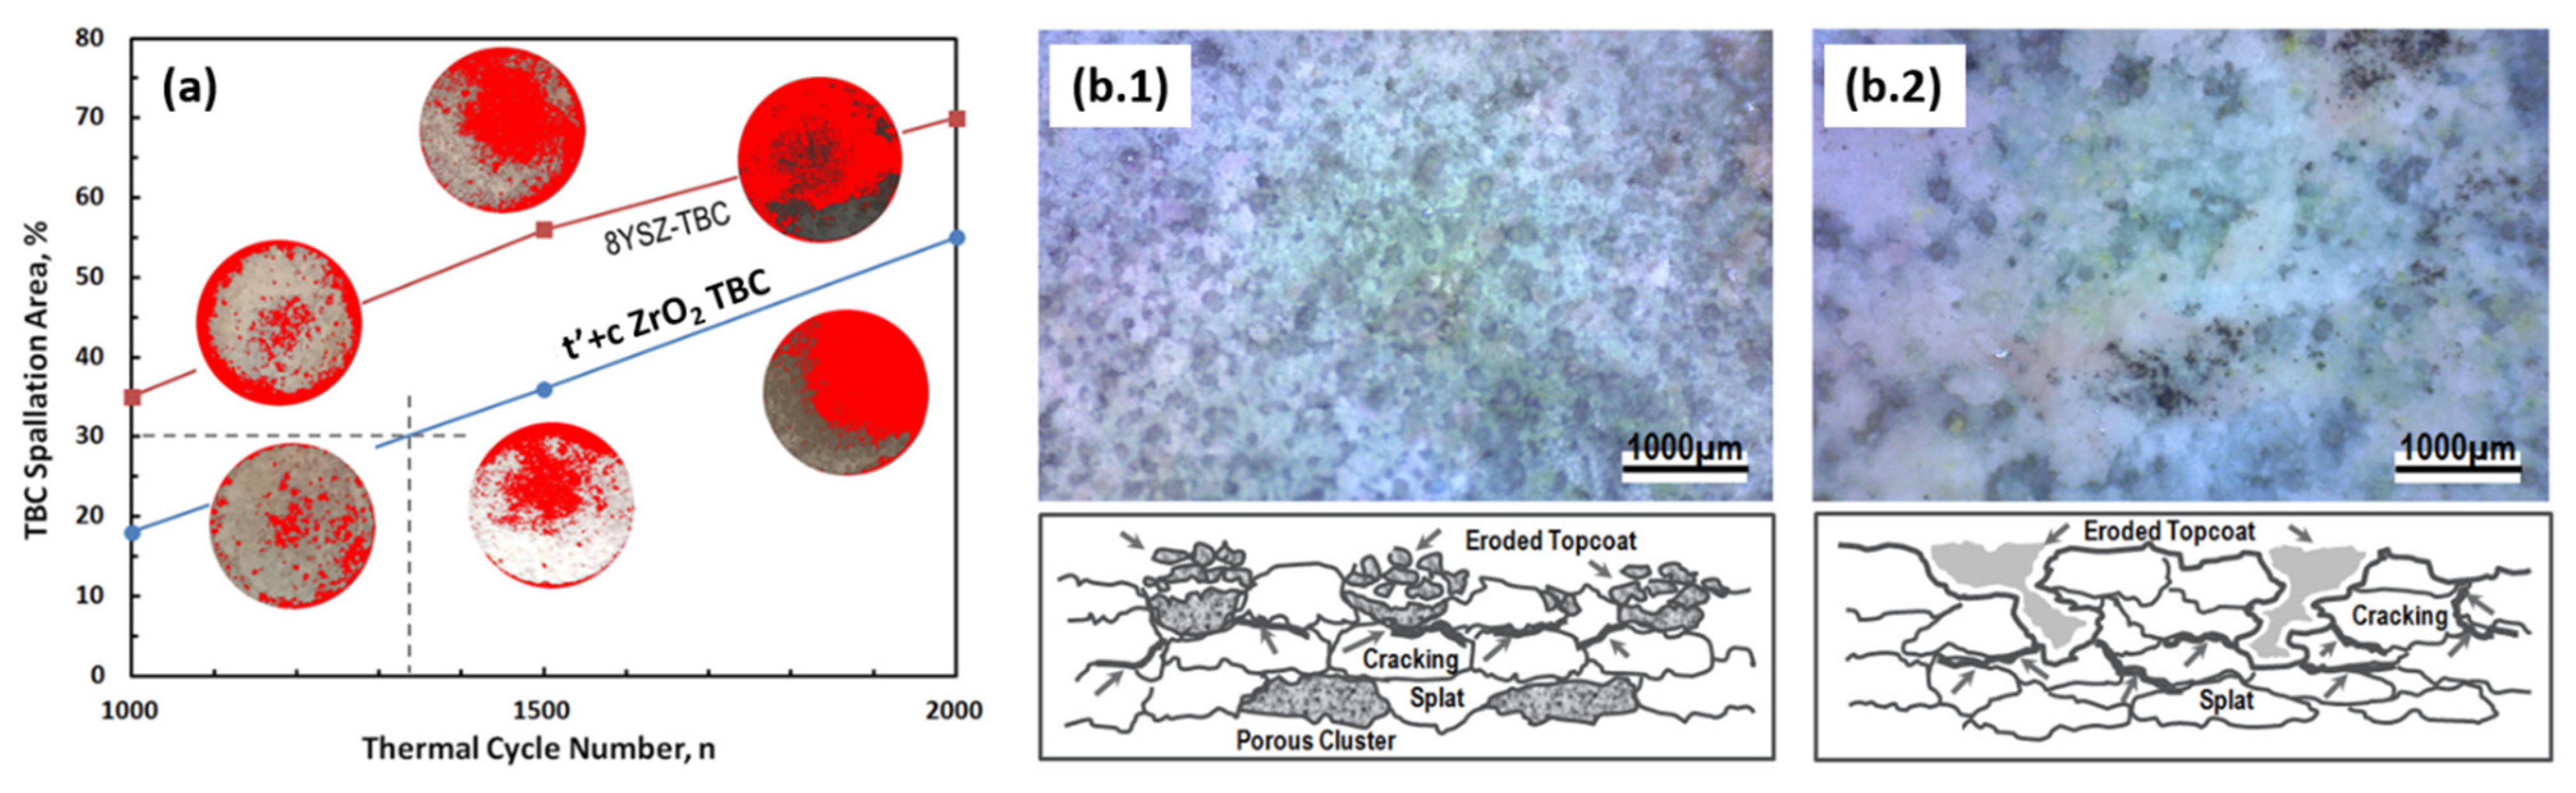
3.2. Thermal Shock Test

The thermal shock resistance of TBCs has been evaluated by the use of a burner rig tester (BRT). The behavior of the coatings was monitored throughout the test, using an infrared camera setup. Failure criteria for the coating were defined as the spallation of at least 30% of the total topcoat area. In fact, 8YSZ TBC is notably resistant to thermal shock, and, thus, was used as a benchmark to compare against the performance of a t’+c zirconia TBC and 20YSZ TBC or Gd2Zr2O7-based TBCs. The spallation areas on those TBCs were identified using the image analysis method and are shown in red color in Figure 9. A plot of the coating spallation percentage with increasing cycle numbers is also presented in Figure 9a. At 1000 cycles, the t’+c-phase ZrO2 TBC exhibited an approximately 17% failure, while the t’ 8YSZ TBC exhibited a 35% failure, which is close to the 30% threshold for the TBC failure criteria. Between 1000 and 2000 cycles, the t’+c phase TBC had a lower spallation percentage than the t’-phase TBC; however, both types of TBCs showed a linear increase in spallation percentage as the cycle number increased. Previous studies have indicated that both types of TBCs should be able to survive at least 2000 cycles in a furnace BRT test without experiencing intense gas velocity erosion damage. With this special BRT setup in the current study, it is assumed that the severe coating damage and failure were attributed to the combined factors of thermal-driven stress, due to rapid cooling and the large thermal gradient across the TBCs, and the erosive impact damage from the high-velocity gas stream on the topcoat surfaces.
The thermal shock test, conducted with a sample subjected to 1000 cycles, revealed that the spallation of the topcoat TBCs was mainly located around the edges, and gradually initiated TBC loss in the central areas. This phenomenon is attributed to the so-called edge effect, which occurs due to the sharp edge causing the localized concentration of thermal stress. The microstructure analysis of cross-sections of the TBCs identified locations of coating failure within the samples. Before the completion of 1000 cycles, it was discovered that failure occurred primarily within the topcoat or in the 8YSZ interlayer—topcoat interface; however, after this threshold was reached, the main failure migrated to the bond coat and topcoat interface. The surface photographs in Figure 9b indicate the uniqueness and differences in the TBC damage modes. The t’+c TBC is cavitation-like, with substantial localized coating loss, while the t’ TBC is tunnel-like, with deep hollow pockets down to the bond coat.
The failure mechanisms of TBCs under various burner-rig test conditions were thoroughly explored. Possible TBC failure modes addressed herein included delamination due to thermal and/or TGO-induced stresses, sintering, phase transformation, and erosion. Using the special burner rig setup employed in this work and experimental observation, it was determined that the spallation of the TBCs that was initiated on the edge regions was due to a concentration of thermal stress during the early cycling time, typically after fewer than 1000 cycles. This type of TBC edge spallation is commonly observed on disk-like specimens. As thermal cycling progressed, micro-cracking began to spread, both within the splats and along the boundaries of said splats (Figure 9b). When the high-velocity gas stream impacted the TBC surfaces, it could attack the defective splats in the topcoats preferentially and erode the coating material selectively, eroding material from the porous and cracked coating areas. The t’+c phase TBC sample has multiple-mode porosity, including porous clusters that are more prone to erosion loss, as observed from the surface photographs in Figure 3 and Figure 6. The TBC sample with a single-mode porosity structure demonstrated poor resistance to localized erosion attacks, resulting in a tunnel-like coating loss due to splat chipping, caused by intense thermal stress and high-velocity gas impact. Conversely, the multiple-mode TBC showed greater strain tolerance under thermal cycling conditions and, thus, exhibited lower spallation rates. The linear relationship between coating loss and the number of cycles indicates that damage to the TBCs was progressive and continuous along with the increasing cycles. This behavior is distinct from that observed in furnace BRT tests conducted solely under thermal cycling conditions; the combined effect of primary thermal cycling (leading to cracking of coatings and laminar delamination of splats) along with the secondary impacts of high-velocity gas (leading to fatigue, erosion, and material removal) meant that the TBCs experienced increased degradation.

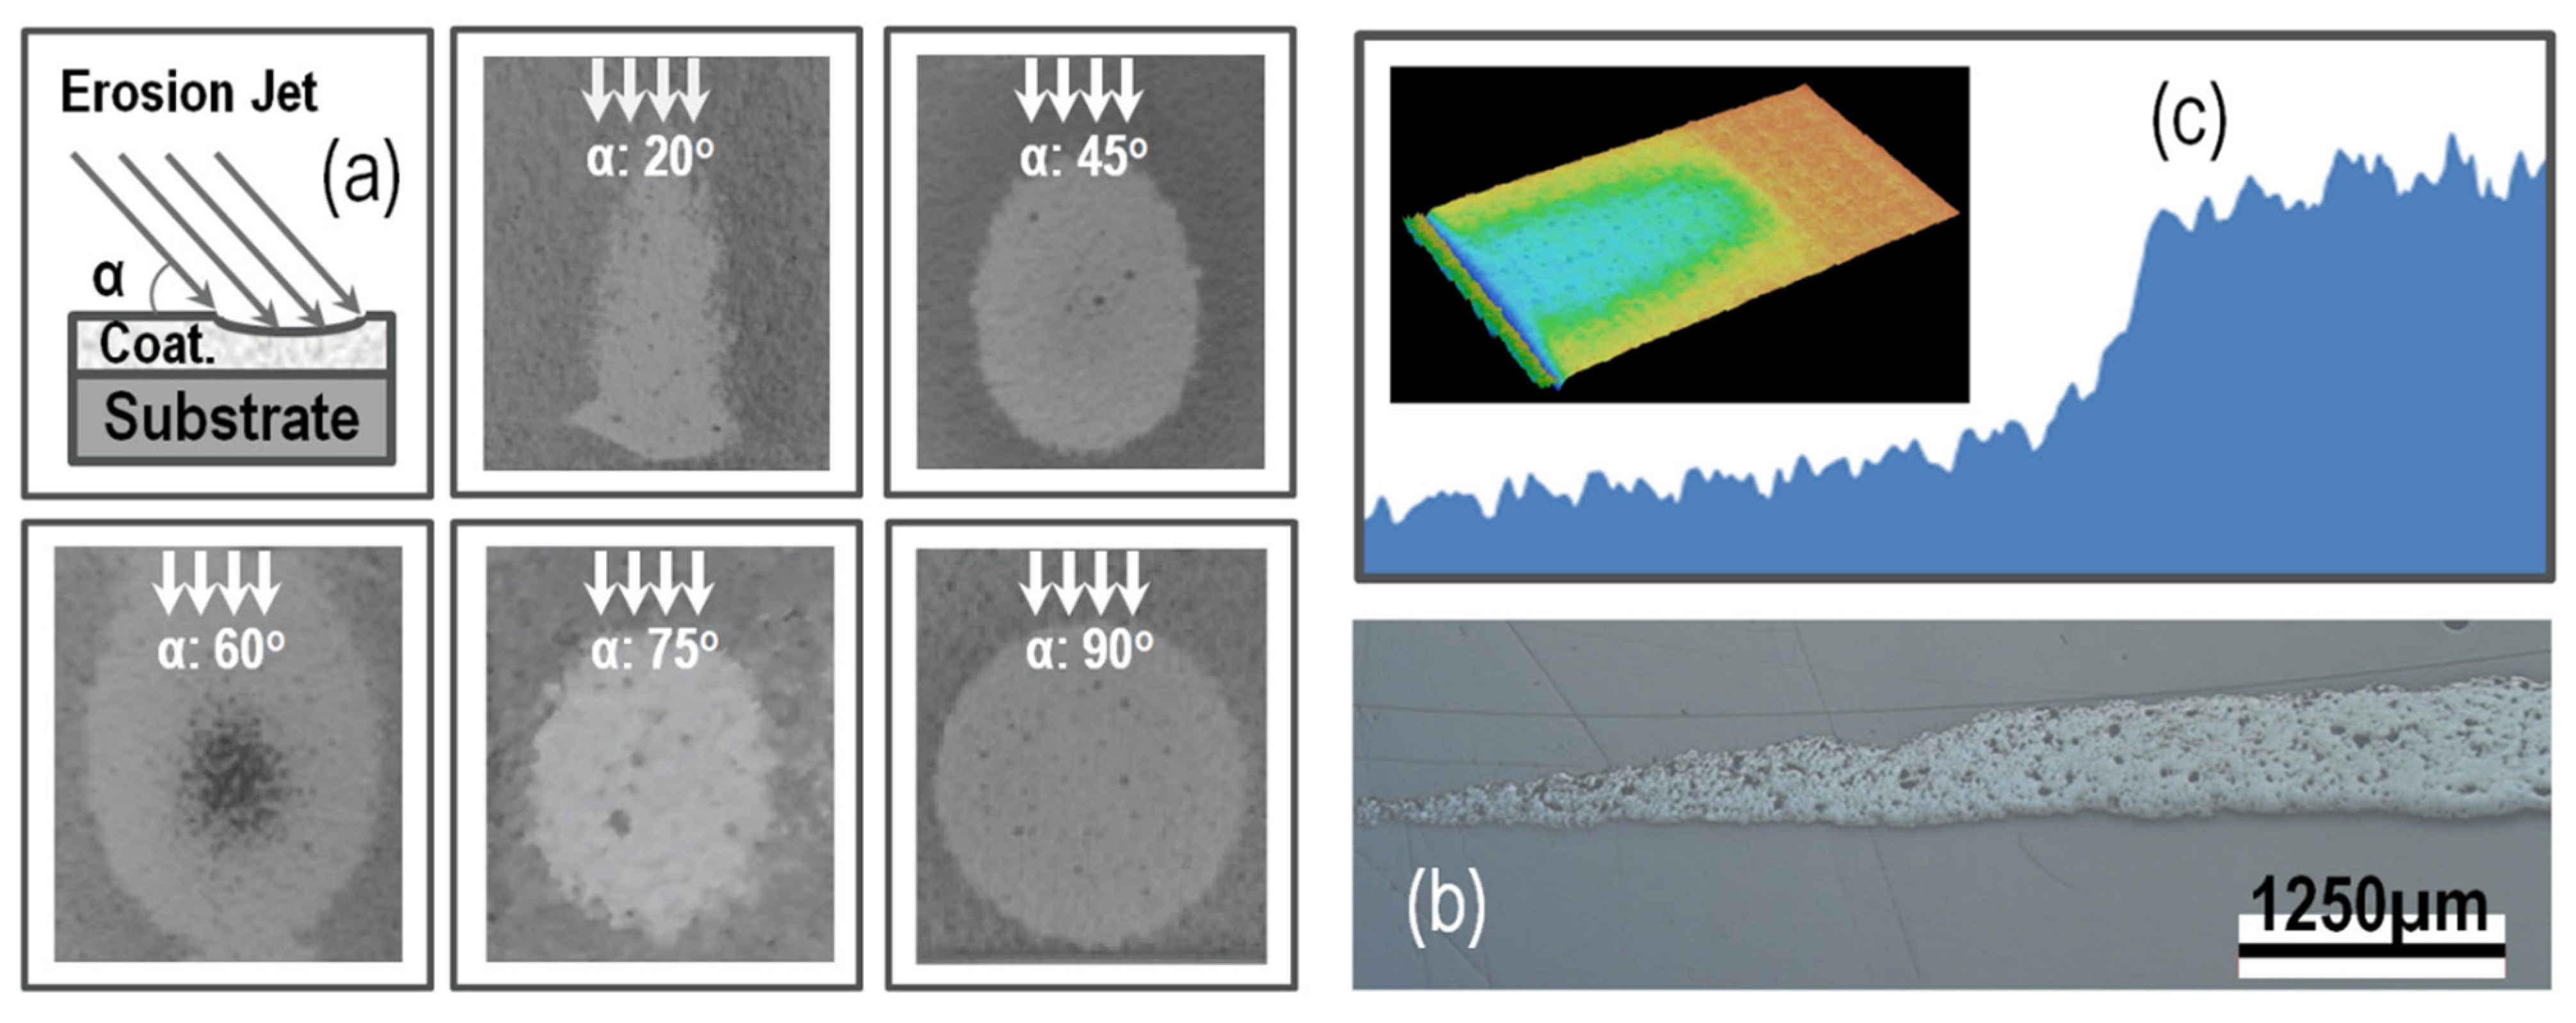
3.3. Solid Particle Erosion Test

Zirconate-based thermal barrier coatings (TBCs), such as Gd2Zr2O7 or La2Zr2O7, are known to have a higher temperature capability than zirconia-based TBCs, but they have inferior erosion resistance. These materials are considered as promising candidates for next-generation TBCs. Therefore, the erosion resistance of the t’+c phase TBC was tested and compared with a single-phase Ga2Zr2O7 TBC. The morphologies and surface profiles of the TBC specimens after the erosion tests were inspected on the eroded surfaces with an optical microscope and a digital microscope, and some results are given in Figure 10, which shows the dependence of the geometry and size of the erosion scars on impingement angles from 20° to 90°. Macro-photographs of the eroded scars indicate that the width of the erosion scars increased with increasing impact angles, and that the geometry of these marks changed from an elongated ellipse shape to a near-round shape. Furthermore, there were three distinct erosion regions that were identified: (i) Zone 1, which was located at the center of each scar and featured the greatest amount of erosion; (ii) Zone 2, which was situated between the center and the outer edge region and experienced medium levels of erosion; and (iii) Zone 3, found in the outer edge region and exhibiting the least erosion. It was observed that the maximum depth of erosion always occurred in Zone 1 due to the uneven distribution of grit particles across radial areas, as identified by other studies. As such, it is difficult to accurately characterize the erosion rate of coatings by measuring the maximum thickness lost, using a measurement tool such as a micrometer. As represented in Figure 10c, a digital 3D microscope was used as a useful and necessary tool for the precise measurement of the surface profile, to determine the maximum eroded depth after the SPE tests.
The erosion rates for the TBC specimens were determined using three methods. The results of the erosion rates measured using method 1, recording the erosion rate at µm/s, are shown in Figure 11a. Other methods were used; method 2 measured the erosion rate at g/s (coating mass loss), while method 3 measured the erosion rate at g/g (coating mass loss/grit mass). Figure 11b provides a comparison of the erosion rates resulting from the three methods. The results can be summarized and interpreted as follows:
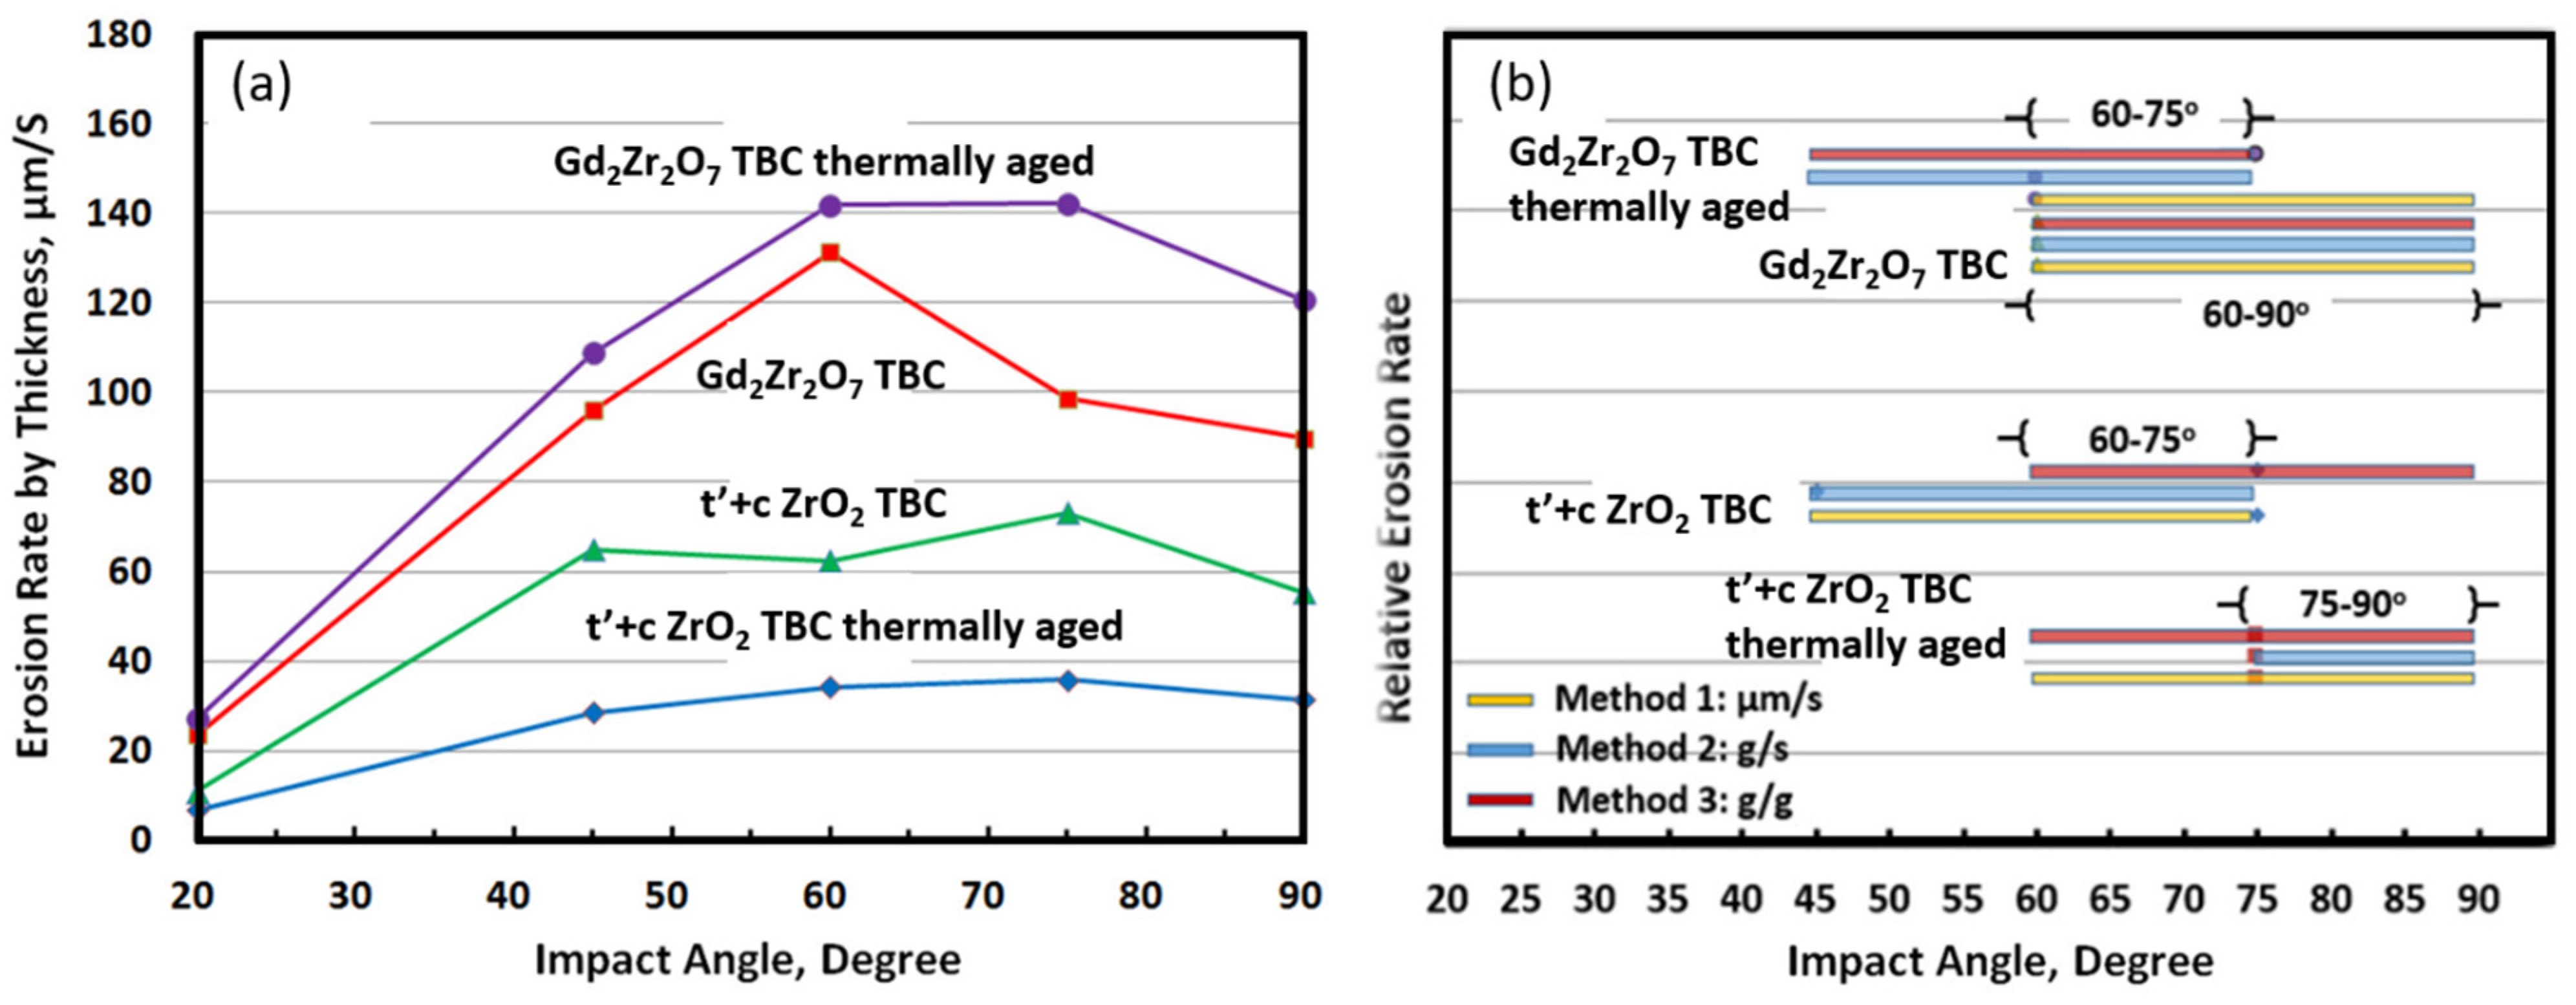
  • Among all the specimens, the group of phase composite TBCs showed much lower SPE erosion rates than the group of zirconate TBCs.
  • The sintering treatment at 1300 °C was more influential for the t’+c phase TBCs in reducing the erosion rate relative to the Gd2Zr2O7 TBCs. However, the thermal aging of the Gd2Zr2O7 TBCs had little effect on the erosion rate.
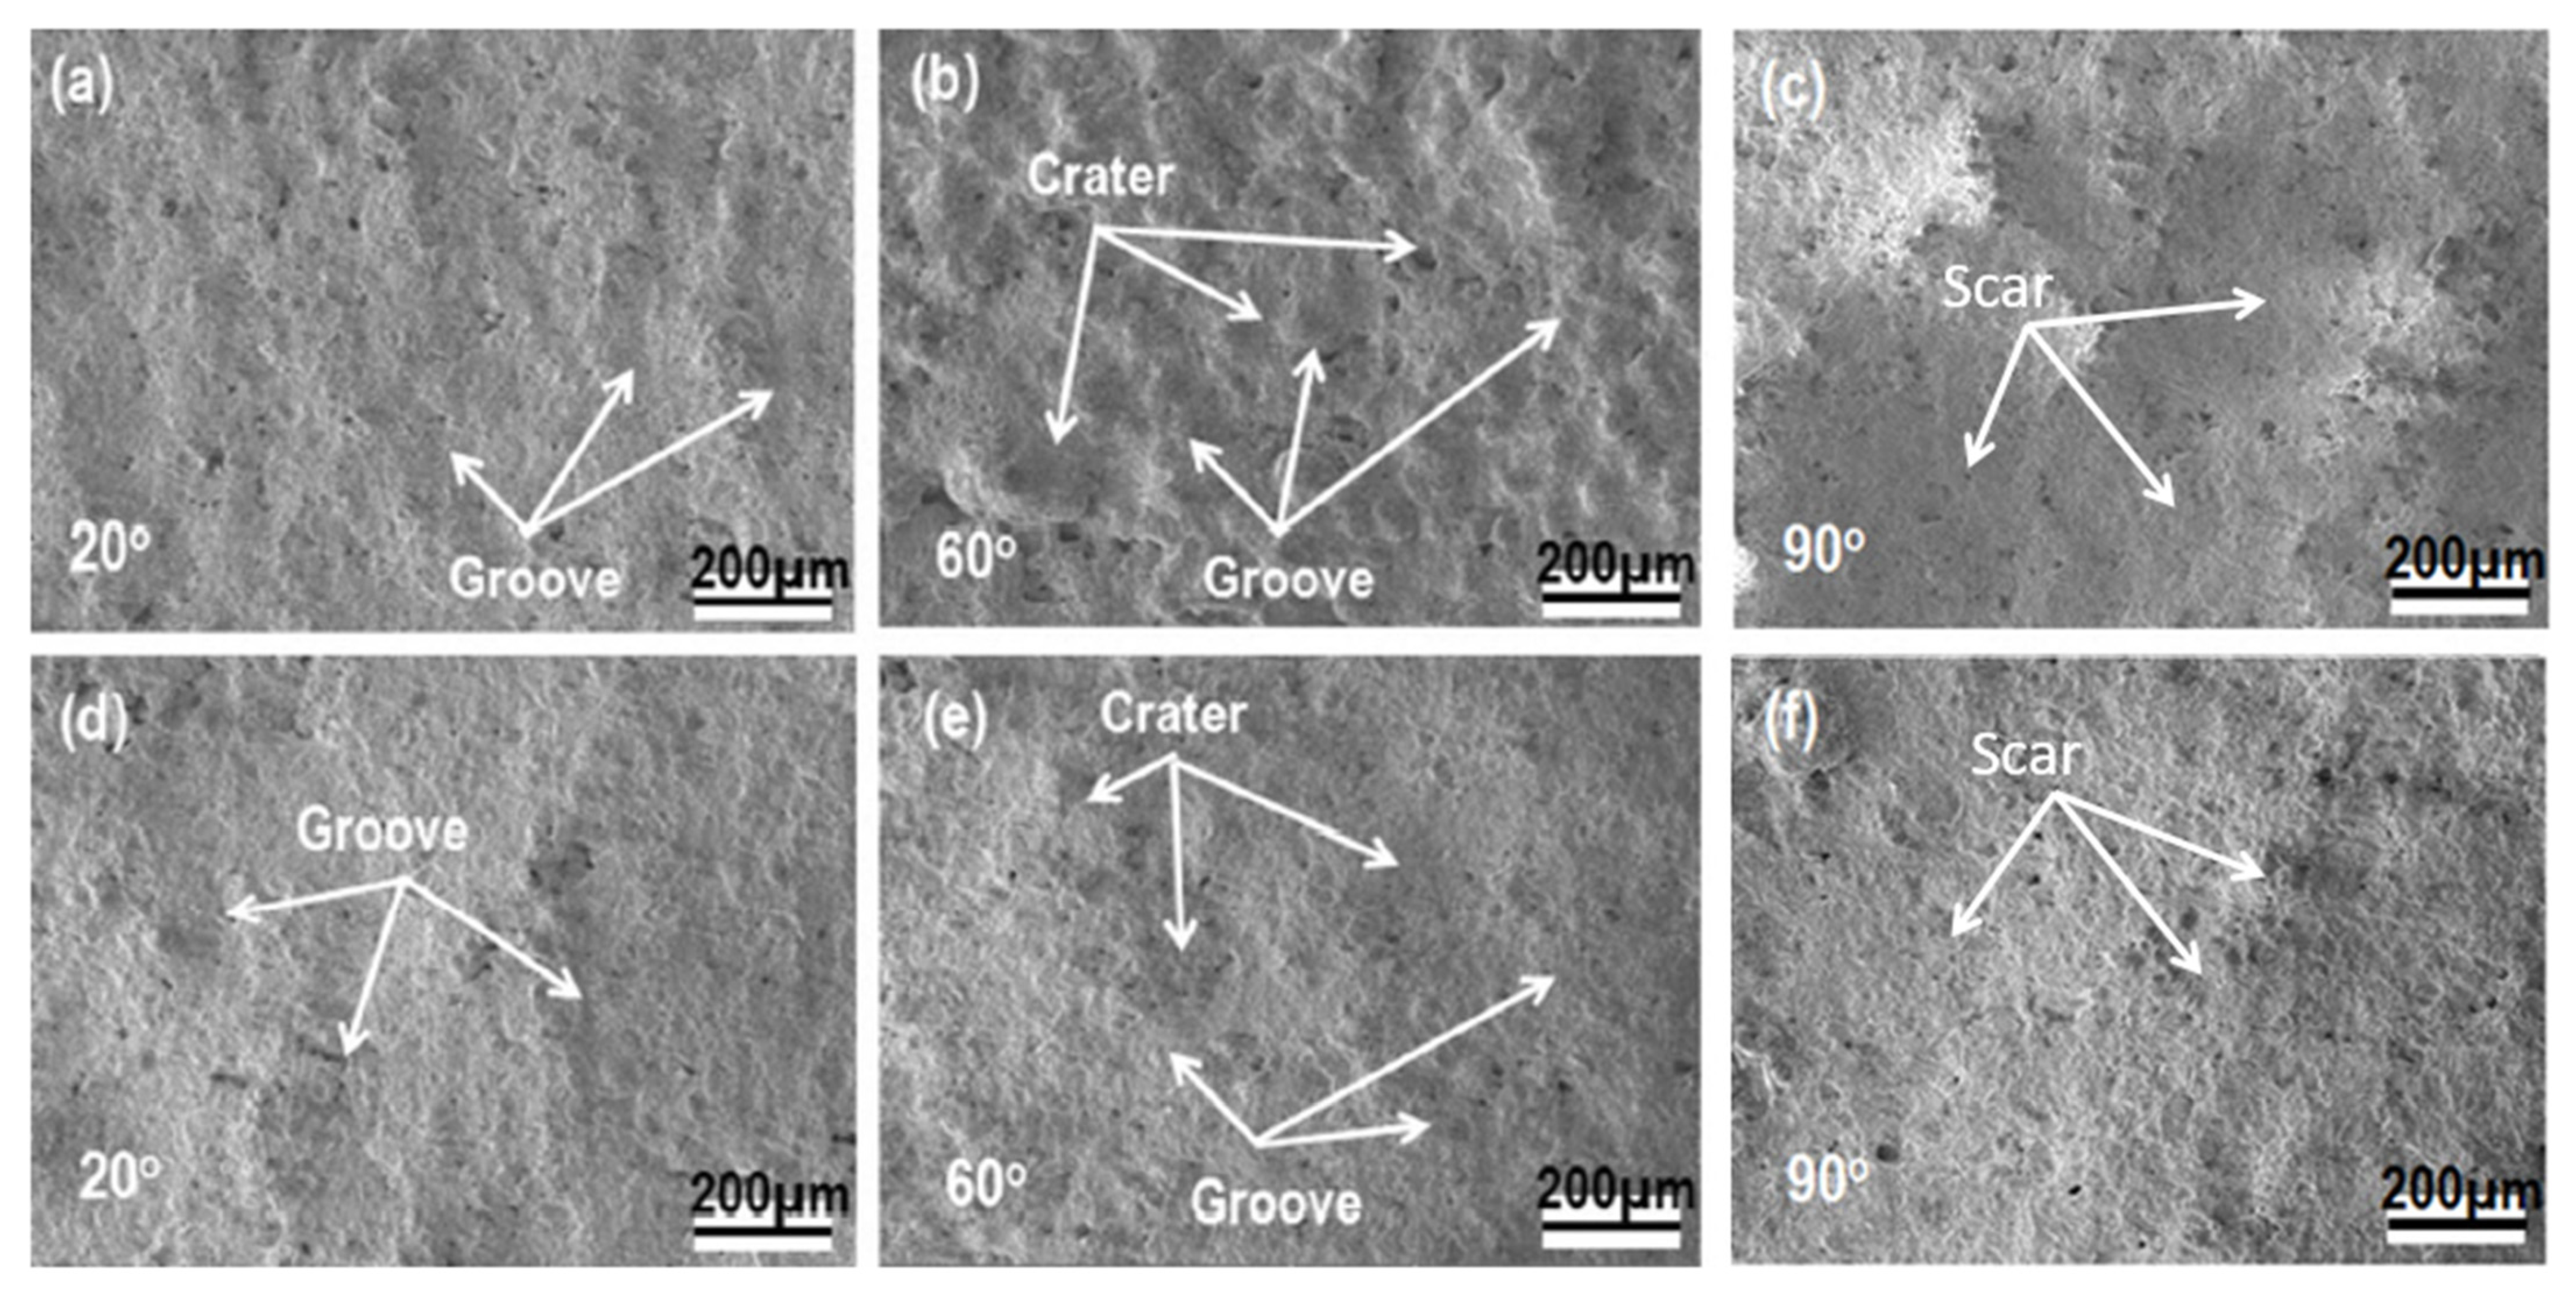
  • It has been clearly demonstrated that the impinging angle of the TBCs has a substantial impact on their erosion behaviors. Samples exposed to angles greater than 60° exhibited significantly increased rates of erosion. It appears that a mode combining both brittle and rough material properties is best suited for describing the erosion behavior of both groups.
  • The comparison of erosion rates obtained from three separate methods revealed the presence of commonly overlapping regions of high erosion rates, as a function of the impact angle. For instance, in the case of an as-sprayed composite TBC, an overlapping region of high erosion rates was observed to be between 60°~75°, while in the aged composite TBC, this shifted to 75°~90°. This shift may suggest that the sintering treatment has caused a variation in the primary cause of erosion losses. Consequently, these common regions for each type of TBC can serve to indicate the dominant erosive behavior with respect to impact angle. The maximum erosion rate observed can be attributed to two distinct mechanisms, namely, a ductile erosion mechanism for alloy materials at lower impact angles and a brittle erosion mechanism for ceramic materials at higher impact angles. The topcoat coating is composed of a ZrO2-based ceramic material, which is known for its high toughness as well as its porosity. This composite material exhibits both ductile and brittle properties when subject to an intermediate impact angle.
Figure 11. Plots of the results of SPE erosion rates as a function of impingement angle: (a) erosion rate measured by the maximum thickness loss per erosion time, µm/s; (b) comparison of erosion rates, as characterized by three evaluation methods.
Coatings 13 00210 g011
Surface topographic photos were taken of the eroded TBCs using SEM and are shown in Figure 12. SEM images of two types of TBC coatings at different impact angles revealed various key features: (i) low-angle samples showed distinct eroded grooves or plunges along the impinging direction; (ii) medium-angle samples displayed a combination of oriented grooves and craters; (iii) high-angle samples presented even surface roughening; (iv) the t’+c YSZ–TBC showed higher surface roughness, compared to Gd2Zr2O7 TBC, with both ductile and brittle characteristics. These findings suggest that erosion initially takes place in the low-density regions of the TBC samples. Previous studies have also indicated that the coating porosity can be reduced from 13%~15% to 8%~10% when plasma power is increased by 15%~20%. As a result of this density increase, the erosion resistance of the t’+c YSZ–TBC may be improved due to the decrease in weakly connected areas, mainly porous clusters in the coating. Therefore, the zirconate TBC may experience decreased erosion resistance due to the loss of its fracture-toughness KIc, as described by the brittle-mode failure mechanism. The erosion results of the as-sprayed and sintered TBCs in Figure 11 supported the above analyses regarding the effect of coating density on the different erosion behaviors of the two TBC systems.
The solid particle erosion (SPE) behavior of a coating system can be affected by various factors, at least in terms of including the complex interaction between the erosion factors with the impacted surface, as revealed in previous studies [35,36,37]. As to the erosion mechanisms for typical TBCs, three different types of SPE were reported, based on the observation of eroded areas on the tested coatings [38,39]. The erosion test results indicated that the as-sprayed composite TBC had a significantly lower erosion rate than the aged TBC, which can be attributed to its higher fracture toughness, KIC. Further thermal aging at 1300 °C caused the sintering of the coating and subsequently reduced the fracture toughness. This reduction in fracture toughness explains the observed result that after aging treatment, the aged TBC was worse at resisting erosion damage. In light of all the obtained data, it can be concluded that a combined ductile/tough and brittle mode is better suited for describing the erosive wear behavior of TBCs, particularly when examining samples with high impingement angles.

3.4. CMAS Corrosion Test

The samples of TBC were examined in air at 1250 °C for 5 h, with a CMAS dosage of approximately 35 mg/cm2. The effect of the YAG additive on the two-phase TBC sample to improve its resistance to CMAS was compared with 8YSZ and t’+c phase TBC samples. All the tested samples showed varying levels of damage due to attacks from CMAS. The 8YSZ TBC sample experienced the most significant deterioration, as demonstrated by spallation, mass loss, and deep penetration into the topcoat. Delamination and separation occurred over multiple layers when viewed from above. The t’+c-phase TBC sample exhibited cracking behavior within the coating, and the evidence suggests that CMAS penetrated only the near-surface region of the topcoat. However, nearly half of the entire coating area experienced the spallation loss of ceramic material. The YAG–modified TBC sample showed enhanced resistance to CMAS by reducing the material loss and keeping the damage localized to certain areas. No coating spallation occurred; instead, buckling of the material was observed in the topcoat as a result of primary coating failure. A visual inspection before and after cooling from 1250 °C to room temperature revealed that damage had occurred during this process, with a layer of approximately 100 µm being removed from the surface of the coating. It is assumed that this layer is formed due to CMAS infiltration in the layer, and the “dark grey” phase could be a new phase due to the reaction between the CMAS and the YAG composite material, as shown in Figure 13. Based on the depth of the CMAS infiltration, it can be concluded that the addition of YAG to the composite ceramic matrix has inhibited the mobility of the CMAS attack frontier, thus slowing down the coating damage to some degree.
Long-exposure CMAS corrosion tests were conducted for the aforementioned TBC samples at 1250 °C for 120 h, with the purpose of further investigating the degree of CMAS attack and the failure mechanisms of the TBC samples with different chemical compositions. Firstly, it is confirmed that the CMAS attack becomes more severe and leads to more damage to those same TBC samples with increased exposure times. Secondly, in the case of the 8YSZ TBC sample, the most severe CMAS attack on the topcoat was observed. The topcoat delaminated and spalled almost entirely at the bond coat and topcoat interface. This indicates that the TBC had lost the protection given by the topcoat. The t’+c phase TBC sample shows multiple layered separation and partial spallation, leading to substantial material loss. The coating damage occurred mostly within the ceramic layer and at the interface of the 8YSZ layer and the composite layer. Thirdly, the t’+c+YAG phase TBC sample exhibited the best CMAS attack resistance among the three TBC samples, although the CMAS attack and coating loss are still quite visible. A small area of the original coating surface is reserved with the spallation, while the rest of the coating area is removed evenly, possibly indicating a more uniform CMAS attack in the coating region. The microstructures of the tested TBC samples reveal the CMAS penetration and migration into the coatings in various ways.
The CMAS-attacked tri-phase TBC samples were subsequently examined via an analysis using SEM/EDXS methods. The cross-sectional views of the TBC of the 120–hour exposure samples are given in Figure 14, and the element chemical analysis results are in Table 2. There are three zones by color contracts. In addition, a dark surface layer above the coating is detected. The compositions of the three zones were found to be similar to those observed in the sample exposed to CMAS for 5 h, suggesting that the attack process is consistent. The dark surface layer was chiefly composed of CMAS elements, along with Al and Y originating from the YAG, indicating a reaction between CMAS and YAG on the coating surface during long-term exposure. This reaction product was determined to be NaO26Si6Y9 via X-ray diffraction analyses conducted on a mixture of CMAS and tri-phase TBC. The coating separation takes place in the inner coating (Figure 14a), corresponding to the severity of a CMAS attack with increasing exposure time.
The effect of CMAS dosage on the CMAS corrosion behavior of two-phase TBC was tested in air at 1250 °C for 25 h, with the surface dosages of CMAS sand of 5, 15, and 35 mg/cm2, respectively. The surface morphologies and the cross-section microstructures of the tested TBC samples are examined and the paths of CMAS infiltration into the coatings are schematically shown in Figure 15. The effects of CMAS on TBC samples are evident, with the degree of damage increasing in accordance with an increase in CMAS dosage. Damage modes for the TBC samples include surface buckling at a mass load of 5 mg/cm2, major cracking and delamination or spallation within the ceramic layers at 15 mg/cm2 and catastrophic spallation at the bond coat/topcoat interface at 35 mg/cm2. The distribution of molten CMAS that had adhered to the TBC surfaces shows discontinuous coverage at a low dosage of 5 mg/cm2; in addition, there was locally concentrated coverage at a medium dosage of 15 mg/cm2, and nearly complete coverage at a high dosage of 35 mg/cm2. This infiltration process is divided into two stages: wetting and the spreading of molten CMAS on the TBC surfaces.
This process begins with a short-time spread-out stage, followed by a long-duration liquid flow stage. It has been reported that CMAS melts and wets the surface of samples at 1250 °C, with the dynamic contact angles decreasing drastically over time during this spreading process; contact angles range from 3° to 20°, depending on the substrate. In thermal sprayed TBCs, these contact angles can vary, due to factors such as roughness, or grain size defects in the coating. Upon reaching a steady state in the spreading process, infiltration follows, beginning from the locations of coating defects. In Figure 15, several types of coating defects are indicated in the TBC topcoat. Cracking Type 1 refers to the intrinsic cracking of a coating that occurs during its formation, with dimensions typically being on the microscale. Cracking Type 2 is caused by the penetration and associated strain due to CMAS; this typically has macroscopic dimensions. Cracking Type 3 develops as a consequence of Cracking Type 2, leading to delamination, spallation, and/or the buckling of the coating. Macro- and micro-porosities in these coatings provide entry points for CMAS penetration when molten. Following entry, CMAS will continue to penetrate into the coating via defects such as widespread cracks and large pores.
The effects of CMAS dosage on the penetration behaviors of the tested TBC samples can be explained as follows. In the case shown in Figure 15a, with a low CMAS dosage, the molten CMAS is only dispersed locally due to its lacking sufficient mass and/or surface-wetting qualities. The low coverage reduces the number of possible CMAS infiltration start points by means of surface macro-sized defects (interconnected pores and open cracking). In the case shown in Figure 15b with a medium CMAS dosage, the CMAS coverage is increased and there are more defective locations available for CMAS penetration. In the case shown in Figure 15c, with a high dosage of CMAS, the coating surface should be fully covered by a layer of molten CMAS, so that the likelihood of CMAS infiltration is maximized. The CMAS layer can also provide a sufficient supply for continuous penetration from the coating surface to the inner coating, finally reaching the interface of the topcoat and bond coat. In the earth’s atmospheric environments, the concentration of sand particles such as PM2.5 has been investigated. Relatively low levels of fine dust are reported as 5~35 µg/m3 [40]. However, some natural events, such as volcanic eruptions and dust/sandstorms, led to elevated levels of fine particulates that are as high as 13,000 µg/m3 [41]. The ingestion of those dust particles into gas turbine engines can cause severe hot-section component damage for both military and commercial aircraft when operating. At present, the safe operating level for GTEs is set to below 2000 µg/m3 [42]. In this study, the effect of CMAS dosage on the CMAS attack severity was confirmed, and the most aggressive attack was confirmed at the highest dosage of 35 mg/cm2.
The beneficial effects of certain additives, such as YAG, RE oxides, and their compounds, have been explained by the optical basicity theory [43,44,45]. Trucer et al. proposed the use of optical basicity as an initial criterion for selecting CMAS-resistant environment-barrier coatings (EBC) made from ceramic materials. Specifically, they identified Si-free YAlO3, γ-Y2Si2O7, β-Yb2Si2O7, and β-Sc2Si2O7 ceramics as promising choices, due to their small difference in optical basicity with respect to CMAS (typically, 0.55~0.65 W/m K). It has been shown that large discrepancies between the optical basicities of CMAS formers and thermal barrier coatings (TBCs), which are typically greater than 0.8, result in more severe degradation and the attacking of the TBC. Kumar et al. showed that a YAG TBC (Λ = 0.70) has a lower K when there are two types of CMAS used, compared to a conventional YSZ TBC (Λ = 0.87). The reactivity and resultant damage caused by the CMAS attack were found to be substantially lower for the YAG TBC samples. It is theorized that this effect can be attributed to the transition of CMAS into crystalline phases, as well as the inhibition of reactive oxides in reducing corrosion. These theories are applicable to the improved resistance to CMAS corrosion that was observed in both two-phase and YAG-modified tri-phase TBC samples.

4. Conclusions

This study aimed to explore a path toward developing durable TBCs with improved multi-properties that are capable of handling extreme environment applications. A novel concept using phase composite ceramics was adopted for the topcoat material design and the fabrication of the phase composite TBCs via the APS process. The advantages of the exemplary TBCs with dual-phase and tri-phase structures over the single-phase TBCs were demonstrated in a variety of property tests:
  • The thermal exposure test at 1300 °C was performed to evaluate the phase thermal stability and sintering behavior of two-phase composite TBCs. The XRD analysis results indicate that high phase stability was achieved without phase transformation. In terms of the single-phase 8YSZ-TBC, the phase composite TBCs show better thermal sintering resistance.
  • Thermal conductivity K, for the as-sprayed two-phase TBCs was measured as 0.45~0.65 W/m K at the temperature range of 1000~1200 °C. This demonstrates the merit of low-thermal conductivity TBC. Thermal aging at 1300 °C led to an increase in K values.
  • The burner-rig test was proven to significantly accelerate the TBCs’ deterioration and failure. The thermal cycling lifetime of the t’+c phase composite TBC is acceptable and is comparable to that of the baseline of the single t’-phase, 8YSZ-TBC.
  • The results of the solid-particle erosion show that the erosion rates of the TBCs tested strongly depend on the impingement angle, while the highest erosion rates existed in the medium- and high angle ranges from 60° to 90°. The t’+c zirconia TBC has demonstrated low erosion rates relative to the single-phase zirconate TBC. The combined mode of ductile or tough and brittle modes had been utilized to elaborate the TBCs’ erosion behaviors and erosion mechanisms.
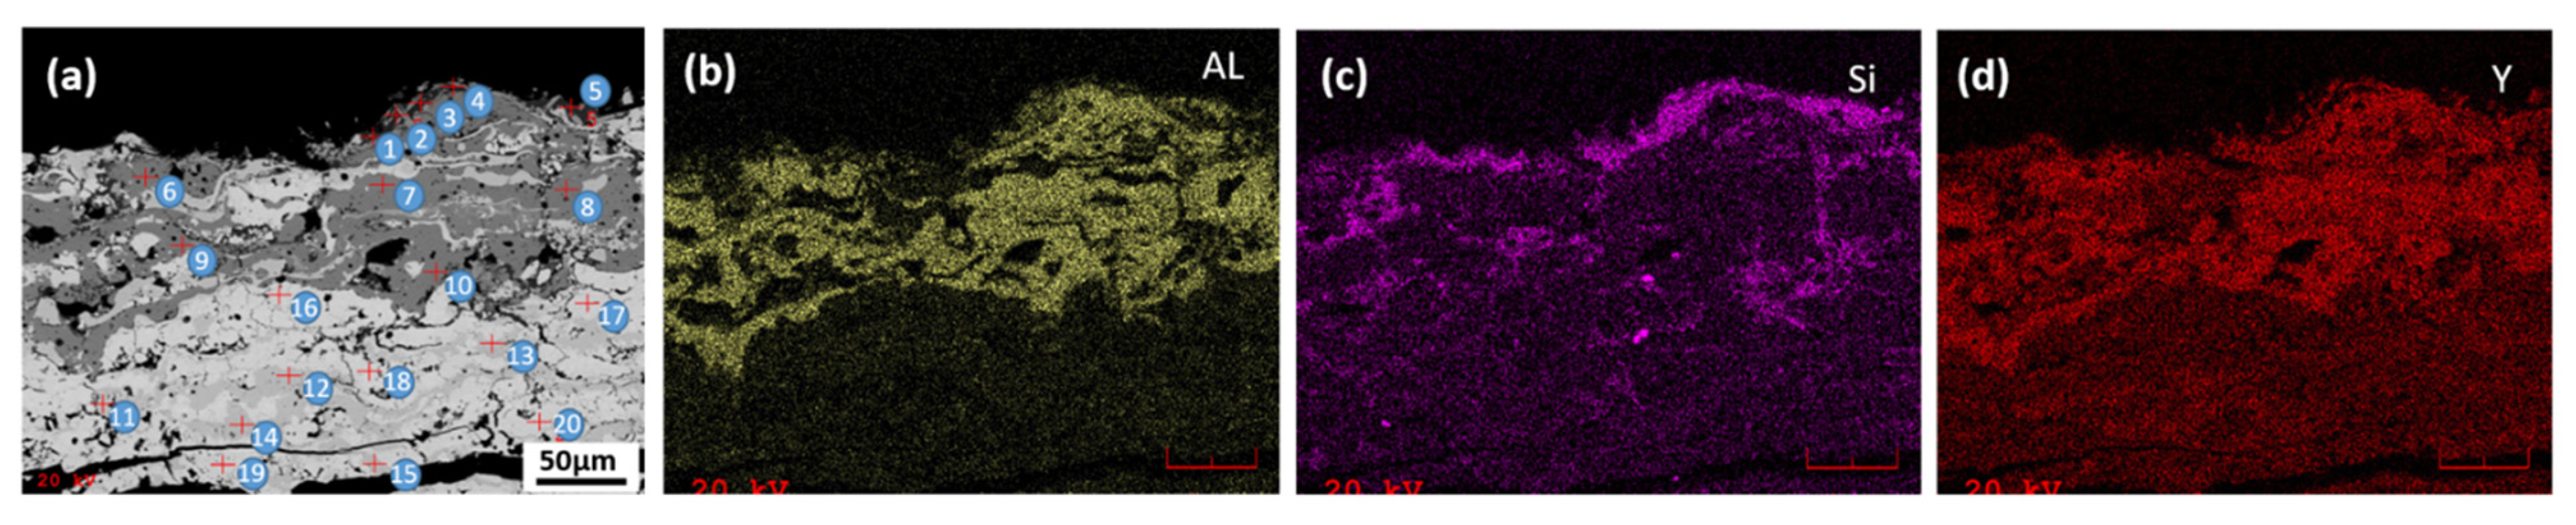
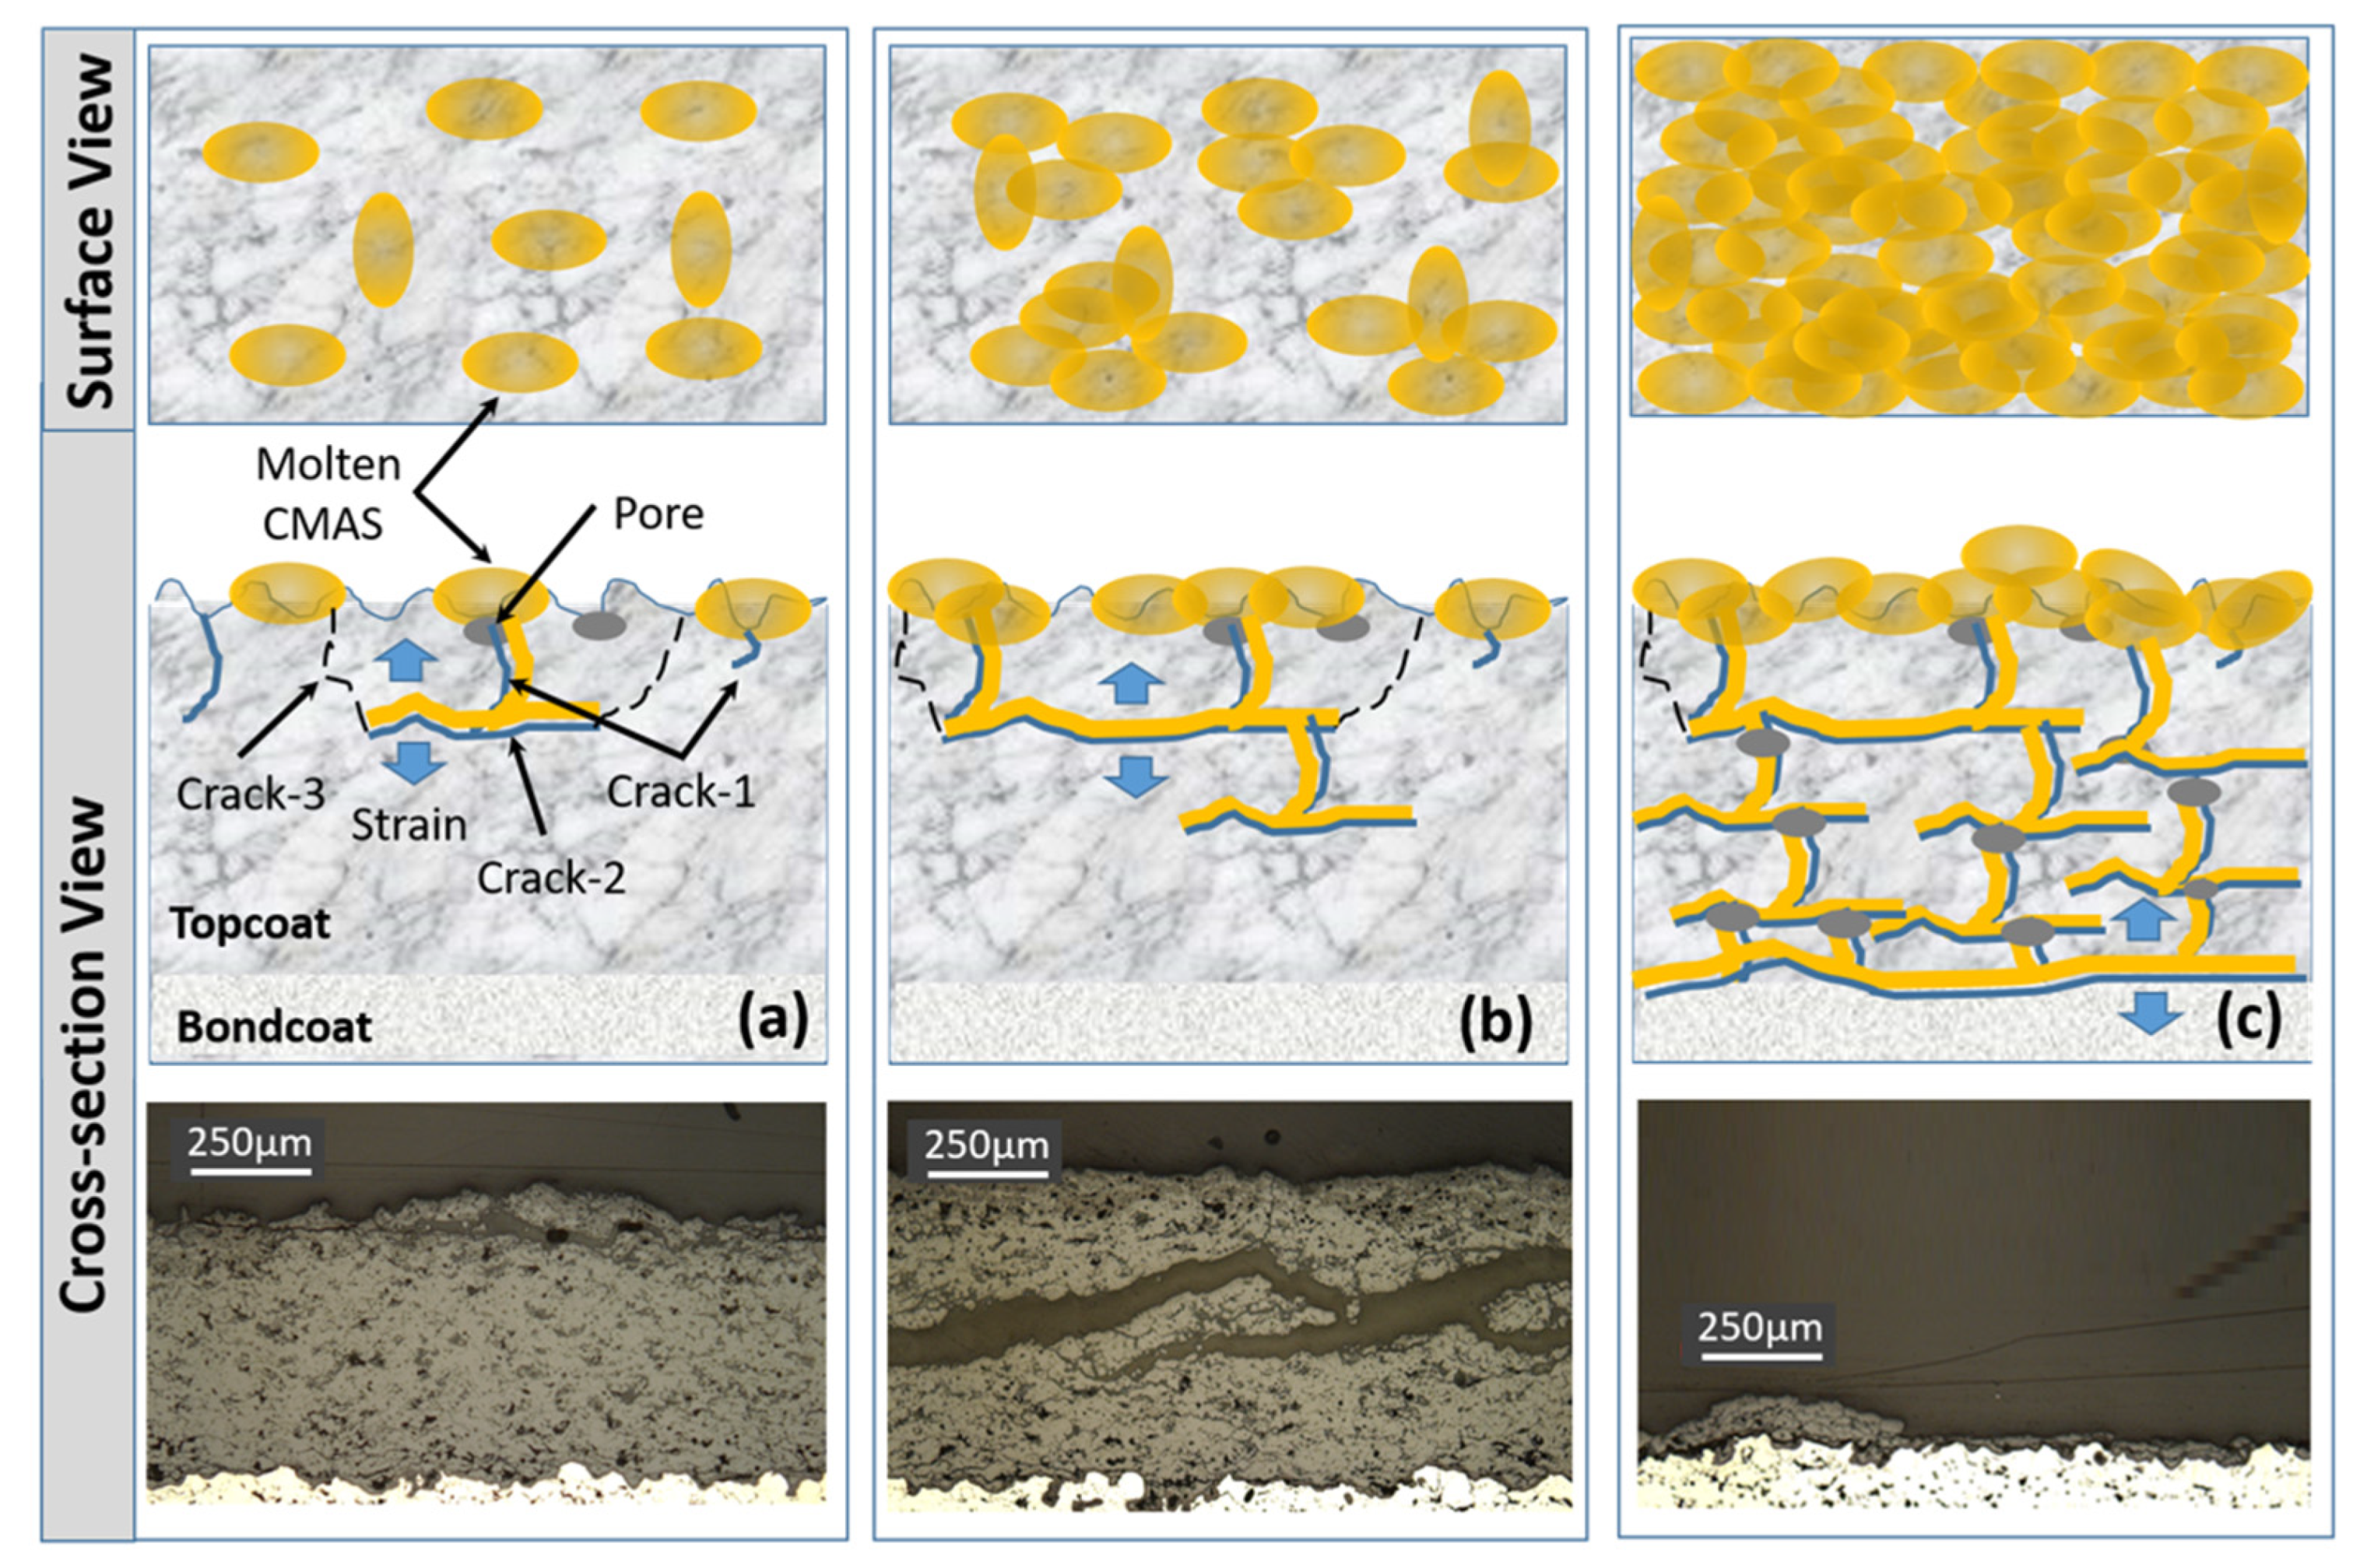
  • Tri-phase TBCs were obtained by adding a third YAG phase to the t’+c zirconia topcoat, then they were investigated for CMAS corrosion tests at 1250 °C for the maximum exposure time of 120 h. In all the tested TBC samples, the CMAS attack was found to be very aggressive and caused coating damage. Compared with single-phase 8YSZ TBC, the degradation of the t’+c TBC and its YAG-modified TBC is inhibited, to some degree. In particular, the YAG additive is more effective in slowing down the process of CMAS infiltration, due to the formation of crystalline compounds with low mobility in the chemical reactions of the YAG phase with molten CMAS.
  • The overall performance of the phase composite ceramics in the experimental tests proves their potential as promising TBC topcoats for next-generation advanced gas turbine engines that are operating in extreme environments.

Author Contributions

X.M. proposed the material concept and TBC design, planned the spray trials, conducted the coating tests and analyses, and wrote this article; K.R. performed early-stage experimental work on the examination and evaluation of some TBC samples; P.R. supported the projects with internal funding and monitored the project’s progress; G.W. was mainly responsible for the SEM/EDXS analyses of the selected test samples. All authors have read and agreed to the published version of the manuscript.

Funding

This research received no external funding.

Institutional Review Board Statement

Not applicable.

Informed Consent Statement

Not applicable.

Data Availability Statement

The authors confirm that the data supporting the findings of this study are available within the article.

Acknowledgments

The authors gratefully acknowledge the technical assistance and experimental support given by D. Reynolds, W. Sproul, and T. Frost, the Curtiss–Wright Corporation, East Windsor, CT, USA; A. Stutzman and B. Eaton for their lab analyses at the IMR Test Lab, Curtiss–Wright Corporation, Lansing, NY, USA; Ni Curry, Treibacher Industrie AG, Austria; and H. Wang, TA Instruments—Waters, LLC, New Castle, DE, USA, for beneficial discussion regarding the TBC thermal properties.

Conflicts of Interest

The authors declare no conflict of interest.

References

  1. Mondal, K.; NuñezIII, L.; Downey, C.; Rooyen, I. Recent advances in the thermal barrier coatings for extreme environments. Mater. Sci. Energy Technol. 2021, 4, 208–210. [Google Scholar] [CrossRef]
  2. Lee, K.; Zhu, D.; Lima, R. Perspectives on environmental barrier coatings (EBCs) manufactured via air plasma spray (APS) on ceramic matrix composites (CMCs): A tutorial paper. J. Therm. Spray Technol. 2021, 30, 40–58. [Google Scholar] [CrossRef]
  3. Clarke, D.; Levi, C. Materials design for the next generation thermal barrier coatings. Ann. Rev. Mater. Res. 2003, 33, 383–417. [Google Scholar] [CrossRef]
  4. Vaßen, R.; Jarligo, M.; Steinke, T.; Mack, D.; Stover, D. Overview on advanced thermal barrier coatings. Surf. Coat. Technol. 2010, 205, 938–942. [Google Scholar] [CrossRef]
  5. Perepezko, J. The hotter the engine, the better. Science 2009, 326, 1068–1069. [Google Scholar] [CrossRef]
  6. Hossain, M.; Rube, M.H.K.; Akbar, M.A.; Ahmed, M.H.; Haque, N.; Rahman, M.F.; Hossain, J.; Hossain, K.M. A review on recent applications and future prospects of rare earth oxides in corrosion and thermal barrier coatings, catalysts, tribological, and environmental sectors. Ceram. Intl. 2022, 48, 32588–32612. [Google Scholar] [CrossRef]
  7. Miller, R. Thermal barrier coatings for aircraft engines: History and directions. J. Therm. Spray Technol. 1997, 6, 35–42. [Google Scholar] [CrossRef] [Green Version]
  8. Stecura, S. Effects of compositional changes on the performance of a thermal barrier coating system. In Proceedings of the Third Annual Conference on Composite and Advanced Materials, Merritt Island, FL, USA, 21–24 January 1979. NASA TM-78976 Report. [Google Scholar]
  9. Stabican, V. Phase equilibria and metastabilities in the systems ZrO2-MgO, ZrO2-CaO and ZrO2-Y2O3. Adv. Ceram. 1984, 24A, 71–85. [Google Scholar]
  10. Hasselman, D. Thermal diffusivity & conductivity of dense polycrystalline ZrO2 ceramics: A survey. Am. Ceram. Soc. Bull. 1987, 66, 799–806. [Google Scholar]
  11. Schlichting, W.; Padture, N.; Klemens, P. Thermal conductivity of dense and porous yttria-stabilized zirconia. J. Mater. Sci. 2001, 36, 3003–3010. [Google Scholar] [CrossRef]
  12. Hutchings, I. Transitions, threshold effects and erosion maps. Key Eng. Mater. 1992, 71, 75–92. [Google Scholar]
  13. Ramachandran, C.; Balasubramanian, V.; Ananthapadmanabhan, P. Erosion of atmospheric plasma sprayed rare earth oxide coatings under air suspended corundum particles. Ceram. Int. 2013, 39, 649–672. [Google Scholar] [CrossRef]
  14. Mahade, S.; Curry, N.; Bjorklund, S.; Markocsan, N.; Nylen, P.; Vaßen, R. Erosion performance of gadolinium zirconate-based thermal barrier coatings processed by suspension plasma spray. J. Therm. Spray Technol. 2017, 26, 108–115. [Google Scholar] [CrossRef]
  15. Mahade, S.; Zhou, D.; Curry, N.; Markocsan, N.; Nylen, P.; Vaßen, R. Tailored microstructures of gadolinium zirconate/YSZ multi-layered thermal barrier coatings produced by suspension plasma spray: Durability and erosion testing. J. Mater. Proc. Technol. 2019, 264, 283–294. [Google Scholar] [CrossRef]
  16. Mahade, S.; Ruelle, C.; Curry, N.; Holmberg, J.; Bjorklund, S.; Markocsan, N.; Nylen, P. Understanding the effect of material composition and microstructural design on the erosion behavior of plasma sprayed thermal barrier coatings. Appl. Surf. Sci. 2019, 488, 170–184. [Google Scholar] [CrossRef]
  17. Kramer, S.; Yang, J.; Levi, C.; Johnson, C. Thermochemical interaction of thermal barrier coatings with molten CaO-MgO-Al2O3-SiO2 (CMAS) deposits. J. Am. Ceram. Soc. 2006, 9, 3167–3175. [Google Scholar] [CrossRef]
  18. Levi, C.; Hutchinson, J.; Vidal-Setif, M.; Johnson, C. Environmental degradation of thermal barrier coatings by molten deposits. MRS Bull. 2012, 37, 932–941. [Google Scholar]
  19. Kim, J.; Dunn, M.; Baran, A.; Wade, D.; Tremba, E. Deposition of volcanic materials in the hot sections of two gas turbine engines. J. Eng. Gas Turbines Power 1993, 115, 641–651. [Google Scholar] [CrossRef]
  20. Clarke, D.; Oechsner, M.; Padture, N. Thermal-barrier coatings for more efficient gas-turbine engines. MRS Bull. 2012, 37, 891–898. [Google Scholar] [CrossRef] [Green Version]
  21. DeWet, D.; Taylor, R.; Stott, F. Corrosion mechanisms of ZrO2-Y2O3 thermal barrier coatings in the presence of molten middle-east sand. J. Phys. IV 1993, 3, 655–663. [Google Scholar]
  22. Craig, M.; Ndamka, N.; Wellman, R.; Nicholls, J. CMAS degradation of EB-PVD TBCs: The effect of basicity. Surf. Coat. Technol. 2015, 270, 145–153. [Google Scholar] [CrossRef]
  23. Aygun, A.; Vasiliev, A.; Padture, N.; Ma, X. Novel thermal barrier coatings that are resistant to high-temperature attack by glassy deposits. Acta Mater. 2007, 55, 6734–6745. [Google Scholar] [CrossRef]
  24. Kramer, S.; Yang, J.; Levi, C. Infiltration-inhibiting reaction of gadolinium zirconate thermal barrier coatings with CMAS melts. Am. Ceram. Soc. 2008, 91, 576–583. [Google Scholar] [CrossRef]
  25. Kumar, R.; Jordan, E.; Gell, M.; Roth, J.; Jiang, C.; Wang, J.; Rommel, S. CMAS behavior of yttrium aluminum garnet (YAG) and yttria-stabilized zirconia (YSZ) thermal barrier coatings. Surf. Coat. Technol. 2015, 327, 126–138. [Google Scholar] [CrossRef]
  26. Ma, X.; Rivellini, K.; Ruggiero, P.; Wildridge, G. Toward durable thermal barrier coating with composite phases and low thermal conductivity. J. Therm. Spray Technol. 2020, 29, 423–432. [Google Scholar] [CrossRef]
  27. Ma, X.; Rivellini, K.; Ruggiero, P.; Wildridge, G. Evaluation and characterization of a durable composite phase thermal barrier coating in solid particle erosion and burner rig tests. J. Therm. Spray Technol. 2021, 30, 69–80. [Google Scholar] [CrossRef]
  28. Ma, X.; Ruggiero, P.; Wildridge, G. Evaluation of CMAS resistance and failure behavior for phase composite thermal barrier coatings. J. Therm. Spray Technol. 2023, 32. (under published). [Google Scholar]
  29. Gu, J.; Wei, B.; Berendt, A.; Ghoshal, A.; Walock, M.; Reidy, R.; Berman, D.; Aouadi, S. A comparative study of calcium–magnesium–aluminum–silicon oxide mitigation in selected self-healing thermal barrier coating ceramics. J. Mater. Res. 2020, 220, 2311–2320. [Google Scholar] [CrossRef]
  30. Keyvani, A.; Bahamirian, M.; Kobayashi, A. Effect of sintering rate on the porous microstructural, mechanical and thermomechanical properties of YSZ and CSZ TBC coatings undergoing thermal cycling. J. Alloys Compd. 2017, 727, 1057–1066. [Google Scholar] [CrossRef]
  31. Lv, B.; Mücke, R.; Fan, X.; Wang, T.J.; Guillon, O.; Vaßen, R. Sintering resistance of advanced plasma-sprayed thermal barrier coatings with strain-tolerant microstructures. J. Eur. Ceram. Soc. 2018, 38, 5092–5100. [Google Scholar] [CrossRef]
  32. Clarke, D. Materials selection guidelines for low thermal conductivity TBCs. Surf. Coat. Technol. 2003, 164, 67–74. [Google Scholar] [CrossRef]
  33. Zhu, D. Low conductivity thermal barrier coating. In Proceedings of the School of Materials Engineering Seminar, West Lafayette, IN, USA, 28 February 2005; NASA technical report, TM-2005-21385. pp. 1–29. [Google Scholar]
  34. Scheibel, J.; Fick, K.; Elbel, S.; Smith, J. Gas turbine low conductivity thermal barrier coating validation and demonstration. In The Future of Gas Turbine Technology, Proceedings of the 8th International Gas Turbine Conference, Brussels, Belgium, 12–13 October 2016; 48-IGTC16; European Turbine Network: Brussels, Belgium, 2016; pp. 1–10. [Google Scholar]
  35. Li, C.; Yang, G.; Ohmori, A. Relationship between particle erosion and lamellar microstructure for plasma-sprayed alumina coating. Wear 2006, 260, 1166–1172. [Google Scholar] [CrossRef]
  36. Goretta, K.; Pena, J.; Orera, V.; Chen, N.; Singh, D.; Routbort, J. Solid-particle erosion of directionally solidified Al2O3-ZrO2 (Y2O3) eutectics. Wear 2010, 268, 571–578. [Google Scholar] [CrossRef]
  37. Kitamura, J.; Tang, Z.; Mizuno, H.; Sato, K.; Burgess, A. Structural, mechanical and erosion properties of yttrium oxide coatings by axial suspension plasma spraying for electronics applications. J. Therm. Spray Technol. 2011, 20, 170–185. [Google Scholar] [CrossRef]
  38. Mishra, S.; Prakash, S.; Chandra, K. Studies on erosion behaviour of plasma sprayed coatings on a Ni-based superalloy. Wear 2006, 260, 422–432. [Google Scholar] [CrossRef]
  39. Eaton, H.; Novak, R. Particulate erosion of plasma-sprayed porous ceramics. Surf. Coat. Technol. 1987, 30, 41–50. [Google Scholar] [CrossRef]
  40. Van Donkelaar, A.; Martin, R.V.; Brauer, M.; Kahn, R.; Levy, R.; Verduzco, C.; Villeneuve, P.J. Global estimates of ambient fine particulate matter concentrations from satellite-based aerosol optical depth: Development and application. Environ. Health Perspect. 2010, 118, 847–855. [Google Scholar] [CrossRef] [Green Version]
  41. Thorsteinsson, T.; Jóhannsson, T.; Stohl, A.; Kristiansen, N.I. High levels of particulate matter in Iceland due to direct ash emissions by the Eyjafjallajokull eruption and resuspension of deposited ash. J. Geophys. Res. Solid Earth 2012, 117, B00C05. [Google Scholar] [CrossRef]
  42. Kueppers, U.; Cimarelli, C.; Hess, K.-U.; Taddeucci, J.; Wadsworth, F.B.; Dingwell, D.B. The thermal stability of Eyjafjallajokull ash versus turbine ingestion sands. J. Appl. Volcanol. 2014, 3, 4–15. [Google Scholar] [CrossRef] [Green Version]
  43. Turcer, L.; Krause, A.; Garces, H.; Zhang, L.; Padture, N. Environmental-barrier coating ceramics for resistance against attack by molten calcia-magnesia-alumino silicate (CMAS) glass: Part II, β-Yb2Si2O7 and β-Sc2Si2O7. J. Eur. Ceram. Soc. 2018, 38, 3914–3924. [Google Scholar] [CrossRef]
  44. Dimitrov, V.; Sakka, S. Electronic oxide polarizability and optical basicity of simple oxides. J. Appl. Phys. 1996, 79, 1736–1740. [Google Scholar] [CrossRef]
  45. Ndamka, N.; Wellman, R.; Nicholls, J. The degradation of thermal barrier coatings by molten deposits: Introducing the concept of basicity. Mater. High Temp. 2016, 33, 44–50. [Google Scholar] [CrossRef]
Figure 1. The aims regarding the development of new ceramic materials to meet desirable properties, performance, the coating process, and the economy targets for novel TBCs that can be used in advanced gas turbine engines.
Coatings 13 00210 g001
Figure 2. Flowchart for the concept and the design of an example two-phase composite ceramic and the sequential steps for developing and optimizing the topcoat in a TBC system.
Coatings 13 00210 g002
Figure 3. SEM images of the cross-section microstructures of the two-phase composite TBC: (a) as-sprayed TBC; (b) as-sprayed topcoat.
Coatings 13 00210 g003
Figure 4. Schematics of the coating structures of the single, dual, and tri-phase composite TBCs.
Coatings 13 00210 g004
Figure 5. Schematic of the burner rig for thermal shock tests and thermal cyclic temperature profiles, using a high heat flux and high-velocity flame torch.
Coatings 13 00210 g005
Figure 6. SEM images of the cross-sections of two-phase composite TBCs after isothermal exposure at 1300 °C/100 h: (a) fracture morphology of the as-sprayed topcoat; (b) fracture morphology of the thermally exposed topcoat; (c) microstructure of the as-sprayed topcoat; (d) microstructure of the thermally exposed topcoat.
Coatings 13 00210 g006
Figure 7. XRD analyses of the two-phase composite ceramic feedstock, as-sprayed topcoat, and thermally exposed topcoat.
Coatings 13 00210 g007
Figure 8. Thermal conductivity data of as-sprayed and thermally exposed material (at 1300 °C for 25 h) for a typical two-phase (t’+c) composite zirconia-based topcoat.
Coatings 13 00210 g008
Figure 9. Thermal shock behavior of two-phase TBC in burner rig test: (a) Plot of TBC spallation area percentage versus the thermal cycling number; (b.1) schematic failure modes of the dual-phase TBC after 2000 cycles; (b.2) failure modes of the single-phase 8YSZ-TBC after 2000 cycles.
Coatings 13 00210 g009
Figure 10. Surface photograph images of SPE erosion samples: (a) erosion scar marks on the dual-phase TBCs at different impinging angles; (b) cross-sectional images of the SPE-tested sample at an angle of 20°; (c) thickness profile for the eroded sample in (b).
Coatings 13 00210 g010
Figure 12. SEM surface morphologies of the TBCs after erosion tests at different impinging angles: (ac) dual-phase zirconia TBC; (df) Gd2Zr2O7 zirconate TBC.
Coatings 13 00210 g012
Figure 13. Microstructures of the tri-phase (t’+c+YAG) TBC specimens after CMAS attack tests at 1250 °C for 5 h: (a) coating attacked by CMAS in the near-surface area; (b) a close look on the CMAS-attacked area.
Coatings 13 00210 g013
Figure 14. SEM cross-sectional images and the corresponding scanning maps of EDXS elements for the tri-phase TBC sample after CMAS corrosion tests at 1250 °C for 120 h: (a) Backscattered electron (BSE) image; (b) element scan map for aluminum; (c) element scan map for silicon; (d) element scan map for yttrium.
Coatings 13 00210 g014
Figure 15. Schematic of the effect of CMAS dosage on the damage mechanisms in the TBC: (a) a low dosage with local surface coverage; (b) a medium dosage with high surface coverage; (c) a high dosage with full surface coverage.
Coatings 13 00210 g015
Table 1. List of the TBC specimens used for testing, evaluation, and analyses.
TBC Samples1. Thermal Stability Test2. Thermal Shock Test3. Erosion Test4. CMAS Test
ZrO2-8Y2O3 (t’)
ZrO2-20Y2O3 (c)
Gd2Zr2O7
ZrO2 (t’+c)
ZrO2 (t’+c) + YAG
Table 2. Results of SEM/EDXS analyses in the tri-phase (t’+c+YAG) TBC after the CMAS corrosion test at 1250 °C for 120 h.
Point#t’+c+YAG TBC: SEM/EDXS Results, wt. % Average
Detection Layer/ZoneMain Elements
ZrAlCaYSiMgNaRE
P1-5Dark surface layer02820.47.842.30.31.1
P6-10Dark gray affected zone026.60.970.910.6
P11-15Light gray affected zone880.5011.3
P16-20Main coating zone69.70.10.26.40.50 23
Disclaimer/Publisher’s Note: The statements, opinions and data contained in all publications are solely those of the individual author(s) and contributor(s) and not of MDPI and/or the editor(s). MDPI and/or the editor(s) disclaim responsibility for any injury to people or property resulting from any ideas, methods, instructions or products referred to in the content.

