Article

Analysis of the High Temperature Plastic Deformation Characteristics of 18CrNi4A Steel and Establishment of a Modified Johnson–Cook Constitutive Model

1
School of Mechatronics Engineering, Henan University of Science and Technology, Luoyang 471003, China
2
School of Mechanical and Electrical Engineering, Shangqiu Polytechnic, Shangqiu 476001, China
*
Author to whom correspondence should be addressed.
Coatings 2023, 13(10), 1697; https://doi.org/10.3390/coatings13101697
Submission received: 31 July 2023 / Revised: 21 September 2023 / Accepted: 23 September 2023 / Published: 27 September 2023

Abstract

:
To investigate the plastic deformation behavior of 18CrNi4A steel at high temperatures, an isothermal hot compression test was conducted on a Thermecmastor-Z series test machine at deformation temperatures from 1273   K to 1423   K and strain rates ranging from 0.01   s 1 to 10   s 1 . The effects of these two factors on the flow stress were analyzed. Based on the true stress–strain experimental curves, the original Johnson–Cook constitutive model was applied to determine the flow stress data under different deformation conditions. The prediction results of the model were compared with the experimental data. The main reason for the large deviation observed between them was that the coupling relationship between the deformation temperature and the strain rate was not considered, so the original Johnson–Cook model was modified. The correlation coefficient and average absolute relative error of the original Johnson–Cook model were 0.962 and 16.36%. The prediction accuracy of the modified Johnson–Cook model was improved to 0.991 and 5.58%, respectively. The results show that the modified Johnson–Cook model exhibits higher prediction precision, which is beneficial for the broader application of 18CrNi4A steel in the industry.

1. Introduction

Gears are the essential mechanical components used to transmit motion and power, and heavy-duty gears are the key components of precision transmission systems in aviation machinery and weapon equipment. As a critical component in power transmission equipment, gears have increasingly high requirements for their processing technology to meet the demands of high precision, high load, high maneuverability, impact resistance, and high reliability. Additionally, with the emergence of advanced processing technologies, there is a growing mandate for green, environmentally friendly and energy-efficient manufacturing methods within the industry, leading to gear precision forging and near net forming which have become the main means of gear processing, as they offer high levels of precision while also reducing material waste and energy consumption. During the forging process, the microstructure of the metallic material plays a vital role in determining the end-use properties. An accurate understanding of the constitutive behavior, or rheological stress behavior, of the material during thermal deformation can be used to optimize the thermal processing process to improve the performance of metal and alloy materials [1]. Given the complex nature of plastic deformation, obtaining an accurate analytical solution for quantitative analysis is difficult. Hence, it is necessary to research the flow stress behavior of metal materials during hot deformation, which is mainly expressed by a plastic deformation model—the constitutive model of the material. This can be divided into a physical constitutive model and an artificial neural network constitutive model, which is more popular at present [2]. At present, there are three widely used phenomenological models: the Johnson–Cook (J–C) model, the modified Zerilli–Armstrong (Z–A) model and the Hansel–Spittel model. Samantaray et al. provided a detailed comparison of the J–C, modified Z–A model, and Arrhenius-type model in predicting the high temperature rheological features of improved 9Cr-1Mo material [3]. A. Venkata Ramana et al. carried out a hot compression deformation test study of high-strength low-alloy (HSLA) steel using the modified Z–A and Arrhenius models and discussed the accuracy of the two constitutive models [4]. Milani et al. discussed the interaction among the parameters in the J–C model and proposed a multi-objective optimization approach to modify that model [5]. Motallebi et al. introduced the Arrhenius model, an artificial neural network model, the Johnson–Cook model and the Fields–Backofen formula for strain compensation, and discussed the methods of model modification, simplification, and physical testing [6]. Mohanraj Murugesan et al. reported a detailed investigated of the material high temperature flow behavior of AISI-1045 material under the conditions of deformation temperatures ( 923   K ~ 1223   K ) and strain rates ( 0.05   s 1 ~ 1.0   s 1 ) based on the modified J–C and Z–A models, and the predictive accuracy was compared [7]. Li et al. applied the modified J–C, Z–A, and Arrhenius-type models to predict the flow stress of 28CrMnMoV material, and the results for the three models were compared [8]. Among the common phenomenological models, the J–C model is widely applied to predict the plastic deformation of metallic materials at high deformation temperatures (DT) and strain rates, as it takes into account the strain, strain rate and DT effects of materials comprehensively, as well as having few undetermined coefficients and low computational complexity. Overall, this model has a fast calculation speed, high accuracy of the results obtained, and a wide range of applications, thus demonstrating high application value in the study of the properties of this steel alloy material. Many scholars have conducted research from different perspectives. However, the model still has certain application limitations, and, therefore, needs to be improved. In this context, this article analyzes the shortcomings of this model, and then makes appropriate improvements according to the requirements. Then, the accuracy of the model is compared and analyzed before and after the revision, in order to verify the application performance advantages of the improved model and to provide support for its further application and promotion.
There are many studies on the plastic deformation of gear steels, including those investigating the microstructure, static mechanical properties, dynamic deformation, and rheological stress modelling, etc. For example, Nassiraei H. et al. developed a finite element model to analyze the variation law of the ultimate strength of steel under high temperature compression [9,10]. Li Hongbin et al. studied the plastic deformation behavior of M50NiL gear steel at DT ( 1123   K ~ 1423   K ) and strain rates ( 0.005   s 1 ~ 10   s 1 ), and the true stress–strain curve was modified by taking friction into account [11]. Wang Wei et al. established the Johnson–Cook (J–C) model and hot processing map of 20Cr2Ni4A material according to the detailed data from compression tests [12]. Wang Xiaoqiang et al. proposed a method for establishing an intrinsic structure model and its validation in terms of the microscopic deformation result of the material, taking the quenched state 42CrMo steel with high brittleness and hardness as an example [13]. Chen Xuewen et al. researched the warm deformation feature of GCr15SiMn steel, established the rheological stress model of this steel based on the Hansel–Spittel model, and verified the accuracy of the model by comparing it with experimental data [14]. Lun et al. carried out high temperature compression tests of 35CrMoV steel with strain rates of 0.01   s 1 ~ 10   s 1 at 1123   K ~ 1423   K , analyzed its high temperature plastic deformation characteristics, and established a Zerilli–Armstrong model to analyze the association among the flow stress, strain rate and temperature of 35CrMoV steel [15]. Zhu Xiaoxing, Wang Baoyu et al. researched the plastic deformation law of the SAE8620H gear steel at deformation temperatures of 1123   K ~ 1373   K and strain rates of 0.01   s 1 ~ 10   s 1 by high temperature compression testing, and a hot working diagram of the steel was established according to the constitutive equation [16]. Tang Haiyan, Yang Maosheng et al. investigated the hot deformation behavior and microstructure of CrCoMoNi gear steel using an isothermal compression test and established a constitutive model of it. According to the experimental results, the flow stress of this material could be described by a hyperbolic sine function [17]. 18CrNi4A steel is a chromium–nickel alloy structural steel with good comprehensive properties that is mostly used in aircraft engines and high-speed diesel engines. Wang Weiming et al. investigated the phase transformation law of 18CrNi4A steel, which provided the basis for the broad application and heat treatment process of the steel [18]. Wang Yanzhong et al. studied the plastic deformation behavior of 18CrNi4A steel fully carburized parts at high strain rates ( 1000   s 1 ~ 4000   s 1 ) and deformation temperatures between 288   K and 773   K [19]. However, there has been no detailed study on the plastic deformation features of 18CrNi4A steel to date. In this paper, isothermal hot compression tests of 18CrNi4A steel conducted on a Thermecmastor-Z series test machine at deformation temperatures from 1273   K to 1423   K and strain rates from 0.01   s 1 to 10   s 1 are reported and the high temperature plastic deformation characteristics are analyzed. Then, the original J–C constitutive model and a modified J–C constitutive model are established to analyze the deformation behavior of the steel. The correlation coefficient (R) and the average absolute relative error (AARE) are used to compare the prediction accuracy of the two models to provide further reference information for the industrial application of 18CrNi4A steel.

2. Test Materials and Methods

2.1. Test Material

18CrNi4A steel is an excellent carburizing steel with high hardenability and good carburizing, welding, cutting and grinding properties, with excellent overall mechanical properties, which is mainly suitable for the manufacture of key heavy-duty gears and shaft parts, such as in WZ9 aero-engines, helicopter main tail reducers and other aviation-specific gear manufacturing [20]. The composition of the sample can be seen in Table 1.

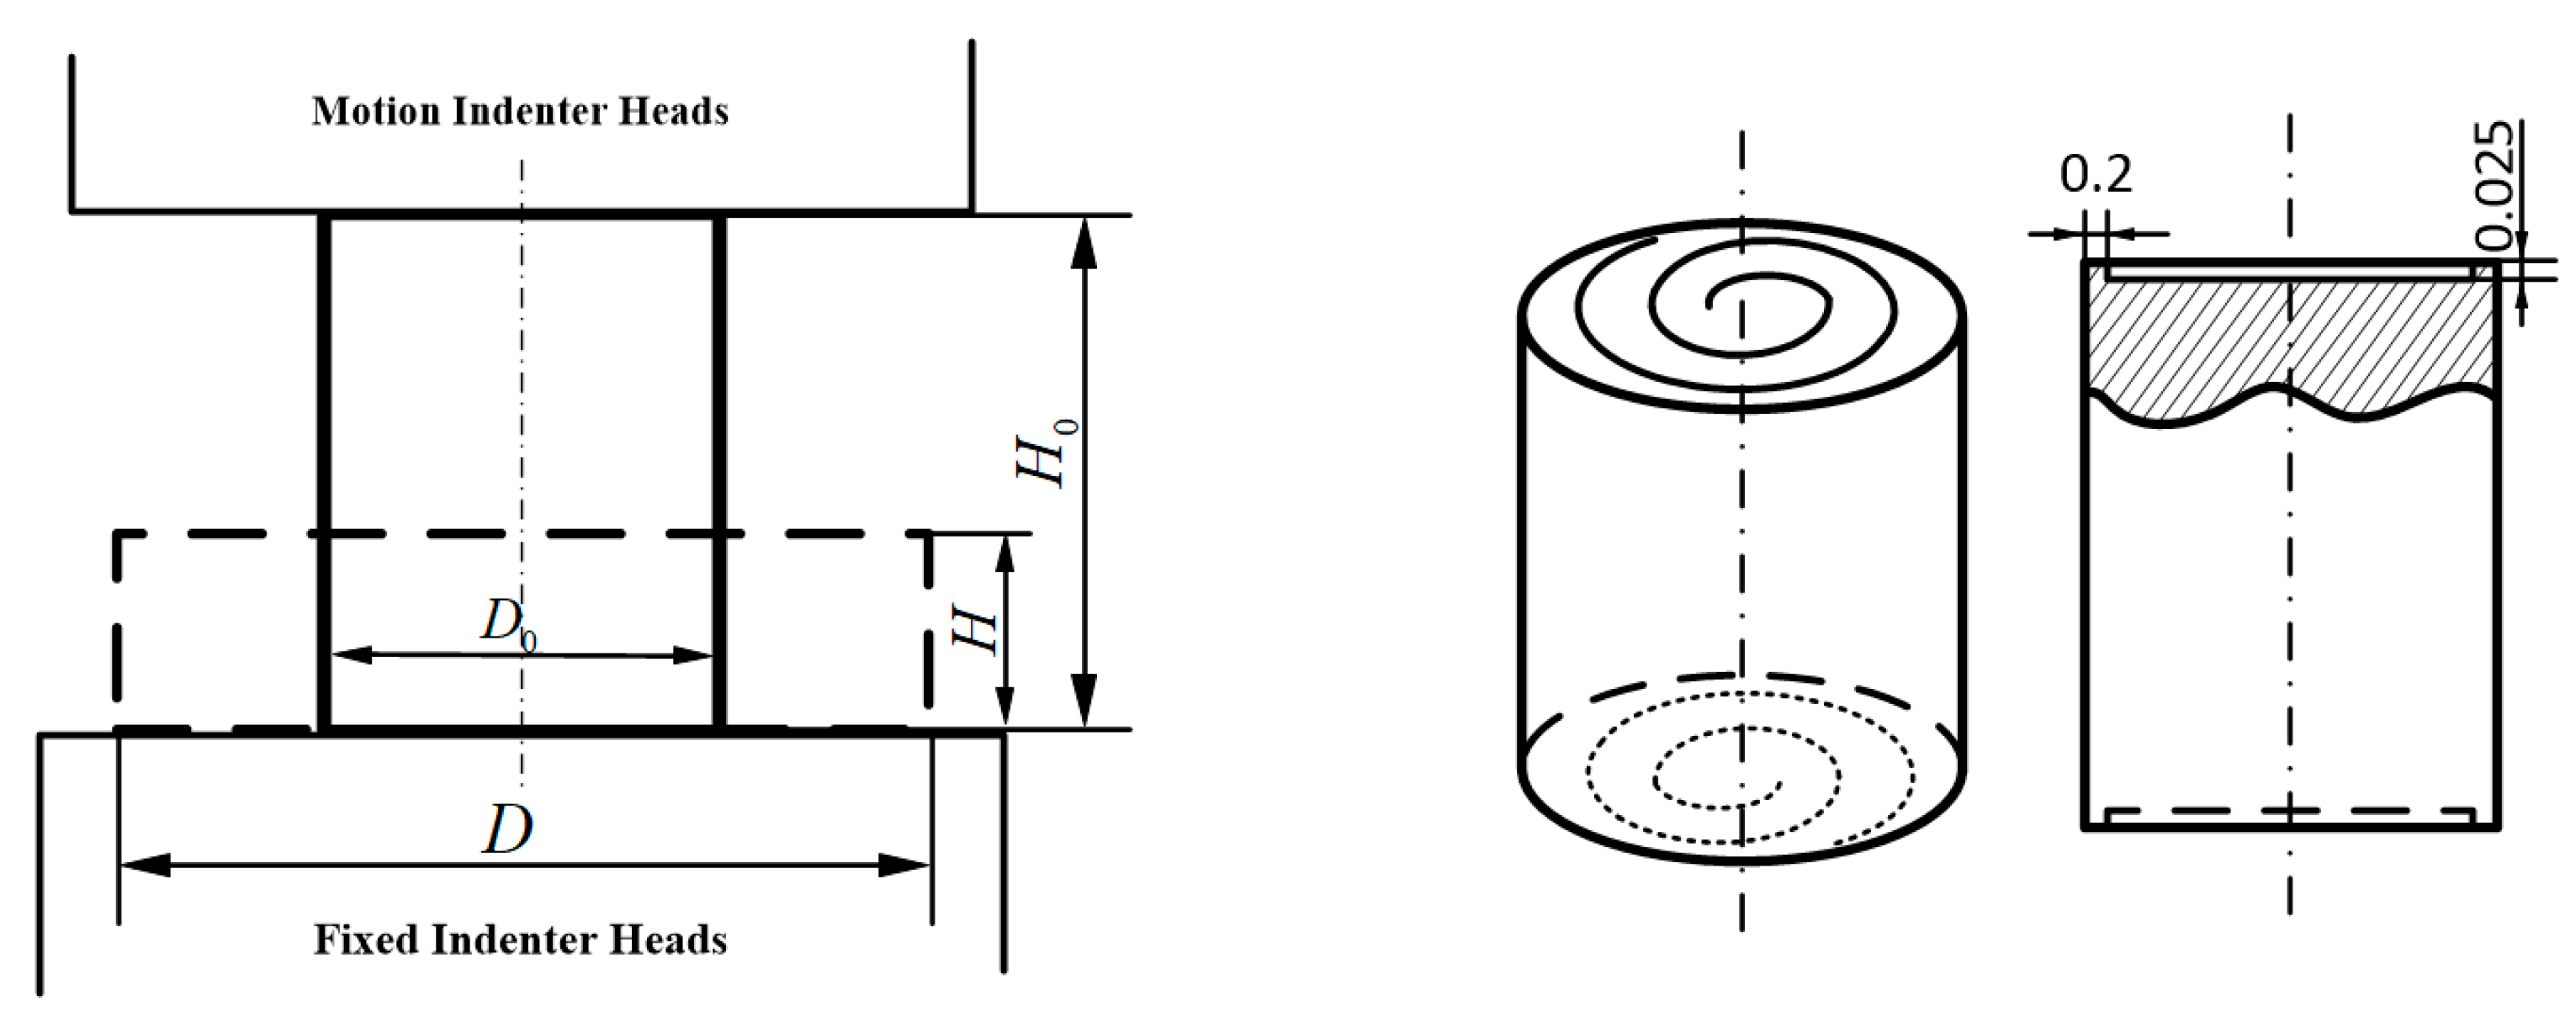
2.2. Test Methods and Requirements
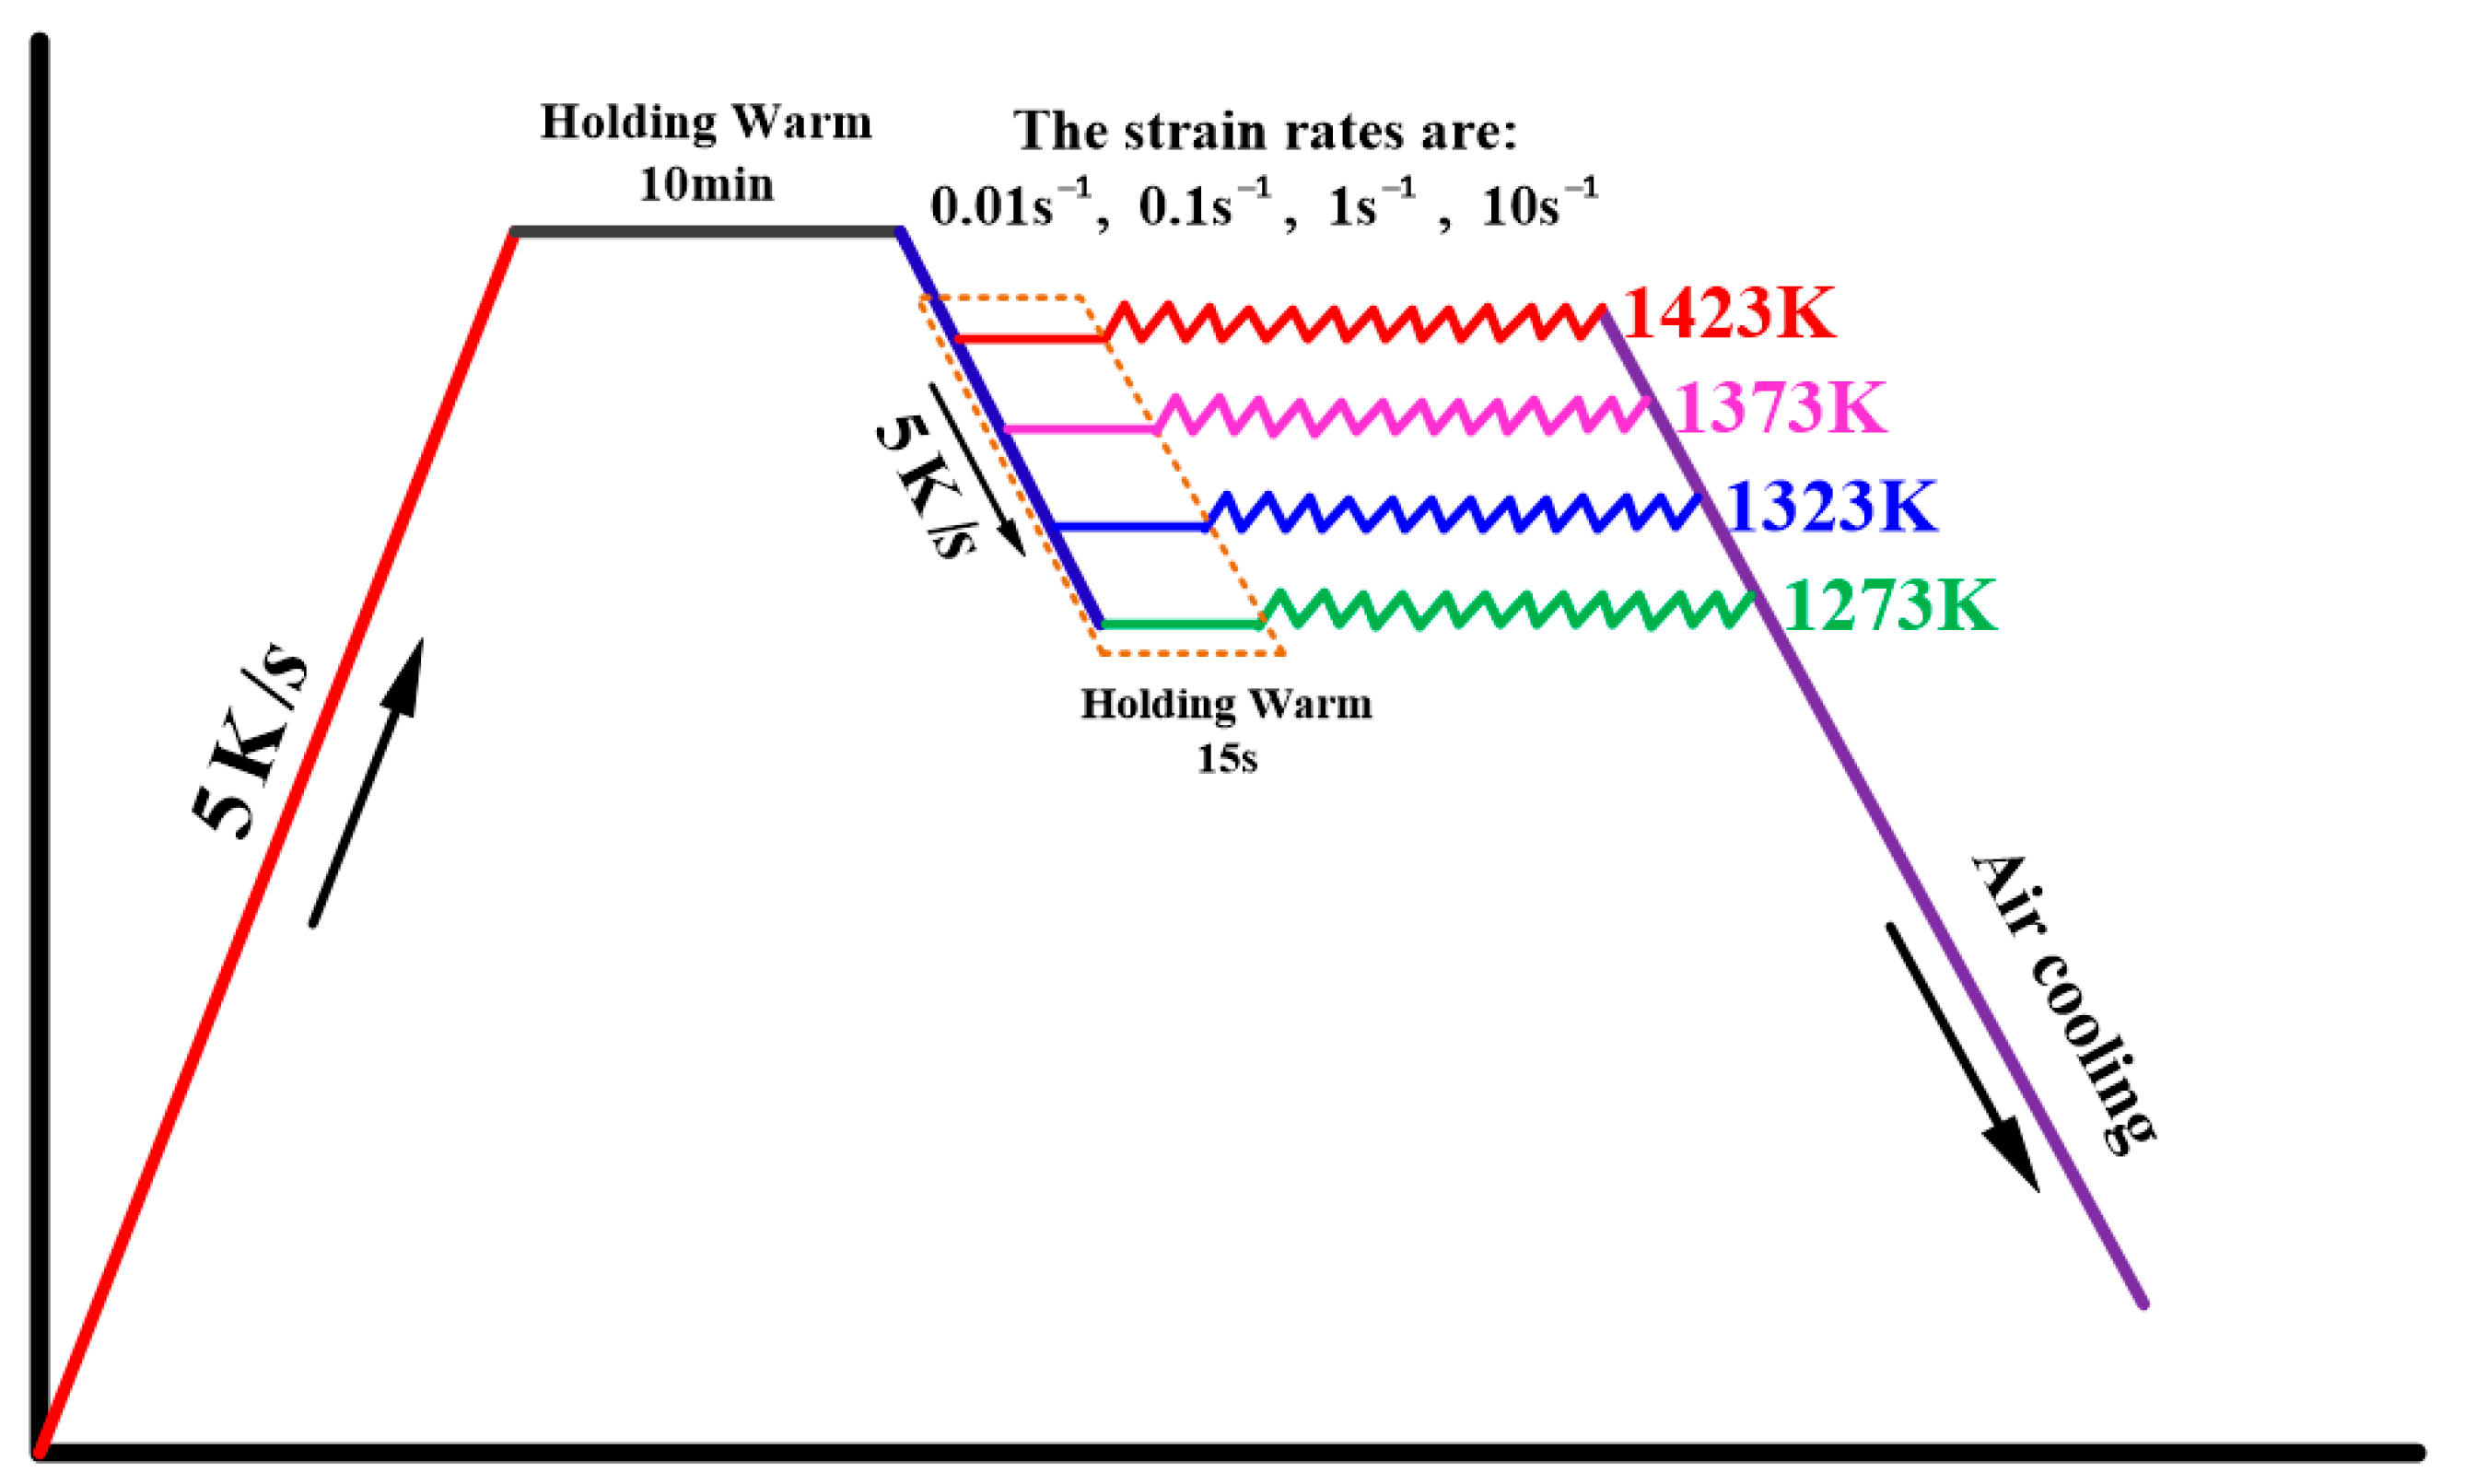
18CrNi4A steel is mainly used in the manufacture of precision forging of heavy-duty gears for aerospace applications, so this test was carried out using a hot compression test. The test was performed on a Thermecmastor-Z series heat/force simulation tester manufactured by Japan Fuji Electronics Noustrial Co. Ltd. (Kawasaki, Japan) to determine the true stress and strain of the sample with various strain rates and temperatures. The compression test has a significant disadvantage, that is, there is friction on the contact surface between the sample and the indenter. To obtain a precise true stress–strain curve, it is crucial to ensure as far as possible that the sample is compressed in one direction so that the thermal conductivity is uniform during hot compression and that the friction between the ends of the sample and the indenter is reduced.
For this reason, the upper and lower indenter heads of the test machine were friction-reduced, and the sample ends were constructed as shown below to store the lubricant. In addition, to control the deformation accuracy, the sample height-to-diameter ratio should not be too large, generally taken to be H 0 / D 0 = 1.5 ; the size of this test sample was D 0 = 8   m m , H 0 = 12   m m . Figure 1 shows the compression test and a sketch of the sample.

2.3. Test Scheme

The samples were heated to 1473   K with a speed of 5   K / s and kept for 10 min on a Thermecmastor-Z thermal simulation tester to maintain uniform temperatures in all parts of the sample, then cooled to deformation temperature at 5   K / s and held at 15   s to eliminate temperature gradients within the test. The deformation temperatures were taken from 1273   K , 1323   K , 1373   K , 1423   K and then hot compression tests were conducted at strain rates of 0.01   s 1 , 0.1   s 1 , 1   s 1 and 10   s 1 , as shown in Figure 2. The true strain of the sample was 1.6 (the engineering strain was approximately 0.81), for a total of 16 sets of experiments. At least two tests needed to be performed under similar conditions to ensure that the difference in the peak stress between the true curves was in the range of 5 % ~ 7 % . The tester automatically collected nominal stress and strain data during the hot compression and converted them to real stress and real strain data.

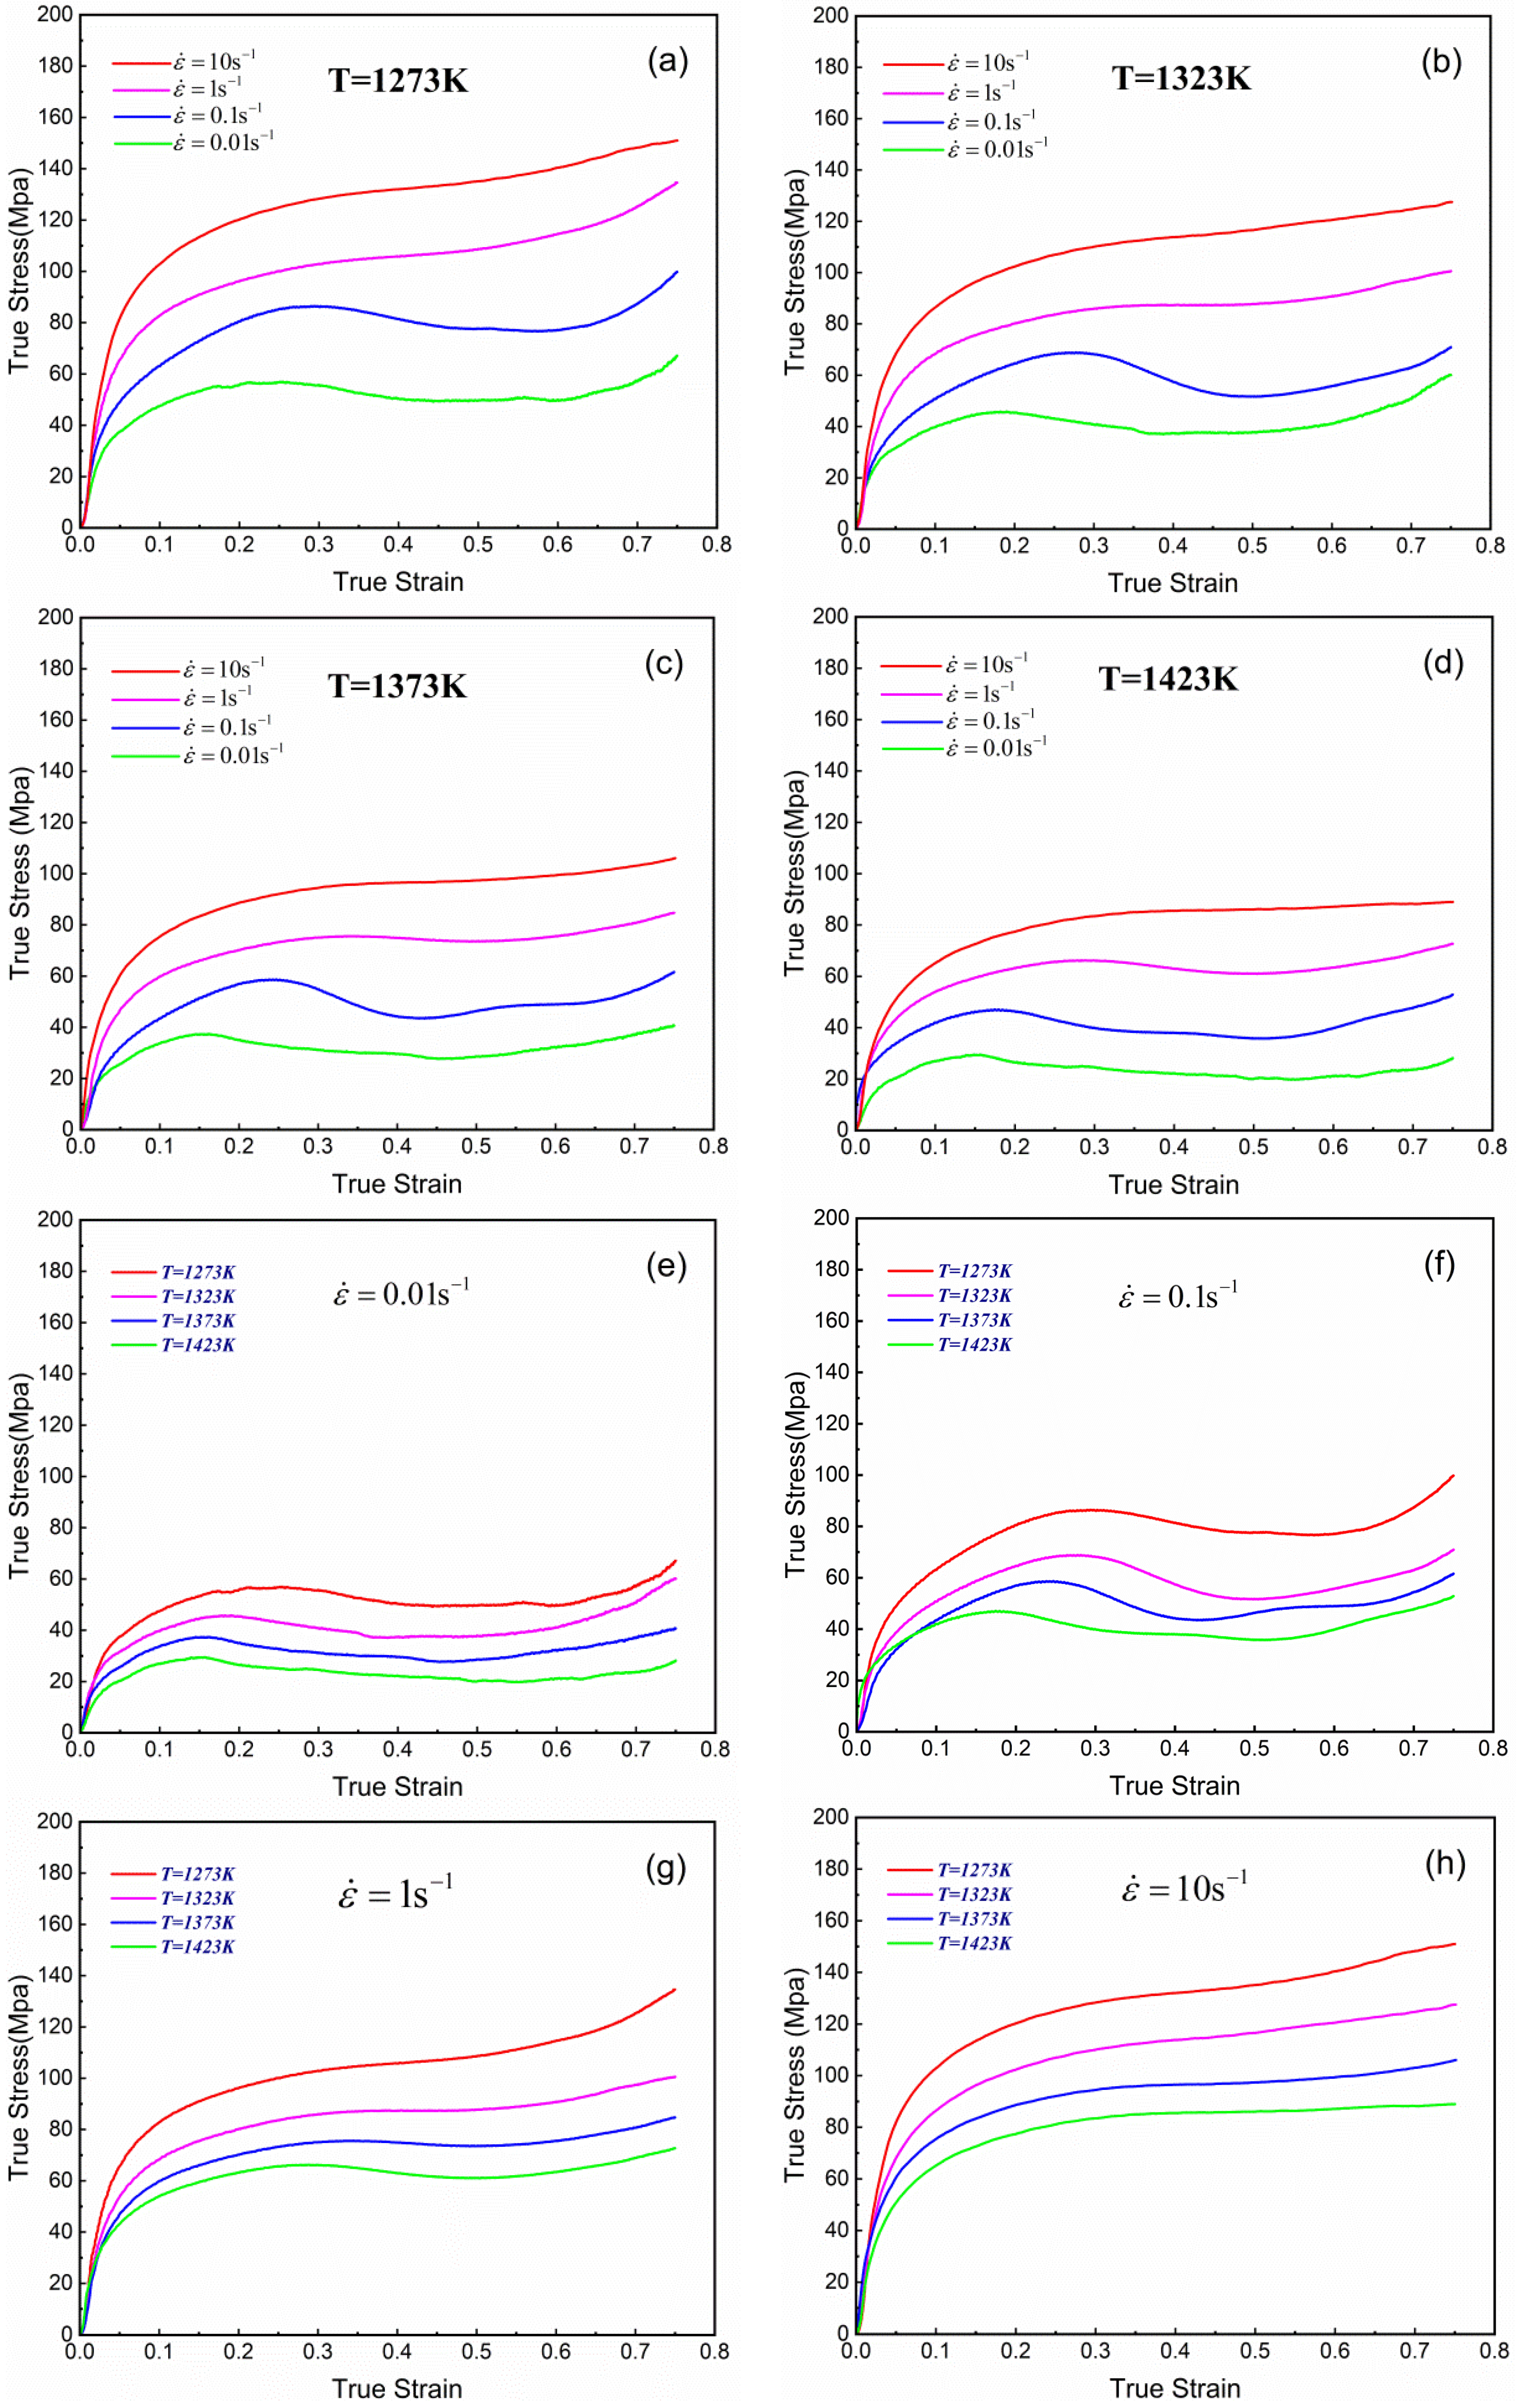
3. Test Results and Analysis

The true stress–true strain curve of 18CrNi4A steel during this process is shown in Figure 3. It can be concluded that these two factors can significantly impact the high temperature deformation feature of 18CrNi4A steel during hot compression deformation. From the test data, the conclusion can be drawn as follows:
(1) There exists a linear association between the flow stress and the DT under the condition that the strain and the strain rate are stable. With the DT increasing, the flow stress tends to decrease gradually. For example, when the strain rate is 1   s 1 and the true strain is 75%, according to Figure 3g, under the condition that the DT is 1273   K , the flow stress of the test steel is larger, and the true stress is 134.57   M p a ; when the DT is increased to 1423   K , the true stress is reduced to 72.68   M p a . There are two main reasons for the large difference in stress values. On the one hand, at the lower deformation temperature of 1273   K , the atomic diffusion resistance of the grain boundaries C , C r and N i increases, making it difficult to move the large-angle grain boundaries and hindering the nucleation and growth of new grains, resulting in higher flow stresses. On the other hand, when the deformation temperature increases to 1423   K , the kinetic energy of the atoms themselves increases, weakening the bonding force between the atoms. At the same time, the nucleation rate of recrystallization increases with DT, and the grain dislocation movement is enhanced under the action of high-temperature heat activation energy, producing new slip systems. The flow stress decreases as a result.
(2) The flow stress of the sample is enhanced with increase in the strain rate under the condition of the deformation amount and the DT does not change. When the DT is 1273   K and the true strain is 75%, according to the test data from Figure 3a, it can be inferred that, at a strain rate of 0.01   s 1 , the flow stress of test steel is minimal, and the true stress is only 67.11   M p a , while for a strain rate of 10   s 1 , the true stress increases rapidly to 150.96   M p a . This is because, as the rate of deformation increases, the stress imposed on the material facilitates a significant acceleration of dislocation mobility, which results in greater shear stresses for the slip between dislocations. Simultaneously, the atomic lattice distortion produced by the deformation creates various crystal defects, such as vacancies and interstitial atoms, which reduce the diffusion distance and inhibit further dislocation movement. This reduction in activation energy, facilitated by the increase in dislocation density occurring as a result of an accelerated dislocation motion, contributes to an overall rise in deformation resistance. Therefore, both factors, namely the enhanced dislocation activity and the crystal defect generation, work synergistically to promote deformation resistance at high strain-rates. On the other hand, as the deformation continues, dynamic recovery processes, such as dislocation slip and climb, become weaker than the stress increase caused by strain hardening, resulting in an increased degree of strain hardening. Although dynamic recovery can offset some strain hardening during deformation, at high deformation rates, the time required for a sample to reach a predetermined deformation becomes shorter. Dynamic recovery refers to the process whereby defects in a metal’s crystal structure, such as dislocations, quickly move and rearrange under applied stresses, decreasing the overall dislocation density. Dynamic recrystallization involves the formation of new, defect-free grains through nucleation and growth as a result of extensive plastic deformation. At high deformation rates, there may not be enough time for these processes to occur. As a result, strain hardening becomes dominant, leading to a continuous increase in deformation resistance. So, it is essential to consider the trade-off between the deformation rate and the resulting stress and strain hardening effects for proper material processing and forming in industry. However, at high deformation rates, dynamic recovery and dynamic recrystallization processes are significantly inhibited and cannot be fully completed. In this case, the effect of strain hardening on deformation is increased dramatically, which also leads to more significant suppression of deformation. Therefore, in the process of material processing and forming, in order to avoid the adverse effects of the above factors, it is necessary to control the deformation rate appropriately to ensure that the relevant strain hardening effect is within a reasonable range, providing support and assistance for material processing.
Overall, the true stress of 18CrNi4A steel is positively related to the true strain with a specified DT and strain rate, which is in line with expectations; the flow stress is proportional to the strain rate and inversely proportional to the DT when the strain is stable. When the DT increases, the temperature softening effect becomes obvious, and the flow stress exhibits a decreasing trend. When the strain rate increases, the strain rate hardening effect is significantly enhanced, and the flow stress shows an increasing trend. This indicates that 18CrNi4A steel is both deformation-temperature sensitive and positively strain-rate sensitive.

4. Johnson–Cook Constitutive Model Establishment

A material constitutive model is a mathematical function between the flow stress and strain, strain rate and DT for a given microstructure of one material [21]. The Johnson–Cook (J–C) constitutive model was first constructed by scholars G. R. Johnson and W. H. Cook in 1981, providing data for some metallic materials with different strain parameters [22]. Mareau C. has analyzed the thermodynamic consistency of the J–C model in detail [23]. This model has a simple form with only a small number of parameters, making it highly adaptable for characterizing the features of various materials with high DTs and strain rates. It is advantageous for analyzing the numerical association between the flow stress and strain with high deformation temperatures, and has been found to be accurate for many types of metallic materials. The equation used in the Johnson–Cook constitutive model is as follows:
σ = ( A + B ε n ) ( 1 + C ln ε ˙ * ) [ 1 ( T * ) m ]
in which σ and ε represent the flow stress and the plastic strain of the sample, respectively, ε ˙ refers to the strain rate, ε ˙ r means the reference strain rate and ε ˙ * = ε ˙ / ε ˙ r refers to the dimensionless strain rate. T * = ( T T r ) / ( T m T r ) refers to the dimensionless temperature, and T r means the reference temperature. As the main purpose of the study is consideration of high temperature plastic deformation, so T r is generally taken as the minimum value of the test range; in this paper T r = 1273   K . T m refers to the melting point; for this material T m = 1794   K . A, B, n, C and m are coefficients related to the materials; here, A means the yield stress at the reference condition (Mpa), B represents the strain hardening constant (Mpa), n refers to the strain hardening exponent, C corresponds to the strain rate hardening coefficient, and m refers to the softening exponent. In Equation (1), the three items to the right of the equal sign reflect the impact of the strain, the strain rate and the DT on the flow stress, i.e., the model takes into account the strain, the strain rate and the temperature effect on the flow stress of the material [24,25].

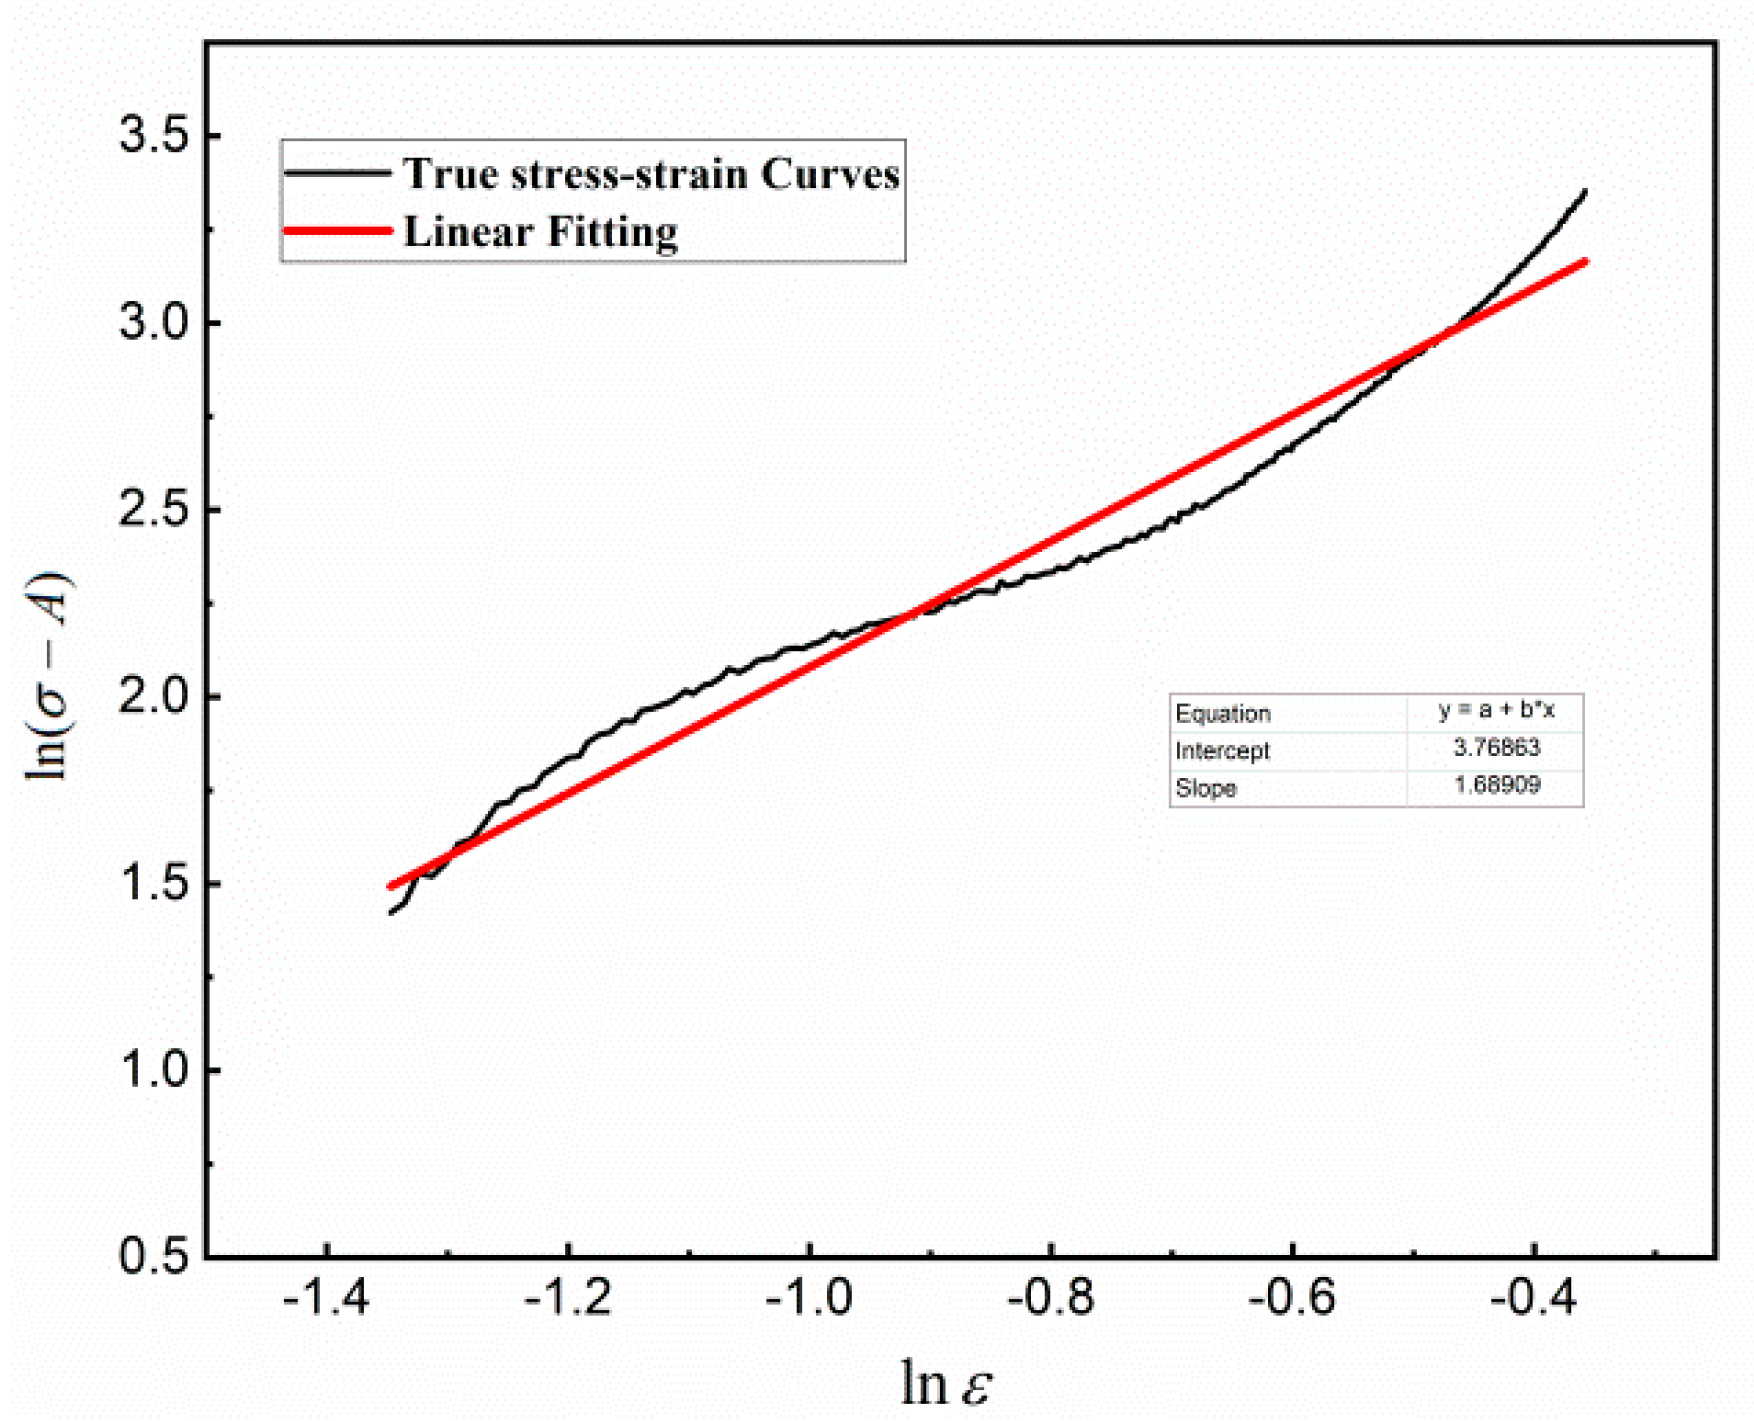
4.1. Determination of the Constants A, B and n

The stress value corresponding to a strain of 0.2% is the conditional yield limit. This article takes ε ˙ r = 1   s 1 and T r = 1273   K , and A = 96.62 Mpa, which can be obtained from the test data and is used alongside the other model parameters to predict the flow stress response with these different parameters. Under the condition of T = T r and a strain rate ε ˙ = ε ˙ r , Equation (1) is altered to:
σ = ( A + B ε n )
Moving A to the left in the above equation, and taking the natural logarithm of both sides, it is rewritten as follows:
ln ( σ A ) = ln B + n ln ε
The flow stress and strain test data are substituted into Equation (3), and a curve of ln ( σ A ) with ln ε (as Figure 4) is drawn. The slope and intercept of the curve correspond to the values of n and ln B . Hence, it can be inferred that B = 43.34   M p a and n = 1.6891 .

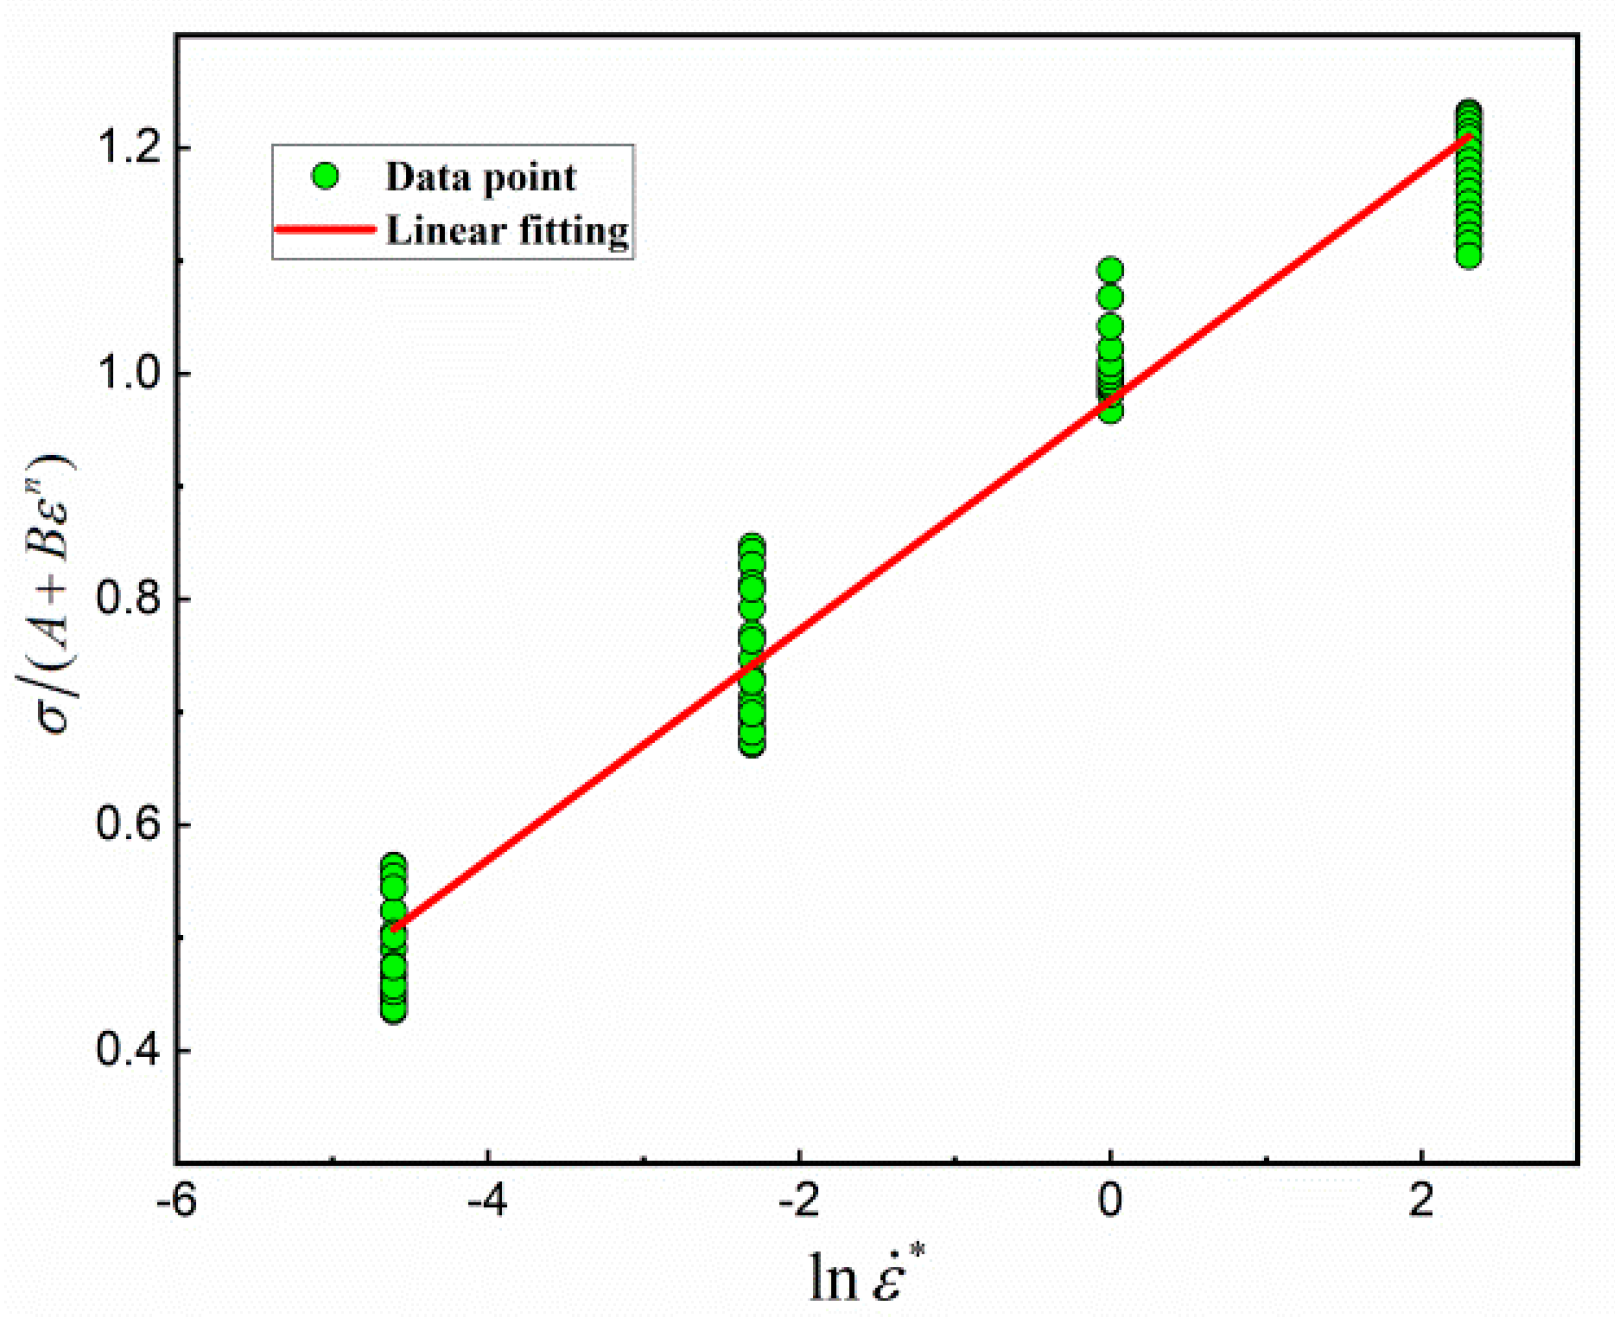
4.2. Determination of the Constant C

Taking T = T r = 1273   K , that is T * = 0 , and assuming the thermal softening influence is negligible, Equation (1) is expressed as follows:
σ = ( A + B ε n ) ( 1 + C ln ε ˙ * )
Transforming the style of Equation (4) yields
σ A + B ε n = 1 + C ln ε ˙ *
Starting from a true strain of 0.2, with 0.025 as the step length until a true strain of 0.75, a total of 23 feature points are substituted into Equation (5) at strain rates of 0.01   s 1 , 0.11   s 1 , 1   s 1 ,   10   s 1 , respectively, and 92 groups of data values of σ / ( A + B ε n ) with respect to ln ε ˙ * can be obtained. As Figure 5 shows, the curve slope is the value of the model parameter C , i.e., C = 0.0999 .

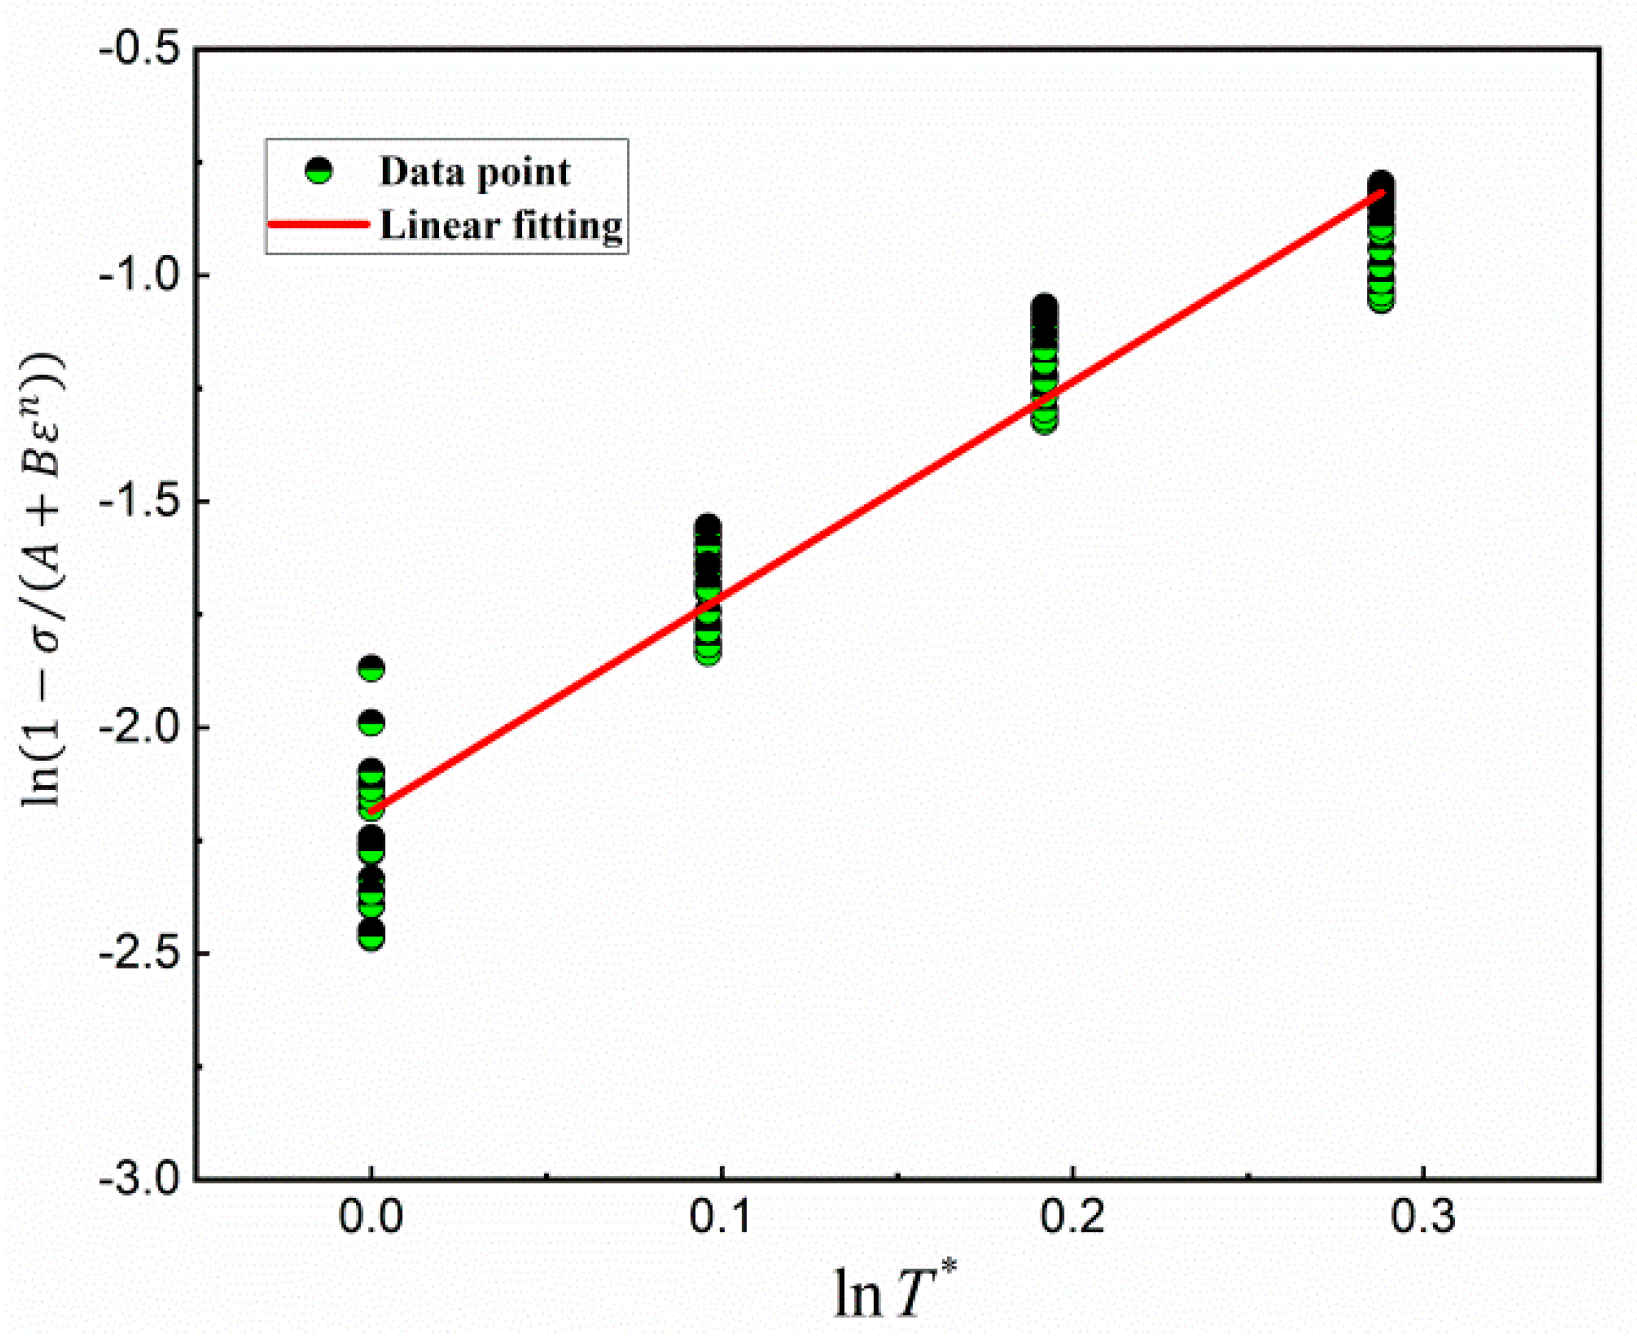
4.3. Determination of the Constant m

To obtain the value of the constant m , the flow stress values at different temperatures are measured during high-temperature plastic deformation of the test material at a specified strain rate. Using a data-fitting method, parameter m can then be obtained. Here, taking the strain rate ε = ˙ ε ˙ r = 1   s 1 , the thermal softening effect is negligible since ln ε ˙ * = 0 . Hence, Equation (1) can be transformed to:
1 σ A + B ε n = ( T * ) m
Taking the natural logarithm of Equation (6), we get
ln ( 1 σ A + B ε n ) = m ln T *
Similarly, starting from a true strain of 0.2 and working in steps of 0.025 up to a true strain of 0.75, 92 characteristic points are substituted into Equation (7) at four different operating temperatures 1273   K , 1323   K , 1373   K and 1423   K . By plotting these data points and fitting a curve to them, as shown in Figure 6, the v a l u e o f   m can be determined from the slope of the graph, that is, m = 4.065 .
So far, the Johnson–Cook constitutive model of 18CrNi4A steel during high DT has been constructed based on substituting the material constants estimated above into Equation (1).
σ = ( 96.62 + 43.34 ε 1.6891 ) ( 1 + 0.0999 ln ε ˙ * ) [ 1 ( T * ) 4.065 ]
To assess the predictive capability of the constructed J–C model, the estimated flow stress values using Equation (8) were compared with the true result.
As Figure 7 shows, it can be seen that these two results show good consistency only at the reference temperature and strain rate—for all other conditions, there are large deviations. It can be seen from the figure that, although the overall trend in the predicted value and the test data curve is consistent, there is a large deviation in the data when the strain increases. In addition, the greater the difference between the strain temperature, the strain rate and the reference value, the larger the deviation between the predicted value and the test data.
This is mainly due to the fact that an accurate and effective constitutive model of metallic materials should take into account the effects of three kinds of softening, while the Johnson–Cook constitutive model, as mentioned above, treats them as three independent factors. According to the research of relevant scholars, there is a certain coupling effect among these three effects. The coupling effect originates from the complex interplay between dislocation accumulation and the recovery mechanisms during plastic deformation, which can lead to nonlinear changes in the rheological behavior of metals under different conditions. In particular, the transient strain rate, and temperature softening effect may interact synergistically or antagonistically, with the strain hardening effect occurring due to the different microstructural characteristics and processing conditions of the material. So, the complex plastic deformation behavior cannot be simply represented by multiplying the consequences of various factors. However, some metal materials are more sensitive to the coupling effect of various factors. The test results show that the coupling effect of the three effects is very obvious in the plastic deformation of 18CrNi4A steel at high temperatures. Therefore, to establish the plastic deformation constitutive model of 18CrNi4A steel with higher precision, it is necessary to modify the above model.

5. Modified Johnson–Cook Model

From the above analysis, it can be seen that, in the study of the plastic flow features of 18CrNi4A, the coupling effect of the above three factors should be considered comprehensively in addition to their respective effects on the flow stress. To precisely predict the plastic flow behavior of 18CrNi4A steel at high temperatures, a constitutive model which can comprehensively characterize these effects should be selected. In this paper, the following modified J–C model was proposed in combination with the research results of relevant scholars:
σ = ( A + b 0 + b 1 ε + b 2 ε 2 + b 3 ε 3 ) ( 1 + C * ln ε ˙ * ) exp [ ( m 1 + m 2 ln ε ˙ * ) ( T T r ) ]

5.1. Determination of the Constants A , b 0 , b 1 , b 2 , b 3

Similarly, the constant A can be obtained directly, and when T = T r and ε ˙ = ε ˙ r , the Equation (9) can be changed to:
σ = A + b 0 + b 1 ε + b 2 ε 2 + b 3 ε 3
The stress and strain testing results are substituted into the above formula, and linear fitting of the third-order polynomial function is carried out. The values b 0 = 28.87 , b 1 = 233.5 , b 2 = 517.6 and b 3 = 429.4 can be obtained from the polynomial coefficients.

5.2. Determination of Temperature Softening Correlation Coefficients m 1 and m 2

Analysis of the curve indicates that the temperature softening effect of 18CrNi4A steel is related not only to the temperature but also to the strain rate. Therefore, the third factor in the modified model can be regarded as the temperature softening effect under the combined action of the DT and the strain rate, which are described through an exponential function.
According to the determination method of the temperature softening coefficient in the reference (Liu Aiqun) [26], at a certain strain rate, the ratio of the yield stress σ ¯ T at the test temperature T to the yield stress σ ¯ T r at the reference temperature T r is:
σ ¯ T σ ¯ T r = exp [ ( m 1 + m 2 ln ε ˙ * ) ( T T r ) ]
Taking the natural logarithm of Equation (11), it can then be changed into:
ln ( σ ¯ T σ ¯ T r ) = ( m 1 + m 2 ln ε ˙ * ) ( T T r )
Under different test temperatures, the values of ( m 1 + m 2 ln ε ˙ * ) can be calculated according to the test results. By linear fitting, the relationship between ( m 1 + m 2 ln ε ˙ * ) and ln ε ˙ * can provide m 1 = 3.42 × 10 3 and m 2 = 1.55 × 10 3 .

5.3. Determination of the Parameter C *

For the original J–C model, C is a sensitive parameter reflecting the influence of the strain rate on the plastic deformation of materials and is treated as a constant. In fact, C is a variable, which will change with the DT in the plastic deformation process. Therefore, the parameter C in Equation (9) should be regarded as an undetermined coefficient. To address this, this study utilizes real stress–strain data obtained from testing and applies a linear regression method to obtain parameter C * . This approach allows us to determine the coupling effect of the DT and the strain rate on the sample properties to construct a more accurate constitutive model. First, Equation (9) is transformed to obtain:
σ ( A + b 0 + b 1 ε + b 2 ε 2 + b 3 ε 3 ) exp [ ( m 1 + m 2 ln ε ˙ * ) ( T T r ) ] = 1 + C * ln ε ˙ *
The correlation coefficients for b 0 , b 1 , b 2 , b 3 , m 1 and m 2 in Equation (13) have been determined. By substituting Equation (13) at various strain rates ( 0.01   s 1 , 0.1   s 1 , 1   s 1 ,   10   s 1 ) and working temperatures ( 1273   K , 1323   K , 1373   K and 1423   K ), we can obtain 16 groups of data values for the C * with relevant engineering strain. To characterize the association of C * and T , the strain rate ε ˙ , and to ensure a high degree of correlation, C * is modified as a binary quadratic function C * = ( T , ε ˙ ) about T and ε ˙ :
C * = c 0 + c 1 T + c 2 ε ˙ + c 3 T 2 + c 4 ε ˙ 2 + c 5 T ε ˙
According to the calculation results and the test data, the model parameters were identified based on the method of least squares. Through this optimization process, the coefficients c 0 , c 1 , c 2 , c 3 , c 4 and c 5 were obtained; respectively: c 0 = 0.2981 , c 1 = 1.8618 × 10 4 , c 2 = 0.7331 , c 3 = 3.49 × 10 7 , c 4 = 6.94 × 10 2 and c 5 = 5.4065 × 10 5 .
Substituting the values of all the parameters previously found into Equation (9), a modified J–C model for the sample was obtained as follows:
σ = ( 67.75 + 233.5 ε 517.6 ε 2 + 429.4 ε 3 ) ( 1 + C * ln ε ˙ * ) exp [ ( 3.42 × 10 3 + 1.55 × 10 3 ln ε ˙ * ) ( T T r ) ] C * = 0.2981 + 1.8618 × 10 4 T + 0.7331 ε ˙ 3.49 × 10 7 T 2 6.94 × 10 2 ε ˙ 2 5.4065 × 10 5 T ε ˙
According to Equation (15), the stress–strain association of 18CrNi4A steel in high temperature plastic deformation can be obtained. To confirm the accuracy of the modified model, the calculated values were compared with the test data during the high DT process of the engineering strain from 25% to 75%, as shown in Figure 8. It can be concluded that the results for the modified model show good consistency with the experimental results. The calculation accuracy is obviously better than that of the original Johnson–Cook model, and the modified model is very suitable to predict the high temperature plastic deformation features of 18CrNi4A steel.

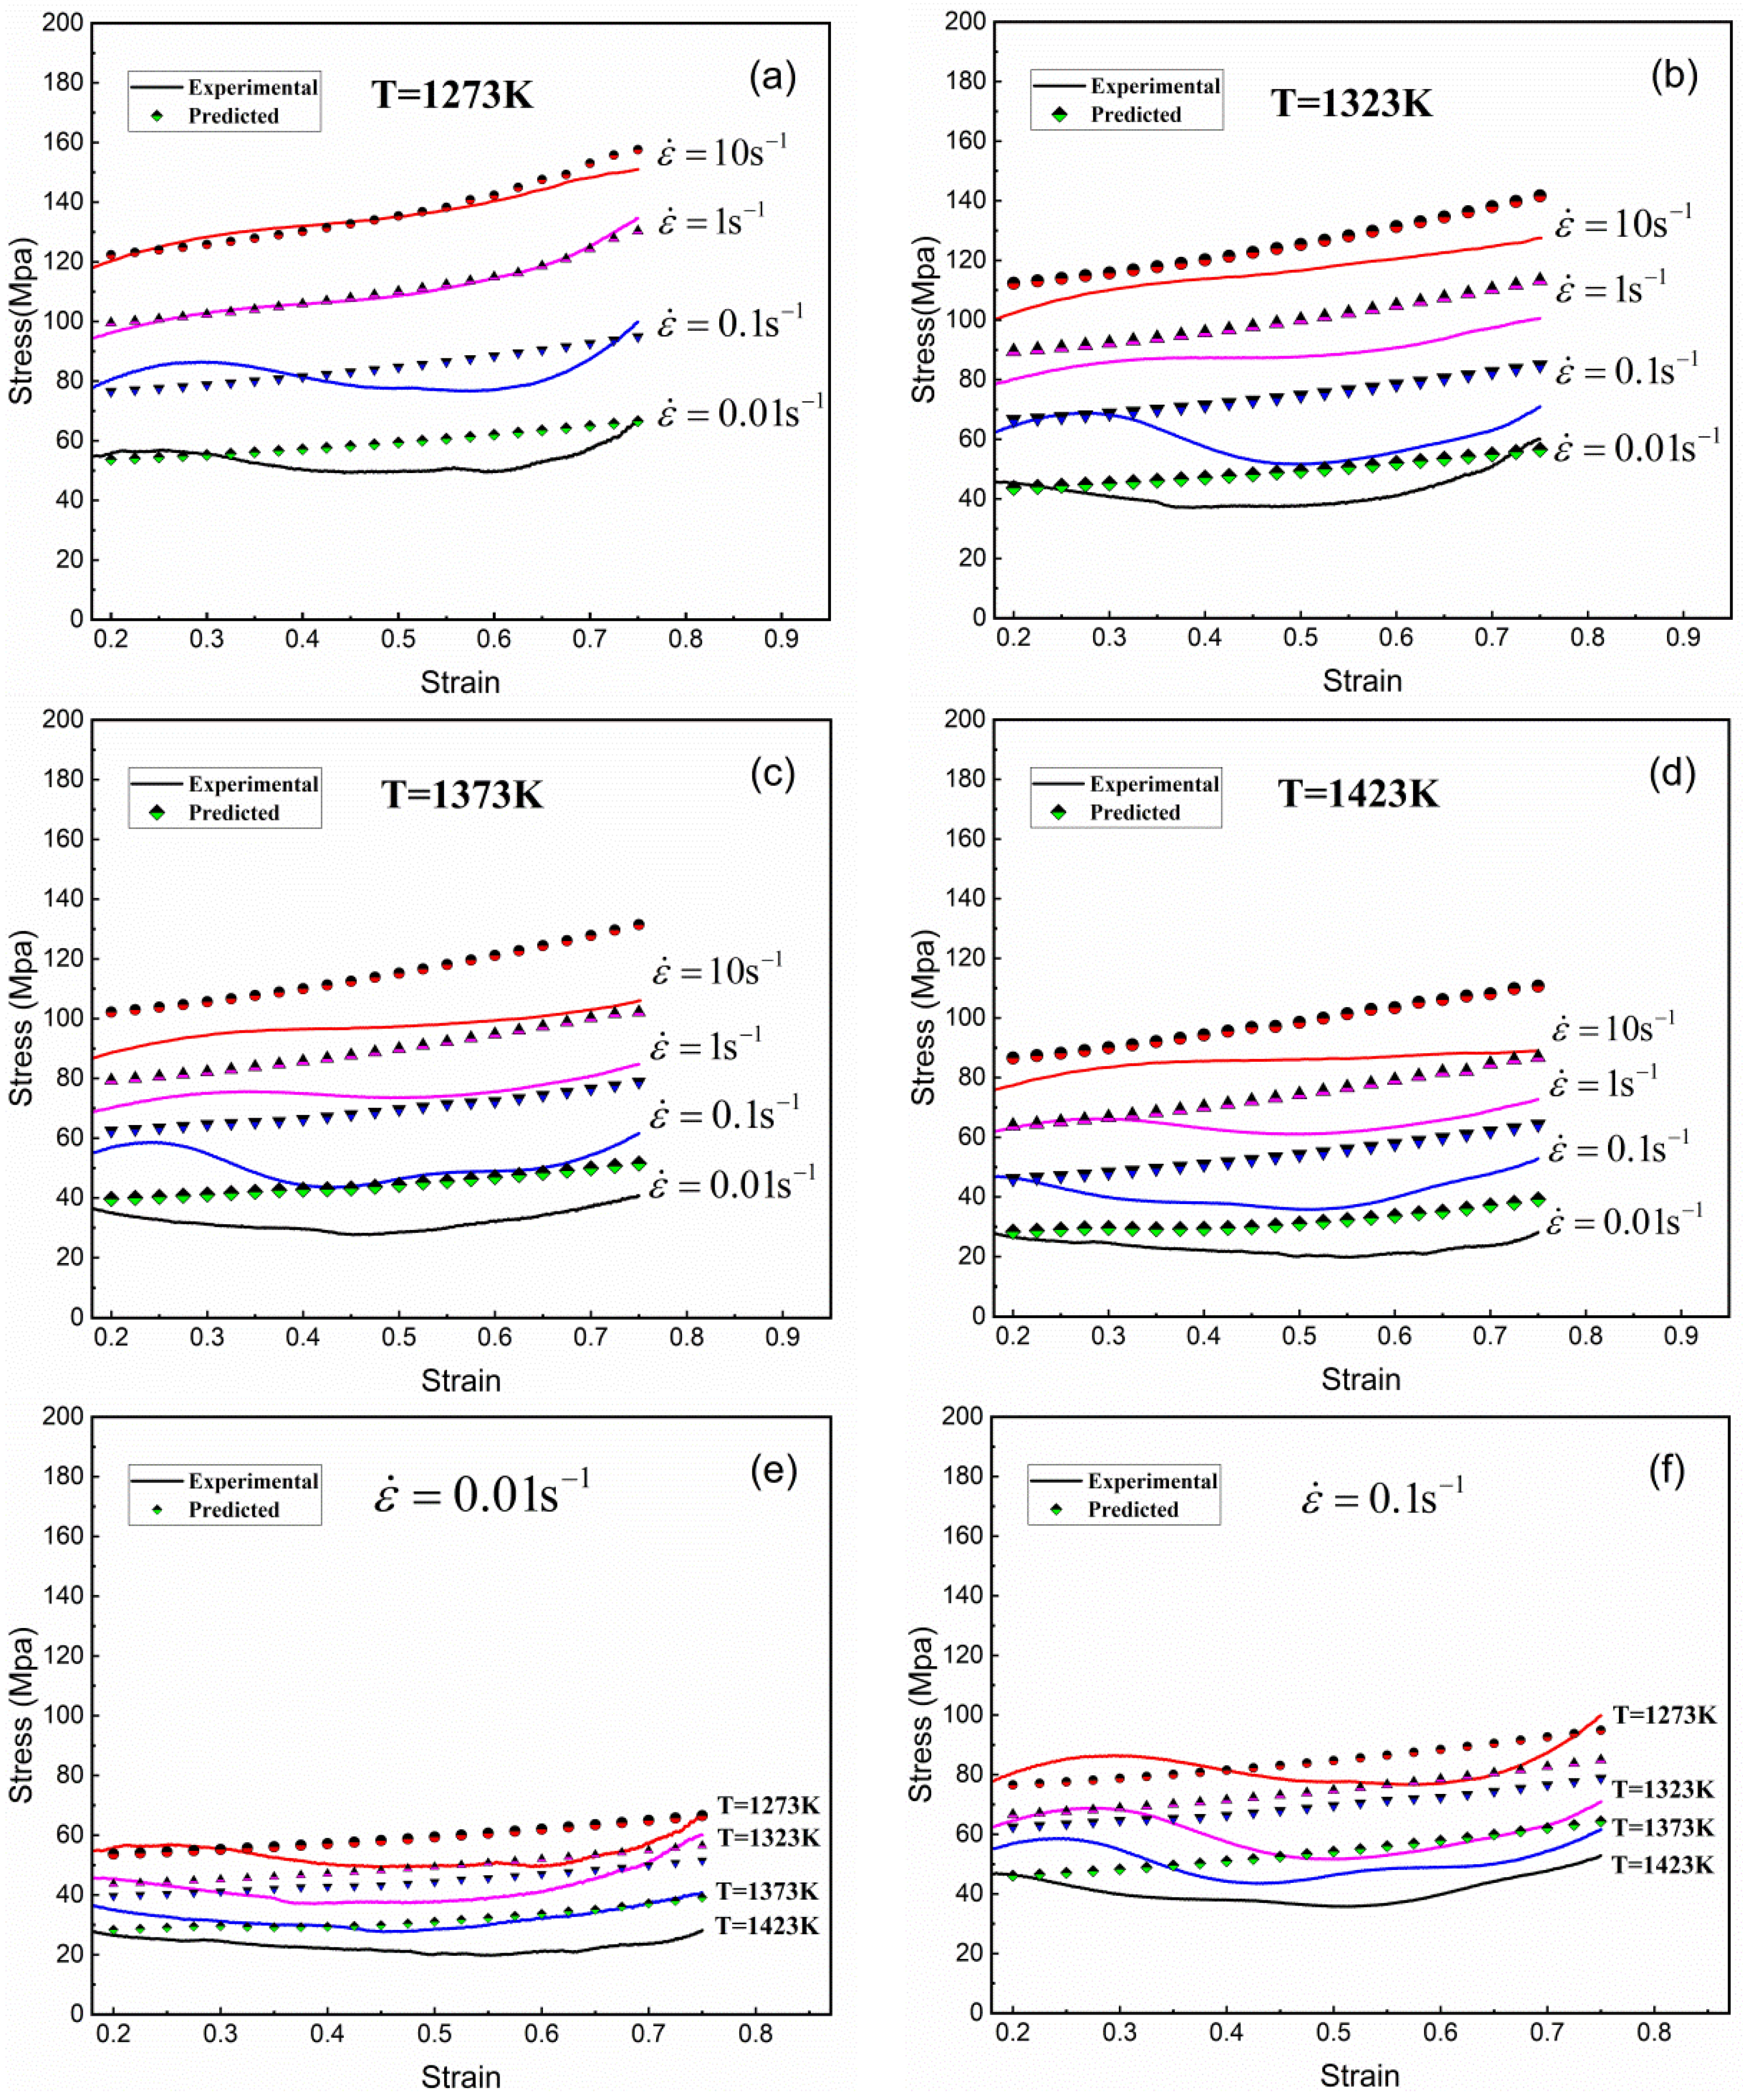
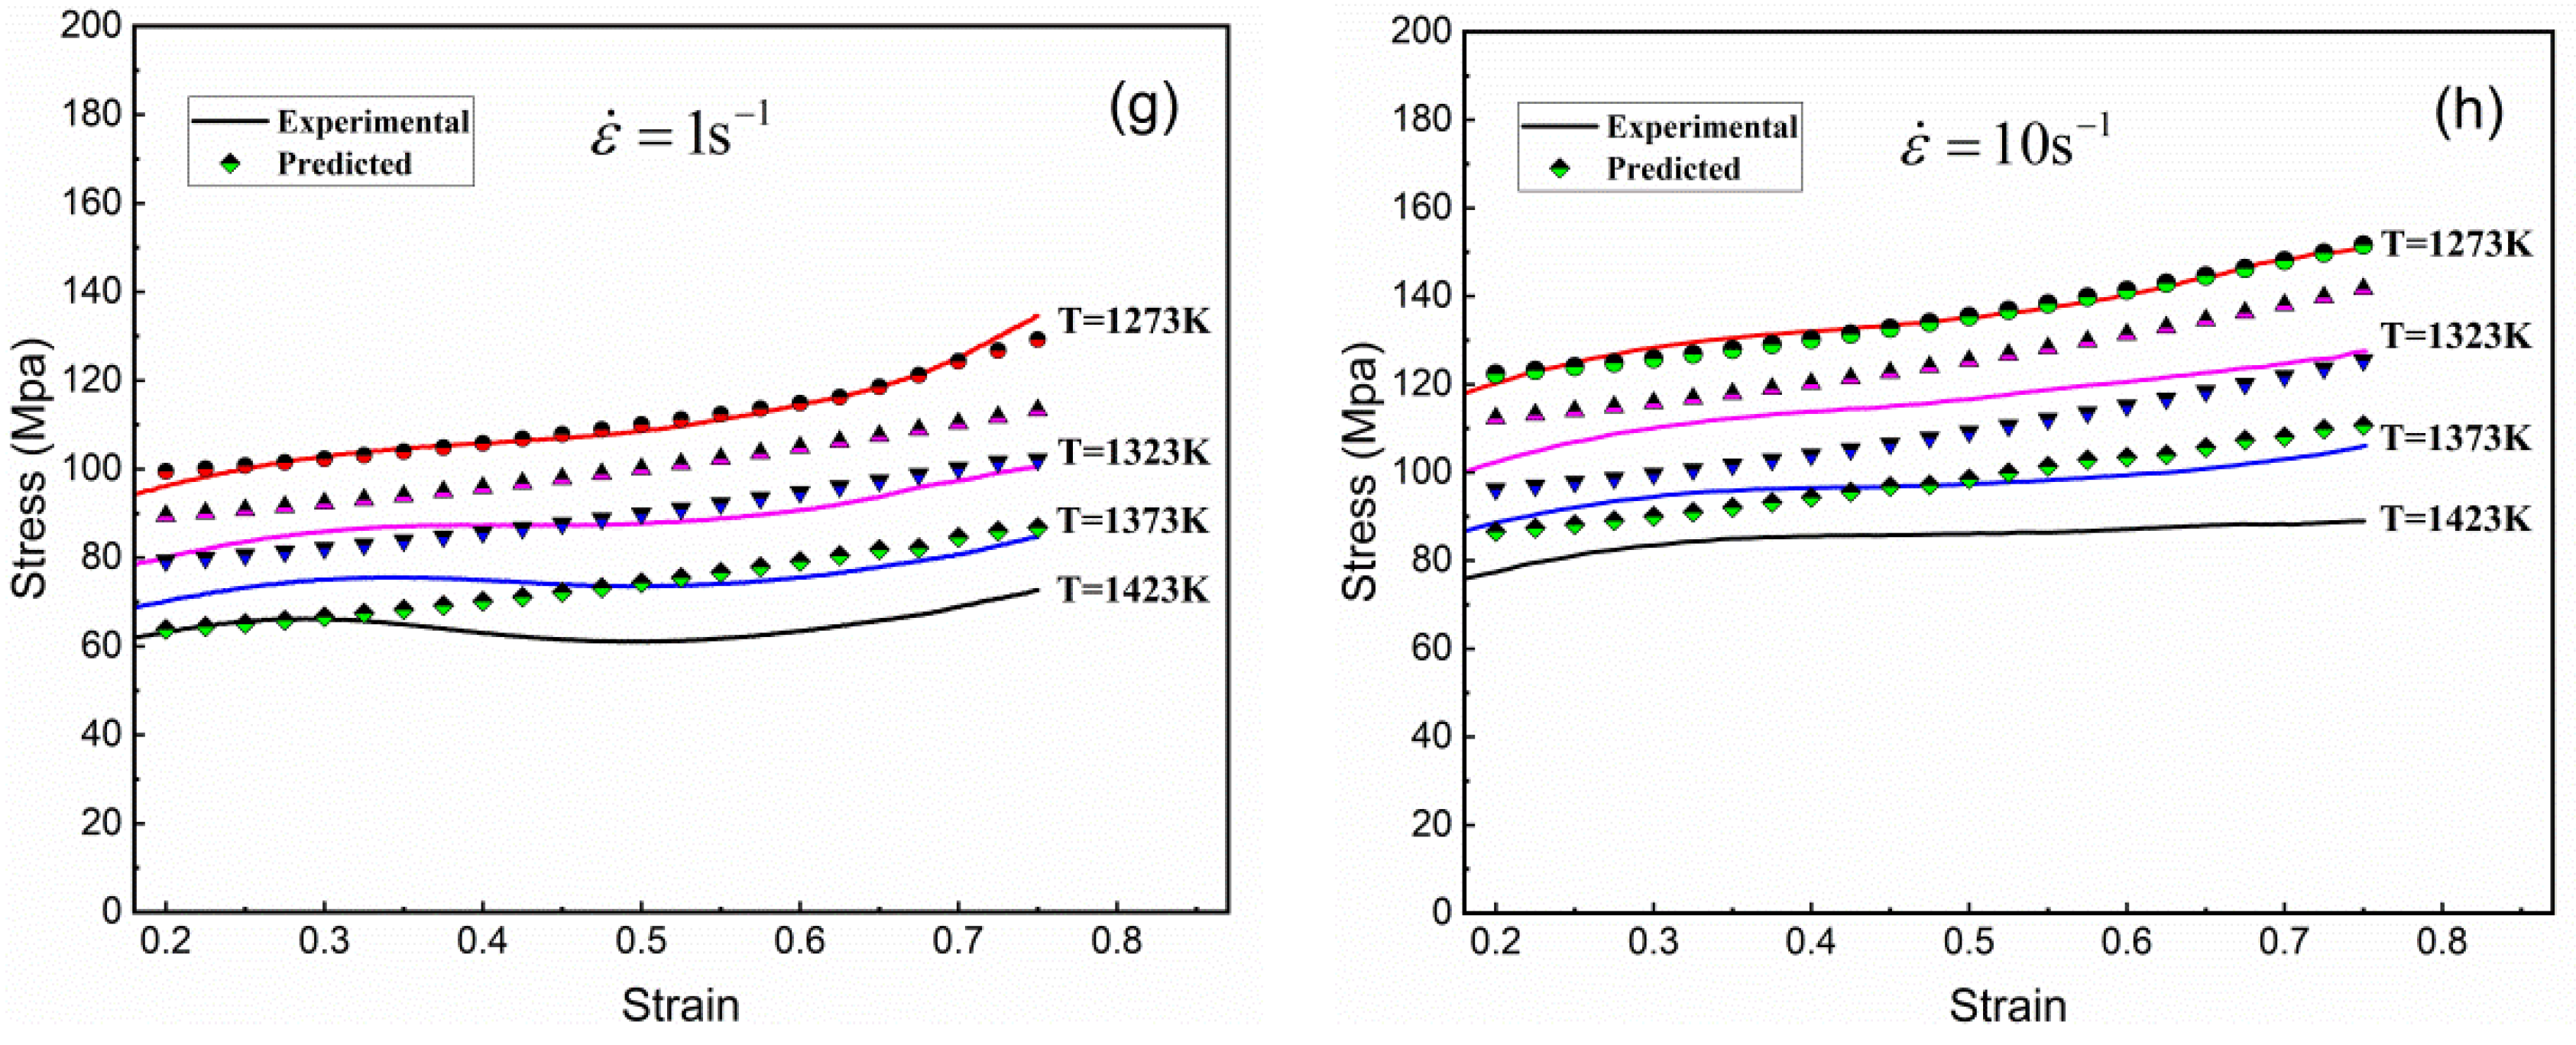
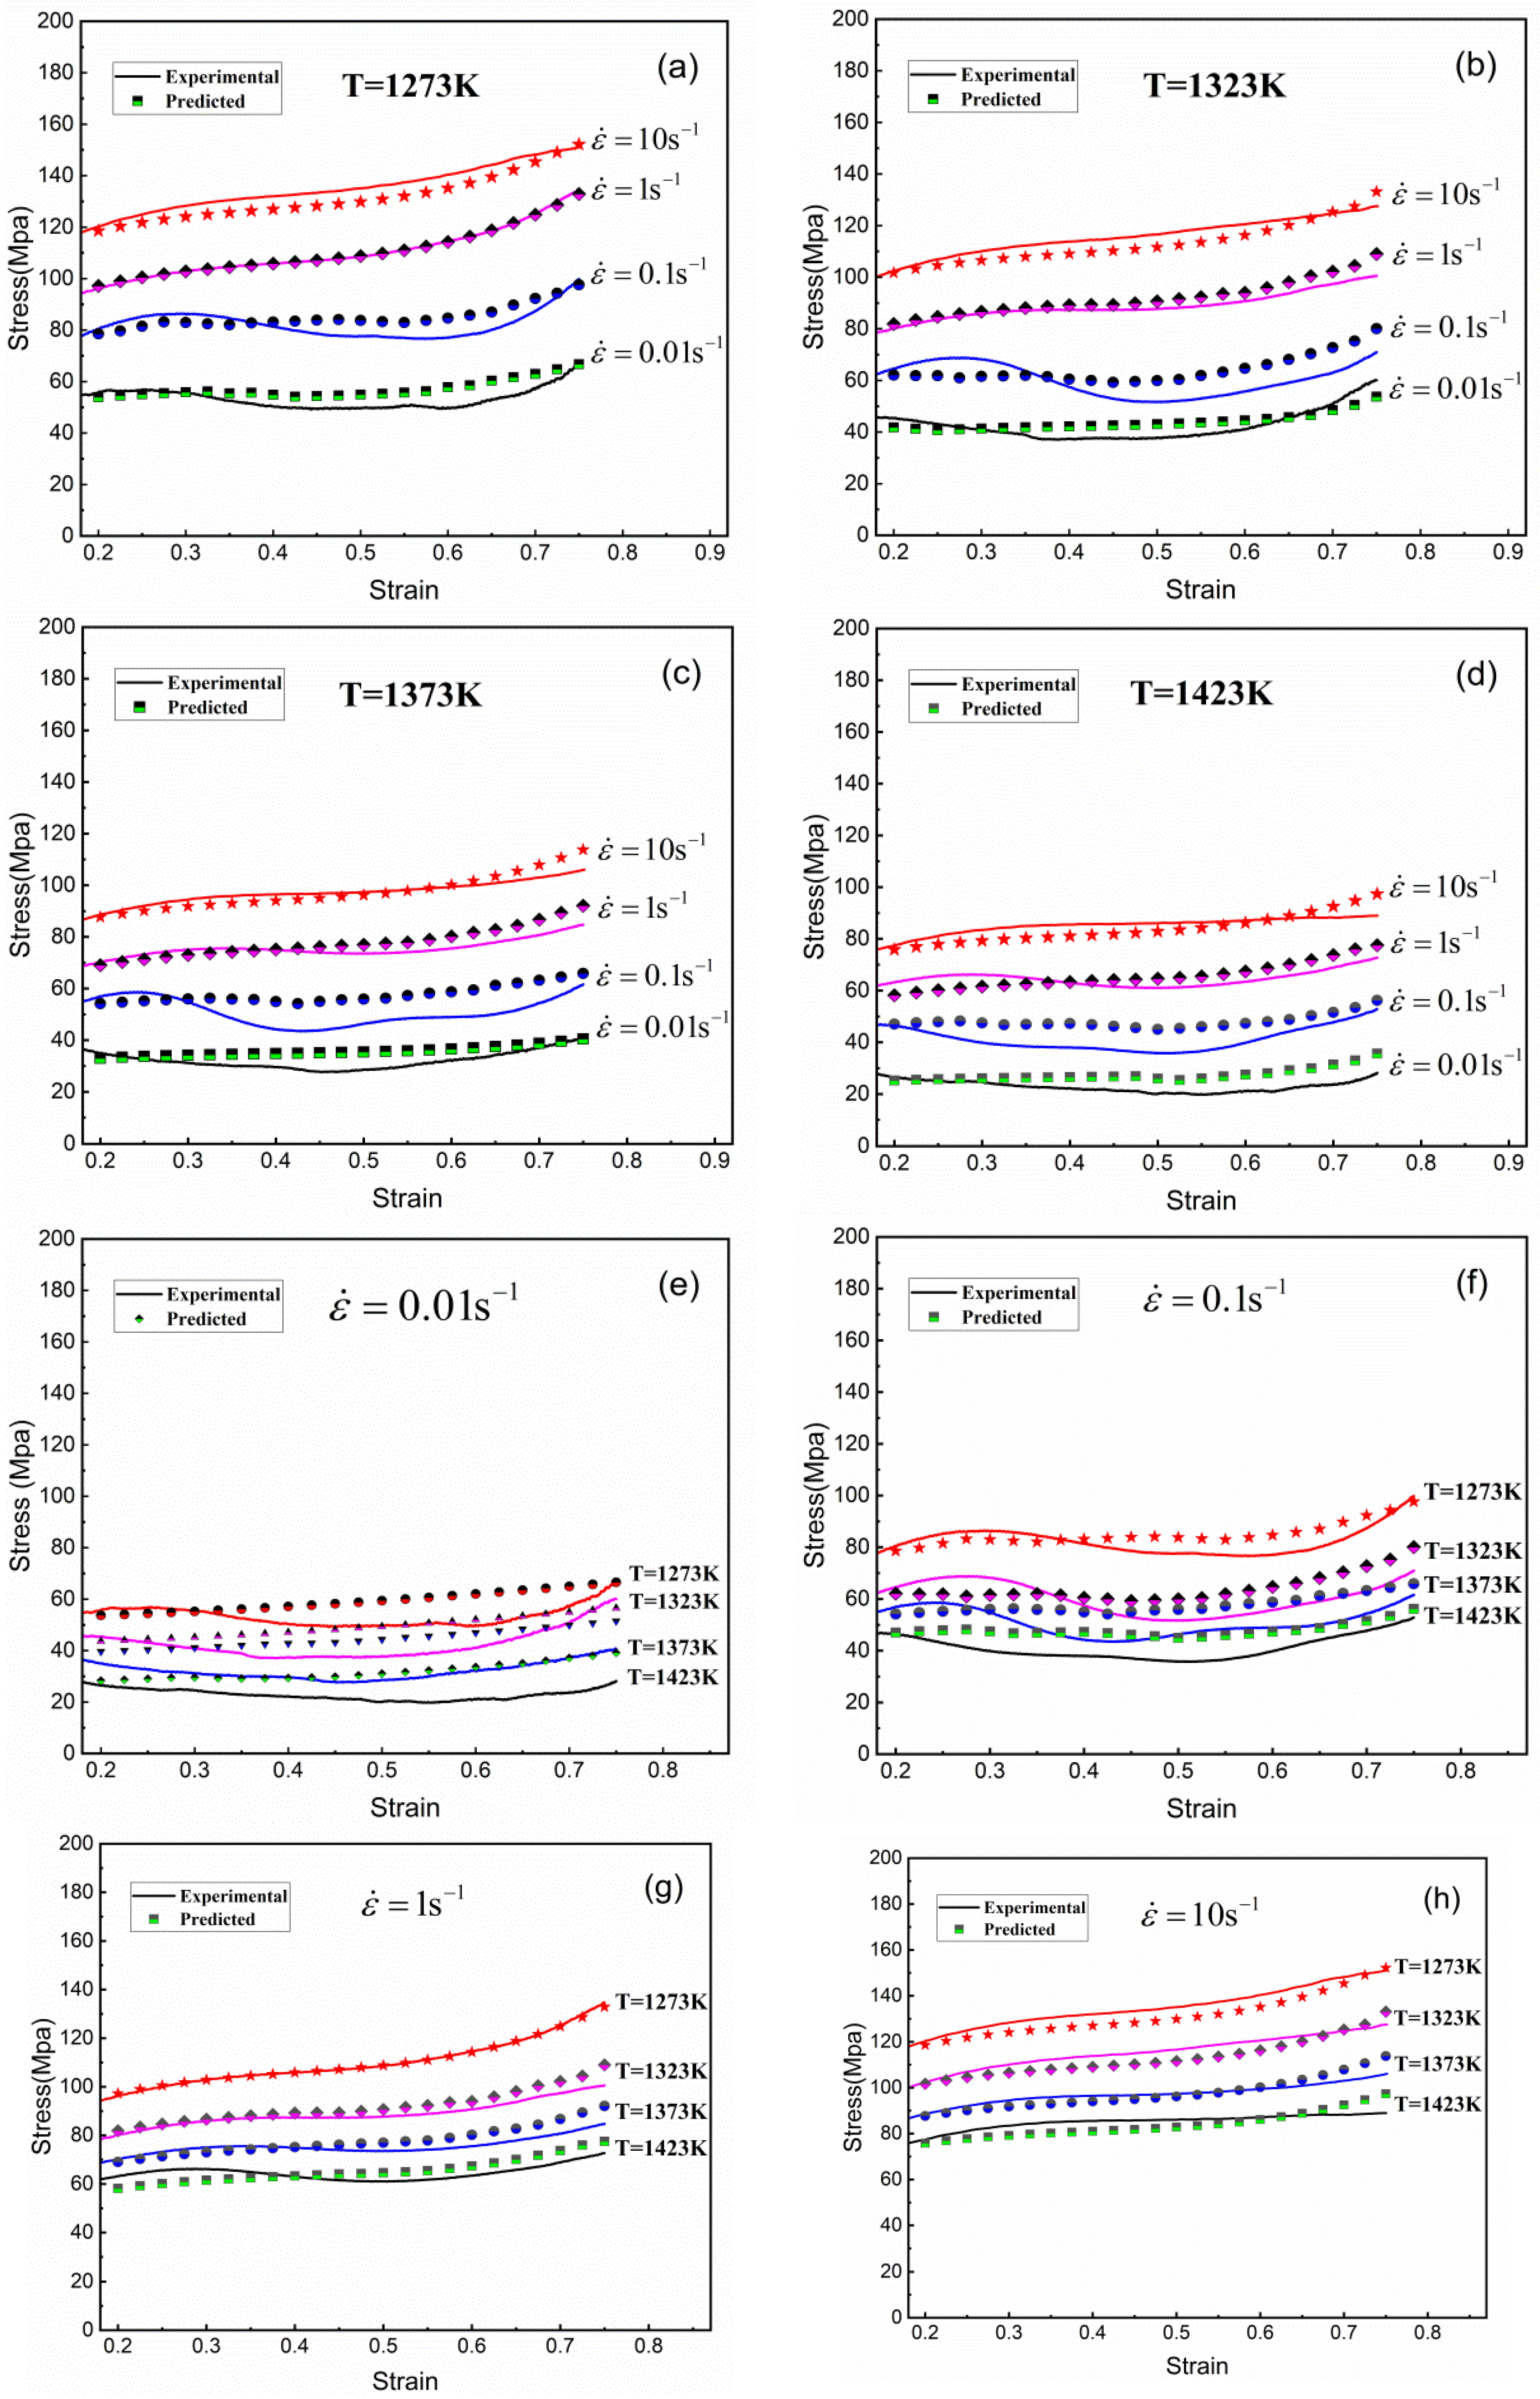
5.4. Model Accuracy Analysis

The accuracy and applicability of the constructive model must be concretely demonstrated. According to relevant studies, the correlation coefficient ( R ) and the average absolute relative error ( A A R E ) are generally chosen to compare the accuracy of the test data and the model result [27]. R can be used to reflect the strength level of the linear relationship between the two results, while the A A R E was applied to measure the predictability of the above model. In general, t h e   R value is positively related to the correlation level between the two results, and there exists the same relation between the A A R E value and the error. The R and A A R E can be determined by the following formula:
R = i = 1 i = N ( σ e i σ ¯ e ) ( σ p i σ ¯ p ) i = 1 i = N ( σ e i σ ¯ e ) 2 i = 1 i = N ( σ p i σ ¯ p ) 2
A A R E ( % ) = 1 N   i = 1 i = N σ e i σ p i σ e i × 100
In this study, 368 data points of plastic flow stress data were used for analysis. σ e i and σ p i represent the test data and model prediction values, respectively, for the same strain with various strain rates and DTs. σ ¯ e and σ ¯ p refer to the mean of σ e i and σ p i , a n d   N corresponds to the number of data points selected during plastic deformation. For the original J–C model, a value of 0.962 was calculated for R and 16.36% for A A R E . For the modified model, R was 0.991 and A A R E was 5.58%. It is obvious that the modified J–C model exhibits higher accuracy.

6. Conclusions

In this paper, the high temperature plastic deformation behavior of 18CrNi4A steel in the specified range of temperature and strain rate was studied by uniaxial high temperature compression thermal simulation testing. The following conclusions can be drawn:
(1) By analyzing the true stress–strain curve, it was shown that 18CrNi4A steel is not only a deformation temperature-sensitive material, but also a positive strain-rate sensitive material.
(2) Based on the test data, the original J–C constitutive model was established. It does not take into account the coupling effect between the deformation factors, so its prediction accuracy is low.
(3) The modified J–C model comprehensively considers the coupling effect of the deformation temperature and strain rate on the real stress and strain. By comparing the predicted value of the model with the test data, as the actual deformation conditions are far away from the reference conditions, the model still shows higher prediction accuracy.
(4) Compared with the original J–C model, the R and AARE predicted values of the modified J–C model were increased by 0.029 and 10.78%, respectively.
Therefore, the modified J–C model has higher prediction accuracy, which can save costs for the popularization and application of 18CrNi4A steel and provide effective support for the widespread engineering application of the steel.

Author Contributions

Conceptualization, Z.W. and C.J.; methodology, Z.W.; software, Z.W.; validation, B.W., Y.W. and C.J.; formal analysis, Y.W.; investigation, Z.W.; resources, C.J.; data curation, Z.W.; writing—original draft preparation, Z.W.; writing—review and editing, Z.W. and C.J.; visualization, Y.W.; supervision, B.W.; project administration, B.W.; funding acquisition, C.J. All authors have read and agreed to the published version of the manuscript.

Funding

This research was funded by the National Key Project (J2019-VII-0017-0159).

Institutional Review Board Statement

Not applicable.

Informed Consent Statement

Not applicable.

Data Availability Statement

Not applicable.

Acknowledgments

The authors would like to thank all the authors of the references that gave us inspiration and help. The authors are grateful to the editors and anonymous reviewers for their valuable comments that improved the quality of this paper.

Conflicts of Interest

The authors declare no conflict of interest.

References

  1. Chen, T.T.; Shi, C.Q.; Ning, Z.D.; Wen, M.; Guan, W.M.; Guo, J.M.; Wang, C.J. Advances in the study of intrinsic modeling and thermal processing diagrams in the thermal deformation of metals and alloys. Mater. Direct 2022, 36, 416–424. [Google Scholar]
  2. Long, S. Rapid Solution Method and Application of Alloy Heat Deformation Behavior. Ph.D. Thesis, Chongqing University, Chongqing, China, 2020. [Google Scholar]
  3. Samantaray, D.; Mandal, S.; Bhaduri, A.K. A comparative study on Johnson Cook, modified Zerilli-Armstrong and Arrhenius-type constitutive models to predict elevated temperature flow behaviour in modified 9Cr-1Mo steel. Comp. Mater. Sci. 2009, 47, 568–576. [Google Scholar] [CrossRef]
  4. Ramana, A.V.; Balasundar, I.; Davidson, M.J.; Balamuralikrishnan, R.; Raghu, T. Constitutive Modelling of a New High-Strength Low-Alloy Steel Using Modified Zerilli–Armstrong and Arrhenius Model. Trans. Indian Inst. Met. 2019, 72, 2869–2876. [Google Scholar] [CrossRef]
  5. Milani, A.S.; Dabboussi, W.; Nemes, J.A.; Abeyaratne, R.C. An improved multi-objective identification of Johnson-Cook material parameters. Int. J. Impact Eng. 2009, 36, 294–302. [Google Scholar] [CrossRef]
  6. Motallebi, R.; Savaedi, Z.; Mirzadeh, H. Additive manufacturing—A review of hot deformation behavior and constitutive modeling of flow stress. Curr. Opin. Solid State Mater. Sci. 2022, 26, 100992. [Google Scholar] [CrossRef]
  7. Murugesan, M.; Jung, D.W. Two flow stress models for describing the hot deformation behavior of AISI-1045 medium carbon steel at elevated temperatures. Heliyon 2019, 5, e01347. [Google Scholar] [CrossRef]
  8. Li, H.Y.; Li, Y.H.; Wang, X.F.; Liu, J.J.; Wu, Y. A comparative study on modified Johnson Cook, modified Zerilli-Armstrong and Arrhenius-type constitutive models to predict the hot deformation behavior in 28CrMnMoV steel. Mater. Des. 2013, 49, 493–501. [Google Scholar] [CrossRef]
  9. Nassiraei, H.; Lotfollahi-Yaghin, M.A.; Neshaei, S.A.; Zhu, L. Structural behavior of tubular X-joints strengthened with collar plate under axially compressive load at elevated temperatures. Mar. Struct. 2018, 61, 46–61. [Google Scholar] [CrossRef]
  10. Nassiraei, H.; Mojtahedi, A.; Lotfollahi-Yaghin, M.A.; Zhu, L. Capacity of tubular X-joints reinforced with collar plates under tensile brace loading at elevated temperatures. Thin-Walled Struct. 2019, 142, 426–443. [Google Scholar] [CrossRef]
  11. Li, H.B.; Zheng, M.Y.; Tian, W.; Xu, S.C.; Tian, Y.Q. Flow stress constitutive equation of M50NiL gear steel based on Johnson-Cook model. Mater. Mech. Eng. 2016, 40, 31–37. [Google Scholar]
  12. Wang, W.; Wang, B.; Yan, H.J.; Ma, S.B.; Zhang, S.J. Johnson-Cook constitutive model and hot processing map of 20Cr2Ni4A steel based on isothermal compression tests. Hot Work. Technol. 2020, 13, 103–108. [Google Scholar]
  13. Wang, X.Q.; Ruan, X.L.; Cui, F.K. Establishment and verification of constitutive equation for quenched 42CrMo steel. J. Plast. Eng. 2019, 26, 118–124. [Google Scholar]
  14. Chen, X.W.; Yang, X.Q.; Wang, N.N. Warm deformation behavior and Hanse1-Spittel of constitutive model of GCrl5SiMn steel. Heat Treat. Met. 2018, 43, 34–38. [Google Scholar]
  15. Lun, J.W.; Liu, W.; Yang, Y.; Guo, C. High temperature plastic deformation behavior and constitutive equation establishment of 35CrMoV steel. Forg. Stamp. Technol. 2021, 46, 216–220. [Google Scholar]
  16. Zhu, X.X.; Wang, B.Y. High temperature deformation behavior and processing maps of SAE8620H gear steel. Chin. J. Eng. 2016, 38, 967–972. [Google Scholar]
  17. Tang, H.Y.; Yang, M.S.; Meng, W.J.; Li, J.S. Hot deformation behavior of Cr-Co- Mo- Ni gear steel and finite element simulation of the die forging process. Chin. J. Eng. 2016, 38, 77–86. [Google Scholar]
  18. Wang, W.M.; Wang, S.Q.; Liu, X.M. Property and microstructure of steel 18CrNi4A. Iron. Steel. 1995, 30, 94–98. [Google Scholar]
  19. Wang, Y.Z.; Chen, Y.Y.; Wang, Z.Q.; Wang, G.C. Plasticity of fully carburized material 18CrNi4A under high temperature and strain rate. Trans. B Inst. Technol. 2017, 37, 239–243. [Google Scholar]
  20. Editorial Committee of the Engineering Materials User Manual. Engineering Materials User Manual, 2nd ed.; China Standards Publishing House: Beijing, China, 2002. [Google Scholar]
  21. Jia, C.L.; Chen, F.R. Modification of Johnson-Cook constitutive model and finite element simulation of aluminum alloy 7A52. J. Inner Mong. Technol. 2019, 38, 416–423. [Google Scholar]
  22. Johnson, G.R.; Cook, W.H. A constitutive model and data for metals subjected to large strains, high strain rates, and high temperatures. In Proceedings of the Seventh International Symposium on Ballistics, International Ballistics Committee, Hague, The Netherlands, 19–21 April 1983. [Google Scholar]
  23. Mareau, C. A thermodynamically consistent formulation of the Johnson-Cook model. Mech. Mater. 2020, 143, 103340. [Google Scholar] [CrossRef]
  24. Li, Y.F.; Zeng, X.G.; Liao, Y. Thermal-viscoplastic constitutive relation of Ti-6Al-4V alloy and numerical simulation by modified Johnson-Cook modal. Chin. J. Nonferrous Met. 2017, 27, 1419–1425. [Google Scholar]
  25. Yang, C.X.; Wang, S.Y.; Wu, D.X. Establishment and simulation application of modified JC constitutive model for as-forged 7050 aluminum alloy. Alum. Fabrica. 2022, 4, 47–51. [Google Scholar]
  26. Liu, A.Q.; Huang, X.C. Identification of high-strain-rate material parameters in dynamic Johnson-Cook constitutive model. Appl. Math. Mech. 2014, 35, 219–225. [Google Scholar]
  27. Yu, R.H.; Li, X.; Li, W.J.; Chen, J.T.; Guo, X.; Li, J.H. Application of four different models for predicting the high-temperature flow behavior of TG6 titanium alloy. Mater. Today Commun. 2021, 26, 102004. [Google Scholar] [CrossRef]
Figure 1. Sketch of compression test and sample.
Coatings 13 01697 g001
Figure 2. Diagram of the thermal simulation compression test scheme.
Coatings 13 01697 g002
Figure 3. The true strain–stress carve with various deformation temperatures and strain rates. (ad) are the true stress–strain curves at the same temperature and different strain rates; (eh) are the true stress–strain curves at the same strain rate and different temperatures.
Coatings 13 01697 g003
Figure 4. The relation between ln ( σ A ) and ln ε .
Coatings 13 01697 g004
Figure 5. The relation between σ / ( A + B ε n ) and ln ε ˙ * .
Coatings 13 01697 g005
Figure 6. The association of ln ( 1 σ / ( A + B ε n ) ) and ln T * .
Coatings 13 01697 g006
Figure 7. Comparison of the testing data and the predicted result of the Johnson–Cook model with different deformation temperatures and strain rates. (ad) are the true stress–strain curves at the same temperature and different strain rates; (eh) are the true stress–strain curves at the same strain rate and different temperatures.
Coatings 13 01697 g007aCoatings 13 01697 g007b
Figure 8. Comparison of the testing data and the predicted result of the modified J–C model with different deformation temperatures and strain rates. (ad) are the true stress–strain curves at the same temperature and different strain rates; (eh) are the true stress–strain curves at the same strain rate and different temperatures.
Coatings 13 01697 g008
Table 1. Chemical composition of 18CrNi4A sample.
ElementCMnSiSPCrNiFe
Composition, %.wt.0.1850.4600.3160.0080.0121.0564.086Bal.
Disclaimer/Publisher’s Note: The statements, opinions and data contained in all publications are solely those of the individual author(s) and contributor(s) and not of MDPI and/or the editor(s). MDPI and/or the editor(s) disclaim responsibility for any injury to people or property resulting from any ideas, methods, instructions or products referred to in the content.

