Article

Optimizing Experimental Immersion Protocol for SEBS Coating Formation on Copper Surfaces Using Response Surface Methodology

by
Fatma Masmoudi
1,
Abdulrahman Mallah
2 and
Mohamed Masmoudi
1,3,*
1
Laboratory of Electrochemistry and Environment (LEE), Sfax National Engineering School (ENIS) BPW, University of Sfax, Sfax 3029, Tunisia
2
Department of Chemistry, College of Science, Qassim University, P.O. Box 6644, Buraydah Almolaydah, Buraydah 51452, Saudi Arabia
3
Preparatory Institute for Engineering Studies of Sfax, Department of chemistry, University of Sfax, Sfax 3029, Tunisia
*
Author to whom correspondence should be addressed.
Coatings 2023, 13(10), 1734; https://doi.org/10.3390/coatings13101734
Submission received: 9 August 2023 / Revised: 12 September 2023 / Accepted: 28 September 2023 / Published: 5 October 2023
(This article belongs to the Special Issue Advanced Corrosion Protection through Coatings and Surface Rebuilding)

Abstract

:
Polystyrene-block-poly (ethylene-ran-butylene)-block-polystyrene (SEBS) was successfully deposited on the copper surface with an optimal condition of immersion protocol. Response surface methodology (RSM), particularly Box–Behnken Design (BBD), was used to study the combination of three environmental factors that minimize corrosion rate (CR), evaluated by voltammetry around the open circuit potential (OCP). The BBD analysis calculates the contribution value of each parameter in changing the value of the CR in both individual and synergistic cases. The optimized parameters were found to be 2.17% of SEBS ratio, 20 min of immersion time 1, and 21 min of immersion time 2. The empirical model result was confirmed by studying the electrochemical behavior of the SEBS coating on copper under optimal conditions (Cu-SEBS-Opt-Cond) exposed in a 3 wt% NaCl solution.

1. Introduction

The rapid progress of the manufacturing industry poses a significant challenge in finding a single material capable of meeting diverse demands, including superior electrical conductivity, enhanced thermal properties, and high strength [1,2]. Copper is one of the most widely used electronic and energy materials. Although copper is a fairly noble metal, it can be highly susceptible to severe corrosion, particularly in the presence of aggressive ions such as chloride, which significantly restricts its use [3]. To solve the problem, various strategies have been explored to safeguard copper from corrosion, among which surface coating has emerged as a cost-effective one. These coating technologies have been widely used in industrial applications because of their exceptional characteristics, such as resistance to degradation, wear, corrosion, and hardness [4,5]. Incorporating polymeric coatings emerges as an efficient approach for protecting metals against corrosive environments. Many studies have used natural and synthetic polymers instead of toxic inorganic and organic corrosion coatings, thereby providing an effective protection against metal corrosion.
Recently, thermoplastic elastomers (TPEs) have gained substantial commercial significance owing to their exceptional chemical resistance and desirable physical properties equivalent to vulcanized rubbers [6]. Polystyrene-block-poly (ethylene-ran-butylene)-block-polystyrene) (SEBS) is a triblock styrene copolymer. It is an extensively used thermoplastic elastomer [7]. SEBS is characterized by its elasticity, versatility in processing, thermo-plasticity, thermo-oxidative stability, ultraviolet resistance, high service temperature, good low-temperature properties design, recyclability, and lower manufacturing cost. These various SEBS characteristics are exploited in several areas such as conductive adhesives, electromagnetic shielding materials, and anti-corrosive coatings [8,9,10].
In our previous study, the SEBS was successfully deposited on the copper surface with a defined immersion protocol [6]. The protective effect of SEBS coated on copper corrosion in a 3 wt% NaCl solution as well as the effect of SEBS ratio on the corrosion resistance was investigated using electrochemical methods. The potentiodynamic polarization and electrochemical impedance spectroscopy analyses demonstrated that the application of SEBS copolymer coatings effectively suppresses the corrosion current density, enhances the charge transfer resistance, and efficiently inhibits copper corrosion. Our previous study solely focused on investigating the influence of the SEBS ratio on the electrochemical behavior of SEBS-coated copper (Cu-SEBS). Additionally, it is worth mentioning that the immersion protocol can depend on other factors. Experimental design should be carried out to determine the variables that significantly influence the CR of Cu-SEBS.
In this study, the RSM was employed as an optimization method while the Statgraphics software was used to treat experimental design data. RSM encompasses a range of mathematical and statistical techniques that are highly valuable for formulating experiments, developing models, and assessing the impact of multiple independent variables [11]. The notable advantage of this approach lies not only in enhancing reproducibility and quality but also in reducing costs, minimizing the number of required experiments, and accounting for interactions among variables. Furthermore, RSM proves highly effective in optimizing operating parameters within multivariable systems [12,13]. In recent times, the chemo-metric approach has emerged as a powerful tool for studying the corrosion and protection process. Many studies have utilized experimental design methodologies to examine the processes of metal corrosion and corrosion inhibition [14,15,16]. RSM stands as an efficient approach for the approximation and optimization of stochastic models [17]. Notable RSM designs used in optimization processes include Doehlert Design (DD), Central Composite Design (CCD), and Box–Behnken Design (BBD). The BBD demonstrates a greater efficiency of 11.5% compared to CCD, requiring fewer experimental runs. The advantages of RSM include reduced effort, cost, and time through a smaller number of experiments while providing comprehensive information necessary for designing processes of interest [17]. For instance, when monitoring four variables at four different levels, BBD requires only 29 experimental runs, including five center points, compared to the 256 experimental runs needed for a full four-level factorial design.
Considering the above-mentioned aspects, the key objectives of our research are as follows:
(i)
Highlighting the use of experimental design and RSM to assess the impacts of the basic operating parameters (SEBS ratio, immersion 1, and immersion 2) in the treatment process of the SEBS-coated copper (Cu-SEBS) on the response factor (CR);
(ii)
Determining, modeling, and optimizing the operating conditions for producing SEBS coating on the copper with the lowest value of corrosion rate;
(iii)
Verifying the model built by experimental design and RSM by employing these optimal operating parameters to explore the corrosion behavior of the SEBS-coated copper at optimal conditions (Cu-SEBS-Opt-Cond) in a 3 wt% NaCl solution.

2. Experimental

2.1. Pre-Treatment of Copper Electrodes

The copper specimens used had the wt (%) elemental composition as follows: Zn-0.01, Pb-0.015, Sn-0.007, P-0.001, Fe-0.01, Ni-0.015, Co-0.03, Al-0.002, and Cu-99.9. The exposed surface area of the copper electrodes, in contact with the electrolyte, was 1 cm2. Surface pre-treatment of the samples involved a meticulous process of polishing, utilizing successive grades of SiC paper ranging from 240 to 1000 grit. Subsequently, the copper electrodes underwent a thorough cleansing procedure with ultra-pure water, followed by a meticulous drying process.

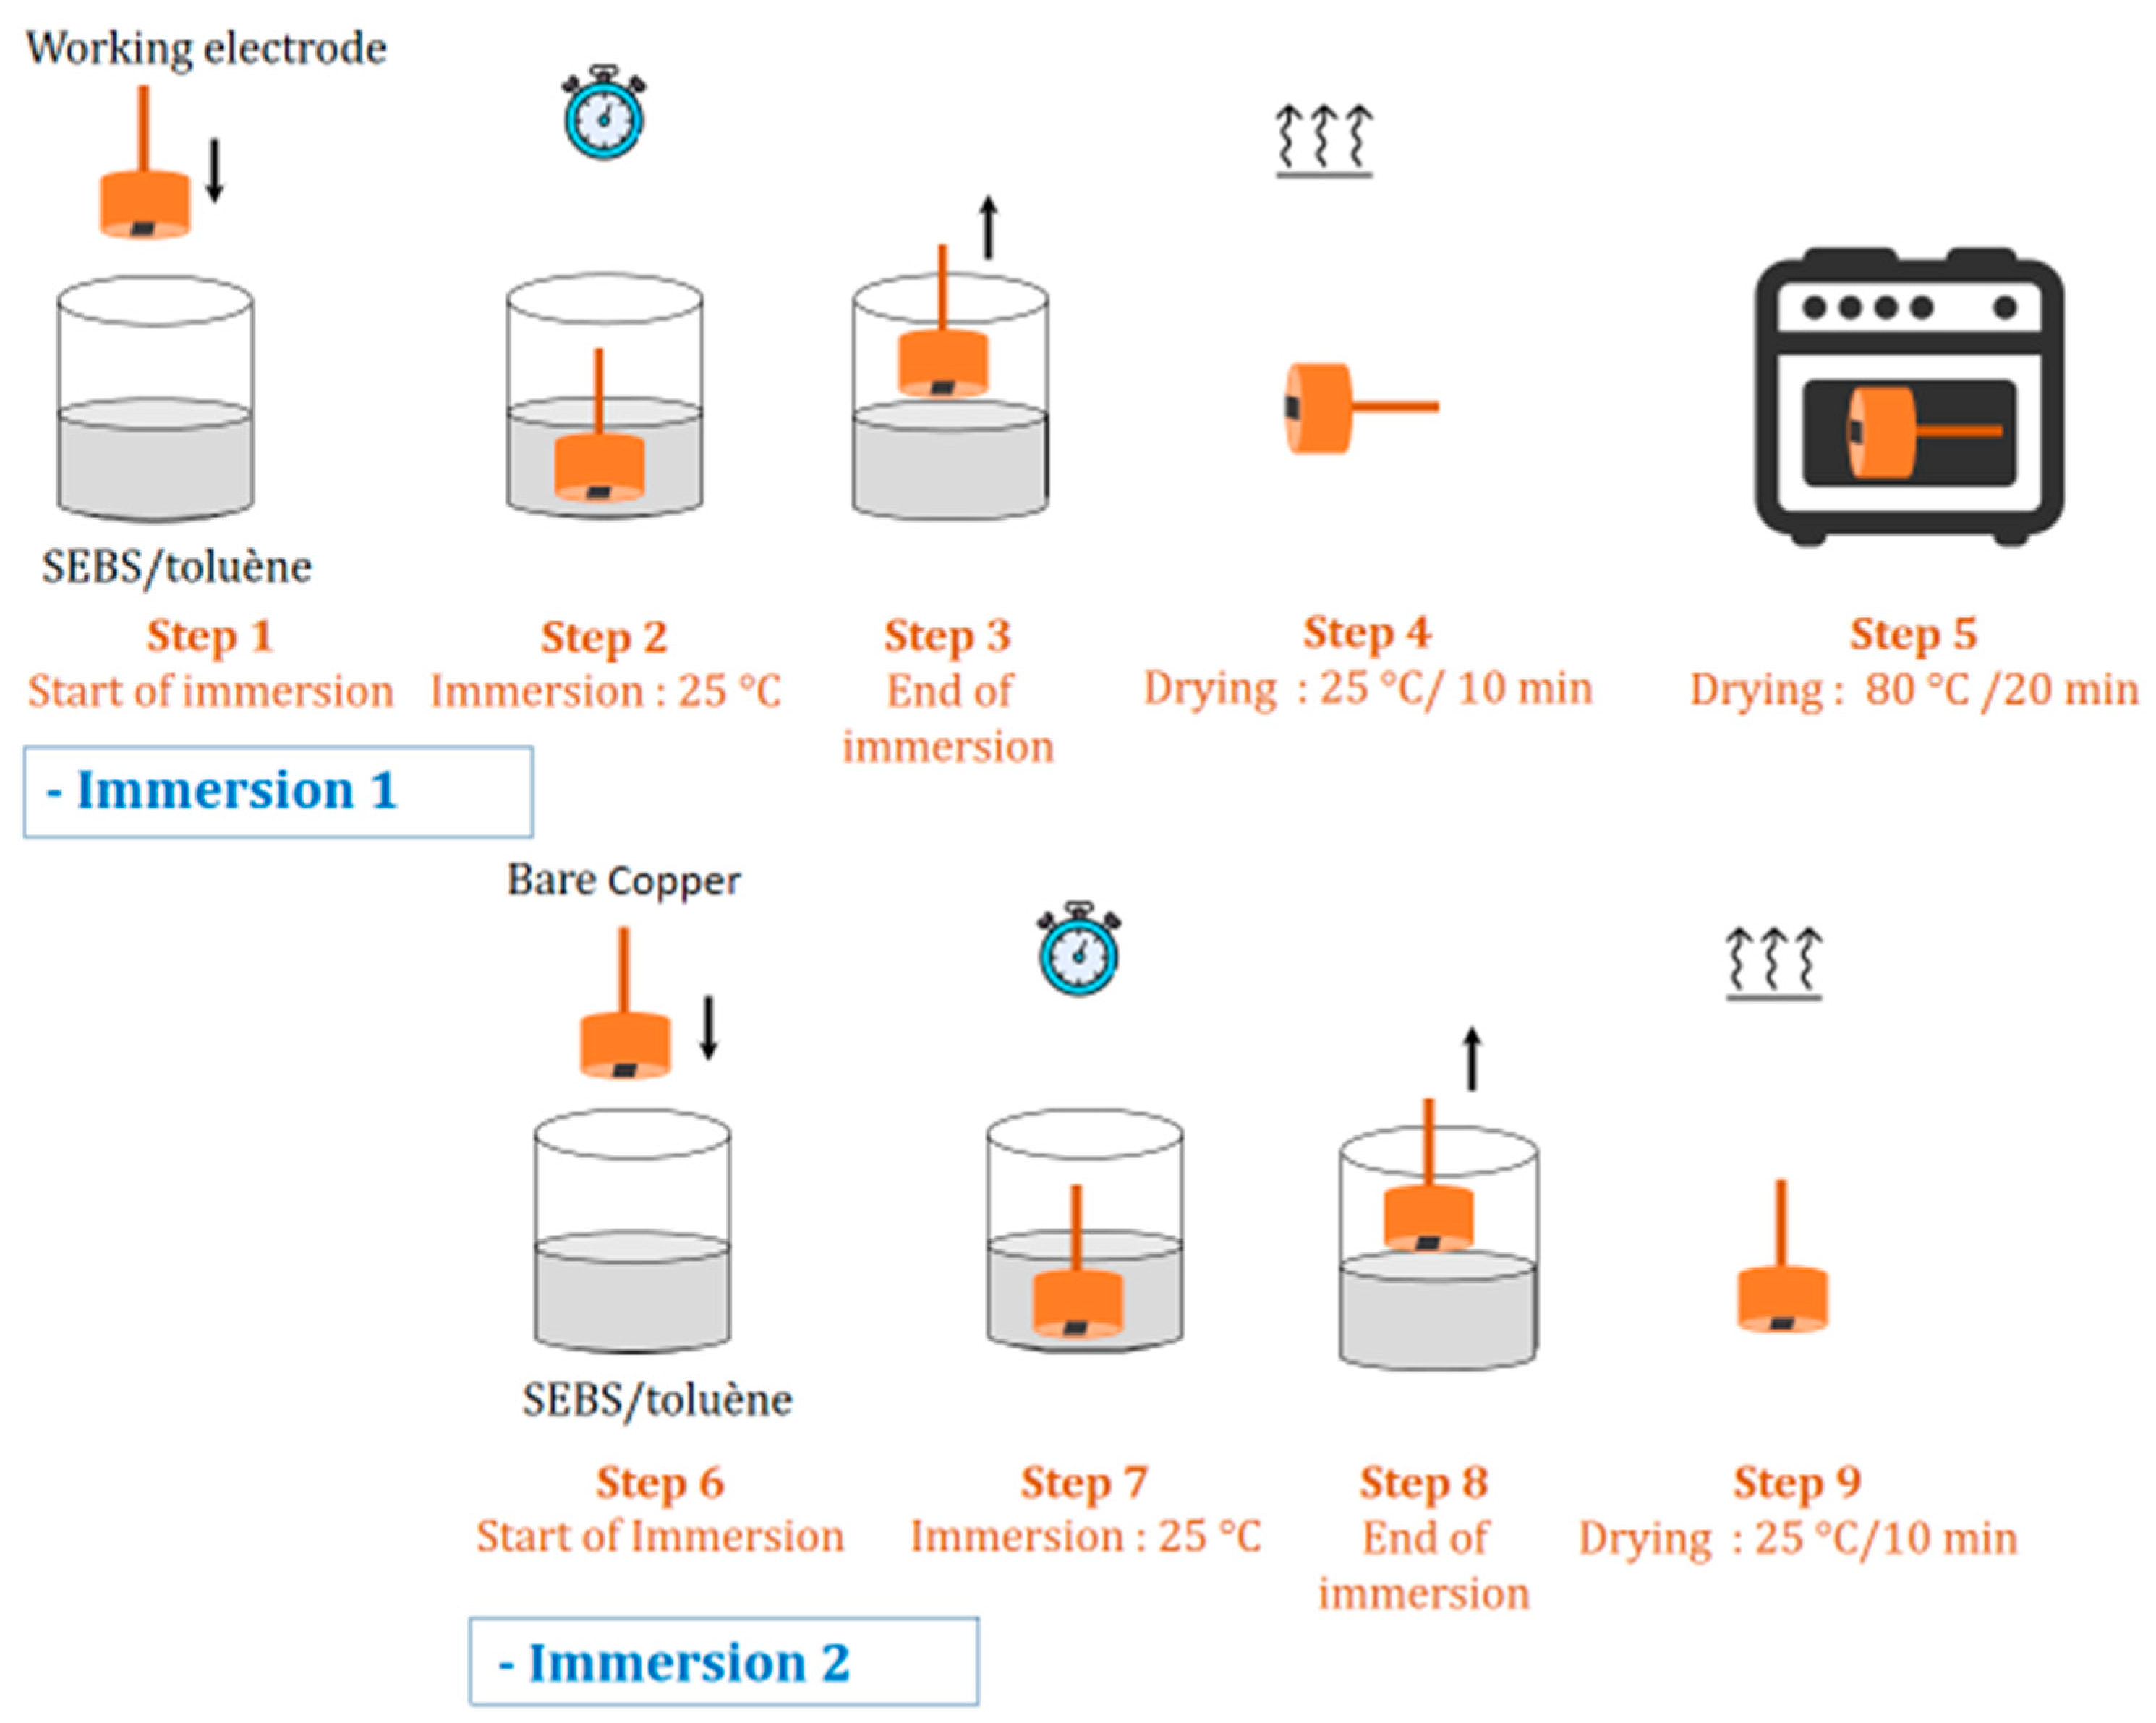
2.2. Preparation of SEBS-Coated Copper Electrodes

The thermoplastic elastomer was a commercial-grade block copolymer, known as SEBS, which was provided by Kraton S.A. (Sfax, Tunisia). All samples were utilized without making any modifications. SEBS solution was prepared by dissolving different SEBS ratios in a toluene solvent (SMSbio, Mednine, Tunisia). Then, the mixture was stirred for 60 min at room temperature (about 25 °C). To create Cu-SEBS coatings, an immersion process was implemented. The immersion protocol is considered an ideal method, which shows advantages such as simplicity and suitability for the treatment of irregular surfaces. Moreover, immersion protocol is not only economical but also useful for creating a protective layer on the metal surface, which is required in some special applications. The immersion process consists of the pre-treated specimens’ immersion in SEBS solution for a specified duration: immersion 1. After this, the obtained coatings were initially dried at 25 °C for 10 min and later for 20 min in an oven at 80 °C. In the next stage, the pre-treated specimens were re-immersed in the SEBS solution for a different duration referred to as immersion 2. Finally, the coatings obtained were dried at 25 °C for 10 min. The schematic illustration of the fabrication process for Cu-SEBS is shown in Figure 1.
This experimental procedure was systematically repeated for each electrochemical corrosion test.

2.3. Experimental Design

In this research, the optimization of three independent variables was undertaken by employing the Response Surface Methodology (RSM) technique known as Box–Behnken Design (BBD). The objective was to determine the optimal conditions for the immersion protocol that would yield the minimum corrosion rate of the Cu-SEBS electrodes, while minimizing the number of experimental runs and investigating the interactions among the independent variables. The independent variables considered in this analysis included the SEBS ratio (in % mass relative to the total mass of the SEBS-Toluene solution), immersion 1 (min), and immersion 2 (min). The corrosion rate (CR) of Cu-SEBS in an aqueous NaCl environment served as the response factor. The independent variables and their respective ranges are provided in Table 1.
Equation (1) allows us to obtain the number of experiments (N) required for BBD:
N = 2k (k − 1) + Cp
where k and Cp represent the number of factors and replicate the number of central points, respectively. A total of 15 experiments were conducted, with three independent factors, each at three different levels, to investigate the effects of these factors on the corrosion rate (CR).
To ascertain the coefficients within the response model, the measured data were fitted to a second-order polynomial equation. This equation, denoted as Equation (2), encompasses all the linear, quadratic, and interaction terms:
Y = β 0 + i = 1 n β i χ i + i = 1 n β i i χ i 2 + i = 1 n 1 j = 2 j > 1 n β i j χ i χ j + ε
Y represents the predicted response. β0, βi, βii, and βij are constant, linear, quadratic, and interaction coefficients, respectively, of the model. Xi and Xj are the coded independent factors. ε represents the error of the model.
In this study, the Statgraphics software XVIII was used to analyze the data and calculate the predicted responses of experimental design.
The model’s validity was established through the application of an analysis of variance (ANOVA).

2.4. Electrochemical Studies

Electrochemical analysis of Cu-SEBS was conducted at room temperature by using a Potentiostat/Galvanostat radiometer controlled by corrosion analysis software (Voltamaster 4). An electrochemical cell was built with a saturated calomel electrode (SCE: XR110, Radiometer-Analytical) as the reference electrode, a platinum bar as the auxiliary electrode, copper as the working electrode. The corrosive medium, a 3 wt% sodium chloride (NaCl) solution, was prepared using an annular-grade reagent of anhydrous NaCl (99%, Sud Medical, Tunisia) and distilled H2O water.

2.4.1. Potentiodynamic Polarization Studies

The potentiodynamic polarization measurements were carried out in the potential range from −400 to +600 mV with a scanning rate of 0.5 mV s−1.

2.4.2. Voltammetry around OCP (ΔE = ±50 mV)

The voltammetry around the open circuit potential (OCP) measurements was per-formed within a limited potential range to minimize metal surface perturbations. The ex-perimental function used to mathematically model the polarization curve j vs. E is given by Equation (3):
j = j a + j c = j c o r r [ e β a E E c o r r e β c E E c o r r ]
where βa and βc are the anodic and the cathodic Tafel coefficient.
The potential moved from the OCP to OCP + 50 mV, then down to OCP − 50 mV and back to OCP, at a scan rate equal to 0.5 mV s−1. The data of the voltammetry around OCP measurements were fitted to the Tafel equation, using EC-Lab V10.32 software (Bio-Logic) to estimate the corrosion current density (jcorr), and corrosion rate (CR).

2.4.3. Electrochemical Impedance Studies

Impedance studies were carried out on bare copper and Cu-SEBS electrodes immersed in an aqueous NaCl solution. The electrode potential was stabilized after 30 min. The impedance spectra were recorded in the frequency range of 100 kHz to 5 mHz with a sinusoidal wave excitation of 10 mV amplitude. The obtained impedance data were analyzed by fitting them to appropriate electrical equivalent circuits using EC-Lab software.

3. Results and Discussion

3.1. Statistical Treatment of Data

The response factor is CR of Cu-SEBS in an aqueous NaCl environment, obtained from voltammetry around OCP (ΔE = ±50 mV vs. SCE). In order to stabilize the OCP, the electrodes were immersed in the solution for half an hour prior to every experiment. As it is mentioned in Figure 2, the examples of comparison between the experimental polarization curve and Tafel simulated curve with EC-Lab software for experiment 1 (−1,−1,0), experiment 2 (1,−1,0), and experiment 13 (0,0,0) were obtained after a 30-min exposure in a 3 wt% NaCl aqueous solution.
The obtained CR values (responses) from the experiments suggested by the Box–Behnken design were fitted to linear, interactive, and quadratic models in order to find the regression equations. The quadratic model was selected because it has a low standard deviation (0.07), high values of R2 (0.9461), and adjusted R2 (0.8491). The multi-regression analysis of experimental data allowed us to find the empirical relationship between the CR and independent variables which can be calculated by the second-order polynomial expression in terms of paramount actual factors as is shown:
CR = 0.24135 − 0.11008 A − 0.00222 B − 0.00718 C + 0.01412 A2 + 0.00068AB+ 0.00112AC − 0.000024 A2 + 0.000055 BC + 0.000073 C2
where A is the SEBS ratio; B is the immersion 1; C is the immersion 2; A2 is the quadratic effect of SEBS ratio; C2 is the quadratic effect of immersion 2; AB is the interaction between SEBS and immersion 1; AC is the interaction between SEBS and immersion 2.
The adjusted R2 is 0.9461—within the acceptable limits of R2 ≥ 0.80—revealing an excellent fitting of the experimental data with the second-order polynomial equation.
The impact of the immersion protocol factors on CR is shown in Figure 3. The Pareto chart presents an ANOVA-based analysis of values for operational parameters and their respective combinations, illustrating their individual impacts ranked from the most to the least significant at 5%. The vertical line points to this statistical level.
Figure 3a illustrates the significant impact of three parameters on the corrosion rate (CR). The SEBS ratio (A), immersion 1 (B), and immersion 2 (C) exhibit negative effects. It means the higher these parameters are, the lower the CR is. The positive values of the quadratic effect of SEBS ratio (A2) reflects a CR evolution but at a minimal level. In fact, it should be pointed out that the interaction between SEBS and immersion 2 (AC) and the quadratic effect of immersion 2 (C2) are not beneficial for reducing the CR.
The experimental design findings depicted in Figure 3b reveal the individual influences of each parameter, namely the SEBS ratio, immersion 1, and immersion 2, on the corrosion rate (CR). Notably, Figure 3b illustrates that an augmentation in the SEBS ratio corresponds to a reduction in CR. The same trends were noticed for the immersion 1 and the immersion 2 factors. However, the evolution of SEBS ratio factor is more remarkable (the slope SEBS ratio is more significant). These findings also suggest that achieving lower CR values requires a higher SEBS ratio and a longer immersion duration (immersion 2).

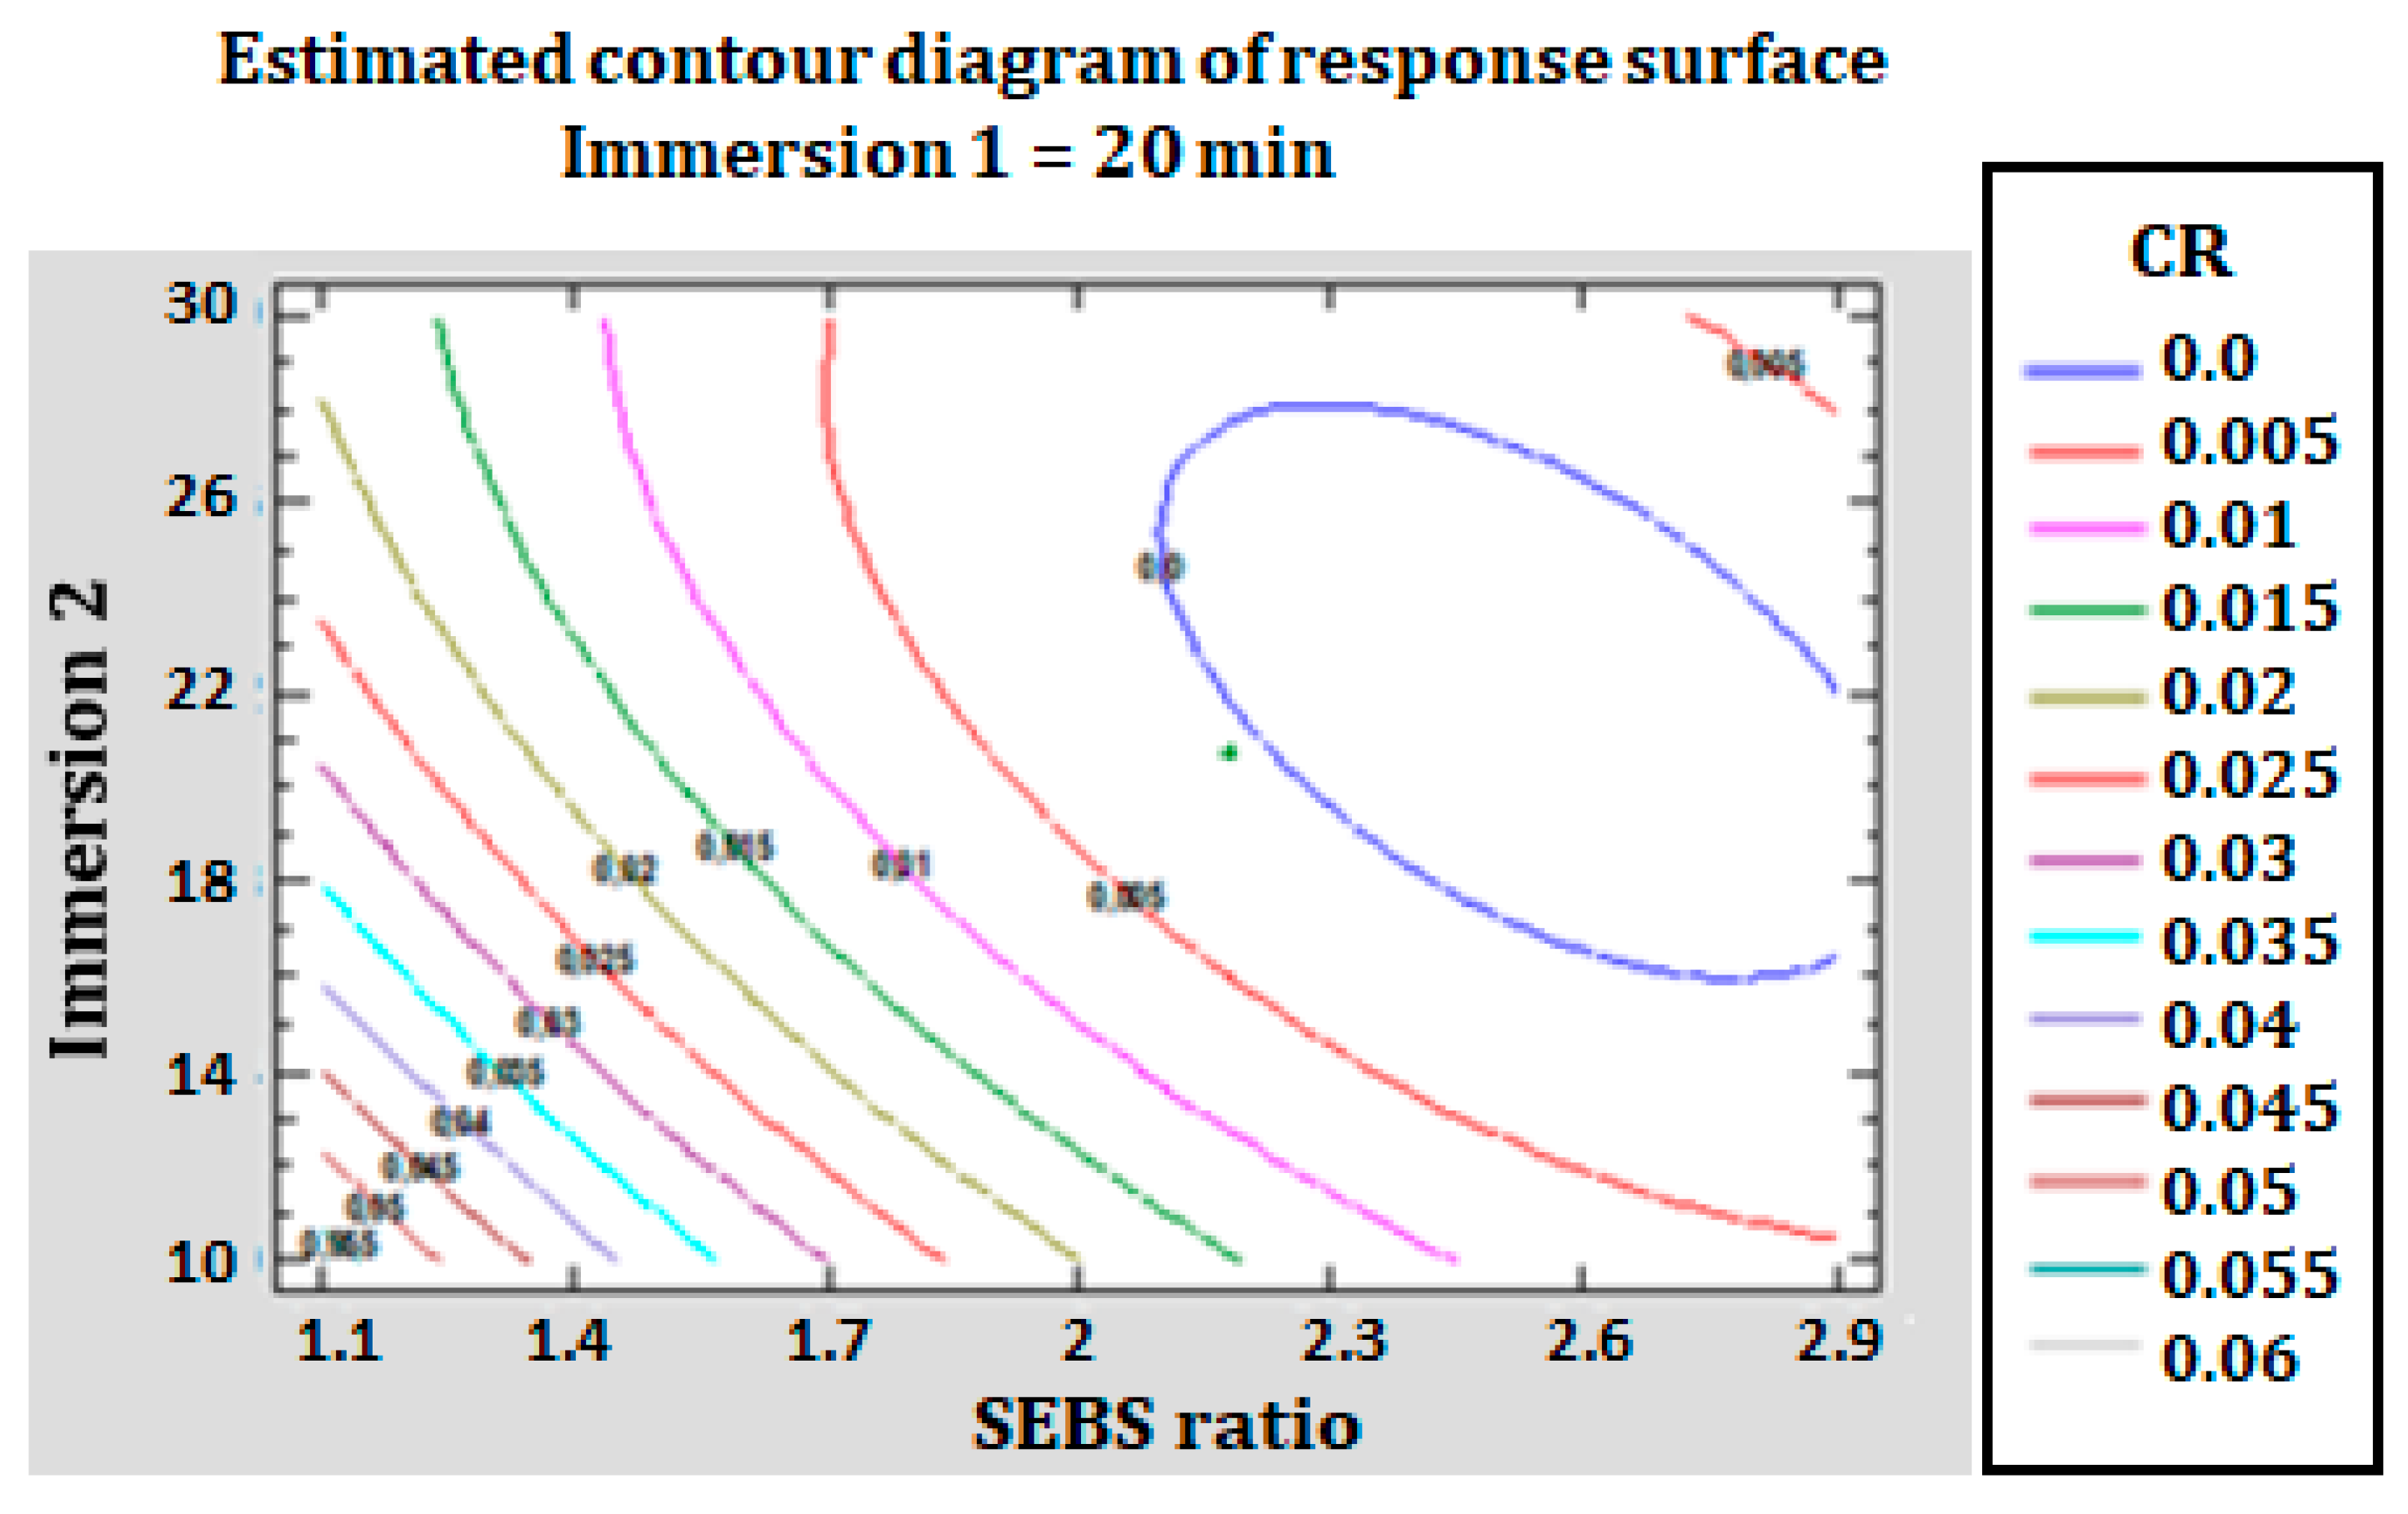
3.2. Response Surfaces for Corrosion Rate CR

The three-dimensional plots, as displayed in Figure 4, provide a graphical representation of the isolated effects of the process variables and their interactions with the corrosion rate (CR). These plots are constructed by charting the measured CR values against two factors while keeping the third factor at a constant level. These surfaces serve as a visual means that provides insights into the influence of each factor on CR.
As it is shown in Figure 4a, CR dropped sharply with A whatever the value of B is. Reciprocally, the same plot reveals that there is a considerable decline in CR with B if A is low, while it shows no significant change with B if A is high. Taking into consideration the influence of both A and C, Figure 4b shows that CR drops sharply with A if C is low while it decreases considerably with A until becoming constant if C is high. Reciprocally, the same plot reveals that CR falls significantly with C if A is low, and it shows considerable declines with C until minimum if A is high. Lastly, Figure 4c shows that CR declines when B and C values increase despite the relatively limited variations.
The shape of the response surface—whether more or less distorted—is an excellent indication showing the interactive effects between variables. Consequently, Figure 4b shows a strong interaction between the SEBS ratio and immersion 2 (AC). In contrast, Figure 4a,c show little interaction effects between the SEBS ratio and immersion 1 (AB) and immersion 1 and immersion 2 (BC), respectively, because the response surfaces of these figures do not have a twisted aspect too. Figure 5 plots the response surface model’s contour diagram as a function of SEBS ratio and immersion 2 with immersion 1 is constant at 20 min.
It has been demonstrated that lower corrosion rate (CR) values are achieved when the SEBS ratio exceeds 2%. These results indicate that a higher SEBS ratio is preferable for obtaining a reduced corrosion rate, while the immersion times 1 and 2 do not need to be prolonged.

3.3. Optimal Operating Conditions Experiment

After studying the impacts of independent variables on the response, the identification of optimum values of the operating parameters that would generate the minimum corrosion rate was sought. This was accomplished by solving the quadratic regression model and analyzing the response surface contour plots. The fit for this experimental design using Statgraphics software’s model enabled us to find the three optimal values of the operating parameters, SEBS ratio (A), immersion 1 (B), and immersion 2 (C) within the ranges investigated (Table 1). The optimum process conditions for A, B, and C were 2.17%, 20 min and 21 min, respectively. Under these conditions, the CR predicted by the model was 0.0001 mm/year. To confirm these results, the electrochemical behavior of the SEBS-coated copper under optimal conditions of immersion protocol (Cu-SEBS-Opt-Cond) exposed in a 3 wt% NaCl solution by using the techniques of potentiodynamic polarization and electrochemical impedance spectroscopy (EIS) was investigated.

3.4. Confirmation of the Results by Electrochemical Studies

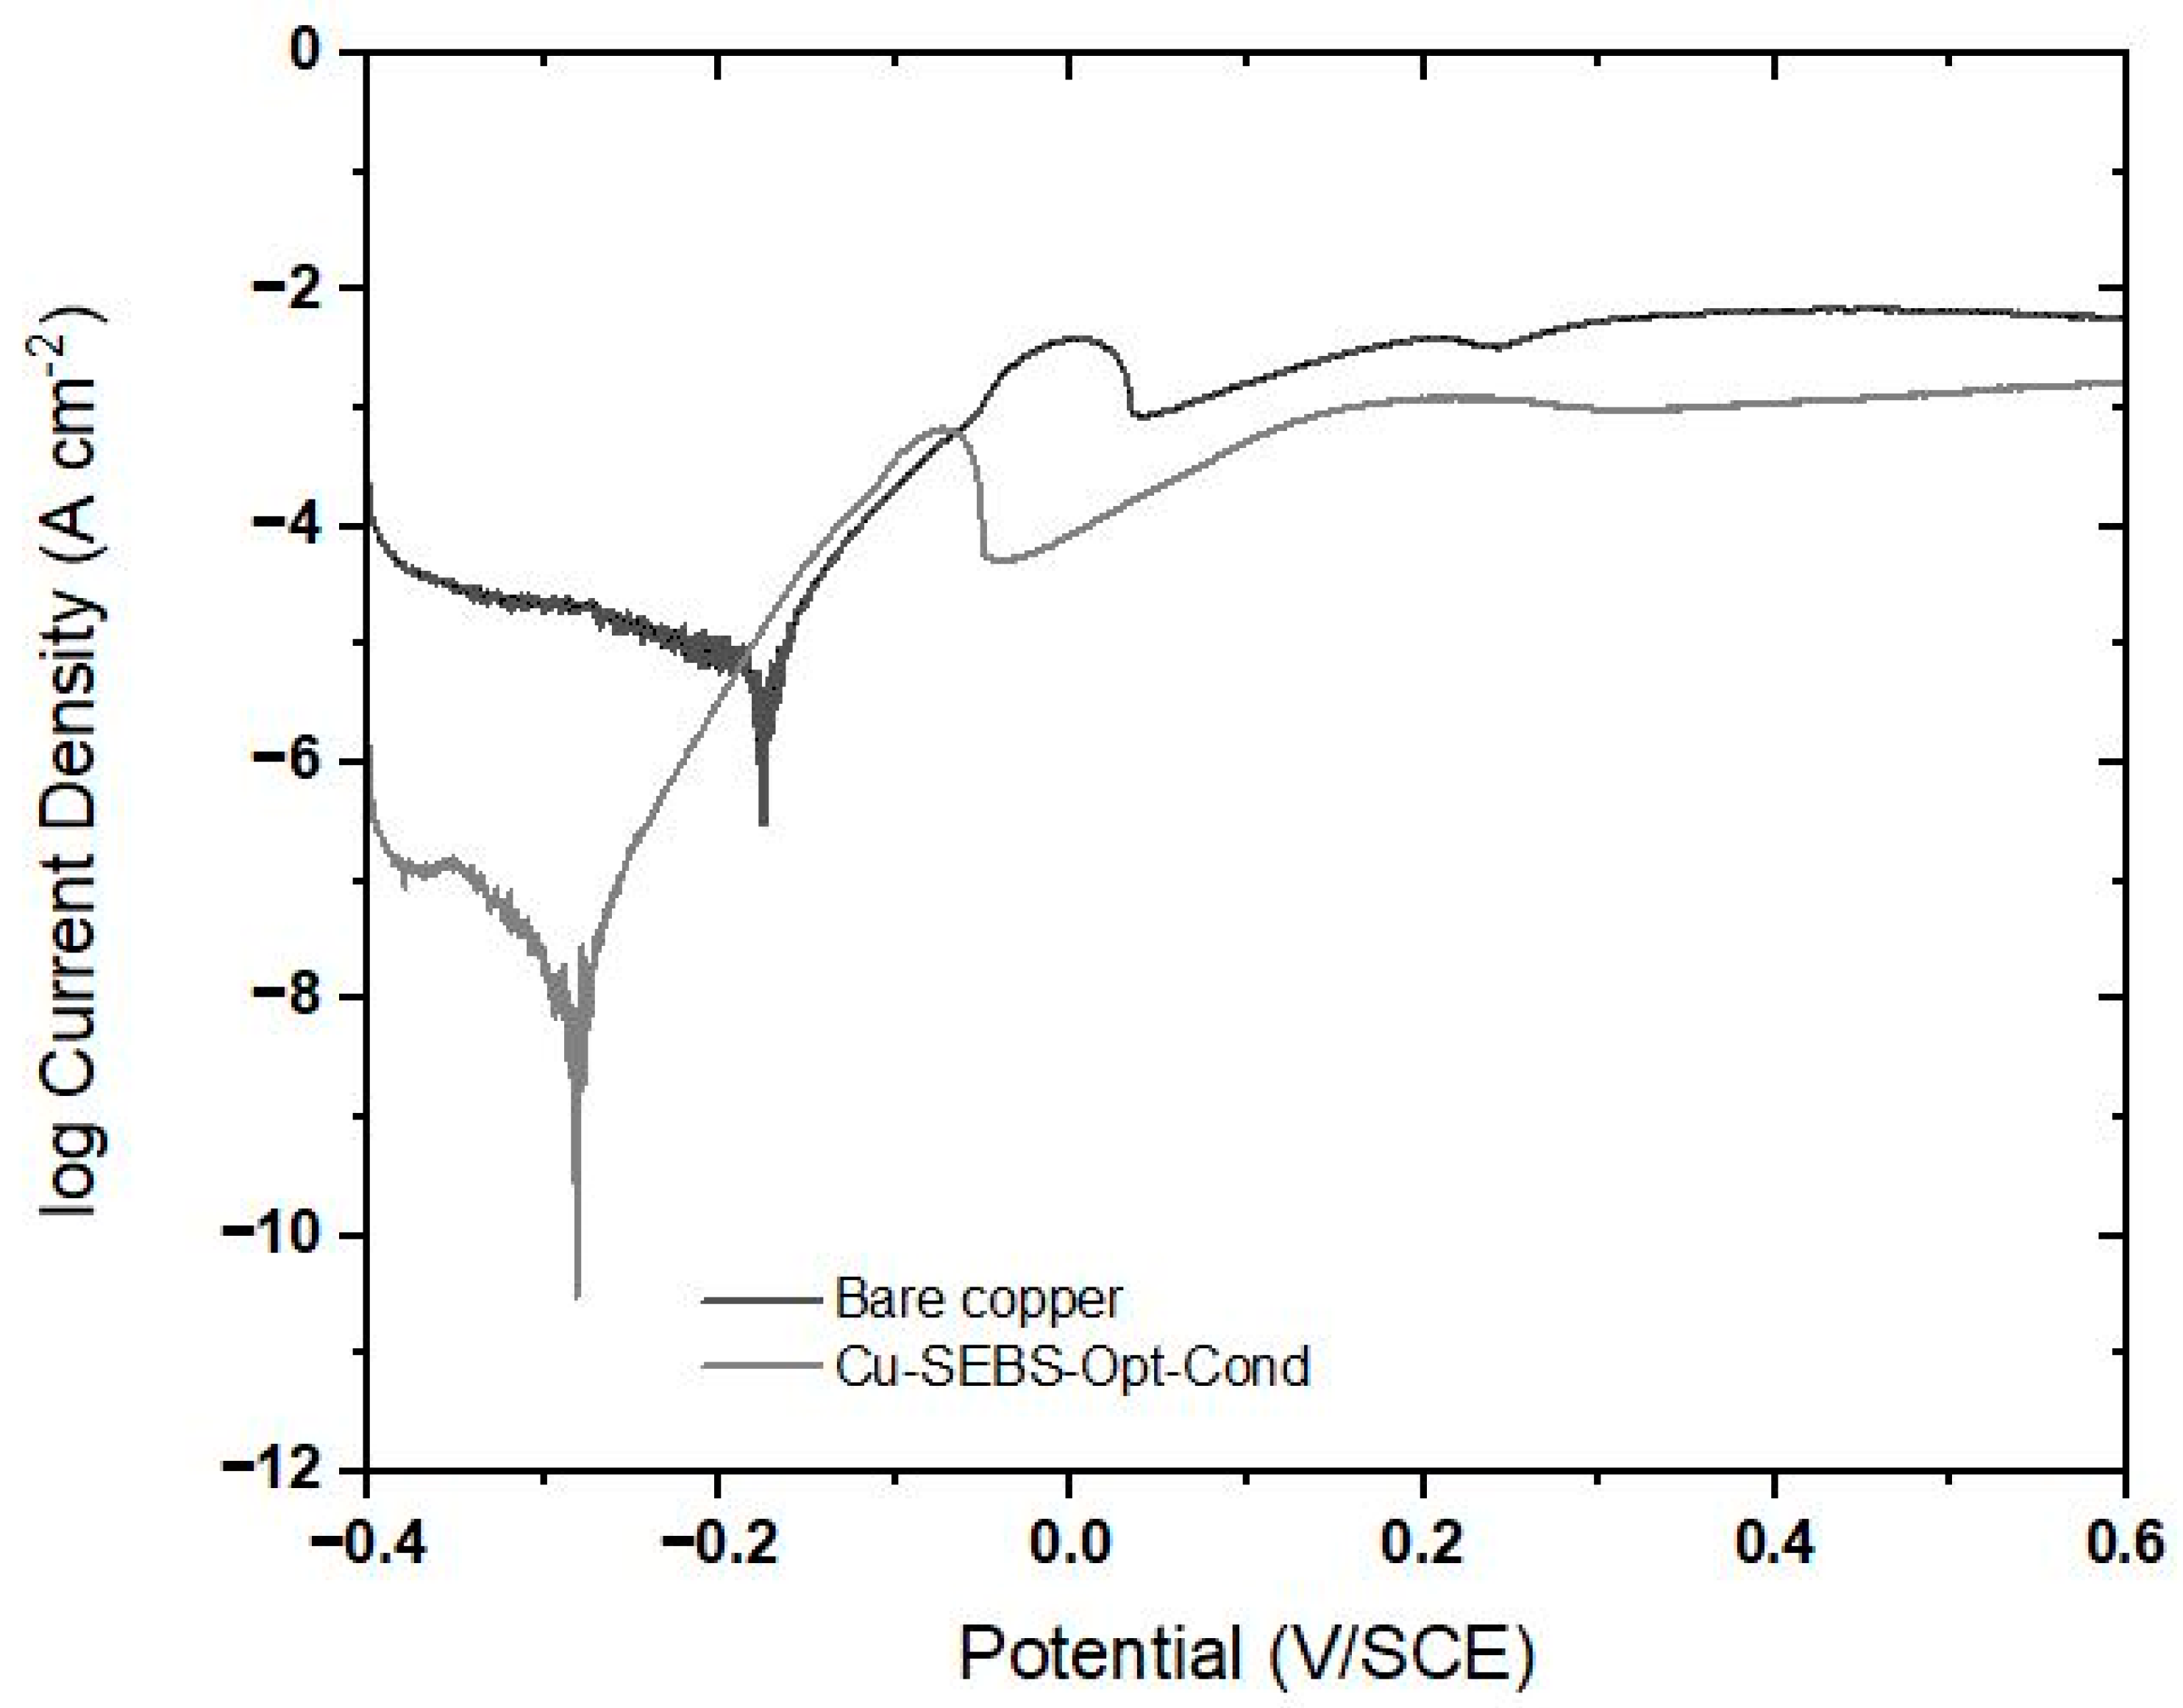
3.4.1. Potentiodynamic Polarization Studies

Potentiodynamic Polarization between −0.4 and +0.6 V vs. SCE

The potentiodynamic polarization curves for bare copper and SEBS-coated copper under the optimized operating conditions (Cu-SEBS-Opt-Cond) in a naturally aerated 3 wt% NaCl solution at 25 °C were listed in Figure 6.
As mentioned in our previous works, the bare copper has three chief regions of potential in the anodic part [6,18]. In fact, the first region is identified by the oxidation of copper Equation (4).
C u C u + + e
The second region emanates from the formation of an insoluble film of cuprous chloride CuCl(film) (Equation (5)).
C u + + C l C u C l ( f i l m )
The third region is characterized by the soluble cuprous complex C u C l 2 (Equation (6)).
C u C l + C l C u C l 2 ( s u r f a c e )
The oxygen reduction reaction is the major cathodic reaction that influences the corrosion processes (Equation (7)).
O 2 + 2 H 2 O + 4 e 4 O H
For the Cu-SEBS-Opt-Cond electrode, it is evident that presence of SEBS on the copper surface exerts a significant control over the cathodic O2 reduction processes, while there is no effect on the anodic metal dissolution. In fact, the anode branches of the two electrodes are very close. Additionally, the cathodic curve produces a roughly parallel line, indicating the cathodic mechanism (the oxygen reduction) does not change. Notably, the electric current density decreases from 1.584 × 10⁻⁴ A cm−2 for bare copper to 6.309 × 10⁻⁷ A cm−2 for Cu-SEBS-Opt-Cond. In addition, the corrosion potential (Ecorr) shifts towards the cathodic direction. These results are in accordance with our previous study’s finding that SEBS is a cathodic-type inhibitor [6].

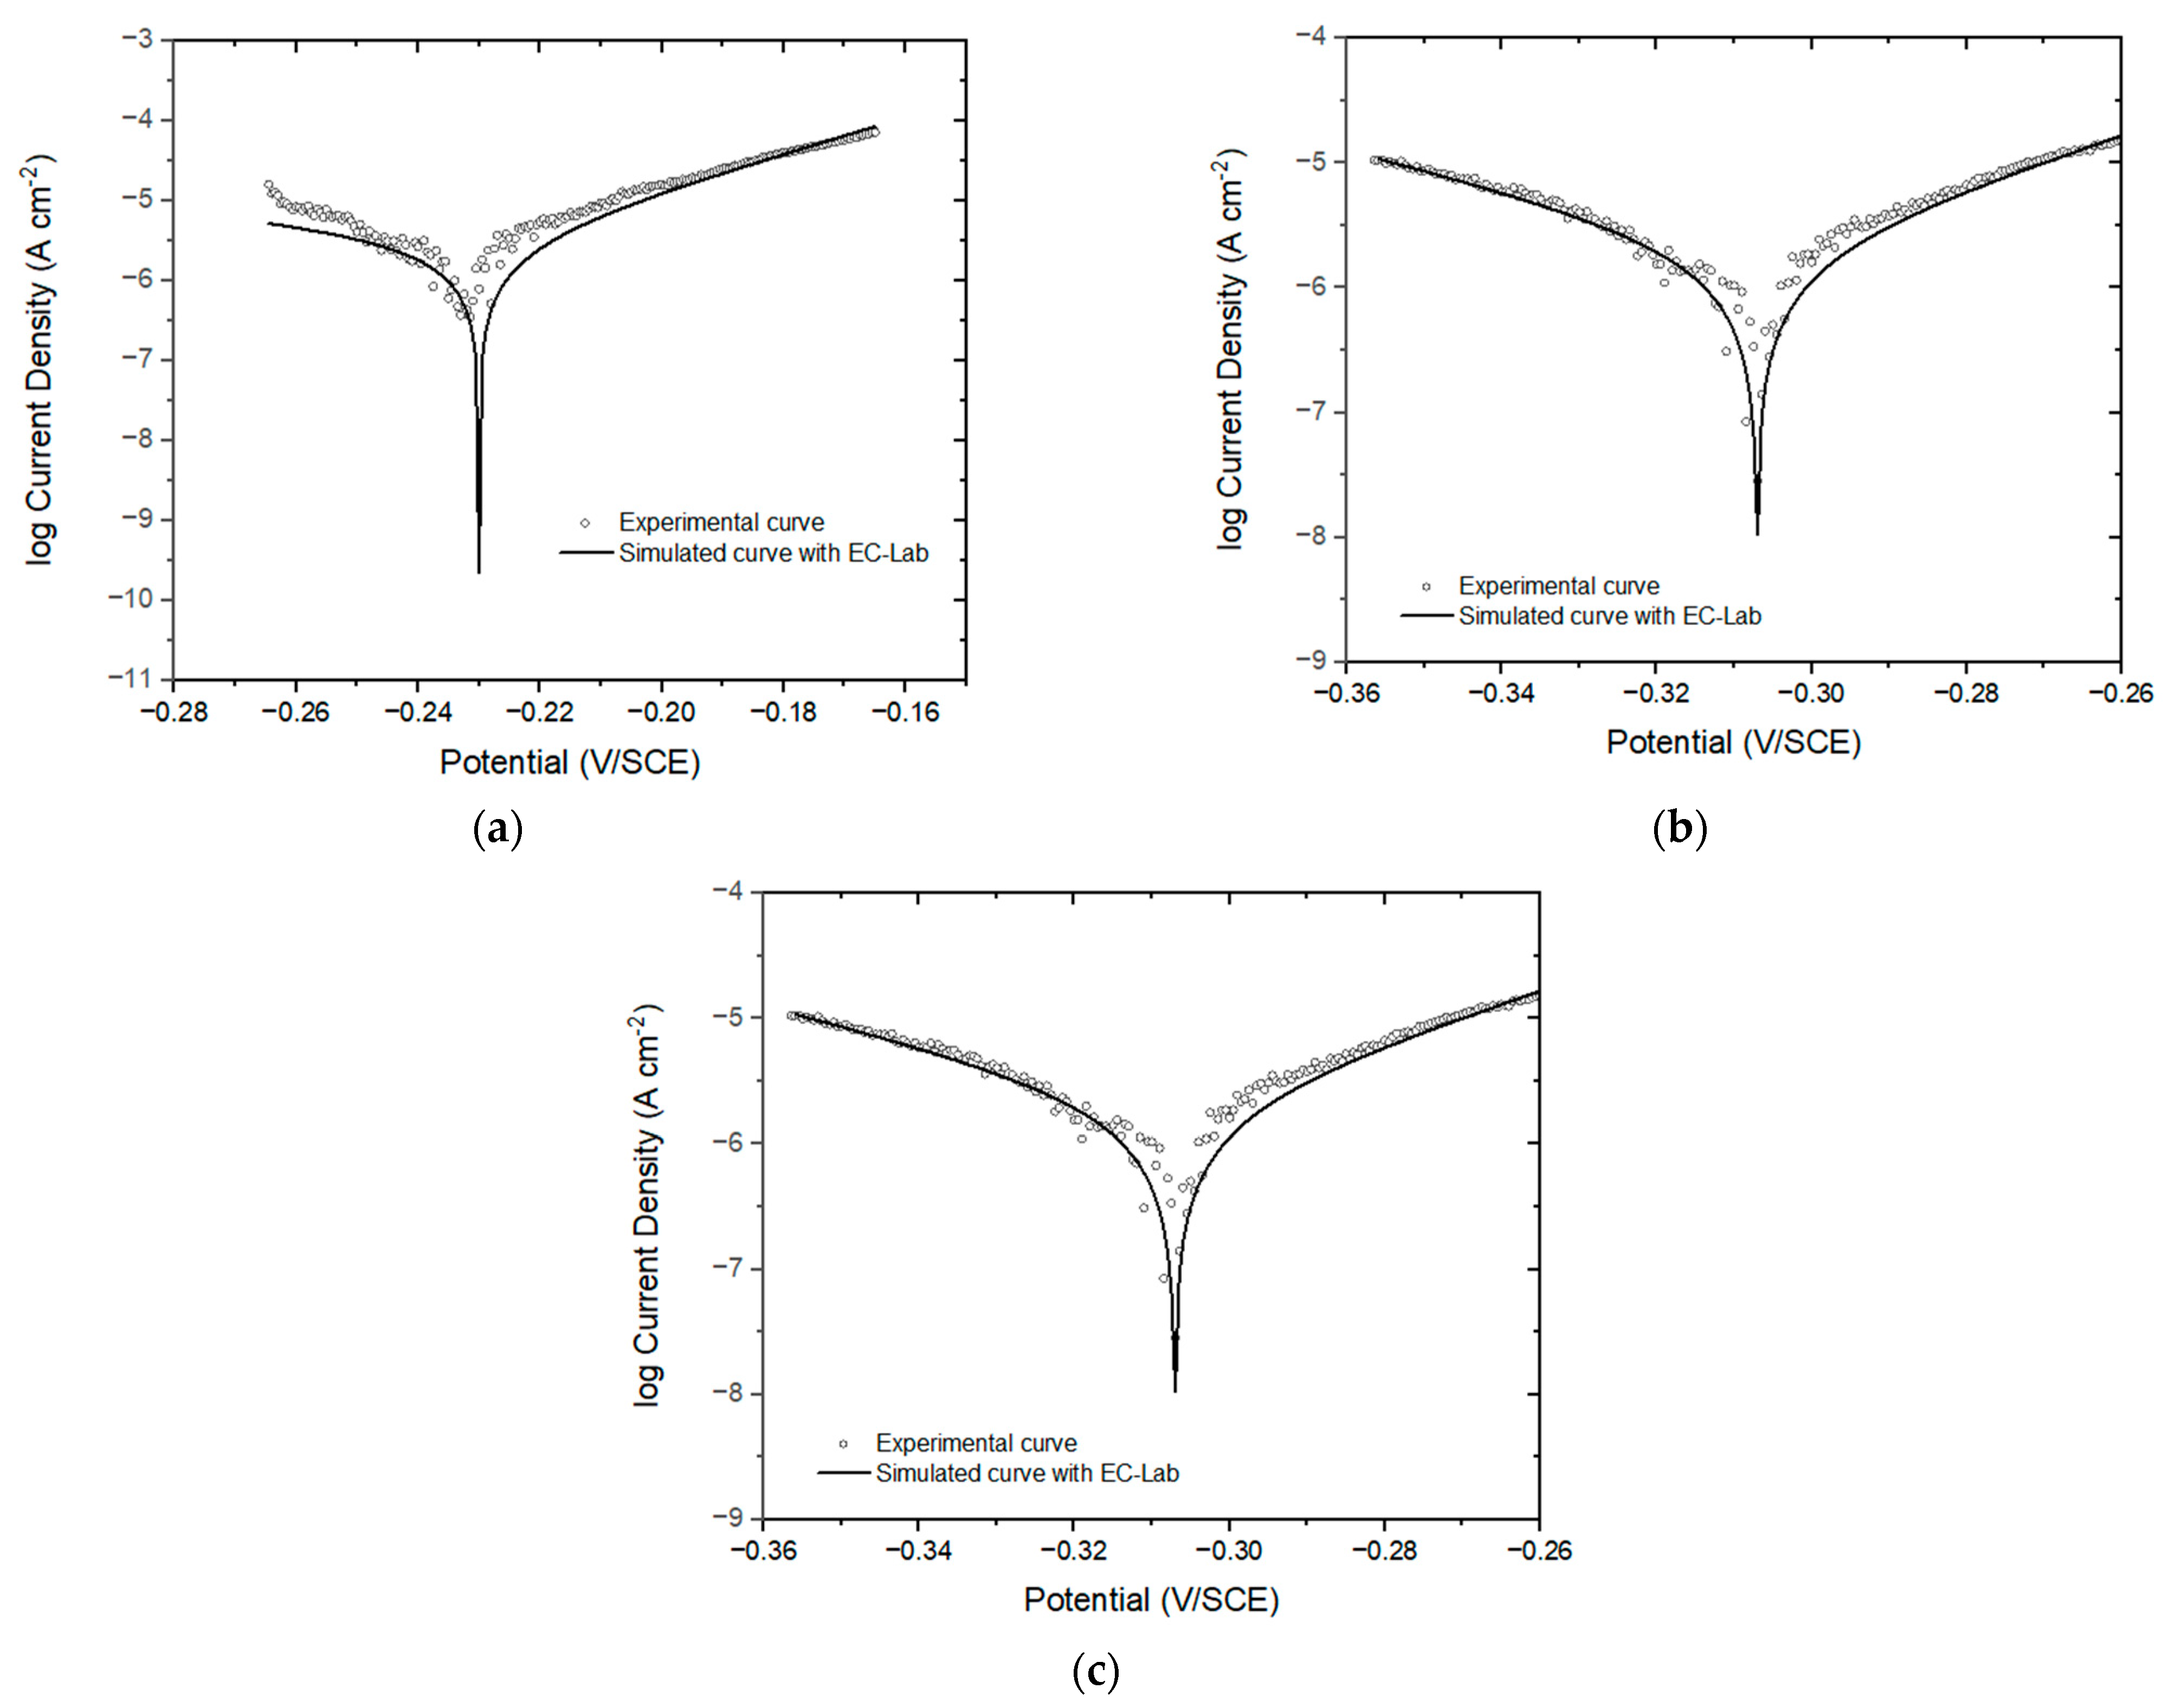
Voltammetry around OCP (ΔE = ±50 mV vs. SCE)

Figure 7 exhibits the results of voltammetry around OCP (ΔE = ±50 mV vs. SCE) of bare copper and Cu-SEBS-Opt-Cond obtained after 30-min immersion in a 3 wt% NaCl solution.
The electrochemical parameters extracted from this figure and simulated with EC-Lab software were listed in Table 2.
It is worth noting that the obtained curves for bare copper and Cu-SEBS-Opt-Cond electrodes exhibit similar shapes, indicating that they can be adequately described by an activation-controlled cathodic reaction (i.e., using Equation (3)). This explained the shape’s curve similar to these two electrodes [18].
The corrosion current density, jcorr, which is directly linked to the corrosion rate, demonstrates a significant decrease following the application of the SEBS coating under optimal conditions of the immersion protocol. jcorr for Cu-SEBS-Opt-Cond equal 0.015 μA cm−2 and CR equal 0.000174 mm year−1. This value closely aligns with the one obtained from the experimental design (0.0001 mm year−1).
Furthermore, the protective action of the SEBS coating is explained by the decline of jcorr. It can be quantified through the protection efficiency (η) and calculated according to the following Equation (8):
η = j c o r r 0 j c o r r j c o r 0 × 100
where j c o r r 0 and jcorr are the corrosion current densities of the bare copper and Cu-SEBS-Opt-Cond, respectively.
The Cu-SEBS-Opt-Cond’s protection efficiency (η) equals 99.7%. This value is high enough to prove the ability of SEBS which is formed on the copper surface to inhibit the corrosion of copper in chloride media. The beneficial effect of SEBS coating in the corrosion resistance is probably due to the following:
(i) The low porosity of the SEBS coating using the SEBS ‘s optimal concentration (2.17%);
(ii) The presence of the SEBS film formed on the copper surface;
(iii) The adsorption of SEBS on the copper surface. This combined effect may hamper the electrolyte penetration throughout the coating, thus providing higher corrosion protection [6,19,20].

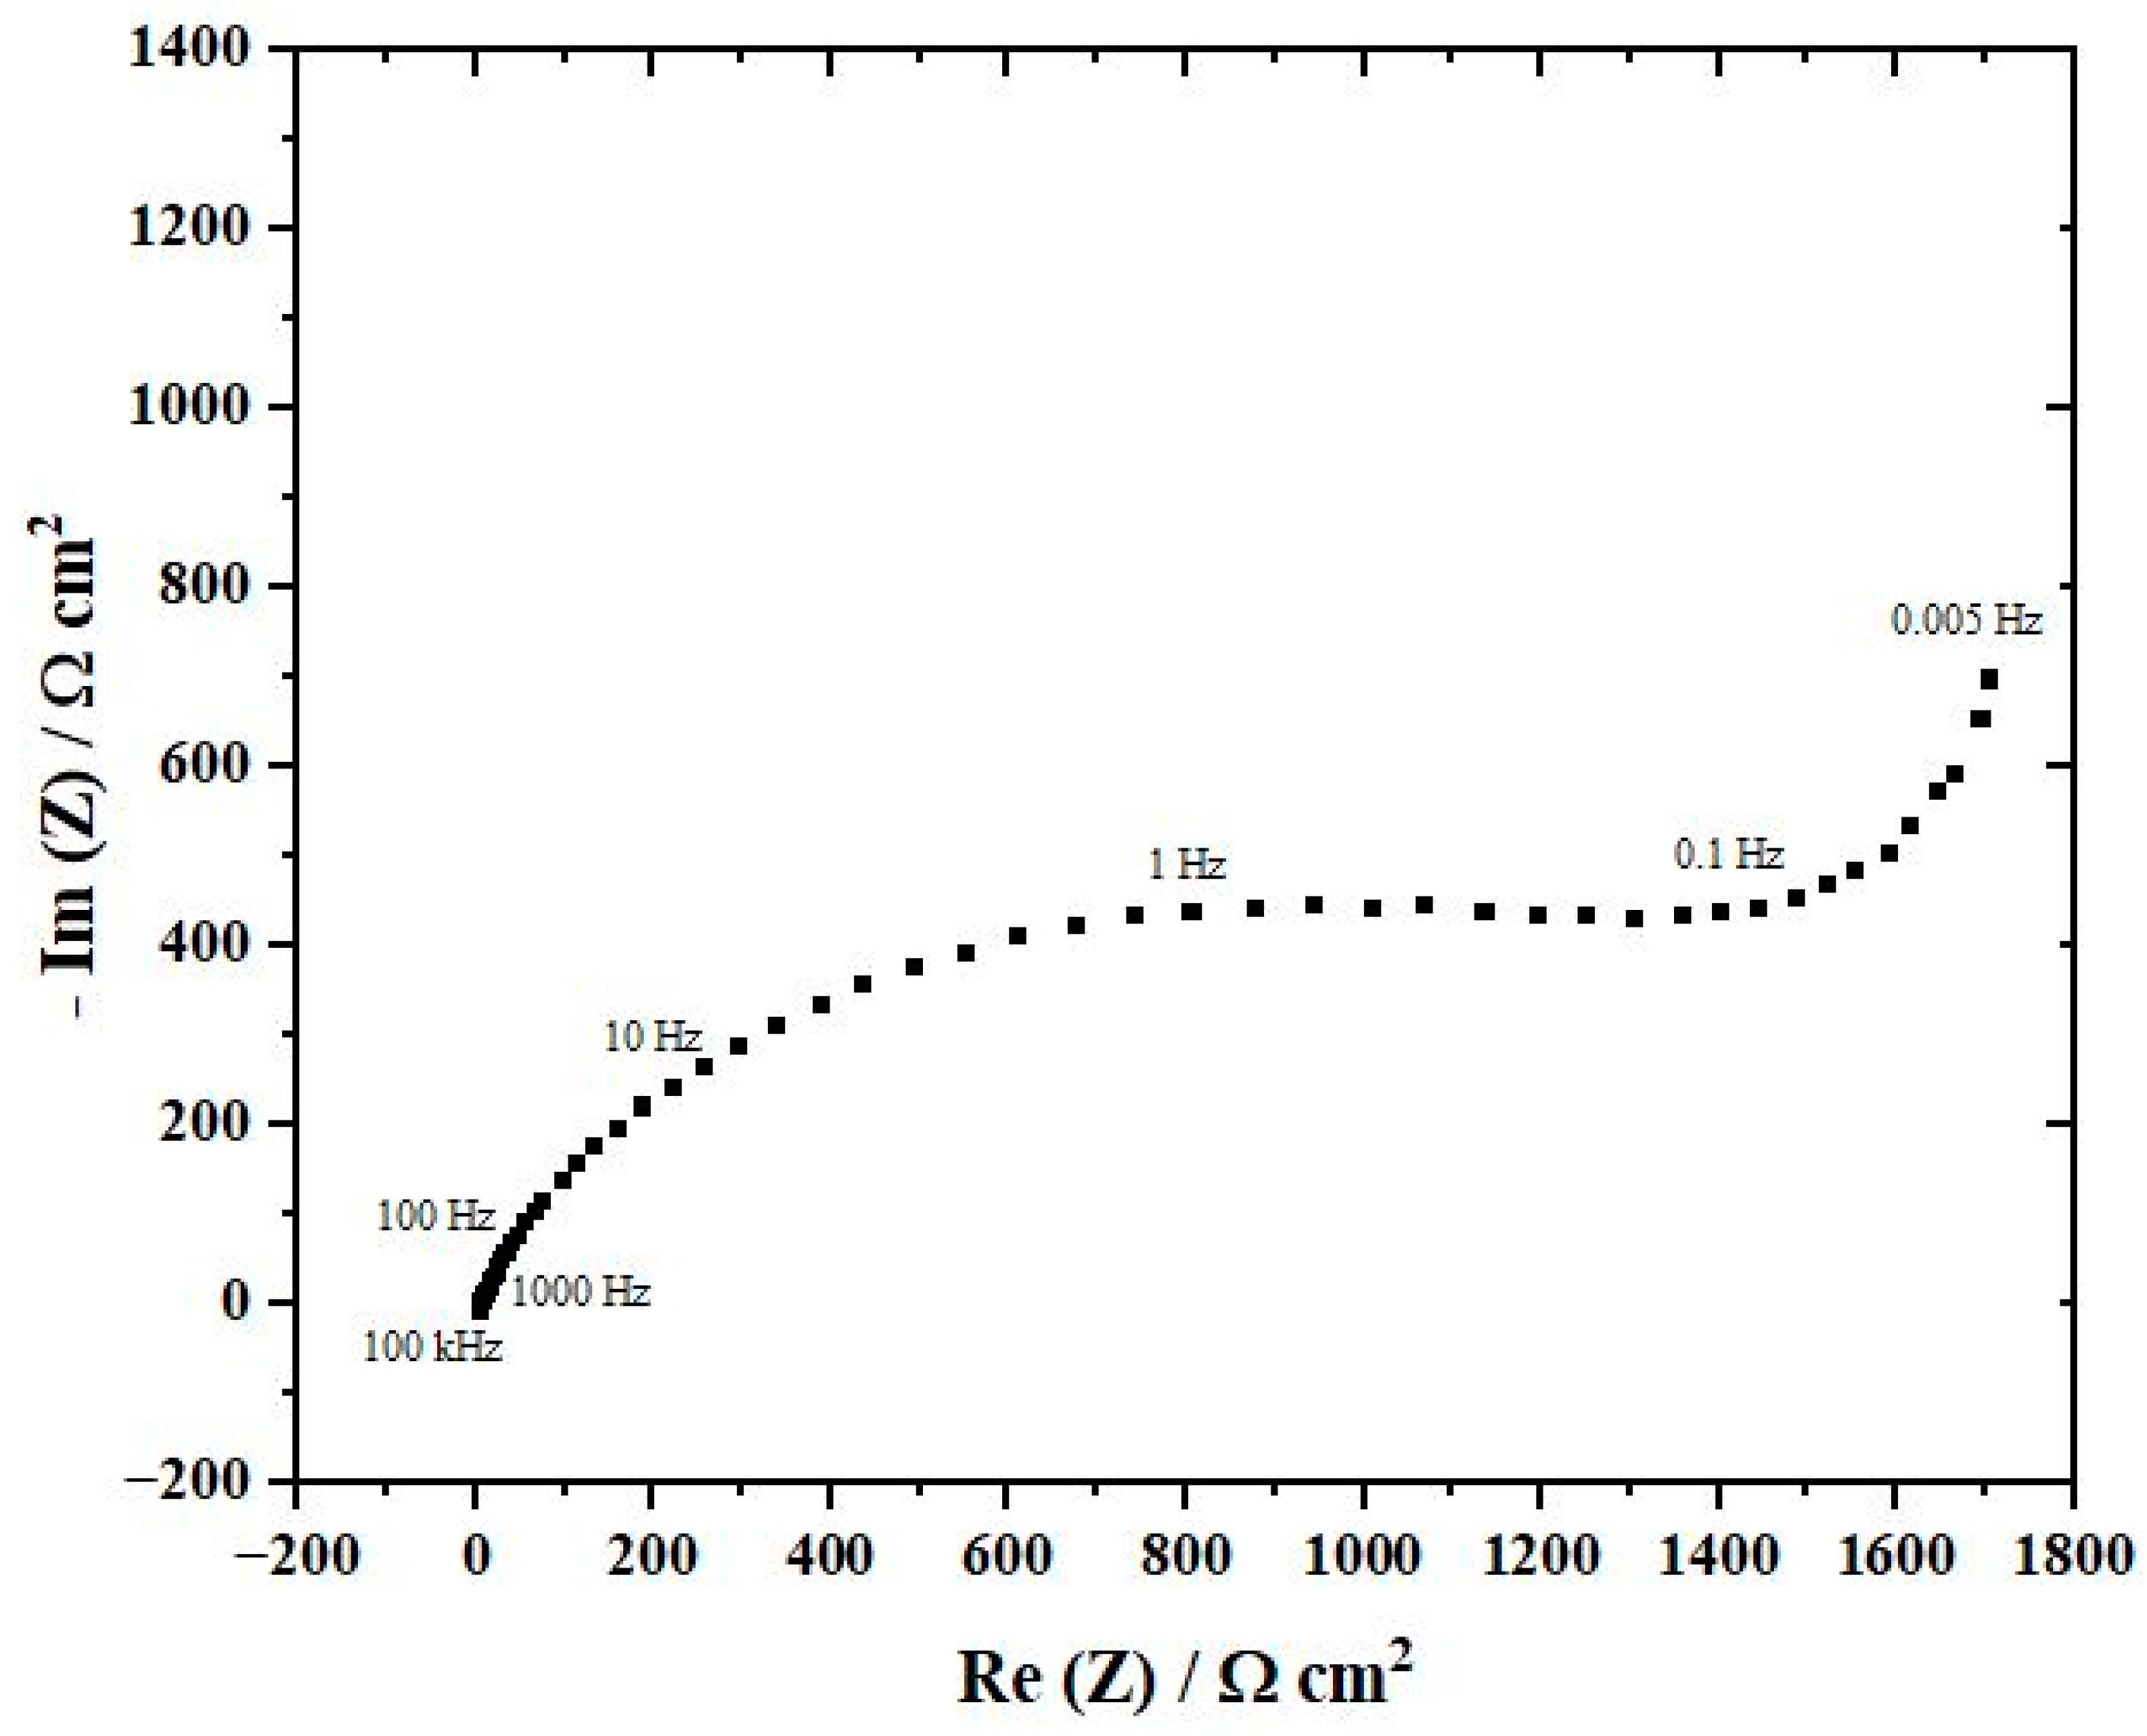
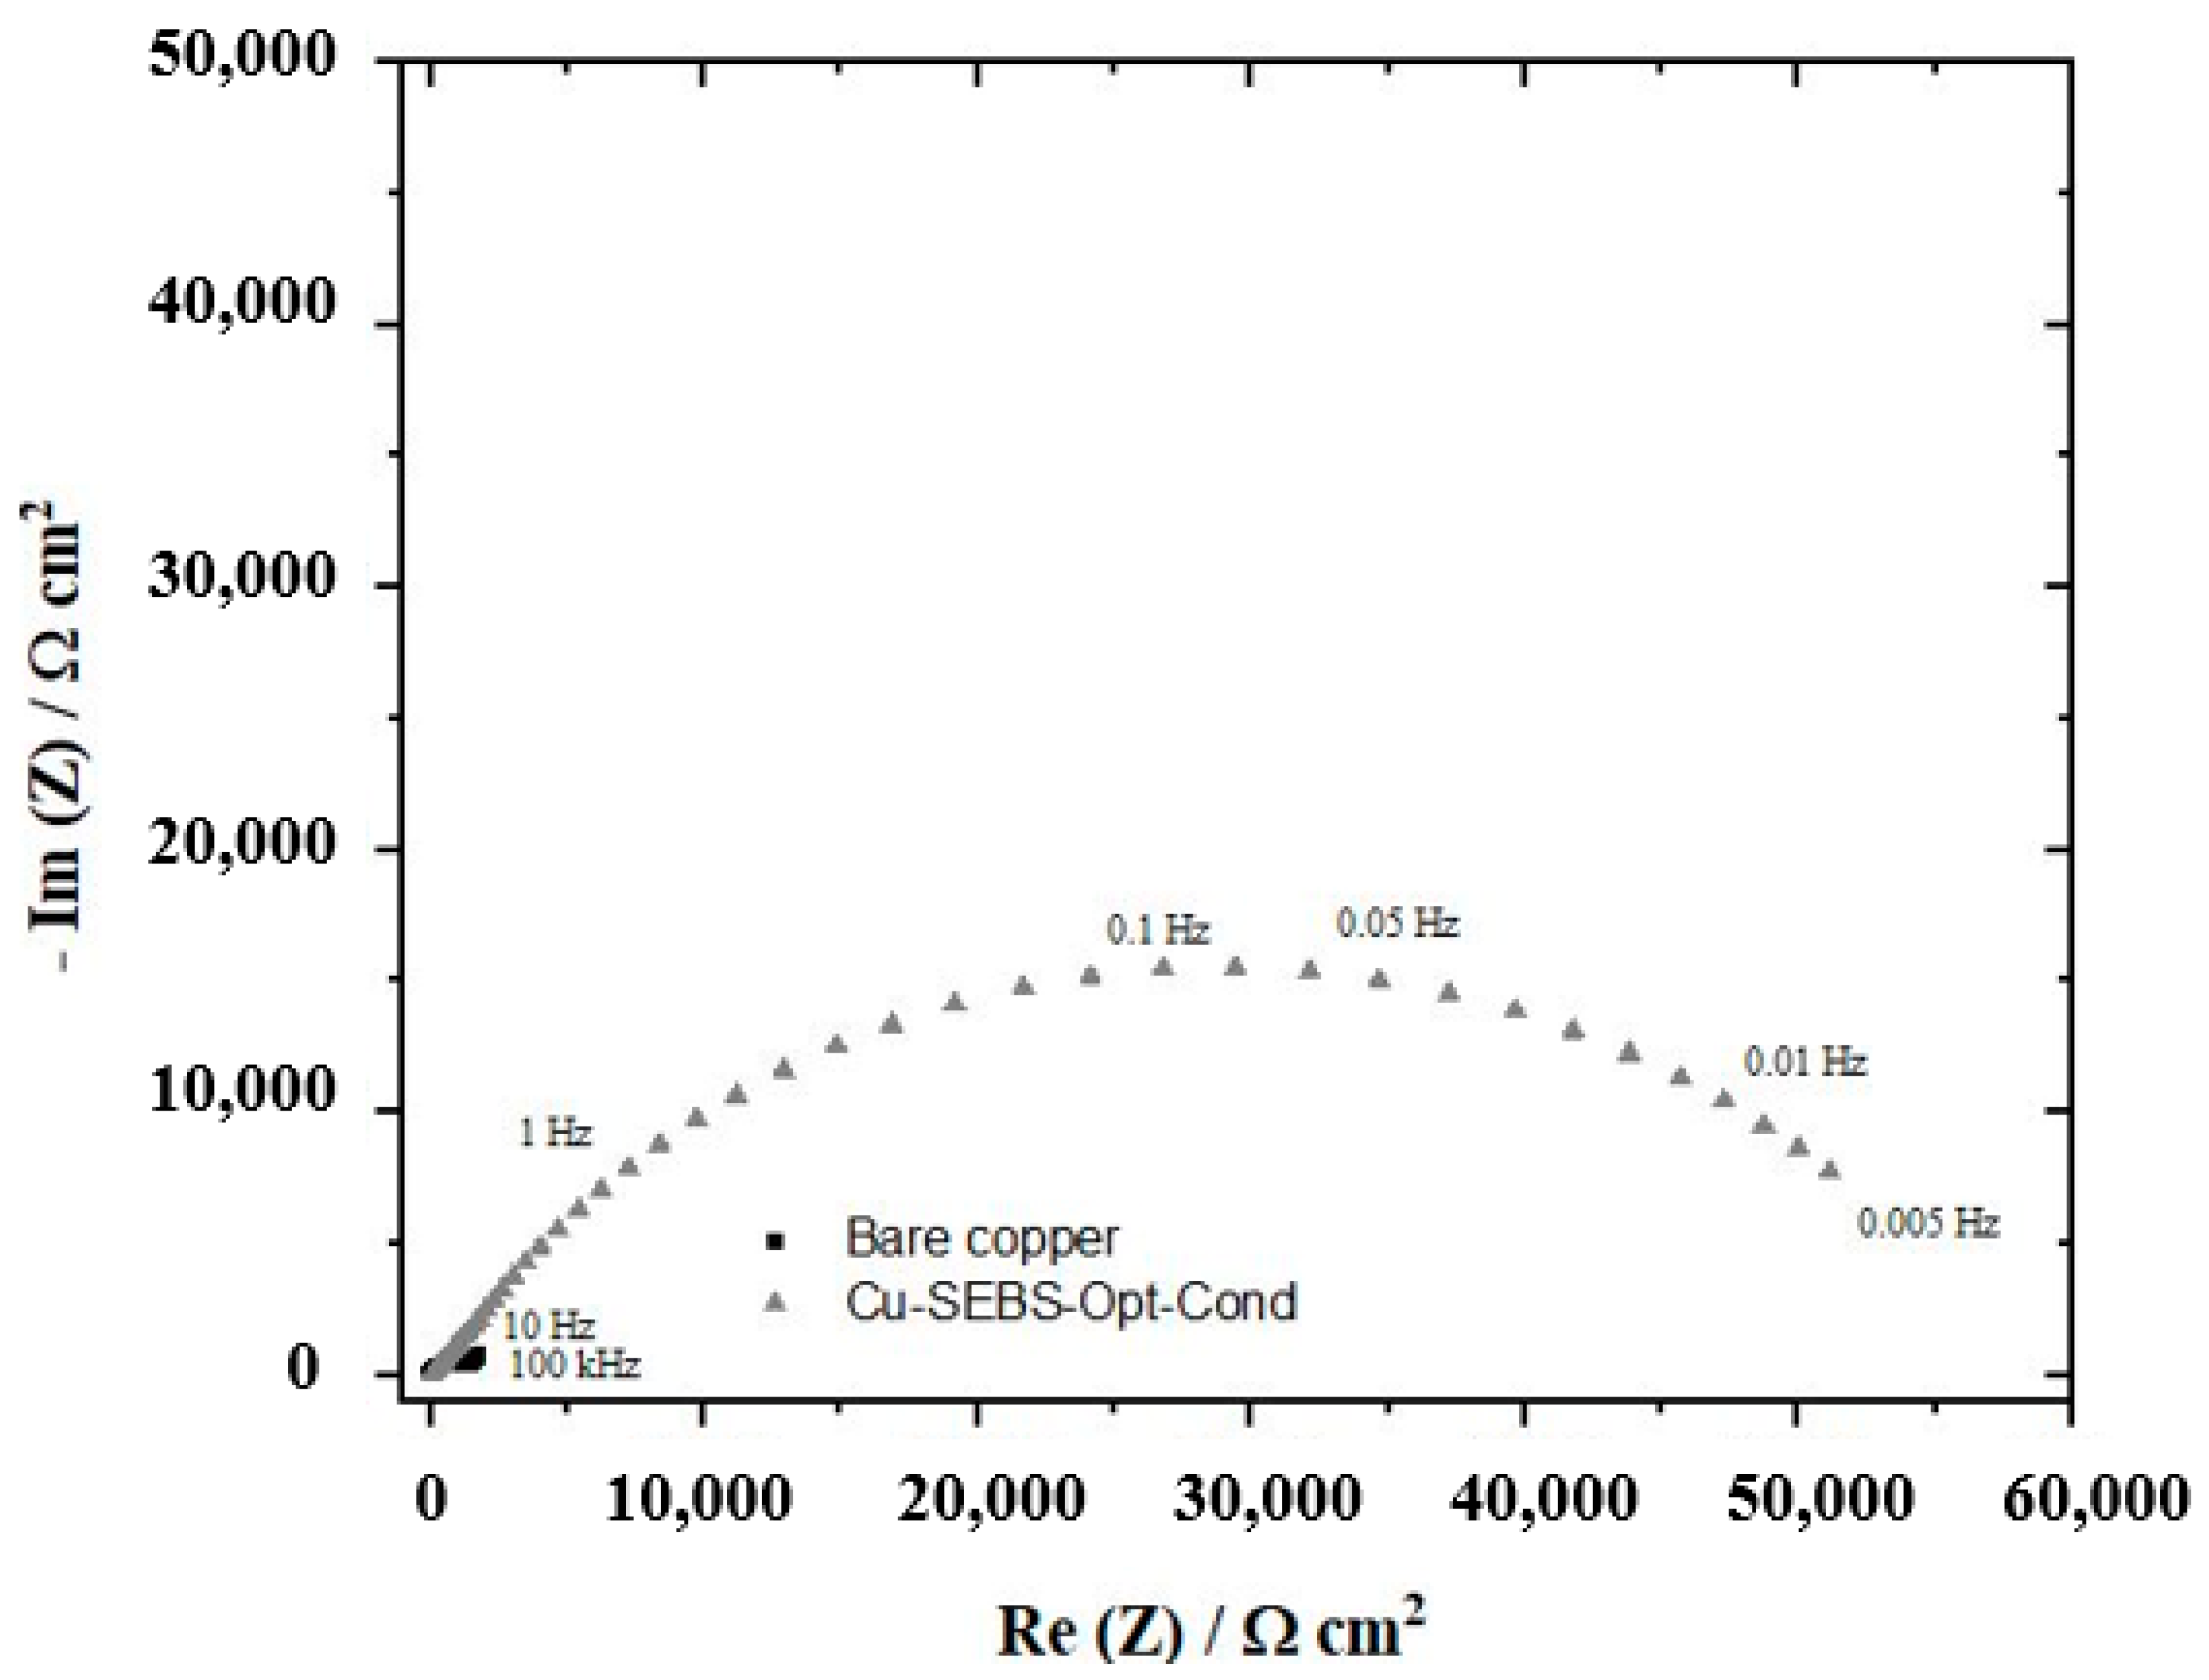
3.4.2. Electrochemical Impedance Spectroscopy (EIS)

Figure 8 represents the Nyquist diagram of bare copper obtained after a 30-min immersion in a 3 wt% NaCl solution at 25 °C.
The diagram mainly reveals a capacitive loop at high frequency and an almost linear curve, forming a 45° angle with the Re (Z) axis at low frequency [6,18,21]. The semicircle in the high-frequency region shows the combination of double-layer capacitance and charge transfer resistance. Moreover, the semi-circle’s depression can be attributed to the frequency dispersion resulting from the roughness and inhomogeneity of the electrode surface [18,22,23]. Furthermore, the Warburg impedance’s presence in the low-frequency region is related to the anodic diffusion process of copper species ( C u C l 2 ) . These species are soluble within the copper surface towards the saline solution. The Warburg’s presence is also associated with the cathodic diffusion process of the oxygen’s dissolution within the saline solution towards the electrode surface.
Figure 9 indicates the Nyquist plots of bare copper and Cu-SEBS-Opt-Cond obtained after a 30-min immersion in an aqueous 3 wt% NaCl solution.
In the presence of SEBS coating at optimal conditions, the diagram’s diameter strongly increases, confirming the clearly observed inhibiting effect by means of voltammetry. In addition, the Warburg impedance disappearance indicates that the film is sufficiently densely packed to prevent the oxygen or Cl ions’ diffusion towards the copper substrate, thus inhibiting the copper corrosion [24].
More accurate information was obtained through the impedance data’s analysis with electrical equivalent circuits (EEC). The two considered EEC were displayed in Figure 10.
In these circuits, Rs is the solution resistance, Rct is the charge transfer resistance, Qdl corresponds to the capacitance of the double layer, Qf is the capacitance of coating, Rf is the transfer resistance of the electrons through coating, and W is the Warburg impedance linked to the diffusion processes in the low-frequency region.
In fact, Qdl and Qf are constant phase elements (CPE) used in place of capacitors to compensate for deviations from ideal dielectric behavior that are due to the heterogeneous nature of the electrode surface. The obtained findings after the computer fitting of the experimental impedance data were listed in Table 3. The parameter n describes how electrode departs from an ideal surface, corresponding to n = 1 (and the CPE, to an ideal capacitor). nf and ndl are associated with Qf and Qdl in Table 3, respectively. The CPE’s impedance function is described according to Equation (9):
Z C P E = 1 Q 0 ( j ω ) n
where Q0 represents the CPE magnitude, j is the imaginary root, ω is the angular frequency, and n is the exponential term that can be used as a measure of the inhomogeneity or roughness of the electrode surface. n denotes the shift phase and its value ranges from 0 to 1. The smaller the n value becomes, the rougher the surface as well as the more serious the corrosion [6].
Table 3 reveals that the parameters estimated for the bare copper accord well with the already published literature [18]. The charge transfer resistance (Rct) value of the Cu-SEBS-Opt-Cond (44,457 Ω cm2) is clearly more important than that of bare copper (1231 Ω cm2). Moreover, the polarization resistance value, Rp, (Rp, is the sum of the Rct and Rf) of Cu-SEBS-Opt-Cond equals 58,375 Ω cm2 which is 47-fold higher than that of bare copper.
Table 3 also presents the protective efficiency (η) determined by the electrochemical impedance spectroscopy, which is calculated according to Equation (10) [25]:
η = R p R p 0 R p × 100
Both R p 0 and Rp are the polarization resistance of bare copper and Cu-SEBS-Opt-Cond, respectively.
It was observed that η reached 97.89% after coating the copper with SEBS at optimal conditions. The obtained results are in excellent accordance with those which are determined by the mathematical modeling of the potentiodynamic polarization curves recorded around OCP (Table 2).
In this study, our investigation was limited to the analysis of three specific operating parameters. However, it is worth noting that additional variables exist which may exert significant effects on the corrosion rate (CR) of Cu-SEBS such as oven drying temperature and duration, the nature of the coating material, the choice of solvent, as well as the coating process itself. Furthermore, the examination of morphological characteristics and their evolution throughout corrosion tests holds significant importance in discerning the nature of corrosion phenomena manifesting within the samples. Regrettably, this current study was not executed due to the unavailability of these techniques within our laboratory. As part of our future research endeavors, we intend to explore these additional parameters using cross-validation methodology to discern the variables that exert substantial influence on the corrosion rate (CR) of Cu-SEBS. Furthermore, our investigation will encompass an examination of morphological characteristics to facilitate the analysis of the chemical composition of corrosion products, ultimately enhancing our comprehension of the inhibition mechanism.

4. Conclusions

The present study successfully evaluated the influence of SEBS ratio, immersion 1, and immersion 2 on the CR of SEBS-coated copper in a 3 wt% NaCl solution using voltammetry around OCP after applying experimental design procedures. The main conclusions drawn from this investigation could be summarized as follows:
  • The SEBS ratio is the most significant parameter that influenced the CR of SEBS-coated copper.
  • The immersion 2, the quadratic effect of the SEBS ratio, the immersion 1 and the interaction SEBS ratio—immersion 2 are important, but they are less significant.
  • The fit of the experimental design indicated that the optimum protocol for the SEBS film’s formation on the copper electrode to obtain a lower CR could be found at 2.17% of the SEBS ratio, 20 min of the immersion 1, and 21 min of the immersion 2.
To confirm the results obtained by the experimental design, the optimal operating conditions were tested on a real protocol, leading to the following:
  • 0.000174 mm year−1 of the CR, value nearly that of the fitted value (0.0001 mm/year).
  • The Rp value equals 58,375 Ω cm2 and is 47-fold higher than that of bare copper.
  • The inhibition efficiencies, as derived from both voltammetry conducted around the OCP (η = 99.7%) and EIS (η = 97.89%), are of utmost significance and demonstrate a remarkable level of concurrence.
  • The SEBS coating acts as a cathodic-type corrosion inhibitor.

Author Contributions

Conceptualization, M.M.; methodology, F.M.; software, F.M. and A.M.; validation, M.M. and F.M.; formal analysis, F.M.; investigation, M.M.; resources, M.M.; data curation, F.M.; writing—original draft preparation, F.M.; writing—review and editing, M.M.; visualization, M.M.; supervision, M.M.; project administration, M.M.; funding acquisition, A.M.; All authors have read and agreed to the published version of the manuscript.

Funding

This research received no external funding.

Institutional Review Board Statement

Not applicable.

Informed Consent Statement

Not applicable.

Data Availability Statement

Not applicable.

Acknowledgments

The authors would like to thank all the members of the laboratory of Electrochemistry and Environment at Sfax National Engineering School and the Research Laboratory of Environmental Sciences and Technologies at the Higher Institute of Environmental Sciences and Technology of Borj Cedria, for supporting this work. Also, the authors would like to thank Abid Skander, the teacher of English, for his help to proofread the paper.

Conflicts of Interest

The authors declare no conflict of interest.

Abbreviation List

SEBSPolystyrene-block-poly (ethylene-ran-butylene)-block-polystyrene
RSMResponse surface methodology
BBDBox–Behnken Design
CRCorrosion rate
OCPOpen circuit potential
TPEsThermoplastic elastomers
Cu-SEBSSEBS-coated copper
DDDoehlert Design
CCDCentral Composite Design
Cu-SEBS-Opt-CondSEBS-coated copper at optimal conditions
k Number of factors
Cp Replicate number of central points
β0Constant coefficients of the model
βiLinear coefficients of the model
βiiQuadratic coefficients of the model
βijInteraction coefficients of the model
Xi, XjCoded independent factors
ԑError of the model
ANOVAAnalysis of variance
SCESaturated calomel electrode
βaAnodic Tafel coefficient
βcCathodic Tafel coefficient
jcorrCorrosion current density
ASEBS ratio
BImmersion 1
CImmersion 2
A2Quadratic effect of SEBS ratio
C2Quadratic effect of immersion 2
ABInteraction between SEBS and immersion 1
ACInteraction between SEBS and immersion 2
BCInteraction between immersion 1 and immersion 2
EISElectrochemical impedance spectroscopy
CuCl ( film ) Insoluble film of cuprous chloride
C u C l 2 Soluble cuprous complex
EcorrCorrosion potential
η Protection efficiency
j corr 0 Corrosion current density of bare copper
EECElectrical equivalent circuits
RsSolution resistance
RctCharge transfer resistance
QdlCapacitance of the double layer
QfCapacitance of coating
RfTransfer resistance of the electrons through coating
W Warburg impedance
CPEConstant phase elements
nf,ndlShift phase associated with Qf and Qdl
Z C P E CPE’s impedance function
Q0CPE magnitude
j Imaginary root
ωAngular frequency

References

  1. Mansouri, H.; Eghbali, B.; Afrand, M. Producing Multi-Layer Composite of Stainless Steel/Aluminum/Copper by Accumulative Roll Bonding (ARB) Process. J. Manuf. Process. 2019, 46, 298–303. [Google Scholar] [CrossRef]
  2. Tang, H.; Sun, J.; Pan, J. Electrochemical and Localized Corrosion Behavior of 316 L SS/Copper/316 L SS Sandwich Composite in Chloride-Containing Environment. Corros. Sci. 2022, 209, 110719. [Google Scholar] [CrossRef]
  3. Yabuki, A.; Tanabe, S.; Fathona, I.W. Self-Healing Polymer Coating with the Microfibers of Superabsorbent Polymers Provides Corrosion Inhibition in Carbon Steel. Surf. Coat. Technol. 2018, 341, 71–77. [Google Scholar] [CrossRef]
  4. Gul, H.; Algul, H.; Akyol, A.; Uysal, M.; Alp, A. Evaluation of Wear and Corrosion Behavior of Electroless Ni-B-P/CNT Composite Coatings on Aluminum Surfaces. Diam. Relat. Mater. 2023, 137, 110075. [Google Scholar] [CrossRef]
  5. Qin, J.; Shi, X.; Li, H.; Zhao, R.; Li, G.; Zhang, S.; Ding, L.; Cui, X.; Zhao, Y.; Zhang, R. Performance and Failure Process of Green Recycling Solutions for Preparing High Degradation Resistance Coating on Biomedical Magnesium Alloys. Green Chem. 2022, 24, 8113–8130. [Google Scholar] [CrossRef]
  6. Masmoudi, F.; Jedidi, I.; Amor, Y.B.; Masmoudi, M. Corrosion Protection Evaluation of Copper Coated with a Block Copolymer and Block Coploymer/Carbon Black Nanoparticles in 3 Wt% NaCl Solution. ChemistrySelect 2023, 8, e202202608. [Google Scholar] [CrossRef]
  7. Li, X.; Huang, K.; Wang, X.; Li, H.; Shen, W.; Zhou, X.; Xu, J.; Wang, X. Effect of Montmorillonite on Morphology, Rheology, and Properties of a Poly [Styrene–(Ethylene-Co-Butylene)–Styrene]/Poly (ɛ-Caprolactone) Nanocomposite. J. Mater. Sci. 2018, 53, 1191–1203. [Google Scholar] [CrossRef]
  8. Drobny, J.G. Handbook of Thermoplastic Elastomers; Elsevier: Amsterdam, The Netherlands, 2014. [Google Scholar]
  9. Zhang, R.; Huang, K.; Zhu, M.; Chen, G.; Tang, Z.; Li, Y.; Yu, H.; Qiu, B.; Li, X. Corrosion Resistance of Stretchable Electrospun SEBS/PANi Micro-Nano Fiber Membrane. Eur. Polym. J. 2020, 123, 109394. [Google Scholar] [CrossRef]
  10. Grigorescu, R.M.; Ciuprina, F.; Ghioca, P.; Ghiurea, M.; Iancu, L.; Spurcaciu, B.; Panaitescu, D.M. Mechanical and Dielectric Properties of SEBS Modified by Graphite Inclusion and Composite Interface. J. Phys. Chem. Solids 2016, 89, 97–106. [Google Scholar] [CrossRef]
  11. Mune, M.A.M.; Minka, S.R.; Mbome, I.L. Response Surface Methodology for Optimisation of Protein Concentratepreparation from Cowpea [Vigna unguiculata (L.) Walp]. Food Chem. 2008, 110, 735–741. [Google Scholar] [CrossRef]
  12. de Lima, T.G.; Rocha, B.; Braga, A.V.C.; do Lago, D.C.B.; Luna, A.S.; Senna, L.F. Response Surface Modeling and Voltammetric Evaluation of Co-Rich Cu–Co Alloy Coatings Obtained from Glycine Baths. Surf. Coat. Technol. 2015, 276, 606–617. [Google Scholar] [CrossRef]
  13. Senna, L.F.; Luna, A.S. Experimental Design and Response Surface Analysis as Available Tools for Statistical Modeling and Optimization of Electrodeposition Processes. In Electroplating; IntechOpen: London, UK, 2012. [Google Scholar]
  14. Do Lago, D.C.B.; De Senna, L.F.; Soares, E.C.S.; Da Silva, L.F.; Fernandes, D.S.; Luna, A.S.; D’elia, E. The Use of Experimental Design for the Study of the Corrosion of Bronze Pretreated with AMT in Artificial Rainwater. Prog. Org. Coat. 2013, 76, 1289–1295. [Google Scholar] [CrossRef]
  15. Chaabani, A.; Aouadi, S.; Souissi, N.; Nóvoa, X.R. Electro-Chemical Impedance Spectral (EIS) Study of Patinated Bronze Corrosion in Sulfate Media: Experimental Design Approach. J. Mater. Sci. Chem. Eng. 2017, 5, 44–54. [Google Scholar] [CrossRef]
  16. Rios, E.C.; Zimer, A.M.; Mendes, P.C.; Freitas, M.B.; de Castro, E.V.; Mascaro, L.H.; Pereira, E.C. Corrosion of AISI 1020 Steel in Crude Oil Studied by the Electrochemical Noise Measurements. Fuel 2015, 150, 325–333. [Google Scholar] [CrossRef]
  17. Şenaras, A.E. Parameter Optimization Using the Surface Response Technique in Automated Guided Vehicles. In Sustainable Engineering Products and Manufacturing Technologies; Elsevier: Amsterdam, The Netherlands, 2019; pp. 187–197. [Google Scholar]
  18. Rahal, C.; Masmoudi, M.; Abdelhedi, R.; Sabot, R.; Jeannin, M.; Bouaziz, M.; Refait, P. Olive Leaf Extract as Natural Corrosion Inhibitor for Pure Copper in 0.5 M NaCl Solution: A Study by Voltammetry around OCP. J. Electroanal. Chem. 2016, 769, 53–61. [Google Scholar] [CrossRef]
  19. Wang, Y.; You, Z.; Pei, S.; Ma, K.; Dai, C.; Wang, D.; Wang, J.; Pan, F. Corrosion Resistance of a Calcium Carbonate Coating Prepared by Ultrasound-Assisted Chemical Conversion in Calcium Disodium Edetate Solution. J. Magnes. Alloys 2023, in press. [CrossRef]
  20. del Olmo, R.; López, E.; Matykina, E.; Tiringer, U.; Mol, J.M.C.; Mohedano, M.; Arrabal, R. Hybrid PEO/Sol-Gel Coatings Loaded with Ce for Corrosion Protection of AA2024-T3. Prog. Org. Coat. 2023, 182, 107667. [Google Scholar] [CrossRef]
  21. Dhouibi, I.; Masmoudi, F.; Bouaziz, M.; Masmoudi, M. A Study of the Anti-Corrosive Effects of Essential Oils of Rosemary and Myrtle for Copper Corrosion in Chloride Media. Arab. J. Chem. 2021, 14, 102961. [Google Scholar] [CrossRef]
  22. Raza, M.A.; Rehman, Z.U.; Ghauri, F.A. Corrosion Study of Silane-Functionalized Graphene Oxide Coatings on Copper. Thin Solid Film. 2018, 663, 93–99. [Google Scholar] [CrossRef]
  23. Yu, Y.; Yang, D.; Zhang, D.; Wang, Y.; Gao, L. Anti-Corrosion Film Formed on HAl77-2 Copper Alloy Surface by Aliphatic Polyamine in 3 Wt.% NaCl Solution. Appl. Surf. Sci. 2017, 392, 768–776. [Google Scholar] [CrossRef]
  24. Sui, W.; Zhao, W.; Zhang, X.; Peng, S.; Zeng, Z.; Xue, Q. Comparative Anti-Corrosion Properties of Alkylthiols SAMs and Mercapto Functional Silica Sol–Gel Coatings on Copper Surface in Sodium Chloride Solution. J. Sol-Gel Sci. Technol. 2016, 80, 567–578. [Google Scholar] [CrossRef]
  25. Ghelichkhah, Z.; Sharifi-Asl, S.; Farhadi, K.; Banisaied, S.; Ahmadi, S.; Macdonald, D.D. L-Cysteine/Polydopamine Nanoparticle-Coatings for Copper Corrosion Protection. Corros. Sci. 2015, 91, 129–139. [Google Scholar] [CrossRef]
Figure 1. Schematic illustration of the preparation process of the Cu-SEBS electrode.
Coatings 13 01734 g001
Figure 2. Tafel curves simulated with EC-Lab of (a) Experiment 1 (b) Experiment 2 and (c) Experiment 13 after exposure in a 3 wt% NaCl solution for 30 min compared to experimental polarization curve around OCP.
Coatings 13 01734 g002
Figure 3. Effect of immersion protocol factors on corrosion rate; (a) standardized Pareto chart; (b) main effects for CR. A: SEBS ratio; B: Immersion 1; C: Immersion 2.
Coatings 13 01734 g003
Figure 4. Response surfaces for CR (a) SEBS and immersion 1 at 20 min of immersion 2, (b) SEBS and immersion 2 at 20 min of immersion 1, (c) of immersion 1 and of immersion 2 at 2% of SEBS.
Coatings 13 01734 g004
Figure 5. Contour diagram of response surface model of the corrosion rate as the function of SEBS ratio and immersion 2 with immersion 1 is constant at 20 min.
Coatings 13 01734 g005
Figure 6. Potentiodynamic polarization curves of bare copper and Cu-SEBS-Opt-Cond obtained after 30-min immersion in a 3 wt% NaCl solution at RT (~25 °C).
Coatings 13 01734 g006
Figure 7. Polarization curve around OCP of bare copper and Cu-SEBS-Opt-Cond obtained after 30-min immersion in a 3 wt% NaCl solution at RT (~25 °C).
Coatings 13 01734 g007
Figure 8. Nyquist plots for bare copper obtained after 30-min immersion in a 3 wt% NaCl solution at RT (~25 °C).
Coatings 13 01734 g008
Figure 9. Nyquist plots for bare copper and Cu-SEBS-Opt-Cond obtained after 30-min immersion in a 3 wt% NaCl solution at RT (~25 °C).
Coatings 13 01734 g009
Figure 10. Equivalent circuits (a) Rs(Qdl(RctW)) (b) Rs(Qf(Rf(QdlRct))) used to fit the EIS experimental data.
Coatings 13 01734 g010
Table 1. Coded levels of operating variables.
FactorSymbolsLevels
Low (−1)Center (0)High (+1)
SEBS ratio (%)A1.122.9
Immersion 1 (min)B102030
Immersion 2 (min)C102030
Table 2. Electrochemical kinetic parameters obtained from the curve’s polarization around OCP and simulated with EC-Lab software for bare copper and Cu-SEBS-Opt-Cond in a 3 wt% NaCl solution at RT (~25 °C).
ElectrodeEcorr
(mV/SCE)
jcorr
μA cm−2
CR × 10−3
mm year−1
η
(%)
Bare Copper−175 ± 56.83 ± 0.779.24 ± 0.2
Cu-SEBS-Opt-Cond−282 ± 50.015 ± 0.00040.174 ± 0.0299.7 ± 0.5
Table 3. Electrochemical impedance parameters for bare copper and Cu-SEBS-Opt-Cond in a 3 wt% NaCl solution RT (~25 °C).
Bare CopperCu-SEBS-Opt-Cond
-
Rs (Ω cm2)7.03 ± 314.7 ± 2
Rct (Ω cm2)1231 ± 20044,457 ± 6000
Q dl . 10 6 ( F   cm 2   s d l n )121 ± 502.857 ± 1.2
ndl0.711 ± 0.020.885 ± 0.02
Rf (Ω cm2)13,918 ± 500
Q f . 10 6 ( F   cm 2   s f n )28.61 ± 2.5
nf0.611 ± 0.01
W (Ω−1 cm−2 s0.5)190.8 ± 12
η (%)97.89 ± 1
Disclaimer/Publisher’s Note: The statements, opinions and data contained in all publications are solely those of the individual author(s) and contributor(s) and not of MDPI and/or the editor(s). MDPI and/or the editor(s) disclaim responsibility for any injury to people or property resulting from any ideas, methods, instructions or products referred to in the content.

