Abstract
Three kinds of Fe30Ni20Co20Cr20Mo3.5 high entropy alloy (HEA) coatings were prepared on the surface of a Q235 steel plate using plasma cladding and laser cladding. The microstructure, crystal structure, element distribution, microhardness, wear resistance, and corrosion resistance of the coatings were studied. The grain size of the high-speed laser cladding coating (HLC) was the smallest. The crystal structures of the plasma cladding coating (PC) and HLC were single face-centered cubic (FCC), while that of the deep laser cladding coating (DLC) was body-centered cubic (BCC). DLC had the best microhardness and wear resistance. The microhardness of PC, HLC, and DLC increased by 70%, 108%, and 109%, respectively, and the average friction coefficient decreased by 33%, 44%, and 51%, respectively, compared to Q235. HLC had the best corrosion resistance, with an annual corrosion rate of 0.66925 mm/a. The annual corrosion rate of PC and HLC was only 40% of Q235. The polarization curves of PC and HLC had obvious passivation regions with a width of up to 2 V. The corrosion types of PC were pitting corrosion and intergranular corrosion, that of HLC was general corrosion, and that of DLC was severe pitting corrosion.
1. Introduction
Q235 steel, composed of ferrite with good toughness and pearlite with high strength, shows great mechanical properties and excellent weldability. It is widely used in construction, energy, machinery, transportation and other industries as a load-bearing component and common weldment. However, the surface hardness and friction and wear resistance of Q235 steel is relatively poor [1]. It contains impurity elements and solid solutions with different potentials such as ferrite, pearlite, carbon, phosphorus, silicon, manganese, etc. In a humid atmosphere, it is very easy to observe metal corrosion due to electrochemical reactions on the surface of Q235 steel [2]. Therefore, surface modification technology is of great significance to the industrial application of Q235 steel.
At present, cladding technologies include argon arc cladding [3], induction cladding [4,5], plasma cladding [6,7,8], laser cladding [9,10,11], etc. Plasma cladding and laser cladding are more widely used in industry due to their convenient operation, high energy density, and excellent coating quality. A high-energy plasma beam greatly improves the cladding efficiency. The thickness of a plasma cladding coating is large. However, the uneven surface morphology of the coating requires secondary processing. Compared with the plasma beam, the laser spot diameter is smaller and the energy is more concentrated, resulting in the metallurgical combination of the coating and the substrate [10]. Research shows that when the laser power density is low (<104 W/cm2), it only causes the temperature of the substrate surface to rise without melting. The HEA powder absorbs a large amount of energy which causes it to melt and deposits a thin coating on the substrate surface. When the laser power density is within the range of 104–106 W/cm2, the energy is absorbed by the workpiece surface, and the heat is transferred to the workpiece interior through heat conduction and molten metal convection [12,13]. At this time, the cladding powder filled into the molten pool can not only promote the metallurgical bonding of the coating and the substrate, but also improve the depth of the coating.
Since the concept of HEA was established, it has received a lot of attention from the academic community because of its far superior comprehensive properties compared to traditional alloys [14,15]. Among them, the CoCrFeNi system HEA received the most extensive study. The atomic radius and electronegativity of the four elements are close, and the mixing enthalpy between any two elements is similar. The CoCrFeNi HEA is composed of a single FCC solid solution, which has good thermal stability, ductility, corrosion resistance, etc. [16]. Sathyamoorthi et al. studied the thermal stability of the CoCrFeNi alloy, and the sintered CoCrFeNi particles showed excellent thermal stability [17]. Zhang et al. prepared CoCrFeNi coatings on Q235 steel by laser cladding. The crystal structure is a single FCC solid solution. The coating exhibits exceptional wear resistance and corrosion resistance [18]. The research shows that the hardness and wear resistance increase greatly with the addition of trace Mo element into the CoCrFeNi HEA. The reason is that the large atomic radius difference between the Mo element and other elements causes a generous amount of lattice distortion, which leads to a high lattice distortion energy of the alloy [19,20,21,22,23]. Liu et al. prepared a CoCrFeNiMo high entropy alloy with excellent properties, and its tensile strength and ductility even reached 1.2 GPa and 19% [24]. Mu et al. successfully prepared CoCrFeNiMo coatings with exceptional friction resistance using plasma cladding [25]. Ma et al. prepared CoCrFeNiMo coatings using laser cladding, and compared the comprehensive properties of coatings with a different cladding speed [9]. Therefore, the preparation of a CoCrFeNiMo HEA coating on the surface of Q235 steel using cladding technology not only retains the advantages of high toughness and plasticity of Q235 steel, but also greatly improves its surface hardness, wear resistance, and corrosion resistance, which is of positive significance for the industrial application of this high entropy alloy.
In this paper, a brand-new element composition of Fe30Ni20Co20Cr20Mo3.5 HEA coating was successfully prepared using three completely different cladding processes. The microstructure, mechanical, and electrochemical properties of the three types of coating were analyzed. DLC with a completely different crystal structure from the Fe30Ni20Co20Cr20Mo3.5 HEA powder was obtained by adjusting the cladding parameters.
2. Experimental Materials and Methods
2.1. Materials and Methods
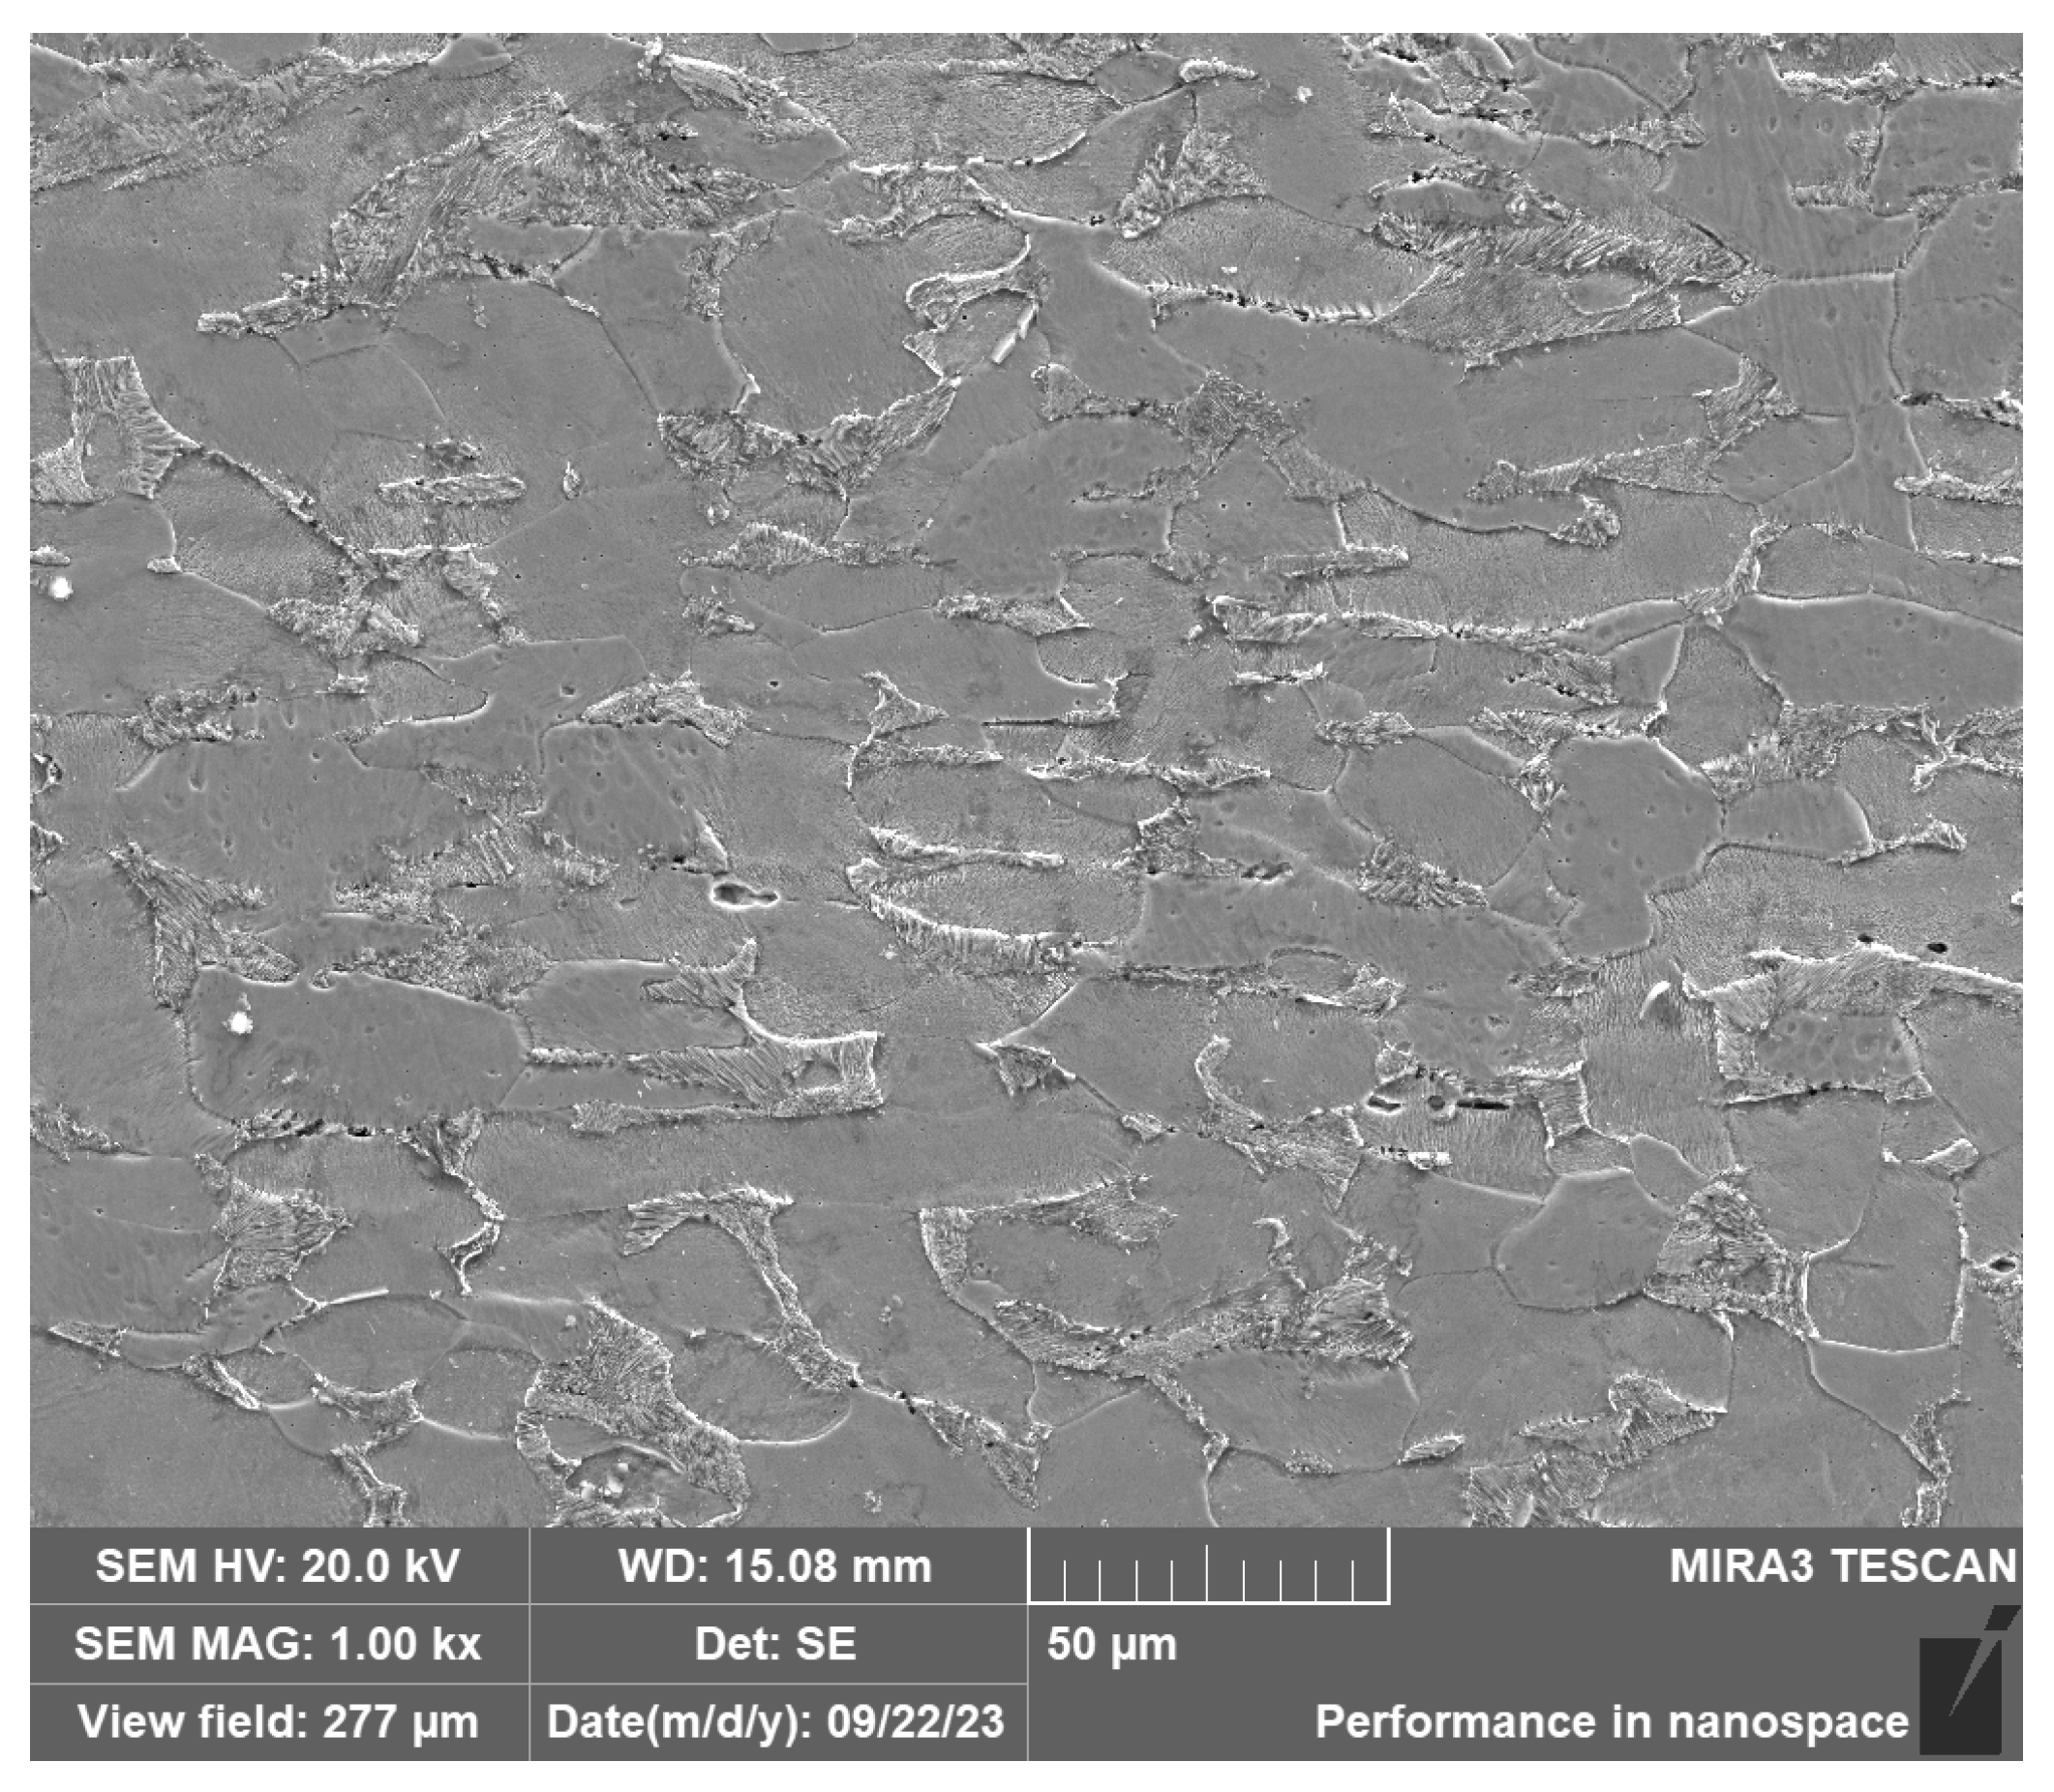
The substrate during cladding was a Q235 plate with the thickness of 10 mm. Table 1 shows the chemical composition of Q235. Figure 1 shows the microstructure of Q235. The particle size of the Fe30Ni20Co20Cr20Mo3.5 HEA powder was 100–300 mesh. The powder was dried at 100 °C for 2 h before cladding.

Table 1.
Chemical composition of Q235 substrate (wt.%).
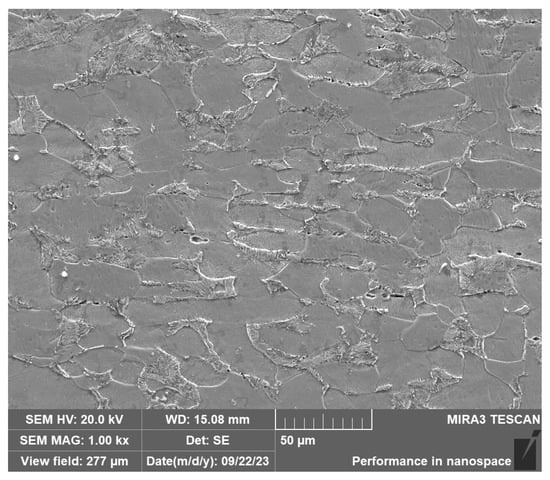
Figure 1.
SEM of Q235.
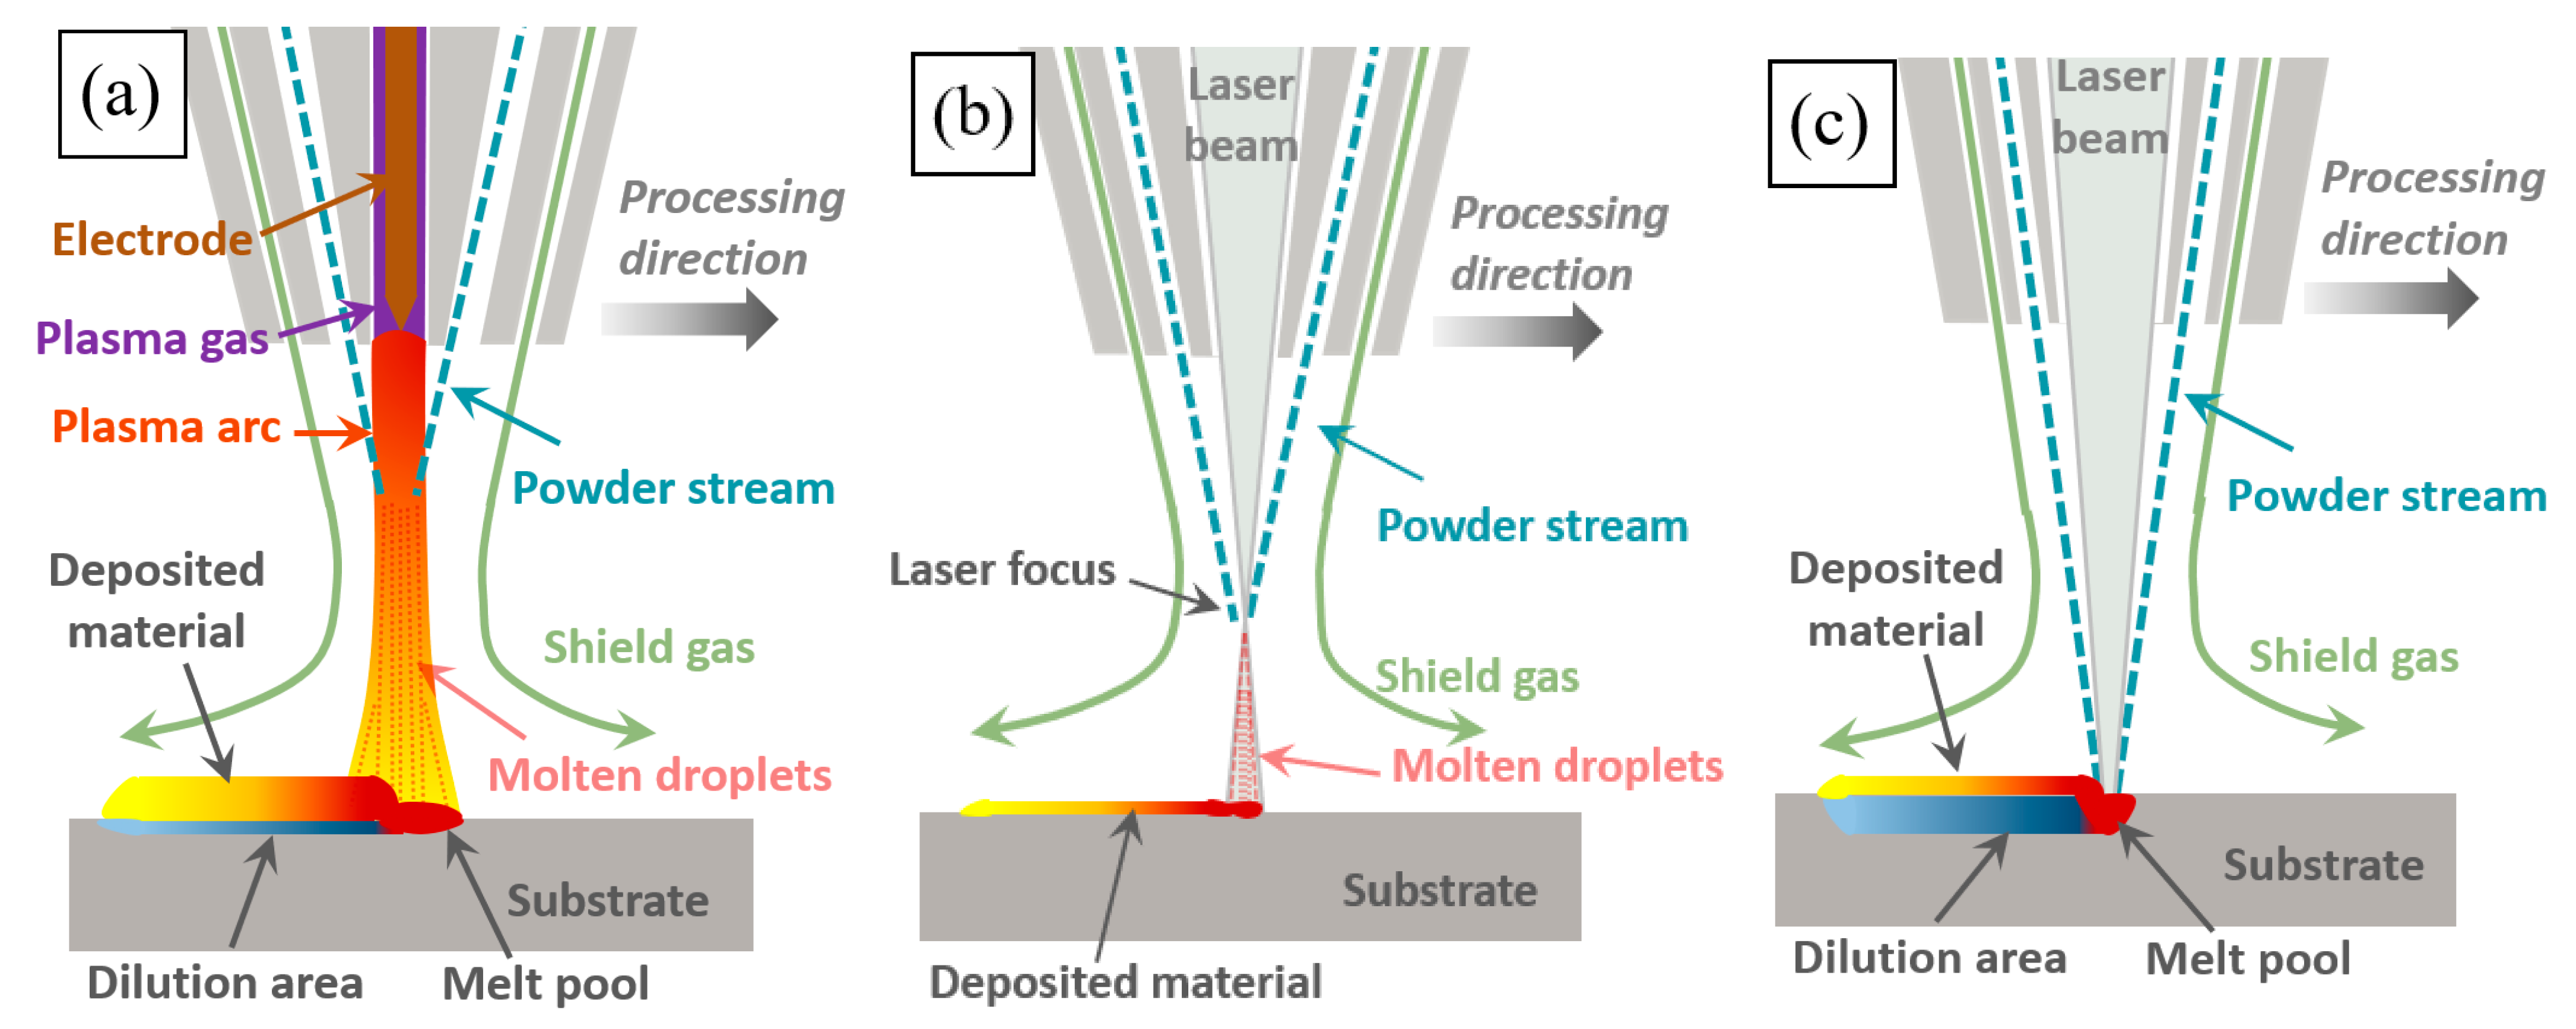
Three kinds of Fe30Ni20Co20Cr20Mo3.5 HEA coatings were prepared using plasma cladding, high-speed laser cladding, and deep laser cladding, which were marked as PC (plasma coating), HLC (high-speed laser coating), and DLC (deep laser coating). Figure 2 shows the working schematic diagram of the three cladding processes. During plasma cladding (Figure 2a) and high-speed laser cladding (Figure 2b), the powder melted before reaching the substrate surface [18]. Molten droplets were sprayed onto the substrate surface under the action of protective gas blowing force, gravity, and arc blowing force. During deep laser cladding (Figure 2c), the laser was focused on the molten pool. The melted powder and the substrate material were bonded after solidification. The process parameters during the cladding process are listed in Table 2. The power densities of PC and HLC are both below 104 W/cm2, and the substrate material is almost non-melting. The power density of DLC is higher than 104 W/cm2, resulting in the melting of the substrate material.
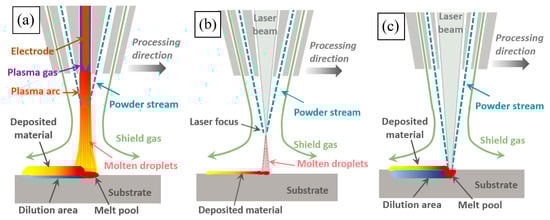
Figure 2.
Working schematic diagram of three cladding processes: (a) plasma cladding; (b) high-speed laser cladding; and (c) deep laser cladding.
Table 2.
Cladding process parameters.
2.2. Microstructure and Property Characteristics
A MIRA 3 LMH field emission scanning electron microscope equipped with an Aztec Energy X-Max 20 energy dispersive spectrometer (EDS) was used to analyze the microstructure and composition of coatings. The crystal structure of the components was tested using a Bruker D8 X-ray diffractometer (XRD, 2°/min, 60 kV, 60 mA, Cu-Kα radiation, 30° to 90°). The Vickers hardness of the coatings from the fusion zone to the coating direction was obtained using a HXS-1000A microhardness tester (load, 3 N, duration, 10 s). The distance between every two points was 0.1 mm. The wear resistance of the coating was tested using a MS-T300 rotary friction tester. Table 3 shows the specific process parameters. Figure 3 is the schematic diagram of the rotational friction test. The polarization curve test and electrochemical impedance spectroscopy test were used to characterize the corrosion resistance of the coatings in 1 mol/L NaCl solution. The electrochemical testing instrument was a typical three-electrode system, including an auxiliary electrode (platinum sheet), a reference electrode (saturated calomel electrode), and a working electrode (the samples). The model of the electrochemical workstation was CS310M. Samples were immersed in the solution for 20 min, and then, the open-circuit voltage (OCP) was measured for 0.5 h. Subsequently, electrochemical impedance spectroscopy (EIS) was performed within the frequency range of 0.01 to 105 Hz. Finally, the potentiodynamic polarization (PD) was tested. The scan speed was 1 mV/s and the scan range was −2 to 2 V.
Table 3.
Friction and wear test parameters.
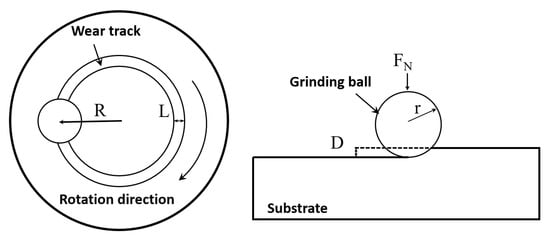
Figure 3.
Schematic diagram of the rotational friction test.
3. Results and Discussion
3.1. Morphology and Microstructure Observation
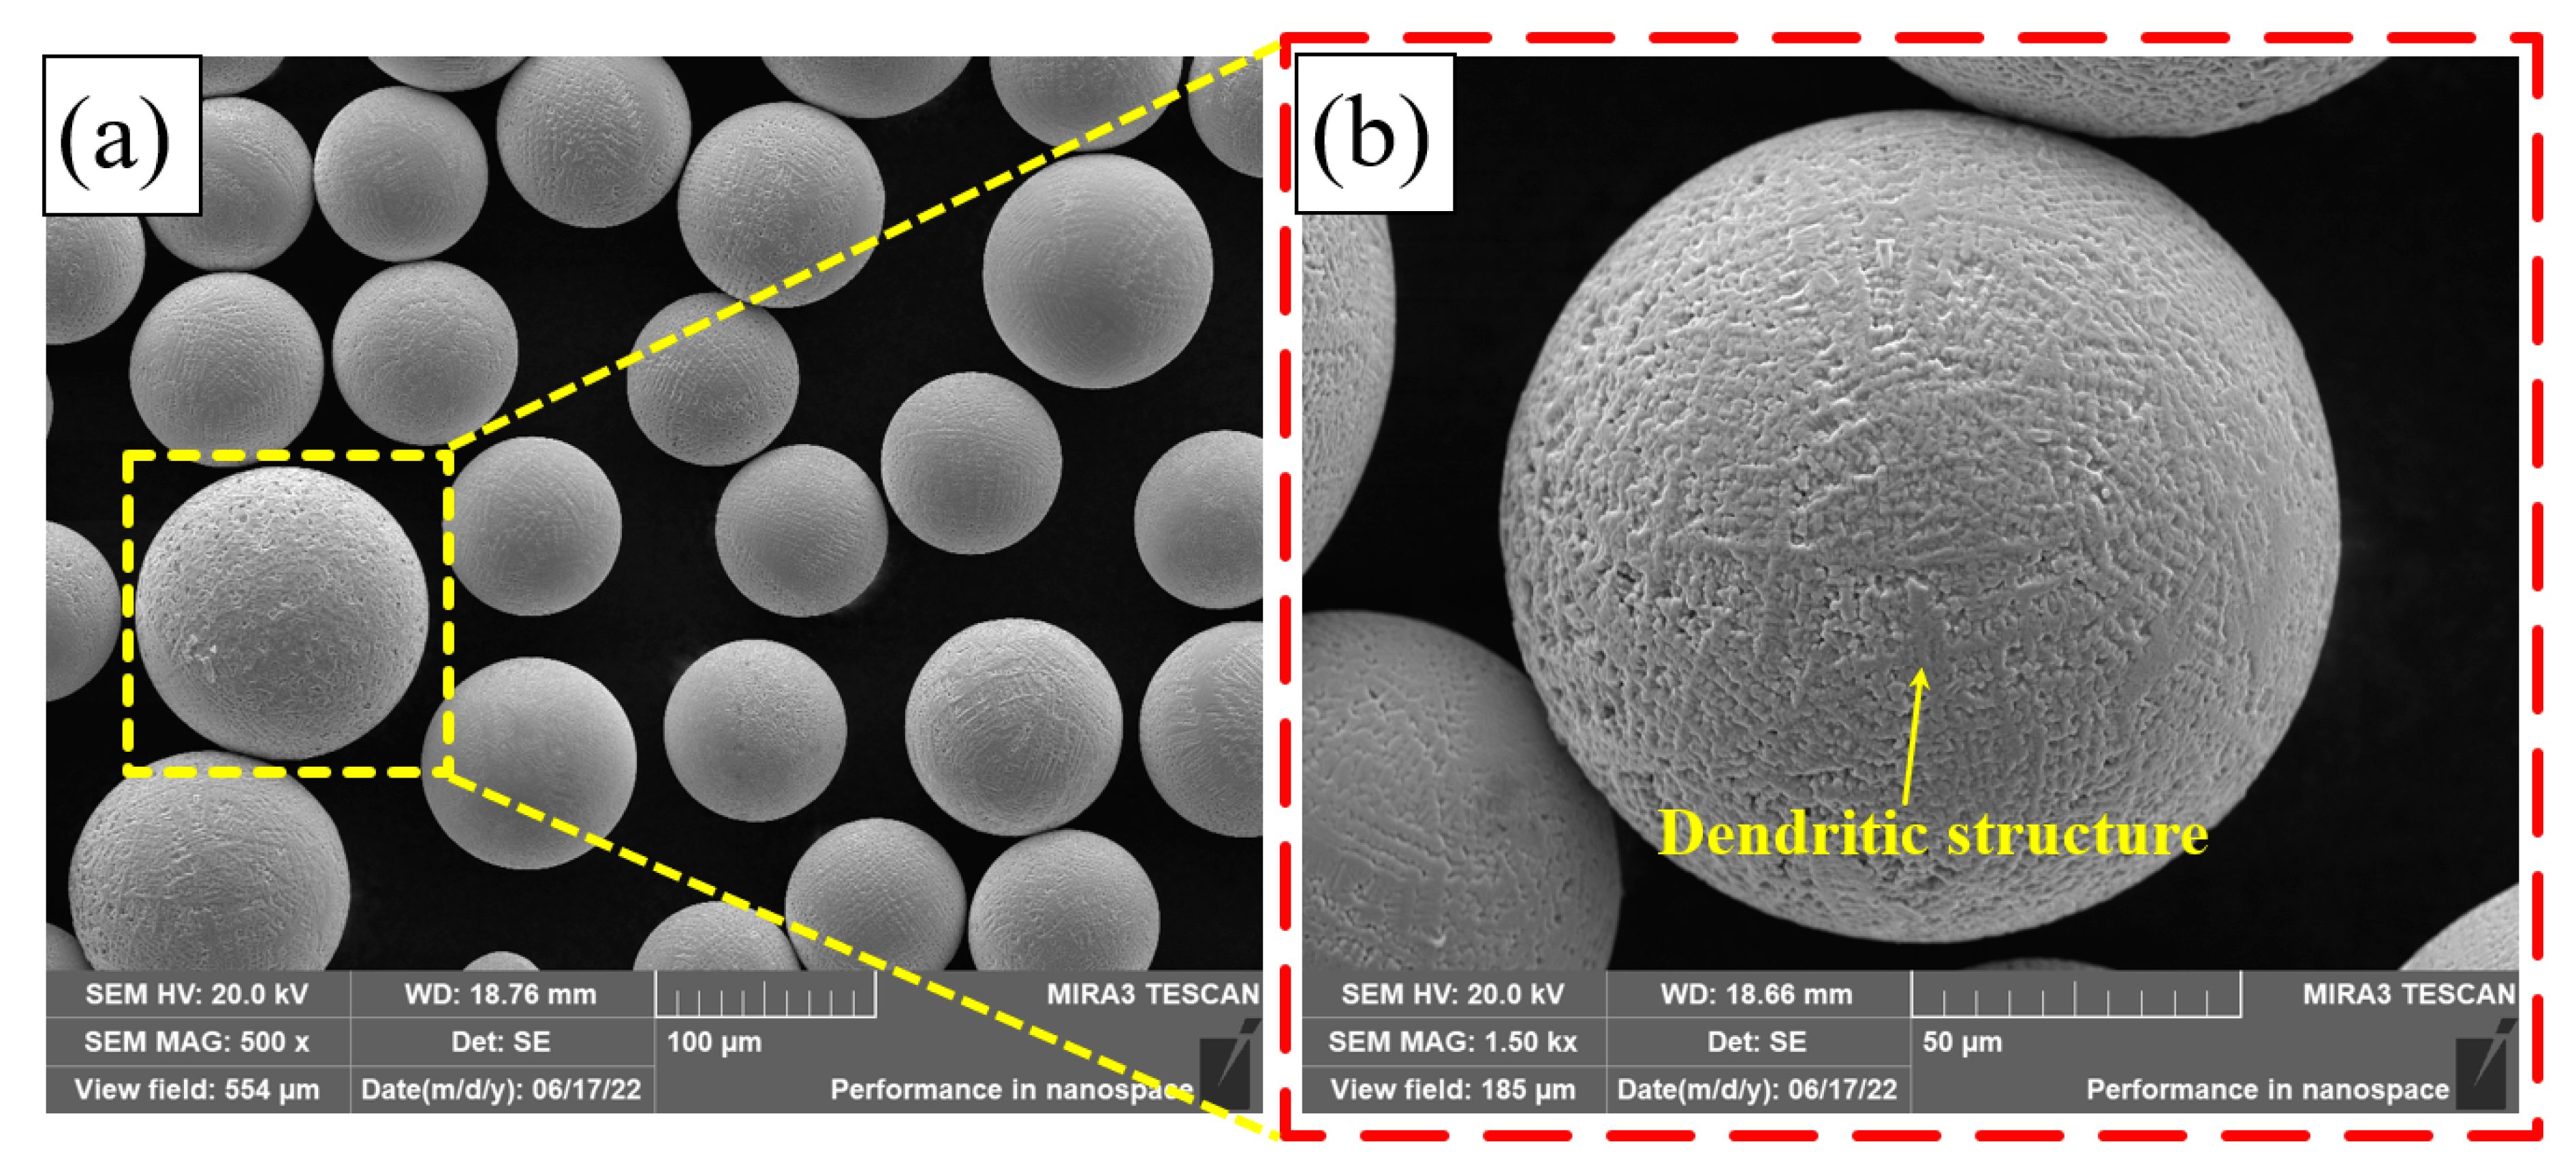
Figure 4 shows the micro-morphology of the Fe30Ni20Co20Cr20Mo3.5 HEA powder. It can be seen from Figure 4a that the powder presents a regular spherical shape. The surface of the powder is uneven, presenting an obvious dendritic structure, as shown in Figure 4b.
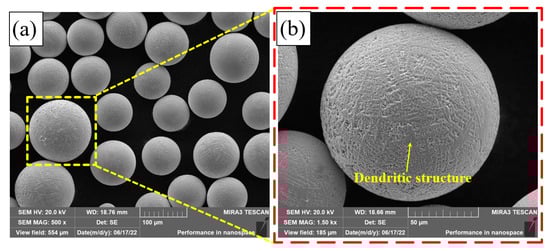
Figure 4.
SEM of the Fe30Ni20Co20Cr20Mo3.5 HEA powder: (a) 500×; (b) 1500×.
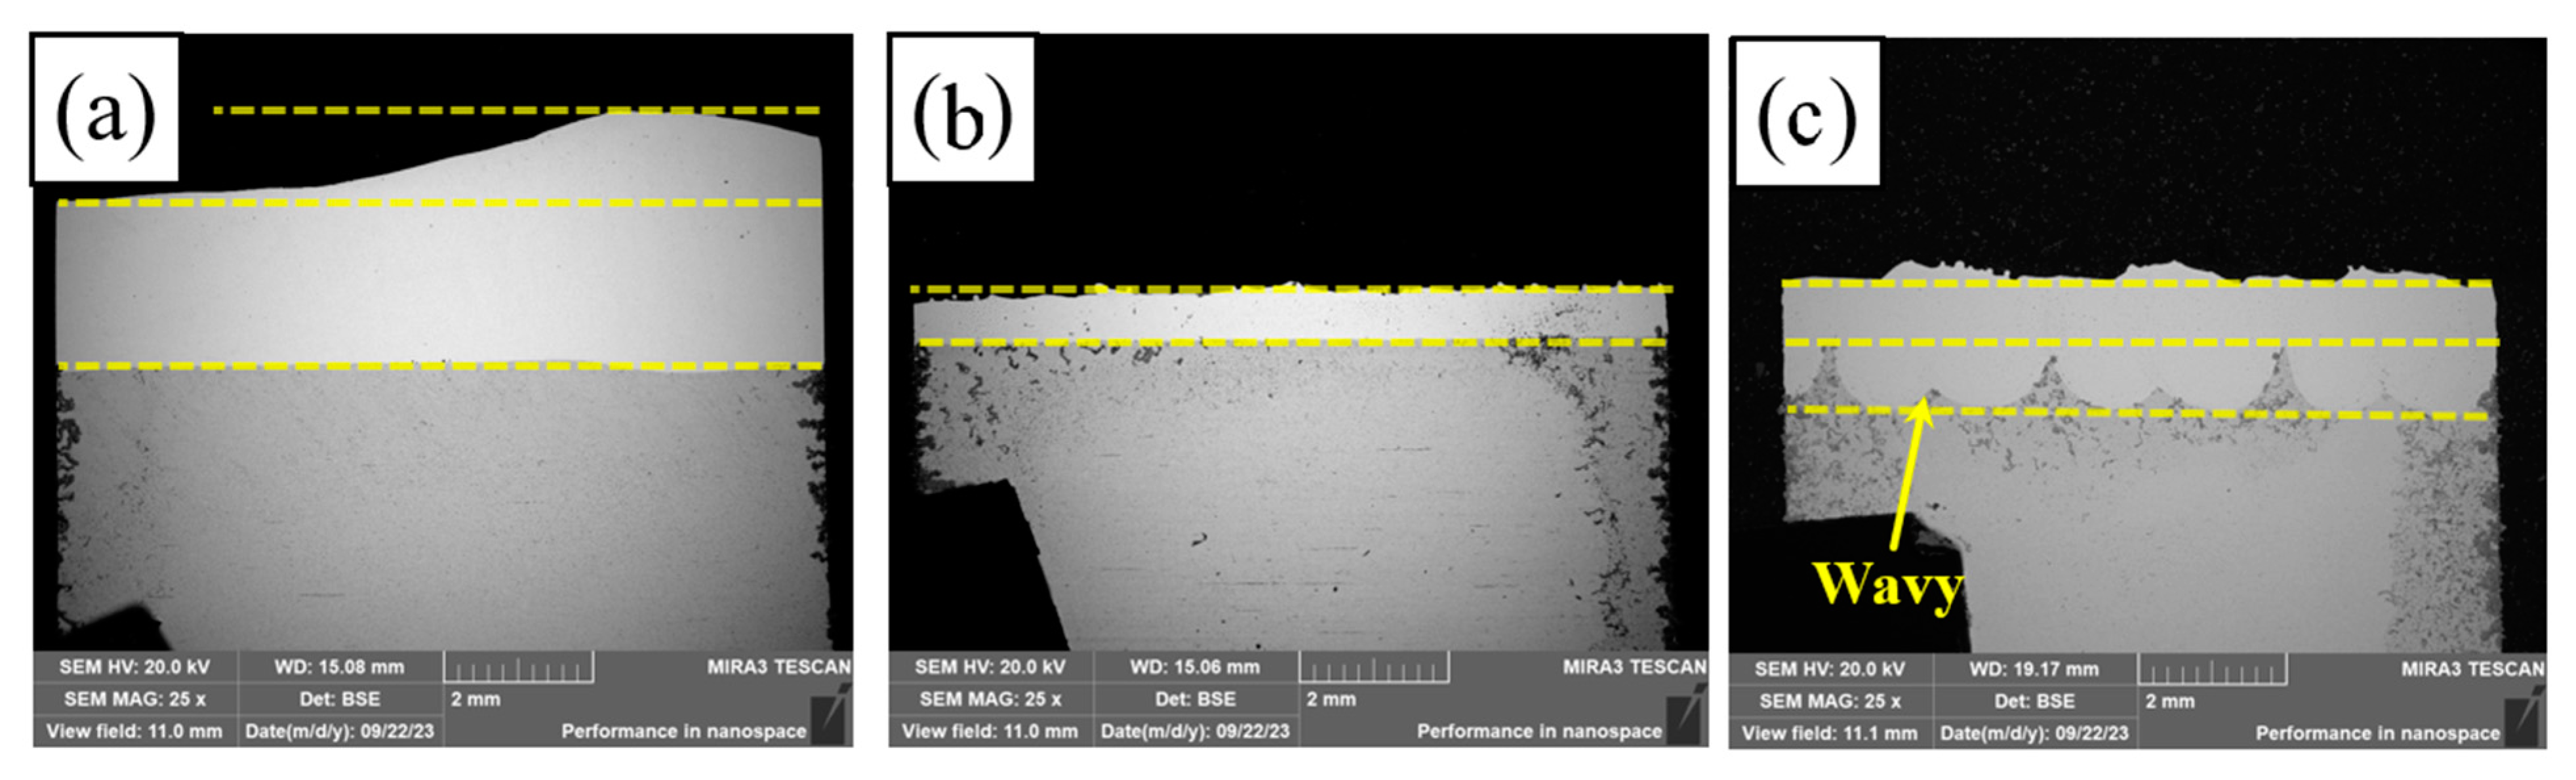
Figure 5 shows the macroscopic cross-sectional morphology of PC, HLC, and DLC, respectively. Figure 5a shows that the bottom of PC is relatively flat, with a small amount of melting of the base material. The coating thickness is 2.05–3.3 mm (obtained using a LAB-1 ZEISS Optical Microscope). The diameter of the plasma beam is about 10 mm. The powder melts quickly after flying out of the nozzle. The droplets accumulate and solidify quickly on the surface of the substrate. The bottom of HLC is extremely flat (Figure 5b). The coating thickness is 0.9–1.05 mm. The laser and powder are focused above the substrate. The molten droplets are sprayed quickly onto the surface of the substrate and form a flat and uniform coating. The substrate material undergoes a short laser radiation time and barely melts due to the high-speed movement of the cladding robot. The bottom of the DLC is wavy (Figure 5c). The coating thickness is 1–1.7 mm. The DLC cladding speed is slower than that of HLC. The surface of the substrate melts quickly. The molten droplets enter the molten pool and produce a metallurgical bond with the substrate.
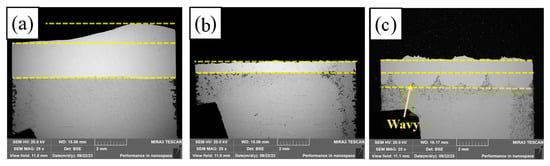
Figure 5.
Macroscopic cross-sectional morphology: (a) PC; (b) HLC; and (c) DLC.
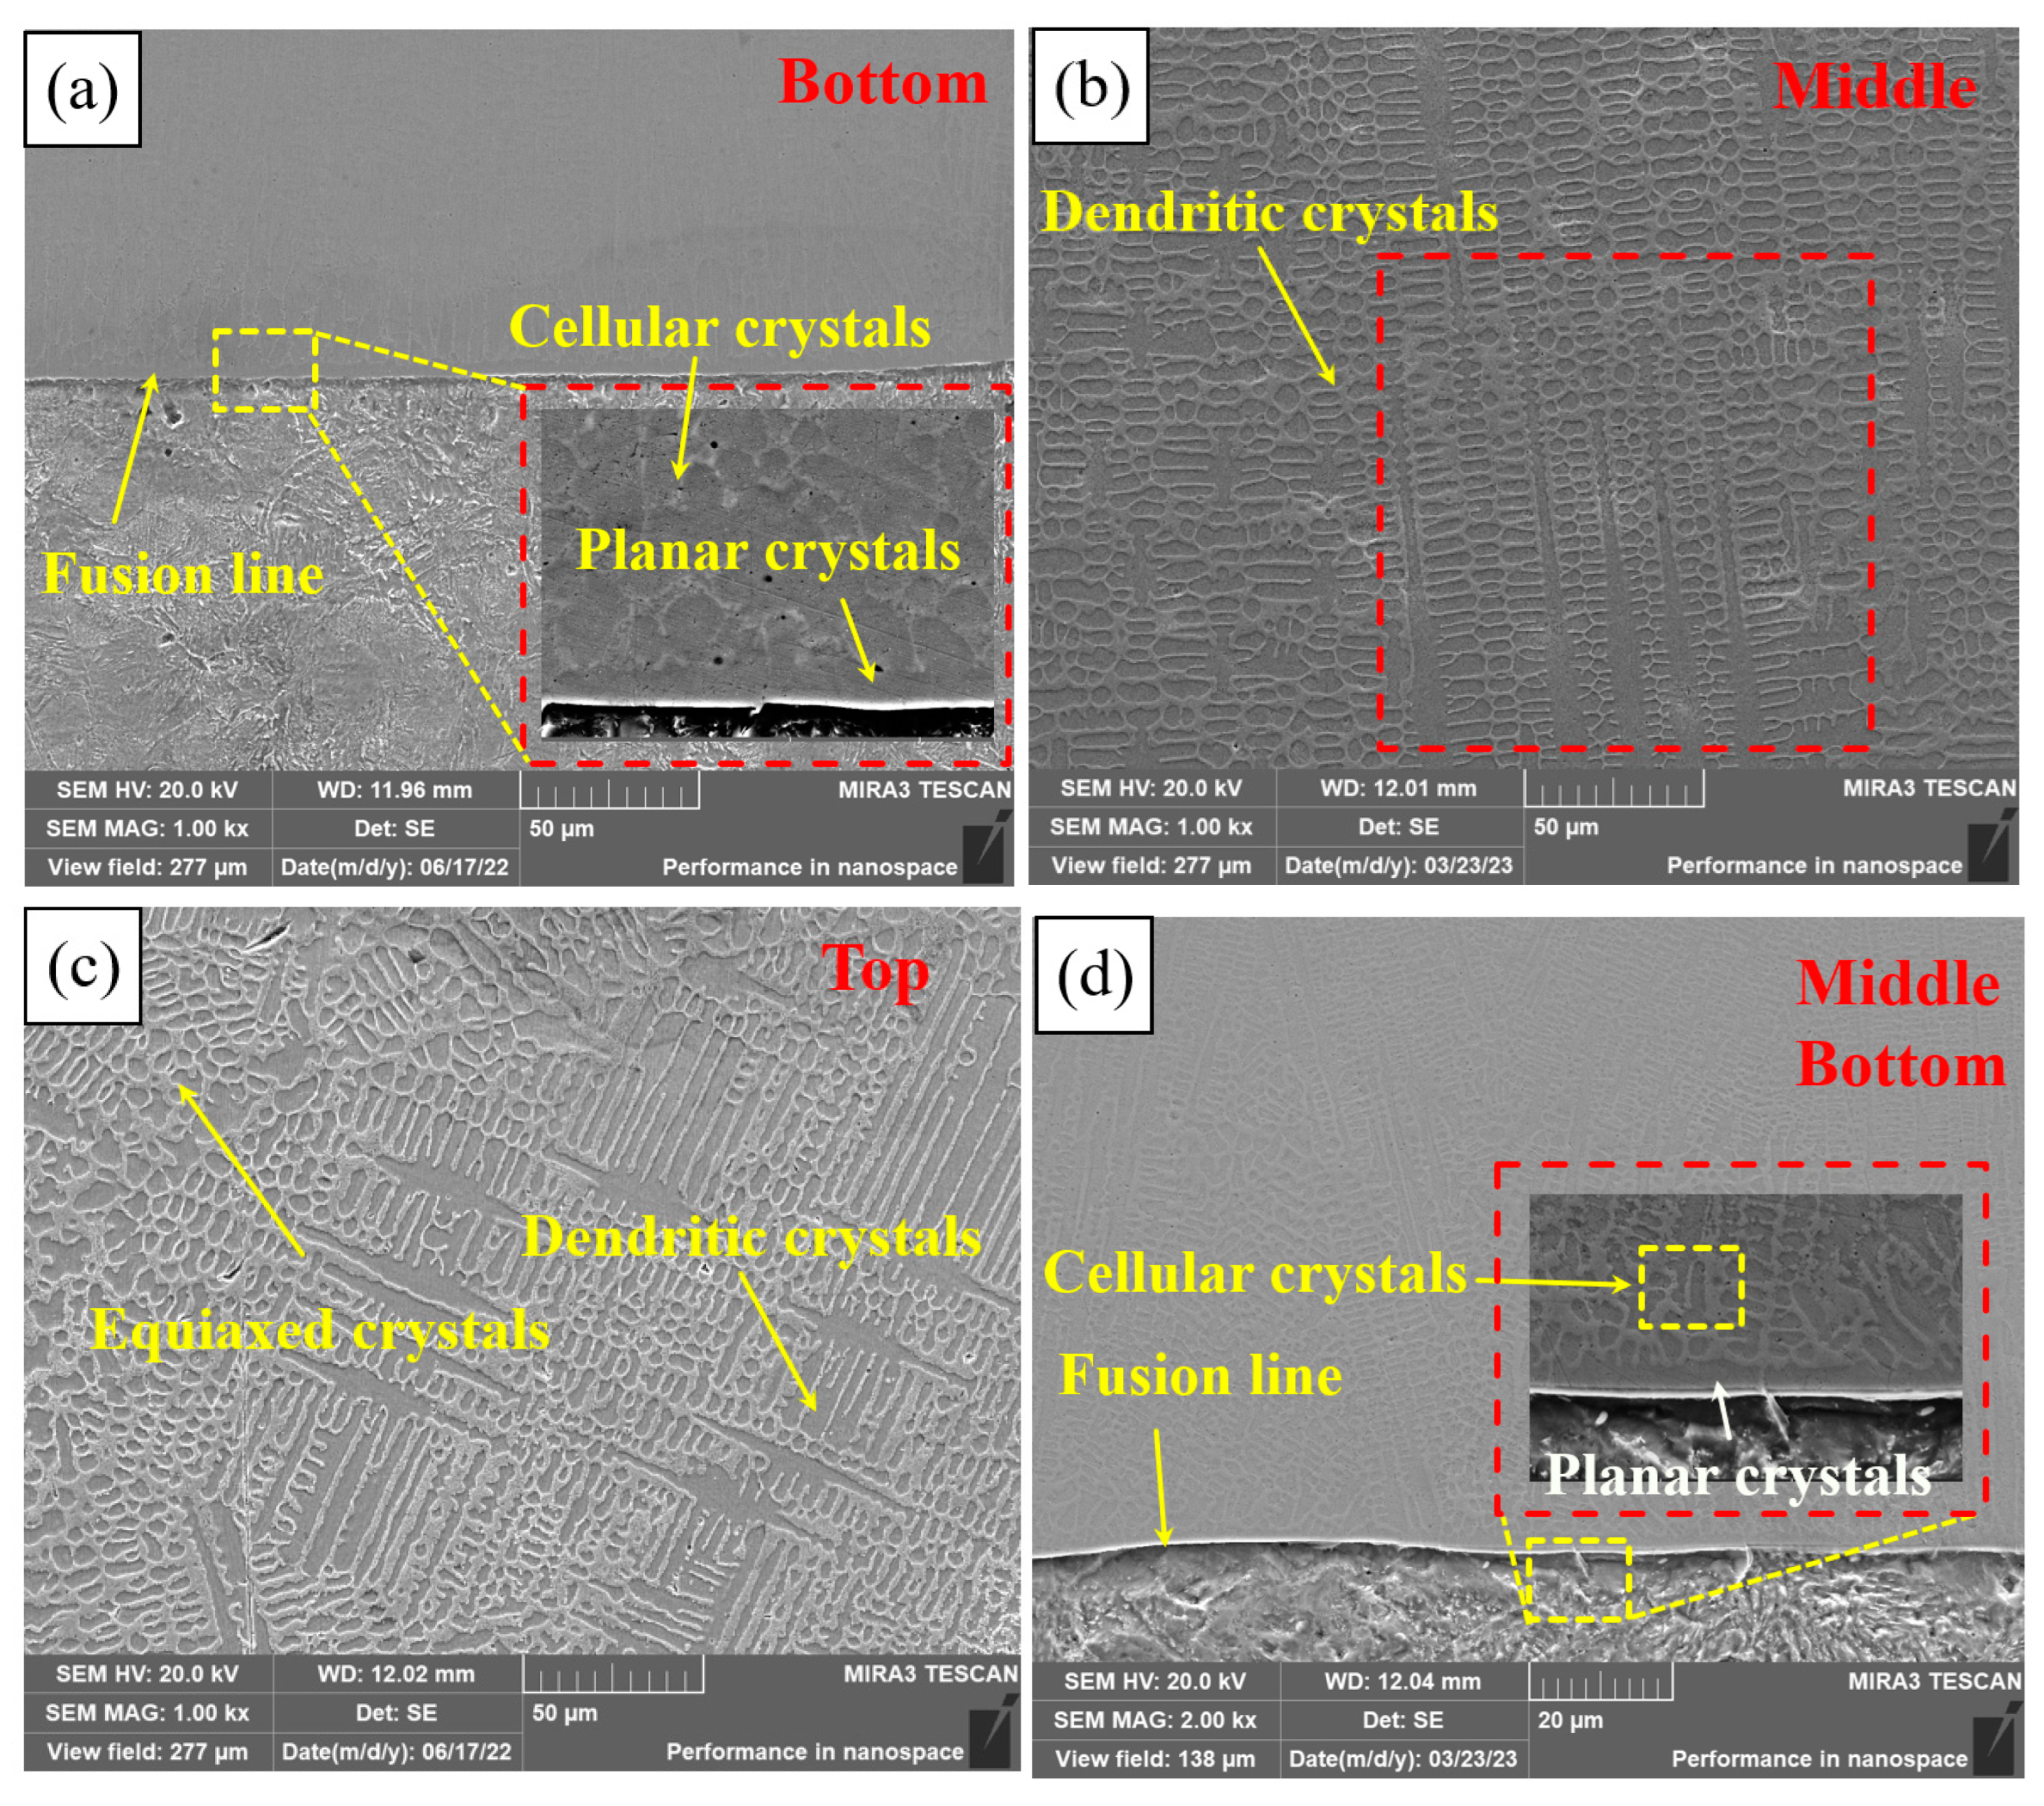
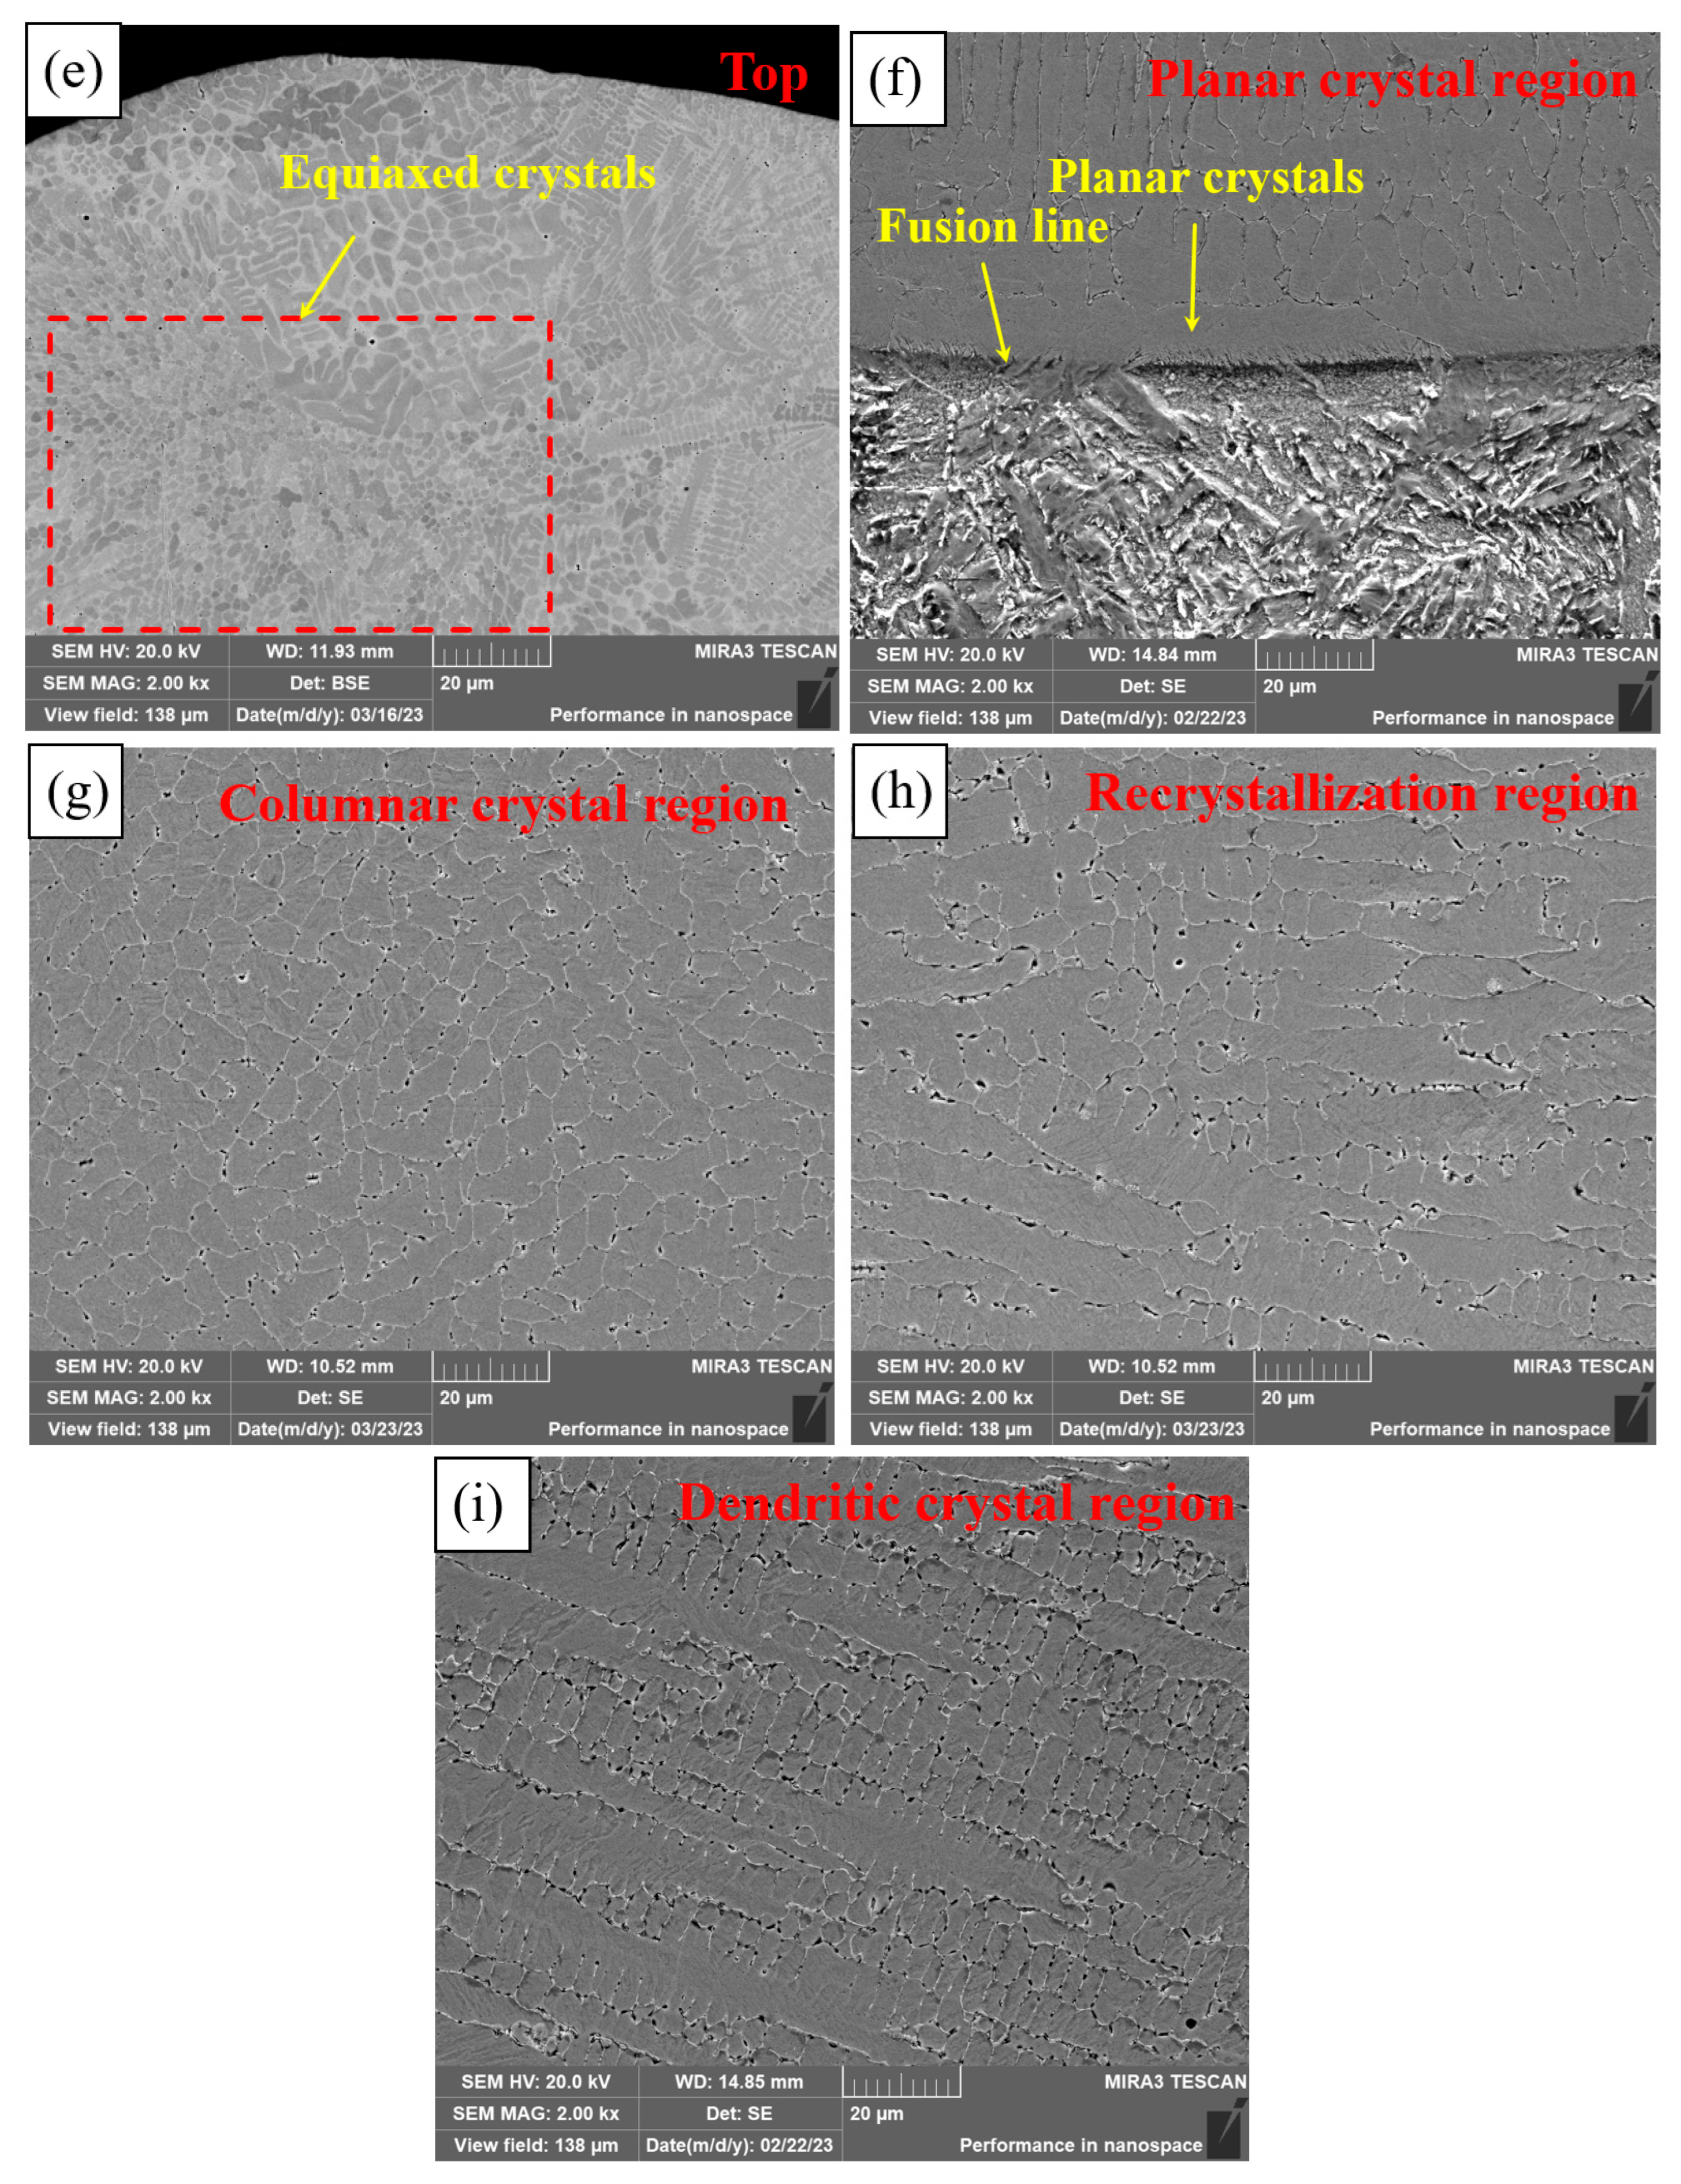
Figure 6 shows the microstructure of different regions of PC, HLC, and DLC. Planar crystals were observed near the fusion line in Figure 6a. PC is composed of cellular crystals, dendritic crystals, and equiaxed crystals, respectively, from the fusion line upward (Figure 6b,c). The microstructure of HLC is similar to that of PC. But the grain size of HLC is smaller (Figure 6d,e). DLC can be divided into a planar crystal region (Figure 6f), a columnar crystal region (Figure 6g), a recrystallization region (Figure 6h), and a dendritic crystal region (Figure 6i), based on the grain morphology and thermal field distribution during the cladding process. DLC has a finer grain boundary and larger grain size compared to HLC. A large number of irregular grains are distributed in the cladding feed direction in DLC (Figure 6h). Because in the overlapping region, dendrites were secondary crystallized at high temperatures during cladding. Crystal boundaries solidify before they are fully formed due to the short time of laser radiation.
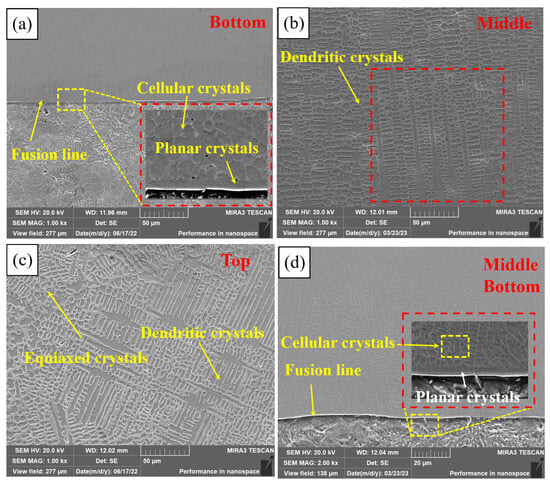
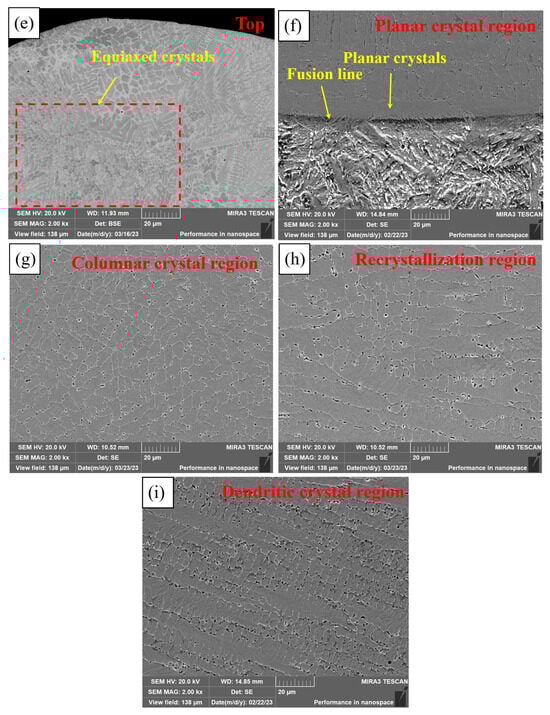
Figure 6.
Microscopic morphology of the three coatings: (a) bottom microstructure of PC; (b) middle microstructure of PC; (c) top microstructure of PC; (d) bottom and middle microstructure of HLC; (e) top microstructure of HLC; (f) bottom microstructure of DLC; (g) middle microstructure of DLC; (h) overlapping region microstructure of DLC; and (i) top microstructure of DLC.
The grain morphology is related to the G (temperature gradient) and V (solidification velocity) at the solid–liquid interface [26]. Due to the rapid heat dissipation of the substrate, the G at the fusion line is extremely large, while the V is extremely small, and there is almost no constitutional supercooling at the solid–liquid interface. The solid–liquid interface advances towards the interior of the coating at an extremely fast speed to form planar crystals. Subsequently, the G decreases and the V increases, resulting in constitutional supercooling at the front of the solid–liquid interface. Then, columnar and dendritic crystals grow on the planar crystals. The V is larger at the top of the coating. Nucleating particles are randomly generated in the liquid phase, resulting in uniformly distributed equiaxed crystals. The grain size depends on the cooling rate. High-speed laser cladding has the lowest overall heat input and the fastest cooling rate of the coating, so the grain size of HLC is slightly smaller than that of DLC and PC.
3.2. Crystal Structure and Composition Analysis
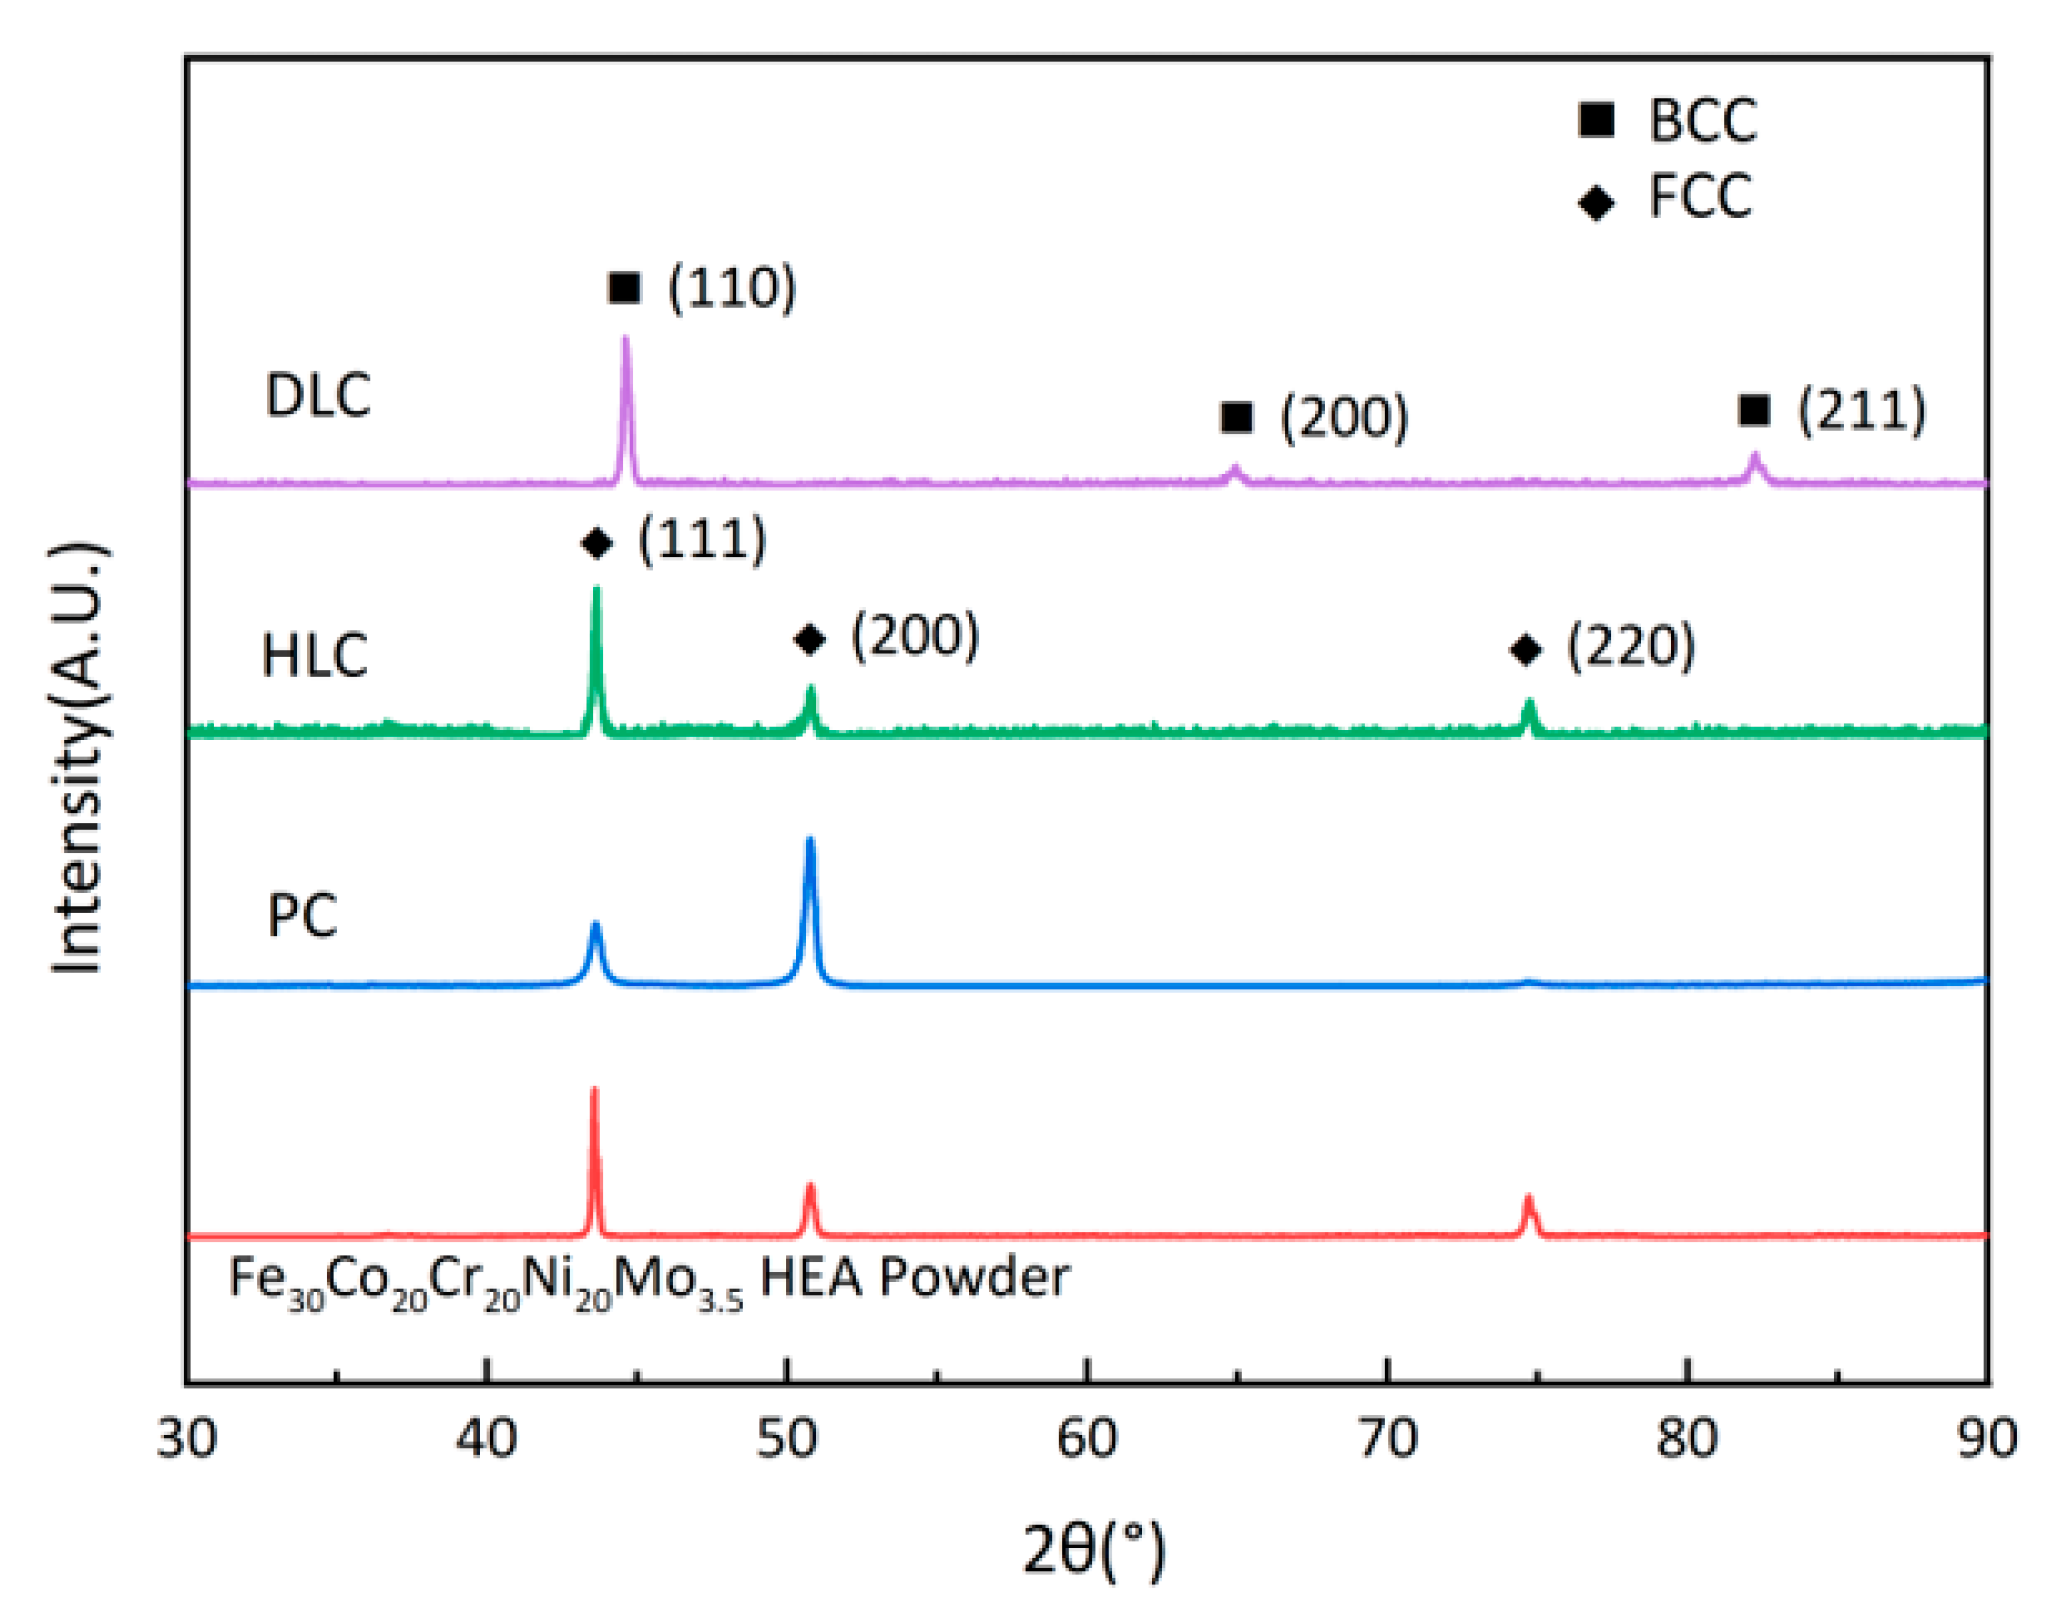
Figure 7 shows the XRD patterns of the Fe30Ni20Co20Cr20Mo3.5 HEA powder, PC, HLC, and DLC. The crystal structure of the powder, PC, and HLC is typical single face-centered cubic (FCC), while that of DLC is body-centered cubic (BCC). The ICDD reference code for the powder, PC, and HLC is #47-1417, and that for DLC is #37-0474. The diffraction peak height of HLC is consistent with that of the powder. The (111) and (200) diffraction peak heights of PC exhibit different behaviors. The reason is that the (200) crystal direction has a lower surface energy, and the grains tend to align in the (200) direction during high-energy cladding [27]. The complete change in the crystal structure of DLC may be related to the high dilution ratio of the coating. Therefore, it is necessary to further explore the microstructure of the three coatings using an EDS.
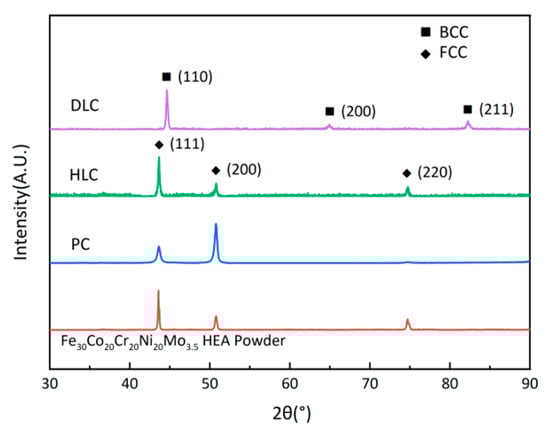
Figure 7.
XRD patterns of Fe30Ni20Co20Cr20Mo3.5 HEA powder, PC, HLC, and DLC.
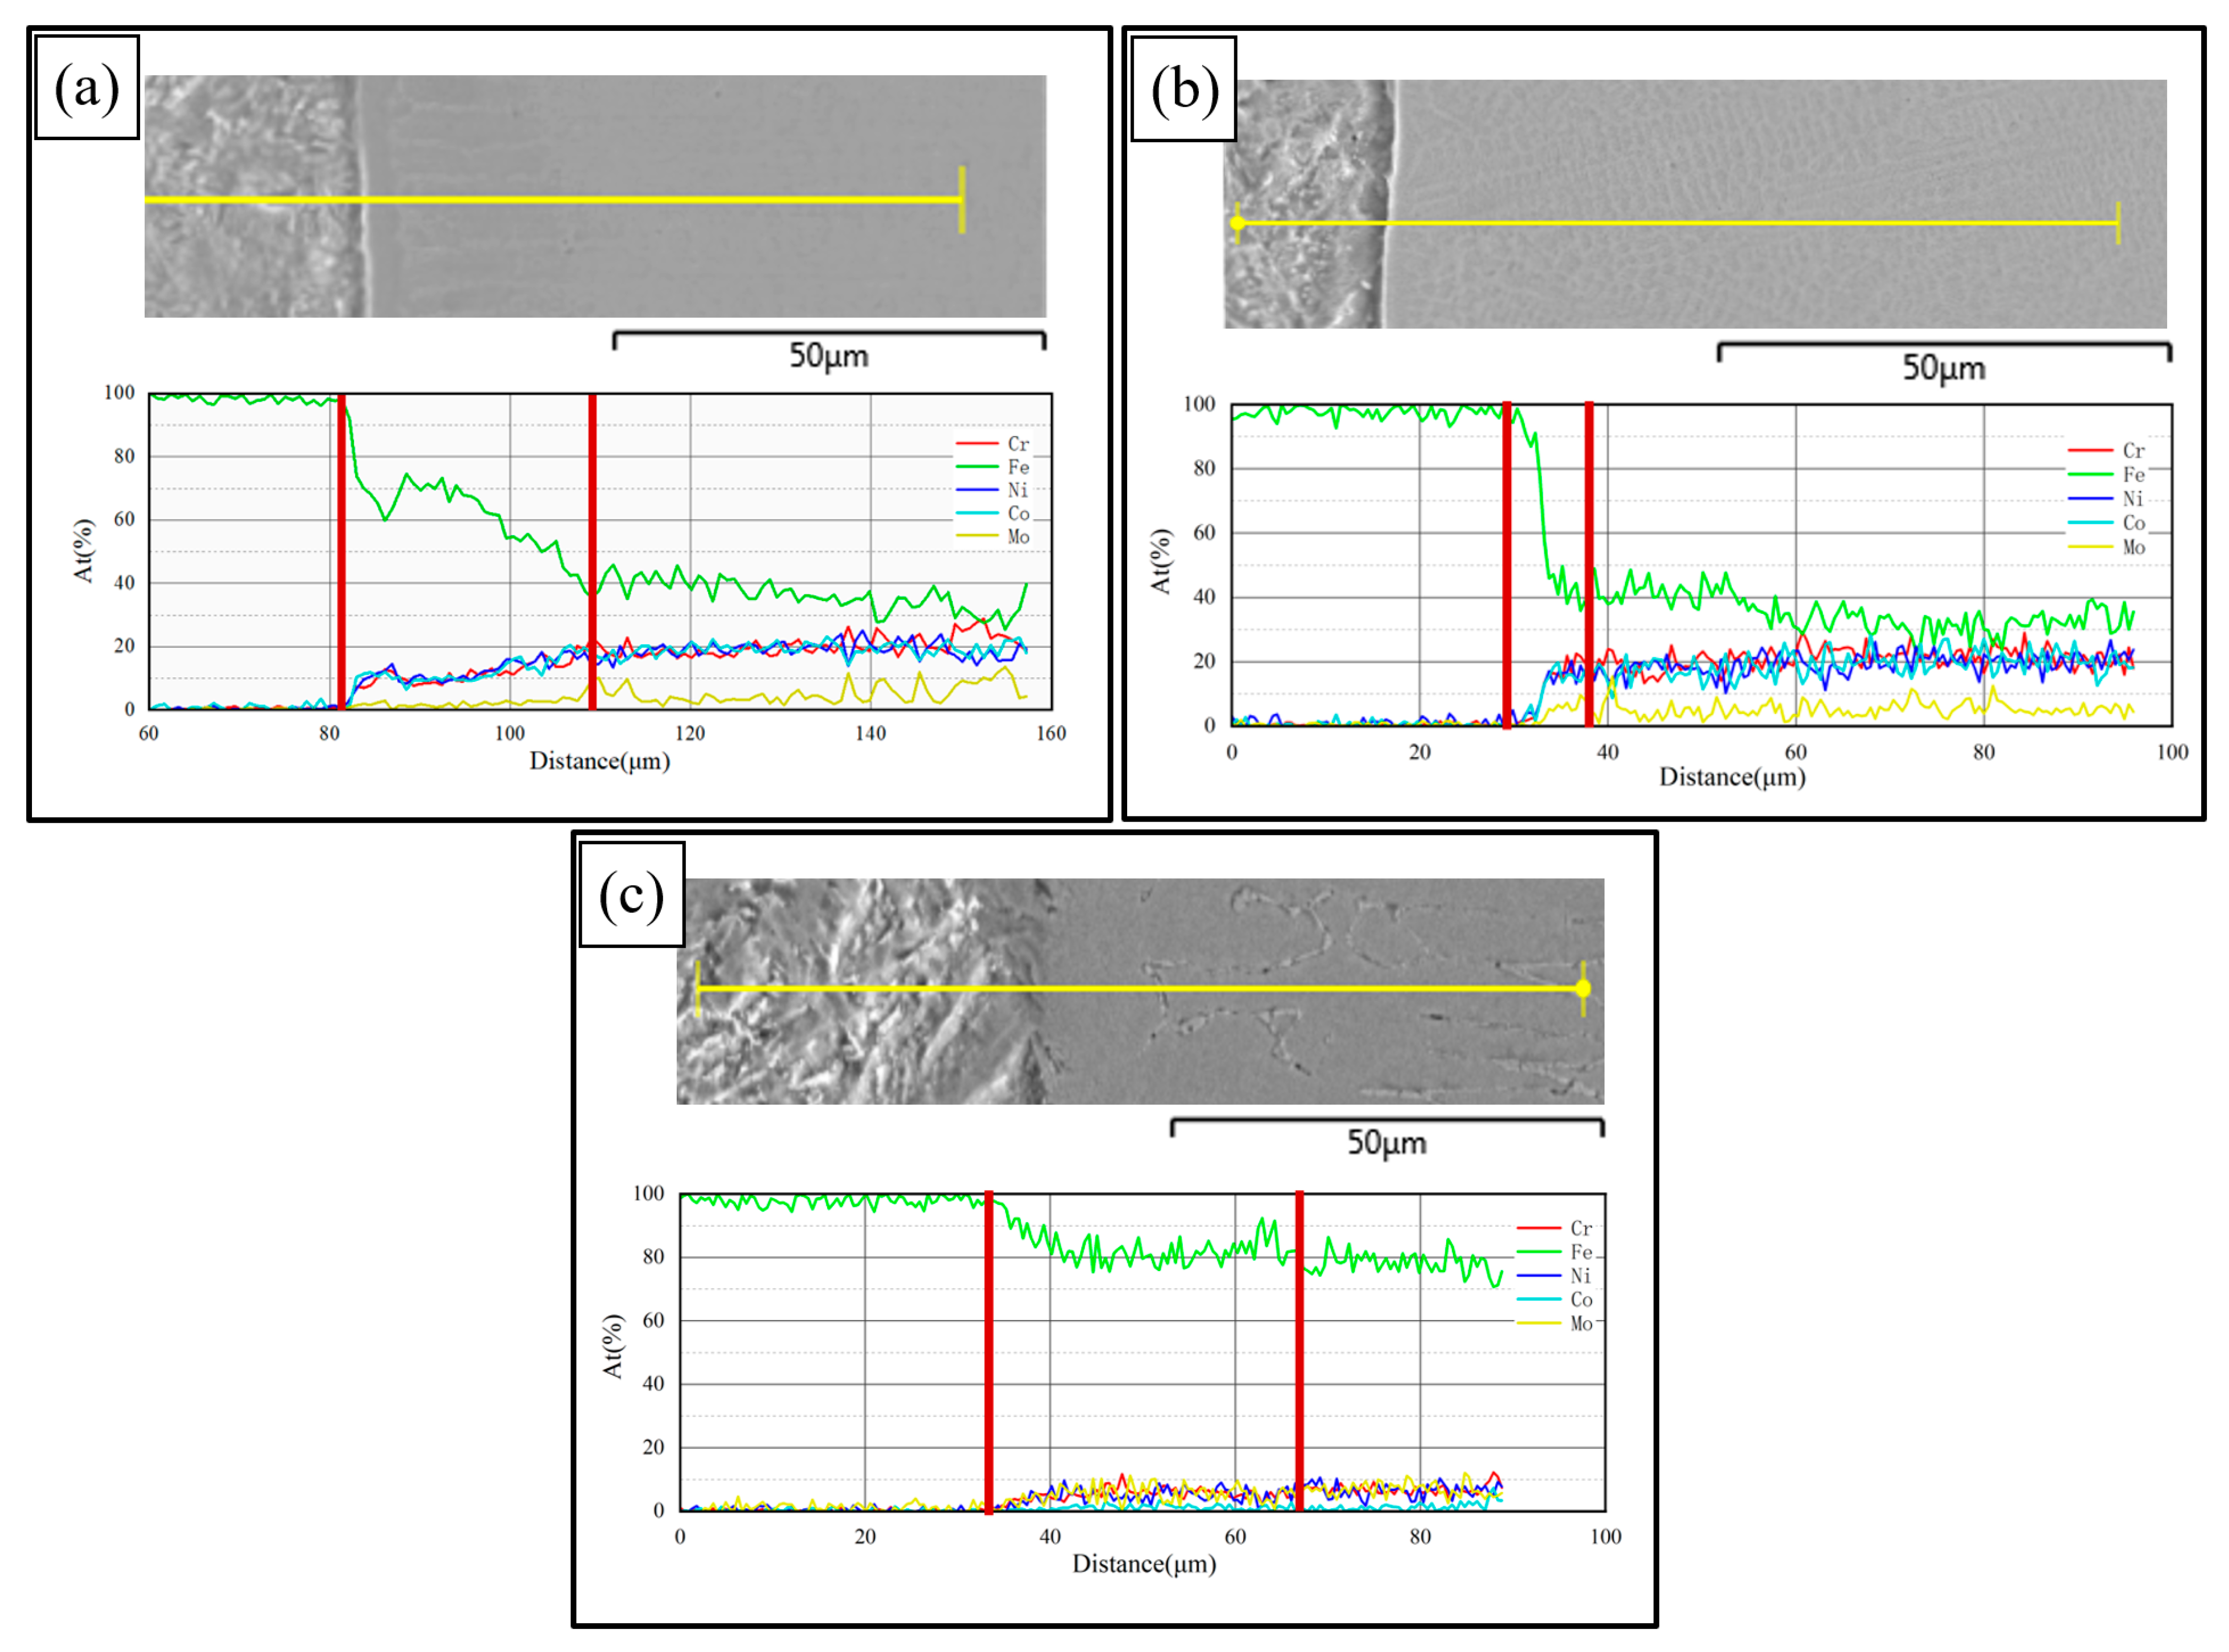
Figure 8 shows the line scanning results at the interfaces of PC, HLC, and DLC, respectively. Element diffusion occurs at the interfaces of the three coatings. The element diffusion region widths of PC, HLC, and DLC are 28 μm, 9 μm, and 31 μm, respectively. Therefore, the less the total heat input, the more difficult the element diffusion is. The element content of PC and HLC is the same as that of the Fe30Ni20Co20Cr20Mo3.5 HEA powder. The content of Fe in DLC is extremely high, around 70%. The element of the substrate material entered the coating, greatly diluting the element content of the coating. Meanwhile, the DLC cladding process has a large heat input, resulting in the slow cooling rate of the coating. With extremely high Fe content and a slow cooling rate, DLC tends to form an α-Fe phase. Therefore, DLC has a BCC crystal structure, which is confirmed by the results of the XRD.
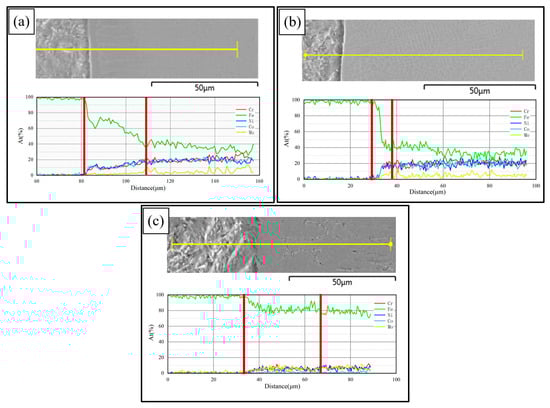
Figure 8.
Element line scanning results: (a) the interface of PC; (b) the interface of HLC; and (c) the interface of DLC.
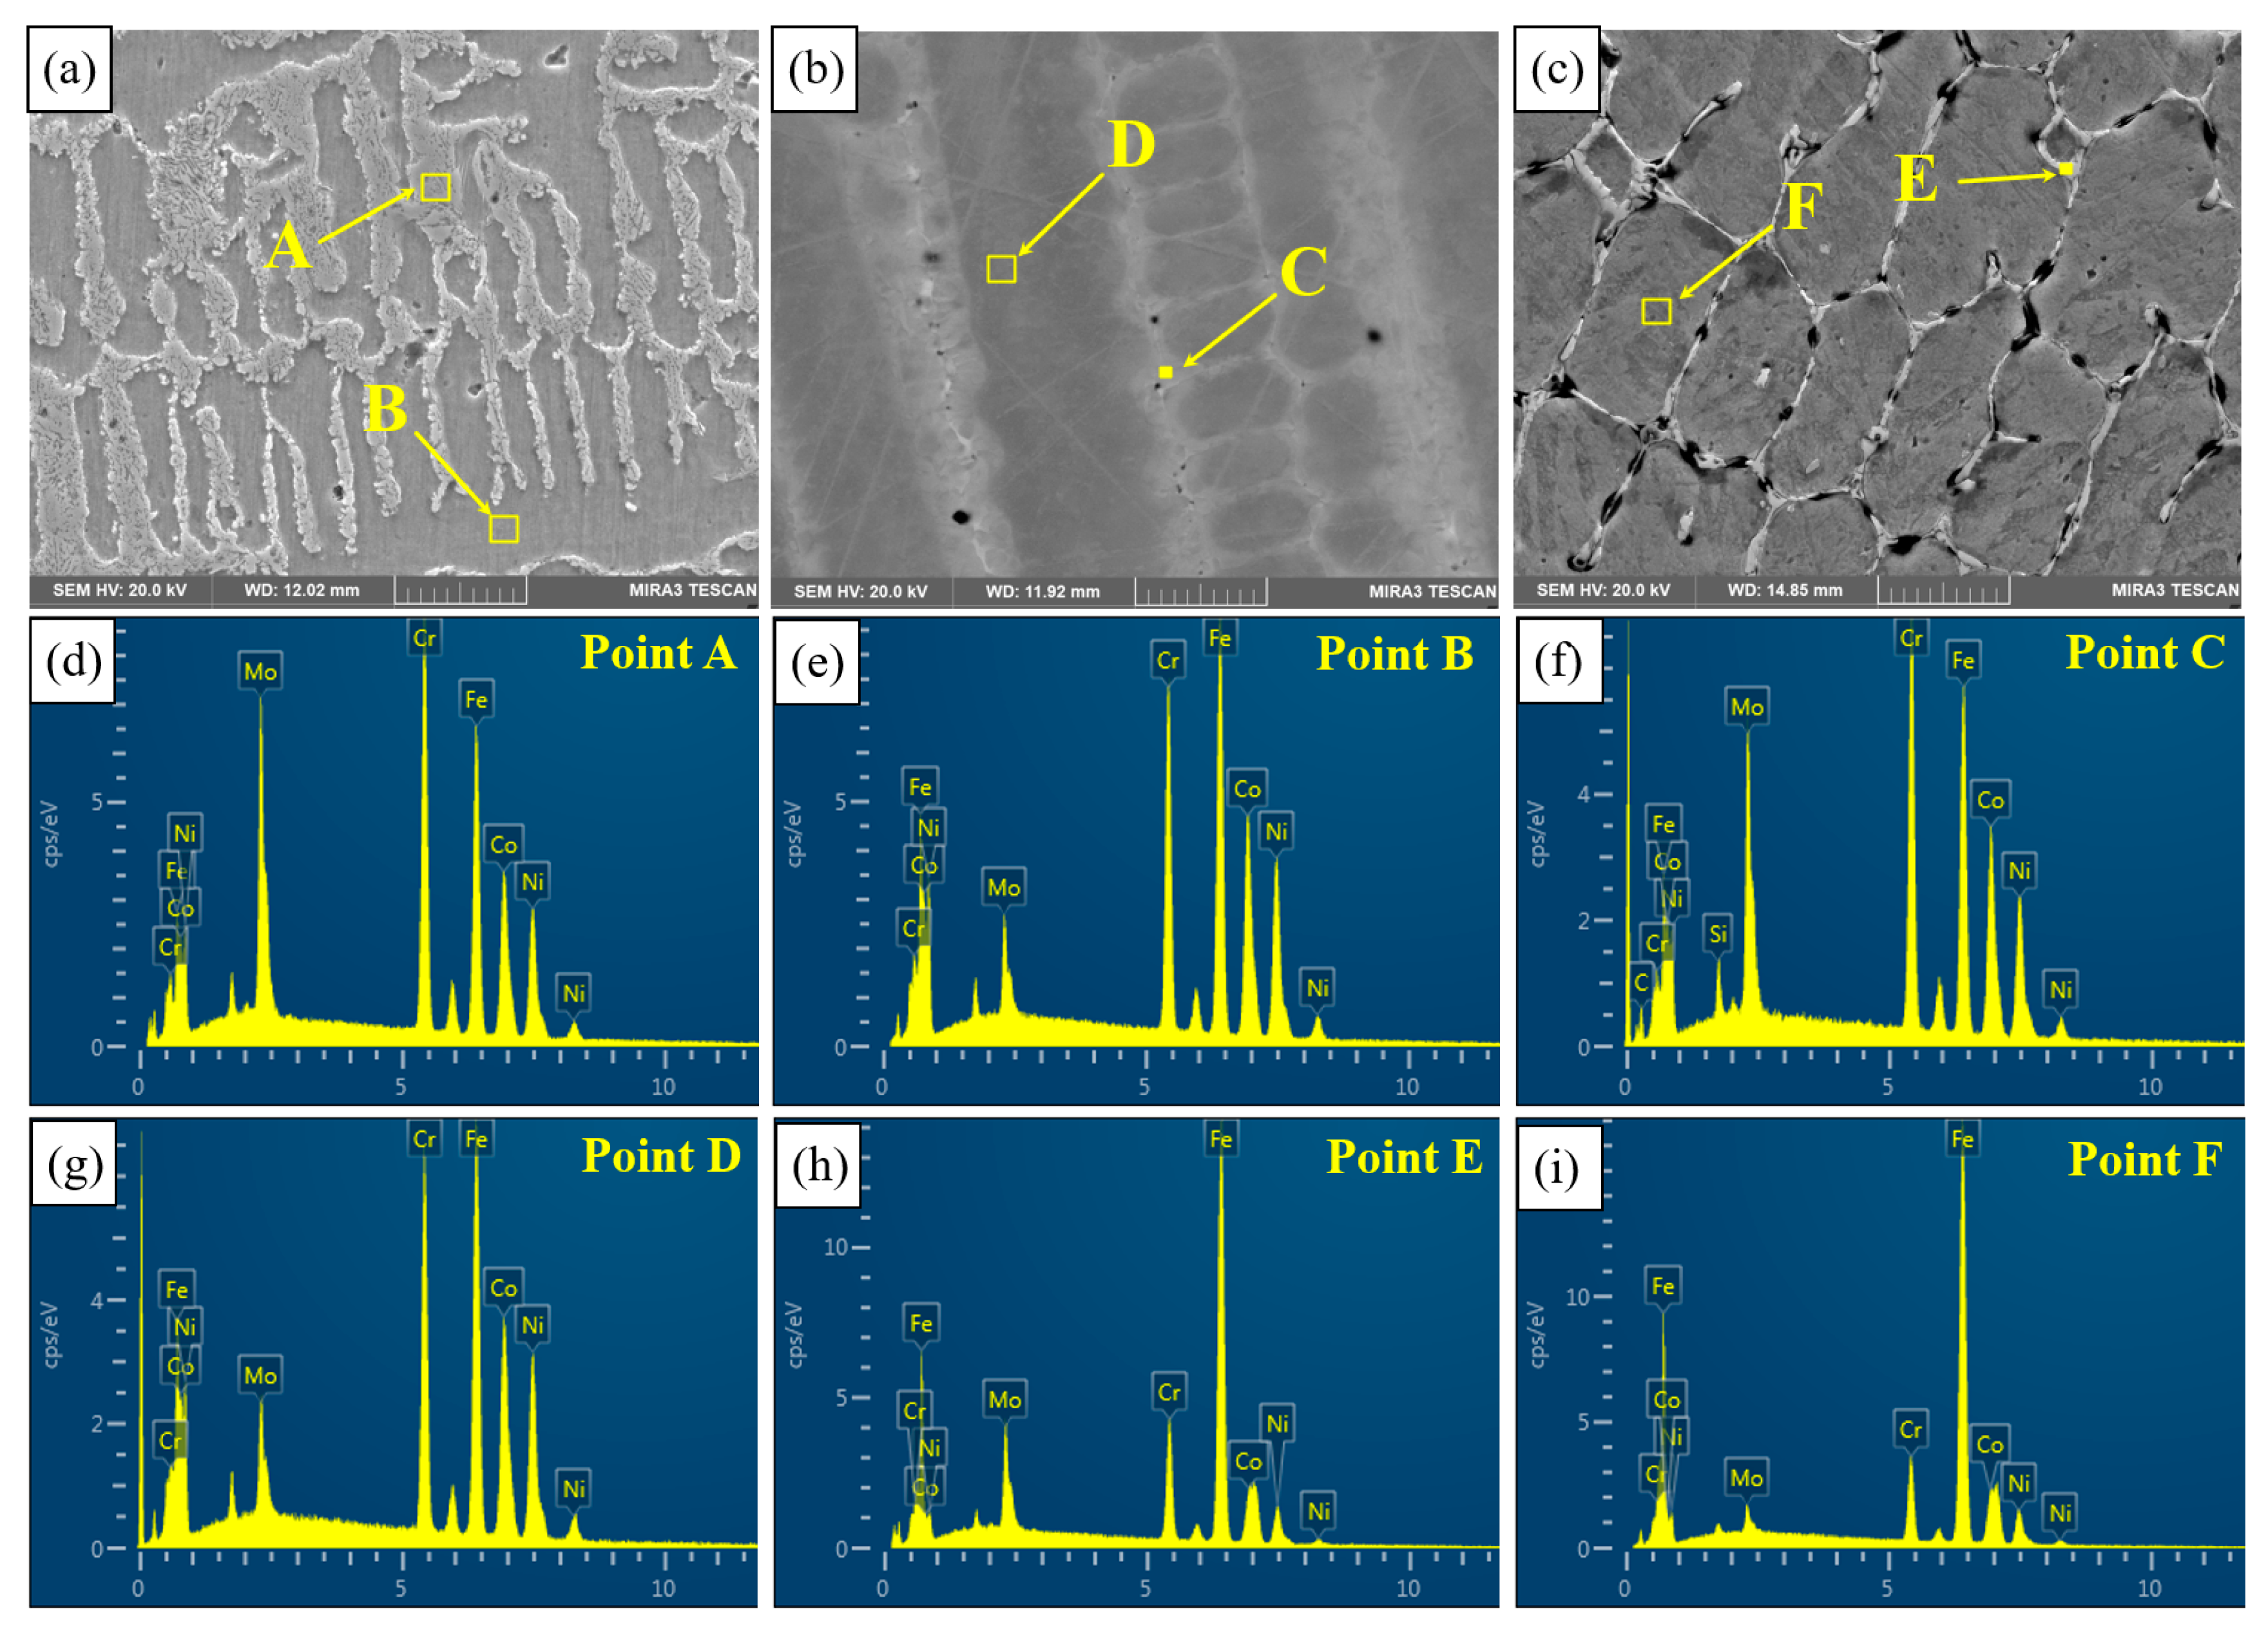
Figure 9 shows the microstructure of the three coatings. An EDS was used to detect the elemental distribution of PC (Figure 9a), HLC (Figure 9b), and DLC (Figure 9c). The EDS results are listed in Table 4. In the three coatings, the content of Cr and Mo elements is higher at the solidification boundary (region A, C, and E) than that in the grain (region B, D, and F). The melting points of the Mo and Cr elements are higher than those of the Fe, Co, and Ni elements, so Mo and Cr solidify first in the molten pool. As the solid–liquid interface advances, Mo and Cr aggregate at the grain boundaries. Therefore, the content of the Mo and Cr elements at the grain boundary is relatively high [22].
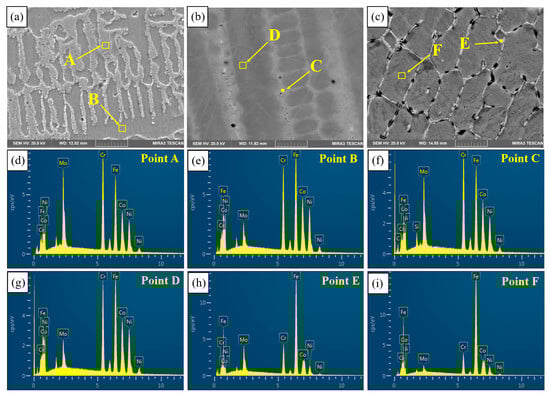
Figure 9.
Microstructure of the three coatings: (a) PC; (b) HLC; (c) DLC; and (d–i) EDS spectra of points A–F.
Table 4.
EDS results of the Fe30Ni20Co20Cr20Mo3.5 high entropy alloy coating (at.%).
3.3. Microhardness and Friction Properties
Figure 10a shows the microhardness of Q235, PC, HLC, and DLC. The average microhardness of Q235, PC, HLC, and DLC is 195 HV, 333 HV, 407 HV, and 408 HV, respectively. Compared to the substrate material, the microhardness of the coating increased by about 109%. The average hardness of the Fe30Ni20Co20Cr20Mo3.5 HEA is 170 HV higher than that of the CrMnFeCoNi HEA through plasma cladding [28]. The standard deviations of microhardness are 9.44 HV, 7.79 HV, 79.26 HV, and 19.83 HV, respectively. The microhardness of PC and HLC is relatively uniform, while DLC exhibits a stepped distribution. The microhardness of HLC is higher than that of PC due to its lower heat input. The solidification speed of the droplets is extremely fast. There is enormous thermal stress inside the coating. At the same time, the SEM of the coatings shows that the grain size of HLC is significantly smaller than that of PC. Therefore, the resistance to dislocation movement during plastic deformation increases, and the microhardness of HLC also increases accordingly. The microhardness of DLC is extremely high at the fusion line. The reason may be that the cooling rate near the fusion line is very fast, resulting in high thermal stress, which increases the microhardness. From the fusion line to the top of DLC, the cooling speed of the molten pool decreases. Therefore, the hardness of the coating gradually decreases and ultimately presents a stepped distribution.
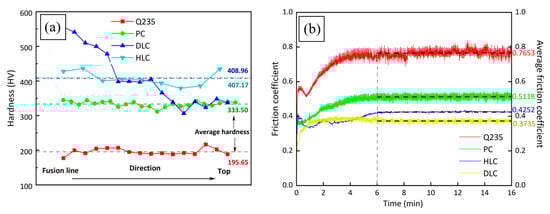
Figure 10.
Mechanical properties of Q235, PC, HLC, and DLC: (a) microhardness curves; (b) friction coefficient curves.
Figure 10b shows the friction coefficient curves of Q235, PC, HLC, and DLC. The four friction coefficient curves all stabilized after 6 min. The friction coefficient curves of the three coatings do not fluctuate sharply, indicating that the Fe30Ni20Co20Cr20Mo3.5 HEA has extremely stable friction and wear resistance. The average friction coefficients for Q235, PC, HLC, and DLC are 0.7653, 0.5118, 0.4252, and 0.3735, respectively, within 6–16 min. The friction coefficient was reduced by more than half compared to Q235. According to the microhardness curve and XRD results, the friction coefficient of the coatings is related to the microhardness and crystal structure. The higher the microhardness of the material, the smaller the average friction coefficient.
The friction coefficient of the grinding ball sliding on the friction surface is μ. It can be calculated by the following equation:
where l/2 and r are the groove radius and abrasive particle radius, respectively. If the ratio of the groove radius to the abrasive particle radius (l/2r) is replaced by A, Equation (1) can be expressed as:
where A is a characterization of the grinding ball penetration depth. The deeper the grinding ball is pressed, the higher the value of A, and the larger the coefficient of friction. The grinding ball is pressed shallowly due to the high microhardness of DLC and HLC. Therefore, the average friction coefficients of DLC and HLC are relatively lower. In addition, the friction and wear resistance of the BCC crystal structure is superior to that of the FCC crystal structure [29]. Therefore, the average friction coefficient of DLC is lower than that of HLC.
According to the width of the wear track, the depth of the wear track can be calculated from Equation (3):
The volume of material wear can be calculated from Equation (4) [18]:
where R is the wear track radius, L is the wear track width, and r is the grinding ball radius. The wear track depths and wear volumes are recorded in Table 5. The wear volumes of Q235, PC, HLC, and DLC are 0.0682, 0.0418, 0.0268, and 0.0245 mm3, respectively. The results show that DLC has the best friction and wear resistance.
Table 5.
Measurement results of wear track.
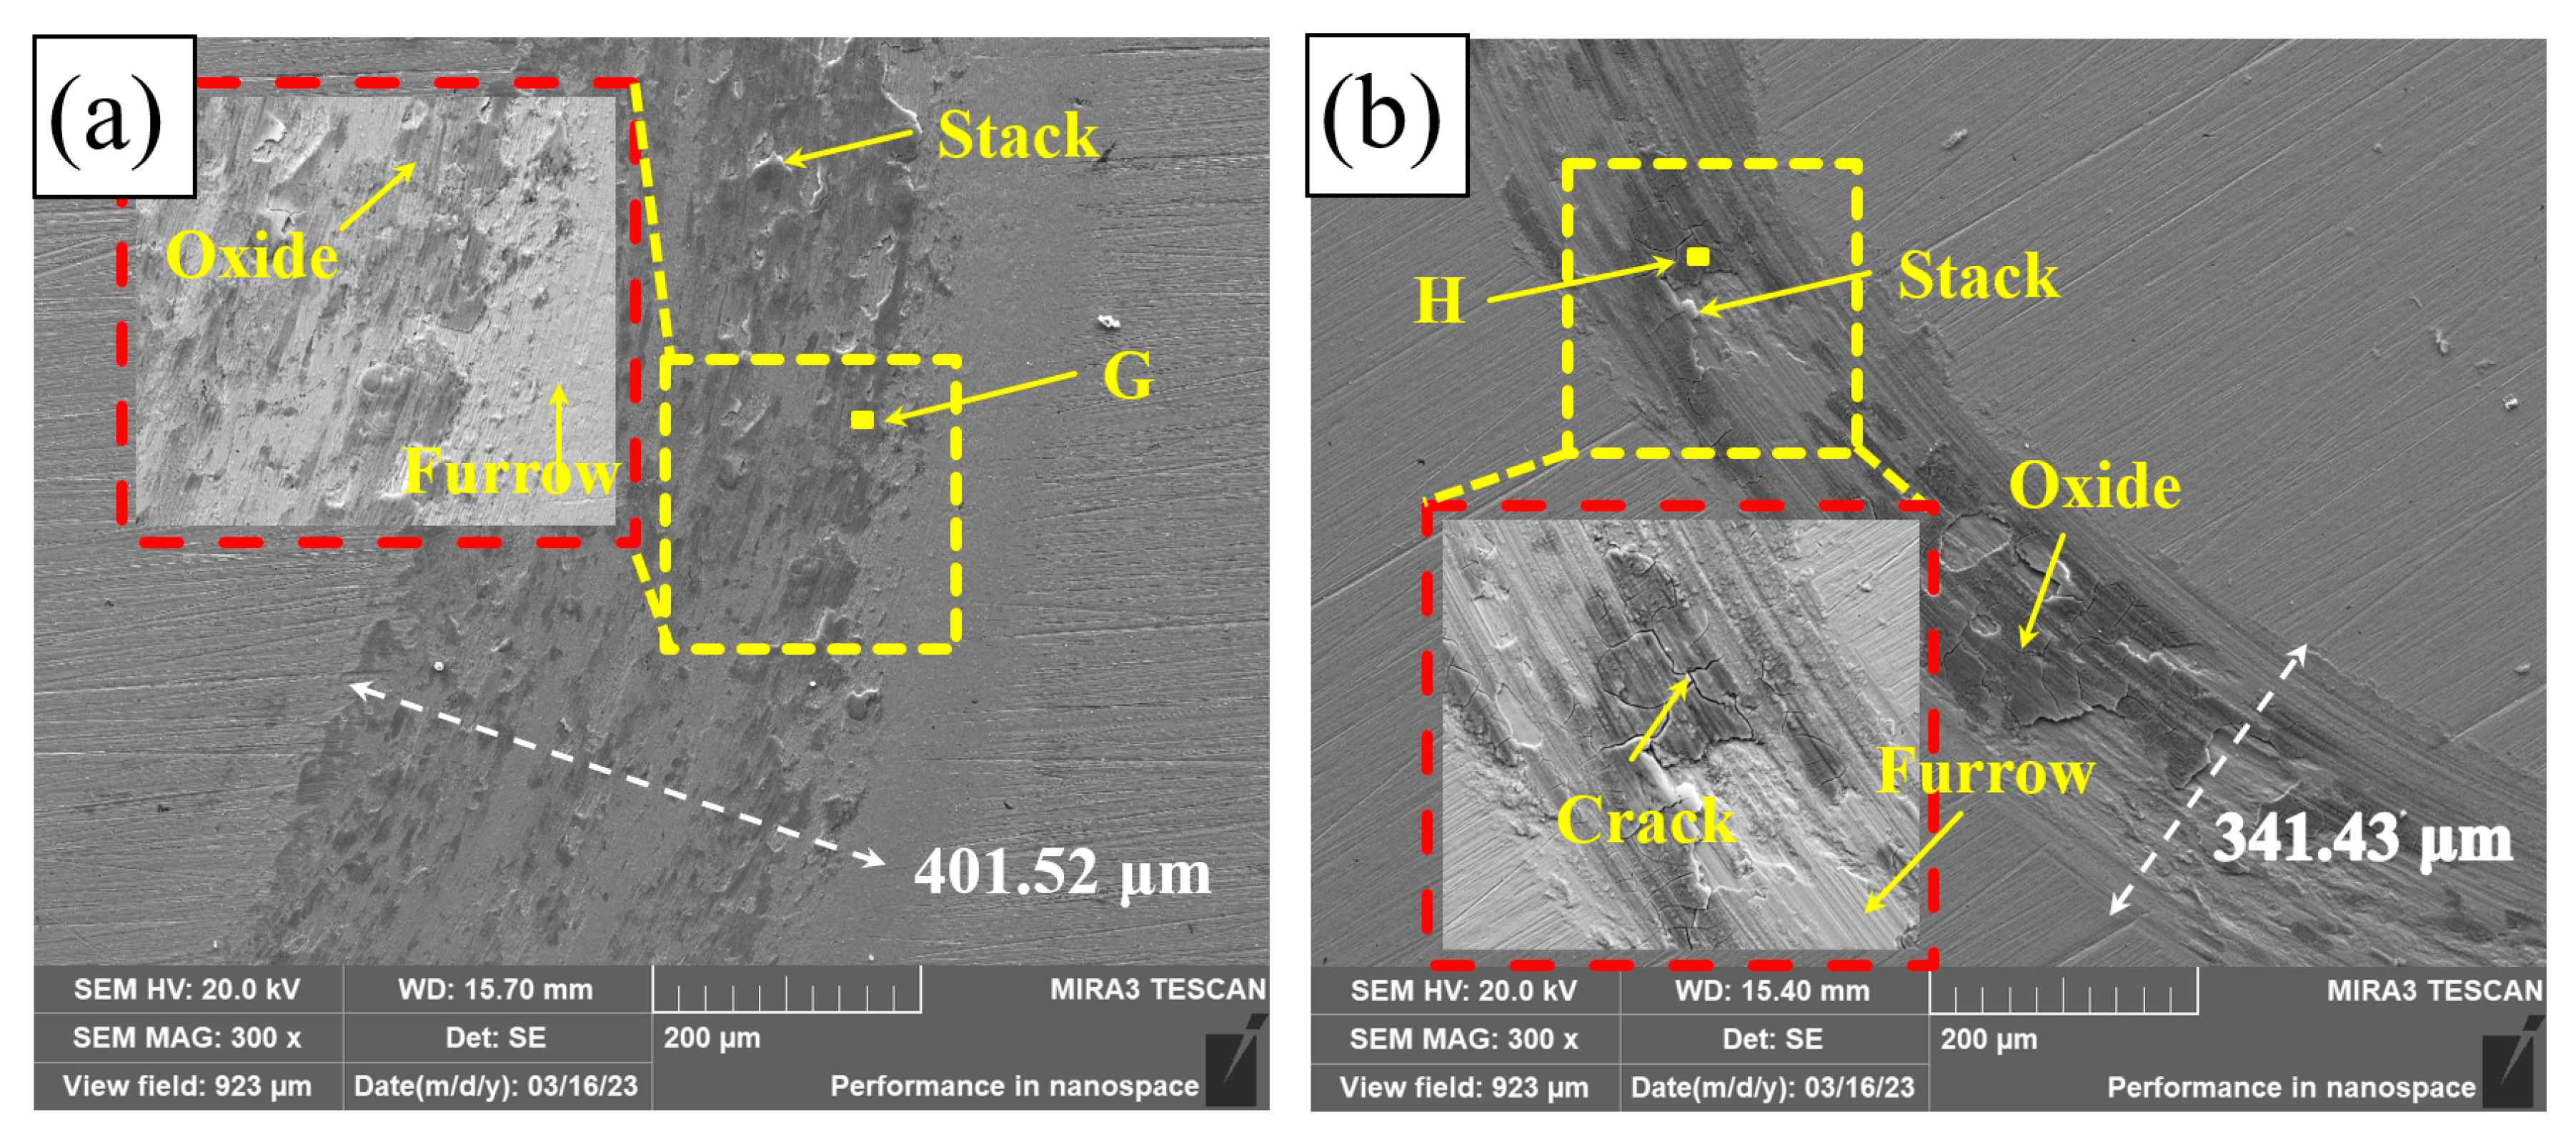
Figure 11 shows the wear tracks of Q235, PC, HLC, and DLC. There is a great number of furrows on the wear tracks of Q235, PC, HLC, and DLC. This indicates that some hard phases fall off during friction, resulting in abrasive wear. The wear track surfaces of Q235, HLC, and DLC are uneven, resulting in adhesive wear. High temperature caused by high-speed friction leads to welding and tearing. Cracks were generated and expanded under the cyclic load. Large areas of black phases and cracks were observed on the wear tracks of PC, HLC, and DLC. The EDS results in Table 6 show that the black phase on the wear track of Q235 is oxide of Fe. Therefore, oxidation wear occurred on Q235 and the three coatings during friction. Although the microhardness of HLC and DLC is similar, the average friction coefficient of DLC is lower than that of HLC. The wear track surface of DLC in Figure 11d is smoother than that of HLC in Figure 11c. The reason is that there are many cracks and stacks on the wear track surface of HLC, which increases the friction force on the grinding ball.
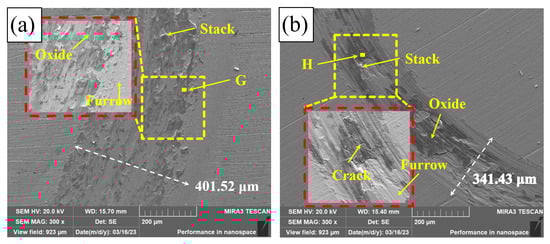
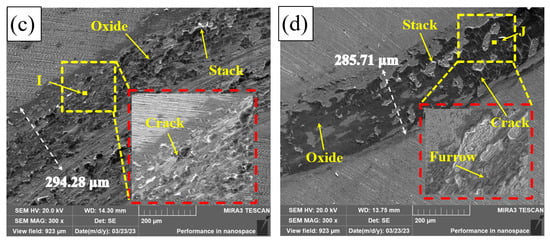
Figure 11.
Friction tracks: (a) Q235; (b) PC; (c) HLC; and (d) DLC.
Table 6.
EDS results of the Fe30Ni20Co20Cr20Mo3.5 high entropy alloy coating on wear tracks (at.%).
3.4. Corrosion Resistance
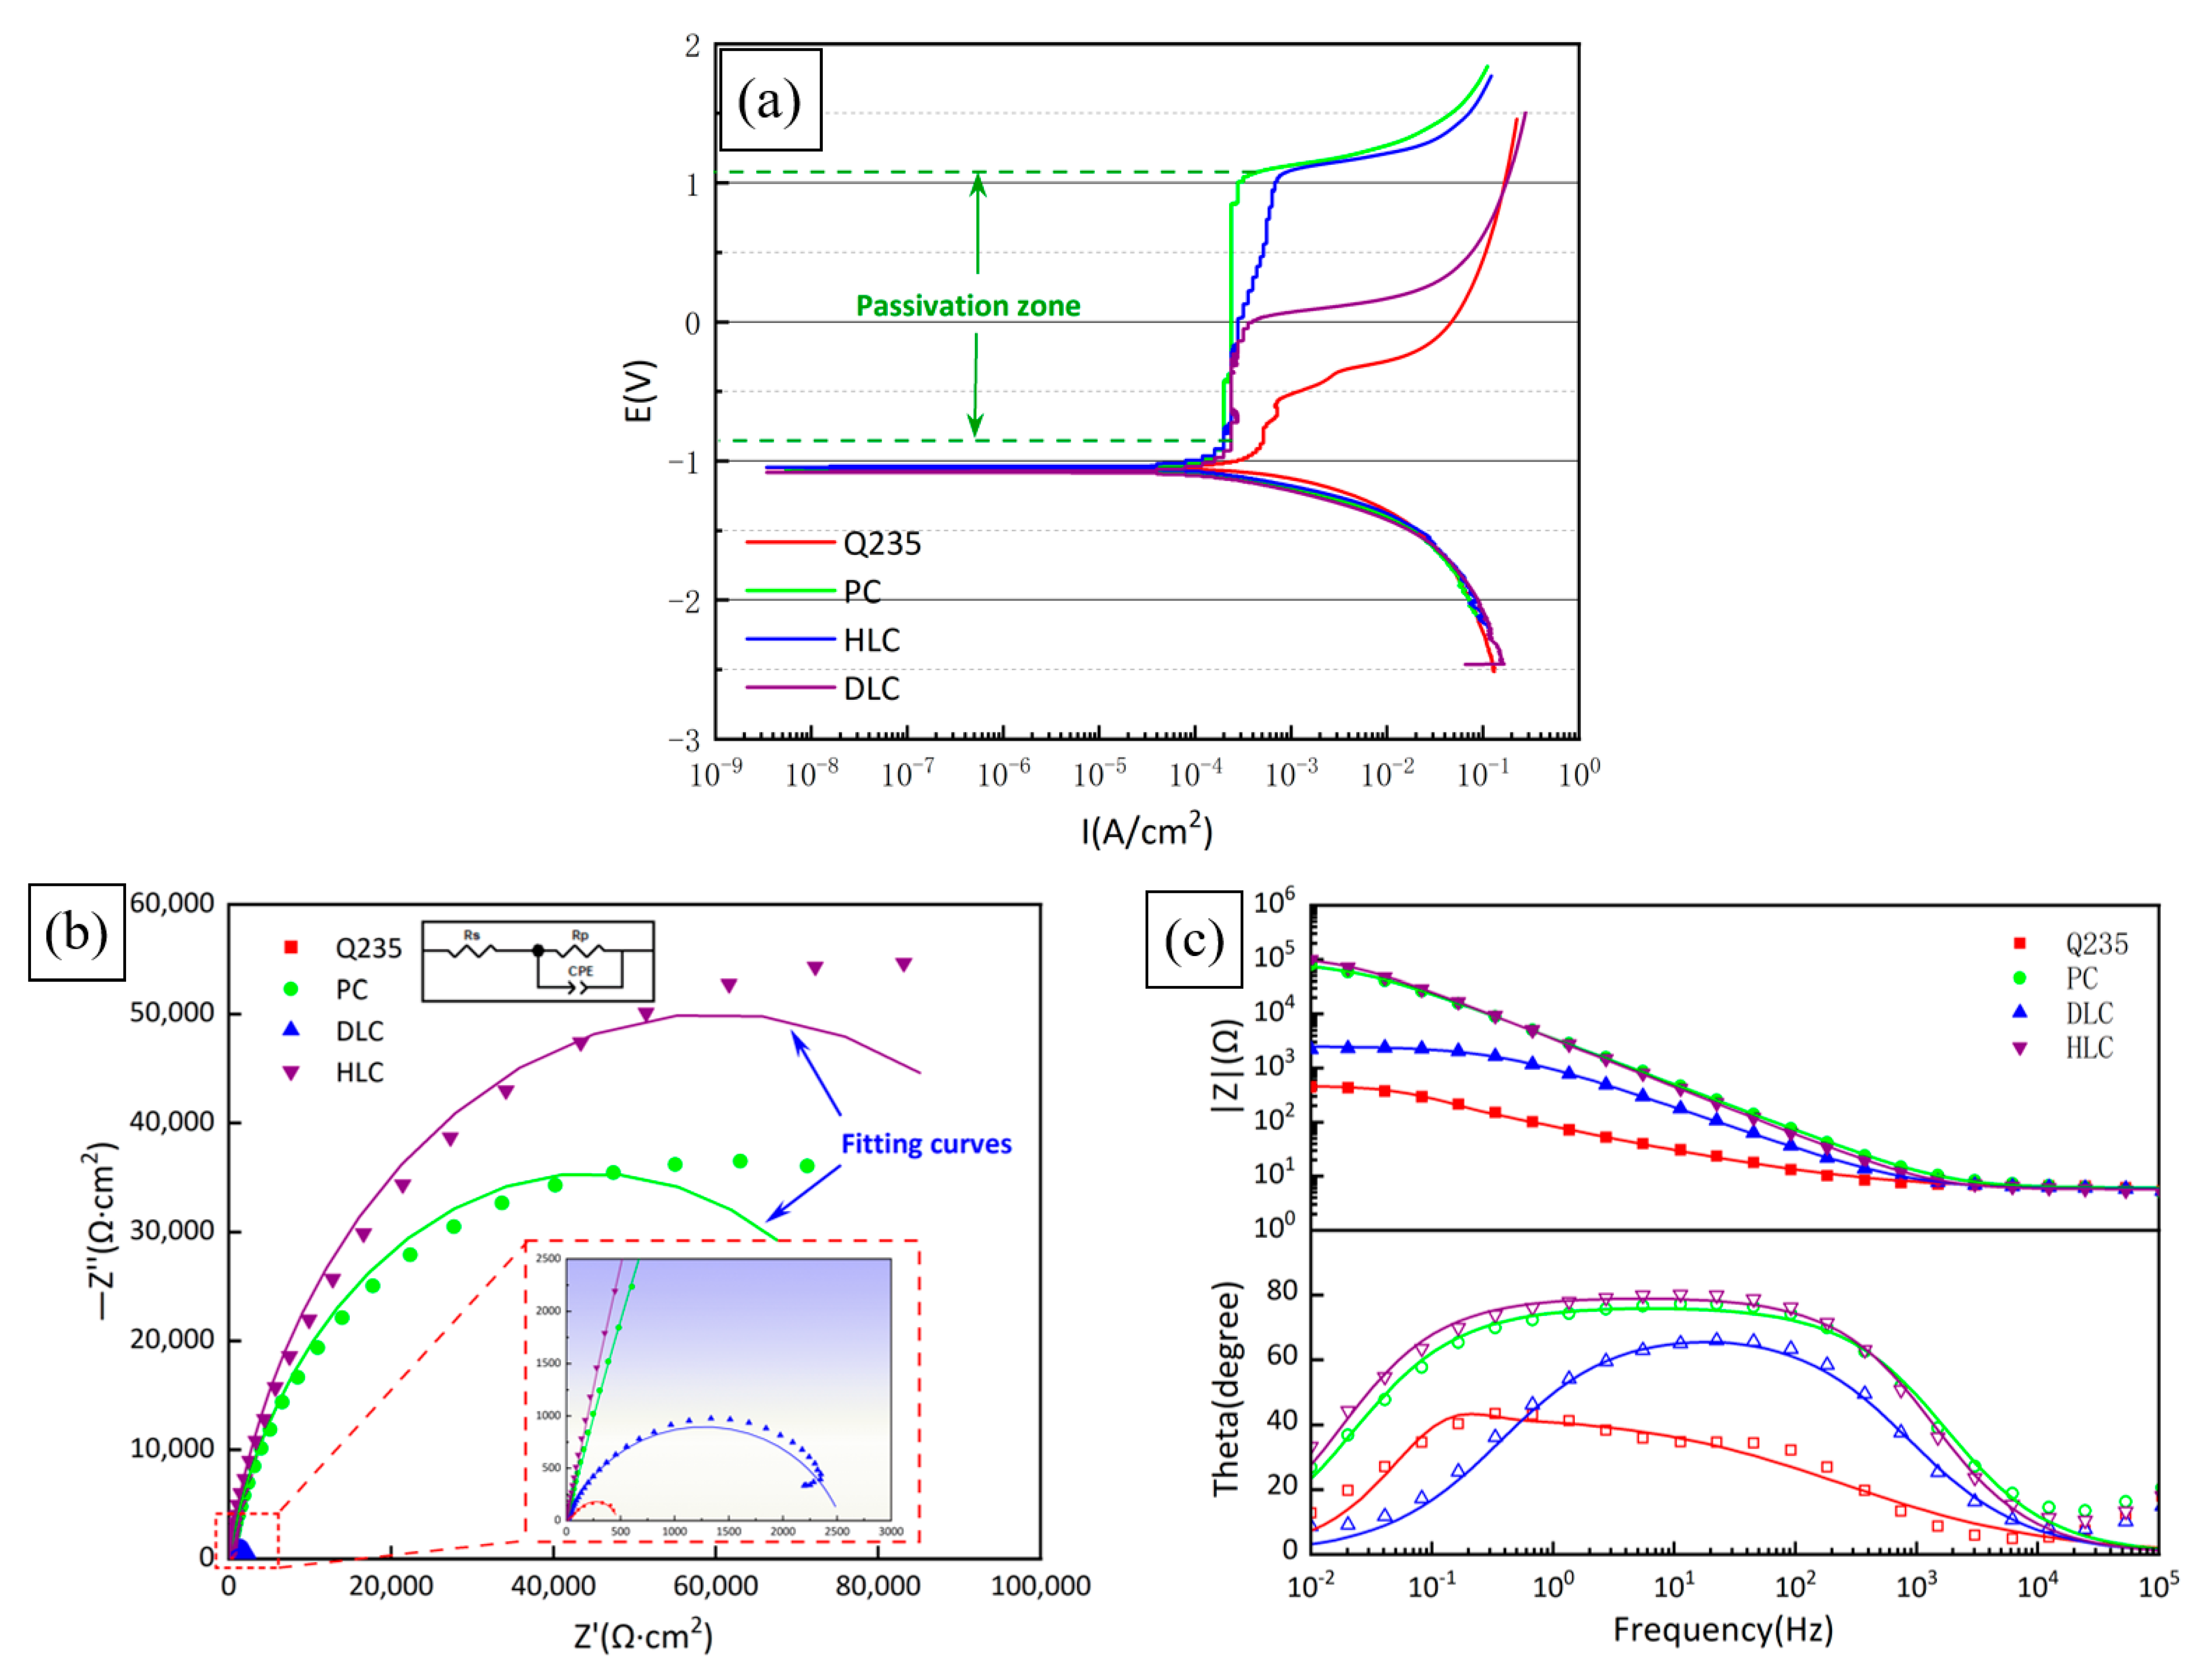
Figure 12a shows the potentiodynamic polarization curves of Q235, PC, HLC, and DLC. It can be seen from Figure 9a that the passivation region width of PC and HLC is significantly wider than that of DLC. Table 7 lists the pitting potential of Q235, PC, HLC, and DLC. Compared with Q235, the Epit of PC and HLC increased by 1.6068 V and 1.6710 V, respectively, while that of DLC only increased by 0.5735 V. This shows that the stability of the PC and HLC passivation films is superior to that of DLC. Due to the similar elemental composition, PC and HLC exhibit the same passivation ability. Research shows that the passivation film of the Fe30Ni20Co20Cr20Mo3.5 HEA consists of Cr2O3 and MoO3[30]. The first reason is that the atomic gap of the BCC crystal structure is larger than that of FCC. The difficulty of Cl moving towards the interior of the coating is lower [31]. Secondly, DLC contains a large amount of Fe. The iron oxide has a strong adsorption effect on anions and the passivation film is more easily damaged by Cl−. Therefore, the passivation film of DLC is more easily damaged by Cl− [32]. Therefore, the passivation region of DLC is relatively narrow.
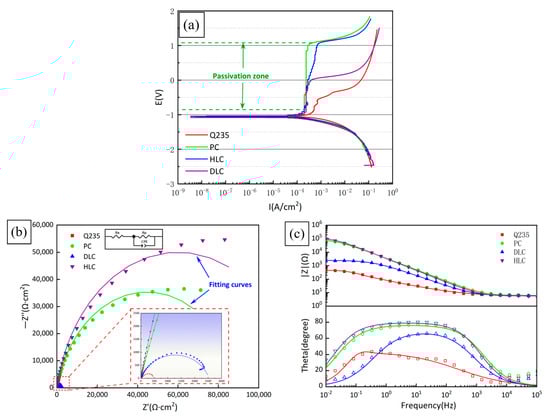
Figure 12.
Electrochemical properties of Q235, PC, HLC, and DLC: (a) potentiodynamic polarization curves; (b) Nyquist plot; and (c) Bode plot.
Table 7.
Electrochemical parameters of the polarization curves in Figure 9.
Table 7 lists the kinetic parameters of the polarization curves obtained by the Rp fitting method. Ecorr, Icorr, and Ccorr are the corrosion potential, corrosion current density, and annual corrosion rate, respectively. The Ecorr of Q235, PC, HLC, and DLC is similar, while the corrosion current density and annual corrosion rate of PC, HLC, and DLC are significantly lower than Q235. The smaller the Icorr, and Ccorr, the better the corrosion resistance of materials. Therefore, HLC and PC have the best corrosion resistance.
Figure 12b,c show the Nyquist plot and Bode plot obtained by fitting the electrochemical impedance spectroscopy (EIS) of Q235, PC, HLC, and DLC. The equivalent circuit of the coatings in 3.5 wt% NaCl solution is Rs (CPE-Rp), as shown in Figure 12b, where Rs and Rp represent the solution resistance and polarization resistance. CPE is the constant phase element defined by two values, CPE-T and CPE-P. The fitting results of the components in the equivalent circuit are listed in Table 8. The values of capacitive reactance arc radius and Rp, in descending order, are HLC, PC, DLC, Q235. This is consistent with the results of Rp fitting in Table 7.
Table 8.
Fitting results of the components in the equivalent circuit.
In the Bode plot (Figure 12c), the value of the impedance modulus |Z| is Rp in the low-frequency region and parallel connection of Rp and CPE in the high-frequency region. The larger the |Z| in the low-frequency region, the better the corrosion resistance of the material. PC and HLC maintain extremely high phase angles over a wide frequency range, indicating that the passivation film stability of PC and HLC is better than that of DLC, which is confirmed by the results of the potentiodynamic polarization curves. Compared to PC and HLC, DLC exhibits completely different corrosion resistance, and more analyses are needed through observing the morphology of the corroded surface.
Figure 13 shows the corrosion morphology of PC, HLC, and DLC. There are many small corrosion pits on the corrosion surface of PC, with a diameter of approximately 3.5 μm (Figure 13a). After amplification, there are many nano phases at the grain boundary (Figure 13b). These nano phases may be crystals left after the precipitates are corroded. A large number of dendrite frames are distributed on the corrosion surface of HLC (Figure 13d). The corrosion surface of HLC is uniform and no corrosion pits are found, indicating that the type of corrosion is general corrosion (Figure 13c). The corrosion surface of DLC has larger corrosion pits with a diameter of approximately 70 μm (Figure 13e). The corrosion type of DLC is pitting corrosion. Corrosion pits are distributed in the overlapping region. Dendrite frames can be observed in the corrosion pits (Figure 13f).
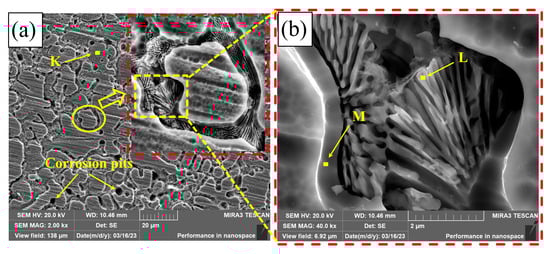
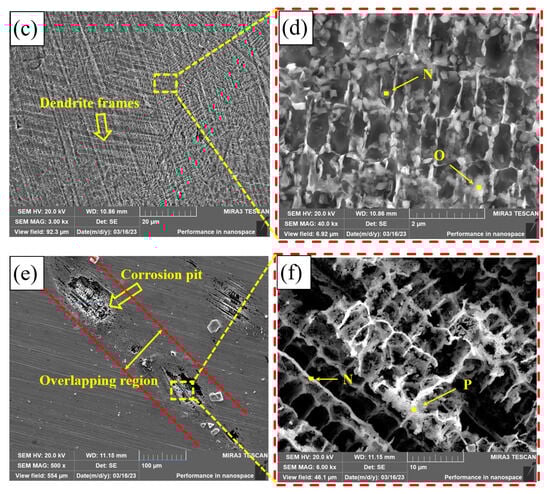
Figure 13.
Microscopic morphology of the coating surface after electrochemical corrosion: (a,b) PC; (c,d) HLC; and (e,f) DLC.
The EDS results of the coatings are listed in Table 9. The element atomic ratio of the phase on the surface of PC is the same as the original composition (Region B as shown in Table 4), indicating that the corrosion mainly occurred between the dendrites. Therefore, based on the SEM pictures of corrosion morphology, the corrosion types of PC are pitting corrosion and intergranular corrosion. The elemental composition of the corrosion product of HLC is the same as the original composition at the grain boundary of HLC (Region C as shown in Table 4). Therefore, the corrosion of HLC occurred within the grains. The content of Co and Ni in the corrosion product of DLC is extremely low. This indicates that the secondary heat input in the overlapping region caused changes in the microstructure and composition of DLC, which is different from the potential in the non-overlapping region. Therefore, the overlapping region is more susceptible to corrosion.
Table 9.
EDS results of the Fe30Ni20Co20Cr20Mo3.5 high entropy alloy coating after electrochemical corrosion (at.%).
4. Conclusions
Three Fe30Ni20Co20Cr20Mo3.5 high entropy alloy coatings using different cladding processes have been successfully prepared on Q235. Compared to Q235, the mechanical and electrochemical properties of the Fe30Ni20Co20Cr20Mo3.5 HEA coatings have been improved. However, further research is needed on the corrosion resistance in different corrosive media. Secondly, the effects of process parameters such as laser power, cladding speed, and powder feeding rate on the microstructure and properties of the Fe30Ni20Co20Cr20Mo3.5 HEA coatings need to be analyzed. In future research, laser cladding simulation models and thermodynamic calculations will be introduced into the study of the formation mechanism of high entropy alloy coating microstructure.
The main conclusions are as follows:
- (1)
- Planar, columnar, dendritic, and equiaxed crystals were observed in all coatings. The surface morphology of HLC and DLC was smoother, compared to PC. HLC had the thinnest thickness and the smallest grain size.
- (2)
- The crystal structure of the powder, PC, and HLC was typical single face-centered cubic (FCC), while that of DLC was body-centered cubic (BCC). The dilution ratio of PC and HLC was extremely low, and the element content of the coating was the same as the original composition of the Fe30Ni20Co20Cr20Mo3.5 HEA powder. The dilution ratio of DLC was very high, and the coating and substrate formed a metallurgical bond. In the three coatings, the Cr and Mo elements segregate at the grain boundary.
- (3)
- The average microhardness of Q235, PC, HLC, and DLC was 195.65 HV, 333.50 HV, 407.17 HV, and 408.96 HV, respectively. Compared to Q235, the microhardness of PC, HLC, and DLC increased by 70%, 108%, and 109%, respectively. The microhardness of PC and DLC was relatively uniform, while DLC exhibited a stepped distribution.
- (4)
- The average friction coefficients for Q235, PC, HLC, and DLC were 0.7653, 0.5118, 0.4252, and 0.3735, respectively. Compared to Q235, the average friction coefficient decreased by 33%, 44%, and 51%, respectively. DLC had the best friction and wear resistance. The friction and wear properties of the coatings were positively correlated with the hardness of the coatings.
- (5)
- Q235, PC, HLC, and DLC had similar corrosion potentials. The Fe30Ni20Co20Cr20Mo3.5 HEA exhibited excellent corrosion resistance by electrochemical test. Compared with Q235, the corrosion rate of PC and HLC decreased by about 60%. Both PC and HLC had a passivation region of about 2 V. Among them, HLC had the best corrosion resistance. The Rp of HLC was 157 times that of Q235.
- (6)
- The corrosion types of PC were pitting corrosion and intergranular corrosion, that of HLC was general corrosion, and that of DLC was severe pitting corrosion.
Author Contributions
Conceptualization, C.L. and G.Z.; Methodology, Y.Z. and L.H.; Software, A.C.; Formal analysis, M.L.; Investigation, M.L., B.L., C.C., S.G. and B.Y.; Writing—original draft, M.L.; Writing—review & editing, Y.Z., L.H. and G.Z. All authors have read and agreed to the published version of the manuscript.
Funding
This research was funded by the National Natural Science Foundation of China (52371073), and the Shenzhen Science and Technology Program (JCYJ20220530140601002).
Institutional Review Board Statement
Not applicable.
Informed Consent Statement
Not applicable.
Data Availability Statement
No new data were created or analyzed in this study. Data sharing is not applicable to this article.
Conflicts of Interest
The authors declare no conflict of interest.
References
- Yuan, S.; Li, H.; Han, C.; Li, W.; Xu, X.; Chen, C.; Wei, R.; Wang, T.; Wu, S.; Li, F. Feconicral0.6 High-Entropy Alloy Coating on Q235 Steel Fabricated by Laser Cladding. Mater. Sci. Technol. 2022, 39, 705–713. [Google Scholar] [CrossRef]
- Li, X.; Wang, X.; Wang, L.; Sun, Y.; Zhang, B.; Li, H.; Huang, Y.; Hou, B. Corrosion Behavior of Q235 Steel in Atmospheres Containing SO2 and NaCl. J. Mater. Eng. Perform. 2019, 28, 2327–2334. [Google Scholar] [CrossRef]
- Liu, N.; Lan, Z.; Liu, L.; Dou, J.; Guo, P.; Wang, X. Optimizing 304 Stainless Steel Surface Performance with CoCrFeMoNi High-Entropy Alloy Coating via Gas Tungsten Arc Cladding. J. Mater. Eng. Perform. 2023, 32, 9114–9120. [Google Scholar] [CrossRef]
- Meng, C.; Song, Z.; Qiu, X.; Wang, G.; Wu, C.; Ren, X.; Zhuang, W.; Wang, X. Effect of Cu Content on Microstructure and Properties of CoCrFeNiCux High-Entropy Alloy Coatings Prepared by Induction Cladding. J. Alloys Compd. 2023, 934, 167896. [Google Scholar] [CrossRef]
- Song, Z.; Liu, S.; Qiu, X.; Zhang, L.; Wu, C.; Ren, X.; Wang, X.; Meng, C. Effect of Ultrasonic Impact Treatment on the Properties of CoCrFeNiCu High-Entropy Alloy Coatings on Steel by Induction Cladding. Surf. Coat. Technol. 2023, 459, 129390. [Google Scholar] [CrossRef]
- Zhou, Y.; Yang, B.; Zhang, G. Microstructure and Mechanical Properties of CoCrFeMnNi/WC Plasma Deposited Coating after the Spark Plasma Sintering Treatment. Surf. Coat. Technol. 2022, 449, 128959. [Google Scholar] [CrossRef]
- Ghadami, F.; Davoudabadi, M.A.; Ghadami, S. Cyclic Oxidation Properties of the Nanocrystalline AlCrFeCoNi High-Entropy Alloy Coatings Applied by the Atmospheric Plasma Spraying Technique. Coatings 2022, 12, 372. [Google Scholar] [CrossRef]
- Gao, P.; Fu, R.; Liu, J.; Chen, B.; Zhang, B.; Zhao, D.; Yang, Z.; Guo, Y.; Liang, M.; Li, J.; et al. Influence of Plasma Arc Current on the Friction and Wear Properties of CoCrFeNiMn High Entropy Alloy Coatings Prepared on CGI through Plasma Transfer Arc Cladding. Coatings 2022, 12, 633. [Google Scholar] [CrossRef]
- Ma, X.F.; Sun, Y.N.; Cheng, W.J.; Chong, Z.Z.; Huang, L.F.; Meng, A.C.; Jiang, L.H. Effect of High-Speed Laser Cladding on Microstructure and Corrosion Resistance of CoCrFeNiMo0.2 High-Entropy Alloy. J. Cent. South Univ. 2022, 29, 3436–3446. [Google Scholar] [CrossRef]
- Cui, W.H.; Wang, H.; Shao, D.Q.; Han, B.; Lin, J.Y. Analysis of Influencing Factors and Experimental Study on Properties of Laser Cladding Layer. IOP Conf. Ser. Mater. Sci. Eng. 2019, 631, 41–47. [Google Scholar] [CrossRef]
- He, Y.; Gu, Y.; Tang, L.; Wang, H. Improvement of Microstructure and Properties of Q235 Steel by Iron-Based Laser Cladding Coating. Adv. Mater. Sci. Eng. 2022, 2022, 2790770. [Google Scholar] [CrossRef]
- Colegrove, P.; Simiand, P.E.; Varughese, A.; Williams, S.; Yapp, D. Evaluation of a Drilling Model Approach to Represent Laser Spot Microwelding. TRENDS Weld. Res. 2009, 1, 303–312. [Google Scholar]
- Nakamura, S.; Sakurai, M.; Kamimuki, K. Detection Technique for Transition between Deep Penetration Mode and Shallow Penetration Mode in CO2. J. Phys. D Appl. Phys. 2000, 33, 2941. [Google Scholar] [CrossRef]
- Yeh, J.W.; Chen, S.K.; Lin, S.J.; Gan, J.Y.; Chin, T.S.; Shun, T.T.; Tsau, C.H.; Chang, S.Y. Nanostructured High-Entropy Alloys with Multiple Principal Elements: Novel Alloy Design Concepts and Outcomes. Adv. Eng. Mater. 2004, 6, 299–303. [Google Scholar] [CrossRef]
- Cantor, B.; Chang, I.T.H.; Knight, P.; Vincent, A.J.B. Microstructural Development in Equiatomic Multicomponent Alloys. Mater. Sci. Eng. A 2004, 375–377, 213–218. [Google Scholar] [CrossRef]
- He, F.; Wang, Z.; Wu, Q.; Niu, S.; Li, J.; Wang, J.; Liu, C.T. Solid Solution Island of the Co-Cr-Fe-Ni High Entropy Alloy System. Scr. Mater. 2017, 131, 42–46. [Google Scholar] [CrossRef]
- Sathiyamoorthi, P.; Basu, J.; Kashyap, S.; Pradeep, K.G.; Kottada, R.S. Thermal Stability and Grain Boundary Strengthening in Ultrafine-Grained CoCrFeNi High Entropy Alloy Composite. Mater. Des. 2017, 134, 426–433. [Google Scholar] [CrossRef]
- Zhang, Q.; Han, B.; Li, M.; Chen, Z.; Hu, C.; Jia, C. Comparison of CoCrFeNi Coatings Prepared via High-Speed Laser Cladding and Normal Laser Cladding on Microstructure and Properties. Intermetallics 2023, 153, 107795. [Google Scholar] [CrossRef]
- Peng, Y.B.; Zhang, W.; Mei, X.L.; Wang, H.J.; Zhang, M.Y.; Wang, L.; Li, X.F.; Hu, Y. Microstructures and Mechanical Properties of FeCoCrNi-Mo High Entropy Alloys Prepared by Spark Plasma Sintering and Vacuum Hot-Pressed Sintering. Mater. Today Commun. 2020, 24, 112–119. [Google Scholar] [CrossRef]
- Zhang, M.; Zhang, W.; Liu, Y.; Liu, B.; Wang, J. FeCoCrNiMo High-Entropy Alloys Prepared by Powder Metallurgy Processing for Diamond Tool Applications. Powder Metall. 2018, 61, 123–130. [Google Scholar] [CrossRef]
- Guo, Y.; Liu, L.; Zhang, Y.; Qi, J.; Wang, B.; Zhao, Z.; Shang, J.; Xiang, J. A Superfine Eutectic Microstructure and the Mechanical Properties of CoCrFeNiMox High-Entropy Alloys. J. Mater. Res. 2018, 33, 3258–3265. [Google Scholar] [CrossRef]
- Gorr, B.; Schellert, S.; Müller, F.; Christ, H.J.; Kauffmann, A.; Heilmaier, M. Current Status of Research on the Oxidation Behavior of Refractory High Entropy Alloys. Adv. Eng. Mater. 2021, 23, 2001047. [Google Scholar] [CrossRef]
- Müller, F.; Gorr, B.; Christ, H.J.; Chen, H.; Kauffmann, A.; Laube, S.; Heilmaier, M. Formation of Complex Intermetallic Phases in Novel Refractory High-Entropy Alloys NbMoCrTiAl and TaMoCrTiAl: Thermodynamic Assessment and Experimental Validation. J. Alloys Compd. 2020, 842, 155726. [Google Scholar] [CrossRef]
- Liu, W.H.; Lu, Z.P.; He, J.Y.; Luan, J.H.; Wang, Z.J.; Liu, B.; Liu, Y.; Chen, M.W.; Liu, C.T. Ductile CoCrFeNiMox High Entropy Alloys Strengthened by Hard Intermetallic Phases. Acta Mater. 2016, 116, 332–342. [Google Scholar] [CrossRef]
- Mu, Y.K.; Jia, Y.D.; Xu, L.; Jia, Y.F.; Tan, X.H.; Yi, J.; Wang, G.; Liaw, P.K. Nano Oxides Reinforced High-Entropy Alloy Coatings Synthesized by Atmospheric Plasma Spraying. Mater. Res. Lett. 2019, 7, 312–319. [Google Scholar] [CrossRef]
- Zhao, Y.; Zhang, B.; Hou, H.; Chen, W.; Wang, M. Phase-Field Simulation for the Evolution of Solid/Liquid Interface Front in Directional Solidification Process. J. Mater. Sci. Technol. 2019, 35, 1044–1052. [Google Scholar] [CrossRef]
- Xu, B.; Zhou, Y.; Liu, Y.; Hu, S.; Zhang, G. Effect of Different Contents of WC on Microstructure and Properties of CrMnFeCoNi High-Entropy Alloy-Deposited Layers Prepared by PTA. J. Mater. Res. 2022, 37, 719–727. [Google Scholar] [CrossRef]
- Li, M.; Huang, L.; Zhou, Y.; Zhang, G. Effect of TiC Content on Microstructure and Properties of CrMnFeCoNi High-Entropy Alloy. J. Mater. Eng. Perform. 2023, 1–13. [Google Scholar] [CrossRef]
- Liu, D.; Huang, B.; Wang, C.; Ma, J.; Zhao, X. Different Effects of Body-Centered Cubic and Face-Centered Cubic Chromium Precipitations on Mechanical Properties and Wear Resistance of Cu-Cr-Zr Alloy. J. Mater. Eng. Perform. 2022, 31, 9910–9920. [Google Scholar] [CrossRef]
- Wu, H.; Zhang, S.; Wang, Z.Y.; Zhang, C.H.; Chen, H.T.; Chen, J. New Studies on Wear and Corrosion Behavior of Laser Cladding FeNiCoCrMox High Entropy Alloy Coating: The Role of Mo. Int. J. Refract. Met. Hard Mater. 2022, 102, 234–244. [Google Scholar] [CrossRef]
- Parakh, A.; Vaidya, M.; Kumar, N.; Chetty, R.; Murty, B.S. Effect of Crystal Structure and Grain Size on Corrosion Properties of AlCoCrFeNi High Entropy Alloy. J. Alloys Compd. 2021, 863, 153–163. [Google Scholar] [CrossRef]
- Wang, X.; Zhang, C.H.; Zhou, F.Q.; Zhang, S.; Chen, J.; Zhang, J.B. Novel Gradient Alloy Steel with Quasi-Continuous Ratios Fabricated by Selective Laser Melting: Microstructure and Corrosion Behavior. Steel Res. Int. 2021, 92, 2100232. [Google Scholar] [CrossRef]


Disclaimer/Publisher’s Note: The statements, opinions and data contained in all publications are solely those of the individual author(s) and contributor(s) and not of MDPI and/or the editor(s). MDPI and/or the editor(s) disclaim responsibility for any injury to people or property resulting from any ideas, methods, instructions or products referred to in the content. |
© 2023 by the authors. Licensee MDPI, Basel, Switzerland. This article is an open access article distributed under the terms and conditions of the Creative Commons Attribution (CC BY) license (https://creativecommons.org/licenses/by/4.0/).