Article

Corrosion and Micro-Abrasion Properties of an AISI 316L Austenitic Stainless Steel after Low-Temperature Plasma Nitriding

1
Department of Materials, Faculty of Mechanical Engineering and Naval Architecture, University of Zagreb, 10000 Zagreb, Croatia
2
Department of Welded Structures, Faculty of Mechanical Engineering and Naval Architecture, University of Zagreb, 10000 Zagreb, Croatia
*
Author to whom correspondence should be addressed.
Coatings 2023, 13(11), 1854; https://doi.org/10.3390/coatings13111854
Submission received: 14 July 2023 / Revised: 19 October 2023 / Accepted: 26 October 2023 / Published: 28 October 2023
(This article belongs to the Special Issue Investigation on Corrosion Behaviour of Metallic Materials)

Abstract

:
The paper investigates the effects of DC plasma nitriding on surface roughness, hardness, microstructure, micro-abrasion, and corrosion resistance of AISI 316L Austenitic Stainless (AS) steel. The nitriding has been conducted for durations ranging from 4 to 24 h at a temperature of 430 °C in a commercial vacuum furnace, Rübig PN90/70. Micro-abrasion resistance has been tested using the calotest device with a measurement diameter of craters produced on the sample surface after 10 to 60 s of wear. Corrosion resistance has been tested using the Electroimpedance Spectroscopy (EIS) method in a 3.5% NaCl water solution. The surface roughness parameters and hardness of the samples increased with longer nitriding times, attributed to the saturation of austenite and the formation of iron and chromium nitrides. Nitriding for longer than 8 h resulted in the formation of a thicker compound layer that is hard and brittle, leading to reduced wear resistance compared with shorter nitriding times. EIS measurements revealed that nitrided samples had lower corrosion resistance compared with the untreated sample. The corrosion stability was not significantly affected by nitriding time. Different nitriding times have a great influence on resistance to pitting corrosion. This study provides valuable insights into the effects of plasma nitriding on the properties of AS steel, highlighting the importance of optimizing nitriding parameters for specific applications.

1. Introduction

The austenitic stainless (AS) steels have a combination of good corrosion resistance, high temperature strength, and oxidation resistance, high toughness on low temperatures, good ductility, and weldability. The steel AISI 316L (EN X5CrNiMo17-12-2, 1.4401) is typical representative of the high quality AS steels and its properties are usually compared as a reference to the properties of other stainless steels. Additionally, their heat treatment after welding, cold forming, or grinding is simple and usually only annealing for reducing residual stresses and stress corrosion is recommended. This annealing can be conducted at a temperature of 850–950 °C for 2 h for a section with a wall thickness of 25.5 mm, 4 h for a section with a thickness of 50.1 mm, etc. To maintain good corrosion resistance, the weld surface of AS steels should be cleaned of residual protective pastes and oxides by acid pickling and finely ground or polished to a medium roughness of Ra < 0.5 μm. The AS steel AISI 316L is used in numerous structures that require corrosion resistance in marine or industrial atmospheres, clean water, heat exchangers, and preheaters, production of chemical compounds such as hydrogen peroxide, concentrated sulfuric acid, alcohol-based solvents, etc. [1,2].
Although possessing superior properties, AS steels can be attacked by pitting and stress corrosion, in the presence of hydrochloric acid or a hot caustic environment. Additionally, their hardness and wear resistance are low. This problem can be solved by replacing the AS steel with a more expensive martensitic stainless steel or by protecting the AS steel with surface modification and coating processes.
To modify the surface of AS steels, according to the multiple favorable influence on the properties, the nitriding process in plasma is highlighted over gas and salt bath nitriding. The addition of nitrogen to surface layer of AS steels will change stacking fault energy and the dislocation structure, leading to increased surface hardness, fatigue life, and enhances pitting corrosion resistance, without affecting the bulk properties [2,3,4]. Before plasma nitriding (PN) the workpiece is cleaned by ion bombardment (sputtering) with H2, N2 and Ar ions. The plasma nitriding (PN) temperature needs to be lower than 430–440 °C to avoid the precipitation of chromium nitrides at the grain boundaries and to maintain good corrosion resistance [5,6,7]. This low-temperature PN process enables the formation of the S-phase, which is a nitrogen-supersaturated austenite (γN) with a distorted Face Centered Cubic (FCC) crystalline lattice in a thin surface layer. Temperatures higher than 440 °C stimulate the precipitation of nitrides γ′-(Fe,Cr)4N and ε-(Fe,Cr)2+xN at the grain boundaries of the S-phase and at the surface’s top layer. The presence of the S-phase can be observed using X-ray diffractometry, where two characteristic peaks in a diffractogram appear at smaller angles compared to the peaks of the substrate austenite. These peaks correspond to the (111) and (200) crystallographic planes in the FCC lattice. The shift in these peaks indicates that the S-phase has a larger lattice parameter than the substrate austenite and is supersaturated with nitrogen atoms [5,6,7,8]. A homogeneous S-phase exhibits higher hardness than the austenitic phase in the substrate while preserving good corrosion resistance. However, producing it through PN requires a specific combination of parameters and has a limited range of surface layer depth. The most influential process parameters on nitride layer thickness include nitriding temperature and time, the ratio of atmosphere gases (H2/N2), pressure in the vacuum chamber, substrate voltage, and plasma current density.
In reference [9], a plasma nitriding (PN) process was conducted for a duration of 5 h with a mass flow ratio of H2/N2 = 75%/25% and a pressure of 500 Pa. Two transition temperatures were identified: T1 for producing a homogeneous S-phase and T2 for the decomposition of the S-phase and the formation of γ’-(Fe,Cr)4N, Cr2N, and CrN nitride precipitates. Plasma nitriding of AS steel AISI 316 below the temperature T1 = 460 °C results in the formation of a surface layer consisting only of the S-phase. Nitriding at temperatures above T2 = 550 °C results in the formation of nitride precipitates and a thin γ’-(Fe,Cr)4N surface layer. The thickness of the S-phase layer obtained varied from 3 μm after PN conducted at 400 °C for 5 h to 14 μm after treatment in plasma at 450 °C for 5 h. It was also observed that the thickness of the nitride layer on a plane surface was not uniform and depended on the thickness of the plasma layer formed during the PN process. In references [9,10], the authors concluded that increasing the PN temperature above 450 °C with a nitriding time longer than 10 h causes the occurrence of nitride precipitates. Reference [11] provides a review of the literature, indicating the possibility of obtaining an S-phase layer on AS steels through conventional PN and pulsed DC discharge PN at temperatures below 420 °C. In the above mentioned low-temperature nitriding procedures, lasting up to 4 h, a surface layer composed of pure S-phase, up to 10 μm thick, and a layer with a mixture of S-phase and nitride precipitates, up to 20 μm thick, were obtained. In references [5,11], vacuum pressures between 100 and 1000 Pa, substrate voltage of 100–1000 V, and a plasma current density greater than 1 mA/cm2, along with low temperatures below 440 °C, are recommended for obtaining a surface layer up to 10 μm thick, composed of a homogeneous S-phase on AISI 316L steel in a PN process with ionized gases N2 or N2–H2.
In reference [12], the plasma nitriding (PN) process was investigated in an atmosphere of dissociated and ionized ammonia at a vacuum pressure of 300 Pa, at temperatures ranging from 350 to 500 °C, with a nitriding time of 6 h, and an anode voltage (vacuum chamber wall) of 600–800 V. The thickness of the surface layer with a compact S-phase increased from 1.5 μm after nitriding at 350 °C to 30 μm after nitriding at the upper temperature of 500 °C. However, when nitriding at temperatures above 450 °C, nitride precipitates were observed in the nitrided layer. In reference [13], a study of low-temperature PN treatment of AISI 316LM AS steel was conducted with the following parameters: a ratio of ionized gases H2/N2 = 15%:85%, vacuum pressure of 300 Pa, nitriding temperature at 380 °C, voltage between the anode and cathode at 490–500 V, and processing times ranging from 0.5 to 8 h. The thicknesses of the nitrided layer with S-phase and without precipitated nitrides were found to be between 1.90 and 4.31 μm.
The references [14,15] investigate the impact of ionized gas atmosphere and temperature on the microstructure and properties of the surface layer. In reference [14], AS steel AISI 316L underwent nitriding with the following parameters: a flow ratio of ionized gases H2/N2 = 75%:25% or H2/N2 = 80%:20%, a vacuum pressure of 650 Pa, a nitriding temperature of 400 °C, a voltage between the anode and cathode of 700 V, and a nitriding time of 20 h. The PN process with an N2 content of 25% resulted in a 20 μm thick nitrided layer, while the process with a lower N2 content created a 15 μm thick surface layer. According to the results of XRD analysis, the thinner layer consisted of the S-phase, while the thicker layer also contained nitride precipitates. In reference [15], AISI 316L steel was nitrided with the following parameters: gas flow ratio H2/N2 = 1:3 or H2/N2 = 3:1, vacuum pressure of 250 Pa, nitriding temperature of 400 °C or 550 °C, voltage between anodes and cathodes of 470 V, and a nitriding time of 12 h. Using the Rietveld method in the analysis of the X-ray diffraction diagram, it was discovered that the S-phase, along with chromium and iron nitrides, is always present in the nitrided layer. During low-temperature nitriding at 400 °C, the share of the S-phase dominates over the share of nitrides. With the ratio H2/N2 = 1:3, the share of the S-phase in the nitrided layer was 89.6%, while with the ratio H2/N2 = 3:1, it was 96.7%. In the PN process with a higher proportion of hydrogen, CrN nitride is compatible with the S-phase, while in nitriding with a higher mass flow of N2, γ’-Fe4N nitride is dominantly present. At a temperature of around 420 °C, the highest solubility of nitrogen in austenite is achieved. Nitriding at temperatures higher than 420 °C leads to the decomposition of the metastable S-phase and the release of CrN precipitates. After the PN process at 550 °C, only 7.4% of the S-phase is present in the nitrided layer.
In reference [16], AISI 316L steel underwent nitriding with the following parameters: a gas flow ratio H2/N2 = 80%:20%, a vacuum pressure of 100 Pa, nitriding temperatures ranging from 400 to 500 °C, and a nitriding time of 5 h. In the nitrided layer of samples processed at temperatures up to 450 °C, the S-phase dominates, while CrN nitride also appears after nitriding at higher temperatures. On samples nitrided at 470–500 °C, in addition to CrN nitride, γ’-Fe4N nitride also becomes evident. The thickness and hardness of the nitrided layer range from 4 μm/373 HK0.1 after nitriding at 400 °C to 47 μm/1605 HK0.1 after processing at 500 °C. In reference [17], AISI 316L steel was nitrided with the following parameters: a gas flow ratio H2/N2 = 80%:20%, a vacuum pressure of 1000 Pa, nitriding temperatures ranging from 450 to 550 °C, and nitriding times of 2, 4, and 9 h. The presence of the S-phase, along with precipitates of iron (Fe4N) and chromium (CrN, Cr2N) nitrides, was observed on samples nitrided at 450 °C for 2 h, resulting in a layer with a thickness of about 15 μm. After nitriding at temperatures higher than 450 °C for 9 h, a thin film composed of γ’-Fe4N and ε-Fe2–3N nitrides forms on the surface above the S-phase layer. The highest thickness of the nitrided layer, 95 μm, was obtained after a PN process conducted at 500 °C for 9 h. The hardness of the S-phase depends on the amount of soluted nitrogen and can range from 330 to 1200 HV [18]. The hardness of nitride phases and CrN precipitates can reach around 2000 HV. While a nitriding temperature of around 450 °C is recommended to achieve the highest hardness, good wear resistance, and maintain good corrosion resistance, the appearance of ε-Fe2–3N nitride precipitates in the S-phase and the formation of a surface film of hard nitrides after nitriding at 550 °C can lead to embrittlement, cracks, and delamination of the surface layer [17].
Summarizing all the above research results for low-temperature plasma nitriding of AISI 316L AS steel, the optimal process temperature is between 420 and 450 °C can be recommended for producing a nitride layer with the maximum thickness composed from the S-phase without significant precipitation of iron or chromium nitrides along the grain boundaries. Additionally, the gas flow ratio of H2/N2 = 4:1 or H2/N2 = 3:1 is recommended. The selection of a vacuum pressure depends on the plasma furnace construction and has a significant impact on nitride layer thickness. For the PN process carried out with a gas flow ratio of H2/N2 = 4:1, a vacuum of 100 Pa, a temperature of 450 °C, and a time of 5 h, the thickness of the nitrided layer is approximately 13 μm [16]. In PN process with the parameters H2/N2 = 4:1, a vacuum of 650 Pa, a nitriding temperature of 400 °C, and time of 20 h, the nitrided layer with S-phase was 15 μm thick [14]. For the PN process carried out with the same parameters of gas flow and temperature of 450 °C in a shorter time of 4 h, with a vacuum of 1000 Pa, a thickness of the nitrided layer of 45 μm was achieved [17].
In comparison to the surface of an untreated AS steel, the nitride layer of the S-phase has an enhanced resistance to tribocorrosion [15] and to pitting corrosion in neutral chloride solutions [19]. If the plasma nitriding was conducted only with S-phase layer formation below surface, and without overheating of surface, the surface roughness obtained on workpieces after polishing or fine grinding remains practically unchanged. The Fe4N and (Fe,Cr)4N nitride film formed over S-phase layer increase surface roughness compared with the heat-untreated AS steel [20,21], and might be associated with the lower corrosion resistance in water Na2SO4 and H2SO4 solutions [22,23,24]. Therefore, few proposals can be found in the literature for the selection of parameters of low-temperature plasma nitriding, which would achieve a favorable combination of increased wear and corrosion resistance. In [25] the application of the active screen plasma nitriding was proposed for producing S-phase layer with improved wear and corrosion resistance. In [26], a hybrid plasma nitriding was proposed with two processes alternately running with high and low pressures. In [27] the optimal process of plasma nitriding for an AISI 316L AS steel was proposed as a treatment carried out at 400 °C with nitriding current density between 1 and 2.5 mA/cm2.
The surface overheating, due to the formation of cathodic arcs, may appear on sharp edges and protrusions or when nitriding a surface insufficiently cleaned of oxides. Cathodic sparking can be avoided by using a direct current (DC) pulsed plasma generator instead of a conventional DC power supply with constant voltage. Modern plasma generators enable pulsed oscillations of the cathode voltage with frequencies of 1–10 kHz. Using a generator with pulsating cathode voltage, it is possible to regulate the temperature of nitrided objects, by adjusting the duration of the voltage pulse in relation to the total duration of the pulse period [28].
The influence of the nitriding temperature on the corrosion resistance of AS steel AISI 316L in aqueous NaCl solution has been confirmed in several works. Plasma nitriding at a temperature of 400 °C increases the resistance to pitting, compared to non-nitrided steel, but the surface layer of the S-phase is too thin for efficient protection of the substrate. Nitriding at temperatures between 430 and 450 °C proved to be optimal for increasing resistance to pitting and crevice corrosion. Plasma nitriding at temperatures above 470–500 °C reduces the resistance to intergranular corrosion and localized corrosion on the surface in comparison with untreated AS steel or steel nitrided at lower-temperature PN process [16,17,29].
Additional improvement in the wear resistance of AS steel can be achieved by forming an S-phase layer covered by a thin film of Fe2–4N, Cr1–2N, and (Fe,Cr)4N nitrides, with a surface hardness of 800–1200 HV [5,17,29]. In reference [30], a long-duration micro-abrasion test involved a fixed rotating steel ball pressed against a test sample without abrasive slurry to assess the wear resistance of a thin nitrided and nitrocarburized layer on AISI 316L AS steel after treatment at 450 °C for 5 h and 10 h. The test was performed using a 25.4 mm ball diameter at a rotational speed of 500 rpm under dry sliding conditions, with a normal load of 2.45 N. The test durations ranged from 5 to 20 min. The results show that the S-phase layer, at the beginning of dry sliding wear, reduces the volumetric loss of material by about three times compared to the loss of material on non-nitrided samples. At the end of the test, this loss was seven times lower. Even after 20 min of testing, the nitrided or nitrocarburized layer remained unperforated. This fact highlights the advantage of micro-abrasion testing compared to macro-abrasion wear tests, such as the “sand-rubber wheel” method, as it allows for testing the wear resistance of thin surface layers on a small area without significant substrate influence, using a simple and cost-effective test system [31]. Another variant of the micro-abrasion test involves a steel ball that rotates freely between the shaft and the test specimen. A suspension containing abrasive particles is added between the ball and the sample, pressed into the sample’s surface by the normal force generated from the ball’s weight. As the ball rotates on the contact area with the sample, it generates a tangential force that moves abrasive particles between the ball and the sample. These particles scratch, scrape, and smooth the sample’s surface, forming a wear mark in the shape of a calotte. The normal force in micro-abrasion tests typically falls in the range of 0.05–5 N. In testing with a freely rotating ball, it is usually less than 0.5 N, depending on the ball’s diameter and the sample’s angle of inclination to the horizontal plane. The final sliding distance should be selected in a manner that ensures a constant wear rate with increasing wear time [32,33]. In the implementation and interpretation of micro-abrasion test results, factors such as the type, shape, and size of abrasive particles, the fluid used to create the suspension, the normal force, the rotational speed at which the ball acts on the sample, the ball’s diameter, the roughness of the ball and sample surfaces, and the hardness ratio between the ball and the sample must be considered. To describe abrasive wear, three basic modes of wear are proposed: two-body grooving abrasion, three-body rolling abrasion, and a mixed regime, which is a combination of the previous two. In the first mode of wear, abrasive particles adhere to the ball’s surface and, as it turns, groove the sample’s surface. In the second mode of wear, abrasive particles roll on the contact surface between the ball and the sample [34,35,36]. Due to the shallow penetration depth and low normal loads, micro-wear tests reflect the intrinsic properties of the surface layer or coating and are suitable for comparison or quality checking.
The aim of this paper is to investigate the influence of the DC plasma nitriding time on tribological and corrosion properties of surface layer on an AISI 316L AS steel with methods limited in action to the thin surface layer using micro-abrasion, cyclic polarization and electro impedance spectroscopy (EIS) testing. Based on these limited surface tests, the optimal range of nitriding temperature and time for an AISI 316L AS steel will be proposed to achieve a good combination of its wear and corrosion resistance.

2. Materials and Methods

2.1. Materials

All tests were performed on samples of a commercially available AISI 316L AS steel. The chemical composition of the steel was determined by the two-measurement apparatus: a GDS LECO 850 device (LECO Corporation Inc., St. Joseph, MO, USA) and X-ray fluorescence device Olympus Innov-X Systems, model DS 2000-C (Evident Scientific, Inc., Waltham, MA, USA). The values of chemical elements are consistent and listed in Table 1. The samples were made in the form of a thin disk with a diameter of 40 mm and a thickness of 1.5 mm. The samples surface was sanded with waterproof sandpaper with grain sizes of P120, P600, and finally P1200. Before applying the plasma nitriding processes, all samples were cleaned in an ultrasonic bath VTUSC3 (Velleman, Gavere, Belgium) in 75% ethyl alcohol for 5 min.

2.2. Plasma Nitriding Treatment

Ten cleaned and dried samples for one plasma nitriding process were put into a PC 70/90 commercial vacuum furnace (Rübig GmbH, Wels, Austria) onto a same charging pad, which was also used as a cathode of the system. The surrounding wall of cylindrical chamber was used as an anode of the system on earth potential. The furnace was equipped with a bipolar DC voltage-controlled micro pulse plasma generator. The vacuum chamber with samples was heated with an auxiliary heating system consisting of three heating zones, the temperature of which was controlled by thermocouples loaded directly into the charge of heated samples. The DC plasma nitriding consisted of a surface sputtering and plasma nitriding treatment with the parameters shown in Table 2. Four plasma nitridings were carried out at the same temperature of 430 °C ± 5 °C in duration of 4 h, 8 h, 12 h, and 24 h, with a flow ratio of gasses H2/N2 = 3:1 at a pressure of 200 Pa.
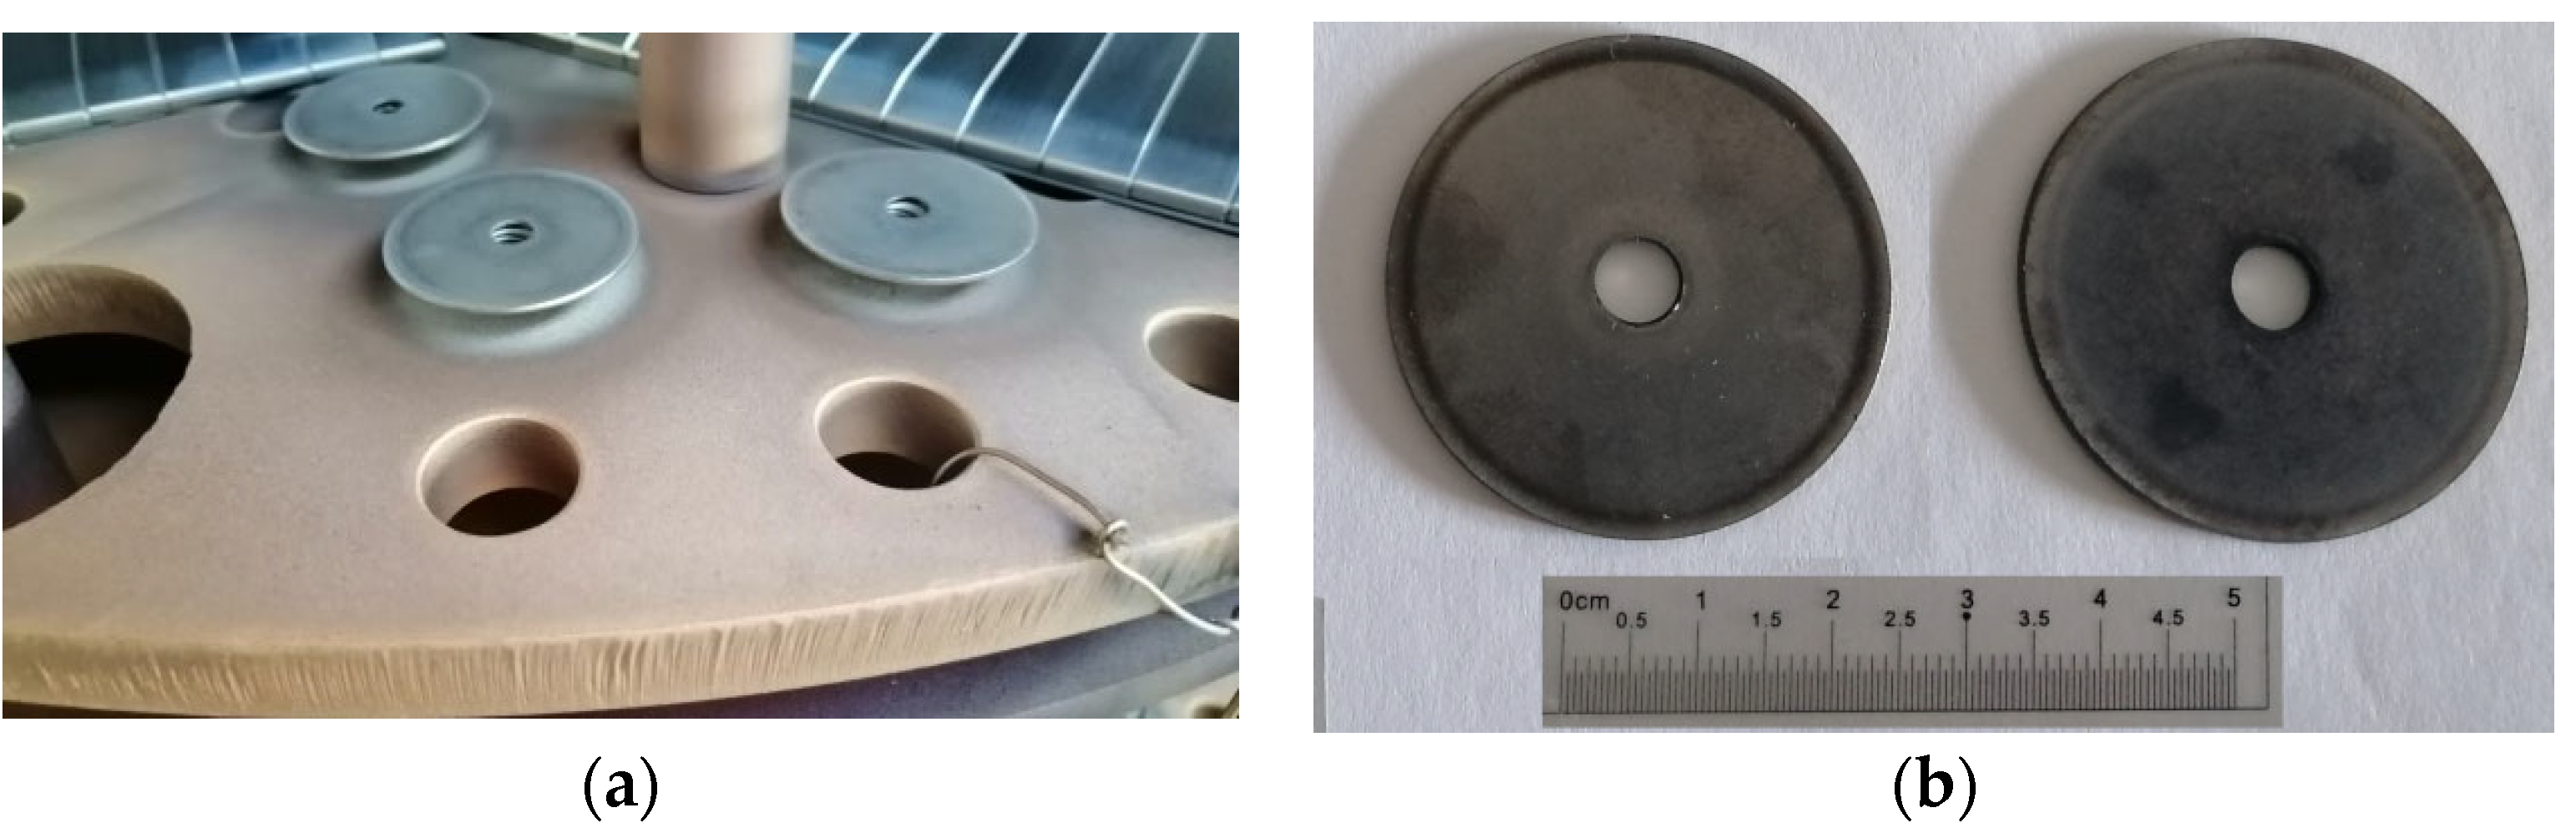
Figure 1 shows test samples after plasma nitriding for 8 h to 24 h. The samples were nitrided only on one side, whereas the other side was supported on a non-alloyed steel holder, which makes good electrical contact with the cathode and enables the plasma to uniformly settle around the sample. Despite that, around the edge of the sample there are characteristic ring colored light gray due to the concentration of the plasma electromagnetic field and more intense heating, to a temperature between 430 and 450 °C. The central part of the sample, in good thermal and electrical contact with cathode, was retained at a temperature of 430 °C during all nitriding process. Overheating of the edge part of AISI 316L samples at temperatures above 420 °C leads to reaching the solubility limit of nitrogen in the metastable expanded austenite and to precipitation of chromium nitrides [37].

2.3. Mechanical Tests and Microstructural Analysis

The surface hardness of test samples was determined on a Wilson Wolpert Tukon 2100 B microhardness tester (Instron Corporation Inc., Norwood, MA, USA) using the Vickers method, with a load of 1.96 N (HV0.2) on repeated measurements at 10 randomly selected locations on a sample. The initial hardness of the samples was 228 ± 10 HV0.2 Total nitriding depth was determined on metallographically prepared samples using the Vickers method with a load of 0.49 N (HV0.05).
The surface roughness of samples was tested with 5 repetitions using an electromechanical device with a stylus, on the Surface Roughness Tester TR200 (INNOVATEST Europe BV, Maastricht, The Netherlands). The length reading for the measurement of roughness parameters was 1.75 mm and the Gauss filter was used for filtering data (λc = 0.8 mm). After sanding, the mean roughness of samples was Ra = 0.609 ± 0.043 μm, the average height difference was Rz = 4.768 ± 0.639 µm, and the maximum height difference was Rmax = 8.235 ± 2.795 µm.
Microstructure analysis of nitrided AS steel samples was performed on metallographically prepared samples which, after standard preparation by grinding and polishing, were exposed to electrochemical etching in an aqueous solution with 10% oxalic acid, with DC voltage of 8 V and etching duration of 3 min. The microstructure of the electrochemically etched samples was analyzed using the scanning electron microscope Tescan Vega 5136LS(TESCAN GROUP, a.s., Brno-Kohoutovice, Czech Republic), equipped with the energy dispersive spectroscopy (EDS) device Bruker (Bruker AXS GmbH, Karlsruhe, Germany). The EDS line analysis and mapping were performed on 3 randomly selected transverse sites on the metallographic prepared section of each sample.

2.4. Micro-Abrasion Tests

The wear resistance to micro-abrasion was determined using a calotester device (TRIBOtechnic, Clichy, France) with freely rotating ball, shown in Figure 2.
The ball, 2R = 20 mm in diameter, was made of EN 100Cr6 steel, with mass m = 32.6 ± 0.05 g. The abrasive slurry placed on the rotating ball consisted of 3 µm polycrystalline diamonds dispersed in the Struers DP-Suspension P (Struers, S.A.S. Champigny, France). The speed of the ball was 300 rpm. Ball rotation speed and the duration of micro-abrasion test were controlled by a microprocessor. Before tests samples were ultrasonically clean in 95% ethyl alcohol for 3 min and dry in oven at 75 °C for 10 min. The surface of all test samples was micro-abraded in durations from 10 to 60 s in steps of 10 s, with the manual addition of one drop of diamond suspension every 10 s. This feed rate ensures that the contact between the ball and sample was always wet, and that a circular ring was formed in the middle of the ball covered with the diamond suspension. At each specified wear time, a new crater was created on the surface of the sample. The angle of inclination of the sample to the horizontal plane was φ = 55°. This angle enabled continuous and uniform rotation of the ball on the sample without slipping. After micro-abrasion wear process, a spherical crater with a clearly visible diameter remains on the surface of the sample. The samples were again cleaned in 95% ethyl alcohol for 3 min and dried in an oven at 75 °C for 10 min. The spherical cap diameter was observed by an optical stereo microscope BTC STM-3C (Castell Nova Kft, Sopron, Hungary) equipped with camera MicroQ SP-51(Hangzhou ToupTek Photonic Co., Ltd., Hangzhou, China). The resolution of the camera is 5.1 Mpx, and the pixel size is 2.0 µm × 2.0 µm. Measurement of the dimensions of abraded crater was conducted in the image analysis software ToupTek ToupView, version x64, 4.11.19561.20210912 The diameter of the wear scar was measured in parallel and at a perpendicular direction to the ball rotation.
The wear scars were produced with test times of 10 s, 20 s, 30, 40 s, 50 s, and 60 s to obtain the volume loss curve. The number of parameters affect the results of the free rotating ball cratering tests. The most significant of them are [38]: the abrasive material, the abrasive size and shape, the abrasive slurry loading, the type of suspension fluid, the drive shaft rotation speed, the ball mass, its diameter, material, and surface roughness. All these parameters were kept approximately the same during all tests. Assuming that the crater is spherical in shape and that its depth and diameter are significantly smaller than the diameter of the ball, the volume loss of a monolithic material (V) removed from the crater and its depth (h) can be calculated according to the following equations [30,39]:
V π · d 4 64 · R , f o r   d < < R
h   V π · R , f o r   h < < R
in which d is the crater diameter (mm) and R is the ball radius (mm). The wear volume can be deduced as a function of the relative sliding distance (S), and normal load (N) on the contact area and the wear coefficient κ may be calculated from Equation (3), which is an extension of the Archard wear equation [38,40]:
κ = V S · N
The wear path (S) is determined based on the following equation:
S = 2 · R · π · n 60 · t
where R is the ball radius, n is rotation speed, and t is time. The wear path obtained via ball rotation without sliding was in the range of S = 0 m to S = 14.30 m, after 60 s of rotation. The normal load N on the sample surface caused by the ball weights can be calculated from the equation:
N = m · g · cos φ
where m is the ball mass, g = 9.81 ms−2, and φ is the inclination angle of the sample to the horizontal plane. For the test conditions shown in Figure 2, the normal load was N = 0.1834 N.

2.5. DC Electrochemical Tests

For measuring the electrochemical corrosion resistance, samples were researched by direct current DC and alternating current AC techniques in 3.5 wt. % NaCl solution (pH = 6.6) at room temperature (20 ± 2) °C. For electrochemical measurement, the surface of samples was cleaned with ethyl alcohol. Electrochemical DC measurements were obtained using the standard three-electrode system. The counter electrode was platinum, and the reference electrode was a saturated calomel electrode (SCE). Stainless steel specimens (type 1.4401) with different surface nitriding time (0 h, 8 h, 12 h and 24 h) and exposed test area of 78 mm2 were used as the working electrode. Measurements were performed using Potentiostat/Galvanostat VersaSTAT 3 (AMETEK, Princeton Applied Research, Berwyn, PA, USA) with use of the software package VersaStudio v2.44 (AMETEK Scientific Instruments, Berwyn, PA, USA). The volume capacity of the used electrochemical cell (K0235 AMETEK Scientific Instruments, Berwyn, PA, USA) was 250 mL. Changes in the corrosion potential of a metal substrate with coating were tested using the open circuit potential. The reading of the open circuit potentials (Eocp or Ecorr) was performed after stabilizing the system over a time interval of 1000 s. Besides the Ecorr measurement, in order to define susceptibility to pitting corrosion, the pitting potential Epitt and nucleation resistance ΔE were measured. The span of ΔE (EpittEcorr), as small difference between Epitt and Ecorr, indicates higher susceptibility to localized corrosion. The initial potential for cyclic polarization was −0.1 V vs. Ecorr and the vertex potential was 1.2 V vs. Ecorr.

2.6. AC Electrochemical Tests

Electrochemical behavior at the interface of metal/coating/electrolyte phases has a key role in understanding metal behavior (corrosion resistance) in an electrolyte. For that reason, electrochemical impedance spectroscopy (EIS) as a useful and nondestructive technique was performed using VersaSTAT 3 Potentiostat/Galvanostat (AMETEK Scientific 131 Instruments, Princeton applied research, Berwyn, PA, USA), with the application of the appropriate ZsimpWin 3.60 software package. Changes in the corrosion properties were tested in accordance with EN ISO 17475:2008, in 3.5 wt. % NaCl solution (pH = 6.6) at room temperature (20 ± 2) °C. The application of EIS enabled the quantification of the surface layer resistance and the definition of the mechanism of corrosion progression without any degradation of the test surface. It is also highly sensitive and can detect changes on the metal surface over time, allowing for the monitoring of the corrosion process at the interface in real-time. Generally, interface was described with an equivalent electrical circuit (EEC) that contains a specific combination of resistors, inductors, and capacitors. A comparison of experimental results which were obtained by mathematical aligning the measurement data with the theoretical function of the equivalent electrical circuit, represents the basis for interpreting corrosion processes. Measurements were performed after 0 h, 4 h, 8 h, 12 h, and 24 h and are given with Nyquist’s and Bode’s graphs over a wide range of applied potential frequencies (0.1 Hz to over 100 kHz), recording 10 points per decade. The amplitude of the sinusoidal voltage signal was 10 mV. To checks the repeatability of the data; each measurement was executed in three replications.

3. Results and Discussion

3.1. Surface Roughness

Measured results of the surface roughness before and after the plasma nitriding are shown in Table 3 using several amplitude parameters [41]: the arithmetic mean of the magnitude of the deviation of the profile from the mean line (Ra), the root-mean-square value (Rq),the ISO 10-point height parameter (Rz), the maximum height of the profile above the mean line within the sampling length (Rp), the maximum depth of the profile below the mean line (Rv), the maximum peak to valley height of the profile (Rt), and the maximum peak to valley height of the profile in a sampling length (Rmax).
Table 3 and Figure 3 show a decrease in all roughness amplitude parameters after plasma nitriding for 4 h. This phenomenon is a consequence of the sputtering process, in which the surface of the samples is cleaned from the remains of organic impurities, the oxide film is removed, and the surface is smoothed by the action of DC plasma composed of ionized hydrogen, argon, and nitrogen gases. Bombarding the surface of stainless steel with argon and nitrogen ions removes the peaks of micro-unevennesses, sputter iron ions and alloying elements, while hydrogen ions break down the oxide film. After such preparation, in addition to obtaining a physically clean surface, there is also a reduction in surface roughness. In the continuation of the nitriding process, FeN nitrides are deposited on the cleaned surface from the plasma, and nitrogen diffusion into the surface layer and the formation of metastable expanded austenite occurs. By nitriding stainless steel for more than 12 h, a compound layer composed of iron nitride FexNy and chromium nitride CrxNy with different stoichiometric ratios of nitrogen and metal elements begins to form on the surface. The creation and increase in the thickness of the compound layer causes an increase in the value of almost all the amplitude parameters of the surface roughness. After 24 h of nitriding, the surface roughness is practically similar to the roughness in the initial state.

3.2. Hardness and Nitriding Depth

The mean values of 10 surface hardness measurements per individual sample, after plasma nitriding AS steel AISI 316L at 430 °C for 4 h, 8 h, 12 h, and 24 h, are shown in Figure 4. The deviation of the measured hardness values from the mean value is between 8% and 10%. By comparing the hardness of the nitrided sample with the hardness of the sample in the initial state, an increase in hardness is observed with a longer nitriding time. After 4 h and 8 h of nitriding, the hardness of the surface increased very slightly compared to the untreated state. This 60–80% increase in hardness is the result of the formation of a diffusion zone under the surface of the sample, the dissolution of nitrogen in the austenite and the formation of metastable expanded austenite. Nitriding for 12 h increased the surface hardness by 100% compared to the untreated state, whereas after 24 h of nitriding the surface hardness increased by 162% compared to the non-nitrided surface. This increase in hardness indicates the formation of an iron nitride zone on the sample surface and the precipitation of chromium nitride in the compound layer.
The distribution of hardness according to the depth of the nitrided layer, shown in Figure 5, was tested by the Vickers method with a load of 0.491 N by measuring two sets of hardness with distances between impressions of 50 μm. The hardness of the core was 190–200 HV0.05.
The effective depth of nitriding, determined as the distance from the surface where the measured hardness is greater than the hardness of the core by 50 HV0.05, is 6–8 μm for the sample nitrided for 8 h, 10–12 μm for the sample nitrided for 12 h, and 18–20 μm for the sample nitrided for 24 h. From the distribution of hardness by layer depth, an increase in nitriding depth and surface hardness can be observed with longer nitriding time.

3.3. EDS and Microstructure Analysis

Figure 6 shows the microstructure of the nitrided layer on an AISI 316L steel after nitriding at 430 °C for 4 h and 8 h observed with light microscopy (LM) on a Metallurgical microscope KERN OKO 178 (KERN & SOHN GmbH, Balingen, Germany), and after 12 h and 24 h observed with the scanning electron microscopy (SEM) on a device Tescan Vega 5136LS. The LM measured thickness of a nitride layer after PN treatment for 4 h and 8 h was 3–4 μm and 6–9 μm, respectively. A nitride layer achieved after PN treatment for the duration of 12 h has a thickness between 11 and 14 μm and, as can be observed in Figure 6c, it consists of the expanded austenite with a very thin top layer of brittle nitrides. In the expanded austenite sub layer, grains were of equal size and similar shape, without visible nitride precipitates. Figure 6d shows a significantly thicker nitride layer, compared with the previously described one, with precipitates of iron and chromium nitrides on the grain boundaries. The thickness of this layer, which was formed after 24 h of plasma nitriding, had values between 16 and 20 μm. The results of the SEM analysis of the nitrided layer coincide with the results of the microhardness test.
The elemental composition of the nitrided layers on an AISI 316L steel was determined via line EDS analysis with device Bruker. The distribution of elements in the surface layer after nitriding at 430 °C/12 h is shown in Figure 7. The formation of iron and chromium nitrides is confirmed by the increased presence of elements iron (Fe), chromium (Cr), and nitrogen (N) in the compound layer. Below, there is a thin layer of the expanded austenite (S-phase) with decreased content of Fe and Cr. Above the S-phase toward to the surface, an increased presence of Fe, Cr, and N can be observed at distances from 22 to 25 μm in Figure 7. This is caused by formation of compound layer formed from metal elements (Fe, Cr) diffused from steel core and nitrogen (N) diffused from the ionized H2-N2 plasma.
The distribution of elements in the surface layer after nitriding of an AS steel AISI 316L at 430 °C/24 h is shown in Figure 8. In this sample, there is an even greater amount of chromium (Cr) in the compound layer than in the sample nitrated for 12 h, while the amount of iron (Fe) is smaller. This relationship between iron and chromium is a consequence of the local concentration of chromium at the grain boundaries in the form of CrN precipitates.
Microstructure analysis and EDS distribution of chemical elements by depth of nitrided layers on an AISI 316L steel samples confirmed the assumptions about the formation of a hard and brittle zone of increased hardness and increased values of roughness amplitude parameters.

3.4. Micro-Abrasion Wear Resistance

The micro-abrasive wear results of nitrided samples of an AISI 316L AS steel are shown in Figure 9. Using Equation (1), the volume of the sample material (V) removed from the crater after wear for 10–60 s was determined. Using Equations (4) and (5), the product S·N was determined, consisting of the wear path (S) after the given wear time and the normal force at the point of contact between the ball and the sample (N). The dependence of the wear volume V on the wear path, i.e., the SN product, was determined using linear regression analysis. The coefficient of micro-abrasive wear κ, which physically represents the wear rate, is calculated according to Equation (3) for wear time between 10 and 60 s. From the change in the coefficient of micro-abrasion wear depending on the SN product, shown in Figure 8b, unstable wear can be observed during 10–40 s, then the values of the coefficient are set at the characteristic values for each nitrated sample. The amounts of the coefficient of micro abrasive wear after 60 s of wear are shown in Table 4. The depth of the crater (h) after 60 s of micro-abrasion wear was calculated by Equation (2) and shown in Figure 9c.
From the comparison of the coefficients of micro-abrasion wear, a significantly higher rate of wear can be observed in samples nitrated for 12 h and 24 h compared to samples nitrated for 4 h and 8 h and the non-heat-treated sample. These results derive from the microstructure and properties of the nitrided layer and the test conditions. During micro-abrasive wear of the soft surface of non-nitrided 316L steel, larger abrasive particles are pressed into the surface of the sample and the abrasive suspension accumulates around the crater, while a smaller number of abrasive particles remain stuck to the ball of the calotester. Therefore, with the rotation of the calotester balls, the abrasive particles between the ball and the soft surface of the sample simultaneously rotate and move. The result of such micro-abrasive wear with the simultaneous rotation of the ball and microparticles is a relatively small diameter and depth of craters in the surface of non-nitrided steel, as well as a small wear coefficient κ = 1.2336 × 10⁻⁴ mm3/Nm. Additionally, a clearly visible sign of wear remains on the calotester ball after wear. Micro abrasion wear of the nitrided layer with ductile expanded austenite formed after 4 h and 8 h of nitriding shows wear characteristics similar to non-nitrided austenitic steel. At the same time, the amounts of wear coefficients are slightly higher than the coefficient of non-nitrided steel.
The amount of the wear coefficient of samples nitrated for 12 h and 24 h are significantly higher than the coefficients of samples nitrated for 4 h and 8 h. This phenomenon can be explained by the appearance of a different mechanism of micro abrasive wear and the effect of precipitated nitrides on the grain boundaries of expanded austenite. In the case of these, longer nitrided samples, the surface hardness is higher than in non-nitrided austenite steel, and the abrasive particles are not pressed into the nitrided layer but remain mostly stuck to the ball of the calotester. Therefore, in this case, pure abrasive wear occurs with grooves and removal of particles from the nitrided surface with minimal rolling of abrasive particles between the sample and the calotester ball. On the other hand, in the nitrided layer, hard and brittle nitrides of iron and chromium are secreted along the grain boundaries, which additionally promote abrasive wear, after they break off and mix with the diamond grains in the abrasive suspension. During the wear of the nitrided sample for 12 h and 24 h, significantly less wear of the calotester ball was observed than when the wear of the soft samples of non-nitrided steel was observed. The shown action of micro abrasives on the soft or hard surface of the sample and the results of the micro abrasion test are described in refs. [34,35,36]. From the comparison of the coefficients of micro-abrasive wear and the calculated depth of the crater, it can be concluded that short-term plasma nitriding of AS steel, lasting 4–8 h, is more favorable than long-term plasma nitriding of 12–24 h from the aspect of better resistance to abrasive wear.
The appearance of the crater after 60 s of micro-abrasion wear of the nitrided sample with a ball with a diameter of 20 mm at 300 rpm is shown in Figure 10 for nitriding times of 4 h, 8 h, 12 h, and 24 h.
Photographs of the worn surface were taken under the same conditions on a stereo microscope BTC STM-3C equipped with camera MicroQ SP-51 at a magnification of 40:1. The appearance of the worn surface in the crater is characteristic for pure abrasion wear. In the crater, one can clearly see parallel grooves and scratches created during removal of sample material by action of diamond grains from the suspension enveloped around a steel ball. The grooves are orientated in the ball rolling direction. The craters which are formed on the samples after 60 s of testing are circular in shape with a mean diameter shown in Table 4. By comparing the diameter of the craters, a significant increase in craters dimension can be observed on samples nitrated for 12 h and 24 h compared to samples nitrated for 4 h and 8 h. In the interior of the crater in Figure 10b, on the sample that was nitrided for 24 h, micro porosity and microcracks can be observed, which were created by the formation of a brittle and partially porous nitride layer on the surface and the release of nitride needles along the grain boundaries. In the process of abrasive wear, such weakened places contribute to a greater loss of mass and an increase in the diameter of the crater.
From the results of micro-abrasion wear, shown in Figure 9 and in Table 4, it can be seen that nitriding of an AS steel AISI 316L in plasma at a temperature of 430 °C for a duration of more than 8 h does not achieve an increase in wear resistance, but an unfavorable decrease. This unfavorable influence of the nitriding time at a temperature of 430 °C on the wear resistance of an AS steel AISI 316L agrees with the results and conclusions of several papers [17,18,42]. Increased wear resistance can be expected when nitriding at temperatures between 350 °C and 400 °C, with the formation of a surface layer of expanded austenite (S-phase), whereas the formation of a layer with a mixture of hard iron and chromium nitrides on the surface or their precipitation along grain boundaries in the edge layer reduces the micro-abrasion wear resistance of AS steel. As a rule, it can be observed that a thicker nitride layer and a larger amount of nitride precipitates cause a greater reduction in the wear resistance. In [42], it was concluded that plasma nitriding temperatures between 350 and 400 °C led to the best wear properties of AS steel due to the maximum amount of the S-phase and no chromium nitrides. At this temperature interval, increasing the duration of nitriding has no critical impact on wear resistance, but only on the increasing nitriding depth and microhardness of the S-phase. When nitriding at a temperature of 430 °C and higher, a longer nitriding duration of 8 h causes the formation of a thicker layer of iron and chromium nitrides, which is hard and brittle and wears out faster than the softer, but tougher, layer of expanded austenite.

3.5. Electrochemical DC Measurements

In the initial phase of the polarization measurement, the system was stabilized in such a way that after immersion in in 3.5 wt. % NaCl water solution at room temperature (20 ± 2) °C, the electrical circuit between the working and counter electrodes was left open, and the potential difference between the reference and working electrodes was recorded as a function of time [43,44]. The measured numerical values of open circuit potentials for heat-untreated and nitrided AS steel AISI 316L samples (4 h, 8 h, 12 h and 24 h) were recorded after stabilization in 3.5 wt. % NaCl water solution at room temperature (20 ± 2) °C and are shown in Table 5. Graphical values of corrosion potentials are given in Figure 10.
From the measured numerical values of the corrosion potential presented in Table 5 and graphically interpreted in Figure 11, information on the corrosion stability of the samples in the test electrolyte was obtained. After closely established stationary state (t = 1000 s), when the test samples are in equilibrium with the environment (anodic and cathodic currents are equal in magnitude, but in opposite directions), it is visible and expected that heat-untreated (blank) sample has a more positive Ecorr than samples with an inhomogeneous nitrided surface. This fact indicates that the oxide film on a AS steel AISI 316L is more resistant to corrosion then surface films on the nitrided samples, under the same electrolyte corrosion load. According to curve E-t for the heat-untreated sample, an oscillation of the curve can be observed. Such potential oscillation can be correlated with the increased corrosion activity caused by surface instability and material dissolution.
From the numerical and graphical values of Ecorr (Table 5 and Figure 10), it can be concluded that nitriding time has no significant influence on the corrosion stability of the samples of nitrided AISI 316L steel in the test medium. It is also possible to notice that the slope of the curve is much milder in the case of the heat-untreated sample, and that all four curves were shifted in a negative direction, which indicates the corrosion instability of the working electrodes in the chloride medium. All samples showed the same trend and good repeatability of the results [45,46].
From the numerical and graphical values of Ecorr (Table 5 and Figure 11), it can be concluded that nitriding time has no significant influence on the corrosion stability of the samples of nitrided AISI 316L steel in the test medium. It is also possible to notice that the slope of the curve is much milder in the case of the heat-untreated sample, and that all four curves were shifted in a negative direction which indicates the corrosion instability of the working electrodes in the chloride medium. All samples showed the same trend and good repeatability of the results [45,46].
To define susceptibility to pitting corrosion, the pitting potential (Epitt) was measured. The initial potential for cyclic polarisation was −0.1 V vs. Ecorr and the vertex potential was 1.2 V vs. Ecorr. The cyclic polarisation curves obtained in 3.5 wt. % NaCl solution at room temperature (20 ± 2) °C for heat-untreated and plasma-nitrided samples are shown in Figure 12. Table 5 presents the quantitative electrochemical parameters, Epitt and ΔE, collected from the polarization curves in Figure 12.
In the case of the heat-untreated AS steel AISI 316L, it can be seen that the heat-untreated sample does not show an evident passive area like samples with a nitrided surface do, and that the current density increases sharply when the potential is higher than about 376 mV vs. SCE (Table 5) [47]. It is well known that this sudden increase in current density is caused by the break-through of the passive layer on stainless steel and present the potential Epitt at which pitting corrosion initiates in the chloride ion containing environment [46,48]. On the other hand, samples with a nitrided surface generally showed a tendency for passivation, which indicates that the nitrided layer can protect the substrate, providing a good barrier against localized attack at a lower potential range (from −78 to 200 mV vs. SCE), except for the sample where nitriding lasted longer than 12 h. In that case, a sample with 24 h surface nitriding showed better resistance against localized attacks at higher potential.
The value of Epitt for the sample PN 430 °C/24 h was 470 mV vs. SCE, which is 94 mV more positive than the Epitt value of the blank sample (Table 5). However, after Epitt, the anodic current density rapidly raised with the potential which indicates that the nitrided layer had become porous or too thin to withstand the corrosion loading caused by chloride ions [46,48]. Specific behaviours of different nitrided samples to local corrosion loads can be reasonably explained considering two reasons: the nitrogen surface concentration and the thickness of the modified layers. According to data from the literature, it can be concluded that the different amounts of nitrogen in AS steels have a great influence on their resistance to pitting corrosion [49,50]. According to Table 5 and Figure 12, due to the high chloride concentration, pitting branch starts at relatively low anodic potential values (about +200 mV) [51]. At the highest polarization potentials, the anodic current values of the nitrided samples are sensibly reduced in respect of the untreated steel sample and are limited only by concentration polarization phenomena [50]. When it comes to susceptibility to localized corrosion, it can be concluded from Table 5 that the smallest value of pitting nucleation resistance (ΔE) or the highest resistance to localized corrosion has a sample PN 430 °C/24 h (ΔE = 814 mV) with the with the thickest compound layer. ΔE values for other three samples are approximately equal which strongly demonstrate the important role of the nitriding time on the adsorption mechanism and the pit initiation [52,53,54]. The anodic potentiodynamic polarization curves obtained in the present investigation were similar to those previously published for the nitrided AS steel in chloride-containing solutions [55,56,57,58].

3.6. Electrochemical AC Measurements

Electrochemical behaviour at borders of metal/electrolyte phases is a key factor in understanding metal behaviour in an electrolyte [43]. For that reason, electrochemical impedance spectroscopy (EIS) was used to evaluate the resistance and protection of the untreated and nitrided surface. Since the application of the AC measuring technique, during the implementation of EIS, enables the quantification of the resistance of surface layers and the definition of the mechanism of corrosion progression without any degradation of the test surface, the numerical and graphical data obtained by this method are extremely important in determining the corrosion resistance of metal surfaces. For this reason, the dominant data needed to determine the resistance of the base substrate and barrier layers is manifested through the variation of resistance and capacity values; thus, information about the degradation of protective layers and substrates is obtained by indicating the oscillation of the resistance and capacity values, which ultimately results in a change in the impedance value [43,44].
Constant phase element (CPE), used in equivalent circuit, is applied in the case when the inhomogeneity (coating) of the system is affected by surface roughness and porosity and when the porosity of the newly created nitrided film needs to be compensated. Its impedance is defined by the following equations:
Z C P E = Q 1 ( j ω ) n
C = Q ω m a x n 1
In which Q denotes the proportionality constant (CPE), n the empirical exponent or phase shift (−1 ≤ n ≤ 1), ω the angular frequency, root of −1 (imaginary unit), C the capacity, and ωmax the angular frequency in which the imaginary component impedance Z″ reaches the maximum of the time constant. In this way, the impedance spectrum of a distributed system is explained, which cannot be interpreted by a finite number of ideal electrical elements. In the case when 0.6 < n ≤ 1, CPE represents a capacitor of capacity Q; for n = 1, CPE represents an ideal coil Q = L; for n = 0.5, CPE represents Warburg impedance Q = W; for values of n = 0, CPE represents an ideal resistor Q = R [43,44].
In order to further study the electrochemical behavior of the of AS steel 316L samples with heat-untreated and plasma-nitrided surfaces, equivalent circuits were used to simulate the EIS data. The layer shown in Figure 12 is porous (different thickness) with electrochemical reactions occurring only on the exposed electrode surface at the end of the pore. The equivalent circuit with two constant models corresponding to the scheme of the coated electrode is presented in Figure 13.
On the equivalent circuit meaning of the labels are as follows: Rs is the solution resistance. Rn and Qn are the pore resistance and constant phase element, i.e., an imperfect capacitor of oxide/nitride layer. Furthermore, Rct represents the charge transfer resistance; the double electric layer constant phase element is defined with size Qct and the chi-square value (χ2) method was used to assess the goodness of fit between measured and simulated data.
The EIS measurements were carried out in 3.5 wt. % NaCl solution at room temperature (20 ± 2) °C. The impedance spectrum was recorded at the open circuit potential. The amplitude of the sinusoidal voltage signal was 10 mV, while the detection of the current response was performed in the frequency range of 100 kHz–100 mHz [54]. The results of the EIS measurements and corresponding fitting results are shown in Table 6.
The Bode and Nyquist diagrams of the heat-untreated and nitrided AS steel samples with the corresponding equivalent circuit model applied for the simulation of EIS results are presented in Figure 14a,b. The response of the EIS spectrum at higher, medium, and lower frequencies is shown in Figure 15.
The results of EIS tests shown in Table 6, confirm that heat-untreated sample has the highest corrosion resistance, which is evident from the increased value of the charge transfer resistance (Rct = 9.947 × 10³ Ωcm2) at the borders between substrate and 3.5 wt. % NaCl solution. In contrast to untreated samples, nitrided samples have smaller and approximately equal corrosion resistance values, PN 430 °C/4 h (Rct = 2.794 × 10³ Ωcm2), PN 430 °C/8 h (Rct = 1.697 × 10³ Ωcm2), PN 430 °C/12 h (Rct = 1.890 × 10³ Ωcm2), PN 430 °C/24 h. Additionally, resistance values are confirmed by the radius r, which represents capacitive semicircles in the Nyquist diagrams, shown in Figure 14b. The radius of the capacitive loop for blank (untreated) sample is more extensive than nitrided samples, where a decreased diameter is associated with the lower corrosion resistance of the porose-nitrided film. Lower values of the nitrided surface resistance and higher values of their capacity are a common indicator of the electrolyte absorption through the pores, i.e., worse preservation and durability of the surface layer (Table 6), which can also be a partial consequence of too-thin layers. The Bode plot also confirms that the blank untreated sample has the higher value of the resistance and lower value of capacity which is evident from the curve in Figure 14a. It is also evident from Bode’s diagram that the curves of the nitrided samples have approximately equal values and that their slope remains constant. According to Figure 15, all phase angles (except PN 430 °C/4 h) of nitrided samples are between 50° and 70°, with a shift of the approximately constant height peak to the left (towards lower frequencies), which proves that there was an increase in the double layer capacity. Untreated sample phase angle is around 65° and the maximum is detected at medium frequency values (15 Hz) [43,54,59].

4. Conclusions

DC plasma nitriding leads to improved tribological and corrosion properties of the surface layer on AS steel AISI 316L. From previous research conducted with a low-temperature plasma nitriding of 316L austenitic stainless steel, the optimal process temperature/time window was found between 420 and 450 °C/4 and 20 h. Such a combination of parameters might result in a nitrided layer composed of the expanded austenite (S-phase) without significant precipitation of iron or chromium nitrides on the grain boundaries or in the top of the surface. However, the desire to realize the processing process with lower energy consumption sets the requirements for shortening the processing time while achieving good resistance to corrosion and wear. In plasma nitriding experiments of AS steel AISI 316L at a temperature of 430 °C, the effect of nitriding time 4–24 h on surface roughness, and mechanical, tribological, and corrosion properties was investigated.
The all-surface roughness amplitude parameters were decreased after PN (except for PN process lasting 24 h) compared to the untreated state, because of the sputtering process applied before plasma nitriding treatment. With prolongation of nitriding time at 4–12 h, all surface roughness parameters were increased due to the formation of the nitrogen-supersaturated S-phase and Fe and Cr nitrides in the surface layer.
The surface hardness after nitriding for 4–12 h is in the value range of 365–459 HV0.2, while after nitriding for 24 h the hardness increases significantly to 597 HV0.2. The increase in surface hardness and roughness after nitriding at 430 °C/24 h parameters is an indication of the formation of a thin nitride layer on the S-phase layer. However, the increase in surface hardness achieved by nitriding longer than 8 h did not result in an increase in resistance to micro abrasion or to corrosion in salt solution. The nitrided layer with hard and brittle Fe and Cr nitrides precipitated after 430 °C/12–24 h nitriding wears out faster than the softer but tougher S-phase created during 430 °C/4–8 h PN treatment.
Heat-untreated sample has a more positive Ecorr than samples with inhomogeneous nitrided surfaces, which indicates that the oxide film on stainless steel is more resistant to corrosion then surface films on the nitrided samples, under the same electrolyte corrosion load. It can also be concluded that nitriding time has no significant influence on the corrosion stability of nitrided AS steel AISI 316L in the test medium.
Heat-untreated AS steel AISI 316L does not show an evident passive area as samples with a nitrided surface and that the current density increases sharply at pitting potential Epitt = 376 mV vs. SCE. Samples with a nitrided surface generally showed tendency for passivation, which indicates that the nitrided layer provides a good barrier against localized attacks at a lower potential range (from −78 to 200 mV vs. SCE). Samples with 24 h surface nitriding showed the best resistance against pitting corrosion at higher potential. The value of Epitt for the sample PN 430 °C/24 h was 470 mV vs. SCE. It can be concluded that the different amount of nitrogen in AS steels and nitriding time has a great influence on their resistance to pitting corrosion due to nitrogen surface concentration and the thickness of the modified porous layer.
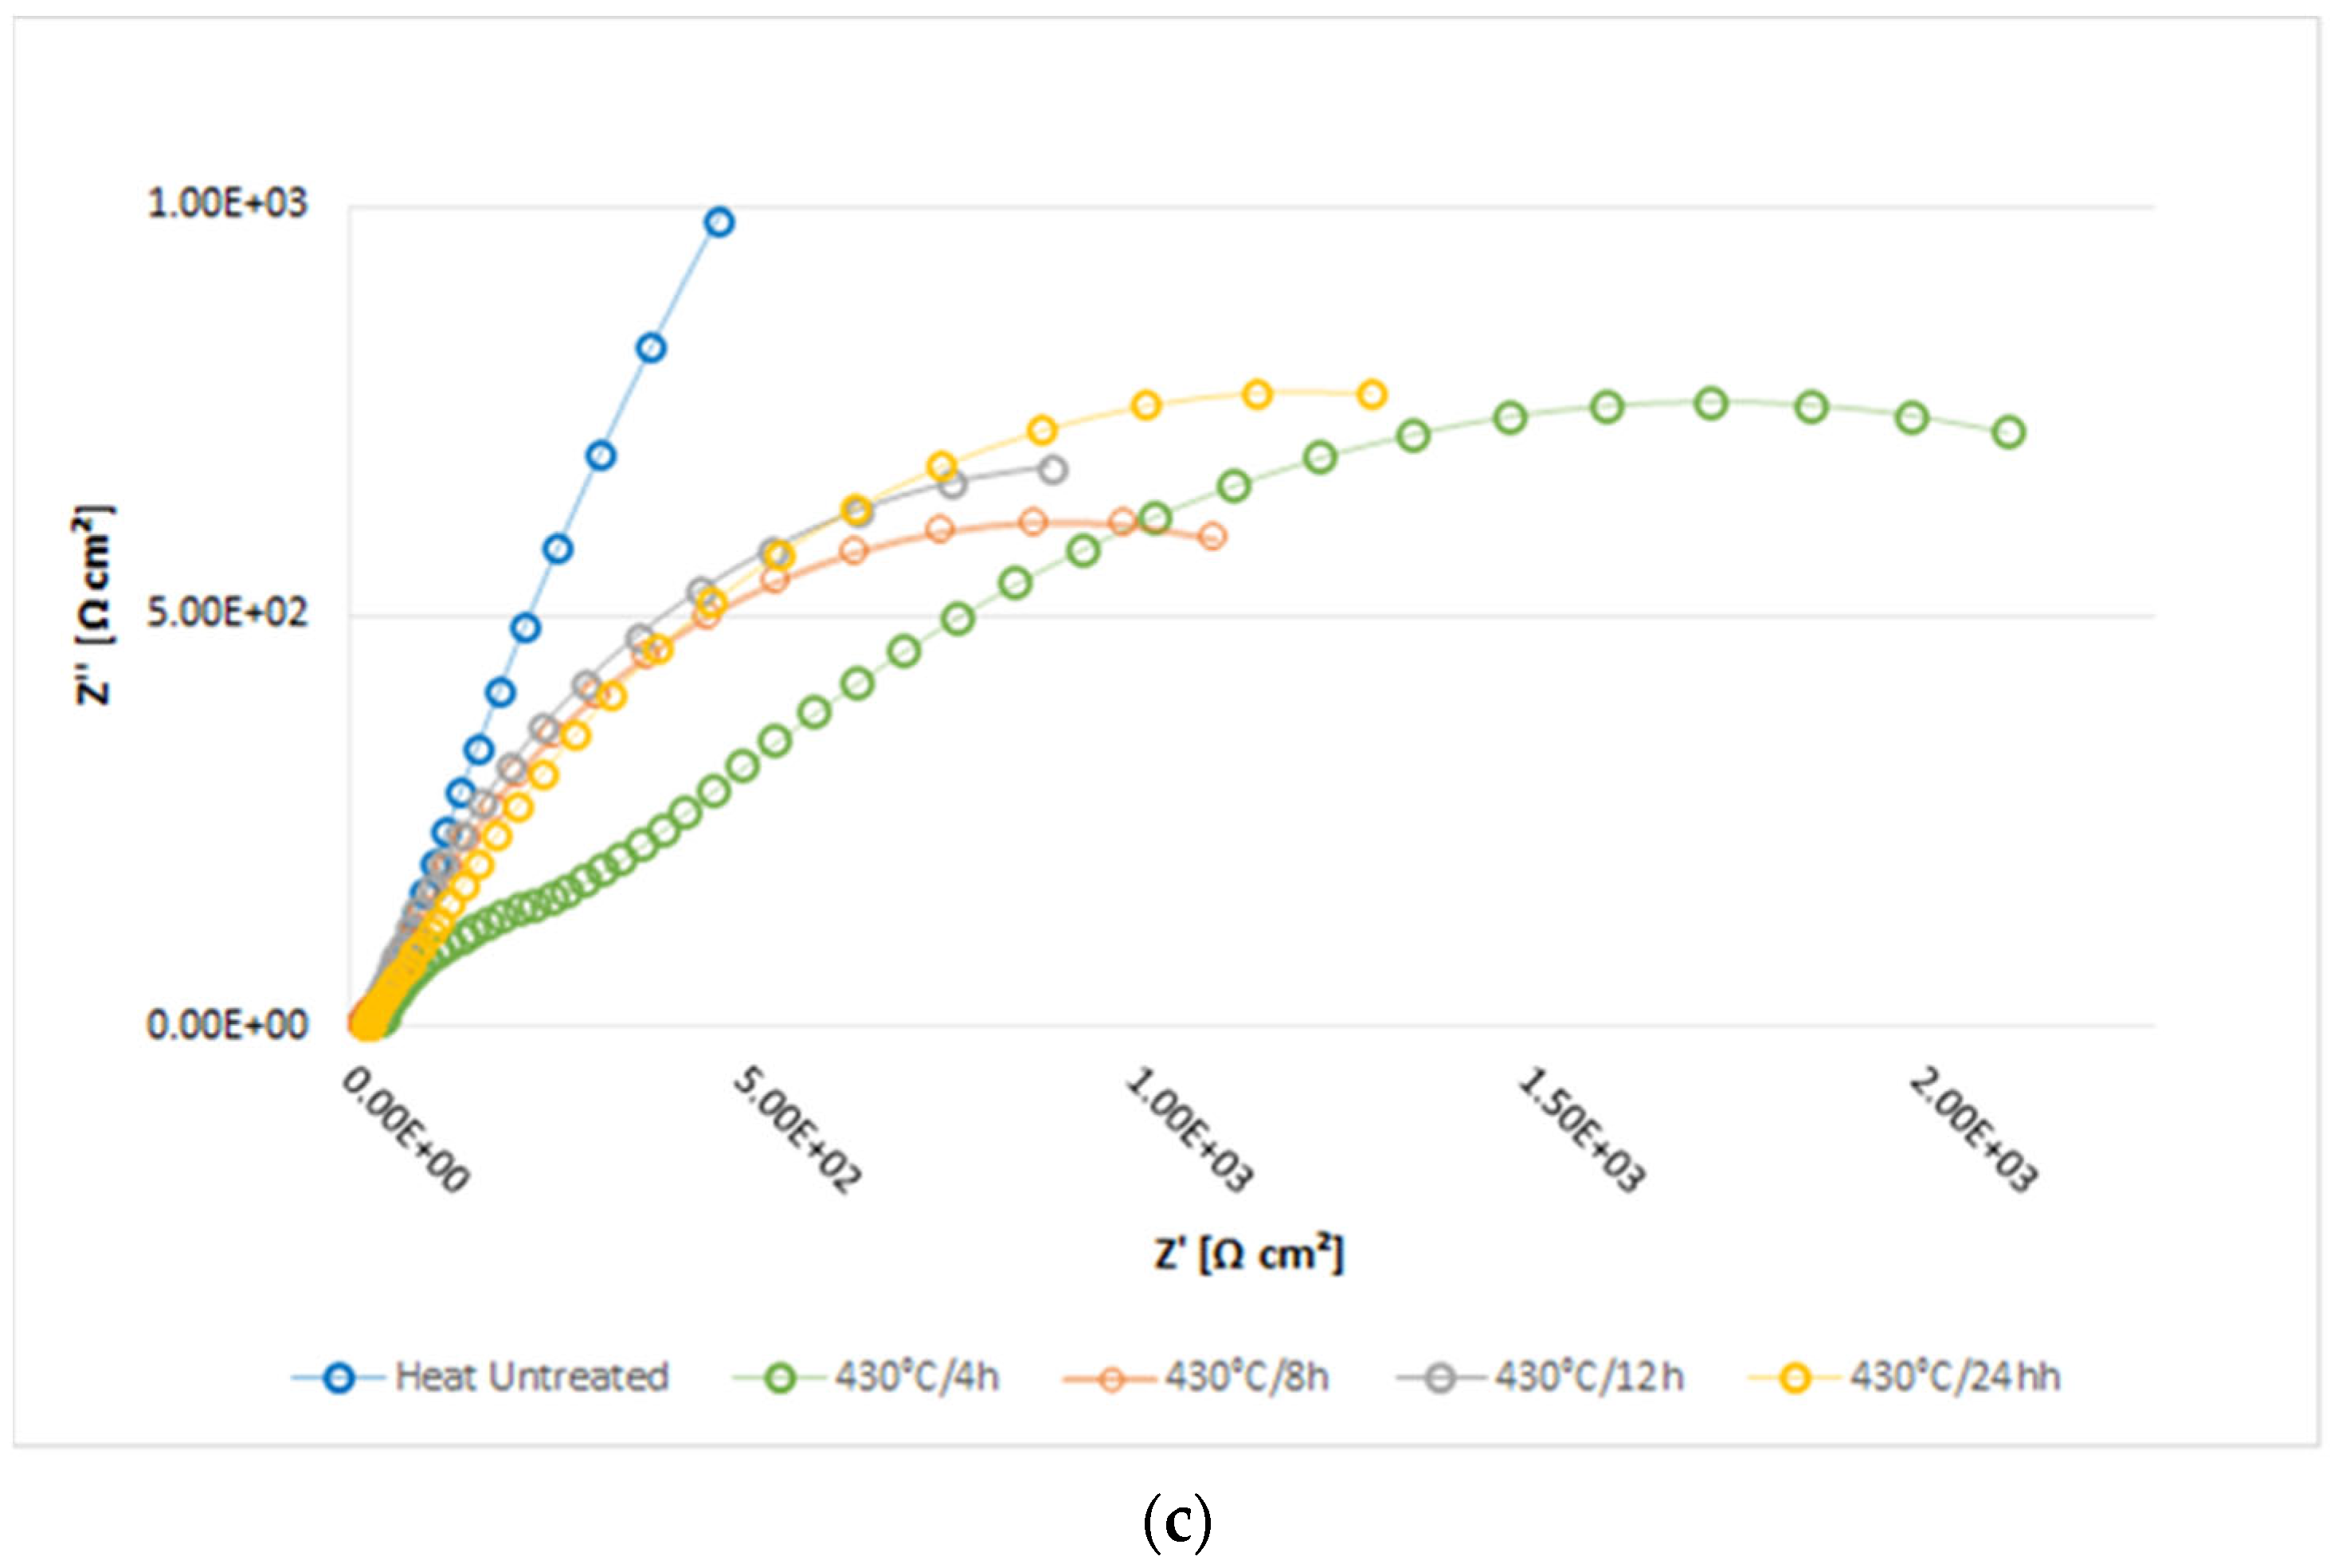
The results of EIS shown in Table 6, confirm that heat-untreated sample has the highest corrosion resistance. Opposite to untreated sample, nitrided samples have smaller and approximately equal corrosion resistance values. Lower values of the nitrided surface resistance and higher values of their capacity are a common indicator of the electrolyte absorption through the pores, i.e., worse preservation and durability of the surface layer.
The conducted tests of plasma-nitrided AS steel AISI 316L provided an insight into the dependence of mechanical, tribological and corrosion properties on the nitriding time, with minimal influence of the substrate on the tests results and measured properties of the thin nitrided layer. The applied test methods (surface roughness measurement, microhardness test, metallographic examination, micro abrasion testing, EIS, and cyclic polarization testing) complement each other and are confirmed by the obtained results in a way that they can be recommended as a reliable procedure for the basic characterization of a thin nitrided layer’s properties on stainless steels.

Author Contributions

Conceptualization, D.L. and M.K.; methodology, D.L. and M.K.; software, J.J. and S.J.; validation, D.L., I.S. and M.K.; formal analysis, D.L. and M.K.; investigation, I.S. and J.J.; resources, S.J.; data curation, S.J., I.S. and J.J.; writing—original draft preparation, D.L. and M.K.; writing—review and editing, D.L., M.K. and I.S.; visualization, D.L., M.K., I.S., J.J. and S.J.; supervision, D.L., M.K. and I.S. All authors have read and agreed to the published version of the manuscript.

Funding

This research was funded by the Ministry of Science and Education (MSE) of Republic Croatia together with the Central Agency for Financing and Contracting Programs and Projects of the European Union (SAFU), Croatia through the funding grant KK.01.1.1.07.0045—Development of an anti-corrosion protection system for the multi-purpose use of pipes.

Institutional Review Board Statement

Not applicable.

Informed Consent Statement

Not applicable.

Data Availability Statement

Not applicable.

Acknowledgments

The authors wish to acknowledge the projects KK.01.1.1.07.0045 “Development of an anti-corrosion protection system for the multi-purpose use of pipes”, funded from the Ministry of Science and Education of Republic Croatian and The Central Agency for Financing and Contracting Programs and Projects of the European Union (SAFU) for their financial support.

Conflicts of Interest

The authors declare no conflict of interest.

References

  1. Dillon, C.P. Corrosion Resistance of Stainless Steels, 1st ed.; Marcel Dekker, Inc.: New York, NY, USA, 1995. [Google Scholar]
  2. Lo, K.H.; Shek, C.H.; Lai, J.K.L. Recent developments in stainless steels. Mater. Sci. Eng. R Rep. 2009, 65, 39–104. [Google Scholar] [CrossRef]
  3. Kim, D.W.; Chang, J.H.; Ryu, W.S. Evaluation of the creep–fatigue damage mechanism of Type 316L and Type 316LN stainless steel. Int. J. Press. Vessel. Pip. 2008, 85, 378–384. [Google Scholar] [CrossRef]
  4. Rokhlin, S.I.; Kim, J.-Y.; Nagy, H.; Zoofan, B. Effect of pitting corrosion on fatigue crack initiation and fatigue life. Eng. Facture Mech. 1999, 62, 425–444. [Google Scholar] [CrossRef]
  5. Sharma, M.K.; Saikia, B.K.; Phukan, A.; Ganguli, B. Plasma nitriding of AS steel in N2 and N2–H2 dc pulsed discharge. Surf. Coat. Technol. 2006, 201, 2407–2413. [Google Scholar] [CrossRef]
  6. Egawa, M.; Ueda, N.; Nakata, K.; Tsujikawa, M.; Tanaka, M. Effect of additive alloying element on plasma nitriding and carburizing behavior for AS steels. Surf. Coat. Technol. 2010, 205, S246–S251. [Google Scholar] [CrossRef]
  7. Fewell, M.P.; Mitchell, D.R.G.; Priest, J.M.; Short, K.T.; Collins, G.A. The nature of expanded austenite. Surf. Coat. Technol. 2000, 131, 300–306. [Google Scholar] [CrossRef]
  8. Bell, T. Surface engineering of AS steel. Surf. Eng. 2002, 18, 415–422. [Google Scholar] [CrossRef]
  9. Sun, Y.; Bell, T.; Kolosvary, Z.; Flis, J. The Response of AS Steels to Low-temperature Plasma Nitriding. Heat Treat. Met. 1999, 1, 9–16. [Google Scholar]
  10. Thaiwatthana, S.; Li, X.Y.; Dong, H.; Bell, T. Mechanical and chemical properties of low temperature plasma surface alloyed 316 AS steel. Surf. Eng. 2002, 18, 140–144. [Google Scholar] [CrossRef]
  11. Czerwiec, T.; Renevier, N.; Michel, H. Low-temperature plasma-assisted nitriding. Surf. Coat. Technol. 2000, 131, 267–277. [Google Scholar] [CrossRef]
  12. Li, G.Y.; Lei, M.K. Microstructure and Properties of Plasma Source Nitrided AISI 316 AS Steel. J. Mater. Eng. Perform. 2017, 26, 418–423. [Google Scholar] [CrossRef]
  13. Keddama, M.; Thiriet, T.; Marcos, G.; Czerwiec, T. Characterization of the expanded austenite developed on AISI 316 LM steel by plasma nitriding. J. Min. Metall. Sect. B Metall. 2016, 53, 47–52. [Google Scholar] [CrossRef]
  14. De Las Heras, E.; Ybarra, G.; Lamas, D.; Cabo, A.; Dalibon, E.L.; Brühl, S.P. Plasma nitriding of 316L stainless steel in two different N2-H2 atmospheres—Influence on microstructure and corrosion resistance. Surf. Coat. Technol. 2017, 313, 47–54. [Google Scholar] [CrossRef]
  15. Mingolo, N.; Tschiptschin, A.P.; Pinedo, C.E. On the formation of expanded austenite during plasma nitriding of an AISI 316L AS steel. Surf. Coat. Technol. 2006, 201, 4215–4218. [Google Scholar] [CrossRef]
  16. Fossati, A.; Borgioli, F.; Galvanetto, E.; Bacci, T. Corrosion resistance properties of glow-discharge nitrided AISI 316L AS steel in NaCl solutions. Corros. Sci. 2006, 48, 1513–1527. [Google Scholar] [CrossRef]
  17. Gokcekaya, O.; Ergun, C.; Gulmez, T.; Nakano, T.; Yilmaz, S. Structural Characterization of Ion Nitrided 316L AS Steel: Influence of Treatment Temperature and Time. Metals 2022, 12, 306. [Google Scholar] [CrossRef]
  18. Aizawa, T.; Yoshino, T.; Morikawa, K.; Yoshihara, S.-I. Microstructure of plasma nitrided AISI420 martensitic stainless steel at 673 K. Crystals 2019, 9, 60. [Google Scholar] [CrossRef]
  19. Larisch, B.; Brusky, U.; Spies, H.J. Plasma nitriding of stainless steels at low temperatures. Surf. Coat. Technol. 1999, 119, 205–211. [Google Scholar] [CrossRef]
  20. Singh, G.P.; Alphonsa, J.; Barhai, P.K.; Rayjada, P.A.; Raole, P.M.; Mukherjee, S. Effect of surface roughness on the properties of the layer formed on AISI 304 stainless steel after plasma nitriding. Surf. Coat. Technol. 2006, 200, 5807–5811. [Google Scholar] [CrossRef]
  21. Cisquini, P.; Ramos, S.V.; Viana, P.R.P.; Lins, V.D.F.C.; Franco, A.R., Jr.; Vieira, E.A. Effect of the roughness produced by plasma nitrocarburizing on corrosion resistance of AISI 304 AS steel. J. Mater. Res. Technol. 2019, 8, 1897–1906. [Google Scholar] [CrossRef]
  22. Flis, J.; Kuczynska, M. Impedance of Cr18Ni10 stainless steel in sulphate solutions after a low-temperature plasma nitriding. Mater. Corros. 2003, 54, 953–956. [Google Scholar] [CrossRef]
  23. Flis, J.; Kuczynska, M. Effect of Low-Temperature Plasma Nitriding on Corrosion of 304L Stainless Steel in Sulfate and Chloride Solutions. J. Electrochem. Soc. 2004, 151, B573–B580. [Google Scholar] [CrossRef]
  24. Nakajima, M.; Nakamura, Y.; Suzuki, K.; Bai, Y.; Uematsu, Y. Effect of solution treatment after nitriding on fatigue properties in type 304 stainless steel. Int. J. Fatigue 2014, 68, 103–110. [Google Scholar] [CrossRef]
  25. Zhao, C.; Li, C.X.; Dong, H.; Bell, T. Study on the active screen plasma nitriding and its nitriding mechanism. Surf. Coat. Technol. 2006, 201, 2320–2325. [Google Scholar] [CrossRef]
  26. Oliveira, R.M.; Ueda, M.; Silva, L.L.G. Characteristics of AS Steel Nitrided in a Hybrid Glow Discharge Plasma. Braz. J. Phys. 2009, 39, 554–558. [Google Scholar] [CrossRef]
  27. Díaz-Guillén, J.C.; Granda-Gutiérrez, E.E.; Vargas-Gutiérrez, G.; Díaz-Guillén, M.R.; Aguilar-Martínez, J.A.; Álvarez-Contreras, L. Effect of Nitriding Current Density on the Surface Properties and Crystallite Size of Pulsed Plasma-Nitrided AISI 316L. J. Mater. Sci. Chem. Eng. 2015, 3, 45–51. [Google Scholar] [CrossRef]
  28. Alves, C., Jr.; Rodrigues, J.A.; Martinelli, A.E. The effect of pulse width on the microstructure of dc-plasma-nitrided layers. Surf. Coat. Technol. 1999, 122, 112–117. [Google Scholar] [CrossRef]
  29. Wang, J.; Xiong, J.; Peng, Q.; Fan, H.; Wang, Y.; Li, G.; Shen, B. Effects of DC plasma nitriding parameters on microstructure and properties of 304L stainless steel. Mater. Charact. 2009, 60, 197–203. [Google Scholar] [CrossRef]
  30. Fernandes, F.A.P.; Heck, S.C.; Pereira, R.G.; Lombardi-Neto, A.; Totten, G.E.; Castelettim, L.C. Wear of plasma nitrided and nitrocarburized AISI 316L AS steel. J. Achiev. Mater. Manuf. Eng. 2010, 40, 175–179. [Google Scholar]
  31. Staia, M.H.; Enriquez, E.; Puchi, E.S.; Lewis, D.B.; Jeandin, M. Application of Ball Cratering Method to Study Abrasive Wear. Surf. Eng. 1998, 14, 49–54. [Google Scholar] [CrossRef]
  32. de Mello, J.D.B.; Binder, C.; Binder, R.; Klein, A.N. Effect of nature of nitride phases on microabrasion of plasma nitrided sintered iron. Tribol. Mater. Surf. Interfaces 2010, 4, 191–196. [Google Scholar] [CrossRef]
  33. Stack, M.M.; Mathew, M.T. Mapping the micro-abrasion resistance of WC/Co based coatings in aqueous conditions. Surf. Coat. Technol. 2004, 183, 337–346. [Google Scholar] [CrossRef]
  34. Axén, N.; Jacobson, S.; Hogmark, S. Influence of hardness of the counterbody in three-body abrasive wear—An overlooked hardness effect. Tribol. Int. 1994, 27, 233–241. [Google Scholar] [CrossRef]
  35. Camerini, R.V.; de Souza, R.B.; de Carli, F.; Pereira, A.S.; Balzaretti, N.M. Ball cratering test on ductile materials. Wear 2011, 271, 770–774. [Google Scholar] [CrossRef]
  36. Resendiz-Calderon, C.D.; Farfan-Cabrera, L.I.; Oseguera-Pen, J.E.; Cazares-Ramırez, I.; Gallardo-Hernandez, E.A. Friction and Wear of Metals under Micro-abrasion, Wet and Dry Sliding Conditions. J. Mater. Eng. Perform. 2020, 220, 6228–6238. [Google Scholar] [CrossRef]
  37. Olzon-Dionysio, M.; Campos, M.; Kapp, M.; de Souza, S. Influences of plasma nitriding edge effect on properties of 316L stainless steel. Surf. Coat. Technol. 2010, 204, 3623–3628. [Google Scholar] [CrossRef]
  38. Shipway, P.H. The role of test conditions on the microabrasive wear behaviour of soda-lime glass. Wear 1999, 233–235, 191–199. [Google Scholar] [CrossRef]
  39. Rutherford, K.L.; Hutchings, I.M. Micro-scale abrasive wear testing of PVD coatings on curved substrates. Tribol. Lett. 1996, 2, 1–11. [Google Scholar] [CrossRef]
  40. Allsopp, D.N.; Hutchings, I.M. Micro-scale abrasion and scratch response of PVD coatings at elevated temperatures. Wear 2001, 251, 1308–1314. [Google Scholar] [CrossRef]
  41. Whitehouse, D. Surfaces and Their Measurement; Hermes Penton Science: London, UK, 2002. [Google Scholar]
  42. Li, G.J.; Peng, Q.; Li, C.; Wang, Y.; Gao, J.; Chen, S.Y.; Wang, J.; Shen, B.L. Effect of DC plasma nitriding temperature on microstructure and dry-sliding wear properties of 316L stainless steel. Surf. Coat. Technol. 2008, 202, 2749–2754. [Google Scholar] [CrossRef]
  43. Kurtela, M.; Šimunović, V.; Stojanović, I.; Alar, V. Effect of the Cerium (III) Chloride Heptahydrate on the Corrosion Inhibition of Aluminium Alloy. Mater. Corros. 2019, 71, 125–147. [Google Scholar] [CrossRef]
  44. Barsoukov, E.; Macdonald, J.R. Impedance Spectroscopy Theory, Experiment, and Applications, 2nd ed.; John Wiley & Sons Inc.: Hoboken, NJ, USA, 2005. [Google Scholar] [CrossRef]
  45. Aleksandrov Fabijanić, T.; Šnajdar, M.; Kurtela, M.; Šimunović, V.; Marciuš, M.; Klaić, M. Corrosion Resistance of Nanostructured Cemented Carbides with Alternative FeNi and FeNiCo Binders. Nanomaterials 2023, 13, 1407. [Google Scholar] [CrossRef]
  46. Fathy, M.H.; Wafaa, A.G. Effect of nitrogen on the corrosion behavior of AS steel in chloride solutions. Mater. Lett. 2005, 59, 3311–3314. [Google Scholar] [CrossRef]
  47. Aleksandrov Fabijanić, T.; Kurtela, M.; Škrinjarić, I.; Pötschke, J.; Mayer, M. Electrochemical Corrosion Resistance of Ni and Co Bonded Near-Nano and Nanostructured Cemented Carbides. Metals 2020, 10, 224. [Google Scholar] [CrossRef]
  48. Yang, L.; Yongyong, H.; Jianxun, Q.; Jun, Z.; Qianwen, Y.; Yijie, Z.; Junyuan, M. Enhancement of Pitting Corrosion Resistance of AS Steel Through Deposition of Amorphous/Nanocrystalline Oxy-nitrided Phases by Active Screen Plasma Treatment. Mater. Res. 2018, 21, 1–10. [Google Scholar] [CrossRef]
  49. Baba, H.; Kodama, T.; Katada, Y. Role of nitrogen on the corrosion behavior of AS steels. Corros. Sci. 2002, 44, 2393–2407. [Google Scholar] [CrossRef]
  50. Yang, L.; Zhuo, W.; Liang, W. Surface properties of nitrided layer on AISI 316L AS steel produced by high temperature plasma nitriding in short time. Appl. Surf. Sci. 2014, 298, 243–250. [Google Scholar] [CrossRef]
  51. Borgioli, F.; Fossati, A.; Galvanetto, E.; Bacci, T. Glow-discharge nitriding of AISI 316L AS steel: Influence of treatment time. Surf. Coat. Technol. 2006, 200, 3511–3517. [Google Scholar] [CrossRef]
  52. Olzon-Dionysio, M.; Souza, S.D.; Basso, R.L.O. Application of Mössbauer spectroscopy to the study of corrosion resistance in NaCl solution of plasma nitrided AISI 316L stainless steel. Surf. Coat. Technol. 2008, 202, 3607–3614. [Google Scholar] [CrossRef]
  53. Borgioli, F.; Fossati, A.; Galvanetto, E.; Bacci, T. Glow-discharge nitriding of AISI 316L AS steel: Influence of treatment temperature. Surf. Coat. Technol. 2005, 200, 2474–2480. [Google Scholar] [CrossRef]
  54. Yang, L.; Shangzhou, Z.; Yongyong, H.; Lei, Z. Characteristics of the nitrided layer formed on AISI 304 AS steel by high temperature nitriding assisted hollow cathode discharge. Mater. Des. 2014, 64, 527–534. [Google Scholar] [CrossRef]
  55. Singh, V.; Marchev, K.; Cooper, K.V.; Meletis, E.I. Intensified plasma-assisted nitriding of AISI 316L stainless steel. Surf. Coat. Technol. 2002, 160, 249–258. [Google Scholar] [CrossRef]
  56. Lei, M.K.; Zhu, X.M. Plasma-based low-energy ion implantation of AS steel for improvement in wear and corrosion resistance. Surf. Coat. Technol. 2005, 193, 22–28. [Google Scholar] [CrossRef]
  57. Baranowska, J.; Arnold, B. Corrosion resistance of nitrided layers on austenitic steel. Surf. Coat. Technol. 2006, 200, 6623–6628. [Google Scholar] [CrossRef]
  58. Yang, W.J.; Zhang, M.; Zhao, Y.H.; Shen, M.L.; Lei, H.; Xu, L.; Xiao, J.Q.; Gong, J.; Yu, B.H.; Sun, C. Enhancement of mechanical property and corrosion resistance of 316L stainless steels by low temperature arc plasma nitriding. Surf. Coat. Technol. 2016, 298, 64–72. [Google Scholar] [CrossRef]
  59. Tian, S.; Liu, Z.; Shen, L.; Pu, J.; Liu, W.; Sun, X.; Li, Z. Performance evaluation of mercapto functional hybrid silica sol–gel coating and its synergistic effect with f-GNs for corrosion protection of copper surface. RSC Adv. 2018, 8, 7438–7449. [Google Scholar] [CrossRef]
Figure 1. Appearance of test samples after nitriding in plasma at 430 °C: (a) samples placed on the cathode of a vacuum furnace (after nitriding for 8 h); (b) appearance of the samples after nitriding 12 h (left sample) and 24 h (right sample).
Coatings 13 01854 g001
Figure 2. Micro-abrasion wear by the freely rotating ball method: (a) a detail of testing on the TRIBOtechnic Calotester device; (b) the relationship between the geometric dimensions of the ball and the crater on the surface of the sample.
Coatings 13 01854 g002
Figure 3. Changes in the main surface roughness parameters after plasma nitriding of an AISI 316L steel at 430 °C with a process duration of 4 h, 8 h, 12 h, and 24 h compared to the heat-untreated state.
Coatings 13 01854 g003
Figure 4. Surface hardness of the AS steel AISI 316L after plasma nitriding at 430 °C with a process duration of 4 h, 8 h, 12 h, and 24 h compared to a heat-untreated state.
Coatings 13 01854 g004
Figure 5. Distribution of hardness according to the depth of the nitrided AS steel AISI 316L after plasma nitriding at 430 °C with a process duration of 8 h, 12 h, and 24 h.
Coatings 13 01854 g005
Figure 6. Microstructure of the surface layer on an AISI 316L AS steel after plasma nitriding at 430 °C with a process duration of: (a) 4 h (LM); (b) 8 h (LM); (c) 12 h (SEM); (d) 24 h (SEM).
Coatings 13 01854 g006
Figure 7. AISI316L AS steel after plasma nitriding at 430 °C in duration of 12 h: (a) microstructure; (b) chemical composition of the surface layer.
Coatings 13 01854 g007
Figure 8. AISI 316L AS steel after plasma nitriding at 430 °C in duration of 24 h: (a) microstructure; (b) chemical composition of the surface layer.
Coatings 13 01854 g008
Figure 9. Results of micro-abrasive wear of a nitrided AS steel AISI 316L: (a) loss of volume from the calotte crater against SN product; (b) wear coefficient κ; (c) crater depth after 60 s wear.
Coatings 13 01854 g009
Figure 10. Crater on the surface of AISI 316L steel samples nitrided in plasma at 430 °C after 60 s of micro-abrasive wear with a 20 mm diameter ball coated with a diamond suspension. Nitriding time: (a) 4 h; (b) 8 h; (c) 12 h; (d) 24 h.
Coatings 13 01854 g010
Figure 11. Open circuit potential (Ecorr) vs. time curves of tested samples.
Coatings 13 01854 g011
Figure 12. Cyclic polarization curves of heat-untreated and nitrided samples of AS steel AISI 316L in 3.5% NaCl water solution.
Coatings 13 01854 g012
Figure 13. The equivalent circuit model R(Q(R(QR))) that was used to analyze the EIS plot.
Coatings 13 01854 g013
Figure 14. The results of EIS tests conducted on heat-untreated and nitrided AS steel AISI 316L: (a) Bode plot; (b) Nyquist plot; (c) detail of the Nyquist plot for low values of Z’.
Coatings 13 01854 g014aCoatings 13 01854 g014b
Figure 15. Phase angle as a function of the frequency of heat-untreated and nitrided AS steel AISI 316L.
Coatings 13 01854 g015
Table 1. Elementary composition of the AISI 316L AS steel.
Elementswt.%+/−
C0.050.02
Si0.940.09
Mn1.530.16
Cr16.590.30
Ni9.460.42
Mo2.000.04
P0.0300.005
S0.0180.005
Table 2. Parameters of sputtering pre-treatment and plasma nitriding of test samples.
Heat TreatmentPlasma Processing Conditions
Constant parametersTemperature430 °C ± 5 °C
Discharge voltage360 V DC
Pressure2 mbar
Sputtering phaseSputtering duration2 h
Power of DC plasma generator1400 W
Flow rates of gases H2/N2/Ar140 dm3/h (H2)/10 dm3/h (N2)/15 dm3/h (Ar)
Duty cycle85%
Plasma nitriding phaseNitriding duration4 h8 h12 h24 h
Power of DC plasma generator2800 W
Flow rates of gases H2/N2/Ar120 dm3/h (H2)/40 dm3/h (N2)/10 dm3/h (Ar)
Duty cycle90%
Table 3. Surface roughness parameters of the plasma-nitrided AISI 316L AS steel.
Rz, μmRa, μmRq, μmRt, μmRp, μmRv, μmRmax, μm
Heat-untreated4.7680.6090.8438.2321.6063.1628.235
±0.320±0.021±0.038±1.397±0.088±0.232±1.398
PN 430 °C/4 h2.9600.4480.5583.6251.3901.5713.470
±0.029±0.008±0.003±0.094±0.040±0.015±0.362
PN 430 °C/8 h3.4740.4590.6265.1861.2492.2264.860
±0.041±0.006±0.002±0.101±0.050±0.010±0.240
PN 430 °C/12 h4.0030.5700.7415.8411.6522.3525.635
±0.028±0.003±0.002±0.327±0.050±0.023±0.428
PN 430 °C/24 h6.2130.7611.04810.0702.4923.7219.995
±0.604±0.039±0.065±2.719±0.599±0.005±2.795
Table 4. The mean crater diameter (Dc) and coefficient of micro-abrasive wear κ after 60 s testing of AISI 316L steel samples.
Sample TreatmentDc, µmκ·10−4, mm3/Nm
Heat-untreated542 ± 281.2336
Plasma-nitrided 430 °C/4 h486 ± 522.4370
Plasma-nitrided 430 °C/8 h553 ± 253.4282
Plasma-nitrided 430 °C/12 h964 ± 556.6560
Plasma-nitrided 430 °C/24 h868 ± 408.3489
Table 5. The results of electrochemical DC techniques applied on heat-untreated and nitrided AS steel AISI 316L.
SampleTs [°C]Ecorr vs. SCE [mV]Epitt vs. SCE
[mV]
ΔE
[mV]
Heat-untreated20 ± 2−175376551
PN 430 °C/4 h20 ± 2−246141387
PN 430 °C/8 h20 ± 2−305192497
PN 430 °C/12 h20 ± 2−369198567
PN 430 °C/24 h20 ± 2−344470814
Table 6. The results of electrochemical impedance spectroscopy (AC) technique applied on the heat-untreated and plasma-nitrided samples of the AS steel AISI 316L.
SampleTs
[°C]
Rs
[Ωcm2]
Qn
[Fcm−2]
n1Rn
[Ωcm2]
Qct
[Fcm−2]
n1Rct
[Ωcm2]
χ2
Heat-untreated20 ± 22.109 × 1015.434 × 10−50.7801.311 × 1022.761 × 10−50.8429.947 × 1031.874 × 10−4
PN 430 °C/4 h20 ± 22.268 × 1012.774 × 10−50.7463.300 × 1022.824 × 10−40.6032.794 × 1034.075 × 10−4
PN 430 °C/8 h20 ± 22.772 × 1013.216 × 10−40.7496.860 × 1012.952 × 10−40.8171.697 × 1032.008 × 10−4
PN 430 °C/12 h20 ± 22.067 × 1014.797 × 10−40.7983.695× 1013.848 × 10−40.7811.890 × 1031.406 × 10−4
PN 430 °C/24 h20 ± 22.263 × 1011.715 × 10−40.8201.621 × 1023.291 × 10−40.7182.201 × 1036.132 × 10−5
Disclaimer/Publisher’s Note: The statements, opinions and data contained in all publications are solely those of the individual author(s) and contributor(s) and not of MDPI and/or the editor(s). MDPI and/or the editor(s) disclaim responsibility for any injury to people or property resulting from any ideas, methods, instructions or products referred to in the content.

