Abstract
Nowadays, it has become a trend to use finite element simulation instead of experimental processes, and this is widely used in the fields of structural mechanics, fluid mechanics, fracture mechanics, and so on. By replacing the experimental process with finite element simulation, we can reduce time and costs; however, when using finite element simulation, we need to define a series of settings, such as modeling, material assignment, environment settings, and many other operations. For laser shock processing intensification, the simulation experiment process is cumbersome and time-consuming. It involves performing neural network agent modeling, replacing finite element simulation with the learning and prediction capabilities of neural networks, learning by using some of the simulation results as a training sets for the neural network, and then learning by using the remaining simulation results as testing sets to test the predictive ability of the neural network agent model. TC4 titanium alloy was selected as the experimental material. Three kinds of neural network agent models, a genetic algorithm-optimized BP network, a strong classifier design based on BP_Adaboost, and an extreme learning machine, instead of finite element simulation experiments, were used to predict the residual stresses generated on the surfaces of the material under different laser shock parameters. Comparing the prediction performances of different neural network agent models, the genetic algorithm-optimized BP network shows the best prediction performance, and its prediction value matches well with the experimental value. The R2, RMSE, and MAE of the testing sets of the BP network optimized using the genetic algorithm were 0.9985, 44.4518, and 30.6285, respectively. The BP network agent model optimized using the genetic algorithm for laser shock parameters other than the 208 sets of data also had good prediction performance, and the predicted values were similar to the actual experimental results. The prediction results show that the BP network optimized using the genetic algorithm can predict the residual stresses on the surface of TC4 titanium alloy material under strengthening via laser shock processing; the genetic algorithm-optimized BP neural network agent model is more convenient and quicker compared to the finite element simulation, and the predicted value is also similar to the actual value. It can thus be used to replace finite element simulation by establishing a more convenient and quicker neural network agent model.
1. Introduction
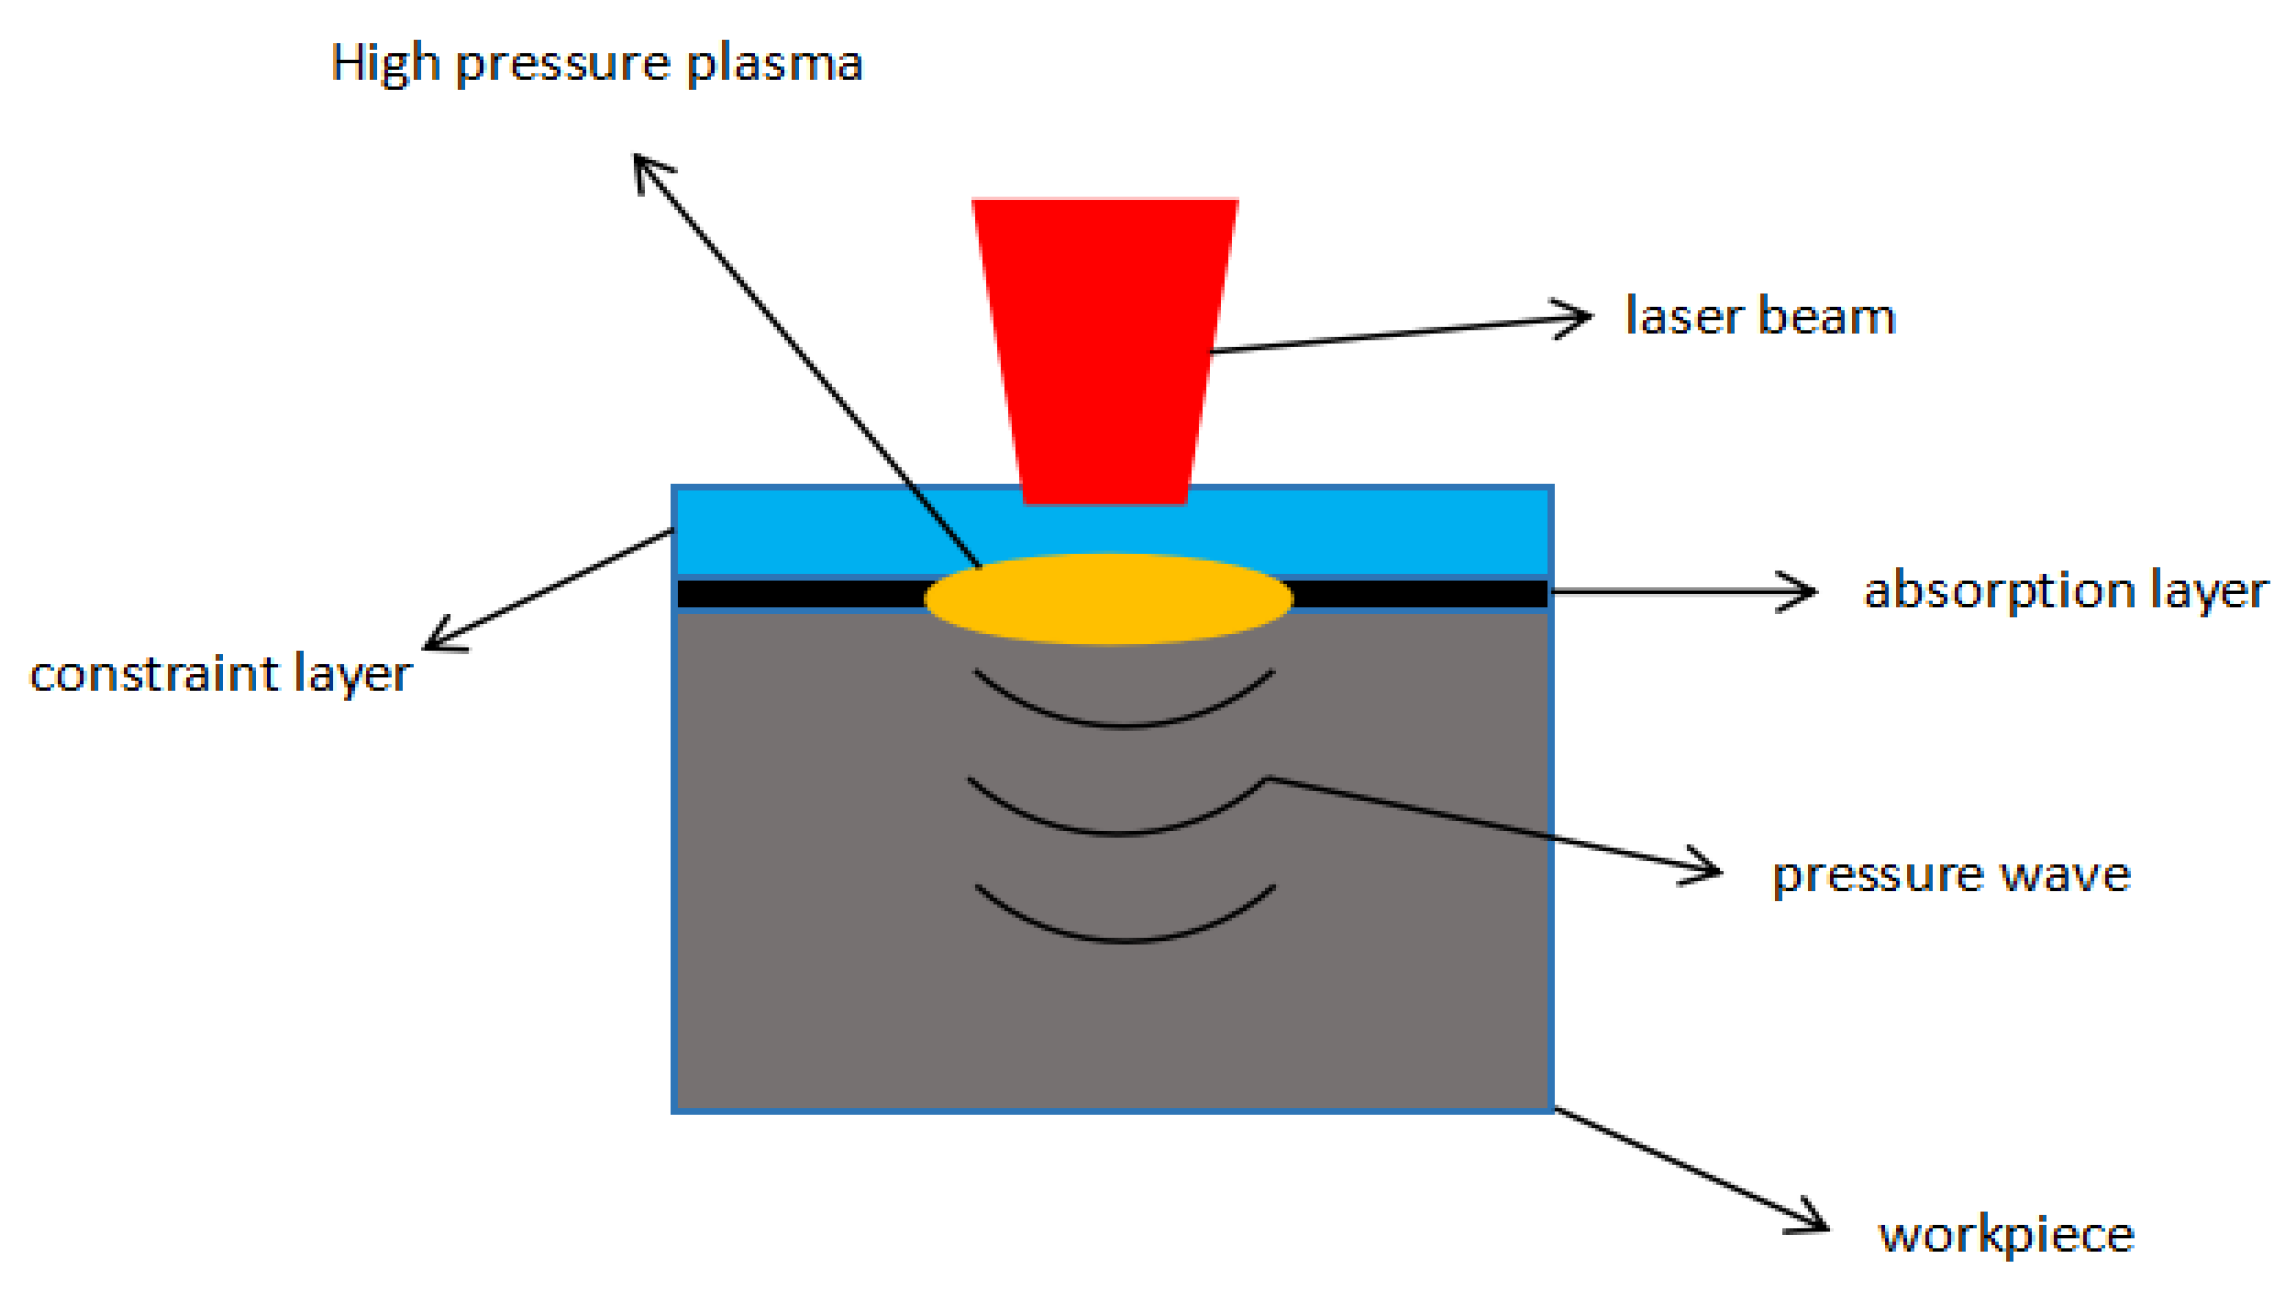
With the rapid development seen in the aviation industry, fatigue fracture problems are commonplace in aero-engine blades and disks. How to improve the fatigue resistance of materials while keeping the basic properties of materials unchanged, so as to improve the reliability of aero-engines and prolong their life, has become a growing concern in aerospace academics [1]. In recent years, surface peening technology has gained a lot of attention internationally, resulting in a series of industrial programs for surface peening, such as shot peening [2], the surface rolling method, and many other strengthening processes [3]. Among them, laser shock processing utilizes the high energy and power of a laser beam to instantaneously subject the surface of the material to extremely high temperature and pressure, resulting in intense plastic deformation and grain refinement effects [4]. When used in engineering processing, this basically does not produce any thermal effects on the material, and can greatly improve the fatigue resistance of the material and the service life of the workpiece. Nowadays, the laser shock processing process is increasingly becoming a research hot spot [5]. The laser shock processing of materials changes the residual stress on the surface of the material, improving the life and reliability of the workpiece, and it has a wide range of applications in surface-strengthening processes.
The detection of residual stresses on the surface of a material after laser shock processing is cumbersome, and requires a lot of time and high economic costs. It is common to use finite element software to simulate the laser shock processing process and to obtain the residual stresses on the surface and inside a material after laser shock processing. The comparison of the simulation calculation results with the actual processing results proves that finite element simulation software can be used to replace laser shock processing, thus reducing the time and costs required for experiments.
With the rapid developments seen in science and technology, Artificial Intelligence (AI) has entered a new stage of development. Combining AI methods and techniques with the modeling, simulation, and optimization of the production process can produce new and better solutions, freeing people not only from physical labor but also from intellectual labor [6,7,8]. This opens up the basis for adopting neural networks as an alternative to finite element simulation.
Neural network agent models can be built on the basis of the in-depth learning of existing data to make fast and accurate predictions of data under unknown parameters [9,10]. In this paper, firstly, the orthogonal experimental design method is used to select the parameters for laser shock processing experiments. The laser pulse energy, optical class radius and overlap rate are used as inputs, and residual stress is used as the output to perform finite element simulation calculations on laser shock processing under different parameters, and a total of 208 sets of data on the residual stress on the surface of the strengthened material are recorded. In total, 80% of the experimental data from the 208 datasets are randomly selected as the training set, and the remaining 20% of the experimental data are used as the testing set. A genetic algorithm (GA)-optimized back propagation (BP) network, a strong classifier design based on BP_Adaboost (BP_Adaboost), and extreme learning machines (ELM) are used to construct agent models. The results of the residual stresses generated under different laser shock processing parameters are predicted, and the predicted results are compared with the test set to analyze the prediction performance of the neural network models established under different network structures. The work in this paper provides new solutions for predicting the residual stresses generated in materials after laser shock processing.
2. Establishment of Simulation Model
2.1. Model Parameters
The finite element simulation software was used to establish the TC4 titanium alloy plate model. The chemical composition of TC4 titanium alloy is shown in Table 1 below [11], and the basic mechanical properties of the TC4 titanium alloy are shown in Table 2 below [11]. The Johnson-Cook intrinsic model takes into account the effects of large strains and high strain rates on the material’s behavior, and is applied in explicit/implicit finite element models [12]. The parameters of the Johnson-Cook intrinsic model for the TC4 titanium alloy are shown in Table 3 below [11]. In the table, A is the yield strength of the material; B is the work-hardening modulus; n is the hardening coefficient; C reflects the strain-hardening effect of the material; ε is the plastic strain; T0 is the room temperature; Tm is the melting point of the material; and m reflects the temperature softening effect of the material.

Table 1.
Normal chemical composition of TC4 titanium alloy.
Table 2.
Basic mechanical properties of TC4 titanium alloy.
Table 3.
Parameters of Johnson-Cook ontological model for TC4 titanium alloy.
Simulation of Laser Shock Processing
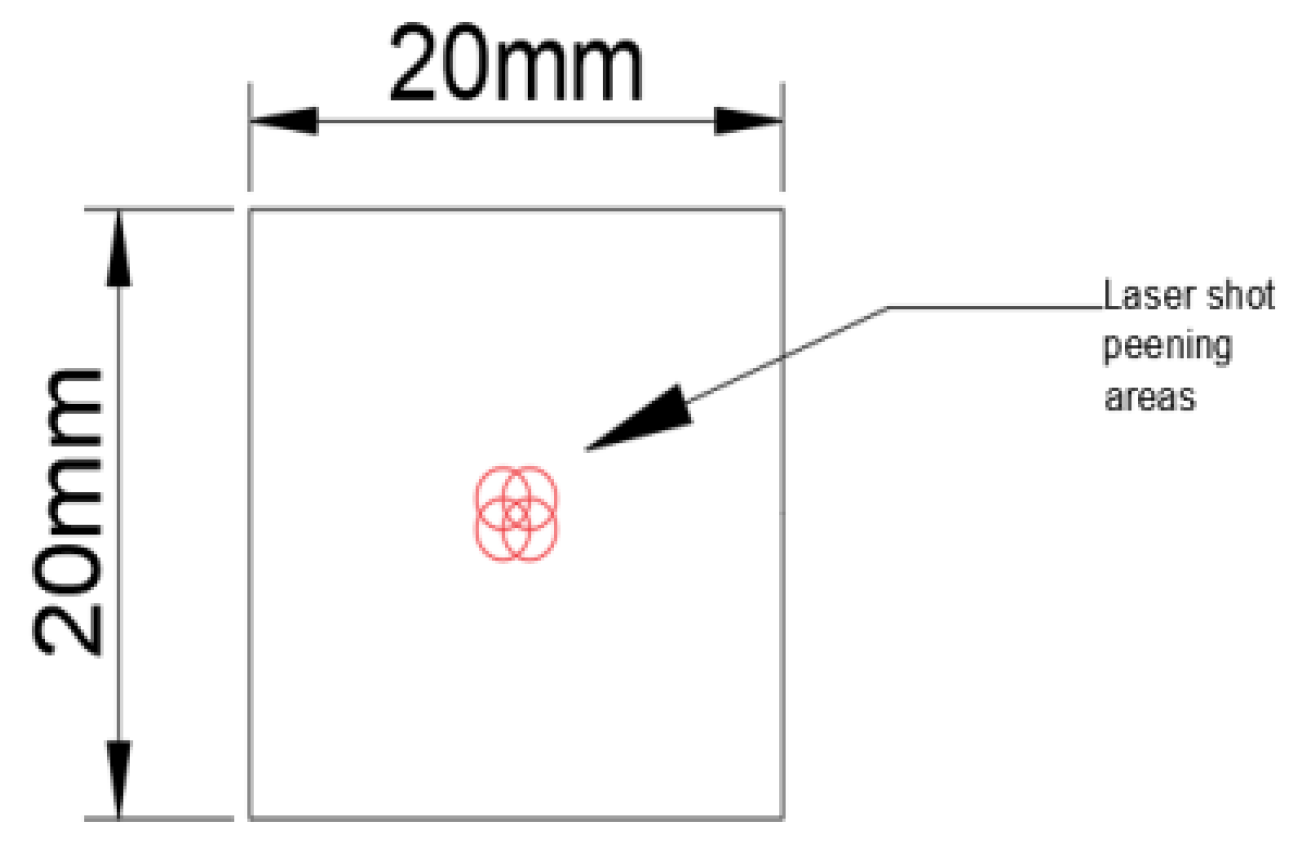
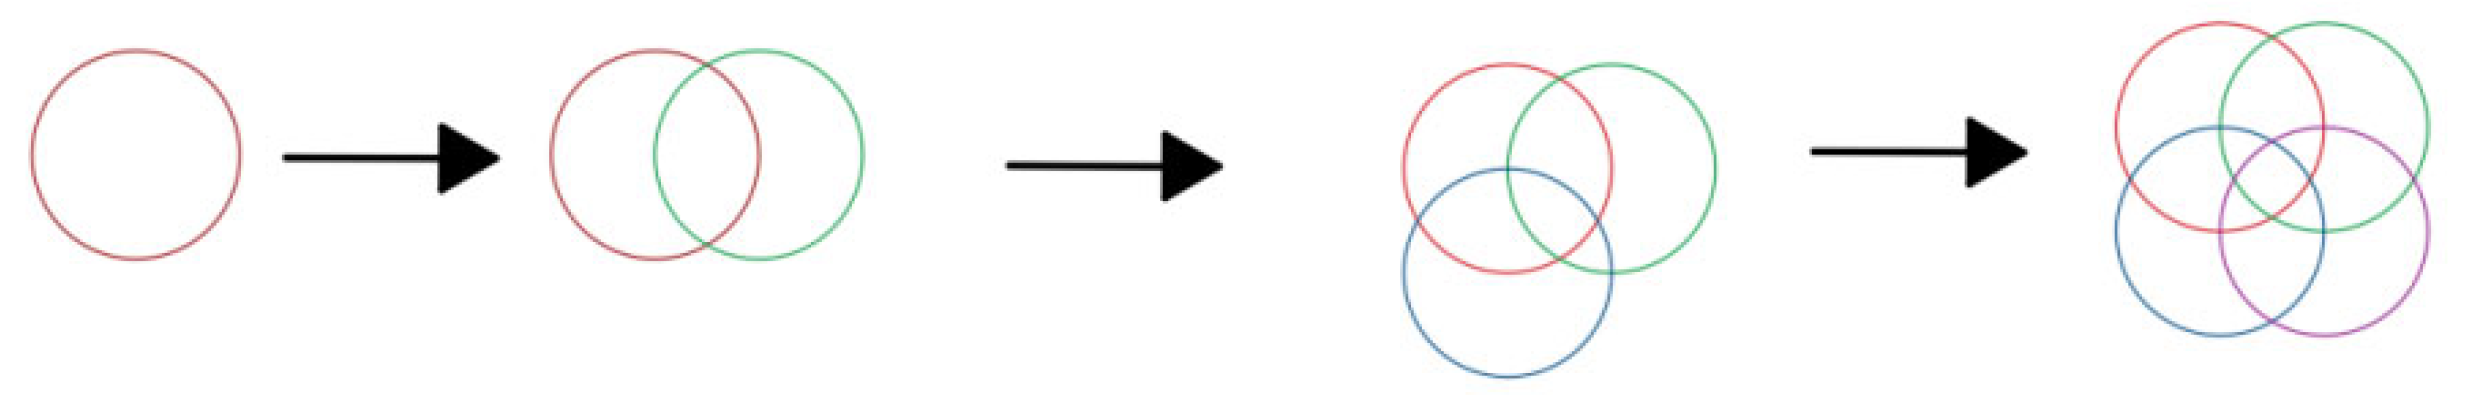
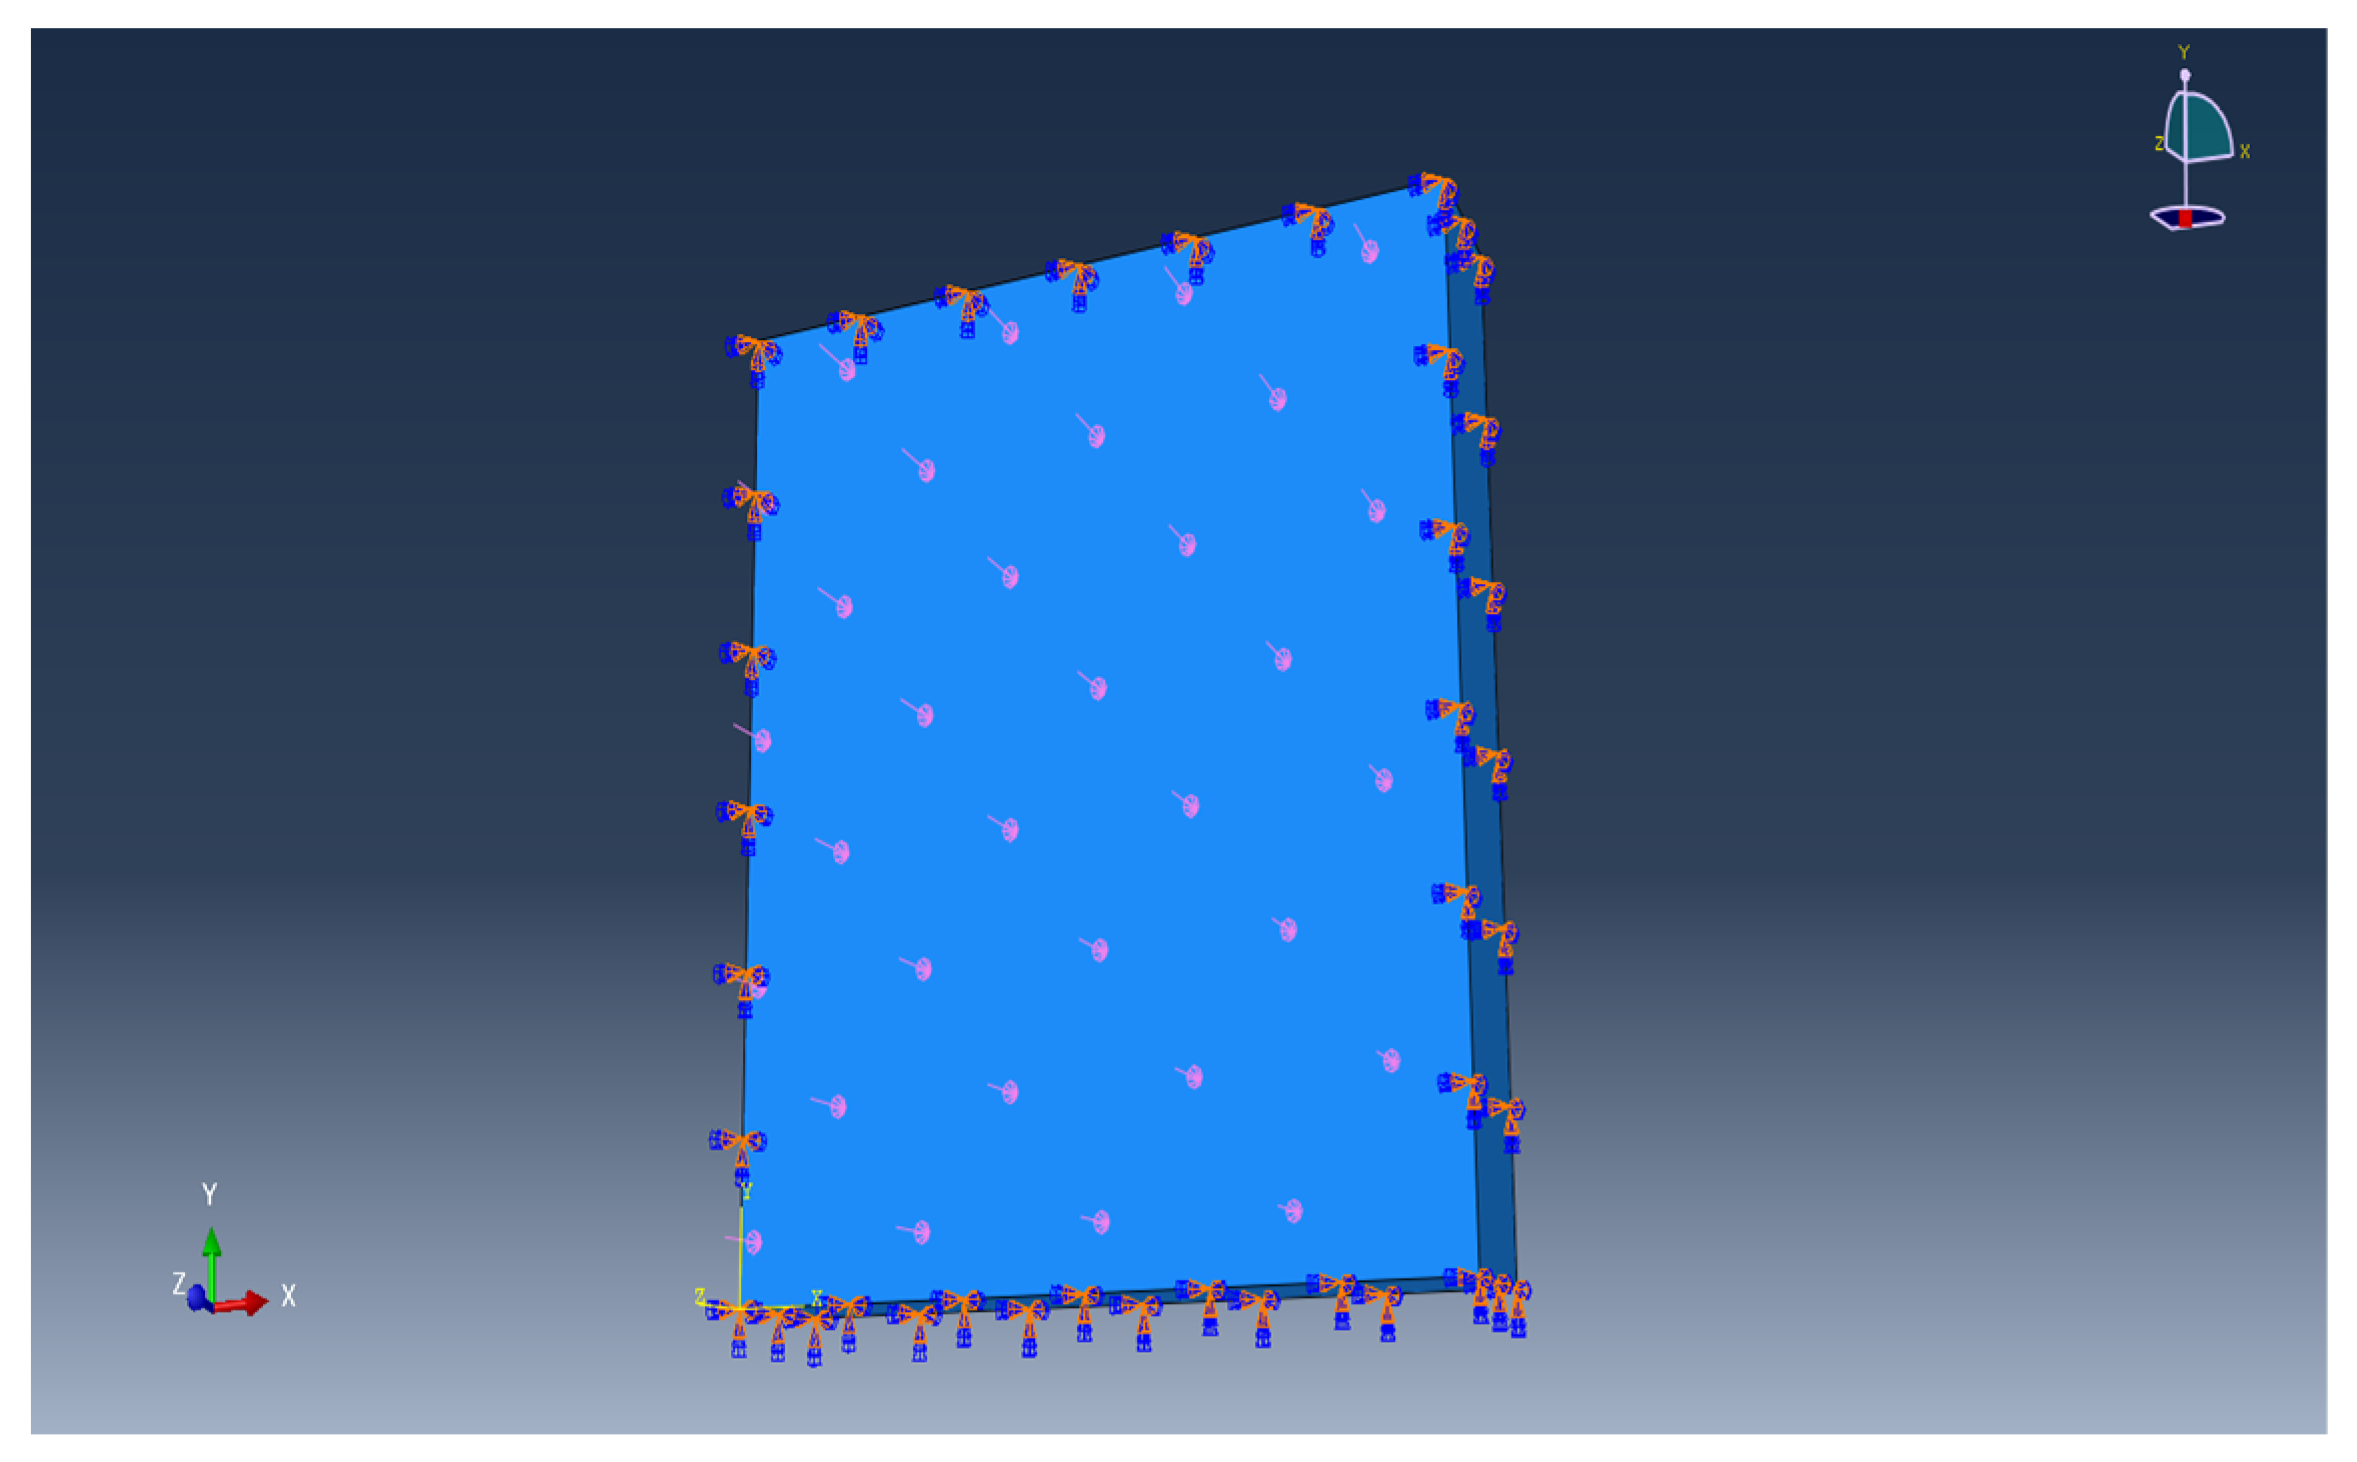
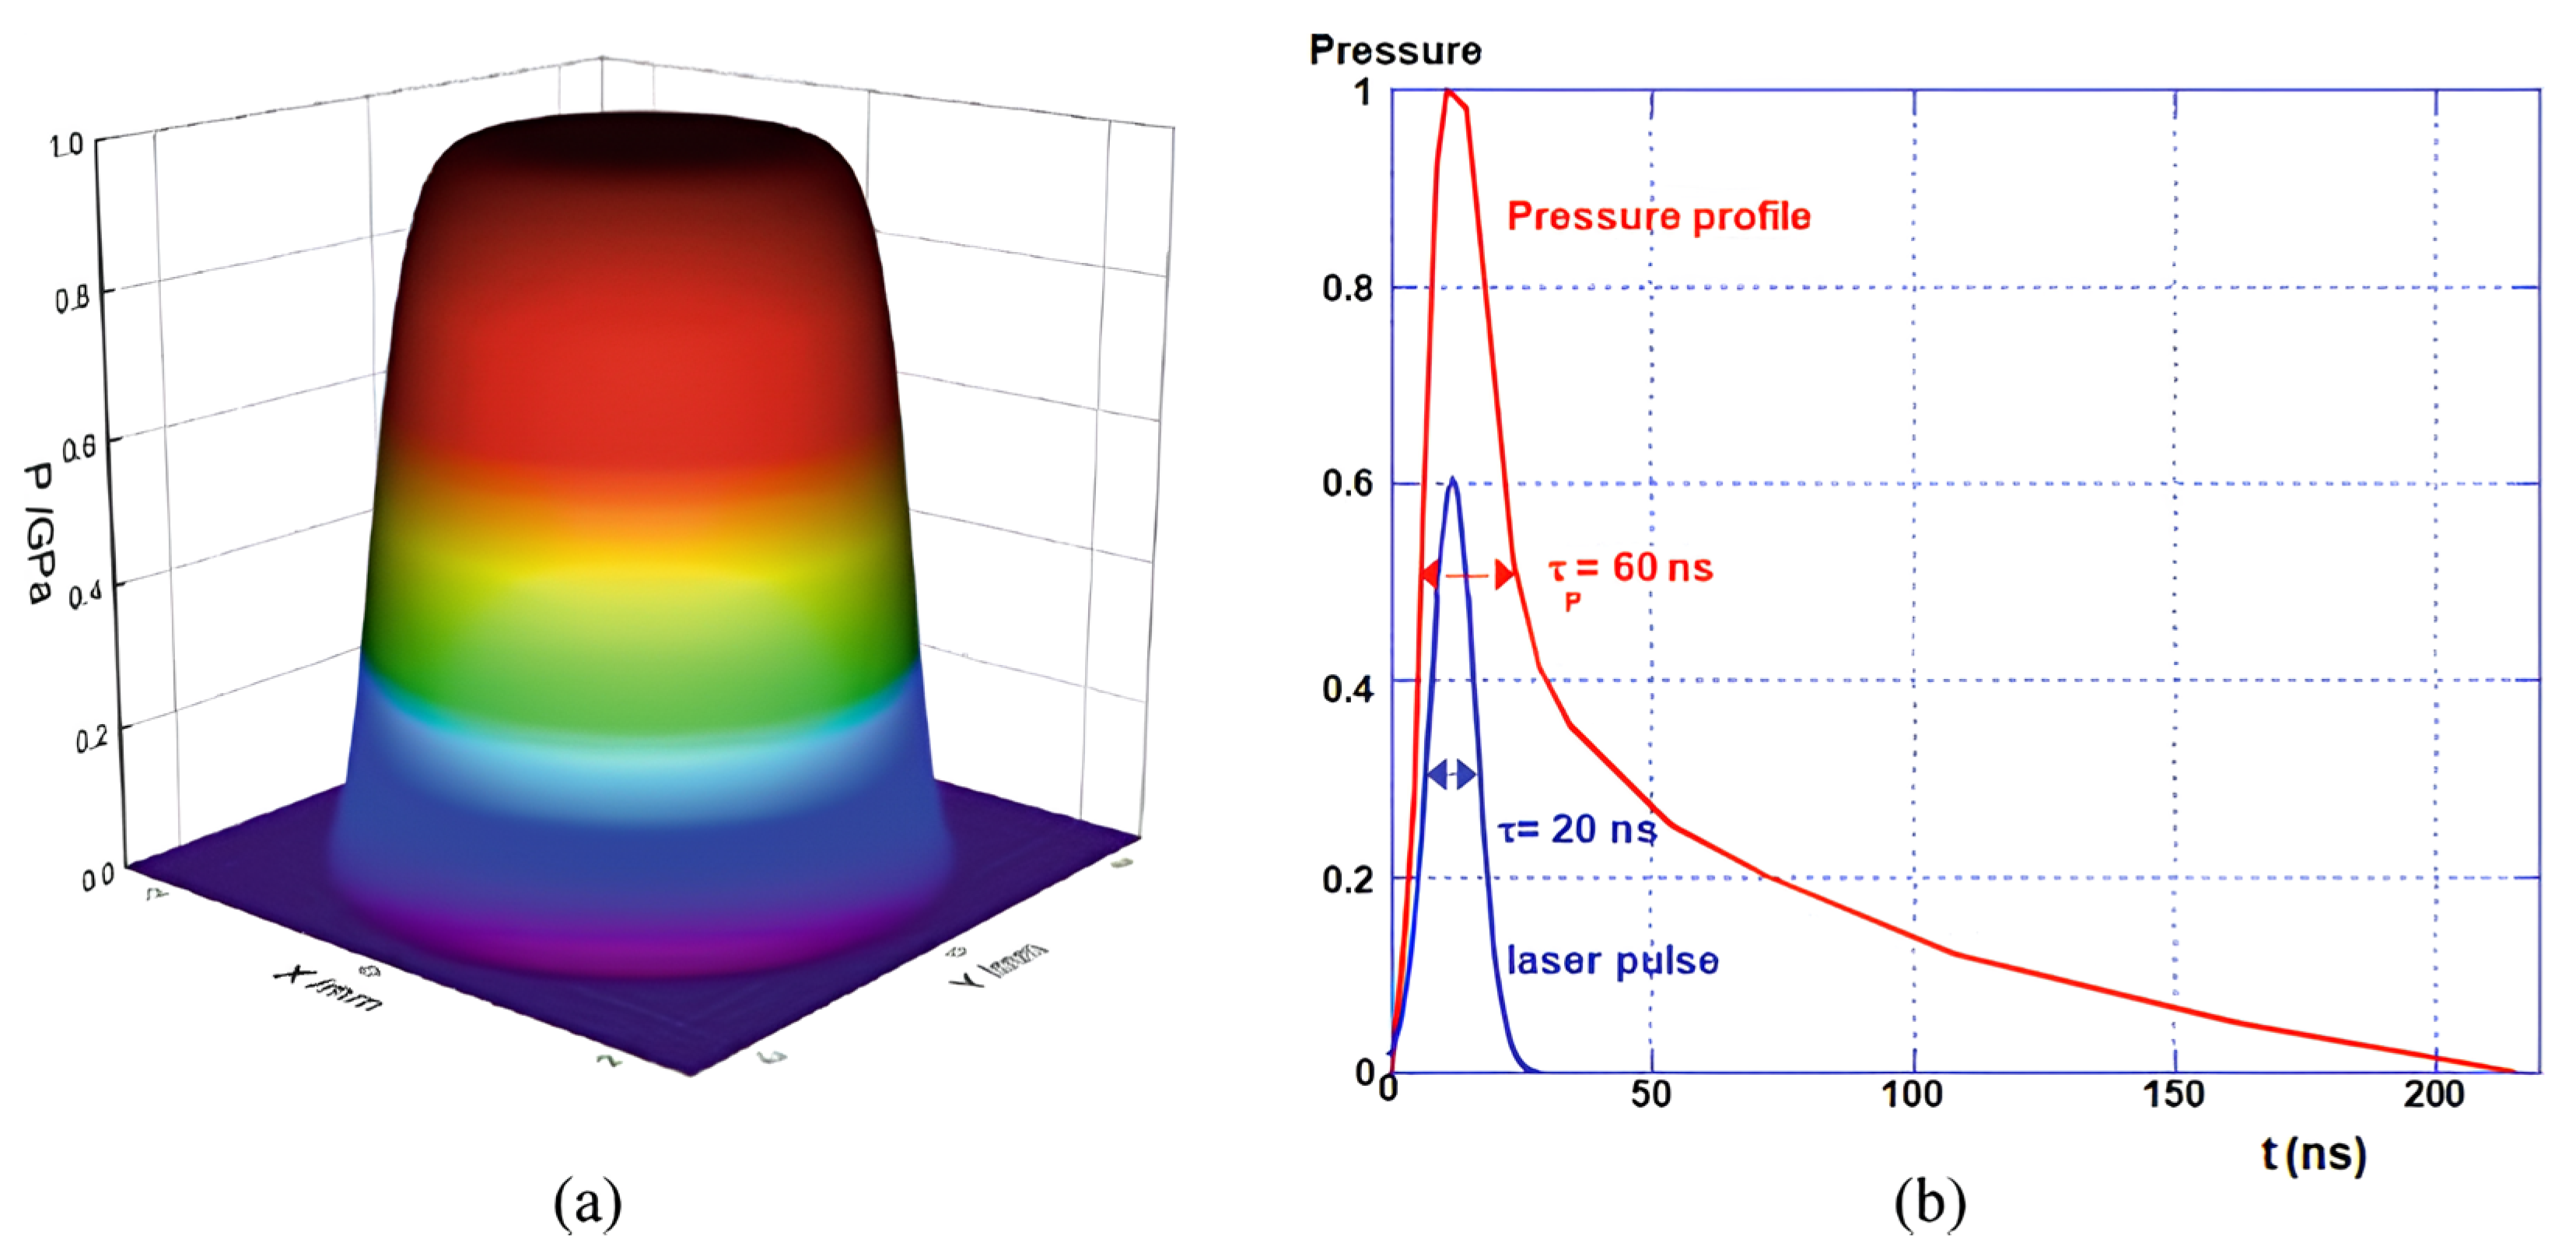
We first established a size model for a 20 mm × 20 mm × 4 mm TC4 titanium alloy plate. After the establishment of a model that endows the plate with the basic mechanical properties of the TC4 material and the Johnson-Cook model parameters, we fixed the specimen’s ends, loaded them with a laser shock load and set the static rebound so as to then carry out the finite element simulation calculations of laser shock processing. The four points of laser shock were set near to the center of the plate, as shown in Figure 1. The sequence of shocks is shown in Figure 2. The boundary conditions and shock loads are shown in Figure 3. The spatial distribution model of the shock wave is shown in Figure 4a. The temporal distribution model of the shock wave is shown in Figure 4b.
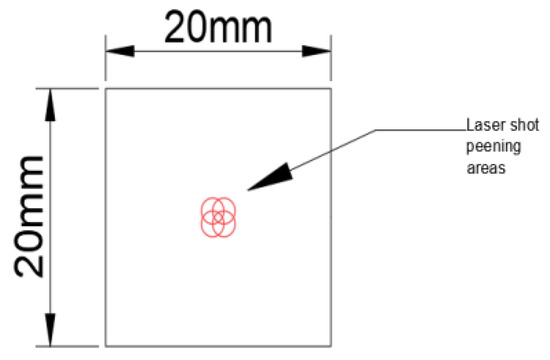
Figure 1.
Schematic diagram of laser shock points.
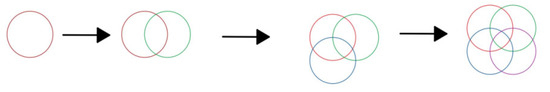
Figure 2.
Laser shock sequence.

Figure 3.
Boundary conditions and shock loads.
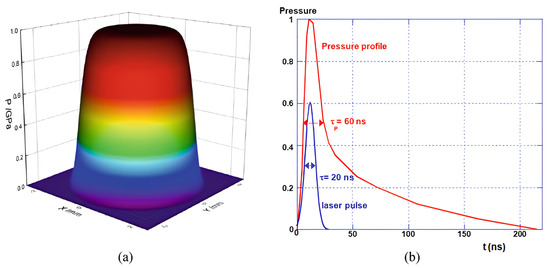
Figure 4.
(a) Spatial schematic of a laser shock wave; (b) Time schematic of laser shock wave.
In the laser shock simulation, one static rebound was performed for every dynamic shock. In total, there are four dynamic impacts and four static rebounds. At the end of the last static rebound, the residual stress results caused by the simulation of laser shock on the TC4 titanium alloy plate are observed, and the laser parameters and the resulting residual stresses are recorded. The recorded data can then be used as a test set or training set for the neural network agent model.
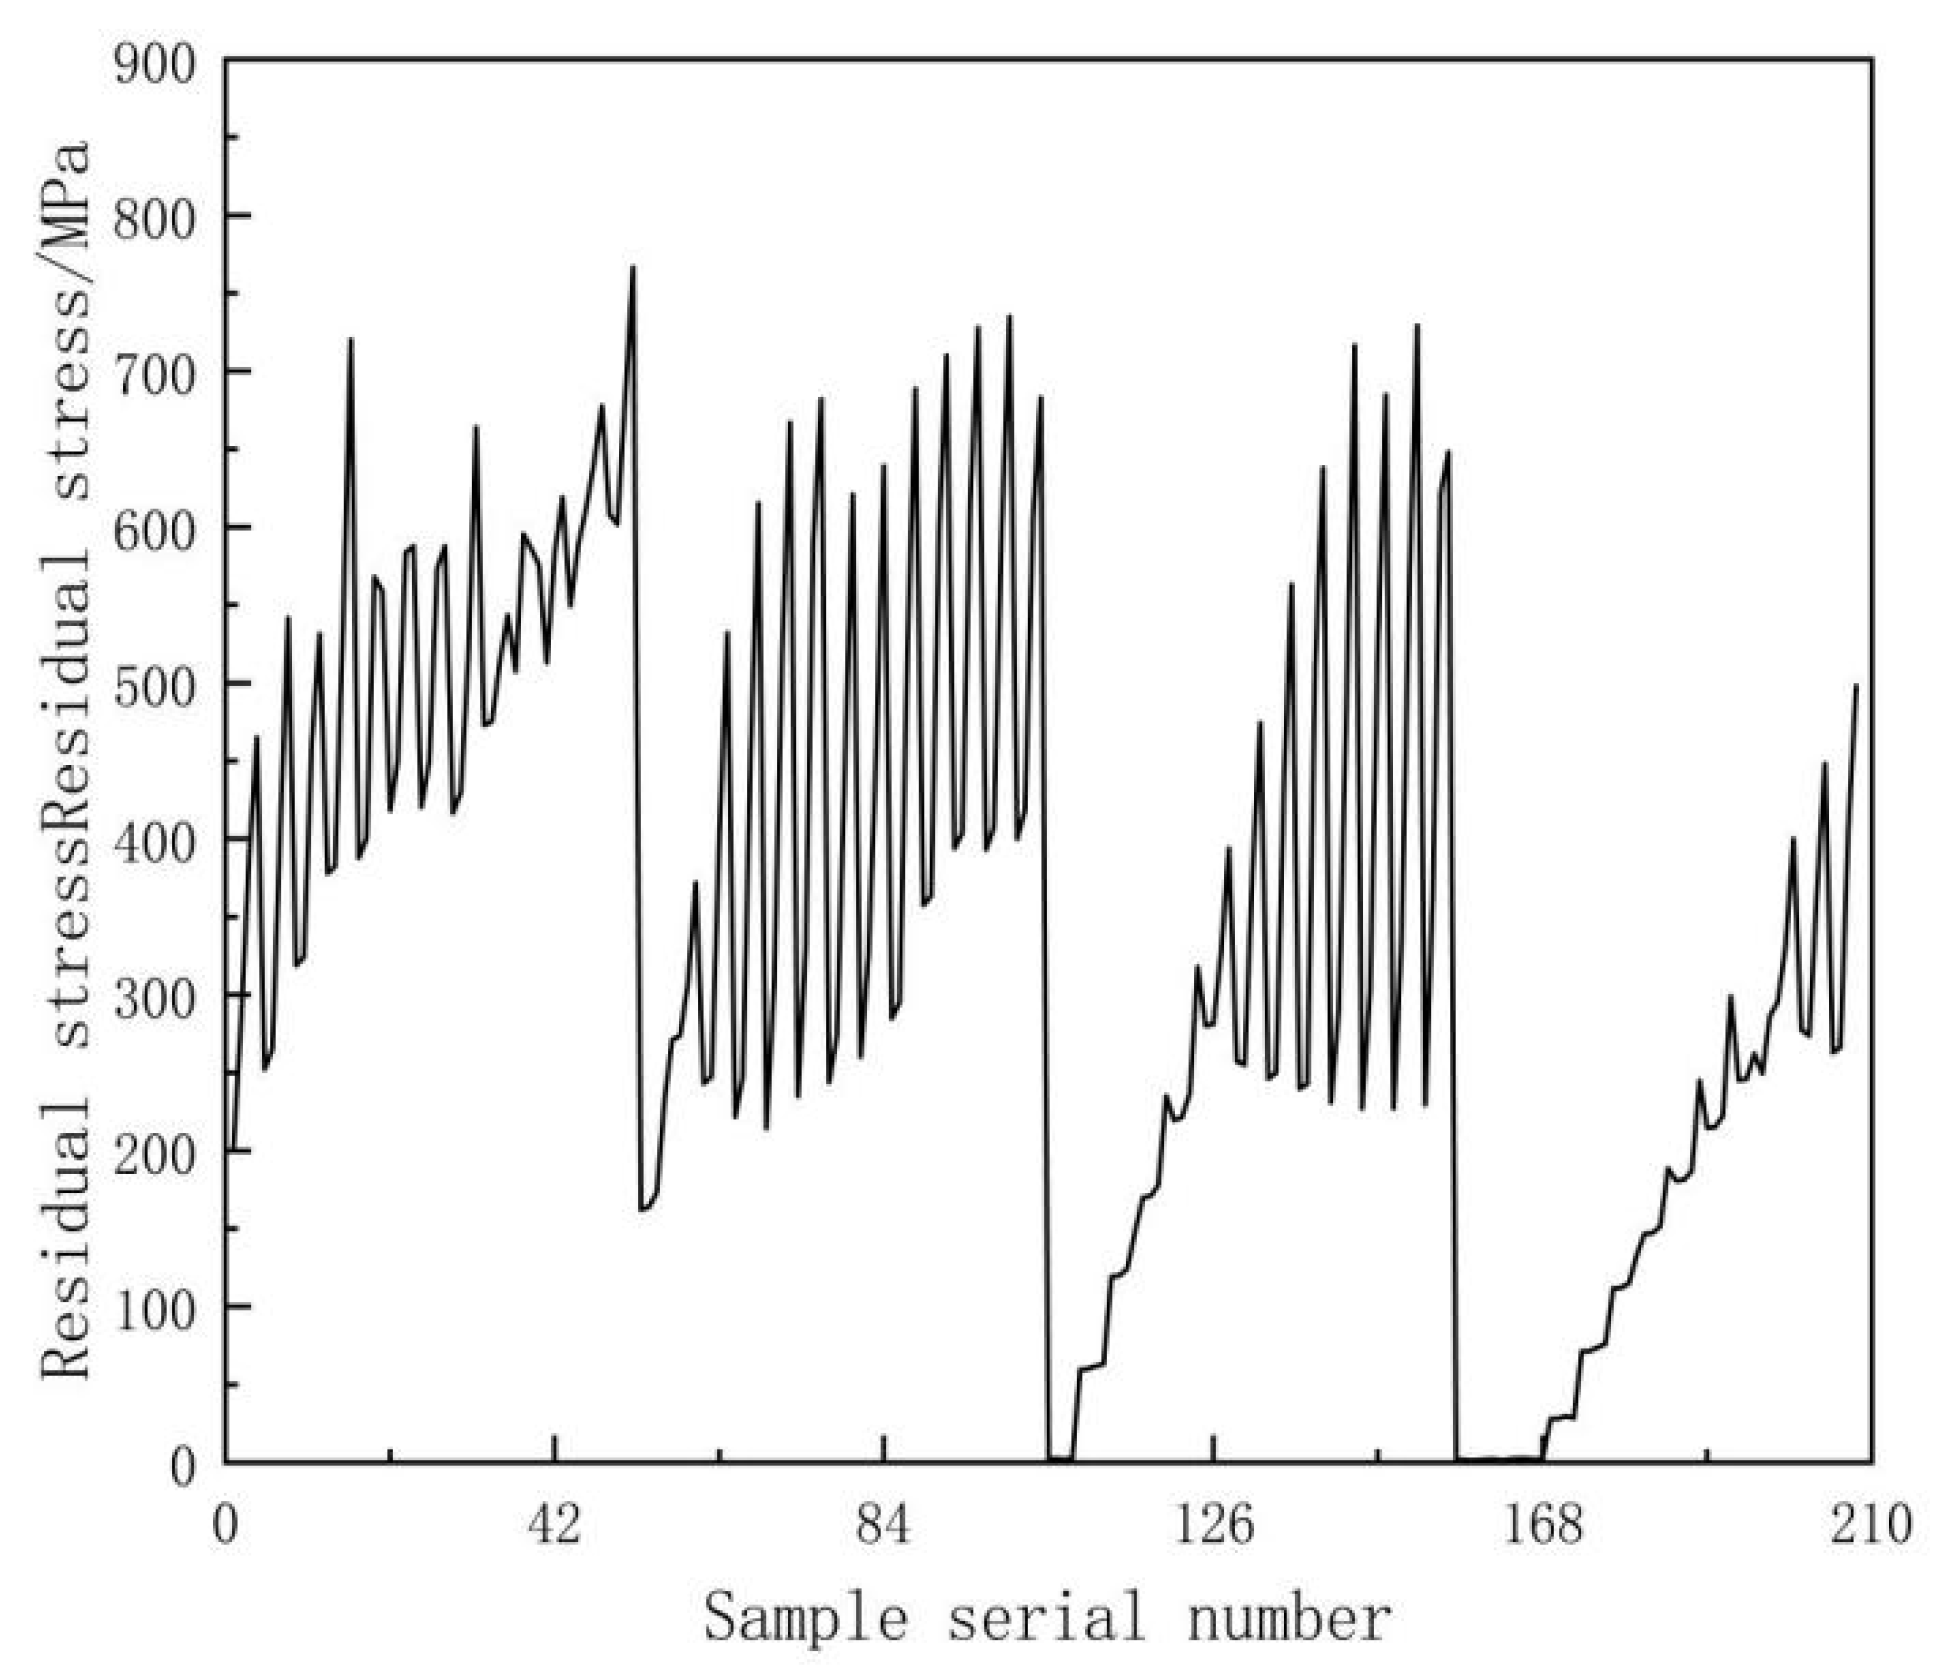
The principle of laser shock processing is shown in Figure 5 [13]; it takes an estimated 30 min to advance from the beginning of simulation modeling to static rebound. In this paper, the laser pulse energy, spot radius and lap rate were chosen as the parameters for the laser impact experiment. The laser pulse energy was increased from 2 J to 8 J at 0.5 J intervals, the spot radius was increased from 1 mm to 2.5 mm at 0.5 mm intervals, and the overlap rate was sequentially increased from 0% to 20%, 50%, and 70%. The orthogonal experimental method was used to select the parameters of the laser shock experiment: 13 types of laser pulse energy × 4 types of optical class radii × 4 types of overlap rates were employed. A total of 208 sets of data were recorded to reflect the residual stresses generated by the parameters of the laser shock experiment under the different orthogonal experimental designs, as shown in Figure 6. Some of the experimental data are shown in Table 4.
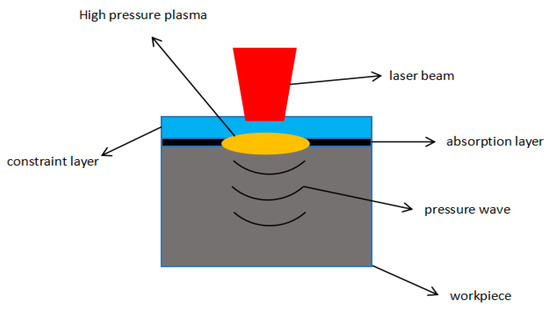
Figure 5.
Principle of laser shock peening.

Figure 6.
Experimental samples.
Table 4.
Selected sample data.
2.2. Modeling Neural Network Agents
2.2.1. Genetic Algorithm Used to Optimize BP Networks
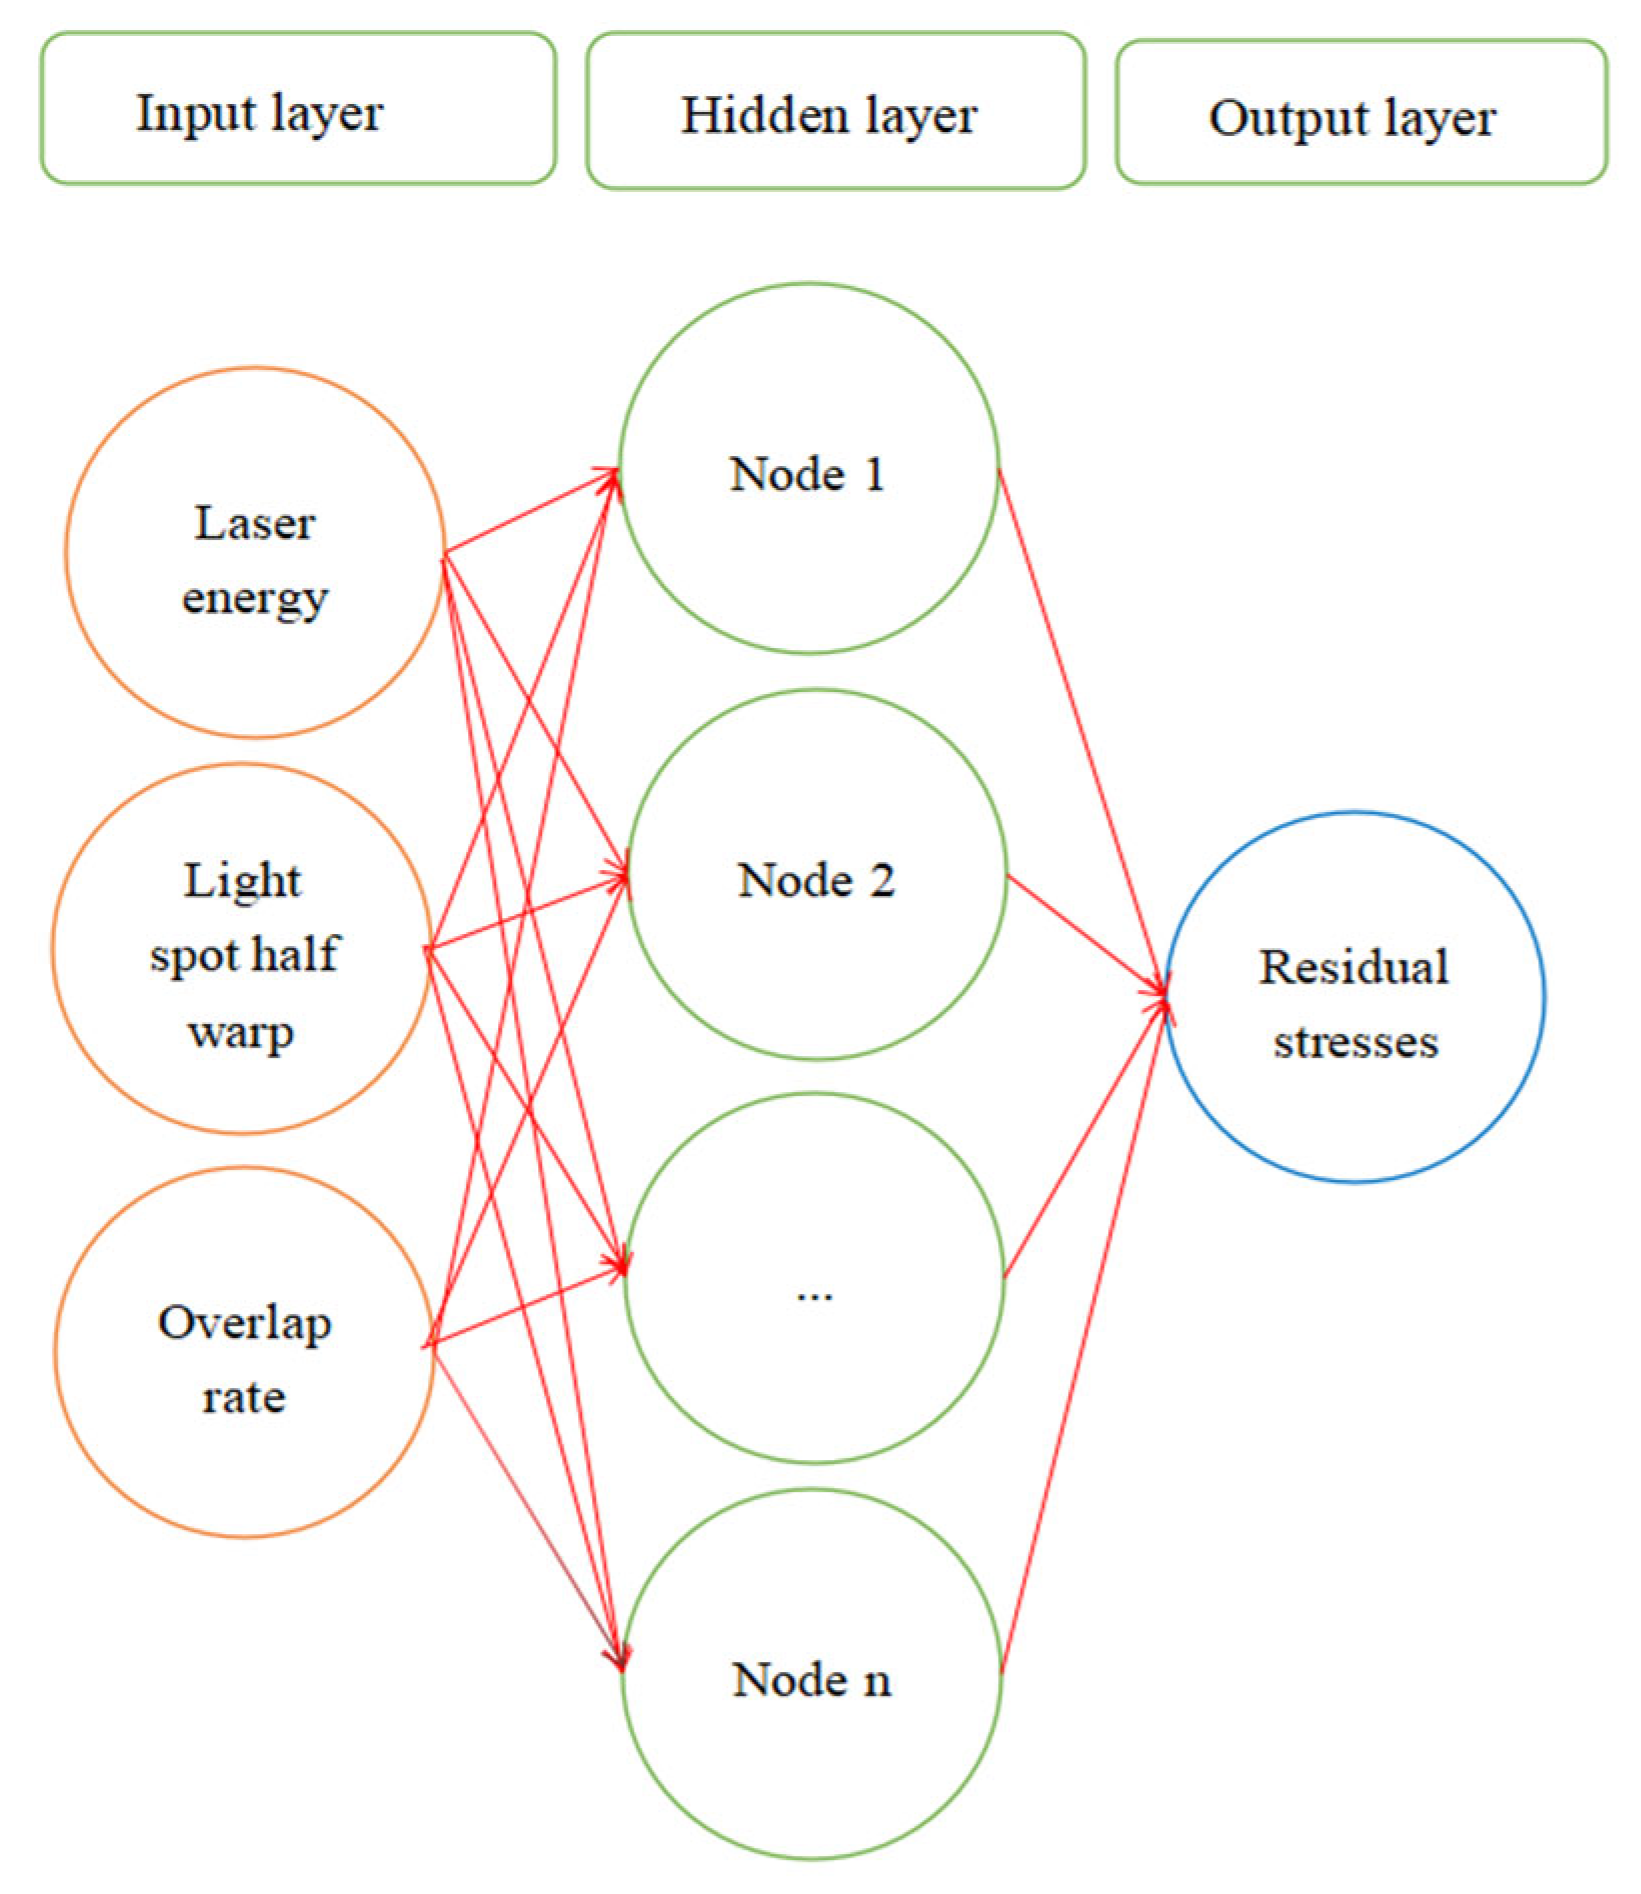
A BP (back propagation) neural network is a multilayer feed-forward neural network, and the main feature of this network is the forward transmission of signals and backward propagation of errors. In forward transmission, the input signal is processed from the input layer through the implicit layer in a layer-by-layer manner until the output layer. The state of neurons in each layer only affects the state of neurons in the next layer [14]. The topology of BP neural network is shown in Figure 7. The number of nodes in the input layer of the BP neural network used in this paper is three, the number of nodes in the single hidden layer is two and the number of nodes in the output layer is one.
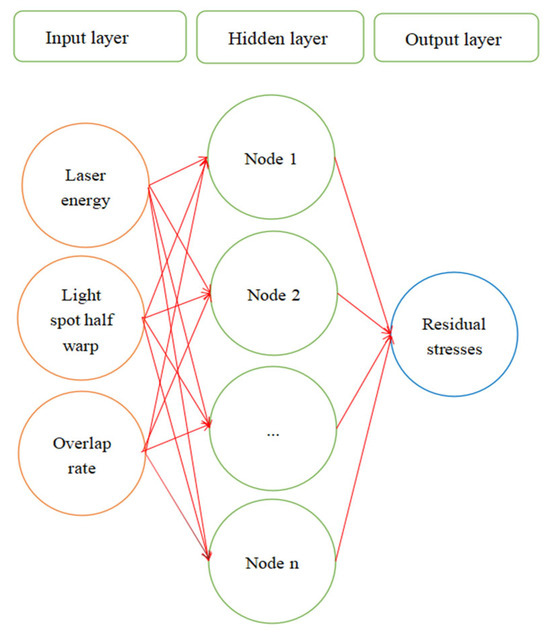
Figure 7.
Topology of BP neural network.
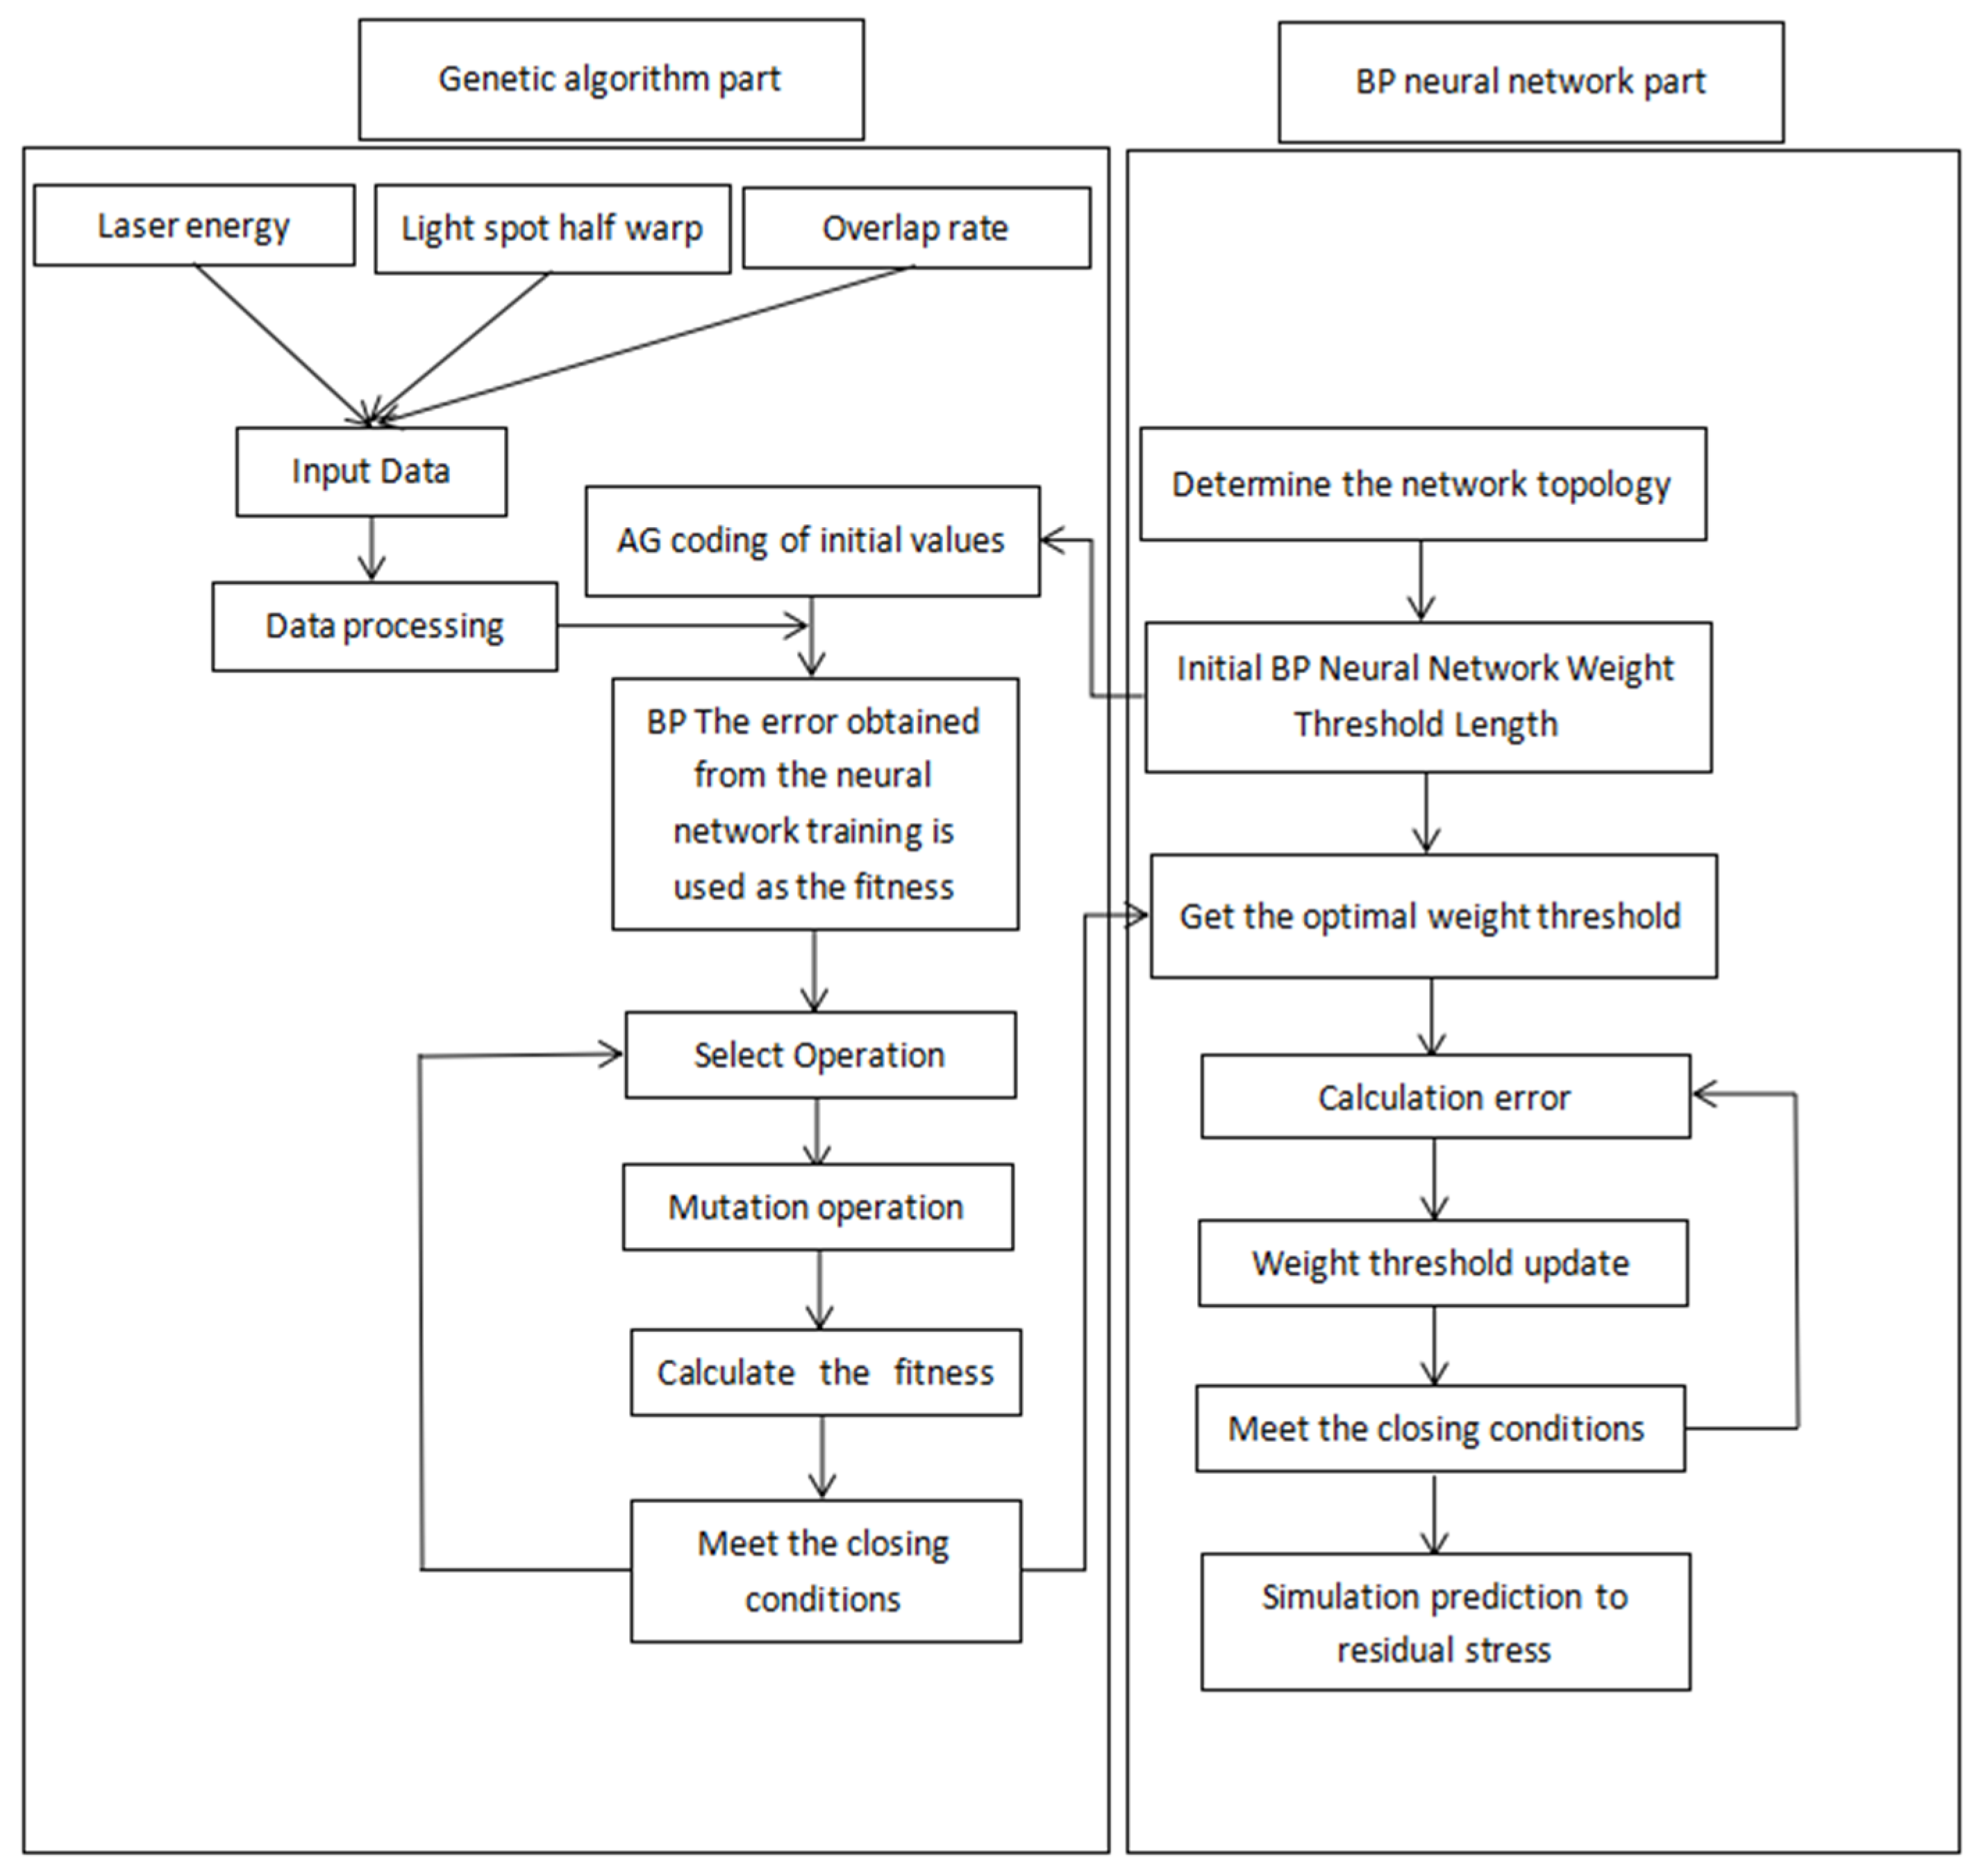
The GA (genetic algorithm) is a parallel stochastic search optimization method that was proposed by Professor Holland of the University of Michigan in 1962, which simulates the genetic mechanism seen in nature in the form of biological evolution. It introduces the biological evolution principle of “survival of the fittest” into the coded tandem population formed by the optimized parameters, and selects individuals according to the chosen fitness function and through selection, crossover and variations in genetics, such that individuals with good fitness values are retained and those with poor fitness are eliminated. The new population thus inherits the information of the previous generation and is better than the previous generation, and this cycle is repeated until the conditions are met [14]. The flow chart of the genetic algorithm used to optimize the BP network is shown in Figure 8 below. In this paper, a number of iterations of 300, a population size of 20, a crossover probability of 0.2, and a variance probability of 0.2 are selected as the basic parameters of the genetic algorithm.
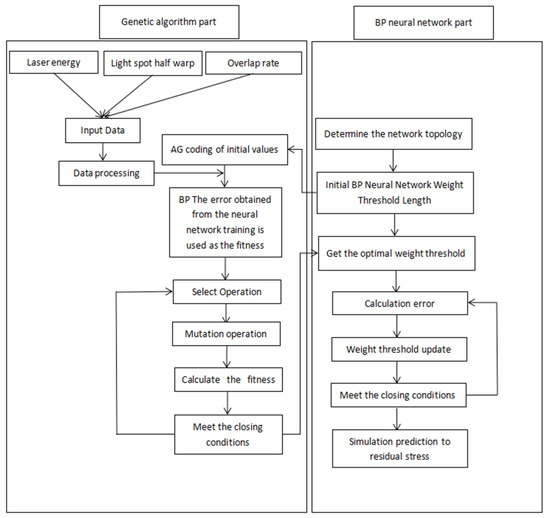
Figure 8.
Genetic algorithm used to optimize BP networks.
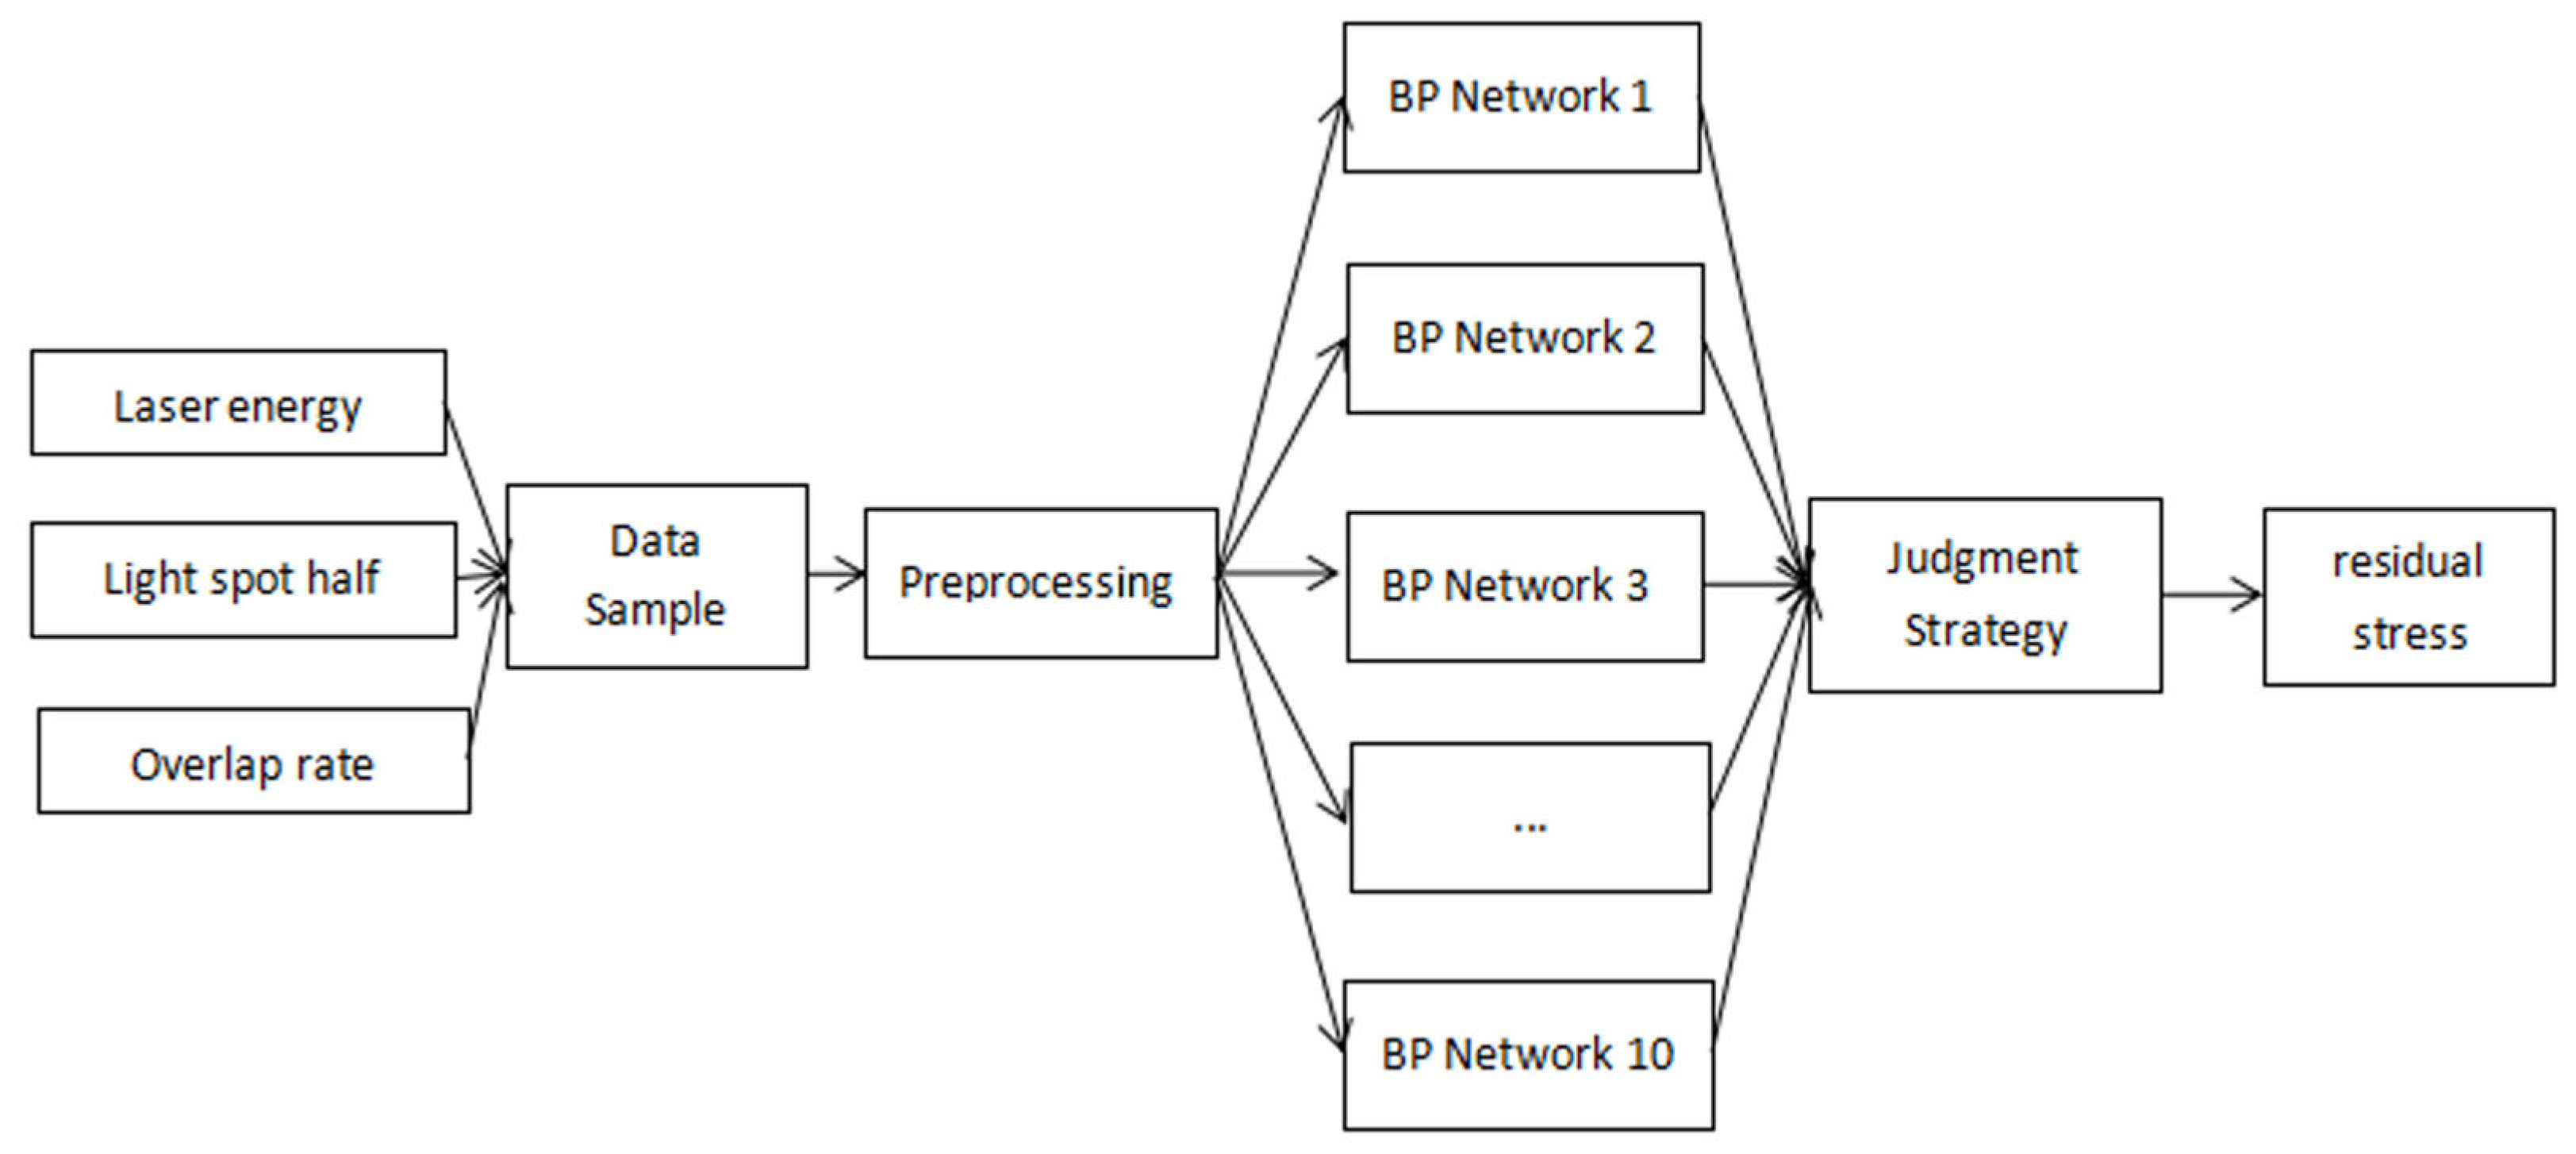
2.2.2. Strong Classifier Design Based on BP_Adaboost
The core idea of the Adaboost algorithm is to combine the outputs of multiple “weak” classifiers and thus produce more efficient classifications based on them. The BP neural network is considered a weak classifier, and after training, the training samples are classified into training samples, and the weight values of the training samples are adjusted according to the results of the training sample classification; finally, a series of weak classifiers and their corresponding weight values are derived. In this experiment, 10 groups of weak classifiers are selected to form a strong classifier for merging, based on which better prediction results are obtained [14]. The flow of the strong classifier design algorithm based on BP_Adaboost is shown in Figure 9 below. In this paper, 10 is chosen as the number of cycles.
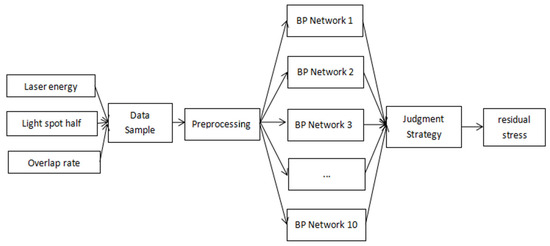
Figure 9.
BP_Adaboost-based strong classifier algorithm flow.
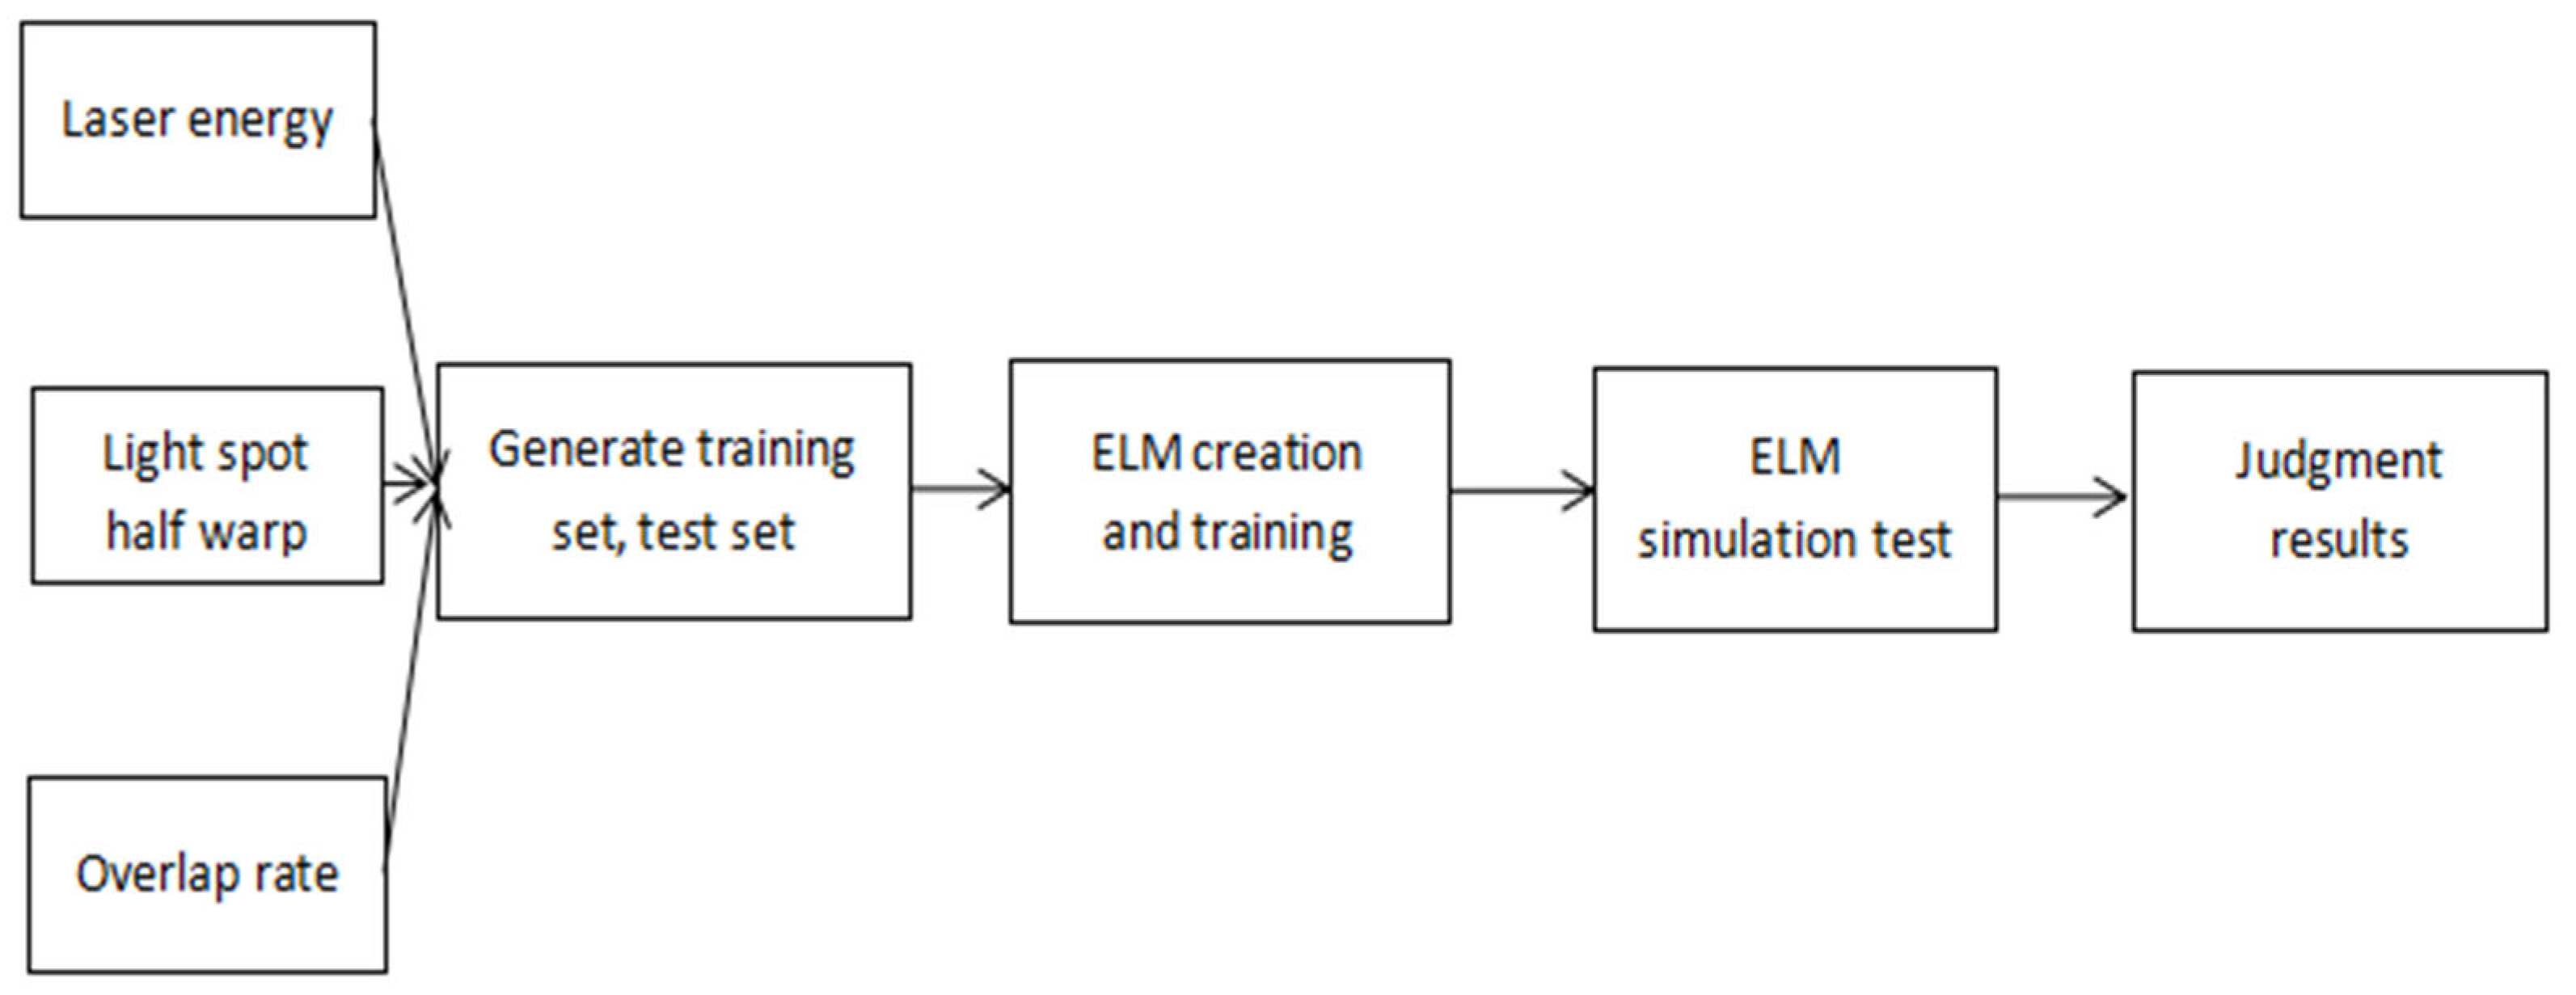
2.2.3. Extreme Learning Machine Optimization Method
The ELM (extreme learning machine) algorithm can randomly generate the connection weights between the input layer and the hidden layer and the threshold values of the neurons in the hidden layer. The experiments only need to set the number of neurons in the hidden layer to come up with a unique optimal solution. Compared with traditional training methods, the extreme learning machine optimization method has the advantages of fast learning speed and good generalization performance [14]. The flow chart of the extreme learning machine algorithm is shown in Figure 10 below. The number of nodes in the input layer of the extreme learning machine used in this paper is three, the number of nodes in the single hidden layer is two, and the number of nodes in the output layer is one.
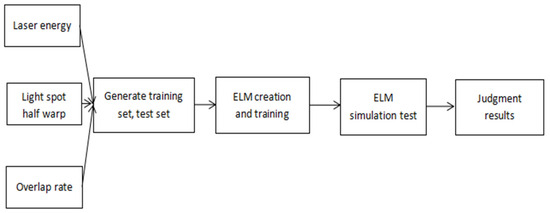
Figure 10.
Flow chart of the algorithm of the extreme learning machine.
2.3. Model Comparison
Typically, the dataset is divided into the training set and test set, which account for 70%–80% and 20%–30% of the data, respectively. In this paper, there are 208 sets of experimental data used for laser shock processing intensification simulation; 80% are selected as the training sets and the remaining 20% are used as the testing sets. That is, there are 166 sets of data in the training set and 42 sets of data in the testing set.
The first 166 sets of the 208 sets of data were used as the training sets, and the other 42 sets were used as the testing set. The genetic algorithm was used to optimize the BP network—a strong classifier design based on BP_Adaboost and extreme learning machine modeling neural network agents. The performance of the established neural network agent model has been evaluated based on the coefficient of determination (R2), root mean square error (RMSE), and mean absolute error (MAE) of the testing sets.
The formulas for R2, RMSE, and MAE are shown below, where y is the expected value (true value) and ŷ is the predicted value [15].
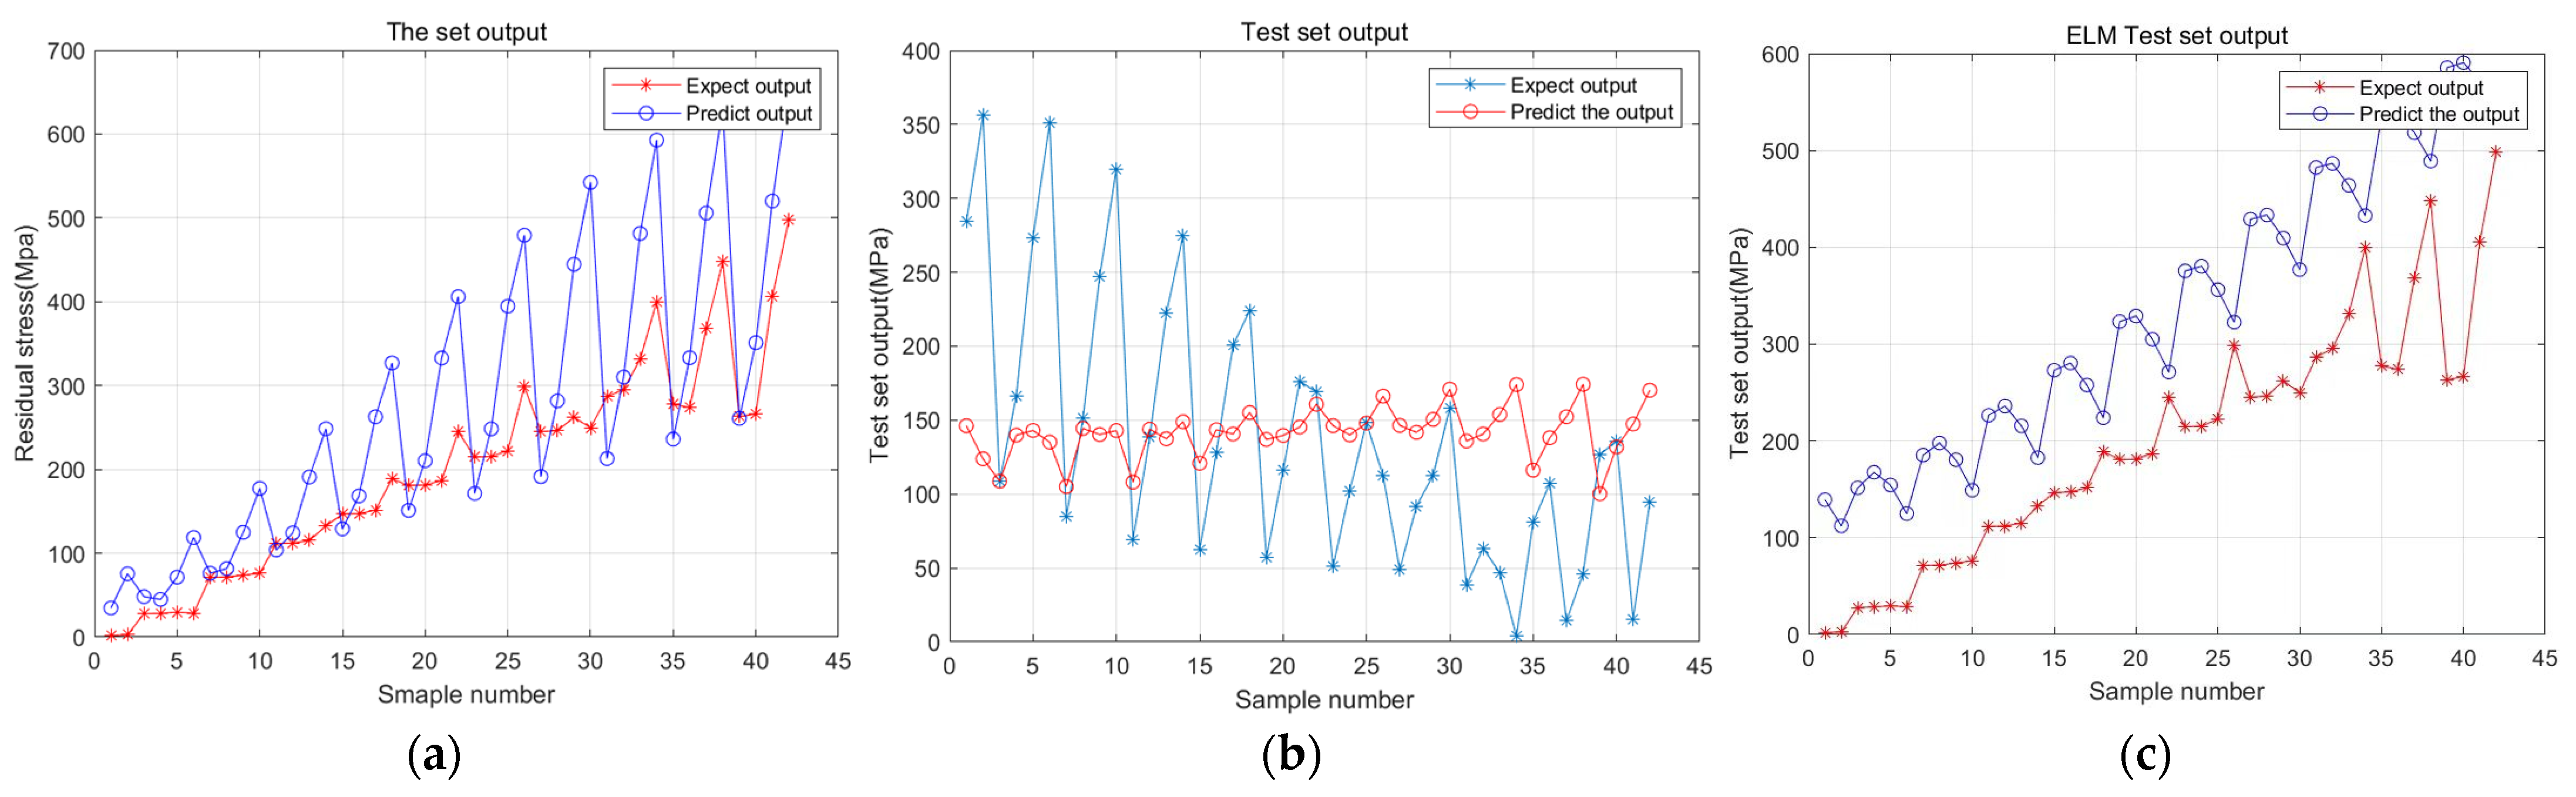
The prediction results of the three neural network agent models are shown in Figure 11 below; from left to right, they show the genetic algorithm-optimized BP network, a strong classifier design based on BP_Adaboost, and the extreme learning machine.
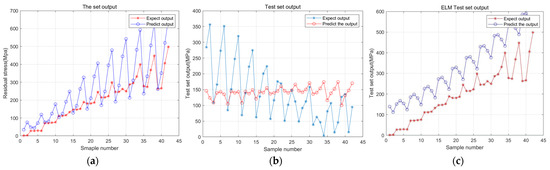
Figure 11.
Sequential selection of prediction results: (a) Prediction results of optimized BP network with genetic algorithm; (b) Prediction results of a strong classifier design based on BP_Adaboost; (c) Prediction results of extreme learning machine.
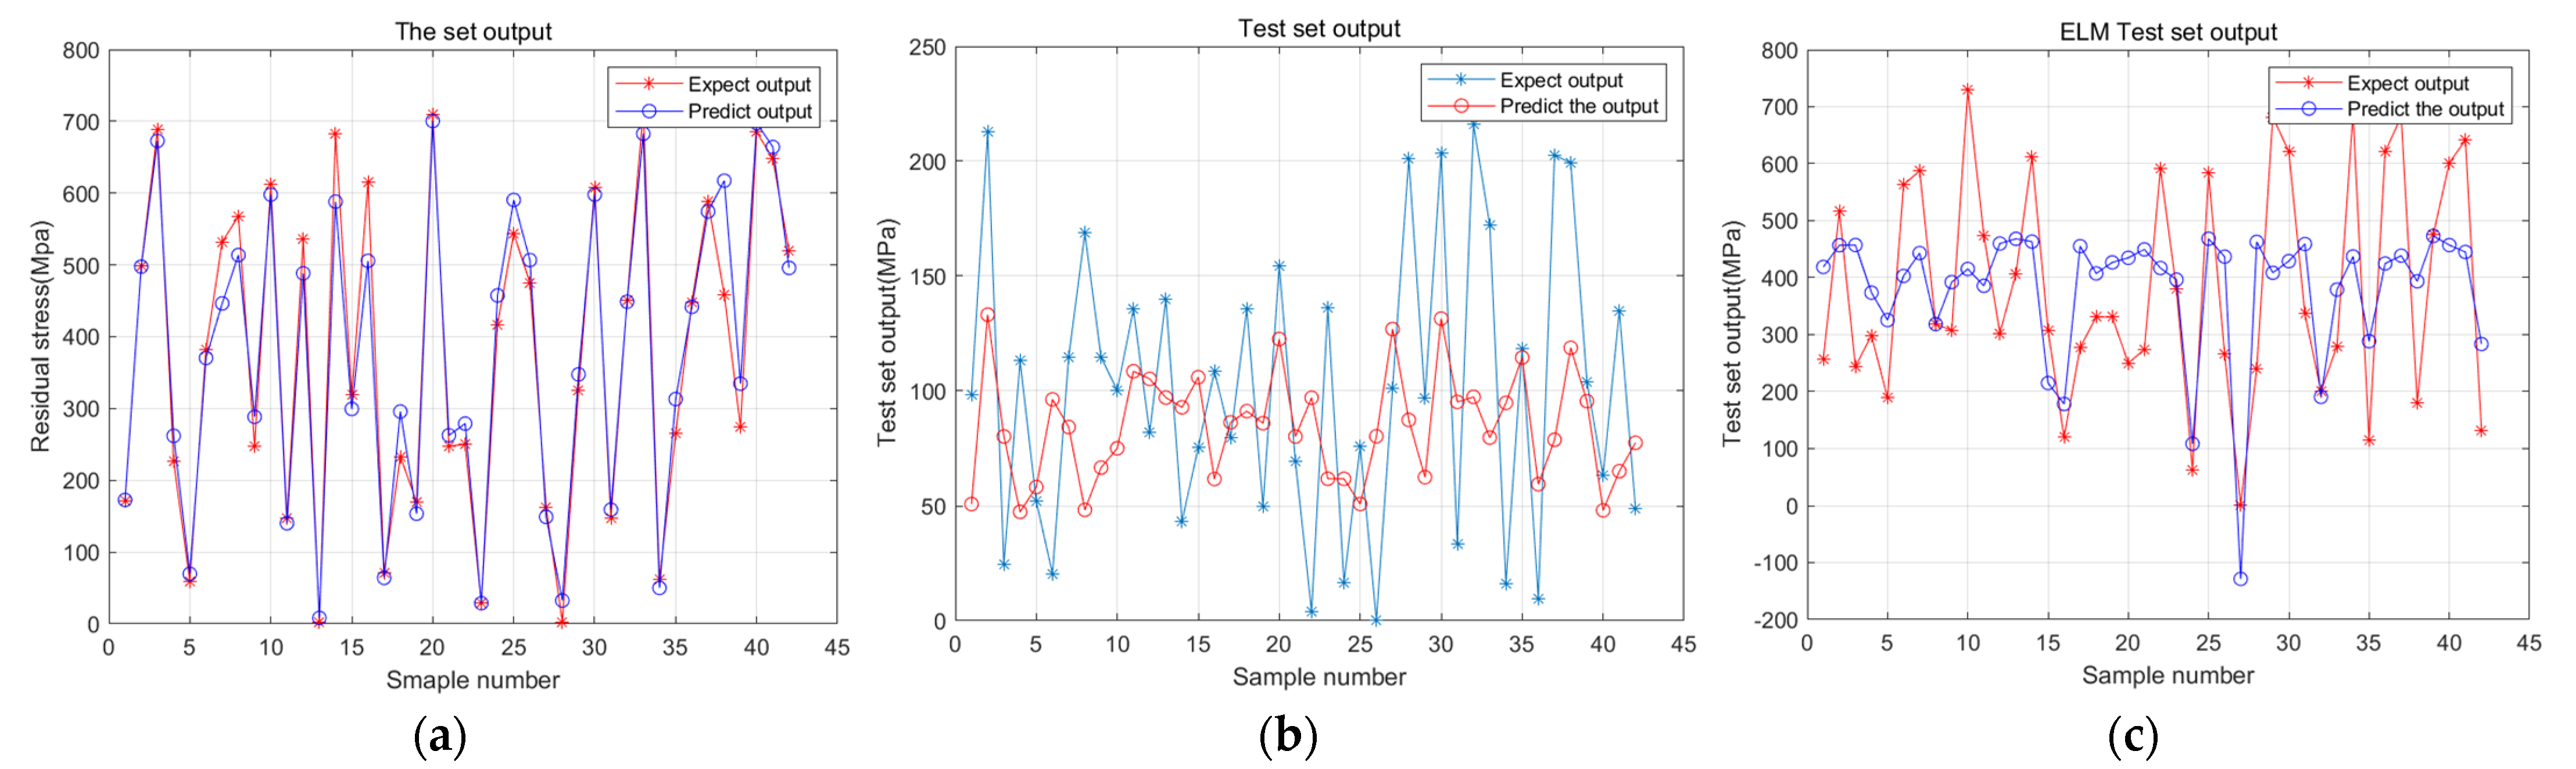
As can be seen in Figure 11, the difference between the predicted and simulated results is very large, and the fit does not converge, indicating that this method of selecting the training and prediction sets is not suitable for predicting the results of laser impact machining. Therefore, this paper uses the random sampling method to select the training set and the prediction set of the three neural networks. In total, 208 groups of experimental data are randomly disordered through the randperm function in matlab; the first 166 (80%) groups of data are extracted as the training sets on the basis of the disordered order, and the remaining 42 (20%) groups of data are used as the testing sets. As the order of the data is redisturbed in each run, the selected training sets and testing sets will be different. As such, all three neural networks are fitted five times, and the R2, RMSE and MAE results with the five best fitting results are selected for comparison. The prediction results of the three neural networks using the random sampling method to select the training and test sets are shown in Figure 12 below. From left to right, they show the optimized BP network using the genetic algorithm, a strong classifier design based on BP_Adaboost, and the extreme learning machine.
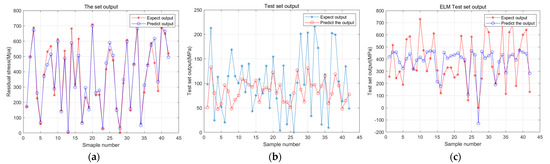
Figure 12.
Random sample prediction results: (a) Prediction results of optimized BP network with genetic algorithm; (b) Prediction results of a strong classifier design based on BP_Adaboost; (c) Prediction results of extreme learning machine.
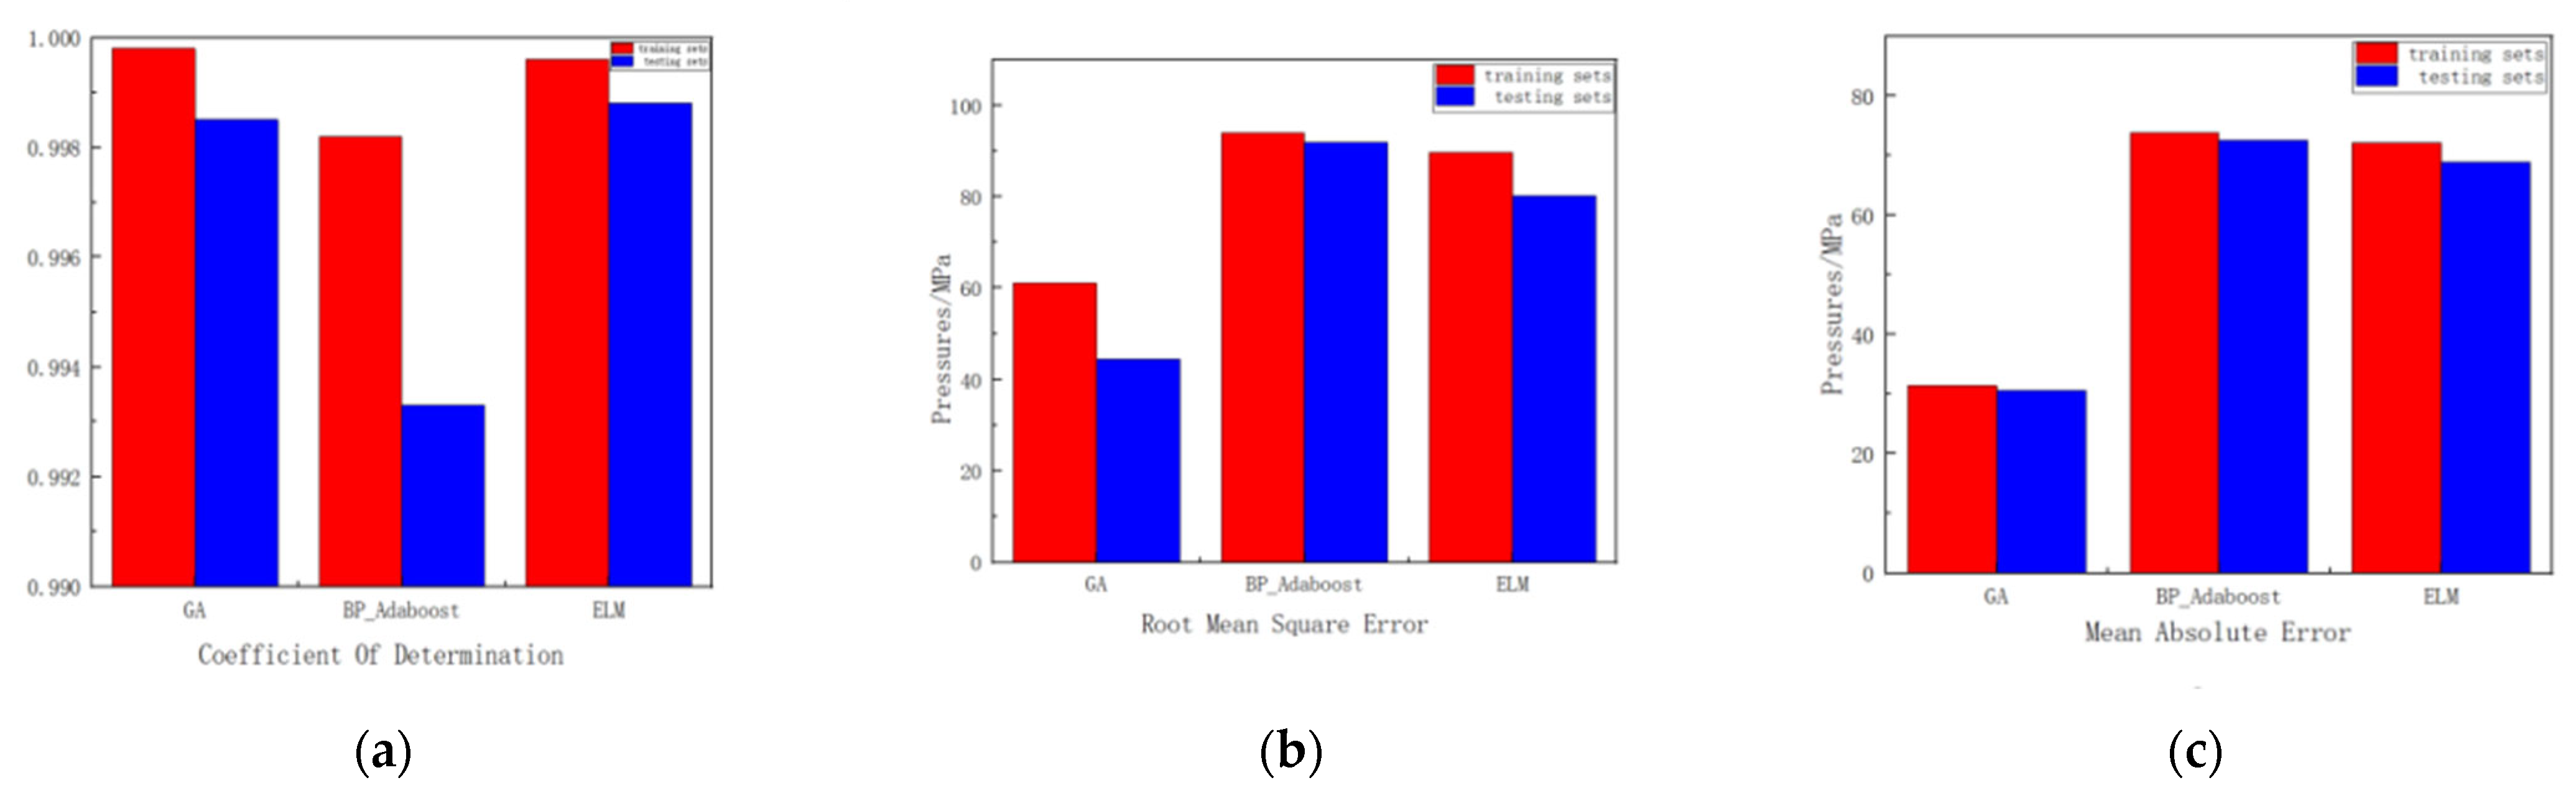
From the comparison of the prediction results with the simulation results in Figure 13, it can be seen that the fitting effect of the neural network agent model using the random sampling method is better than that of directly selecting the training sets and the testing sets in a sequential manner. The strengths of the predictive abilities of the three neural network agent models are difficult to discern from the graphs, so the predictive abilities of the three neural networks are further compared by examining the performance metrics of the testing sets. The performance indexes of the testing sets are an important basis for determining the optimal neural network model, in which the coefficient of determination, R2, represents the fitting ability of the agent model, and the value of R2 is usually in the range of 0–1; the closer R2 is to 1, the better the fitting effect. The mean square error (RMSE) and mean absolute error (MAE) represent the error between the predicted and simulated values; the smaller the RMSE and MAE, the better the fit. This experiment was conducted to determine the optimal neural network agent model by comparing the data on R2, RMSE, and MAE of the respective testing sets of the three neural networks. The data of R2, RMSE, and MAE for the three neural networks are shown in Figure 13 below; from left to right, they show the genetic algorithm-optimized BP network, a strong classifier design based on BP_Adaboost, and the extreme learning machine.
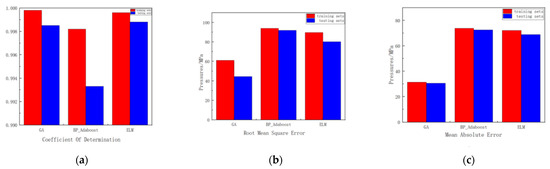
Figure 13.
Comparison of performance indicators: (a) Prediction results of optimized BP network with genetic algorithm; (b) Prediction results of a strong classifier design based on BP_Adaboost; (c) Prediction results of extreme learning machine.
The R2, RMSE and MAE of the training sets of the BP network optimized using the random sampling genetic algorithm are 0.9998, 61.0249 and 31.3729 respectively. The R2, RMSE and MAE values of the testing sets are 0.9985, 44.4518 and 30.6285, respectively.
The R2, RMSE, and MAE of the training sets using the random sampling BP_Adaboost-based strong classifier design are 0.9982, 93.8540 and 73.7437. The R2, RMSE and MAE of the testing sets are 0.9933, 91.8119 and 72.5284, respectively.
The R2, RMSE and MAE for the training sets using the random sampling extreme learning machine are 0.9996, 89.6642 and 72.1043. The R2, RMSE and MAE for the testing sets are 0.9988, 80.2142 and 68.8108, respectively.
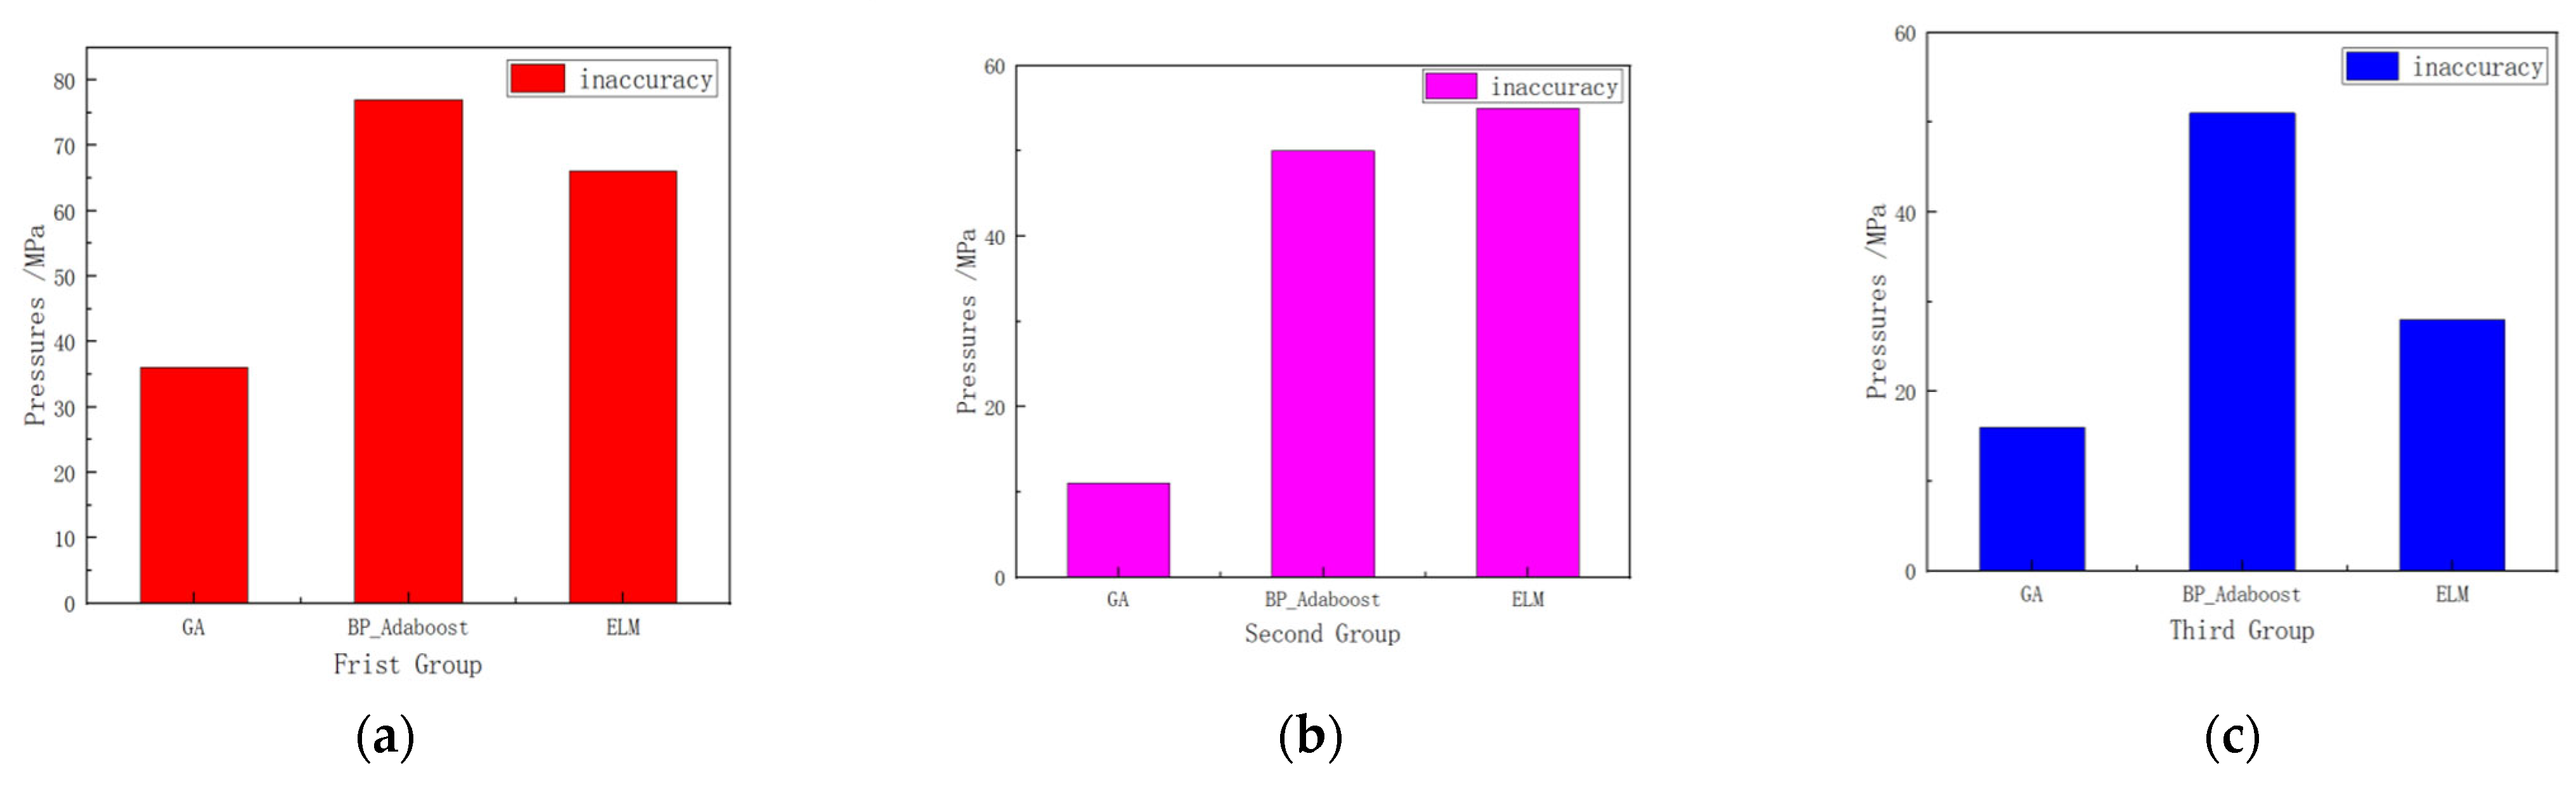
In order to further test the prediction ability of the established neural network agent model, we selected laser shock parameters that are not in the sample as those to be predicted, and the prediction results have been compared with the results of simulation experiments. The first set of laser shock parameters selected were a laser energy of 3.1 J, a radius of 1.2 mm, a lap ratio of 35%, and a simulated residual stress of 299 Mpa. The second set of laser shock parameters selected were a laser energy of 5.7 J, a radius of 1.6 mm, a lap ratio of 41%, and the simulated residual stress was 369 Mpa. The third set of laser shock parameters selected were a laser energy of 7.3 J, a radius of 2.3 mm, a lap rate of 12%, and a simulated residual stress of 251 Mpa. The errors of the predicted and simulated values of the three neural networks are shown in Table 5 below, and the comparison of the errors of the predicted and simulated values of the three neural networks are shown in Figure 14 below. From left to right, these show the BP network optimized using the genetic algorithm, a design of strong classifiers based on BP_Adaboost, and the extreme learning machine.
Table 5.
Comparison of fitting results.
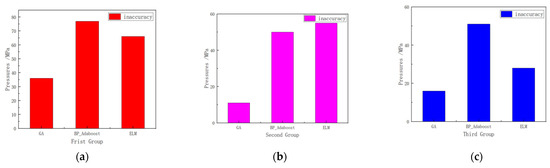
Figure 14.
Error comparison: (a) Prediction results of optimized BP network with genetic algorithm; (b) Prediction results of a strong classifier design based on BP_Adaboost; (c) Prediction results of extreme learning machine.
From Figure 14, it can be seen that the genetic algorithm-optimized BP network achieves the smallest error between the prediction results and the simulation results.
In conclusion, for the genetic algorithm-optimized BP network testing sets, the value of R2 is closest to 1, and the RMSE and MAE values are also the lowest, so the genetic algorithm-optimized BP network is the best neural network agent model of the three neural network models used to predict the results.
In order to further test the prediction ability of the neural network agent model, the prediction results of the neural network agent models are compared with the actual experimental results.
The existing experimental results show that the application of laser shock to the TC4 titanium alloy plate with a laser energy of 3 J, a spot radius of 1.5 mm and a lap rate of 10% led to the surface being subjected to a residual stress of 223 MPa; the genetic algorithm-optimization BP neural network achieved a prediction result of 227 MPa [16].
The residual stress generated on the surface of the TC4 titanium alloy by laser shocking at a laser energy of 7 J, a spot radius of 1.5 mm, and a lap rate of 50% reached a value of 634 MPa, and the prediction result of the BP neural network optimized by the genetic algorithm was 614 MPa [16].
The residual stress generated on the surface of the TC4 titanium alloy by laser shocking at a laser energy of 2.7 J, a spot radius of 0.6 mm, and lap rate of 50% reached a value of 573 MPa, and the prediction result of the BP neural network optimized by the genetic algorithm was 535 MPa [17].
The residual stress generated on the surface of the TC4 titanium alloy by laser shocking at a laser energy of 6 J, a spot radius of 1.5 mm, and a lap rate of 40% reached a value of 327 MPa, and the prediction result of the BP neural network optimized by the genetic algorithm was 377 MPa [18].
From Table 6, it can be seen that the prediction results of the genetic algorithm-optimized BP network are similar to the actual value, and the prediction results were obtained in 150 s; these results are superior to those of finite element simulation, which required around 30 mins from the beginning of simulation modeling to the static rebound. The establishment of the neural network agent model thus significantly reduces the time cost.
Table 6.
Comparison of predicted results with actual values.
At the same time, this paper also provides a method for predicting the residual stress produced on the surfaces of different materials by laser shocking. As long as a part of the data is known, we can use the learning ability of the neural network agent model to learn the existing data and thus realize the prediction of the unknown data. In the prediction of the residual stress generated by laser shocking on the surface of a plate with different parameters, we only need to change the inputs in the code and then click “run” to run. In contrast to finite element simulation, we do not need to modify the impact code or spend a lot of time on dynamic simulation and static rebound. In cases with a large number of shock points, the simulation time will be further extended; when this fact is coupled with the complexity of the material plate model, it becomes less necessary to spend a lot of time modeling, and if there are more unknown data, the advantages of the neural network agent model in terms of reducing the time required will be improved. At the same time, the neural network agent model can also be optimized in various ways to further improve the prediction ability and reduce the error between the predicted value and the actual value, such as by adjusting the basic parameters, increasing the number of hidden layers, increasing the number of hidden layer nodes, and other optimization methods. Compared with finite element simulation, the neural network agent model shows the possibility of further development.
3. Conclusions
In this experiment, TC4 titanium alloy was chosen as the research object, and the laser shock peening parameters were selected based on orthogonal experimental design. A large amount of simulation experimental data was obtained through simulation experiments. Three neural network agent models were established, namely, the BP network optimized by a genetic algorithm, a strong classifier based on BP_Adaboost, and the extreme learning machine, and the simulation experimental data with different combinations of laser shock parameters were randomly selected as the training sets and testing sets and inputted into the neural network agent model for learning and prediction. The simulation experimental data with different combinations of laser shock parameters were randomly extracted from the training sets and testing sets and fed into the neural network agent model for learning and prediction, and the prediction performance of the neural network model established under the three different network structures was compared. The main results of the study are as follows:
- In the simulation experiment undertaken to simulate the TC4 titanium alloy laser shock experiment, the surface residual stress reached under a laser energy of 2 J, a radius of 2.5 mm, and a lap rate of 0% a minimum value of 1.71 MPa. The surface residual stress under a laser energy of 8 J, radius of 1 mm, and lap rate of 70% reached a maximum value of 7.67 × 10² MPa;
- The residual stresses on the surfaces of laser-impacted TC4 titanium alloy plates increased with the increase in laser energy, decreased with the increase in spot radius, and increased with the increase in overlap rate, while all other laser parameters remained constant;
- The agent model built by optimizing a BP network with the genetic algorithm achieved the best performance in predicting the residual stresses of laser-shocked TC4 plates with the performance metrics of R2, RMSE, and MAE of 0.9985, 44.4518, and 30.6285, respectively, in the testing sets;
- In cases with limited experimental data provided through the establishment of a neural network agent model, the limited data were used learned and used to predict the unknown data. Compared with the limited element simulation neural network agent model, this model was more convenient and faster, and the prediction results were similar to those of the actual results. In cases with limited data, the establishment of a genetic algorithm-optimized BP network as a proxy model to predict the residual stress on the surface of TC4 titanium alloy strengthened by laser shocking is effective.
Author Contributions
Conceptualization, S.W. and H.L.; methodology, X.D. and C.W.; software, S.M.; validation, S.W., J.Z. (Junlong Zhang) and Z.J.; formal analysis, H.L.; investigation, J.Z. (Jida Zhong); resources, X.D.; data curation, H.L. and S.M.; writing—original draft preparation, X.D.; writing—review and editing, H.L; visualization, Z.J.; supervision, X.D.; project administration, J.Z. (Junlong Zhang) and C.W.; funding acquisition, X.D. All authors have read and agreed to the published version of the manuscript.
Funding
This research was funded by the Key Research and Development Program of Jiangxi Province: 20223BBE51004.
Institutional Review Board Statement
Not applicable.
Informed Consent Statement
Not applicable.
Data Availability Statement
The data presented in this study are available on request from the corresponding author.
Conflicts of Interest
The authors declare no conflict of interest.
References
- Gan, L.P. Fatigue Life Prediction and Reliability Analysis Method for Key Rotating Parts of Aero-Engine. Ph.D. Thesis, University of Electronic Science and Technology, Chengdu, China, 2014. [Google Scholar]
- Wang, M. Simulation of Surface Integrity and Deformation of Shot Peening Titanium Alloy Blades. Ph.D. Thesis, Dalian University of Technology, Dalian, China, 2022. [Google Scholar] [CrossRef]
- Wang, R.; Liu, P.T.; Liu, D.Y.; Zhao, X. Effect of surface ultrasonic rolling process parameters on the surface properties of EA4T axles. Therm. Process. Technol. 2021, 50, 88–92. [Google Scholar] [CrossRef]
- Zhao, X.J.; Ma, Y.X.; Zhang, Z.; Zhang, X.; Liu, Z.; Yang, W. Current status of research and application of laser impact peening technology. Appl. Lasers 2022, 42, 111–119. [Google Scholar] [CrossRef]
- He, Z.; Shen, Y.; Zhou, J.; Liu, W.; Sun, R. Advances in microstructure evolution and properties of laser impact strengthening. Aerosp. Manuf. Technol. 2021, 64, 48–58. [Google Scholar] [CrossRef]
- Savkovic, B.; Kovac, P.; Rodic, D.; Strbac, B.; Klancnik, S. Comparison of artificial neural network, fuzzy logic and genetic algorithm for cutting temperature and surface roughness prediction during the face milling process. Adv. Prod. Eng. Manag. 2020, 15, 137–150. [Google Scholar] [CrossRef]
- Savkovic, B.; Kovac, P.; Dudic, B.; Gregus, M.; Rodic, D.; Strbac, B.; Ducic, N. Comparative characteristics of ductile iron and austempered ductile iron modeled by Neural Network. Materials 2019, 12, 2864. [Google Scholar] [CrossRef] [PubMed]
- Jovicic, G.; Milosevic, A.; Kanovic, Z.; Sokac, M.; Simunovic, G.; Savkovic, B.; Vukelic, D. Optimization of Dry Turning of Inconel 601 Alloy Based on Surface Roughness, Tool Wear, and Material Removal Rate. Metals 2023, 13, 1068. [Google Scholar] [CrossRef]
- Zheng, L.; Pan, W.L.; Cheng, N. Artificial intelligence technology application and its development trend. Technol. Innov. 2022, 209, 164–166+169. [Google Scholar] [CrossRef]
- Chess, L.B. Theoretical development and application status of machine learning. China New Commun. 2019, 21, 60–62. [Google Scholar]
- Dai, F.; Zhou, J.; Lu, J.; Luo, X. A technique to decrease surface roughness in overlapping laser shock peening. Appl. Surf. Sci. 2016, 370, 501–507. [Google Scholar] [CrossRef]
- Troiani, Z. The effect of laser peening without coating on the fatigue of a 6082-t6 aluminum alloy with a curved notch. Metals 2019, 9, 728. [Google Scholar] [CrossRef]
- Kay, G. Failure Modeling of Titanium-6Al-4V and 2024-T3 Aluminum with the Johnson-Cook Material Model; Lawrence Livermore National Laboratory: Livermore, CA, USA, 2002. [Google Scholar]
- Wang, X.; Shi, F.; Yu, L.; Li, Y. Neural Networks Matlab 43 Case Studies; Beijing University of Aeronautics and Astronautics: Beijing, China, 2011; pp. 11–256. [Google Scholar]
- Wu, J.-J.; Zheng, H.; Qiao, H.-C.; Wei, B.-X.; Zhao, Y.-J.; Li, J.-F.; Zhao, J.-B. Prediction about residual stress and microhardness of material subjected to multiple overlap laser shock processing using artificial neural network. J. Cent. South Univ. 2022, 29, 3346–3360. [Google Scholar] [CrossRef]
- Wu, J.; Huang, Z.; Qiao, H.; Zhao, Y.; Lie, J.; Zhao, J. Artificial neural network approach for mechanical properties prediction of TC4 titanium alloy treated by laser shock processing. Opt. Laser Technol. 2021, 143, 107385. [Google Scholar] [CrossRef]
- Qiao, H.; Zhao, J.; Yu, Y. Parameters and performance analysis of laser impact strengthening of TC4 titanium alloy. Adv. Laser Optoelectron. 2013, 50, 142–147. [Google Scholar]
- Liu, Y.; Shi, Z.; Zhao, Y. Effect of laser impact and shot peening composite peening on the DFRcutoff of fatigue rated strength of TC4 titanium alloy details. China Laser 2020, 47, 371–378. [Google Scholar]
Disclaimer/Publisher’s Note: The statements, opinions and data contained in all publications are solely those of the individual author(s) and contributor(s) and not of MDPI and/or the editor(s). MDPI and/or the editor(s) disclaim responsibility for any injury to people or property resulting from any ideas, methods, instructions or products referred to in the content. |
© 2023 by the authors. Licensee MDPI, Basel, Switzerland. This article is an open access article distributed under the terms and conditions of the Creative Commons Attribution (CC BY) license (https://creativecommons.org/licenses/by/4.0/).