Article

Antifungal Properties of Ozone Treatment against P. citrinum and R. stolonifera in Fresh-Peeled Garlic

1
Food Microbiology Key Laboratory of Sichuan Province, College of Food and Bioengineering, Xihua University, Chengdu 610039, China
2
Technology Research Center of Food Non-Thermal Processing, Yibin Xihua University Research Institute, Yibin 644004, China
*
Author to whom correspondence should be addressed.
Coatings 2023, 13(11), 1931; https://doi.org/10.3390/coatings13111931
Submission received: 11 October 2023 / Revised: 6 November 2023 / Accepted: 9 November 2023 / Published: 11 November 2023
(This article belongs to the Special Issue Advanced Coatings and Films for Food Packing and Storage)

Abstract

:
Garlic is susceptible to decay and presents a potential vehicle for foodborne disease transmission. Ozone treatment has proven to be an effective and innoxious method to provide bacterial resistance in this globally popular pungent vegetable. This study was conducted to evaluate the effects of different ozone treatments (differing in terms of concentration, treatment time and temperature) against Penicillium citrinum and Rhizopus stolonifer in spoiled fresh-peeled garlic. The results have shown that the most inhibitory conditions for in vitro treatments were achieved with an ozone concentration, treatment time and temperature of 6 ppm, for 20 min at 20 °C, respectively, on the P. citrinum and 8 ppm, for 20 min at 25 °C, respectively, on the R. stolonifer. The optimum in vivo ozone treatment conditions for fresh-peeled garlic inoculated with the same two kinds of spoilage molds remained the same for both, consisting of an ozone concentration of 6 ppm, a time of 15 min and a temperature of 20 °C. Following these ozone treatments, the total number of colonies of yeast and mold, as well as the incidence, lesion diameter and depth of spoilage in the fresh-peeled garlic was significantly reduced during storage, with improved bactericidal inhibition effects. In conclusion, this study showed that ozone treatment effectively inhibits the growth of spoilage molds, destroys cell structures, and affects the metabolic and physiological processes of P. citrinum and R. stolonifer. Thus, it provides a protective shield and extends the shelf life of fresh-peeled garlic.

1. Introduction

Garlic (Allium sativum L.) stands as not only one of the most globally consumed vegetables, but also an enduring ingredient in traditional folk medicines [1]. Fresh garlic is rich in nutrients, including organosulfur compounds [1,2,3,4,5], amino acids [6], polyphenols [7] and vitamins [8]. Thus, fresh and fresh-peeled garlic has not only great commercial value but also significant research value. Fresh-peeled garlic can be described as a minimally processed vegetable (MPV). However, its vulnerability to decay, mildew and germination during storage due to the loss of its protective epidermis diminishes its commercial competitiveness significantly. Penicillium citrinum and Rhizopus stolonifer are the main infesting microorganisms. Among them, Penicillium citrinum colonies are mainly yellow-green in color with white edges. When it infests the garlic, it covers the surface with green molds, causing notable changes, such as reduced firmness of the garlic and loss of food value [9]. Spores of Rhizopus stolonifer are ubiquitous in the atmosphere and spread rapidly from infected fruits and vegetables to neighboring produce, particularly when the temperature exceeds 5 °C. These spores, susceptible to infestation of surrounding fruits and vegetables, contribute to spoilage during both pre-harvest and storage stages [10].
Fresh produce and MPVs hold a prominent position in global consumption patterns, serving as vital natural sources of essential nutrients [11]. The fresh-cut produce sector has been experiencing rapid growth, evolving into a multibillion-dollar industry [12] in which fresh-peeled garlic has huge commercial potential. Unfortunately, fresh produce is easily polluted through water, air, soil, insect vectors, processing equipment and even improper handling by employees in the food chain [13]. Multiple studies have highlighted that fresh-cut produce may carry a higher risk of foodborne illness compared to their unprocessed counterparts [14]. Herman [15] et al. analyzed the data on outbreaks of foodborne illness associated with fresh and fresh-cut vegetables between 1973 and 2012 and found that 73.6% were linked to fresh-cut leafy salad. Sirsat [16] et al. found that bagged fresh-cut romaine lettuce has equal if not higher levels of bacteria and spoilage microorganisms to that of whole lettuce. Processing (cutting, peeling, and shredding) can destroy cell surfaces, thereby exposing cytoplasm which provides an excellent source of nutrients for microorganisms [17]. The fresh-cut industry typically uses hypochlorous acid and hypochlorite for disinfection [13]; however, the reaction of these chemicals with organic molecules produces unhealthy by-products, including carcinogenic and mutagenic chlorinated compounds such as chloroform and other trihalomethanes, chloramines and haloacetic acids [18,19]. Therefore, the development of an efficient, yet safe and healthy, preservation method is imperative to prevent decay in fresh-peeled garlic.
Ozone (O3), also known as triatomic oxygen, is naturally produced by oxygen via lightning or the action of ultraviolet (UV) light [20]. It is a strong oxidizing agent and powerful broad-spectrum antimicrobial agent [21] capable of combating bacteria, fungi, viruses and protozoa, as well as bacterial and fungal spores [22]. Molecular ozone or decomposed ozone products can efficiently and swiftly eliminate microorganisms, leaving no residue [23]. Gibson [24] et al. found that ozone is an effective sanitizer when applied to microorganisms on fresh produce. Zou [23] et al. reported that 10 to 15 min ozone treatments retarded mold spots and leakage in commercially packaged and processed produce. In an earlier study, Khadre [22] et al. reported that 0.3 ppm ozone treatments for 12 days at a storage temperature of 2 °C successfully prevented mold development in blackberries, without causing damage to the ozone-treated fruits. Moreover, ozone treatment was granted GRAS status (Generally Recognized As Safe) by the United States Food and Drug Administration (FDA) in 2001 [25]. Interest in ozone has steadily grown in the fruit and vegetable industry [26] and it is now widely applied in the treatment of fresh and dried fruit and vegetables, as well as frozen and processed products. Compared with other garlic preservation techniques, such as irradiation, air conditioning, and chemical preservatives, ozone sterilization has the advantages of high efficiency, affordability and high safety [23]. Among currently available technologies, ozone treatment provides a good alternative to chlorine and has been shown to result in a substantial reduction in microbiomes on various foods [27], such as the microflora and foodborne pathogens present on button mushrooms [28], microflora of dried figs [29], Botrytis cinerea on strawberries [30], green mold on tangerines [31], Rhizopus stolonifer on table grapes [32], molds on peaches and table grapes [33] and anthracnose rot on tomatoes [34]. However, no notable studies addressing the decontamination of fresh-peeled garlic using ozone have yet been reported.
After preliminary studies, we isolated and identified the molds responsible for spoilage in fresh-peeled garlic, among which Penicillium citrinum and Rhizopus stolonifer were subsequently determined to be the primary strains [35]. The main objective of this study was to investigate the antibacterial properties and mechanisms of ozone treatment specifically against P. citrinum and R. stolonifer isolated from fresh-peeled garlic. The exosmosis ratio (ER), protein dissolution rate (PDR), mycelial growth inhibition rate (MGIR) and lethality rate (LR) of P. citrinum and R. stolonifer were determined in vitro, while the total plate count (TPC), yeast and mold (YAM) counts and disease incidence rate (DIR), as well as the depth and diameter of the disease spot, were determined in vivo.

2. Materials and Methods

2.1. Materials

P. citrinum and R. stolonifer (SICC3.977 and SICC3.978, stored in the Southwest Center of Industrial Culture Collection in China, and isolated from spoiled and moldy fresh-peeled garlic) were used throughout the study. The isolates were maintained on potato dextrose agar (PDA, Beijing Aobox Biotechnology Co., Ltd., Beijing, China) at 4 °C until needed.
The P. citrinum and R. stolonifer samples were activated in potato dextrose broth (PDB, Beijing Aobox Biotechnology Co., Ltd., Beijing, China) and placed in a shaker at 28 °C for 72 h, according to a previously reported method [33,36,37], with some modifications. The P. citrinum and R. stolonifer were subsequently cultured on PDA at 28 °C for 72 h in an incubator (SKP-02, Huangshi Hengfeng Medical Apparatus and Instruments Co., Ltd., Huangshi, China). Finally, the P. citrinum and R. stolonifer conidia were collected from the PDA by adding 10 mL sterile water to the Petri dish, and the conidial suspensions were adjusted to a concentration of 106 conidia mL−1.

2.2. Ozone Exposure

Ozone was produced using an ozone generator (YS-MJCB-S17, Hangzhou Yishi Technology Co., Ltd., Hangzhou, China), with an oxygen flow of 2 L·min−1 from the Mark 5 Plus 95 Concentrator Oxygen Concentrator (Nidek Medical Products Inc., Birmingham, AL, USA).

2.3. Sample Preparation and Ozone Treatment

To determine the ER and PDR of P. citrinum and R. stolonifer, their spores were collected from a PDA medium via an inoculation loop and transferred to the PDB medium, according to Diao [38] et al. and Yin [39]. The cell concentrations in the PDB medium were adjusted to approximately 106 conidia mL−1, after which 20 mL of the diluted PDB medium was pipetted into empty Petri dishes (five dishes per treatment). For the determination of MGIR, mycelial plugs (5 mm in diameter) obtained from the periphery of actively growing three-day-old P. citrinum and R. stolonifer cultures were introduced mycelium-down at the center of Petri dishes containing 20 mL PDA medium (5 dishes per treatment). Furthermore, the LR of the two molds was determined according to the method described by Xu [40] et al. and Xing [41] et al., with slight modifications. Samples (1 mL) of each of the diluted spore suspensions were inoculated onto Petri dishes (five dishes per treatment) containing 20 mL PDA medium, after which the dish lids were removed to allow free air flow. The dishes were then placed in an ozone treatment room and the following three investigations were undertaken: (1) After 15 min ozone treatment at a temperature of 25 °C and a humidity level of 90%, the effects of different concentrations of ozone (0 (control), 2, 4, 6, 8, 10 ppm) on the two molds were explored; (2) When the concentration of ozone was 6 ppm, the temperature was 25 °C and the humidity was 90%, the effects of different treatment times (0 (control), 5, 10, 15, 20, 25, 30 min) on the two molds were explored; (3) When the concentration of ozone was 6 ppm, the treatment time was 25 min and the humidity was 90%, the effects of different temperatures (20, 25, 30 °C) on the two molds were explored.
The design and setup of the ozone fumigation system were established as previously described by Palou [33] et al., with some modifications. Pest-free fresh-peeled garlic of the same size was washed, dried and then divided into three groups of 2 kg each. A wound (diameter 2 mm, depth 5 mm) was introduced into the middle of each garlic using a sterile inoculation needle, and the wound surfaces were disinfected with 75% alcohol followed by UV irradiation for 30 min. Thereafter, 5 μL of a suspension of 1 × 10⁶ colony forming unit (CFU)/mL spore concentration of P. citrinum and R. stolonifer were injected into each group of garlic wounds. The groups were then placed in the ozone treatment room and the following investigations were undertaken: In Group 1, after ozone treatment of 15 min at a temperature of 25 °C and a humidity level of 90%, the effects of different concentrations of ozone (0 (control), 1, 2, 3, 4, 5, 6 ppm) on the two molds were explored. In Group 2, when the concentration of ozone was 6 ppm, the temperature was 25 °C and the humidity was 90%, the effects of different treatment times (0 (control), 3, 6, 9, 12, 15, 18 min) on the two molds were studied. In Group 3, when the concentration of ozone was 6 ppm, the treatment time was 15 min and the humidity was 90%, the effects of different temperatures (15, 20, 25 °C) on the two molds were investigated. At the end of each exposure, the dishes were transferred for incubation at 28 °C, and the TPC, YAM, DIR, diameter and depth of the disease spots were determined. Each different treatment was evaluated at intervals of 2 days over 10 days of ambient storage.

2.4. Exosmosis Ratio (ER) and Protein Dissolution Rate (PDR) Determination

The ER of the fungi cells was measured for each ozone treatment group according to the method described by Xing [42] et al. Cells were cultured for 72 h in PDB medium, and then centrifuged at 4 °C and 4000 r/min for 10 min. The obtained precipitate was washed with deionized water 1–2 times, then weighed and divided into two groups, Group A and Group B, which were placed into small beakers and immersed with 20 mL of deionized water. The samples of Group A were placed in a vacuum oven in which vacuum gas drainage was repeated 3–4 times. The pressure was controlled at 450–500 mm Hg and the vacuum infiltration was restored to normal pressure after 30 min. The treated samples were then shaken at 28 °C for another 2–3 h. The samples of Group B were placed in a boiling water bath (100 °C) for 15 min to completely illuminate the electrolytes in the tissue. Finally, conductivity was measured in both Group A and Group B at a constant temperature of 25 °C using a conductivity meter (DBS-11A, Shanghai Yidian Scientific Instrument Co., Ltd., Shanghai, China). The ER was calculated as follows: ER (%) = (the conductivity of Group A/the conductivity of Group B) × 100%.
PDR was measured with reference to the method reported by Yin [39] et al. The bacterial suspension before and after ozone treatment was placed in a refrigerated centrifuge and centrifuged at 4000 r/min for 10 min at 4 °C. The supernatant was subsequently taken to measure the absorbance at 280 nm. Sterile water was used as a reference solution. The PDR was ultimately expressed as absorbance.

2.5. Mycelial Growth Inhibition Rate (MGIR) and Lethality Rate (LR) Determination

At the end of each exposure, the dishes were transferred for incubation at 28 °C for up to 72 h, after which the colony diameter of each treatment was measured with a Vernier caliper, recorded, and the MGIR was estimated by expressing the mean of the diameter at each exposure to ozone concentration. Finally, MGIR was estimated using the following equation:
M G I R % = C D 0 ( c m ) C D t ( cm ) C D 0 ( cm ) × 100 %
Colony diameter = total colony diameter (cm)—0.5 cm, where MGIR is the mycelial growth inhibition rate, CD0 is the colony diameter of control and CDt is the colony diameter of the ozone treatment. At the end of each exposure, the dishes were transferred for incubation at 28 °C for up to 72 h, after which the total colonies of P. citrinum and R. stolonifer in the ozone treatment groups and the blank group were counted separately as follows:
LR (%) = [(total colonies of blank group—total colonies of ozone treatment)/total colonies of blank group] × 100%

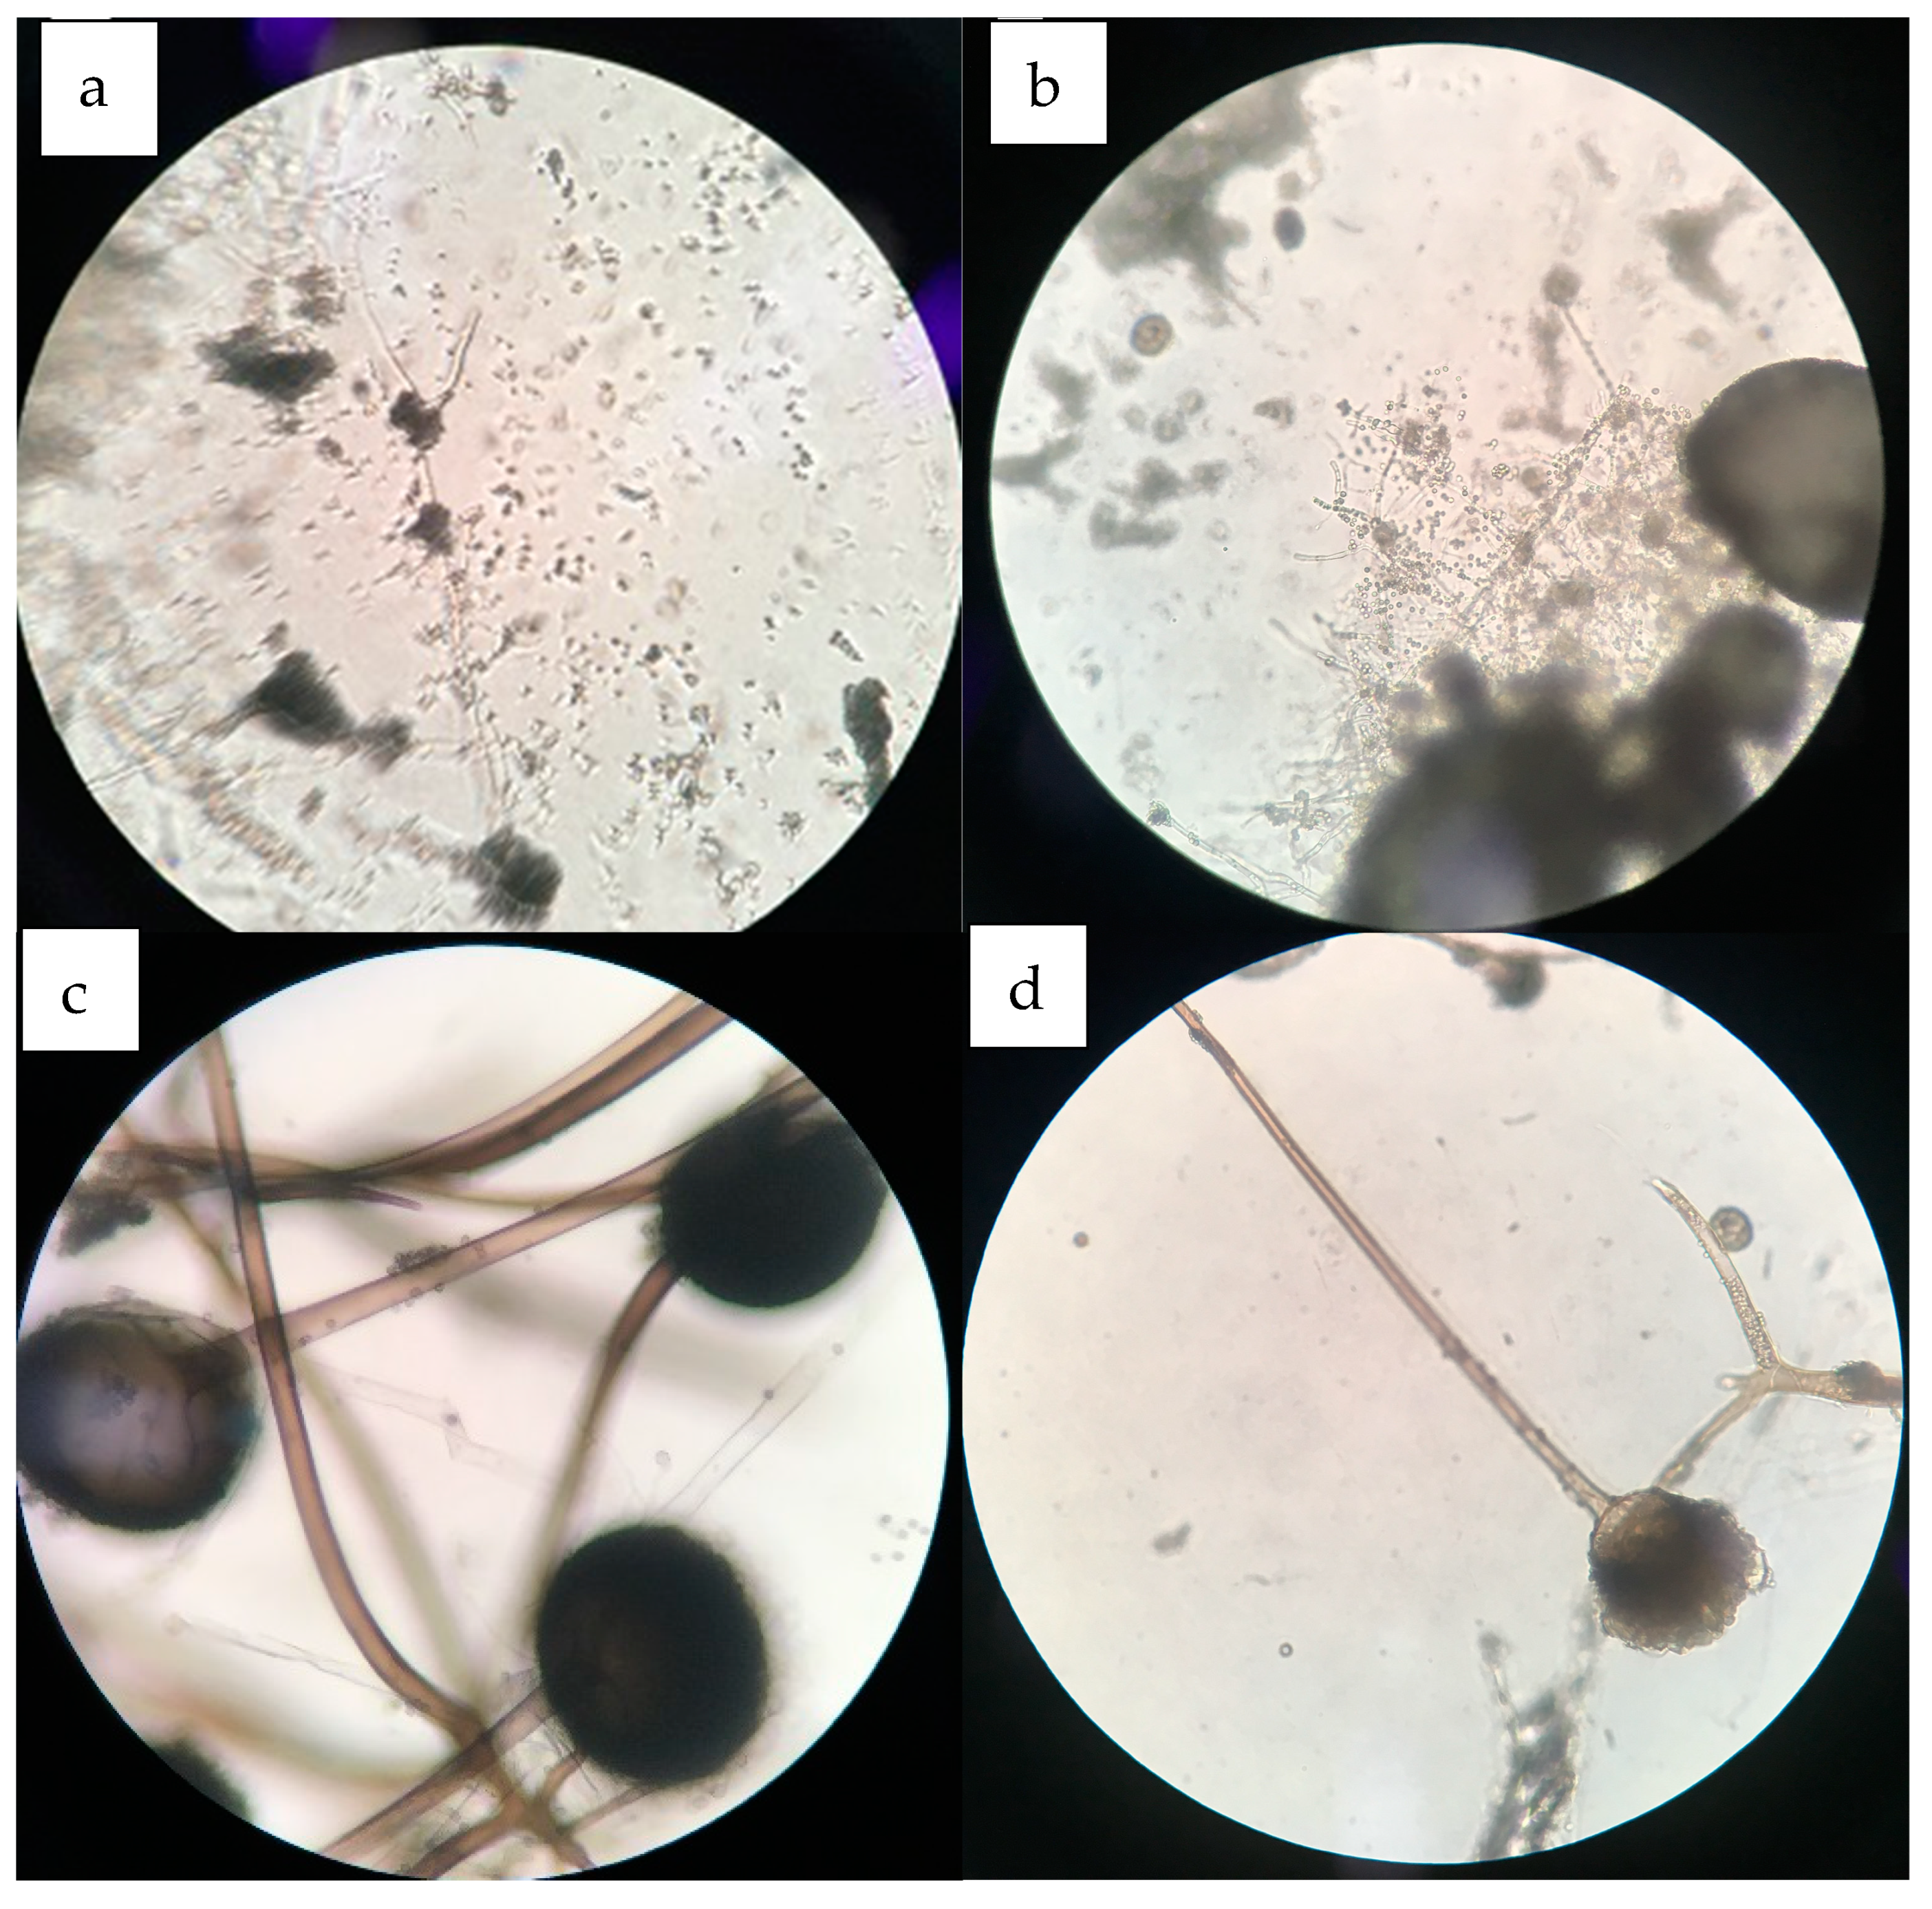
2.6. Mycelial Morphology

Appropriate ozone treatment was adopted based on the above experimental results. One mL of diluted spore suspension was inoculated onto Petri dishes (five dishes per treatment) containing 20 mL PDA medium. Dish lids were removed to allow air flow and the dishes were placed in an ozone treatment library. At the end of exposure, the dishes were transferred for incubation at 28 °C for 72 h, after which the mycelial morphology of each replication dish was assessed via microscopic observation (10 × 40).

2.7. Microbiological Counts

The TPC and YAM counts in the fresh-peeled garlic were determined using the method described by Salve [43] et al. and Martiñon [44] et al. The estimations of TPC on plate count agar and of the YAM on potato dextrose agar were carried out using the spread plate method. TPC was counted after incubation at 30 °C for 24 h, while yeasts were counted at 30 °C for 5 d.

2.8. Disease Incidence Rate (DIR) and Disease Spot Diameter and Depth

Disease incidence in the fungi cells was measured according to the method described by Ong [45] et al., with some modifications. The effect of ozone on the disease incidence in the garlic from each treatment was evaluated at two-day intervals during 10 days of ambient storage by weighing the diseased garlic against the weight of total garlic as follows:
Disease incidence rate (%) = [weight of fresh-peeled garlic (g)/weight of total fresh-peeled garlic (g)] × 100%
Ten garlic samples were taken each time for measurement. A Vernier caliper was used to measure the diameter of the disease spots via the cross method in the direction of the wound. The average value was calculated as the final result. Each treatment was evaluated at 2-day intervals throughout a 10-day period of ambient storage.

2.9. Statistical Analysis

The tests in this investigation were carried out in triplicate. The test results were analyzed using SPSS 20.0 software (SPSS Inc., Chicago, IL, USA) and expressed as mean ± standard deviations. One-way analysis of variance (ANOVA) was performed followed by the Student–Newman–Keuls test to determine the significant difference (p < 0.05) between the various means of treatments.

3. Results and Discussion

3.1. Results

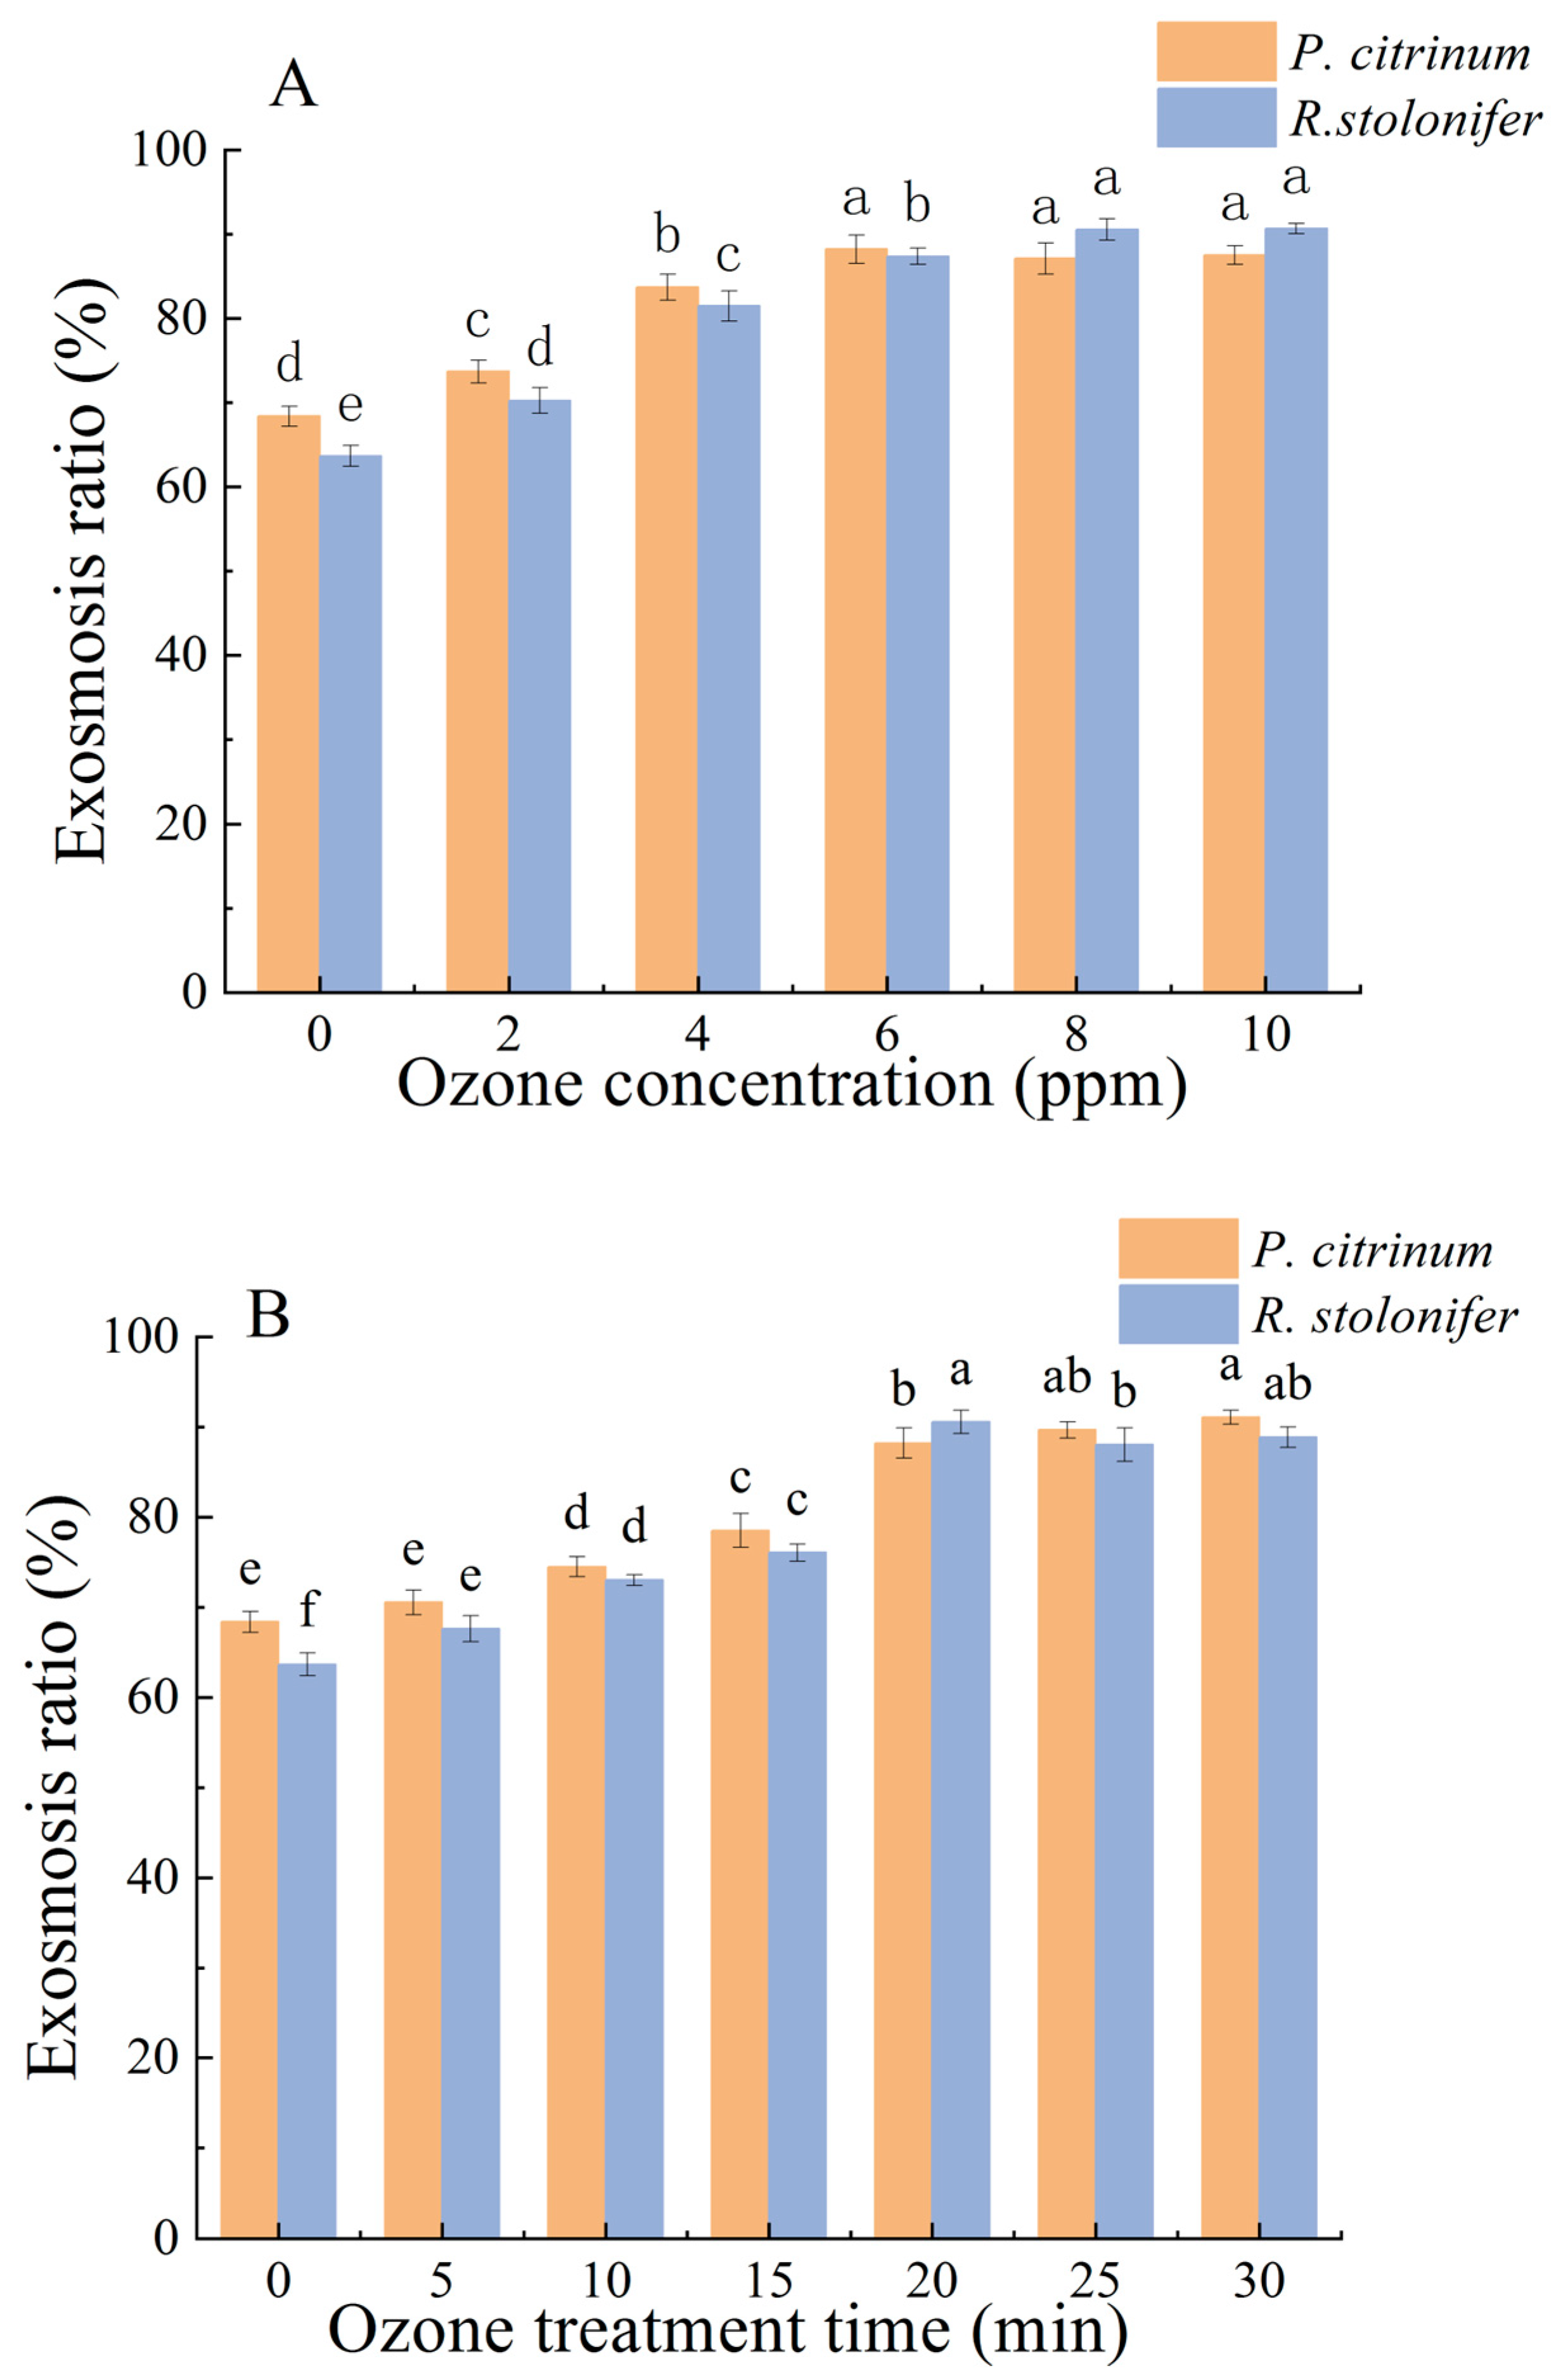
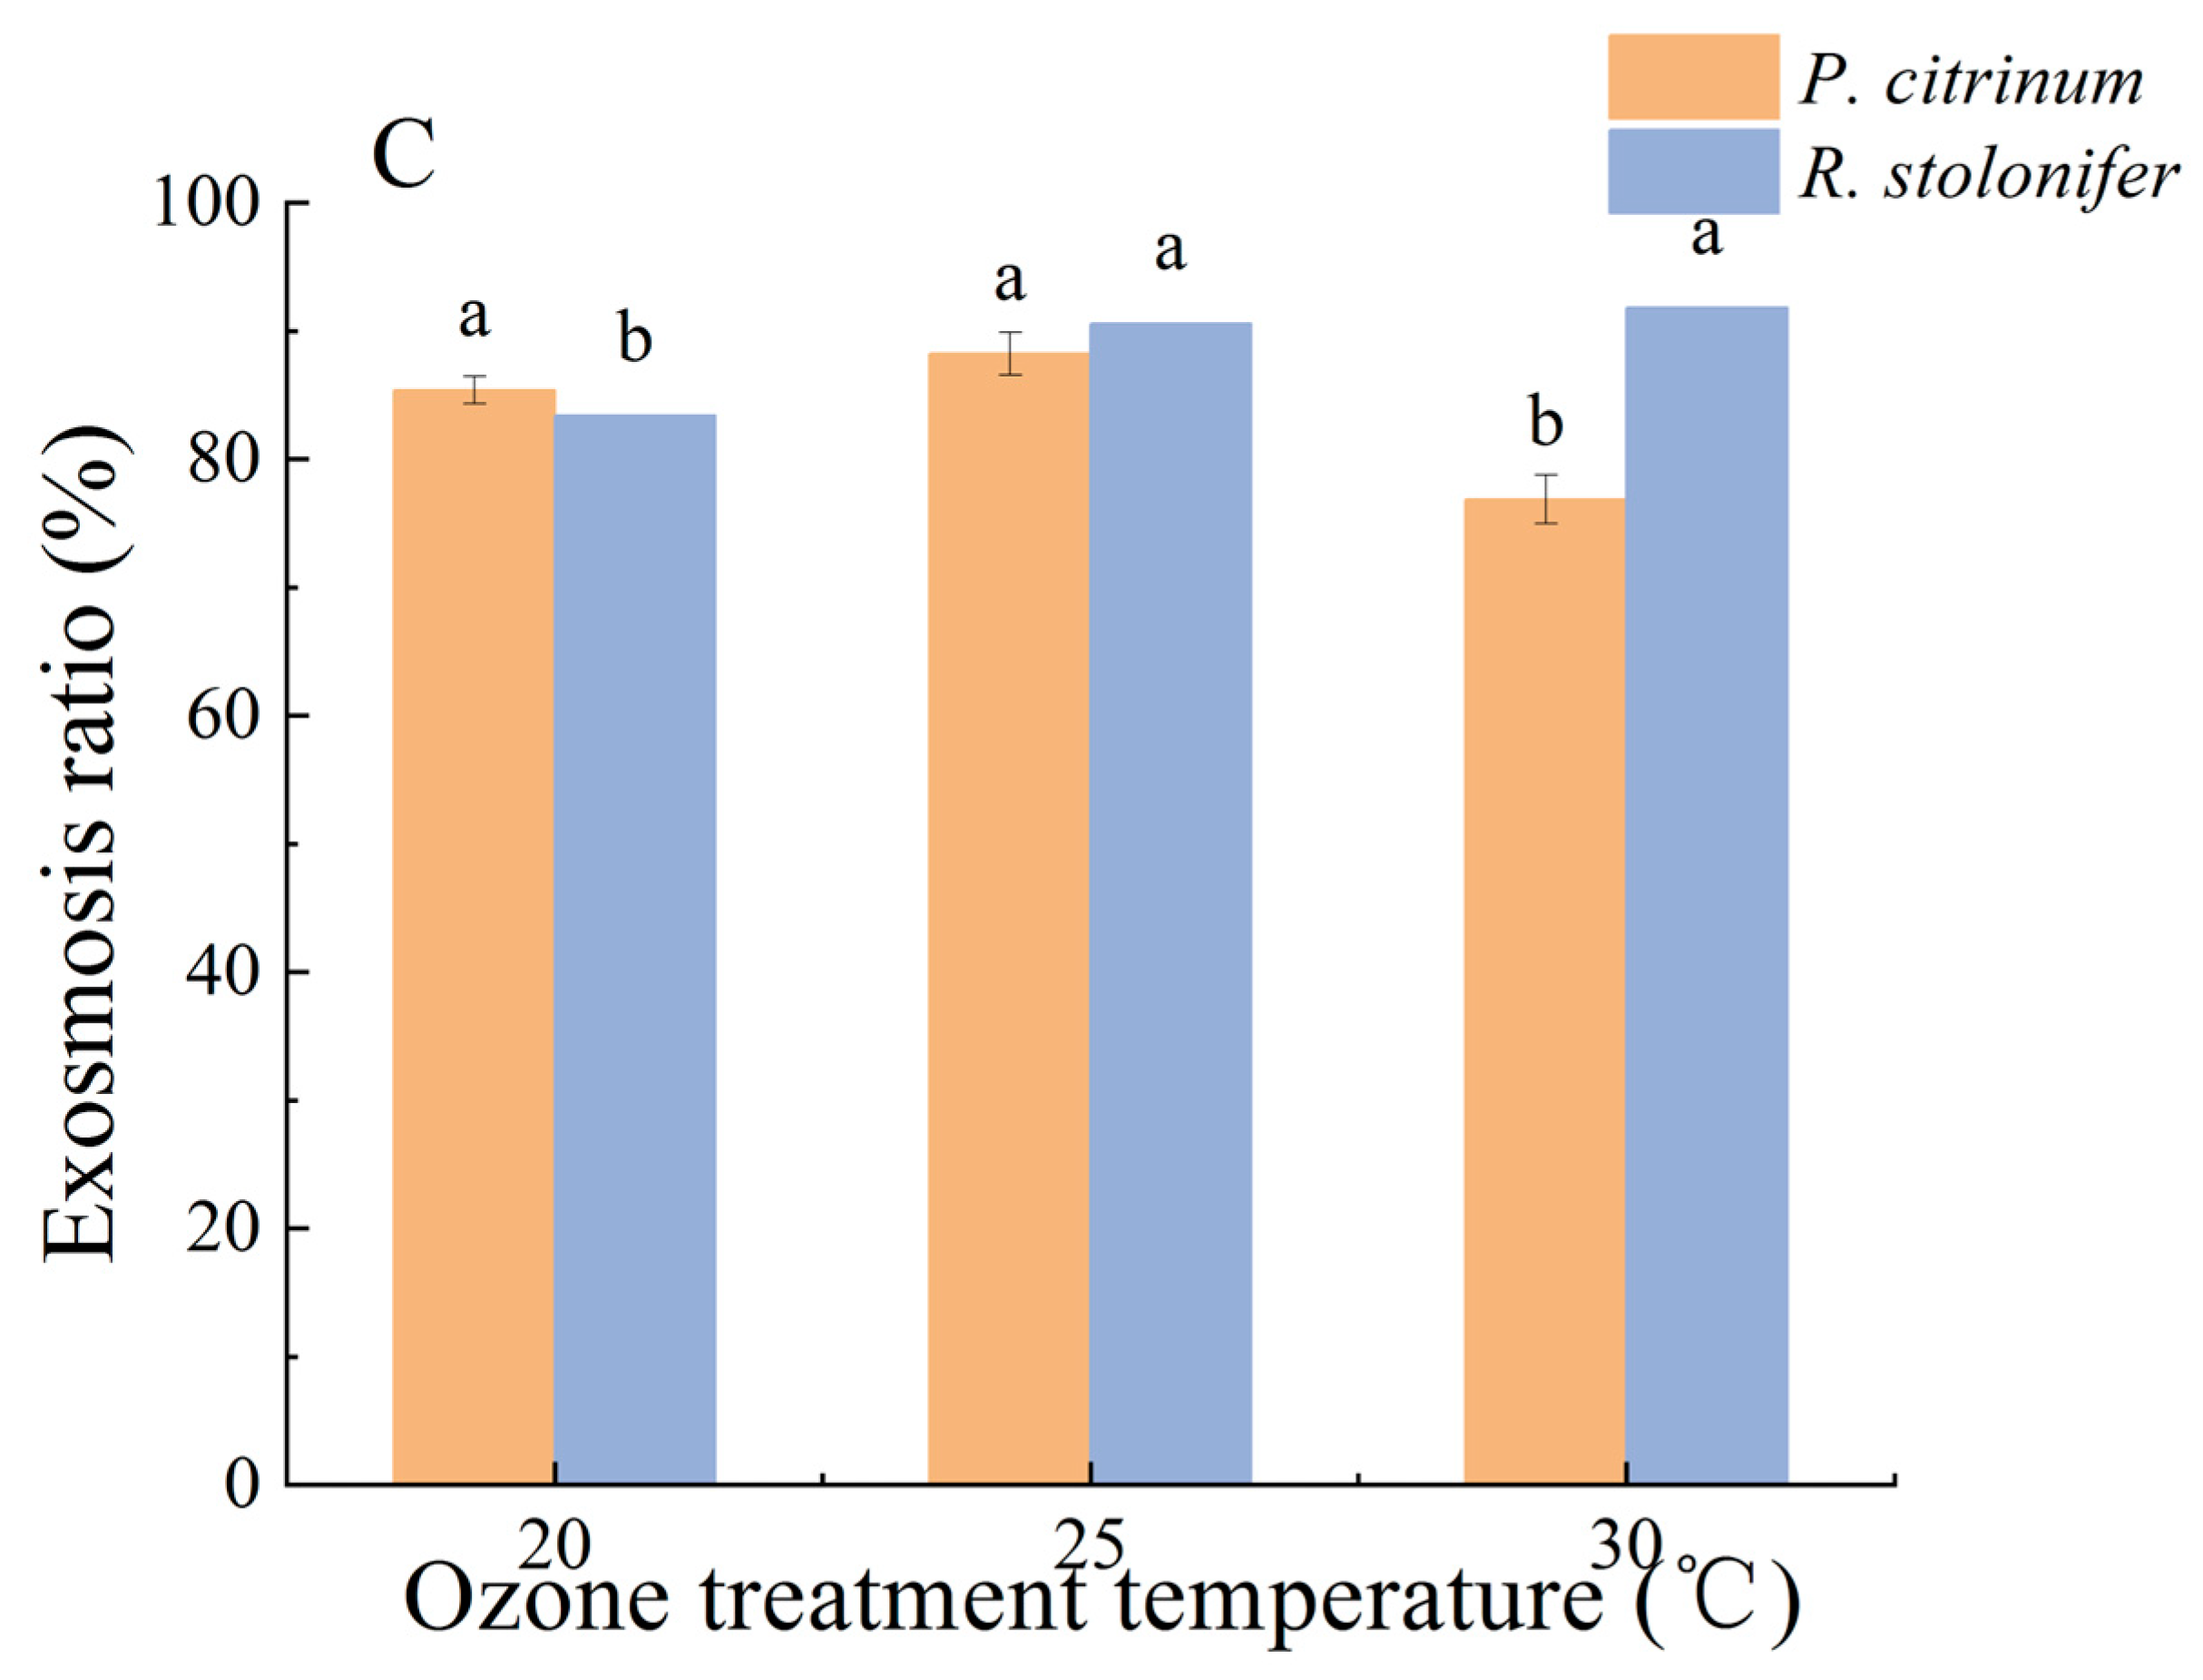
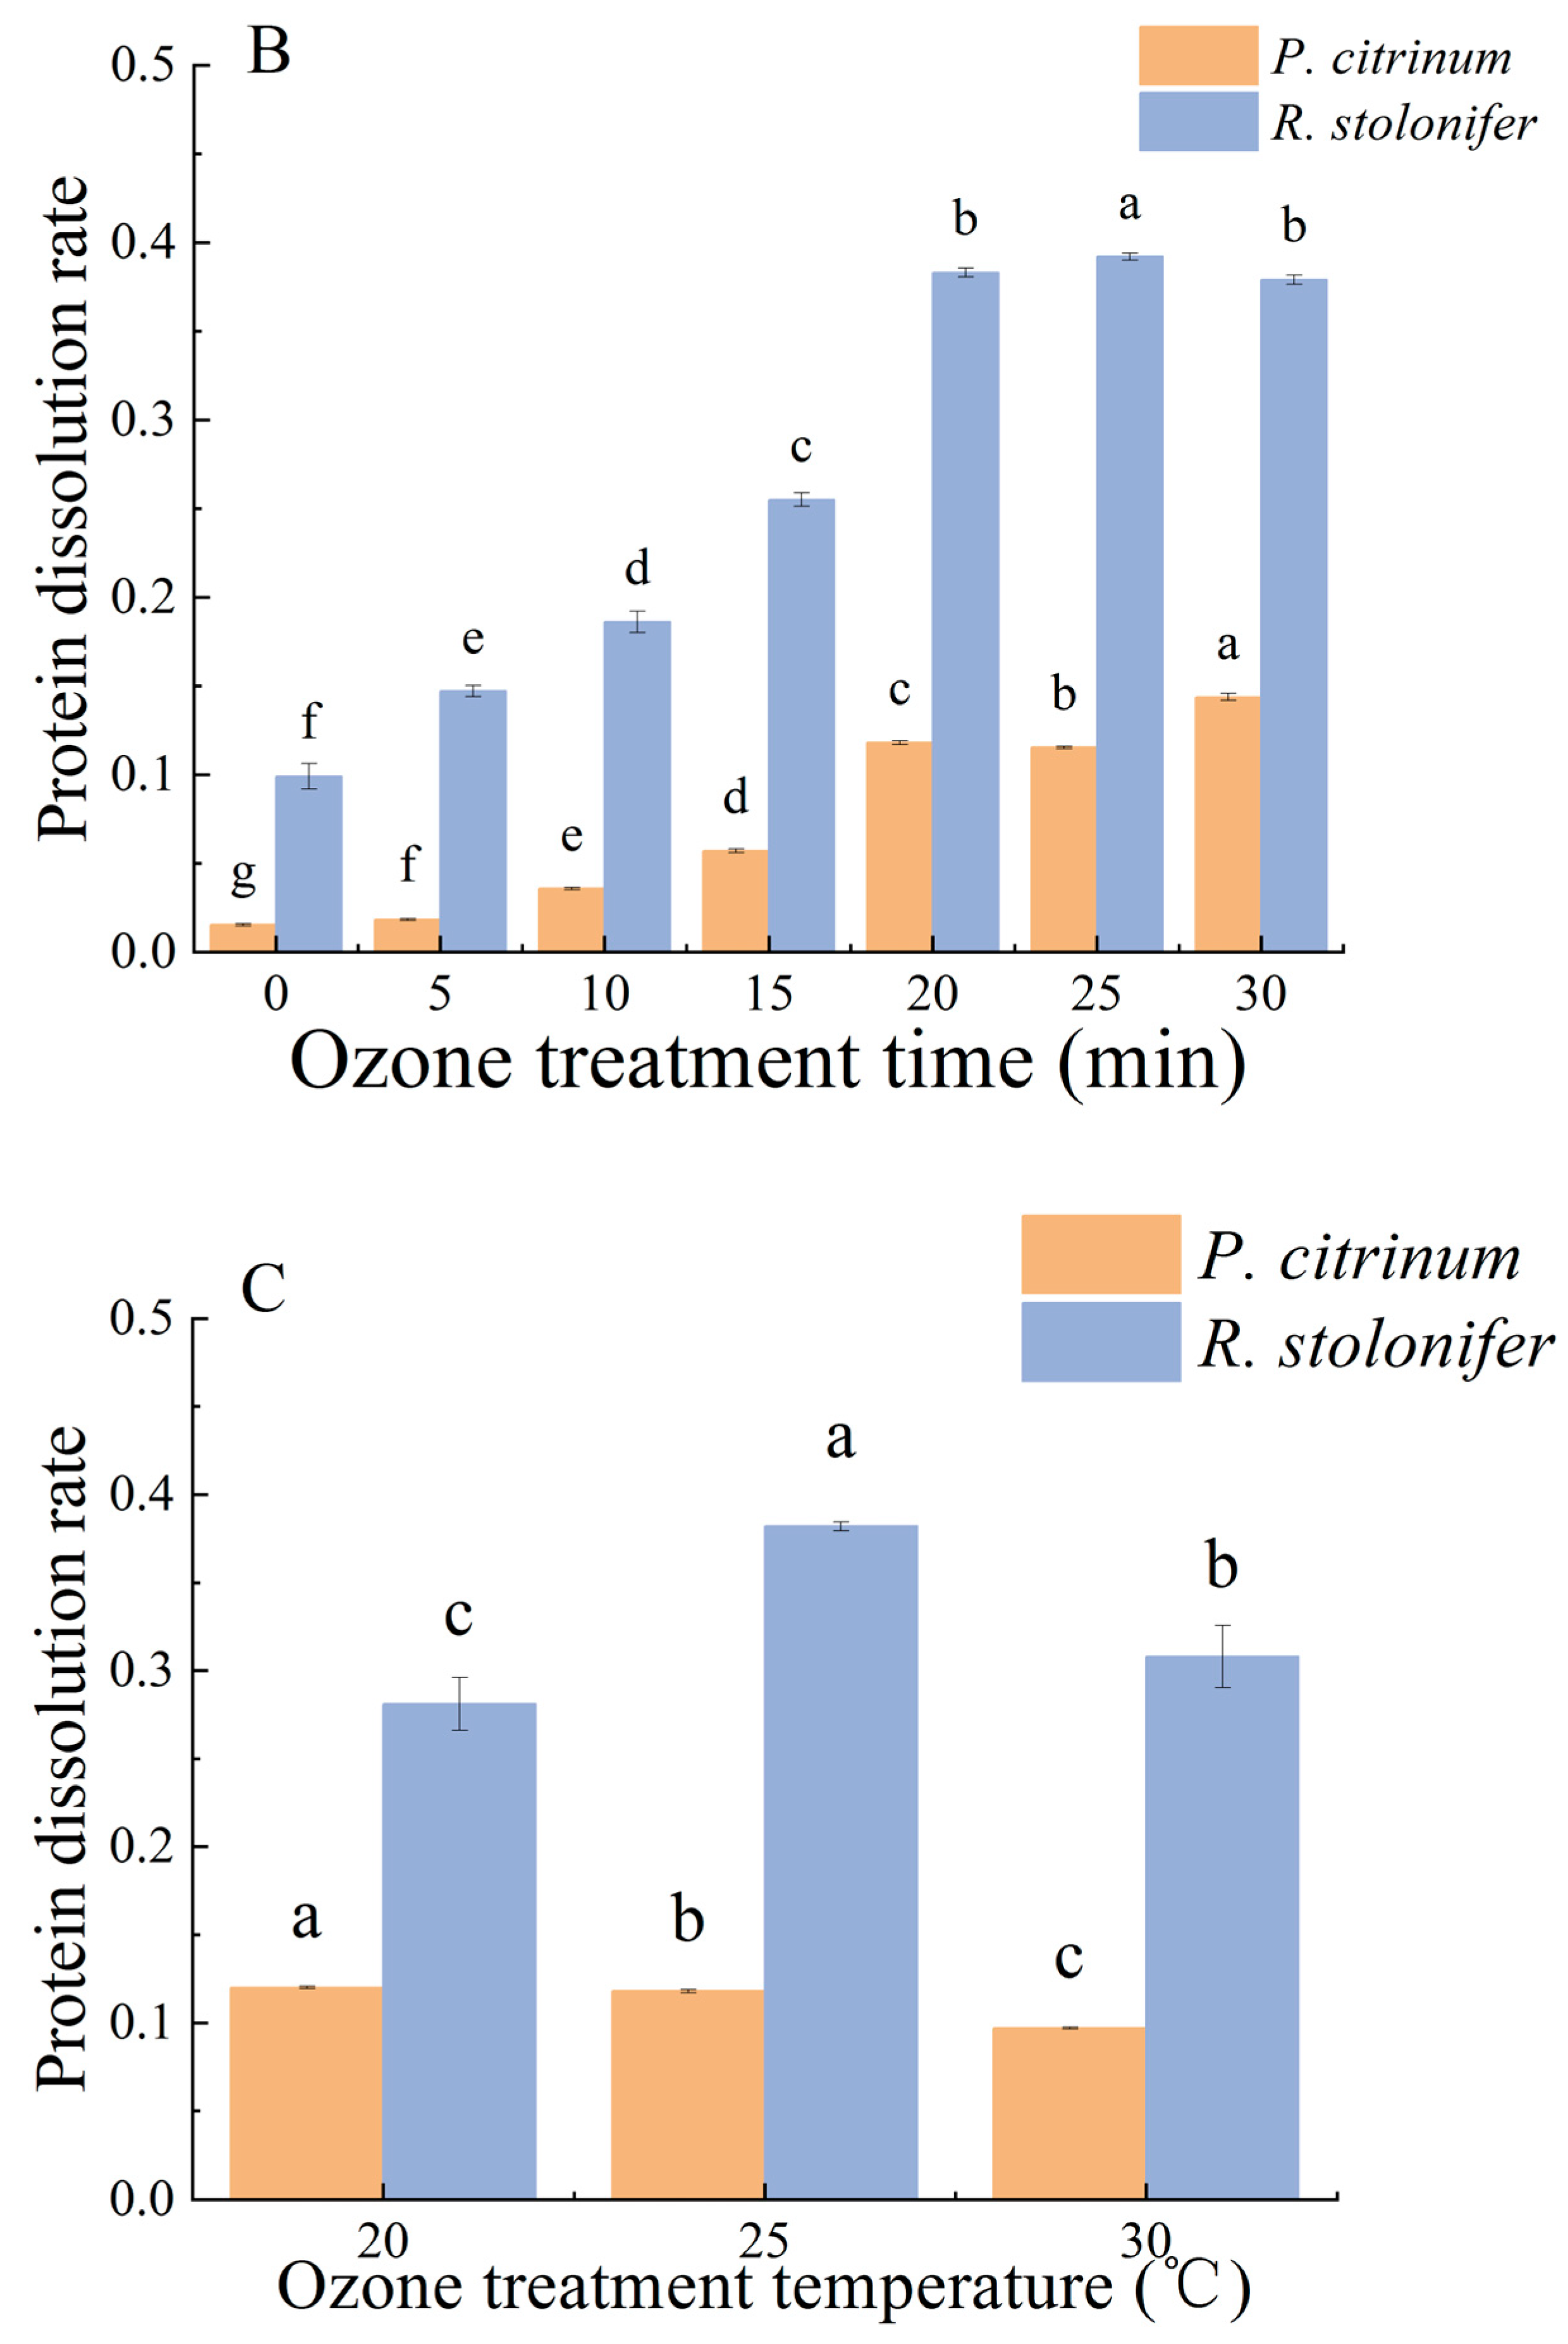
3.1.1. Changes in ER and PDR

As shown in Figure 1A, a statistically significant increase in ER (p < 0.05) was observed when the ozone concentration increased from 0 ppm to 6 ppm. When the ozone concentration increased above 6 ppm, the ER of P. citrinum stabilized, whereas the ER of R. stolonifer continued to increase significantly until the ozone concentration reached 8 ppm. Similarly, when the treatment time lengthened from 5 min to 20 min, the ER of both P. citrinum and R. stolonifer increased significantly; however, the difference was no longer statistically significant after 20 min (Figure 1B). The highest ER observed in the P. citrinum and R. stolonifer were 88.21% and 90.56%, respectively. As shown in Figure 1C, the change in treatment temperature had little effect on the ER of P. citrinum and R. stolonifer. With the increase in temperature, the ER of P. citrinum showed neither a steady, increasing, nor decreasing trend, mainly because the decomposition rate increased but the inhibition rate of mold decreased, and the conductivity of the bacterial suspension also gradually declined. Thus, the increase in the permeability of the mold cell membranes of both P. citrinum and R. stolonifer indicated the destruction of the two fungi by the ozone treatment. However, trends differed according to the different ozone concentrations, treatment times and temperatures.
When the ozone concentration increased from 0 ppm to 10 ppm, the PDR of P. citrinum and R. stolonifer were both found to increase significantly, attaining a maximum of 0.234 and 0.394, respectively, at 10 ppm (Figure 2A). In Figure 2B it is evident that as the ozone treatment time increased from 0 min to 25 min the PDR of both molds increased, stabilizing for P. citrinum thereafter. Furthermore, in Figure 2C, the PDR of P. citrinum dropped significantly with rising temperatures, while that of the R. stolonifer did not show a trend change. Overall, as can be seen in Figure 2, the PDR of P. citrinum was significantly higher than that of the R. stolonifer after the same ozone treatments and, thus, ozone significantly increased the absorbance value of the mold suspension and increased the protein dissolution rate.

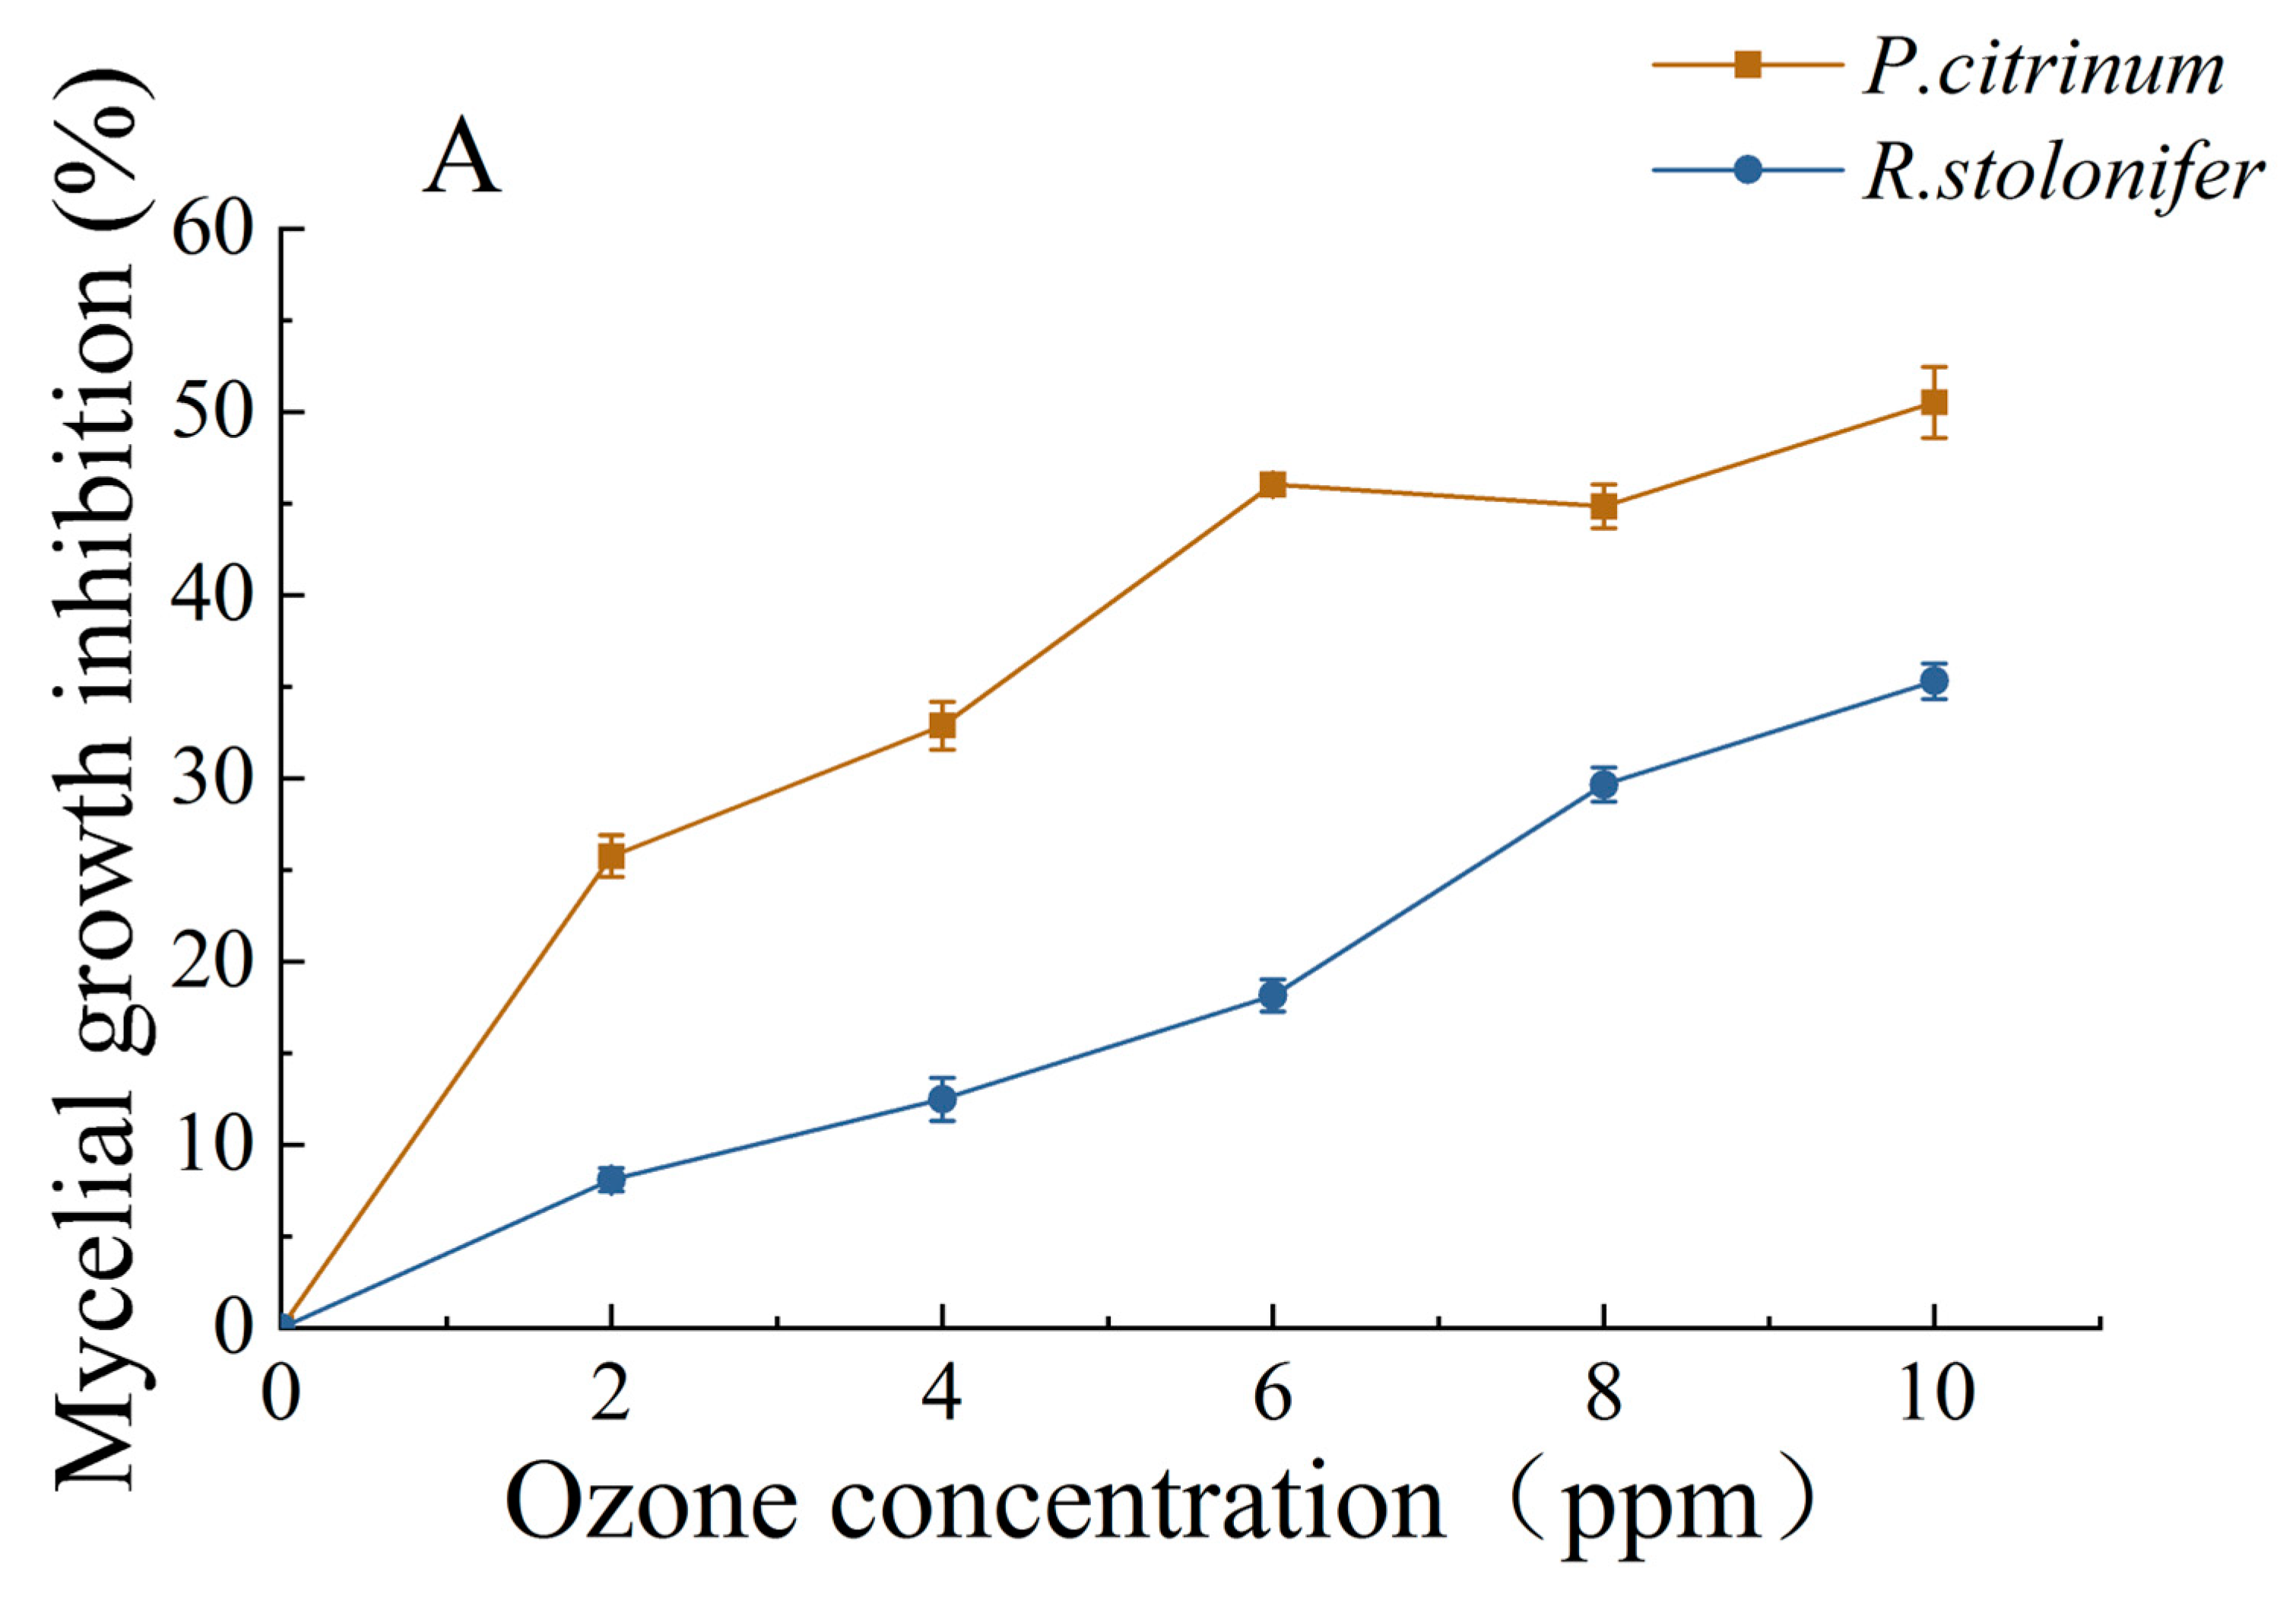
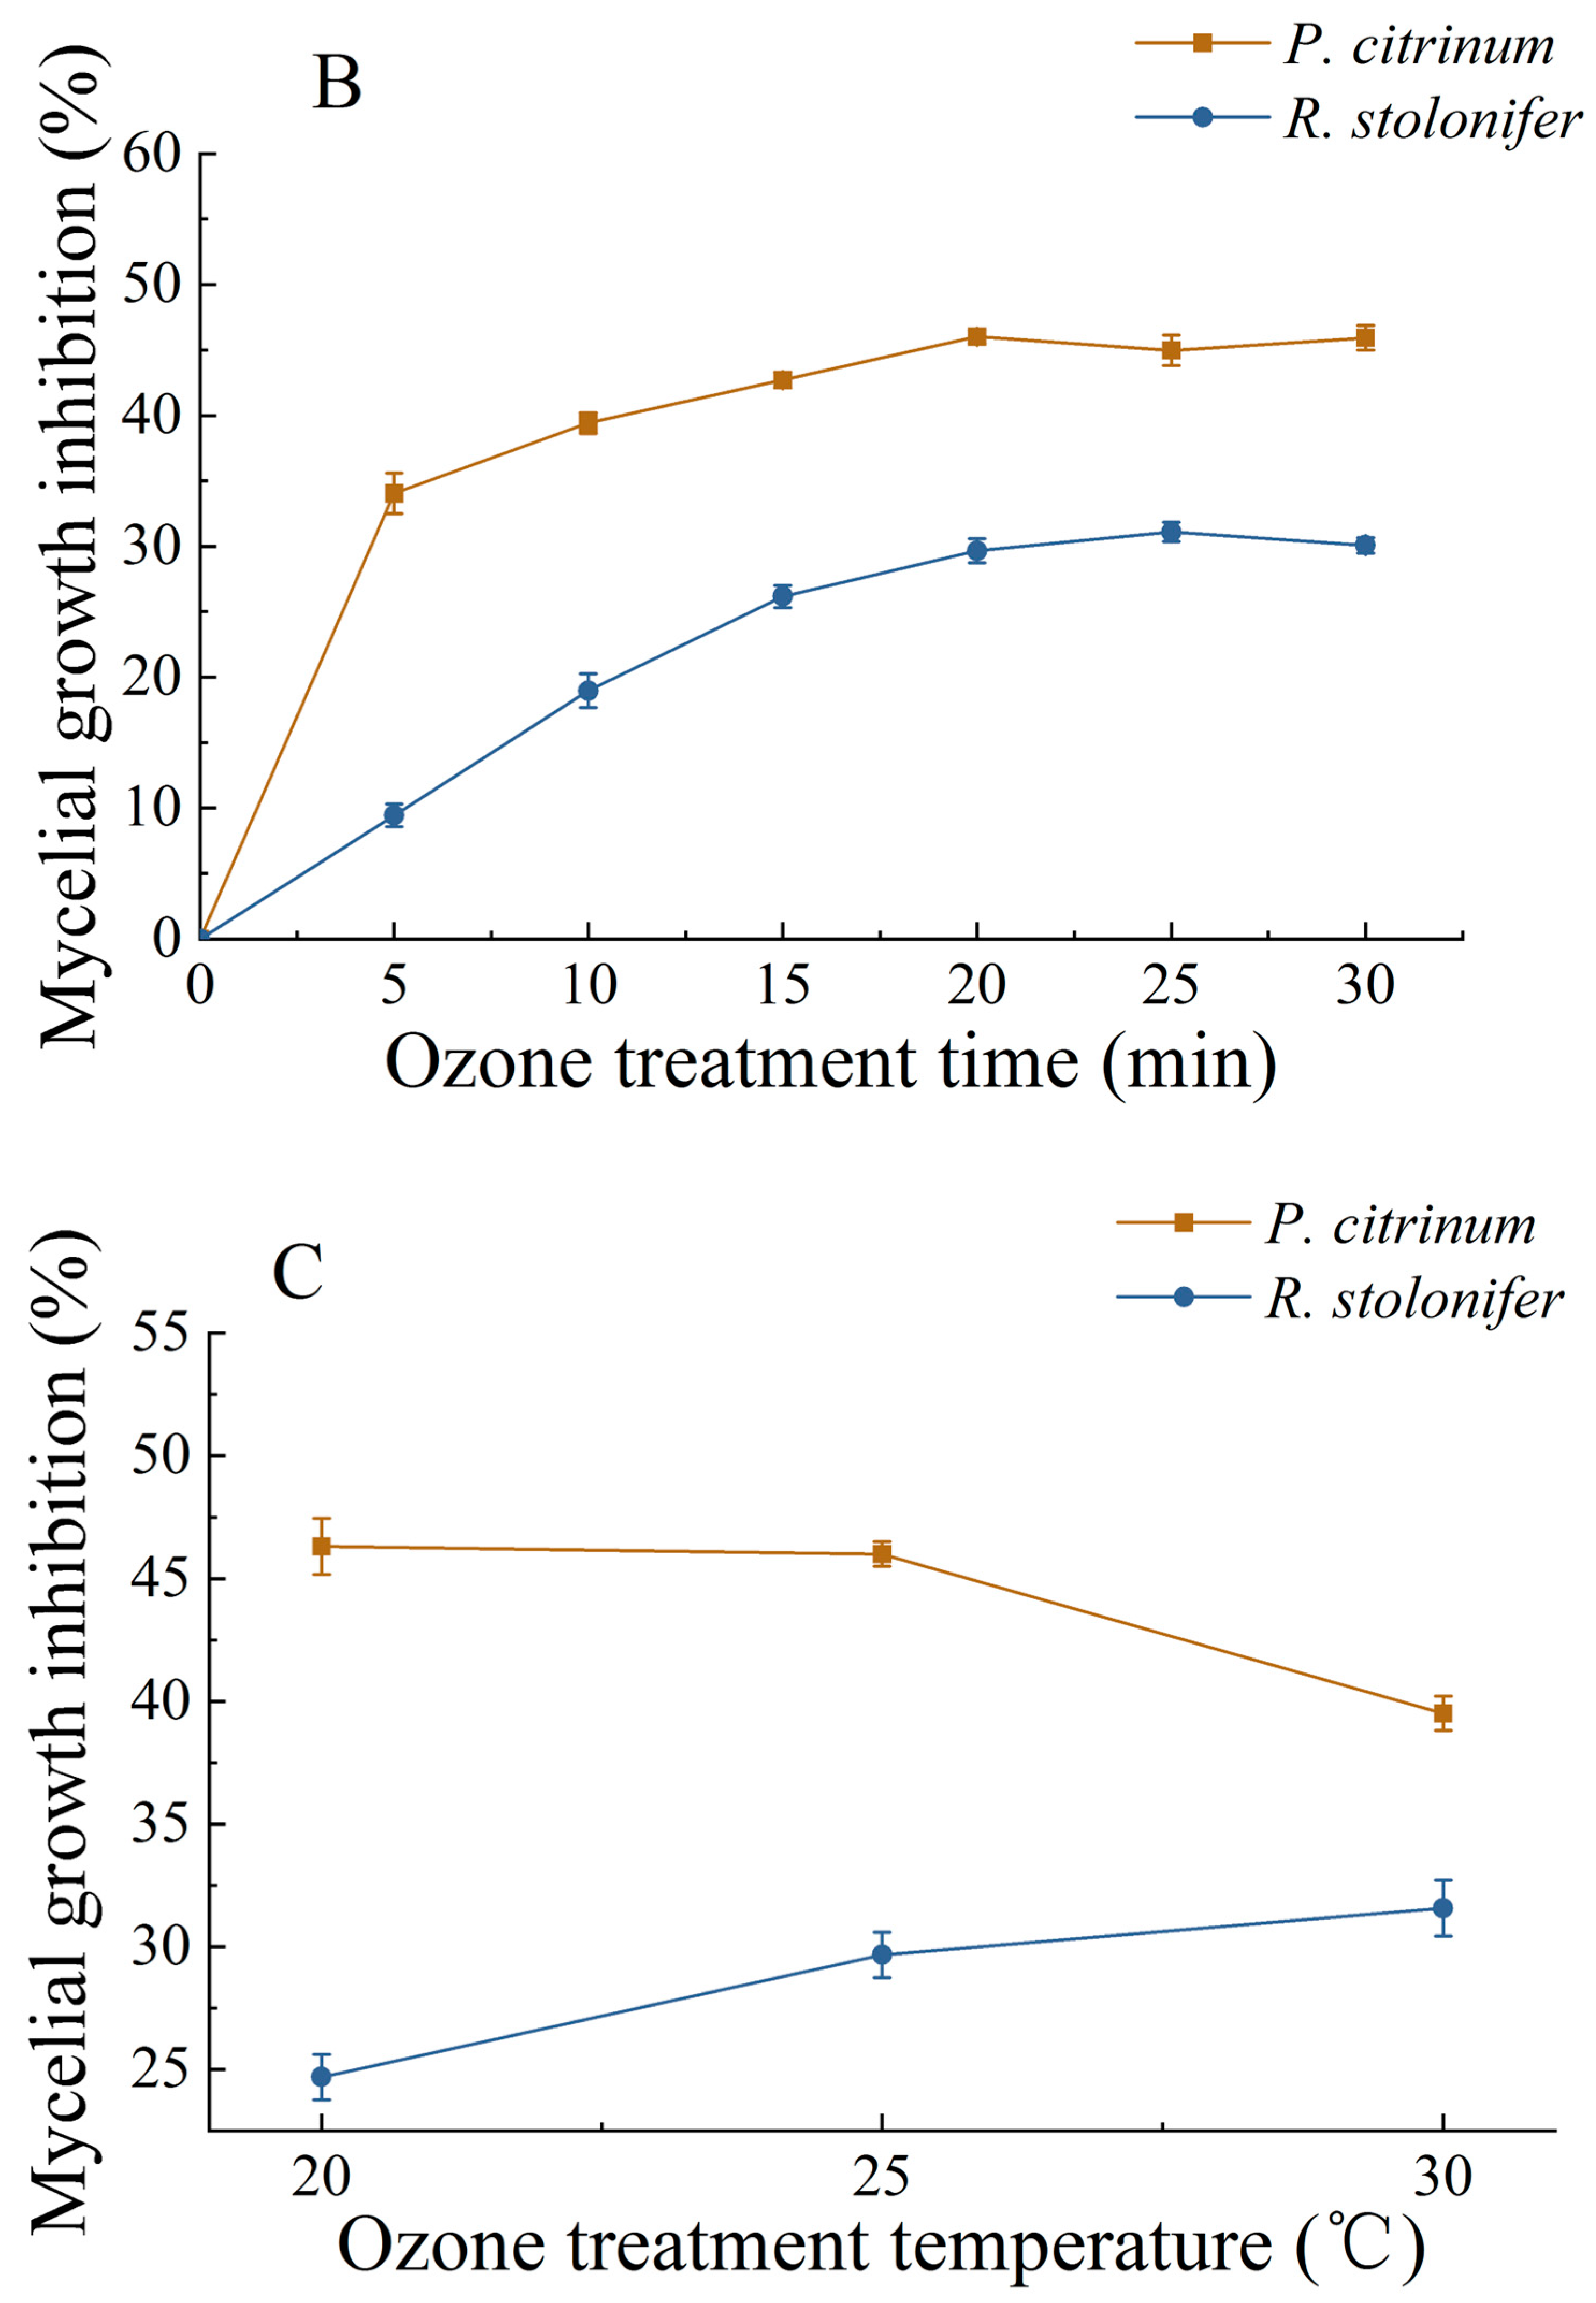
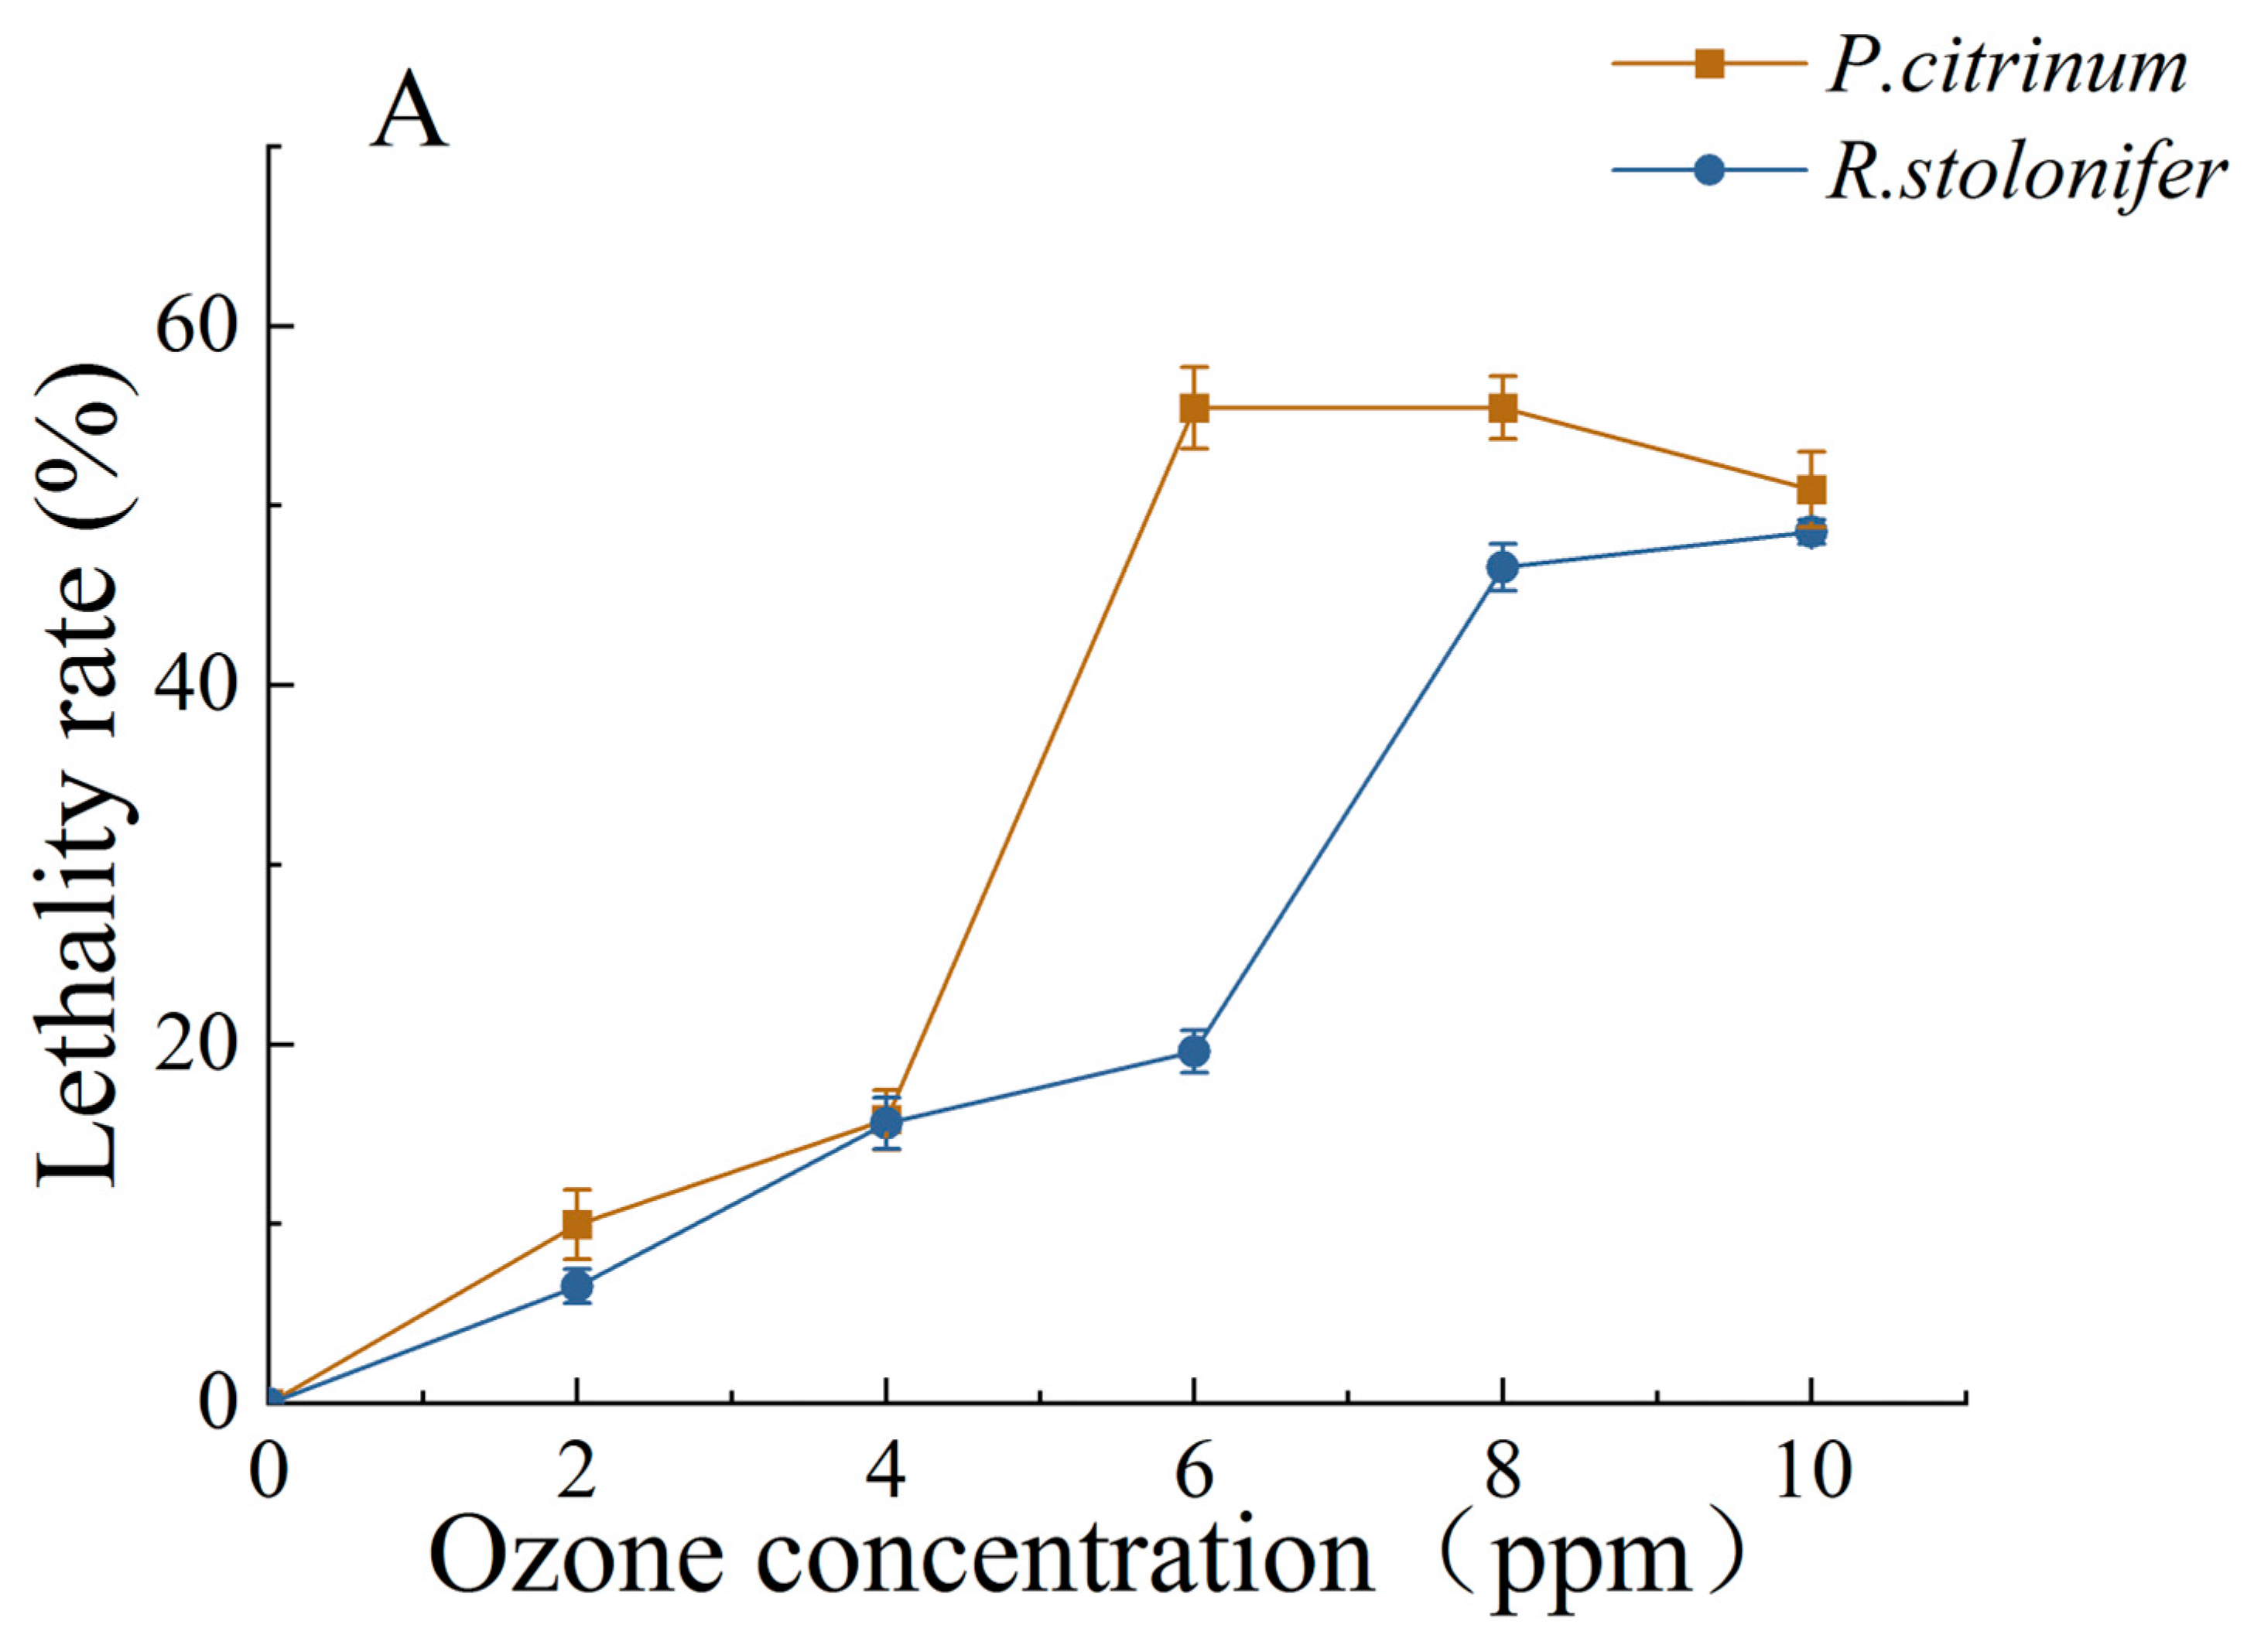
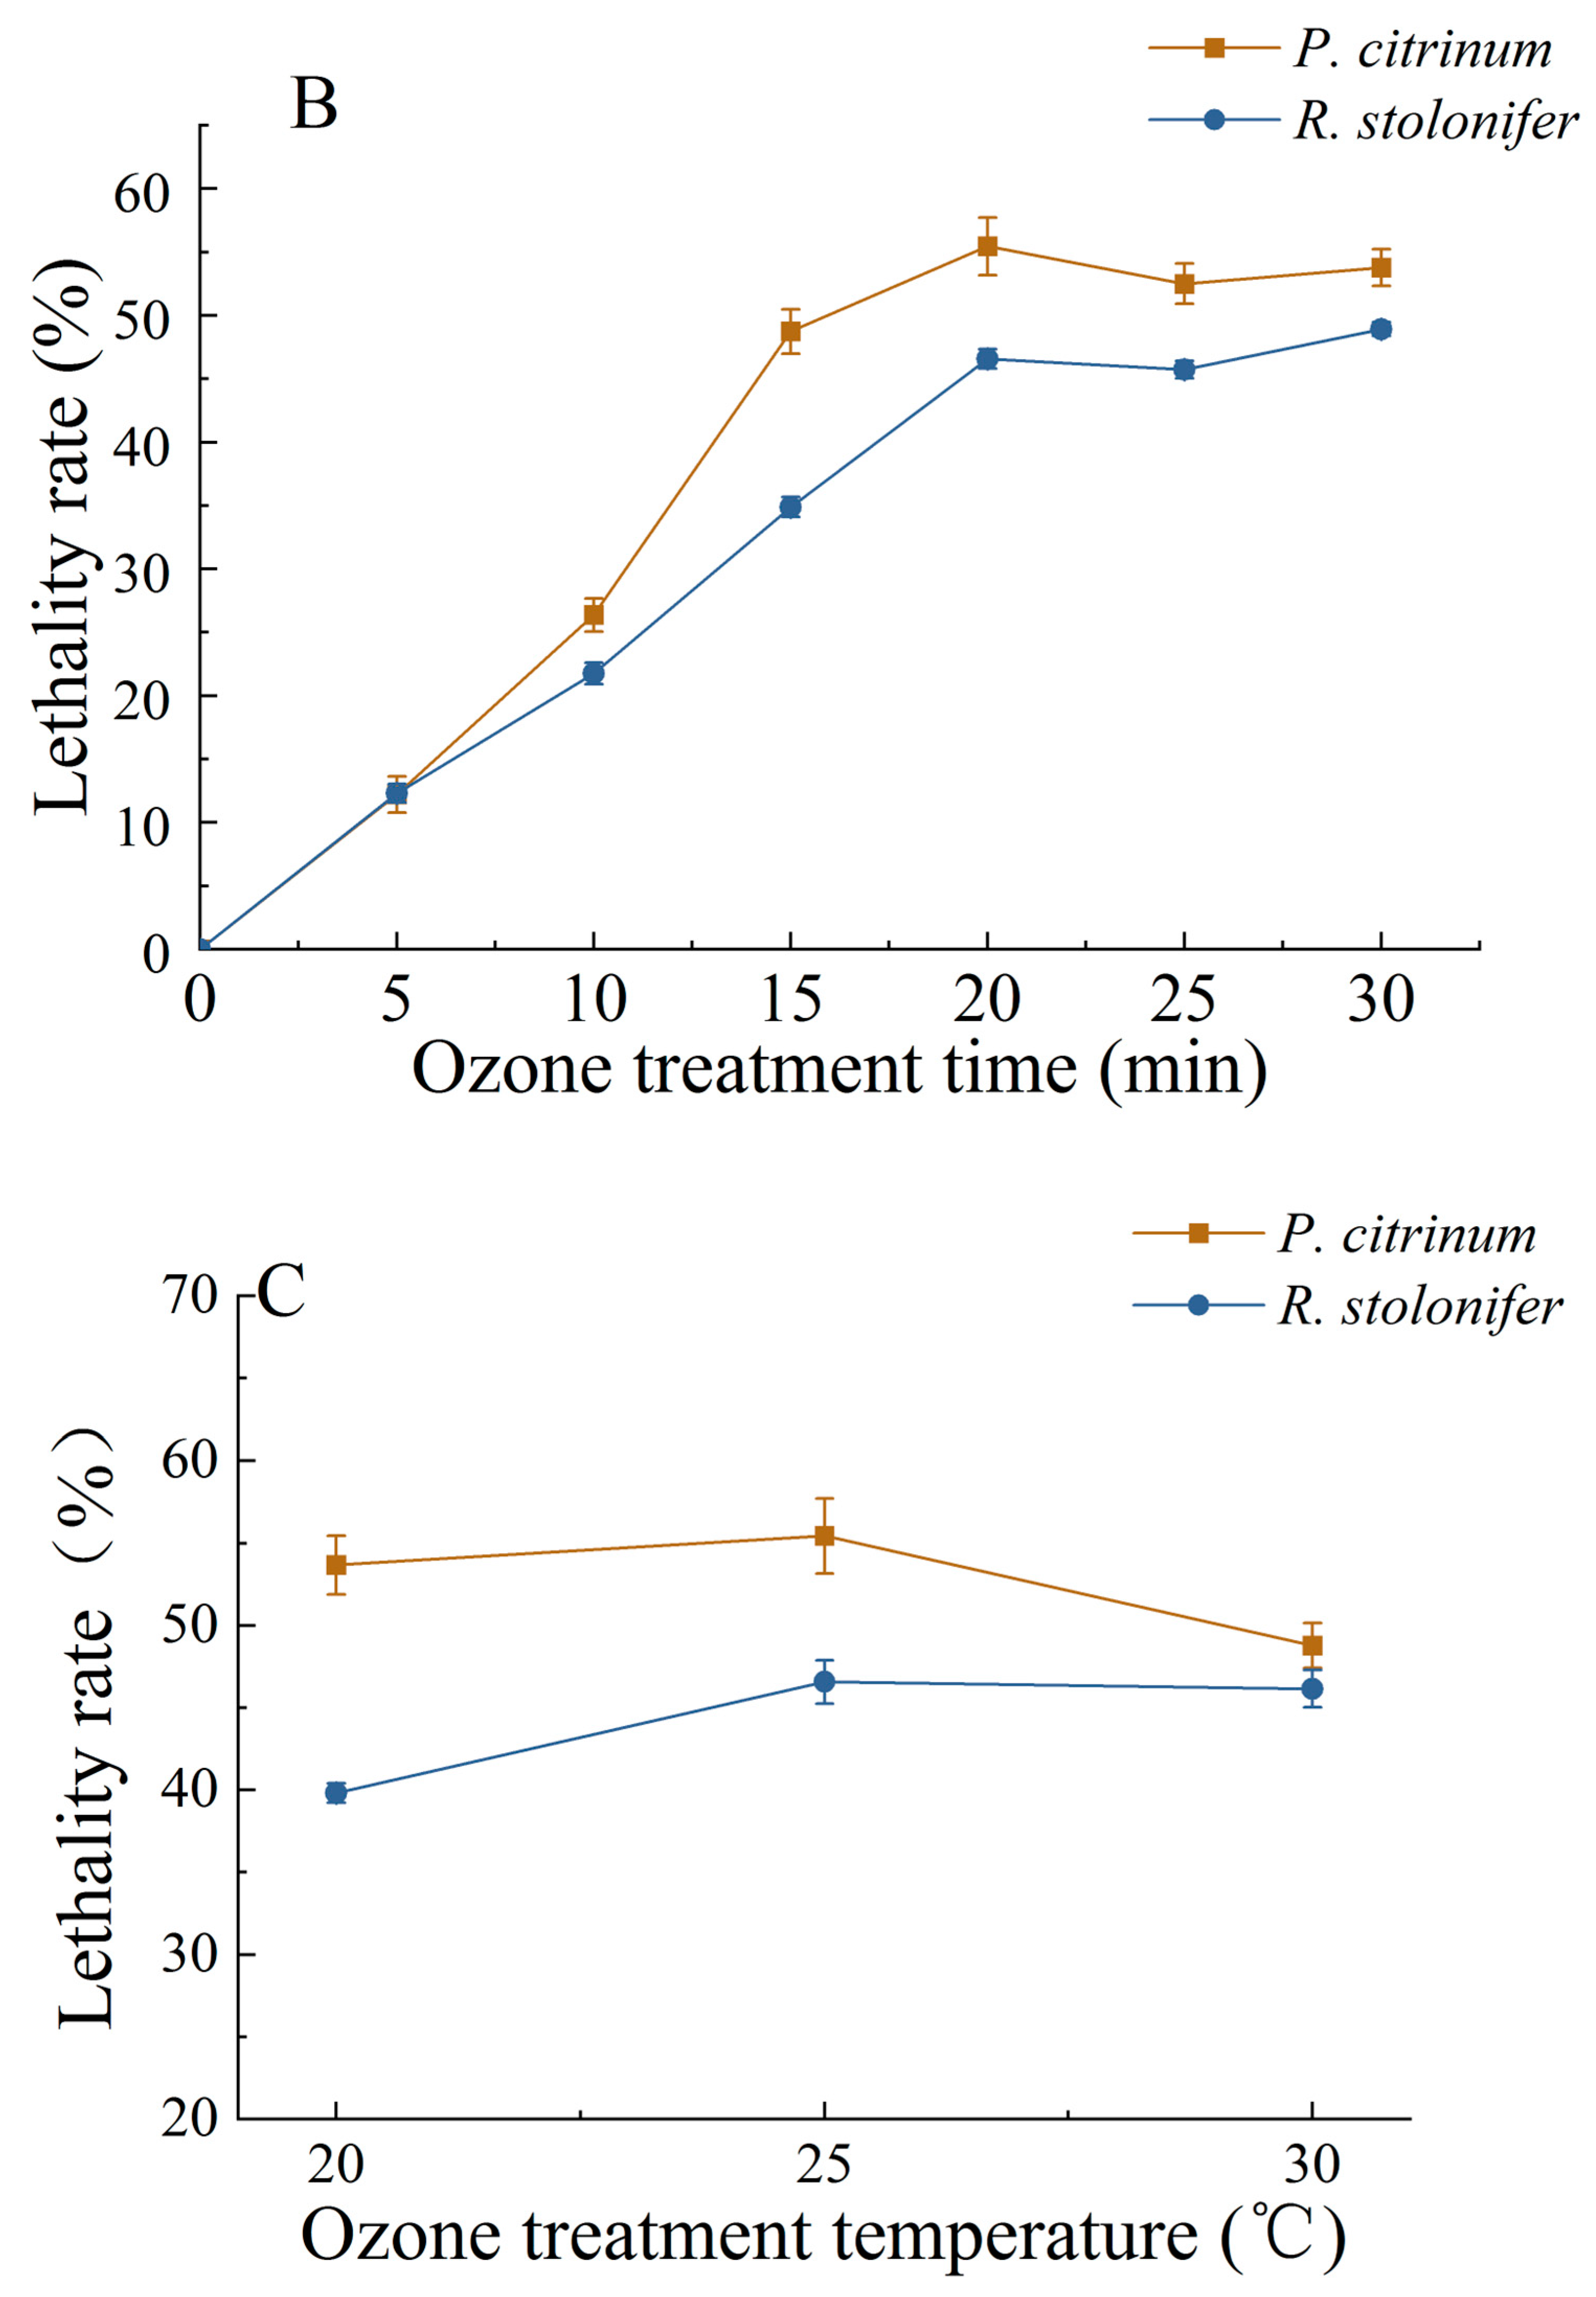
3.1.2. Changes in MGIR and LR

Ozone was found to have a significant inhibitory effect on the mycelial growth of both P. citrinum and R. stolonifer (Figure 3). In Figure 3A,B, it is evident that, at low ozone concentration or treatment time, the inhibitory effects on the same mold were different. In addition, the inhibitory effects of the same ozone concentration or time on P. citrinum were always higher than those on the R. stolonifer. As shown in Figure 3A, when the concentration was 6 ppm, the MGIR of P. citrinum reached 46.04% while that of the R. stolonifer reached only 18.14%. Nevertheless, when the concentration was 10 ppm, the inhibition rate of R. stolonifer reached 35.32%. As shown in Figure 3B, when the treatment time was 5 min, the MGIR of P. citrinum and R. stolonifer were 34.04% and 9.43%, respectively. The MGIR of P. citrinum reached its maximum value of 46.01% at 20 min, while that of R. stolonifer reached its maximum of 31.10% at 25 min. The MGIR of both fungi did not, however, change significantly with the increase in treatment time after 25 min. As can be seen in Figure 3C, the inhibition rate of P. citrinum and R. stolonifer did not change significantly as the temperature changed. At 20 °C, the MGIR of P. citrinum reached its maximum at 46.32%; however, the inhibition rate of R. stolonifer reached its maximum of 31.56% at 30 °C. These results, therefore, indicate that ozone treatment can significantly inhibit the growth of P. citrinum and R. stolonifer.
In order to understand the effect of ozone treatment on fungal morphology more intuitively, both P. citrinum and R. stolonifer were subjected to a 6 ppm exposure for 15 min. The spore stalks in the control group of P. citrinum were larger and more numerous than those of the treatment group (Figure 4b). Moreover, the conidiophore stem surface of the control group of R. stolonifer (Figure 4c) was smoother than those of the treatment groups (Figure 4d). These results showed that ozone treatment can effectively destroy the morphology of P. citrinum and R. stolonifer, reducing their size and, ultimately, killing the fungi.
The LR is one of the most direct indicators of the effect of ozone on mold. Here, LR was determined by measuring the total colonies. As shown in Figure 5A,B, the LR of the two molds continued to increase directly after ozone treatment; however, at 6 ppm exposure, the LR of P. citrinum was 55.45% and tending towards stability, while at 8 ppm exposure, the LR of R. stolonifer was 46.57% and also becoming stable. Before reaching stability, the LR of each mold was significantly different, possibly indicating that P. citrinum and R. stolonifer are tolerant of high concentrations of ozone. Furthermore, as the ozone treatment time extended, the LR of each mold continued to increase significantly up until 20 min of treatment. The LR of P. citrinum reached its highest peak of 55.45% at 20 min, while R. stolonifer reached its highest peak of 48.93% at 30 min. The effects of ozone treatment temperature on the two molds are shown in Figure 5C. The LR of P. citrinum and R. stolonifer reached their maximum of 55.45% and 46.57%, respectively, at 25 °C, and thereafter decreased as the treatment temperature continued to rise. This phenomenon may have been due to the low stability of ozone, as it decomposes into oxygen more rapidly at elevated temperatures, thereby reducing the bactericidal effectiveness.

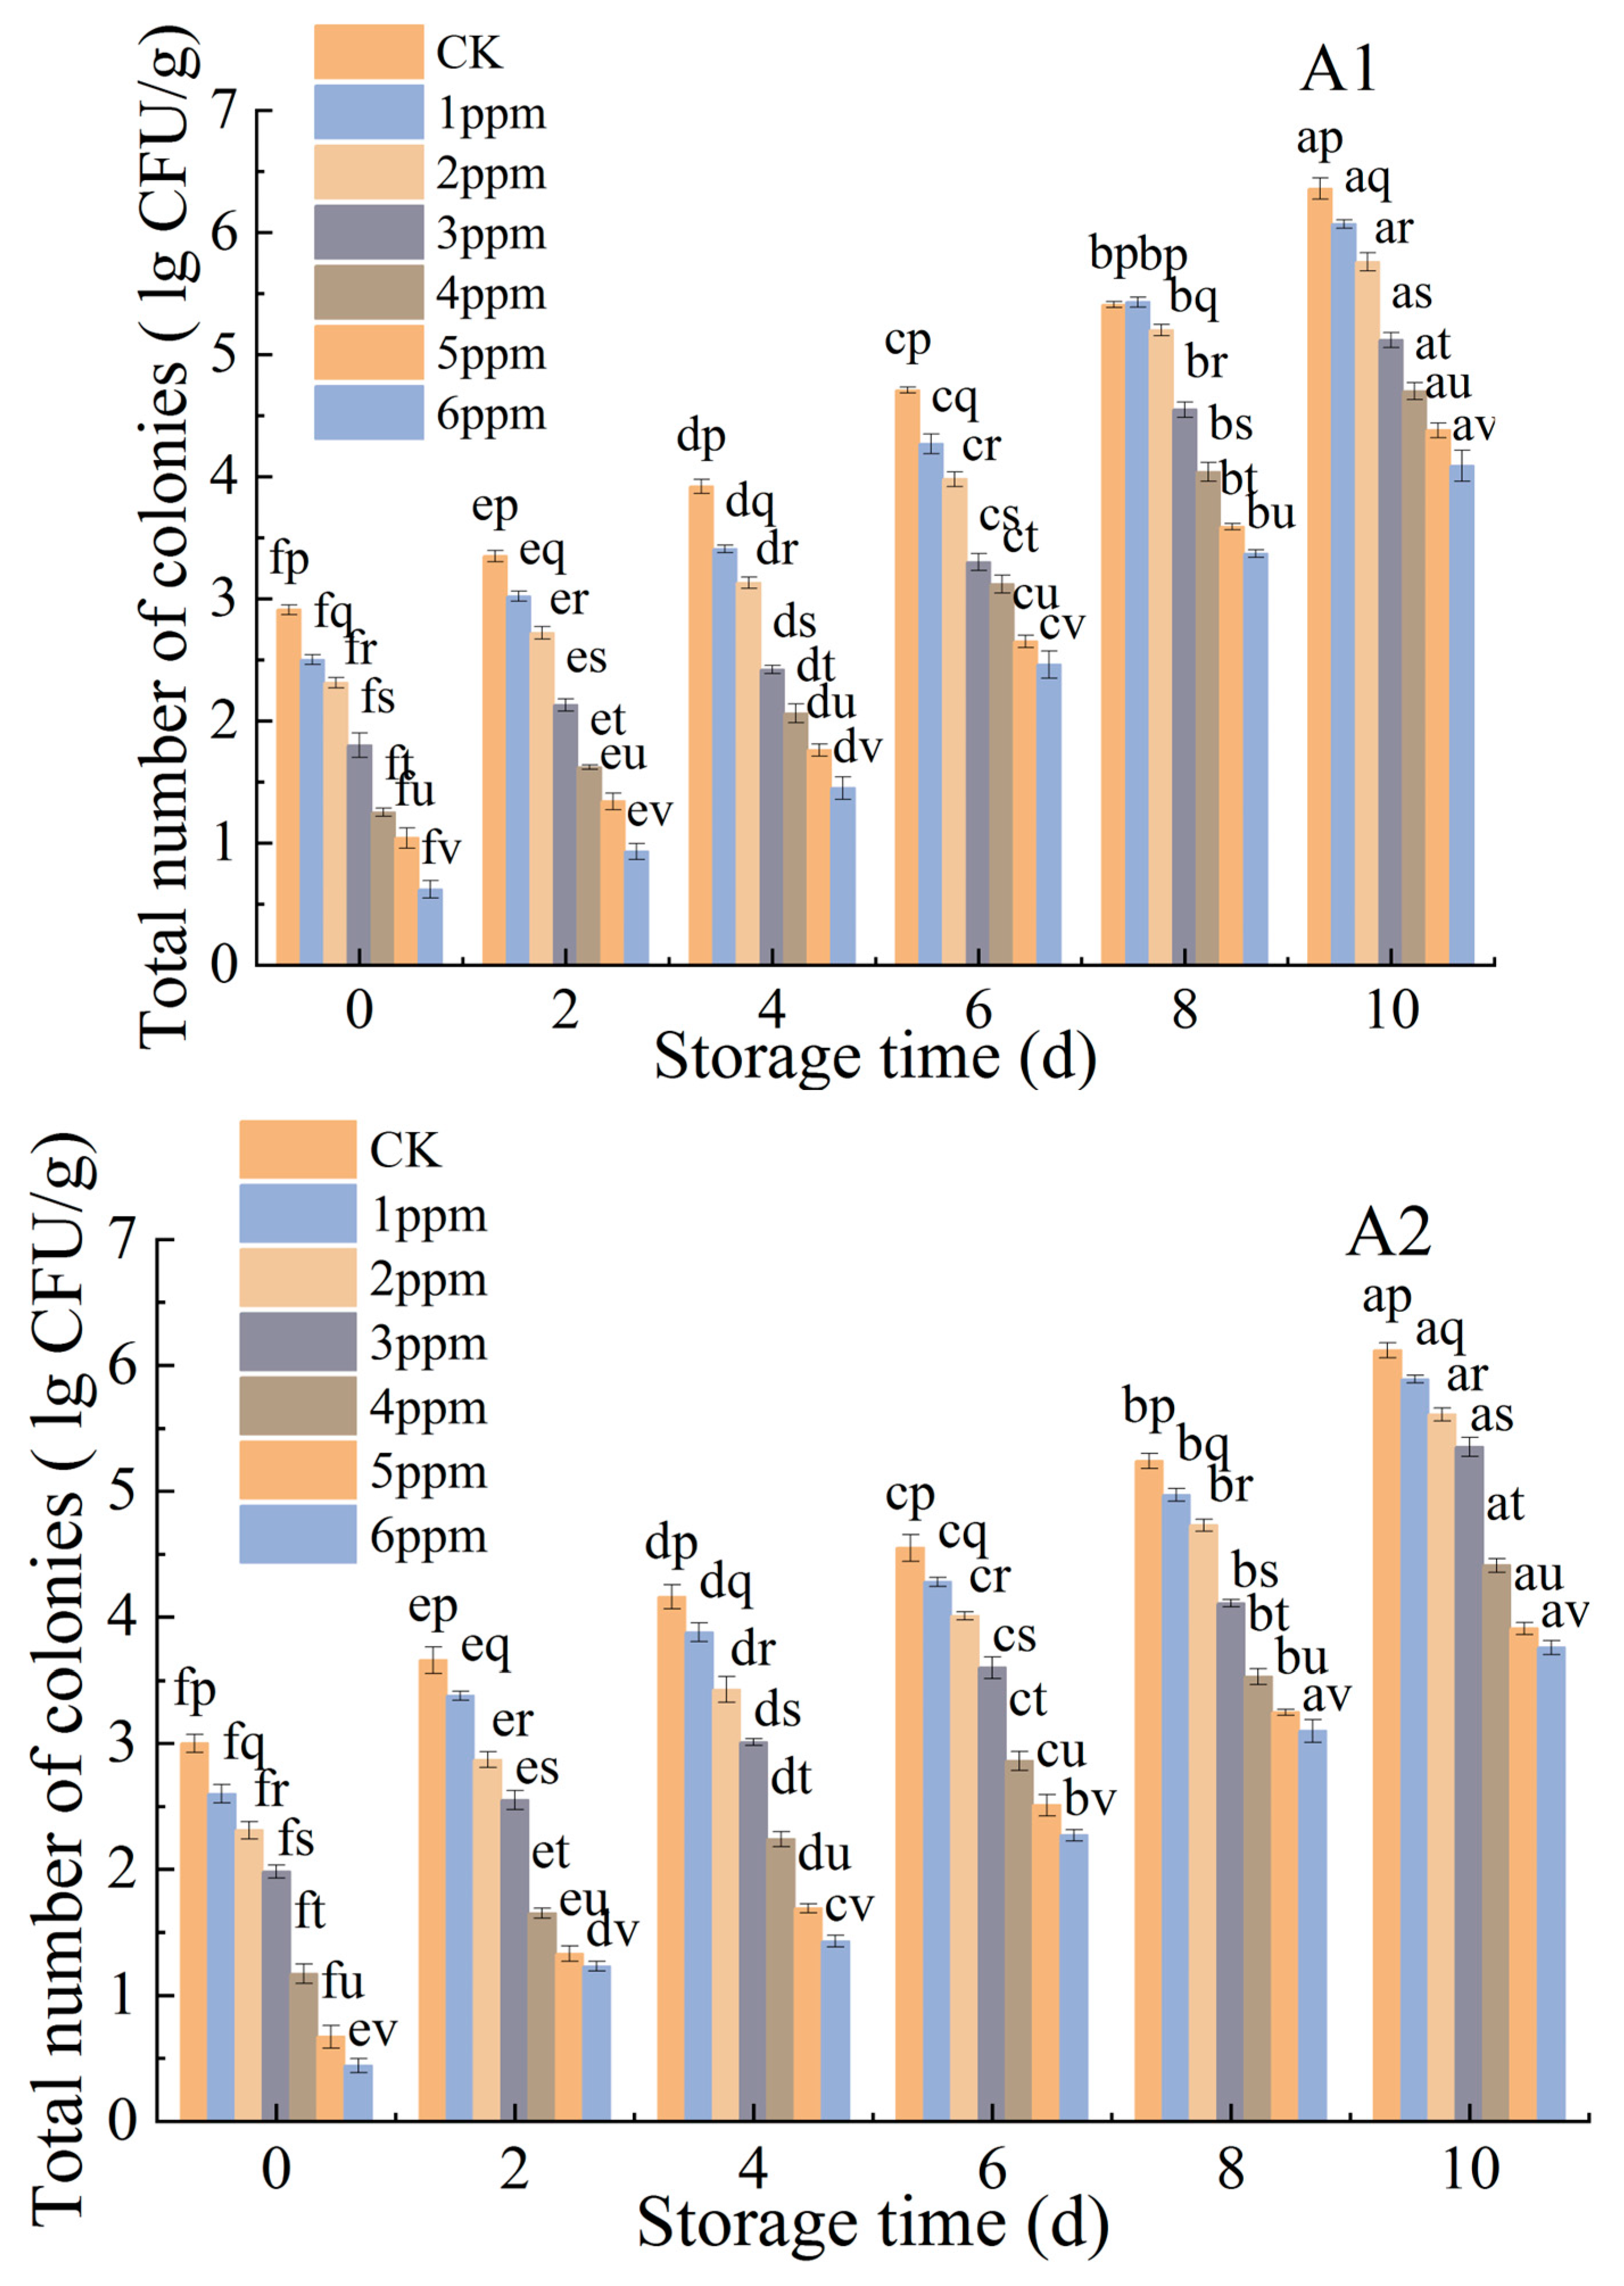
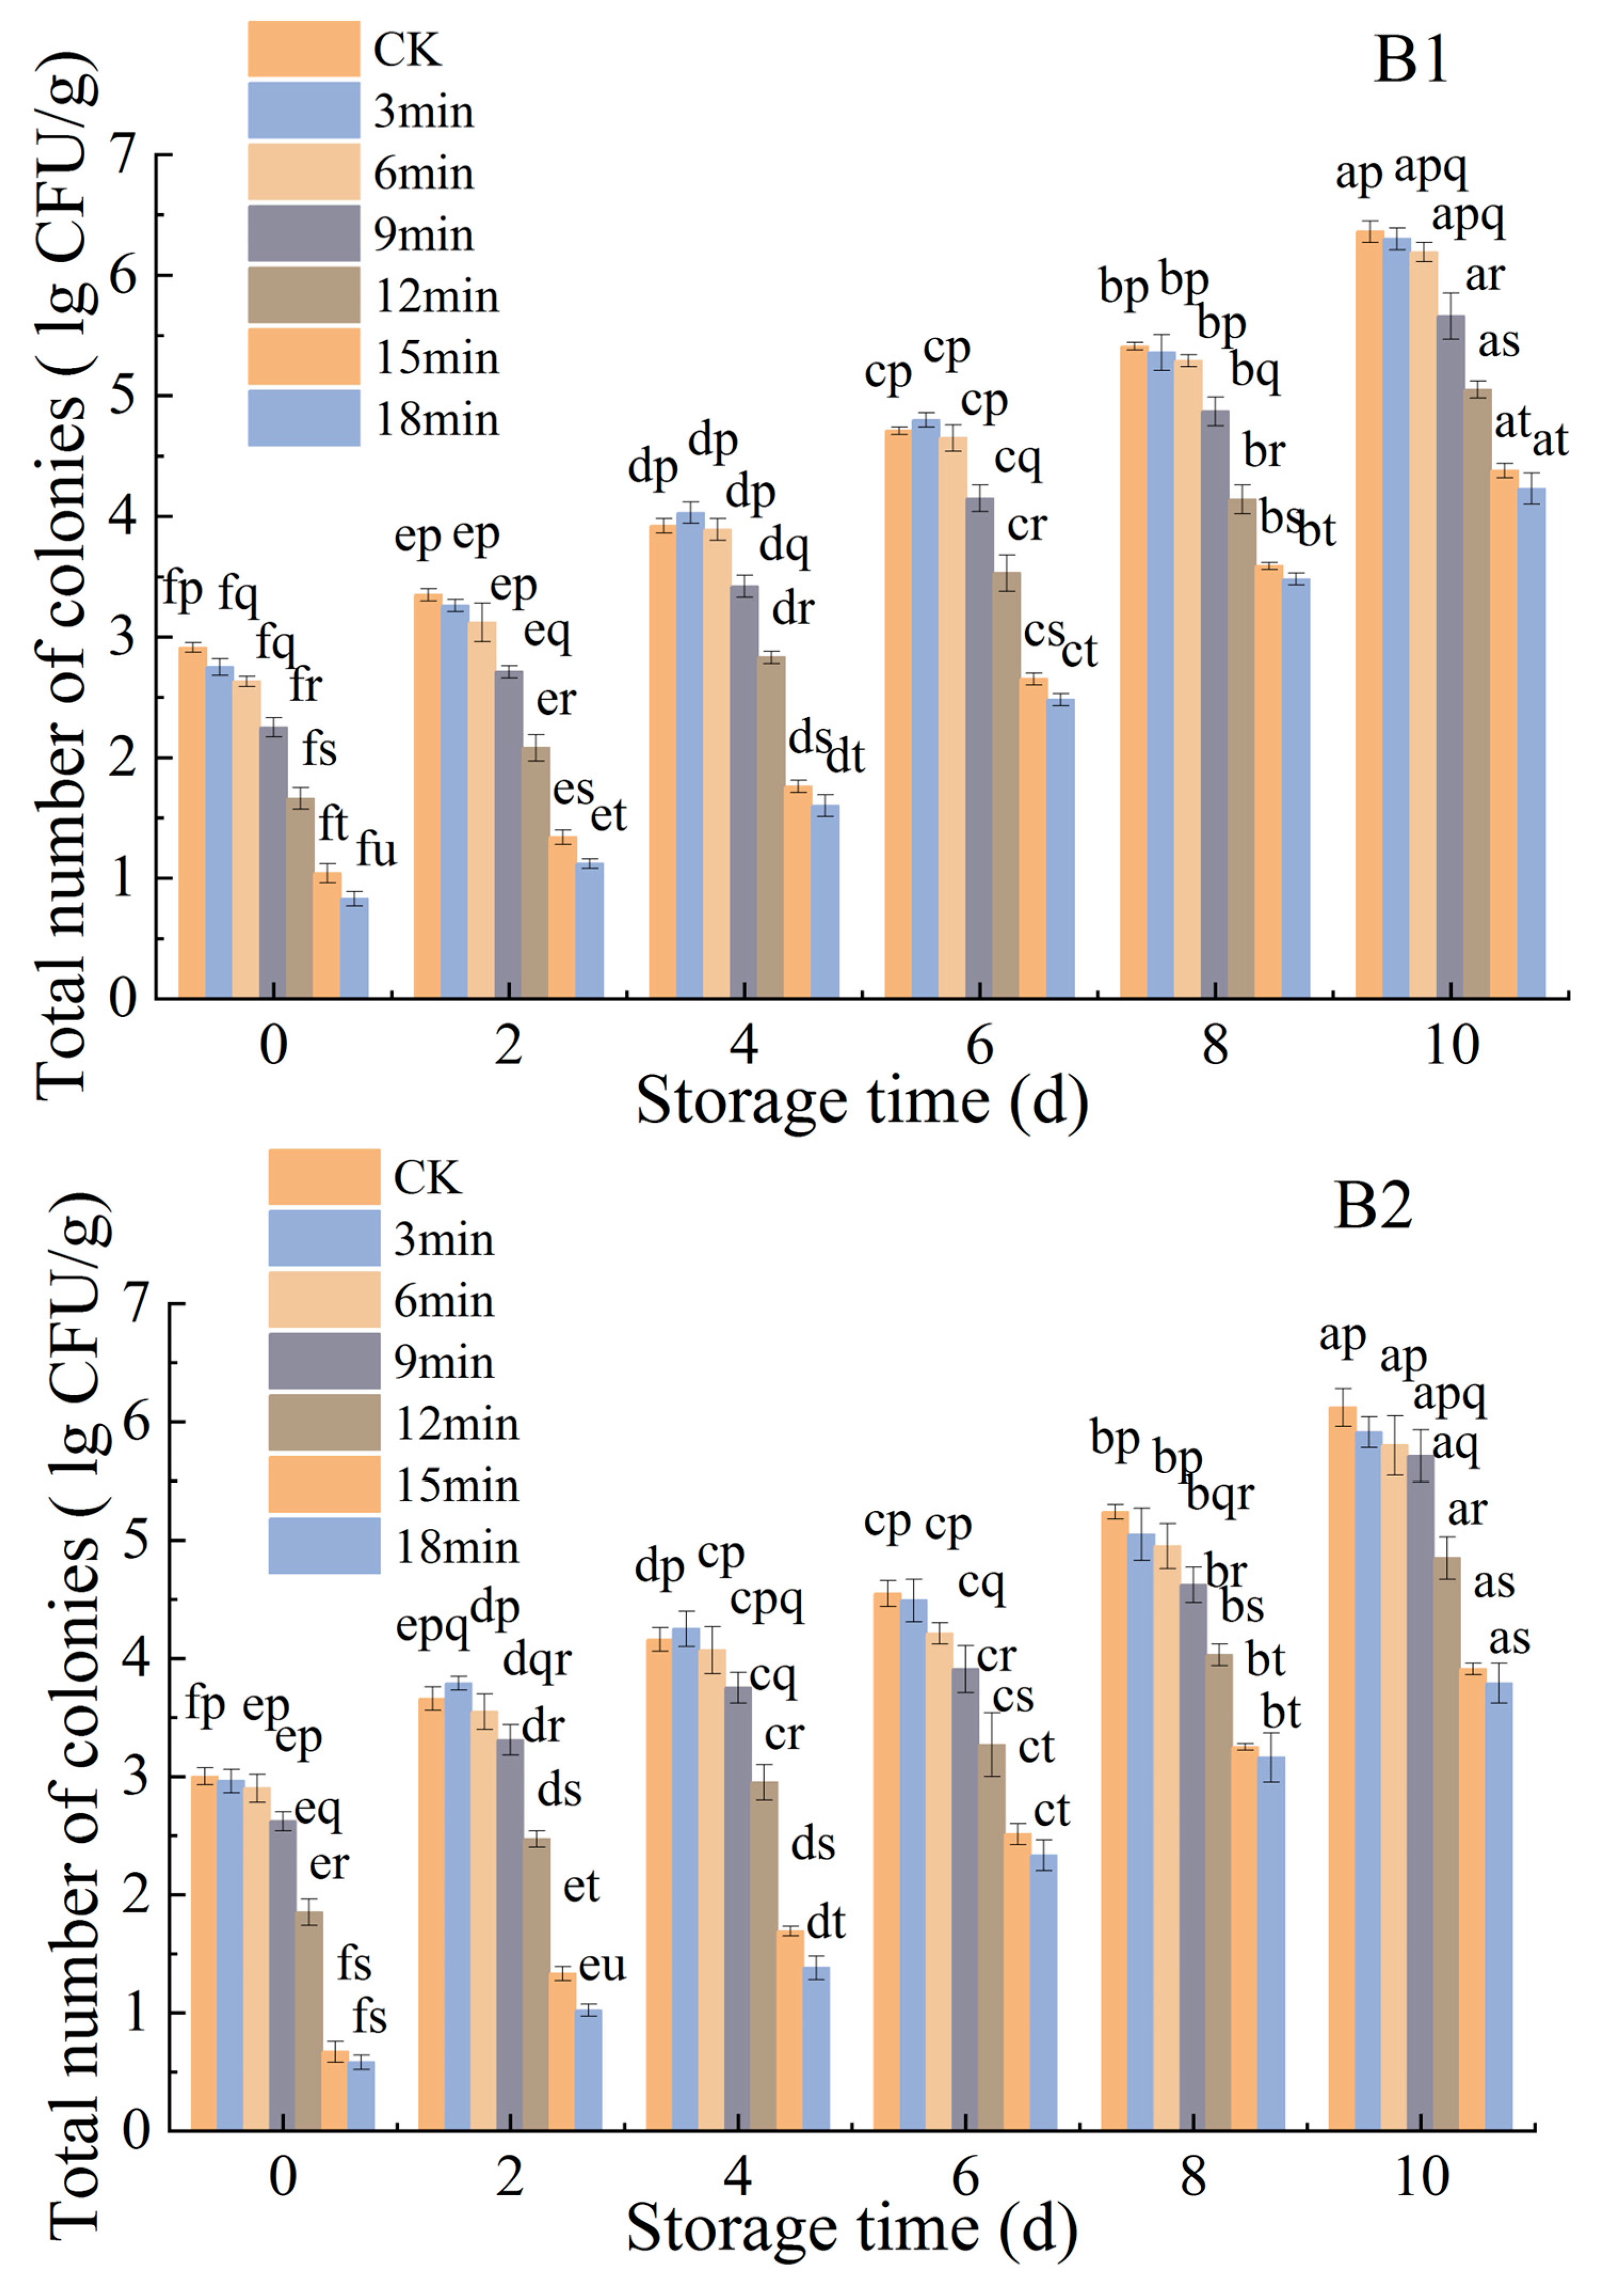
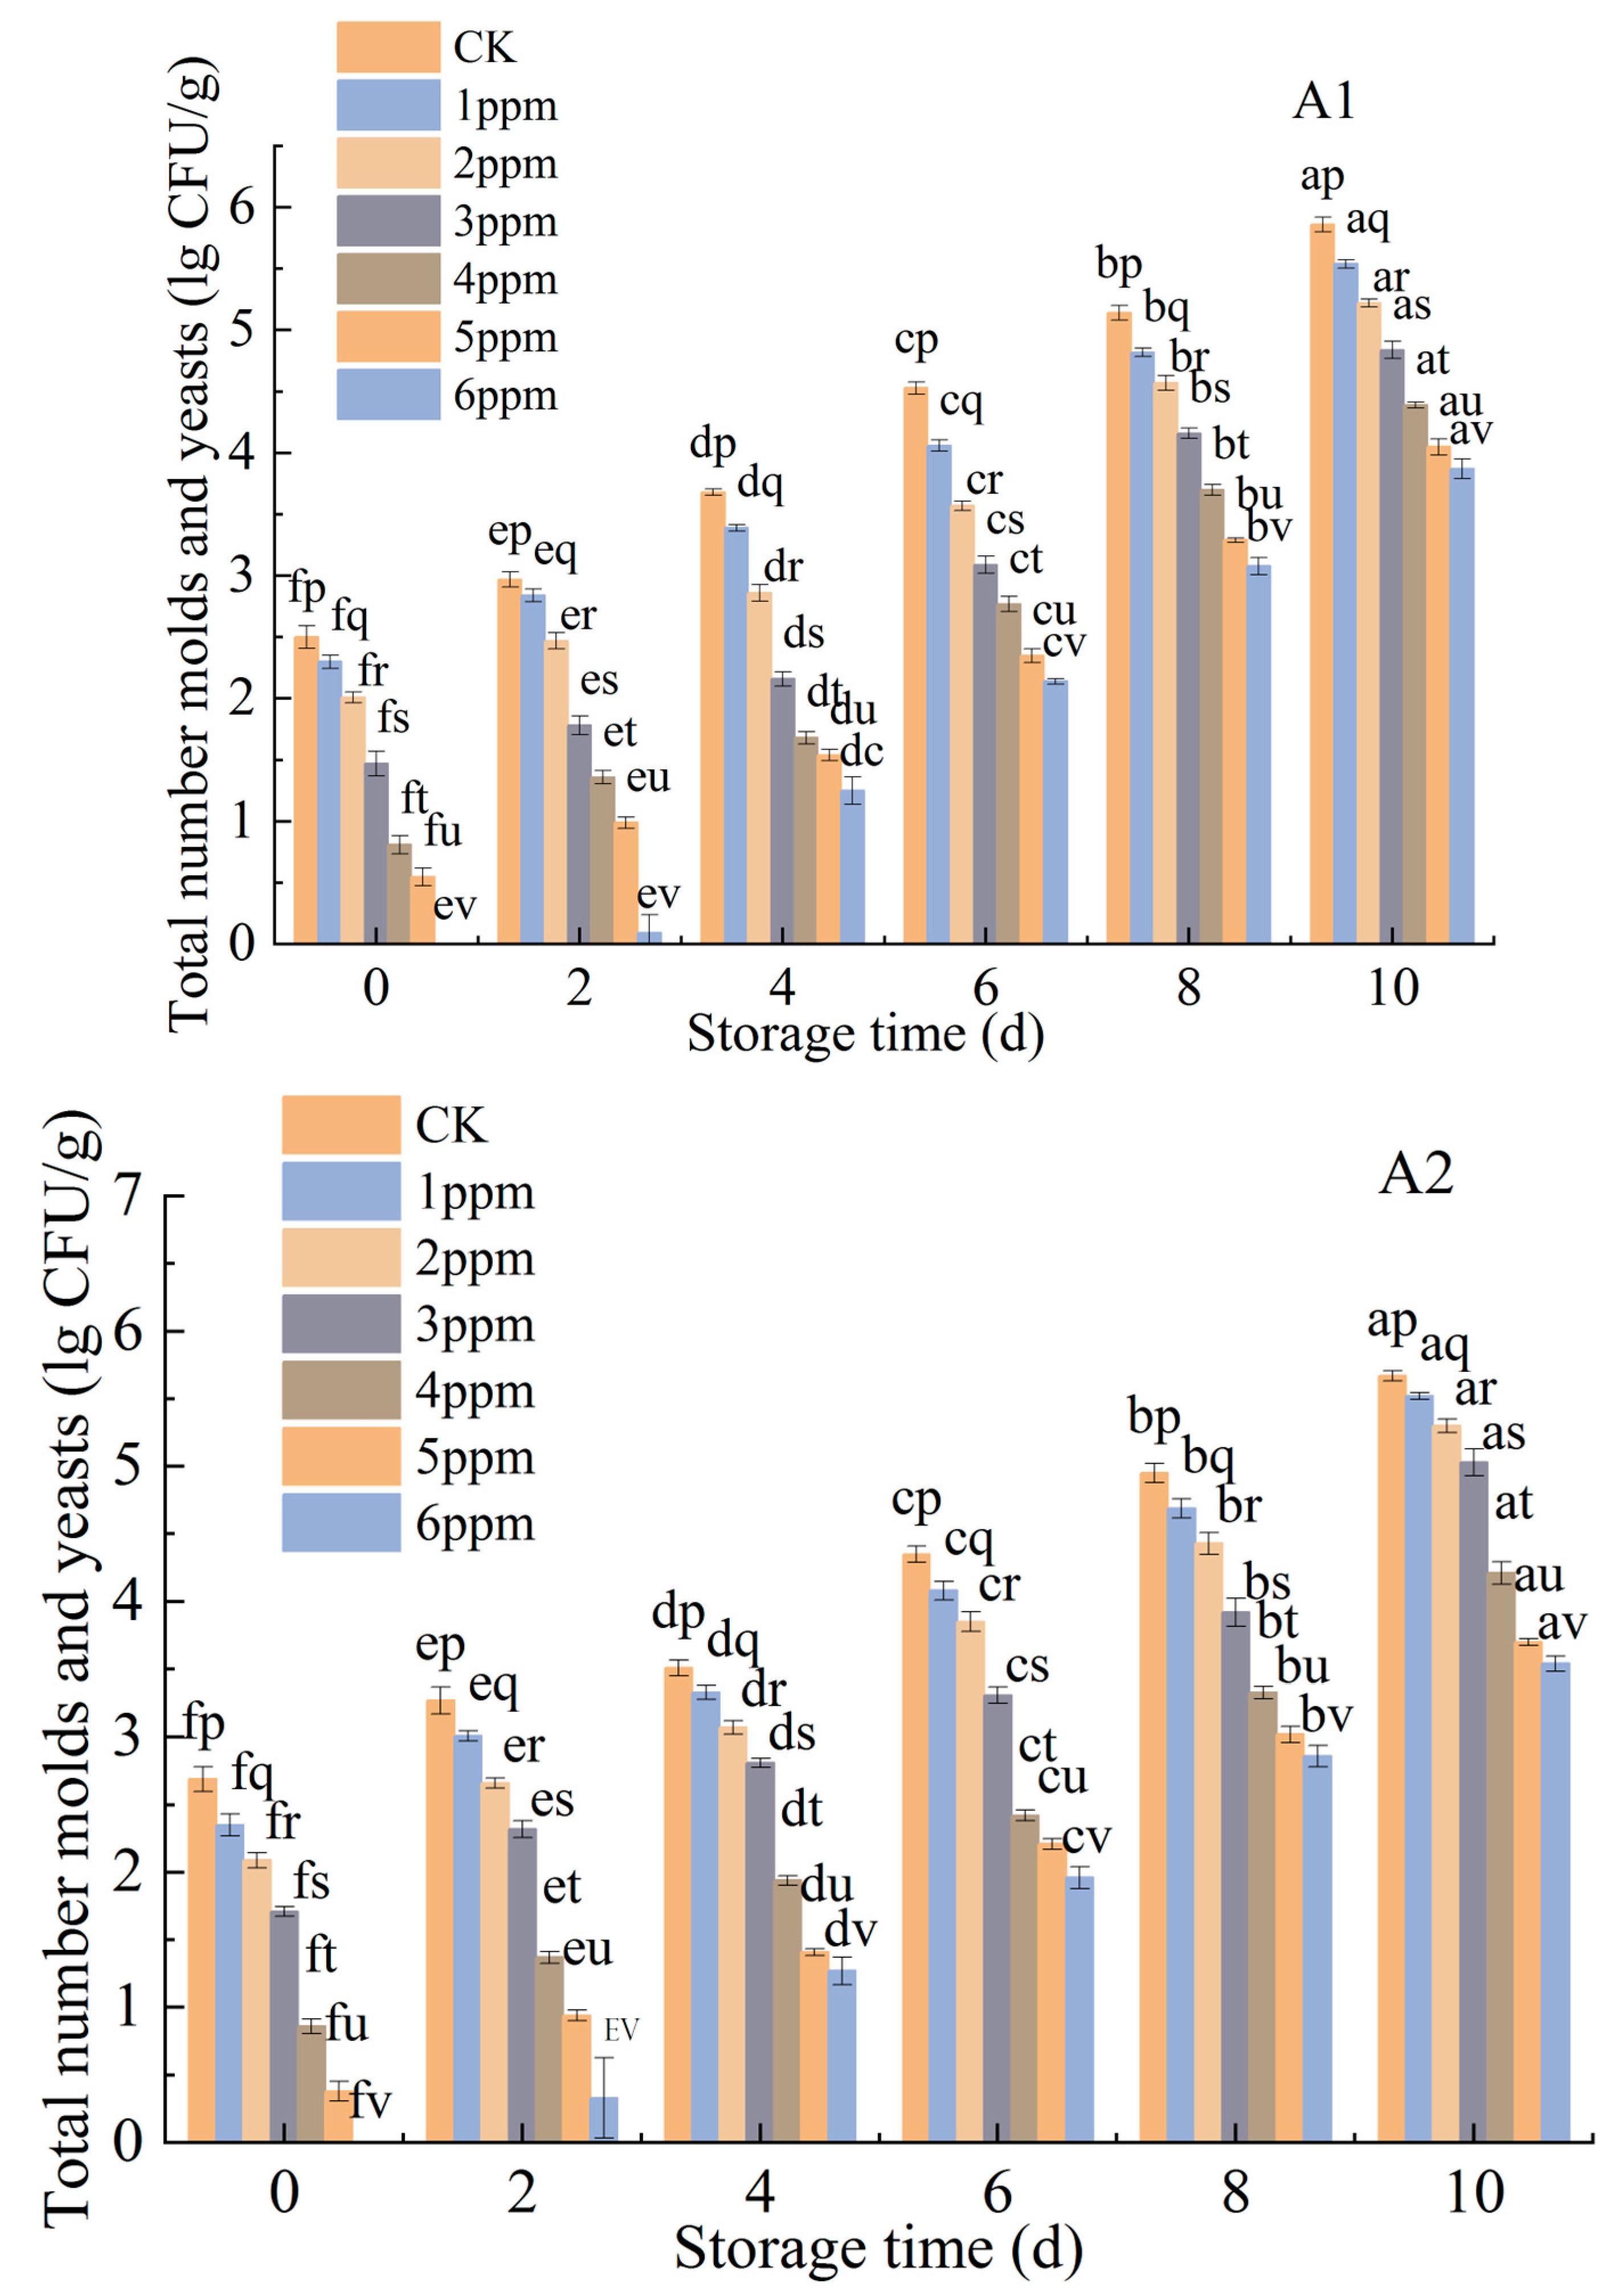
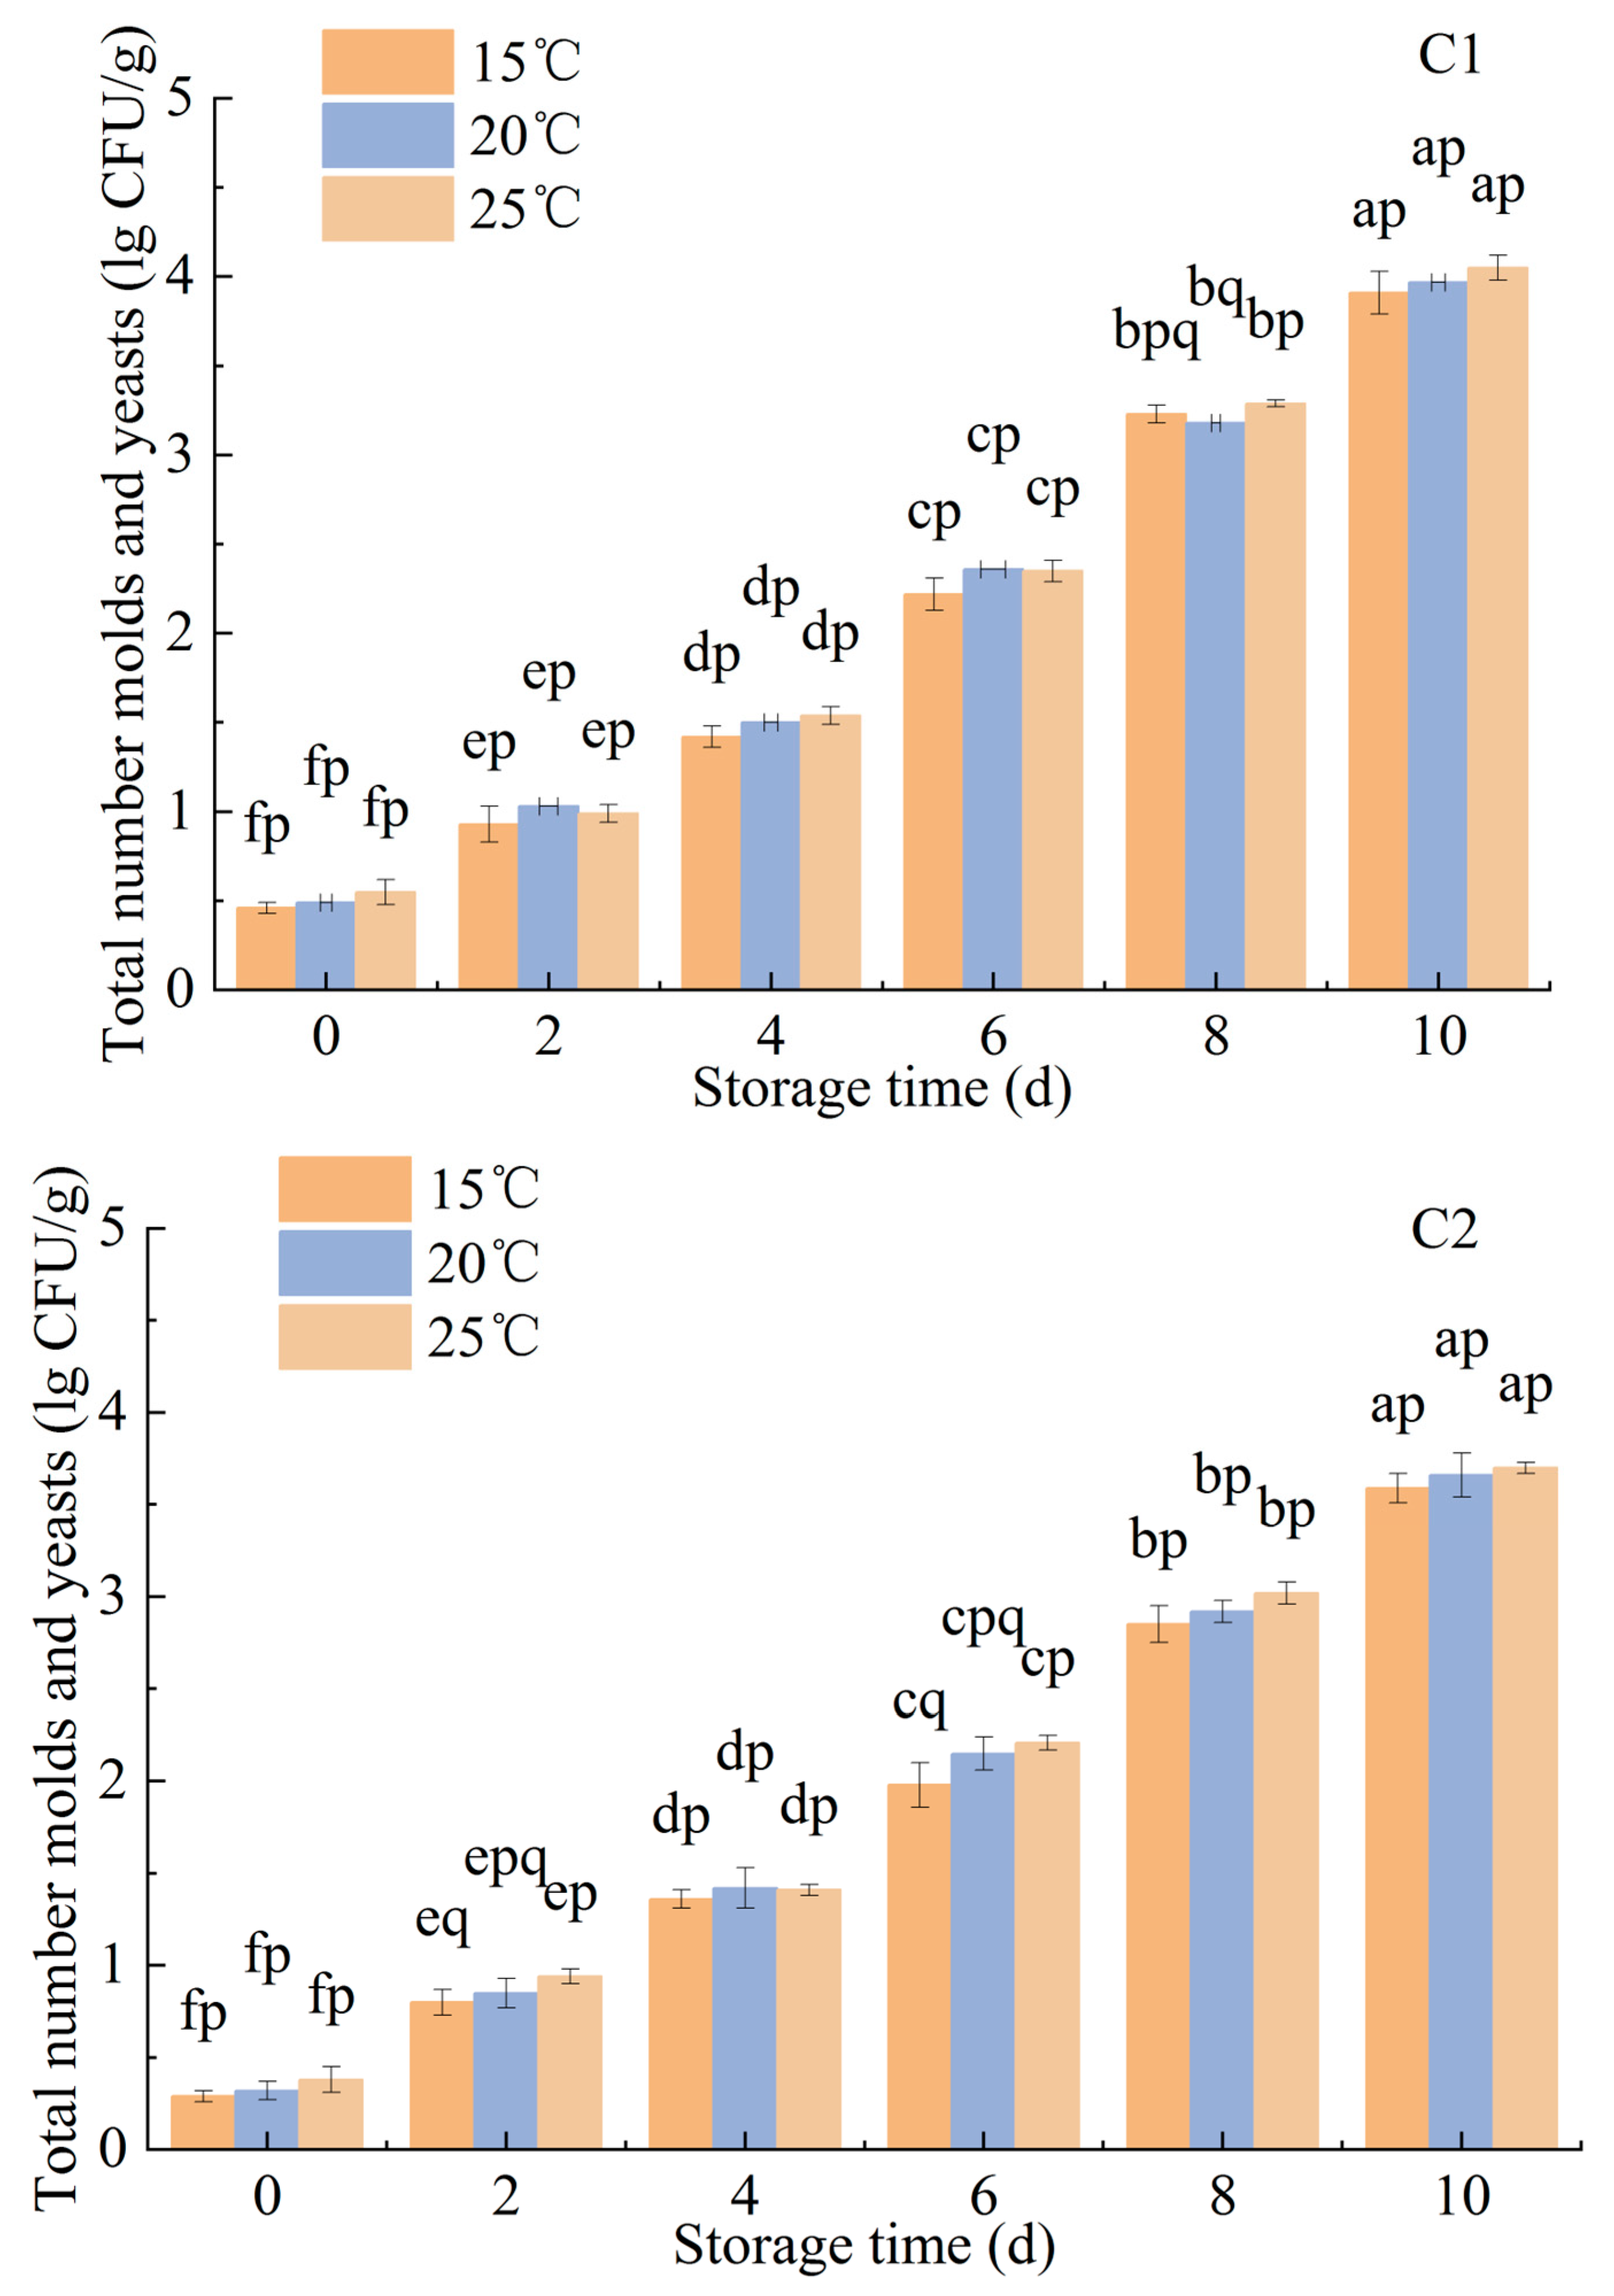
3.1.3. Effects of Ozone Treatment on the Microbiological Counts of P. citrinum and R. stolonifer

As can be seen in Figure 6, the TPC and YAM counts in the fresh-peeled garlic inoculated with P. citrinum and R. stolonifer increased during their entire storage period, even though ozone is widely accepted to be an antimicrobial agent. During the storage process, the TPC in the treatment groups was significantly lower than that in the blank group (p < 0.05). In the P. citrinum (Figure 6(A1)), TPC dropped sharply when the ozone concentration increased from 2 ppm to 3 ppm and, in the fresh-peeled garlic treated at 1 ppm exposure, the TPC was not significantly different compared to that of the blank group by the 8th day of storage. Considering the observed variations, the most effective ozone treatment concentration for fresh-peeled garlic inoculated with P. citrinum was considered to be 6 ppm. TPC in the R. stolonifera (Figure 6(A2)) was found to drop sharply during storage when the ozone concentration increased from 3 ppm to 4 ppm. However, on the 2nd and 8th days, no significant difference was observed between these samples and the fresh-peeled garlic treated at 5 ppm and 6 ppm. The optimal concentration of ozone treatment for the fresh-peeled garlic inoculated by R. stolonifer was determined to be 5 ppm. Figure 6B shows variations in TPC at different times but in samples subjected to the same concentration of ozone treatment. In the P. citrinum, there was no significant difference between the treatment groups (3 min and 6 min) and the blank group. However, when the treatment time was extended to 15 min, the TPC was significantly lower than that at 6 min treatment (p < 0.05). Therefore, a 15-min treatment proved to be more effective in inhibiting P. citrinum. In R. stolonifer, when the treatment time was increased to 12 min, the TPC was significantly lower. After six days, there was no significant difference between the treatment groups at 15 min and 18 min. After 10 days of storage the TPC of the 15 min treatment group was 3.91 lg CFU/g, which was much less than that of the blank group, at 6.12 lg CFU/g. As shown in Figure 6(C1,C2), under the same storage time, there was no significant difference in the TPC on the surface of the garlic treated at 15 °C, 20 °C and 25 °C (p > 0.05).
As shown in Figure 7, the YAM trends were similar to those of the TCP. In the P. citrinum (Figure 7(A1)), the YAM in the 6 ppm ozone treatment group was 0.09 lg CFU/g after 2 days of storage, while the YAM in the blank group was much higher, at 2.97 lg CFU/g. Moreover, after 10 days of storage, the 6 ppm treatment group exhibited the lowest YAM count, indicating the best ozone treatment effect. In the R. stolonifer (Figure 7(A2)), when the ozone concentrate was increased from 3 ppm to 4 ppm, the YAM of the fresh-peeled garlic plummeted, consistently reaching its minimum during storage after 6 ppm ozone treatment. In addition, the YAM decreased continuously (Figure 7B) as the treatment time continued to increase. The YAM of the fresh-peeled garlic inoculated with P. citrinum (Figure 7(B1)) was, however, significantly different in the treatment and blank groups after 9 min. Overall, the optimal ozone treatment time was determined to be 15 min. In the R. stolonifer (Figure 7(B2)), when the ozone treatment time was increased from 15 min to 18 min, the counts of YAM were not significantly different (p > 0.05) at the same amount of storage time; however, they were significantly lower than the blank group. In conclusion, the most effective ozone treatment time was found to be 15 min for both the fungi in this study. Moreover, the change in the ozone treatment temperature did not affect the YAM counts in the fresh-peeled garlic samples (Figure 7C) and, therefore, similar to the TPC, 20 °C was selected as the optimal temperature condition for subsequent ozone sterilization experiments.

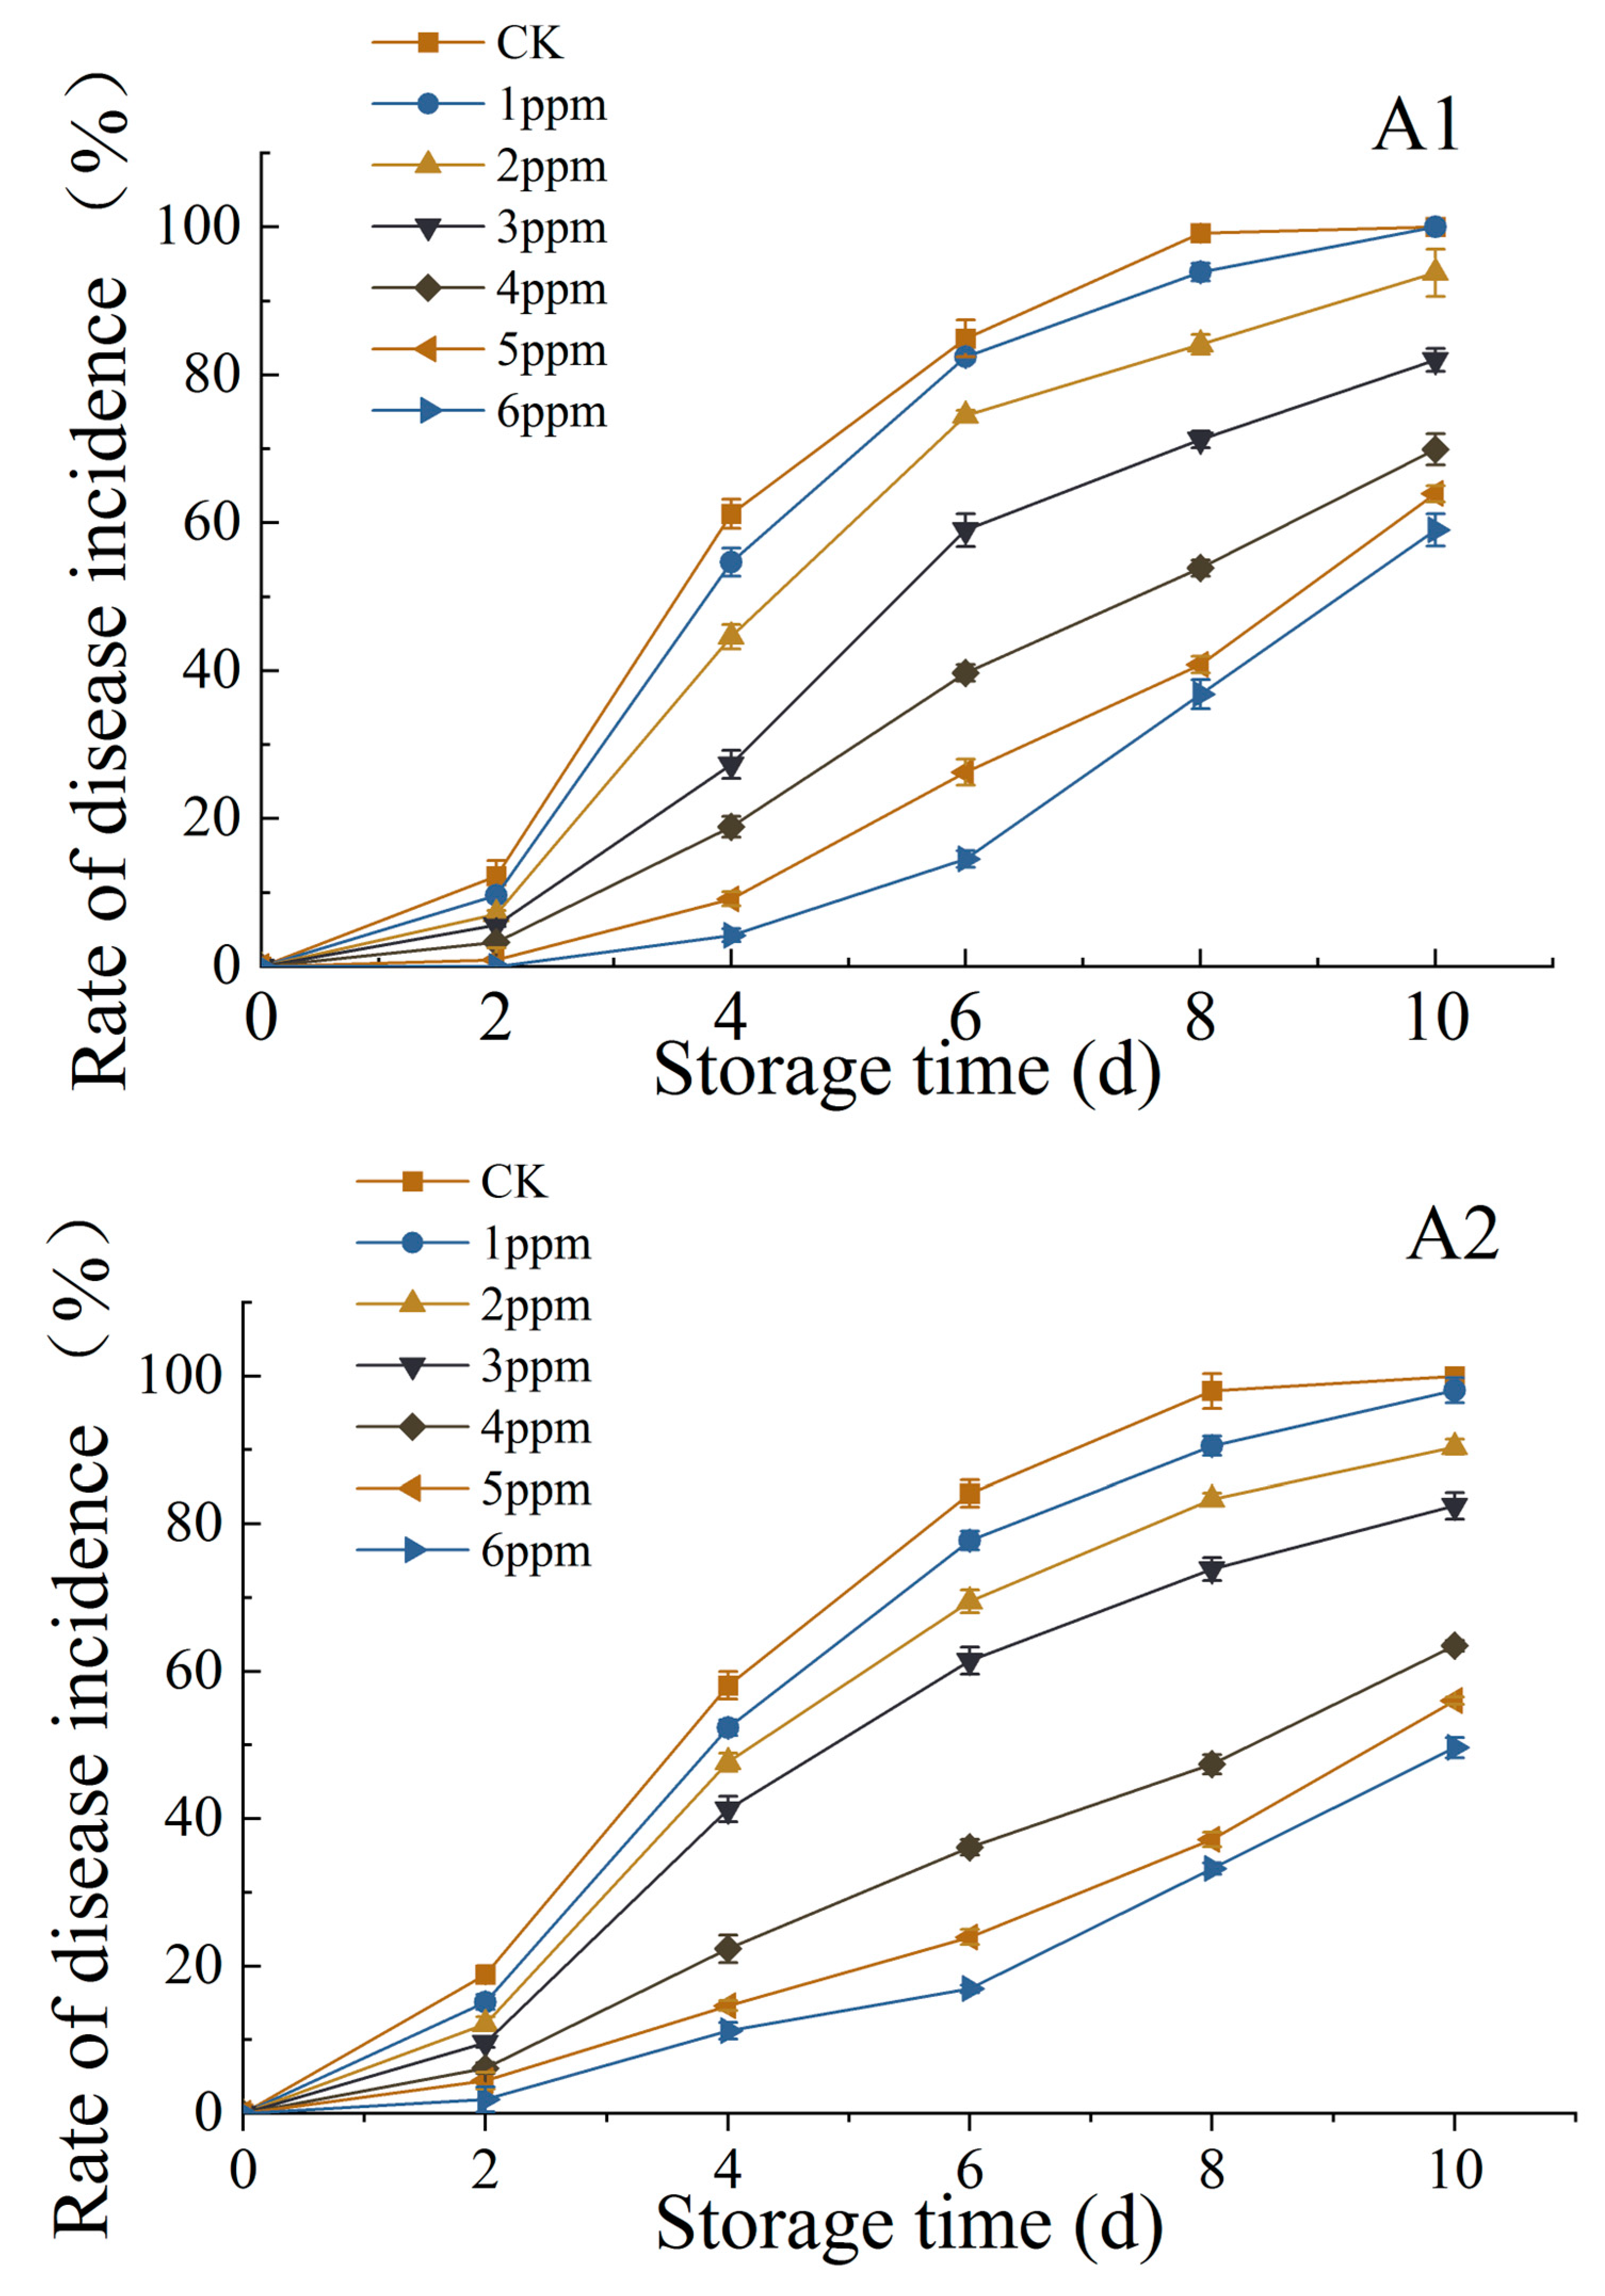
3.1.4. Effects of Ozone Treatment on DIR

Ozone treatment significantly inhibited the DIR in the fresh-peeled garlic. As shown in Figure 8, after four days of storage, in the garlic samples inoculated by P. citrinum, the DIR of the 6 ppm treatment group was only 4.25%, while that of the blank group was as high as 61.23%. By the 10th day, the DIR of the blank group and the 1 ppm treatment group had reached 100%. In the R. stolonifer, after exposures of 3 ppm and 4 ppm, the difference in DIR was the highest during each storage period. When increased to 6 ppm, the DIR was consistently the lowest throughout the storage period, and the antibacterial effect was, thus, the best. The changes during storage in the DIR in the fresh-peeled garlic inoculated with P. citrinum and R. stolonifer treated with ozone for different time are shown in Figure 8(B1,B2), respectively. After 10 days of storage, the DIR of the blank group had reached 100%, while the 15 min treatment groups had reached only 63.95% in the P. citrinum-inoculated samples and 56.03% in the R. stolonifer-inoculated samples. After 15 min ozone treatments, however, the changes in DIR were not significant, remaining at similarly low values. In Figure 8C, the coincidence degree of the curves in the graph indicates no difference in the DIR of the fresh-peeled garlic treated at the three different ozone treatment temperatures.

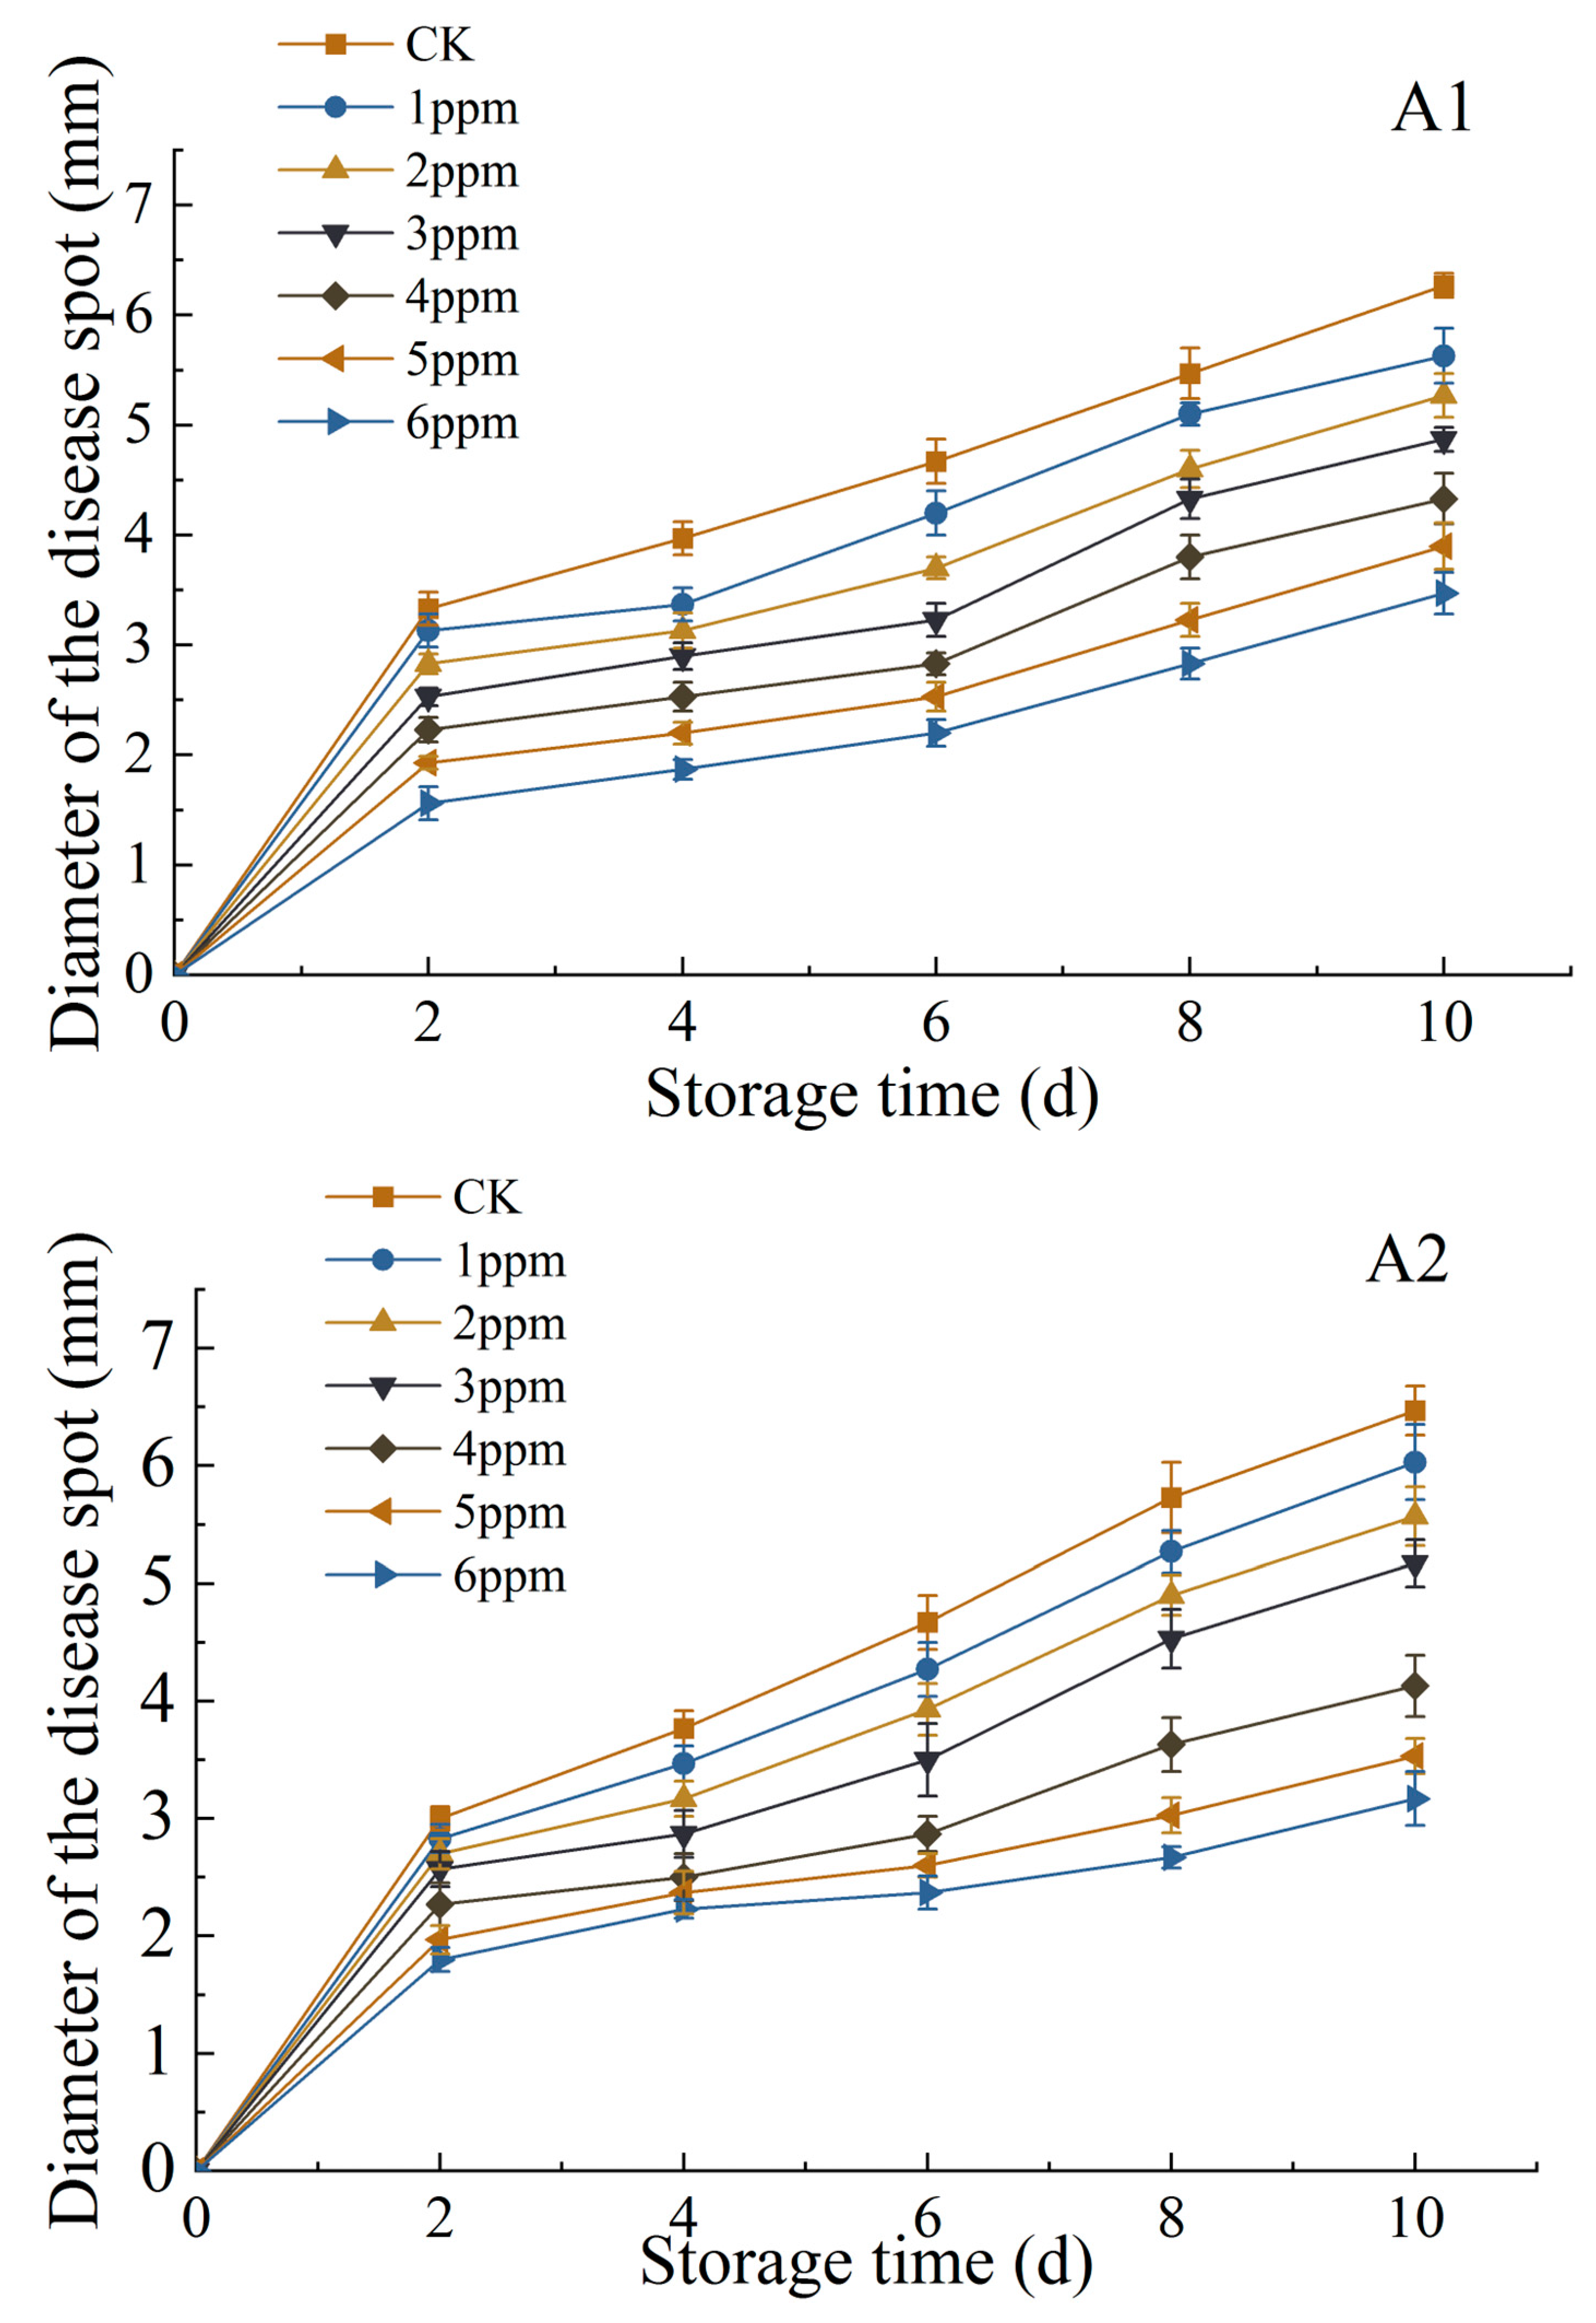
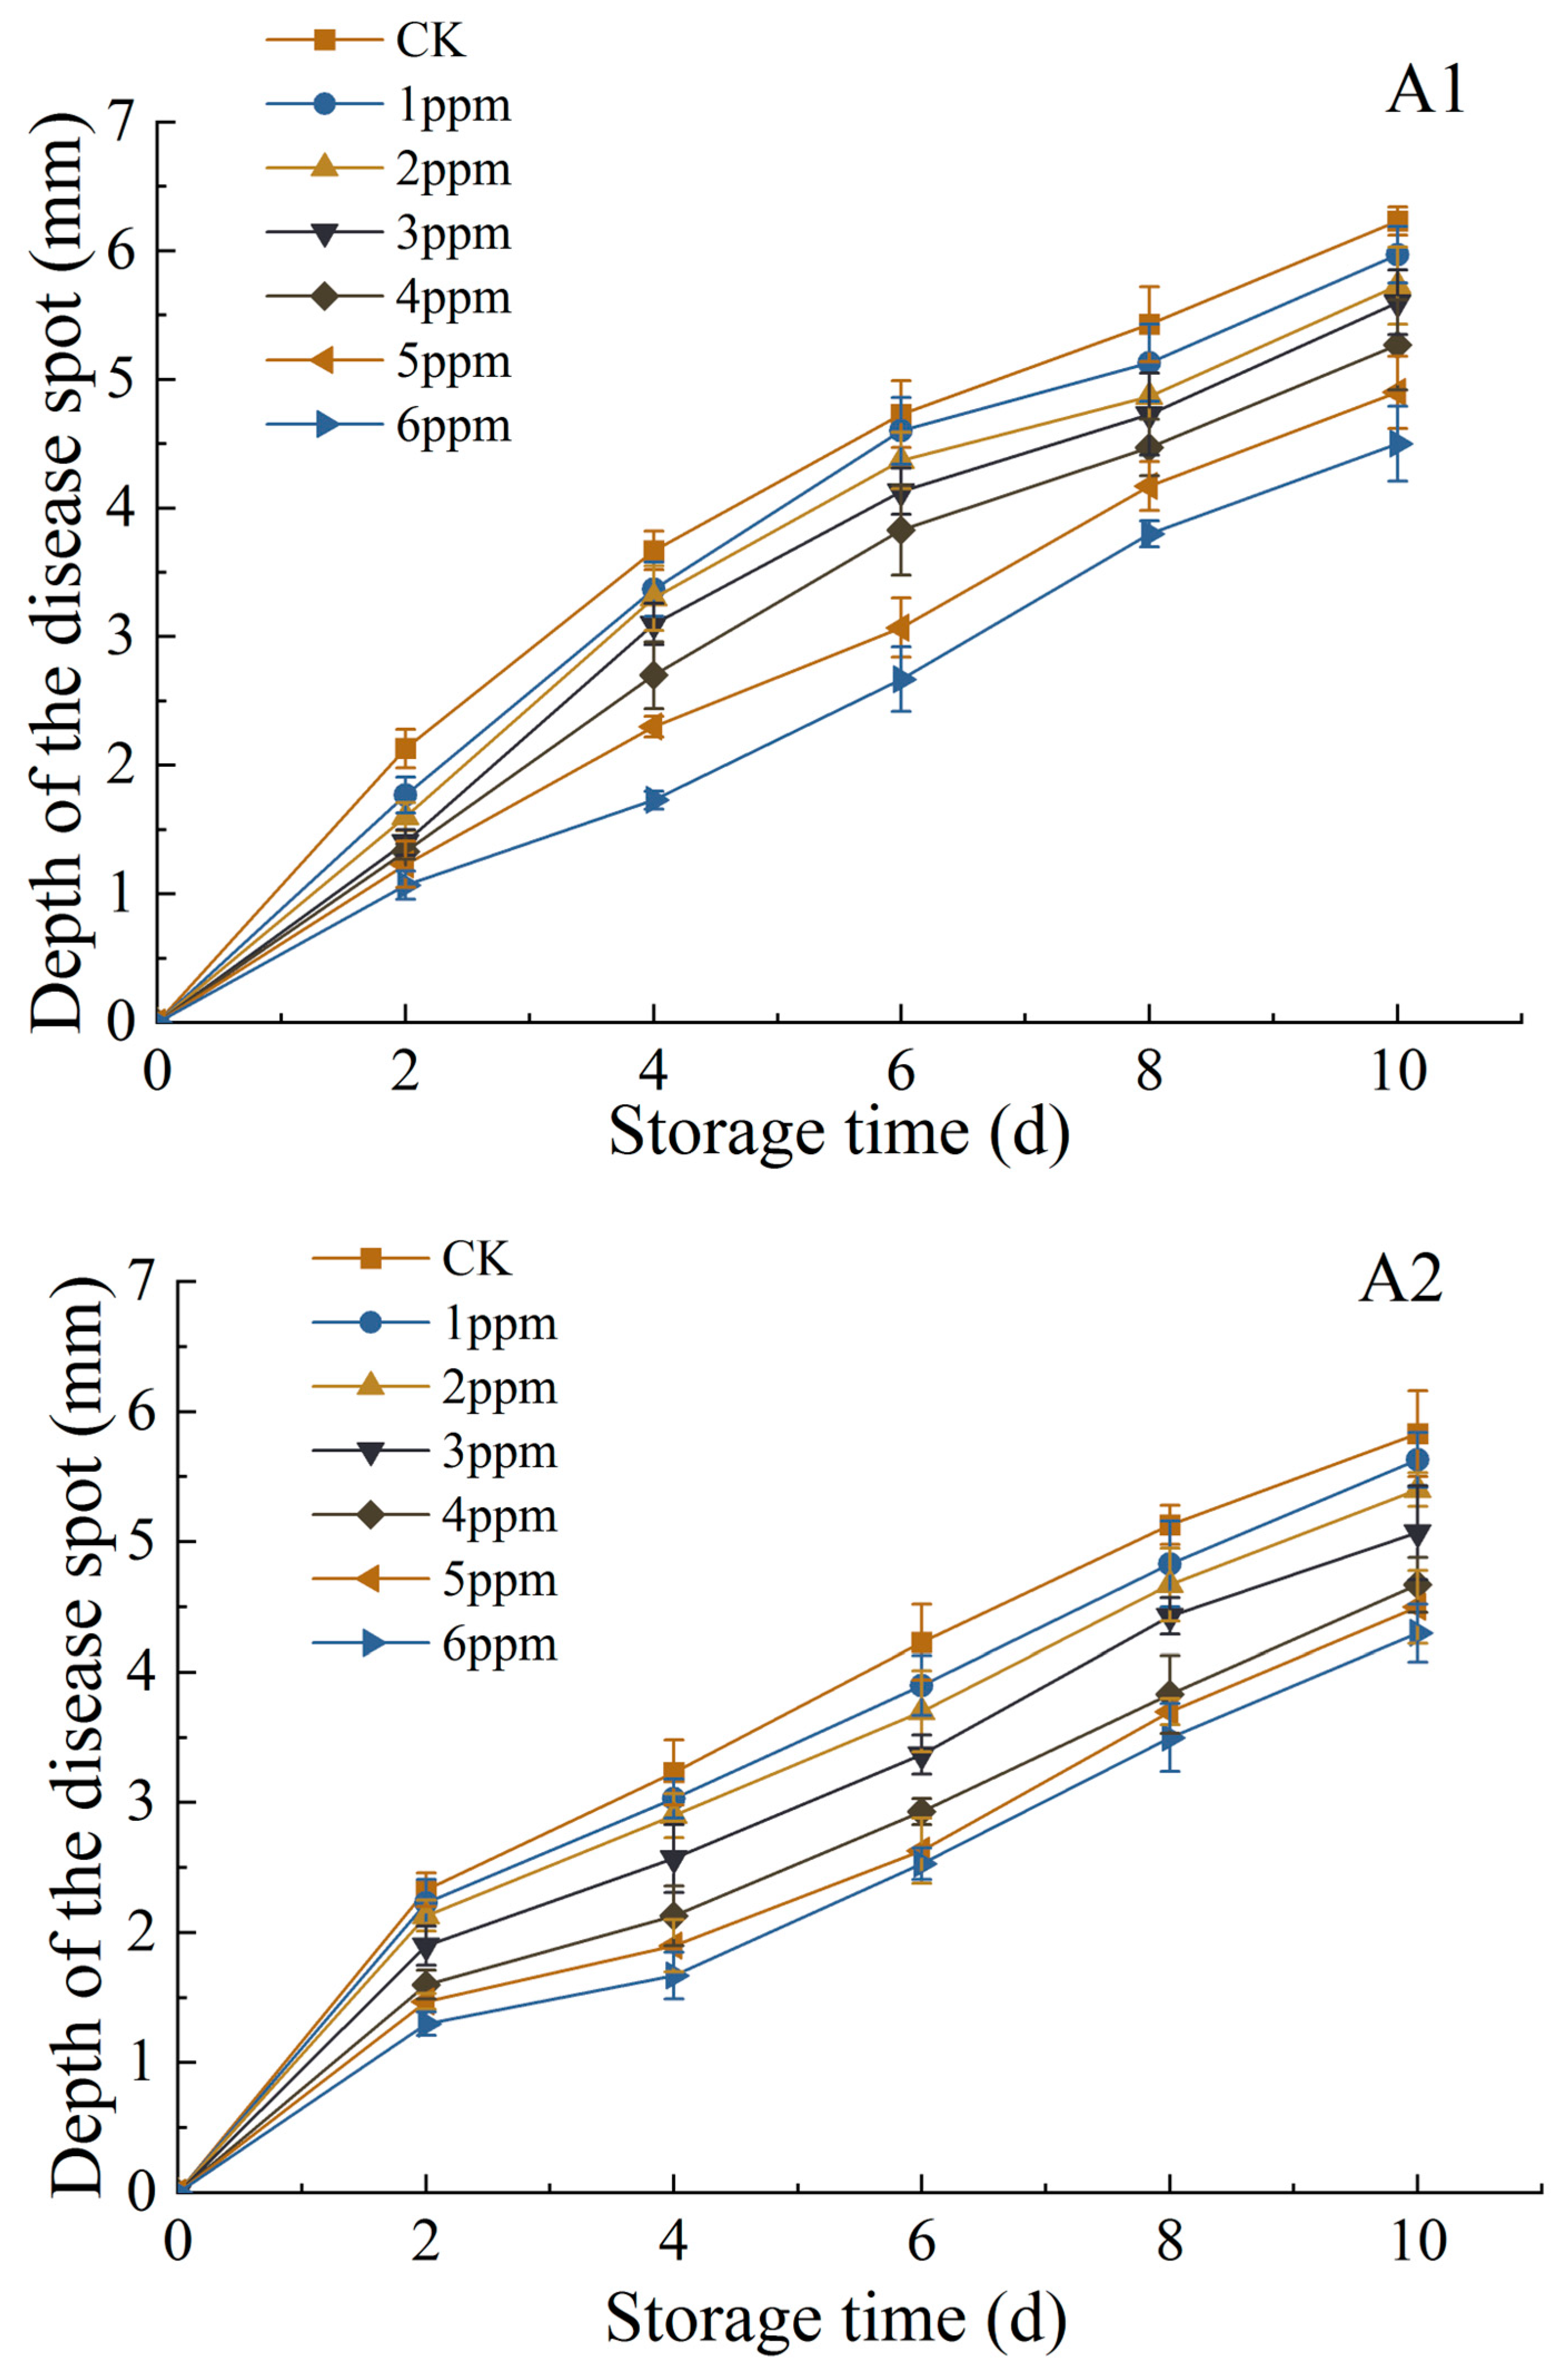
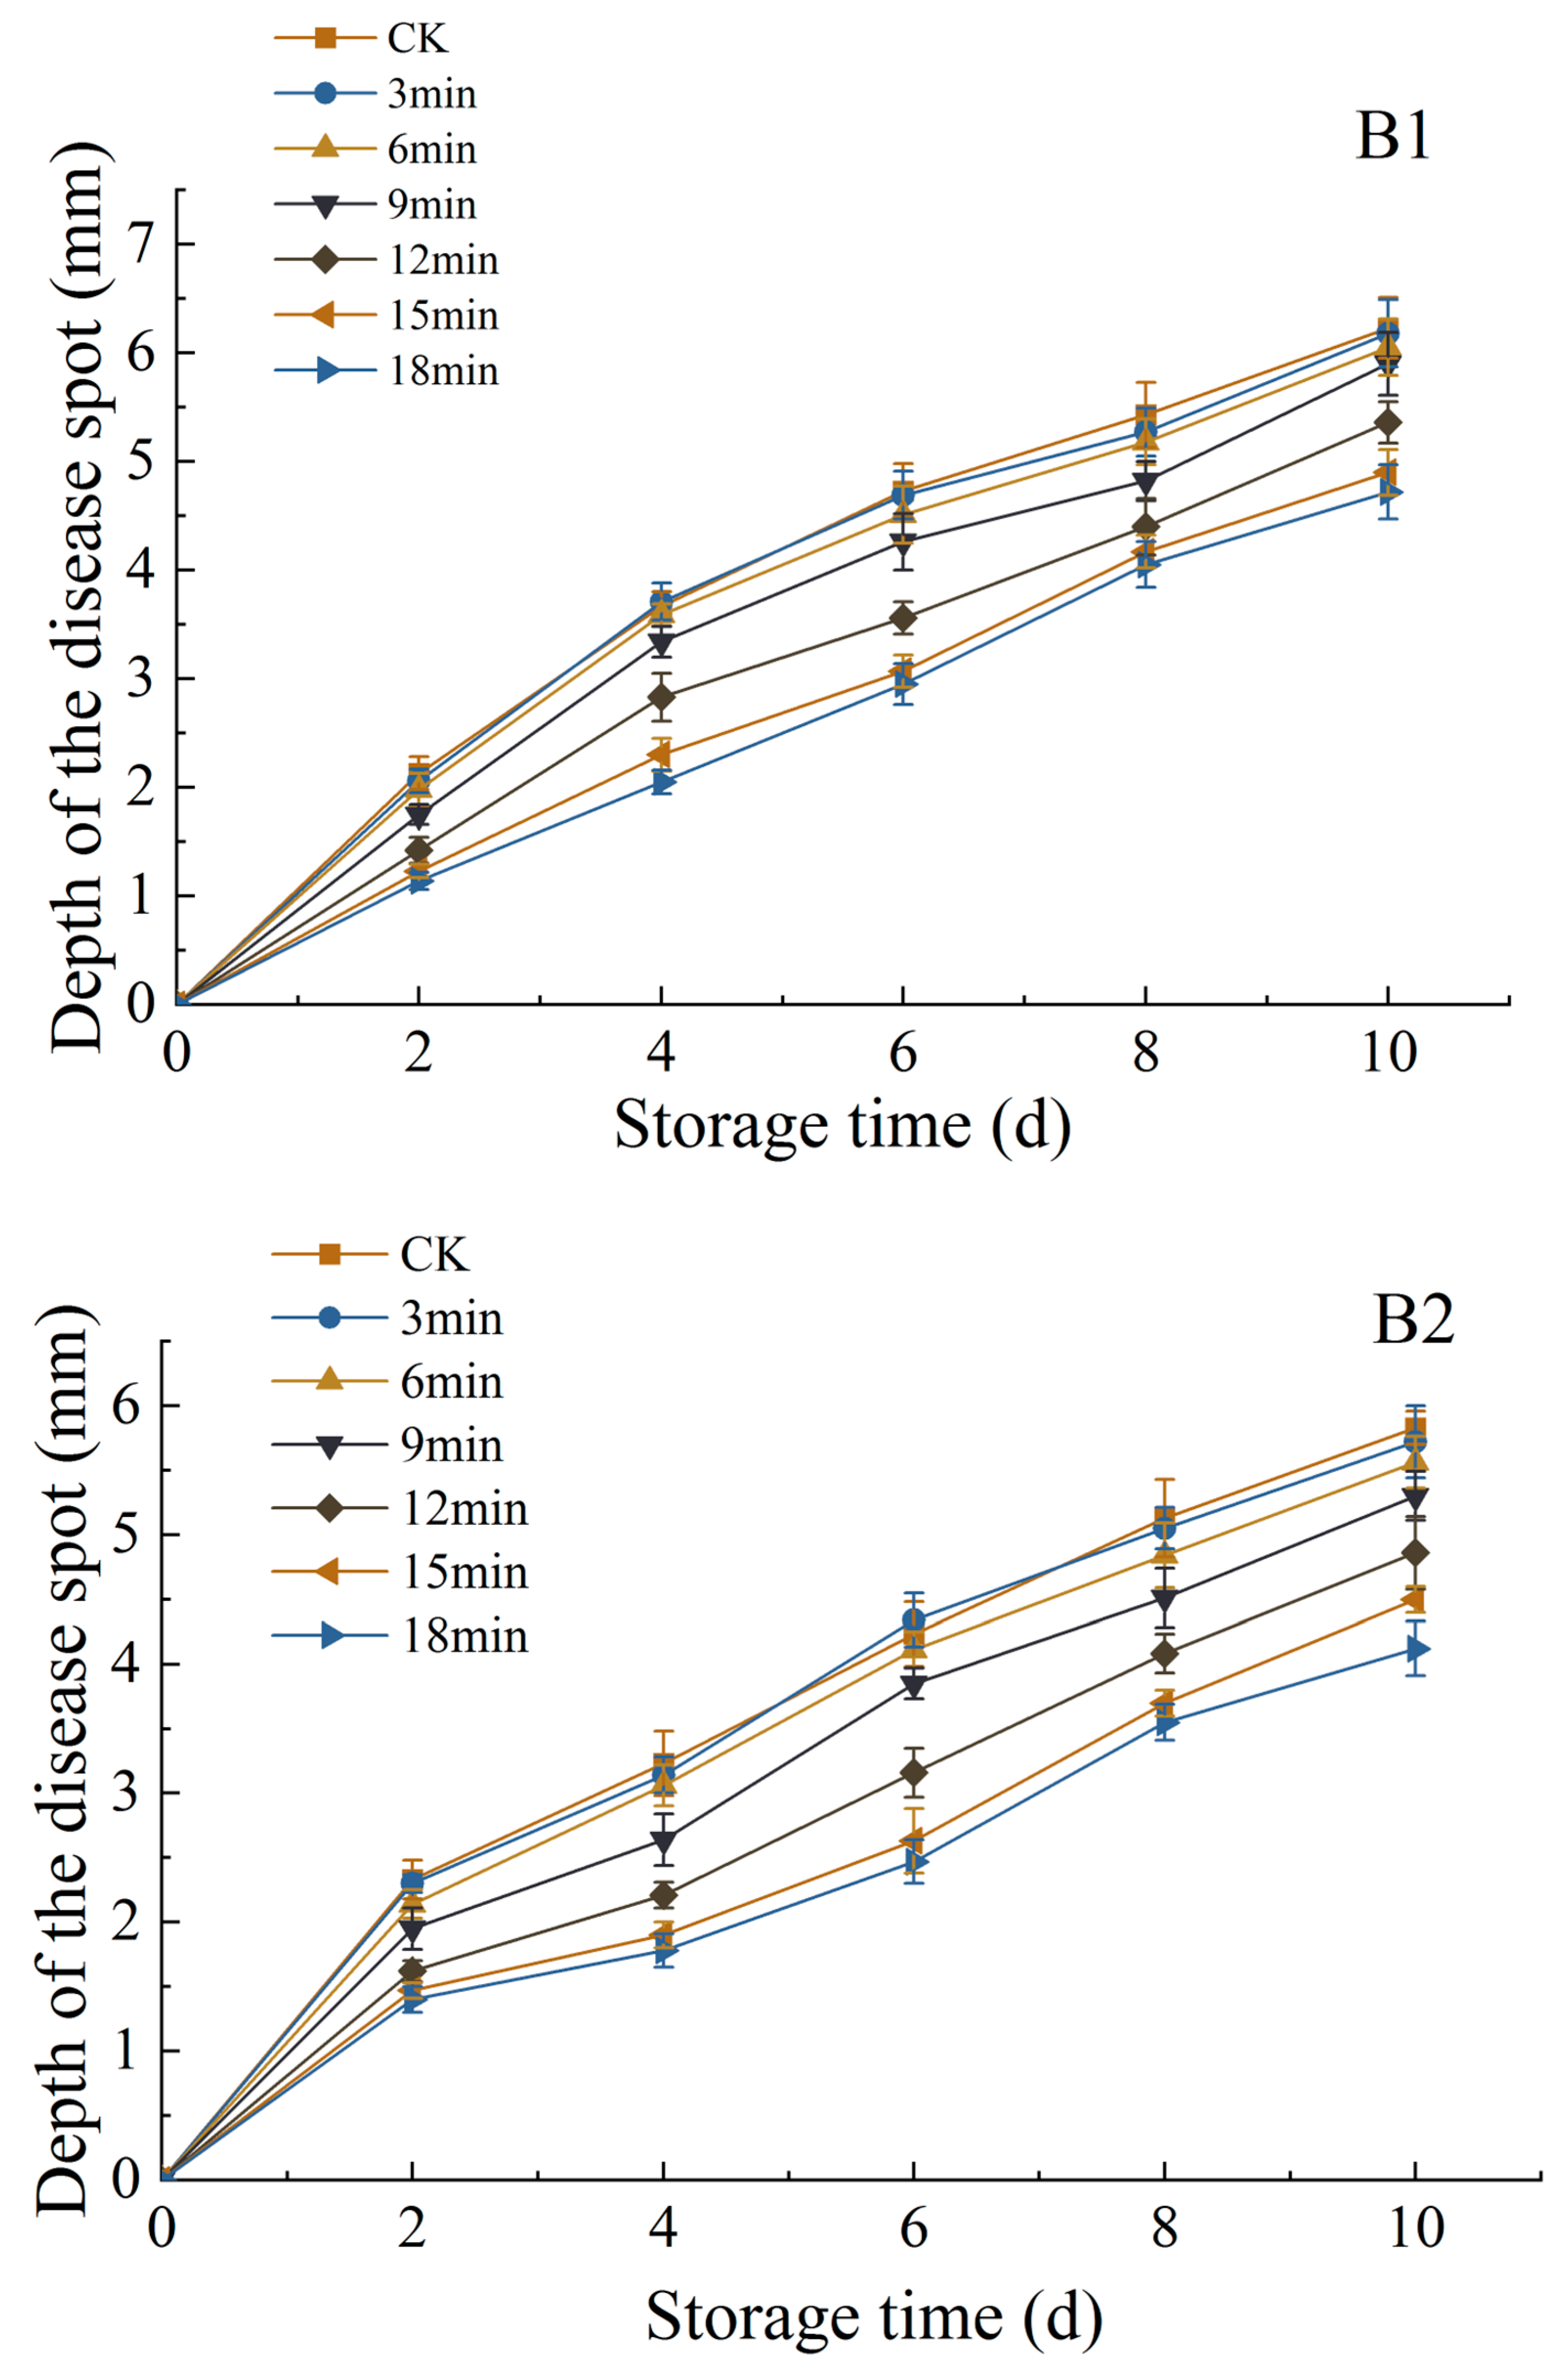
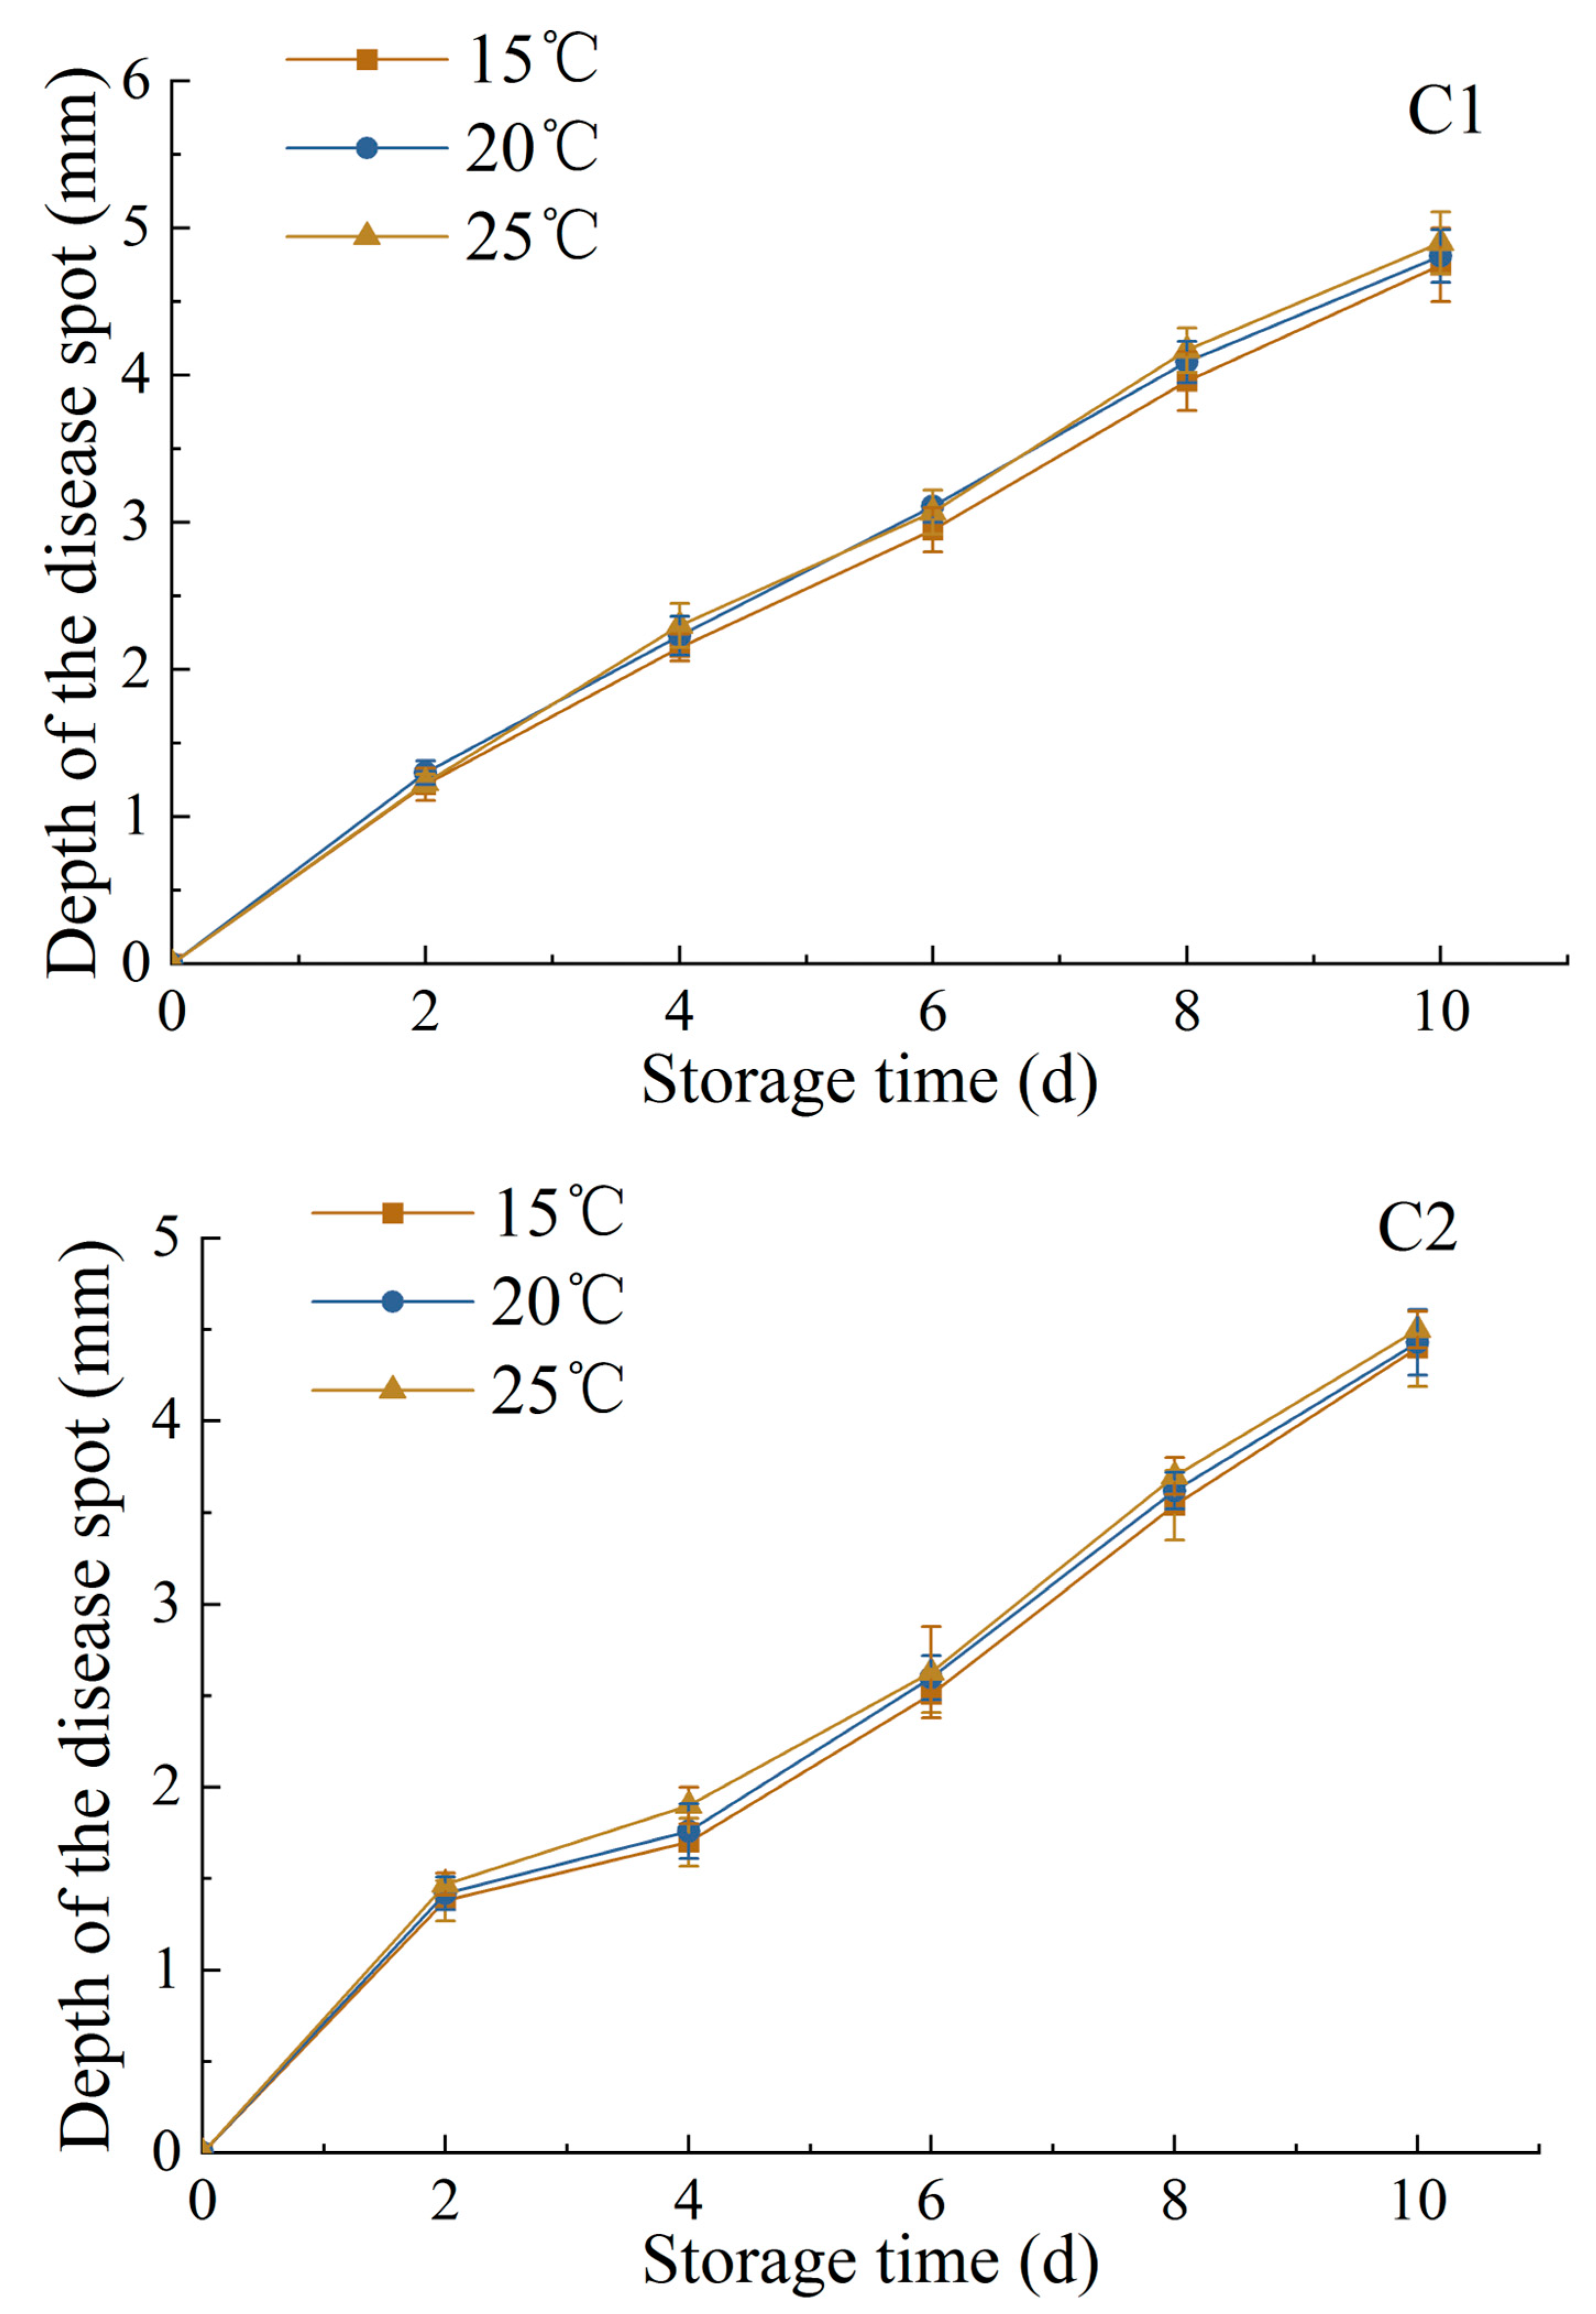
3.1.5. Changes in Diameter and Depth of Disease Spot

As shown in Figure 9, with the increase in storage time, the disease spot diameters in the fresh-peeled garlic after ozone treatment also increased, while the diameter of the spot in the blank group remained consistently at the highest value. Furthermore, the diameters of disease spots in the fresh-peeled garlic samples almost reflected the three ozone treatment temperatures of 15, 20 and 25 °C. After ozone treatment at various concentrations, the 6 ppm ozone treatment was found to have exerted the best bacteriostatic effect during storage, resulting in the smallest lesion diameters. When stored until the 10th day, the lesion diameters of the fresh-peeled garlic inoculated with P. citrinum and R. stolonifer were 3.47 mm and 3.17 mm, respectively, both much lower than that of the blank group. However, at ozone treatment times of 3 min and 6 min, under the same storage time, the disease spot diameters in the treated samples were not significantly different from that of the blank group. As treatment time continuously increased, however, the diameters continued to decrease, reaching a small value at 15 min and then stabilizing despite continuing treatment time.
The depth of the disease spots in the fresh-peeled garlic continuously increased with increasing concentration and exposure time (Figure 10A,B). When the storage time was kept constant, no difference was observed in the depths of disease spots in the fresh-peeled garlic treatment groups of 15, 20 and 25 °C (Figure 10C).

3.2. Discussion

In the in vitro experiment, with increased ozone concentration, exposure time and temperature, the ER, PDR, MGIR and LR of the two molds changed (Figure 1, Figure 2, Figure 3, Figure 4 and Figure 5). Ozone effectively inhibited the growth of P. citrinum and R. stolonifer in vitro, by disrupting spore development and inhibiting fungal cell growth through oxygenation. The result was consistent with that reported by Antony-Babu [46] et al., who found that ozone exposure significantly reduced the number of asexual spores formed in media. Another study reported that ozone did not kill all the spores in the in vitro tests [33], while Ozkan [47] et al. and Palou [48] et al. noted that different molds exhibit different levels of ozone tolerance. These results correspond with those of this study, shown in Figure 5, in which the trends of the two molds were similar but different, indicating that the ozone had similar inhibitory effects on P. citrinum and R. stolonifer, but could not attain an LR of 100%. Tzortzakis [49] et al. concluded that a low concentration of ozone could inhibit the growth of mold mycelium, while ozone treatment suppressed the germination of conidia but its inhibitory action was dependent on the concentration and duration of exposure. Therefore, the sensitivity of mold spores to the oxidizing action of ozone is considered to be dependent on fungal species, ozone dosage, exposure time and temperature. Further research is essential to explore the impacts of ozone on the ultramorphology, physiological metabolism and gene expression of molds, especially when examining its inhibitory properties on decay-causing molds in vitro.
In the in vivo experiment, as the storage period increased, the TPC, which predicts food shelf life resistance, YAM, which is one of the indicators for evaluating food hygiene, and DIR, as well as the diameter and depth of the two mold disease spots in the fresh-peeled garlic samples all increased (Figure 6, Figure 7, Figure 8, Figure 9 and Figure 10). These results indicate that while ozone treatment can inhibit P. citrinum and R. stolonifer in vivo, it cannot completely eradicate all fungi in garlic, which are potentially affected by various factors. The effect of temperature on the two molds was relatively small in comparison to those of the ozone concentration and exposure time. These findings concur with those of Wang [35] et al., in which ozone delayed disease incidence and reduced its severity in fruit. Their study also found that prolonged ozone exposure decreased the germination of fungal spores on fruit peel. Similarly, Yeoh [50] et al. discovered that ozone effectively controlled fungal sporulation on citrus fruit. It also slightly delayed disease incidence and significantly lowered disease severity. Palou [33] et al. found that fungal structures within wounds remained protected from the oxidizing effect of ozone because of limited ozone penetration. Consequently, while exposure to gaseous ozone delayed disease incidence and reduced disease severity on wound-inoculated fruit, it did not totally prevent fruit decay. Overall, however, previous studies have found that ozone does exert a significantly beneficial effect on the preservation of fresh-peeled garlic and other MPV, such as table grapes [32,47,50,51]. Additionally, investigating the preservation effect of ozone treatment on fresh-peeled garlic remains a crucial area for future studies.
It is worth noting that due to the mechanism of action of ozone, its application in food disinfection and sterilization basically does not compromise food quality and safety. However, strict control over the ozone concentration is imperative. Exceeding prescribed limits may result in harmful substances, especially if ozone reacts with bromide. In the disinfection process using ozone, it is also necessary to strictly control the ozone quantity. Ozone has a stimulating effect on the human body, and excessively high concentration can cause respiratory diseases, headaches, tachycardia, and other health threats, posing risks to human safety [52].

4. Conclusions

In this study, ozone treatment was found to partially damage the integrity of the fungi cell membrane, causing the leakage of intracellular proteins, polysaccharides and other substances, which led to an increase in the conductivity of the fungi suspension and, ultimately, the death of the mold. Furthermore, the exposure of fresh-peeled garlic samples to ozone exerted a significant inhibitory effect on P. citrinum and R. stolonifer, two of the main strains causing spoilage in fresh-peeled garlic. It was also evident that ozone treatment under appropriate conditions will provide optimal treatment results. In vitro, the best inhibitory effect of the ozone treatment on P. citrinum was evidenced at 6 ppm, for 20 min at 20 °C, while on R. stolonifer the optimal conditions were 8 ppm, for 20 min at 25 °C. In vivo, the best inhibitory effect of ozone treatment on both of the molds was evidenced at 6 ppm, for 15 min at 20 °C. Overall, the application of appropriate ozone treatment was found to provide a feasible solution for the inhibition of P. citrinum and R. stolonifer and may prolong the shelf life of peeled garlic.

Author Contributions

Conceptualization, H.L. and X.W.; methodology, L.C.; software, X.F.; validation, Y.X. and X.F.; formal analysis, W.L.; investigation, J.H.; resources, X.L.; data curation, X.L.; writing—original draft preparation, H.L.; writing—review and editing, X.F.; visualization, J.H. and L.C.; supervision, Y.X.; project administration, W.L. and J.H.; funding acquisition, Y.X. and X.L. All authors have read and agreed to the published version of the manuscript.

Funding

This work was supported by Science and technology support program of Sichuan (2021YFQ0071 and 2020YFN0151), the Open Research Subject of International Science and Technology Cooperation (Australia and New Zealand) Institute of Sichuan (AXYJ2022-012 and AXYJ2022-013) and the College Students Innovation and Entrepreneurship Training Program of Sichuan Province (S202110650007).

Institutional Review Board Statement

Not applicable.

Informed Consent Statement

Not applicable.

Data Availability Statement

Data are contained within the article.

Conflicts of Interest

The authors declare no conflict of interest.

References

  1. Martins, N.; Petropoulos, S.; Ferreira, I.C.F.R. Chemical Composition and Bioactive Compounds of Garlic (Allium Sativum L.) as Affected by Pre- and Post-Harvest Conditions: A Review. Food Chem. 2016, 211, 41–50. [Google Scholar] [CrossRef] [PubMed]
  2. Beato, V.M.; Orgaz, F.; Mansilla, F.; Montaño, A. Changes in Phenolic Compounds in Garlic (Allium Sativum L.) Owing to the Cultivar and Location of Growth. Plant Foods Hum. Nutr. 2011, 66, 218–223. [Google Scholar] [CrossRef] [PubMed]
  3. González, R.E.; Soto, V.C.; Sance, M.M.; Camargo, A.B.; Galmarini, C.R. Variability of Solids, Organosulfur Compounds, Pungency and Health-Enhancing Traits in Garlic (Allium Sativum L.) Cultivars Belonging to Different Ecophysiological Groups. J. Agric. Food Chem. 2009, 57, 10282–10288. [Google Scholar] [CrossRef]
  4. Ichikawa, M.; Mizuno, I.; Yoshida, J.; Ide, N.; Ushijima, M.; Kodera, Y.; Hayama, M.; Ono, K. Pharmacokinetics of Cycloalliin, an Organosulfur Compound Found in Garlic and Onion, in Rats. J. Agric. Food Chem. 2006, 54, 9811–9819. [Google Scholar] [CrossRef] [PubMed]
  5. Jabbes, N.; Arnault, I.; Auger, J.; Al Mohandes Dridi, B.; Hannachi, C. Agro-Morphological Markers and Organo-Sulphur Compounds to Assess Diversity in Tunisian Garlic Landraces. Sci. Hortic. 2012, 148, 47–54. [Google Scholar] [CrossRef]
  6. Lee, J.; Harnly, J.M. Free Amino Acid and Cysteine Sulfoxide Composition of 11 Garlic (Allium Sativum L.) Cultivars by Gas Chromatography with Flame Ionization and Mass Selective Detection. J. Agric. Food Chem. 2005, 53, 9100–9104. [Google Scholar] [CrossRef] [PubMed]
  7. Hirata, S.; Abdelrahman, M.; Yamauchi, N.; Shigyo, M. Diversity Evaluation Based on Morphological, Physiological and Isozyme Variation in Genetic Resources of Garlic (Allium Sativum L.) Collected Worldwide. Genes Genet. Syst. 2016, 91, 161–173. [Google Scholar] [CrossRef]
  8. Fratianni, F.; Riccardi, R.; Spigno, P.; Ombra, M.N.; Cozzolino, A.; Tremonte, P.; Coppola, R.; Nazzaro, F. Biochemical Characterization and Antimicrobial and Antifungal Activity of Two Endemic Varieties of Garlic (Allium Sativum L.) of the Campania Region, Southern Italy. J. Med. Food 2016, 19, 686–691. [Google Scholar] [CrossRef]
  9. Li, R.; Wu, W.; Fang, X.; Chen, H.; Han, Y.; Niu, B.; Chen, H.; Gao, H. Antifungal Activity and Mechanism of Perillaldehyde against Penicillium citrinum, a Major Fungal Pathogen of Myrica rubra. Food Sci. 2023, 44, 196–203. [Google Scholar]
  10. Kong, J.; Zhang, Y.; Ju, J.; Xie, Y.; Guo, Y.; Cheng, Y.; Qian, H.; Quek, S.Y.; Yao, W. Antifungal Effects of Thymol and Salicylic Acid on Cell Membrane and Mitochondria of Rhizopus Stolonifer and Their Application in Postharvest Preservation of Tomatoes. Food Chem. 2019, 285, 380–388. [Google Scholar] [CrossRef]
  11. Meireles, A.; Giaouris, E.; Simões, M. Alternative Disinfection Methods to Chlorine for Use in the Fresh-Cut Industry. Food Res. Int. 2016, 82, 71–85. [Google Scholar] [CrossRef]
  12. Rico, D.; Martín-Diana, A.B.; Barat, J.M.; Barry-Ryan, C. Extending and Measuring the Quality of Fresh-Cut Fruit and Vegetables: A Review. Trends Food Sci. Technol. 2007, 18, 373–386. [Google Scholar] [CrossRef]
  13. Martínez-Vaz, B.M.; Fink, R.C.; Diez-Gonzalez, F.; Sadowsky, M.J. Enteric Pathogen-Plant Interactions: Molecular Connections Leading to Colonization and Growth and Implications for Food Safety. Microb. Environ. 2014, 29, 123–135. [Google Scholar] [CrossRef] [PubMed]
  14. Yu, H.; Neal, J.A.; Sirsat, S.A. Consumers’ Food Safety Risk Perceptions and Willingness to Pay for Fresh-Cut Produce with Lower Risk of Foodborne Illness. Food Control 2018, 86, 83–89. [Google Scholar] [CrossRef]
  15. Herman, K.M.; Hall, A.J.; Gould, L.H. Outbreaks Attributed to Fresh Leafy Vegetables, United States, 1973–2012. Epidemiol. Infect. 2015, 143, 3011–3021. [Google Scholar] [CrossRef]
  16. Sirsat, S.; Neal, J. Microbial Profile of Soil-Free versus In-Soil Grown Lettuce and Intervention Methodologies to Combat Pathogen Surrogates and Spoilage Microorganisms on Lettuce. Foods 2013, 2, 488–498. [Google Scholar] [CrossRef]
  17. Francis, G.A.; Gallone, A.; Nychas, G.J.; Sofos, J.N.; Colelli, G.; Amodio, M.L.; Spano, G. Factors Affecting Quality and Safety of Fresh-Cut Produce. Crit. Rev. Food Sci. Nutr. 2012, 52, 595–610. [Google Scholar] [CrossRef]
  18. Bull, R.J.; Crook, J.; Whittaker, M.; Cotruvo, J.A. Therapeutic Dose as the Point of Departure in Assessing Potential Health Hazards from Drugs in Drinking Water and Recycled Municipal Wastewater. Regul. Toxicol. Pharmacol. 2011, 60, 1–19. [Google Scholar] [CrossRef]
  19. Legay, C.; Rodriguez, M.J.; Sérodes, J.B.; Levallois, P. Estimation of Chlorination By-Products Presence in Drinking Water in Epidemiological Studies on Adverse Reproductive Outcomes: A Review. Sci. Total Environ. 2010, 408, 456–472. [Google Scholar] [CrossRef]
  20. Kim, J.-G.; Yousef, A.E.; Dave, S. Application of Ozone for Enhancing the Microbiological Safety and Quality of Foods: A Review. J. Food Prot. 1999, 62, 1071–1087. [Google Scholar] [CrossRef]
  21. Cullen, P.J.; Valdramidis, V.P.; Tiwari, B.K.; Patil, S.; Bourke, P.; O’Donnell, C.P. Ozone Processing for Food Preservation: An Overview on Fruit Juice Treatments. Ozone Sci. Eng. 2010, 32, 166–179. [Google Scholar] [CrossRef]
  22. Khadre, M.A.; Yousef, A.E. Sporicidal Action of Ozone and Hydrogen Peroxide: A Comparative Study. Int. J. Food Microbiol. 2001, 71, 131–138. [Google Scholar] [CrossRef]
  23. Zou, H.; Xu, L.; Xu, Z.; Xie, W.; Wang, Y.; Liao, X.; Kong, X. Effects of Ultra-High Temperature Treatment and Packages on Baked Purple Sweet Potato Nectar. LWT 2018, 94, 129–135. [Google Scholar] [CrossRef]
  24. Gibson, K.E.; Almeida, G.; Jones, S.L.; Wright, K.; Lee, J.A. Inactivation of Bacteria on Fresh Produce by Batch Wash Ozone Sanitation. Food Control 2019, 106, 106747. [Google Scholar] [CrossRef]
  25. Tzortzakis, N.; Chrysargyris, A. Postharvest Ozone Application for the Preservation of Fruits and Vegetables. Food Rev. Int. 2017, 33, 270–315. [Google Scholar] [CrossRef]
  26. Miller, F.A.; Silva, C.L.M.; Brandão, T.R.S. A Review on Ozone-Based Treatments for Fruit and Vegetables Preservation. Food Eng. Rev. 2013, 5, 77–106. [Google Scholar] [CrossRef]
  27. Horvitz, S.; Cantalejo, M.J. Application of Ozone for the Postharvest Treatment of Fruits and Vegetables. Crit. Rev. Food Sci. Nutr. 2014, 54, 312–339. [Google Scholar] [CrossRef]
  28. Akata, I.; Torlak, E.; Erci, F. Efficacy of Gaseous Ozone for Reducing Microflora and Foodborne Pathogens on Button Mushroom. Postharvest Biol. Technol. 2015, 109, 40–44. [Google Scholar] [CrossRef]
  29. Öztekin, S.; Zorlugenç, B.; Zorlugenç, F.K. Effects of Ozone Treatment on Microflora of Dried Figs. J. Food Eng. 2006, 75, 396–399. [Google Scholar] [CrossRef]
  30. Nadas, A.; Olmo, M.; Garcia, J.M. Growth of Botrytis Cinerea and Strawberry Quality in Ozone-Enriched Atmospheres. J Food Sci. 2003, 68, 1798–1802. [Google Scholar] [CrossRef]
  31. Boonkorn, P.; Gemma, H.; Sugaya, S.; Setha, S.; Uthaibutra, J.; Whangchai, K. Impact of High-Dose, Short Periods of Ozone Exposure on Green Mold and Antioxidant Enzyme Activity of Tangerine Fruit. Postharvest Biol. Technol. 2012, 67, 25–28. [Google Scholar] [CrossRef]
  32. Sarig, P.; Zahavi, T.; Zutkhi, Y.; Yannai, S.; Lisker, N.; Ben-Arie, R. Ozone for Control of Post-Harvest Decay of Table Grapes Caused ByRhizopus Stolonifer. Physiol. Mol. Plant Pathol. 1996, 48, 403–415. [Google Scholar] [CrossRef]
  33. Palou, L.; Crisosto, C.H.; Smilanick, J.L.; Adaskaveg, J.E.; Zoffoli, J.P. Effects of Continuous 0.3 Ppm Ozone Exposure on Decay Development and Physiological Responses of Peaches and Table Grapes in Cold Storage. Postharvest Biol. Technol. 2002, 24, 39–48. [Google Scholar] [CrossRef]
  34. Tzortzakis, N.; Singleton, I.; Barnes, J. Impact of Low-Level Atmospheric Ozone-Enrichment on Black Spot and Anthracnose Rot of Tomato Fruit. Postharvest Biol. Technol. 2008, 47, 1–9. [Google Scholar] [CrossRef]
  35. Wang, X.; Liu, R.; Yang, Y.; Zhang, M. Isolation, Purification and Identification of Antioxidants in an Aqueous Aged Garlic Extract. Food Chem. 2015, 187, 37–43. [Google Scholar] [CrossRef] [PubMed]
  36. Minas, I.S.; Karaoglanidis, G.S.; Manganaris, G.A.; Vasilakakis, M. Effect of Ozone Application during Cold Storage of Kiwifruit on the Development of Stem-End Rot Caused by Botrytis Cinerea. Postharvest Biol. Technol. 2010, 58, 203–210. [Google Scholar] [CrossRef]
  37. Moscoso-Ramírez, P.A.; Palou, L. Effect of Ethylene Degreening on the Development of Postharvest Penicillium Molds and Fruit Quality of Early Season Citrus Fruit. Postharvest Biol. Technol. 2014, 91, 1–8. [Google Scholar] [CrossRef]
  38. Diao, W.-R.; Zhang, L.-L.; Feng, S.-S.; Xu, J.-G. Chemical Composition, Antibacterial Activity, and Mechanism of Action of the Essential Oil from Amomum Kravanh. J. Food Prot. 2014, 77, 1740–1746. [Google Scholar] [CrossRef]
  39. Yin, X.; Luo, Y.; Fan, H.; Feng, L.; Shen, H. Effect of Freeze-Chilled Treatment on Flavor of Grass Carp (Ctenopharyngodon Idellus) Fillets and Soups During Short-Term Storage. J. Aquat. Food Prod. Technol. 2016, 25, 777–787. [Google Scholar] [CrossRef]
  40. Xu, Q.; Xing, Y.; Che, Z.; Guan, T.; Zhang, L.; Bai, Y.; Gong, L. Effect of Chitosan Coating and Oil Fumigation on the Microbiological and Quality Safety of Fresh-Cut Pear: Microbiological Safety of Fresh-Cut Pear. J. Food Saf. 2013, 33, 179–189. [Google Scholar] [CrossRef]
  41. Xing, Y.; Xu, Q.; Li, X.; Che, Z.; Yun, J. Antifungal Activities of Clove Oil Against Rhizopus Nigricans, Aspergillus Flavus and Penicillium Citrinum in Vitro and in Wounded Fruit Test: Antifungal Activities of Clove Oil. J. Food Saf. 2012, 32, 84–93. [Google Scholar] [CrossRef]
  42. Xing, Y.; Xu, Q.; Yang, S.; Chen, C.; Tang, Y.; Sun, S.; Zhang, L.; Che, Z.; Li, X. Preservation Mechanism of Chitosan-Based Coating with Cinnamon Oil for Fruits Storage Based on Sensor Data. Sensors 2016, 16, 1111. [Google Scholar] [CrossRef]
  43. Salve, A.R.; Pegu, K.; Arya, S.S. Comparative Assessment of High-Intensity Ultrasound and Hydrodynamic Cavitation Processing on Physico-Chemical Properties and Microbial Inactivation of Peanut Milk. Ultrason. Sonochem. 2019, 59, 104728. [Google Scholar] [CrossRef] [PubMed]
  44. Martiñon, M.E.; Moreira, R.G.; Castell-Perez, M.E.; Gomes, C. Development of a Multilayered Antimicrobial Edible Coating for Shelf-Life Extension of Fresh-Cut Cantaloupe (Cucumis Melo L.) Stored at 4 °C. LWT—Food Sci. Technol. 2014, 56, 341–350. [Google Scholar] [CrossRef]
  45. Ong, M.K.; Ali, A. Antifungal Action of Ozone against Colletotrichum Gloeosporioides and Control of Papaya Anthracnose. Postharvest Biol. Technol. 2015, 100, 113–119. [Google Scholar] [CrossRef]
  46. Antony-Babu, S.; Singleton, I. Effects of Ozone Exposure on the Xerophilic Fungus, Eurotium Amstelodami IS-SAB-01, Isolated from Naan Bread. Int. J. Food Microbiol. 2011, 144, 331–336. [Google Scholar] [CrossRef]
  47. Ozkan, R.; Smilanick, J.L.; Karabulut, O.A. Toxicity of Ozone Gas to Conidia of Penicillium Digitatum, Penicillium Italicum, and Botrytis Cinerea and Control of Gray Mold on Table Grapes. Postharvest Biol. Technol. 2011, 60, 47–51. [Google Scholar] [CrossRef]
  48. Palou, L.; Smilanick, J.L.; Crisosto, C.H.; Mansour, M. Effect of Gaseous Ozone Exposure on the Development of Green and Blue Molds on Cold Stored Citrus Fruit. Plant Dis. 2001, 85, 632–638. [Google Scholar] [CrossRef]
  49. Tzortzakis, N.; Singleton, I.; Barnes, J. Deployment of Low-Level Ozone-Enrichment for the Preservation of Chilled Fresh Produce. Postharvest Biol. Technol. 2007, 43, 261–270. [Google Scholar] [CrossRef]
  50. Yeoh, W.K.; Ali, A.; Forney, C.F. Effects of Ozone on Major Antioxidants and Microbial Populations of Fresh-Cut Papaya. Postharvest Biol. Technol. 2014, 89, 56–58. [Google Scholar] [CrossRef]
  51. Aguayo, E.; Escalona, V.H.; Artés, F. Effect of Cyclic Exposure to Ozone Gas on Physicochemical, Sensorial and Microbial Quality of Whole and Sliced Tomatoes. Postharvest Biol. Technol. 2006, 39, 169–177. [Google Scholar] [CrossRef]
  52. Zhou, Q. Discussion on the Ozone Disinfection and Sterilization Technology Applied in the Food Industry. China Food Saf. Mag. 2023, 9, 155–157. [Google Scholar] [CrossRef]
Figure 1. Effects of ozone treatments on the ER of P. citrinum and R. stolonifer. (A): Ozone concentration (ppm); (B): ozone treatment time (min); (C): ozone treatment temperature (°C). For P. citrinum and R. stolonifer, mean bars with different letters (a–d), (a–e) differed significantly (p < 0.05) for the same time and temperature at different ozone concentrations in (A). Mean bars with different letters (a–e), (a–f) within the same ozone concentration and temperature at different times differed significantly (p < 0.05) in (B). Mean bars with different letters (a,b), (a,b) differ significantly (p < 0.05) for the same ozone concentration and time at different temperatures in (C).
Coatings 13 01931 g001aCoatings 13 01931 g001b
Figure 2. Effects of ozone treatments on the PDR of P. citrinum and R. stolonifer. (A): Ozone concentration (ppm); (B): ozone treatment time (min); (C): ozone treatment temperature (°C). For P. citrinum and R. stolonifer, mean bars with different letters (a–f), (a–f) differed significantly (p < 0.05) for the same time and temperature at different ozone concentrations in (A). Mean bars with different letters (a–g), (a–f) within the same ozone concentration and temperature at different times differed significantly(p < 0.05) in (B). Mean bars with different letters (a–c), (a–c) differ significantly (p < 0.05) for the same ozone concentration and time at different temperatures in (C).
Coatings 13 01931 g002aCoatings 13 01931 g002b
Figure 3. Effects of ozone treatments on the MGIR of P. citrinum and R. stolonifer. (A): Ozone concentration (ppm); (B): ozone treatment time (min); (C): ozone treatment temperature (°C).
Coatings 13 01931 g003aCoatings 13 01931 g003b
Figure 4. Effects of ozone treatments on mycelial morphology of P. citrinum and R. stolonifer in 10 × 40 field. (a): Control group of P. citrinum; (b): ozone treatment of P. citrinum; (c): control group of R. stolonifer; (d): ozone treatment of R. stolonifer.
Coatings 13 01931 g004
Figure 5. Effects of ozone treatments on the LR of P. citrinum and R. stolonifer. (A): Ozone concentration (ppm); (B): ozone treatment time (min); (C): ozone treatment temperature (°C).
Coatings 13 01931 g005aCoatings 13 01931 g005b
Figure 6. Effects of ozone treatments on the TPC counts of P. citrinum and R. stolonifer during storage. CK: control; (A): ozone concentration (ppm); (B): ozone treatment time (min); (C): ozone treatment temperature (°C); 1: P. citrinum; 2: R. stolonifer. For P. citrinum and R. stolonifer, mean bars with different letters (a–f) were significantly different (p < 0.05) for the same treatment, different storage days in (A,B,C1). Mean bars with different letters (p–v) differed significantly (p < 0.05) across treatments for the same number of storage days in (A,B).
Coatings 13 01931 g006aCoatings 13 01931 g006bCoatings 13 01931 g006c
Figure 7. Effects of ozone treatments on the YAM counts of P. citrinum and R. stolonifer during storage. CK: control; (A): ozone concentration (ppm); (B): ozone treatment time (min); (C): ozone treatment temperature (°C); 1: P. citrinum; 2: R. stolonifer. For P. citrinum and R. stolonifer, mean bars with different letters (a–f) were significantly different (p < 0.05) for the same treatment, different storage days in (A,B). Mean bars with different letters (p–v) differed significantly (p < 0.05) across treatments for the same number of storage days in (A,B1).
Coatings 13 01931 g007aCoatings 13 01931 g007bCoatings 13 01931 g007c
Figure 8. Effects of ozone treatments on the DIR. CK: control; (A): ozone concentration (ppm); (B): ozone treatment time (min); (C): ozone treatment temperature (°C); 1: P. citrinum; 2: R. stolonifer.
Coatings 13 01931 g008aCoatings 13 01931 g008bCoatings 13 01931 g008c
Figure 9. Effects of ozone treatments on the diameter of the disease spot. CK: control; (A): ozone concentration (ppm); (B): ozone treatment time (min); (C): ozone treatment temperature (°C); 1: P. citrinum; 2: R. stolonifer.
Coatings 13 01931 g009aCoatings 13 01931 g009bCoatings 13 01931 g009c
Figure 10. Effects of ozone treatments on the depth of the disease spot. CK: control; (A): ozone concentration (ppm); (B): ozone treatment time (min); (C): ozone treatment temperature (°C); 1: P. citrinum; 2: R. stolonifer.
Coatings 13 01931 g010aCoatings 13 01931 g010bCoatings 13 01931 g010c
Disclaimer/Publisher’s Note: The statements, opinions and data contained in all publications are solely those of the individual author(s) and contributor(s) and not of MDPI and/or the editor(s). MDPI and/or the editor(s) disclaim responsibility for any injury to people or property resulting from any ideas, methods, instructions or products referred to in the content.

