Article

Effects and Consequences of an Alkali-Induced Cathodic Environment on Coating Aging

1
French Corrosion Institute, Part of Research Institutes of Sweden (RISE), 220 Rue Pierre Rivoalon, 29200 Brest, France
2
Laboratoire de Chimie Physique et Microbiologie pour les Matériaux et l’Environnement (LCPME), UMR CNRS—Université de Lorraine, 405 Rue de Vandoeuvre, 54600 Villers-lès-Nancy, France
3
TotalEnergies OneTech, Avenue Larribau, 64000 Pau, France
4
Téréga, 40 Avenue de l’Europe, 64000 Pau, France
5
GRTgaz, 5 A Rue Ferdinand de Lesseps, 60200 Compiègne, France
6
BS Coatings, 1 Allée Paul Sabatier, 27940 Le Val-d’Hazey, France
*
Author to whom correspondence should be addressed.
Coatings 2023, 13(11), 1949; https://doi.org/10.3390/coatings13111949
Submission received: 24 October 2023 / Revised: 8 November 2023 / Accepted: 13 November 2023 / Published: 15 November 2023

Abstract

:
The use of organic coatings in conjunction with cathodic protection (CP) for buried structures is the usual method for protecting steel against corrosion. When the organic coating loses its protective ability, regardless of the reason, the CP becomes the active protection, leading to a specific local environment. This environment can be characterized by high alkalinity, which can be detrimental for the coated structure, either by weakening the steel–coating interface or by the chemical aging of the coating. Thus, the coating must be compatible with CP and able to sustain aging under an alkaline environment. In this study, the susceptibility to alkaline aging and its consequences in regards to coating performance have been investigated for two commercial coatings used for buried structures—fusion bonded epoxy (FBE) and liquid epoxy (LE)—in free membrane and coated steel configurations. The results showed a clear impact of alkaline aging on the studied LE, leading to a significant reduction in coating resistance and ultimately, failure of the steel–coating interface, whereas the studied FBE remained stable. The presented results relate to a precise formulation of LE and FBE; however, the proposed chemical method appears to be relevant and shows the necessity of considering such specific aging results for coating specifications and improvements.

1. Introduction

Surface protection against corrosion will always be a topic of great interest, as all materials are bound to age. Furthermore, failure due to corrosion may be highly costly and can affect up to 3.4% of the global gross domestic product [1]. Several solutions, such as the application of organic coatings, exist to correctly protect metallic surfaces to slow down corrosion. In the case of buried steel structures, such as pipelines or tanks, the corrosion protection consists of a combination of organic coatings and cathodic protection (CP). The role of organic coating is to create an insulating barrier, inhibiting the corrosion reactions and limiting the diffusion of aggressive species like water, oxygen, or ions involved in corrosion processes (Cl, SO42−, Na+, K+, NH4+, and Ca2+). The CP becomes the active protection when the organic coating loses its barrier ability for different reasons, such as mechanical impacts, poor surface preparation, internal stresses, etc. [2,3,4,5,6,7,8,9]. The activation of the CP can induce a local alkalinity, which may impact the organic coating and its interface.
Near an open defect, this local alkalinity arises from the electrochemical reactions between iron and oxygen or water occurring at the steel–coating interface, leading to the production and accumulation of hydroxyl ions at this interface [6,10,11,12]. The induced local alkalinity depends on the applied CP current, the OH diffusion, and their interaction with the media [13,14,15]. This alkaline environment can cause adhesion loss, called cathodic disbondment (CD), through different mechanisms, sorted in the literature into three main groups, all of them potentially occurring together: reduction of the oxide layer, chemical degradation of the coating, and interfacial failure [3,10,16]. Thus, when organic coatings and CP are used in conjunction, the ability of the intact coating near the open defect to sustain the effect of the CP must be considered when selecting the appropriate coating, as a function of the intended application. Indeed, the extent of CD will be dependent upon the strength of the steel–coating interface but also on the coating susceptibility to chemical aging in alkaline media. Many standardized test methods for the evaluation of cathodic disbondment are available, whereas the assessment of the coating susceptibility to chemical aging is less characterizable [17,18,19].
Even though the possible chemical aging of the polymeric matrix under alkali conditions is known, such a mechanism has not been fully studied, especially in regards to commercial coatings containing fillers and additives in addition to the polymeric matrix. Traditional coatings in the pipeline industry include the use of fusion bonded epoxy (FBE), liquid epoxy (LE), or three-layer polyolefin (3LPO) [3,20]. The FBE is a powder coating (solvent free), based on epoxy chemistry, in which the film formation is achieved at high temperatures under high shear, whereas the LE coating is a traditional solvent-borne coating, which is also based on an epoxy chemistry. The 3LPO is a multi-layered system consisting of an epoxy primer, FBE or LE, an adhesive layer, and a polyolefin topcoat. In a recent study, a 30-year-old disbonded FBE coating collected close to an open defect under CP showed significant aging evidenced by a reduction in coating resistance, characterized using electrochemical impedance spectroscopy (EIS) [21]. Under CP, in the case of buried structures, the increase in soil pH at the vicinity of the metal can be observed even with rather low current densities, showing the importance of considering the possible effect of the local environment on the coating [13,14,15]. In addition, a drop in the coating resistance due to alkaline aging is expected to increase the CP demand and thus, further increase the environmental aggressiveness.
This study focused on evaluating the impact of alkaline aging on two commercial coatings, FBE and LE, and estimating the consequences of such aging on the coating performances. The coating degradation, as a free membrane, was studied by gravimetry monitoring, EIS, and spectroscopic investigation (infrared absorption and Raman scattering), whereas in the coated steel configuration, current monitoring and adhesion tests were performed, in addition to EIS.

2. Materials and Methods

In this section, basic information regarding the coatings and their complementary characterizations are summarized. Two types of coatings were used: (i) free membranes, and (ii) coated steel coupons.

2.1. Materials

2.1.1. Free Membranes

The free membranes consisted of fusion bonded epoxy (FBE) and liquid epoxy (LE) applied on an easy-release Terphane film, allowing the obtention of free membranes. The membranes thickness measured 500 ± 50 µm, and the size of the samples was 50 × 50 mm.
Characterization performed by scanning electron microscopy (SEM) coupled with energy dispersion X-ray (EDX) analysis have shown that the FBE coating contained various mineral fillers, including BaSO4, and α-Fe2O3, with some containing Zn, Al, and Mg, and some containing Al and Si. The size of the mineral fillers was of 15 µm, on average, whatever the nature of the mineral fraction considered (see SEM given in Figure 1a). The polymeric matrix was made of reticulated epoxy (bisphenol A diglycidyl ether—BADGE), likely with an amine-type hardener.
The LE membranes consisted of an epoxy network, presumably reticulated with an amine hardener. X-ray diffraction (XRD) and SEM-EDX analysis of the coating have shown the presence of TiO2 (Rutile), CaMg(CO3)2 (Dolomite), MgCO3, MgSi2O5(OH)4 (Lizardite), (Mg,Fe2+)5Al((OH)8/AlSi3O10) (Clinochlore), SiO2, and CaCO3 as mineral fractions, as presented in Figure 1b. The shape of the filler was variable using a lamellar filler and a rough-shaped filler. Their sizes were about 70 × 10 µm, for the lamellar filler, and about 35 µm, for the rough-shaped filler. A smaller filler, 10 µm in average, was also detected. The lamellar filler was made of clinochlore or lizardite, whereas the rough-shaped filler consisted mainly of dolomite or sometimes clinochlore.

2.1.2. Coated Steel

In addition to free membranes, steel samples coated with FBE and LE were investigated. Coated steel samples were manufactured from 200 × 200 × 5 mm raw steel sections, for which the composition is given in Table 1.

2.2. Exposure Conditions

The free membranes and coated steel were exposed to different solutions, from deionized water to various alkali pH, with addition of sodium hydroxide (NaOH—Merck 1.06498.5000 MQ300, Darmstadt, Germany).

2.2.1. Free Membranes

The free membranes were totally immersed, without agitation, in a closed polyethylene (PE) container (both faces) in three solutions at room temperature (RT), as summarized in Table 2. The glass transition temperature (Tg) of the different coatings is expected to be greater than that of room temperature. For example, the dry Tg for FBE is typically around 101–106 °C [9].

2.2.2. Coated Steel

Coated steel samples were exposed, in parallel with the free membranes, at pH 14 at room temperature. Two replicates were exposed for 360 days. The experimental setup consisted in the assembling of a 140 mm diameter polyvinyl chloride (PVC) cell mounted on the coated steel coupon using watertight mastic. In this configuration, only the coated side was exposed to the solution.
To monitor a possible coating degradation over time, a 1 V voltage was applied through the coating using a DC power supply and titanium coated with a mixed-metal oxide (TiMMO) counter electrode. The current was continuously monitored using a 1 kOhm shunt resistance and a high accuracy Fluke Hydra 2638 A voltmeter (Fluke, Everett, WA, USA).

2.3. Gravimetric Measurements

The coating water uptake by the free membranes versus time was quantified by gravimetric measurements using an analytical balance (Sartorius MSE150, Sartorius, Göttingen, Germany) with a readability of 0.01 mg. The free membranes were kept fully immersed in the tested solutions (deionized water, without or with NaOH, at different pHs) and weighed periodically. The surface of the coupons was dried with a soft tissue prior to weighing. The mass gain absorbed by the free membranes was calculated as:
m t × 100 m 0 100
where mt is the mass of the wet specimen at time t, and m0 is the mass of the dry specimen.
At the end of the test, the free membranes were left to dry in the atmosphere for one week and then dried in a ventilated oven (40 °C) until the mass loss stabilized. Three replicates were used.

2.4. Characterization

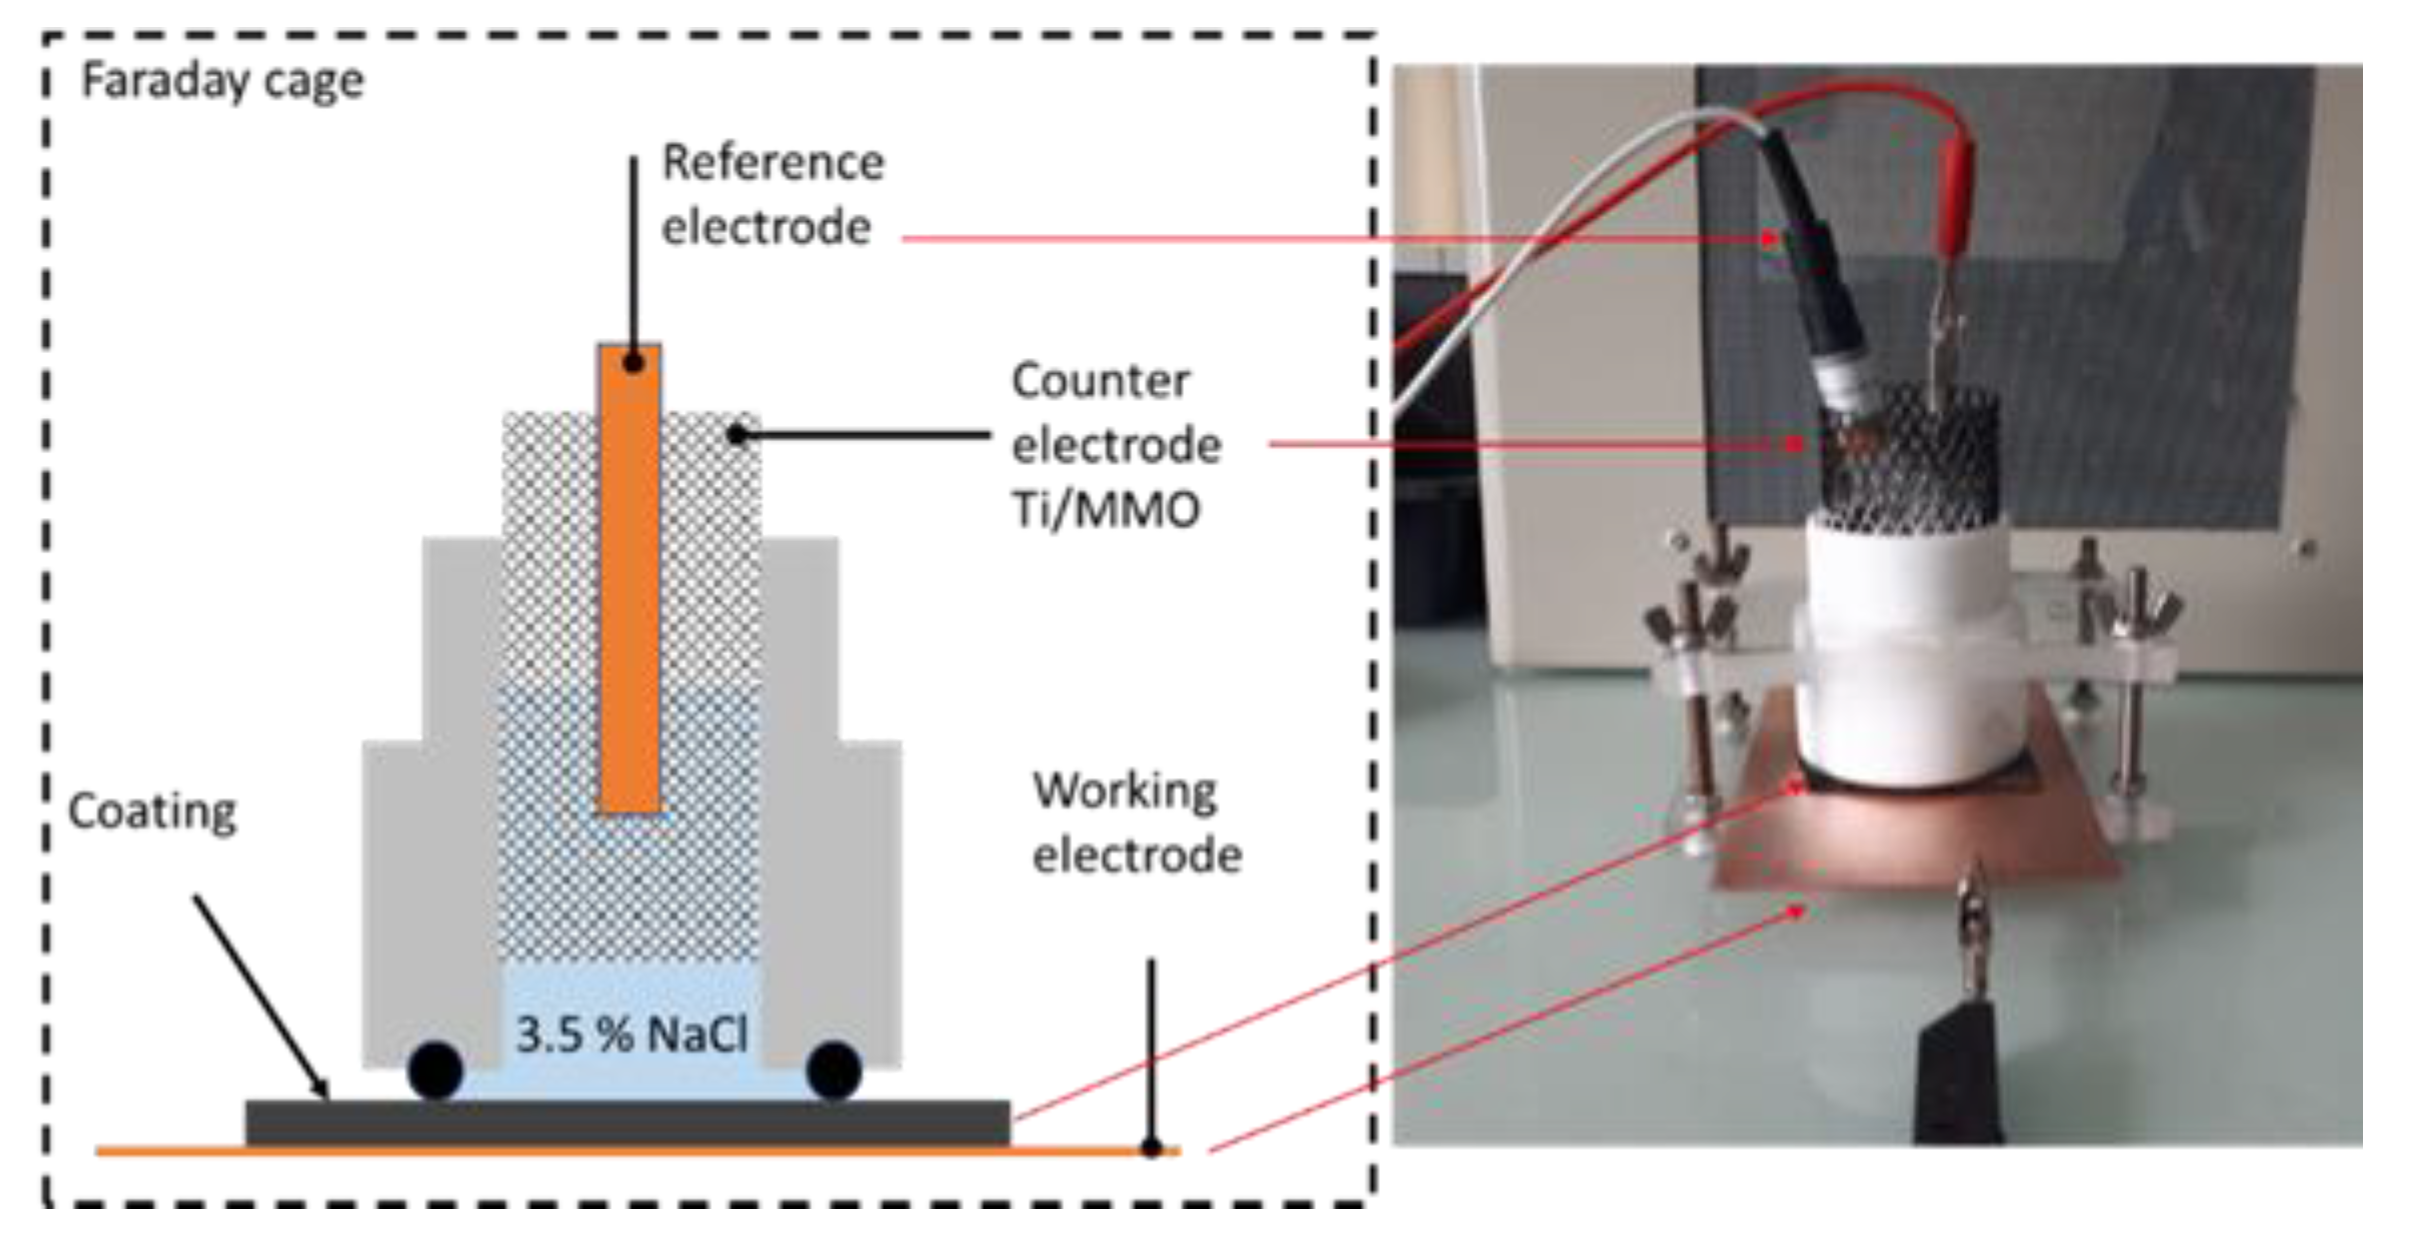
2.4.1. Electrochemical Impedance Spectroscopy (EIS)

The EIS cell consisted of a Teflon mounting cell, a Ti/MMO (titanium mixed-metal oxides) grid as a counter electrode, a saturated calomel electrode (SCE) reference electrode, and a 3.5% NaCl electrolyte, as presented in Figure 2. For the free membranes, a freshly polished copper plate was used as a conductive substrate. The cell was installed in a Faraday cage to limit noise from the surrounding environment. The exposed surface corresponded to 9.3 cm2. The EIS measurements of the free membranes were carried out after 1 month, 3 months, 6 months, 12 months, and after the drying step at the end of the exposure. The measurements were performed using a 20 mV amplitude within a frequency range from 106 Hz to 10−2 Hz using a Gamry Ref600 potentiostat (Gamry, Philadelphia, PA, USA). Three replicates were used.
For the coated steel samples, the EIS measurements were performed directly on the experimental setup at the end of the test. In addition, at the end of the test and after dismounting, the samples were cut to fit into the Faraday cage, and additional EIS measurements were carried out. Two replicates were used.

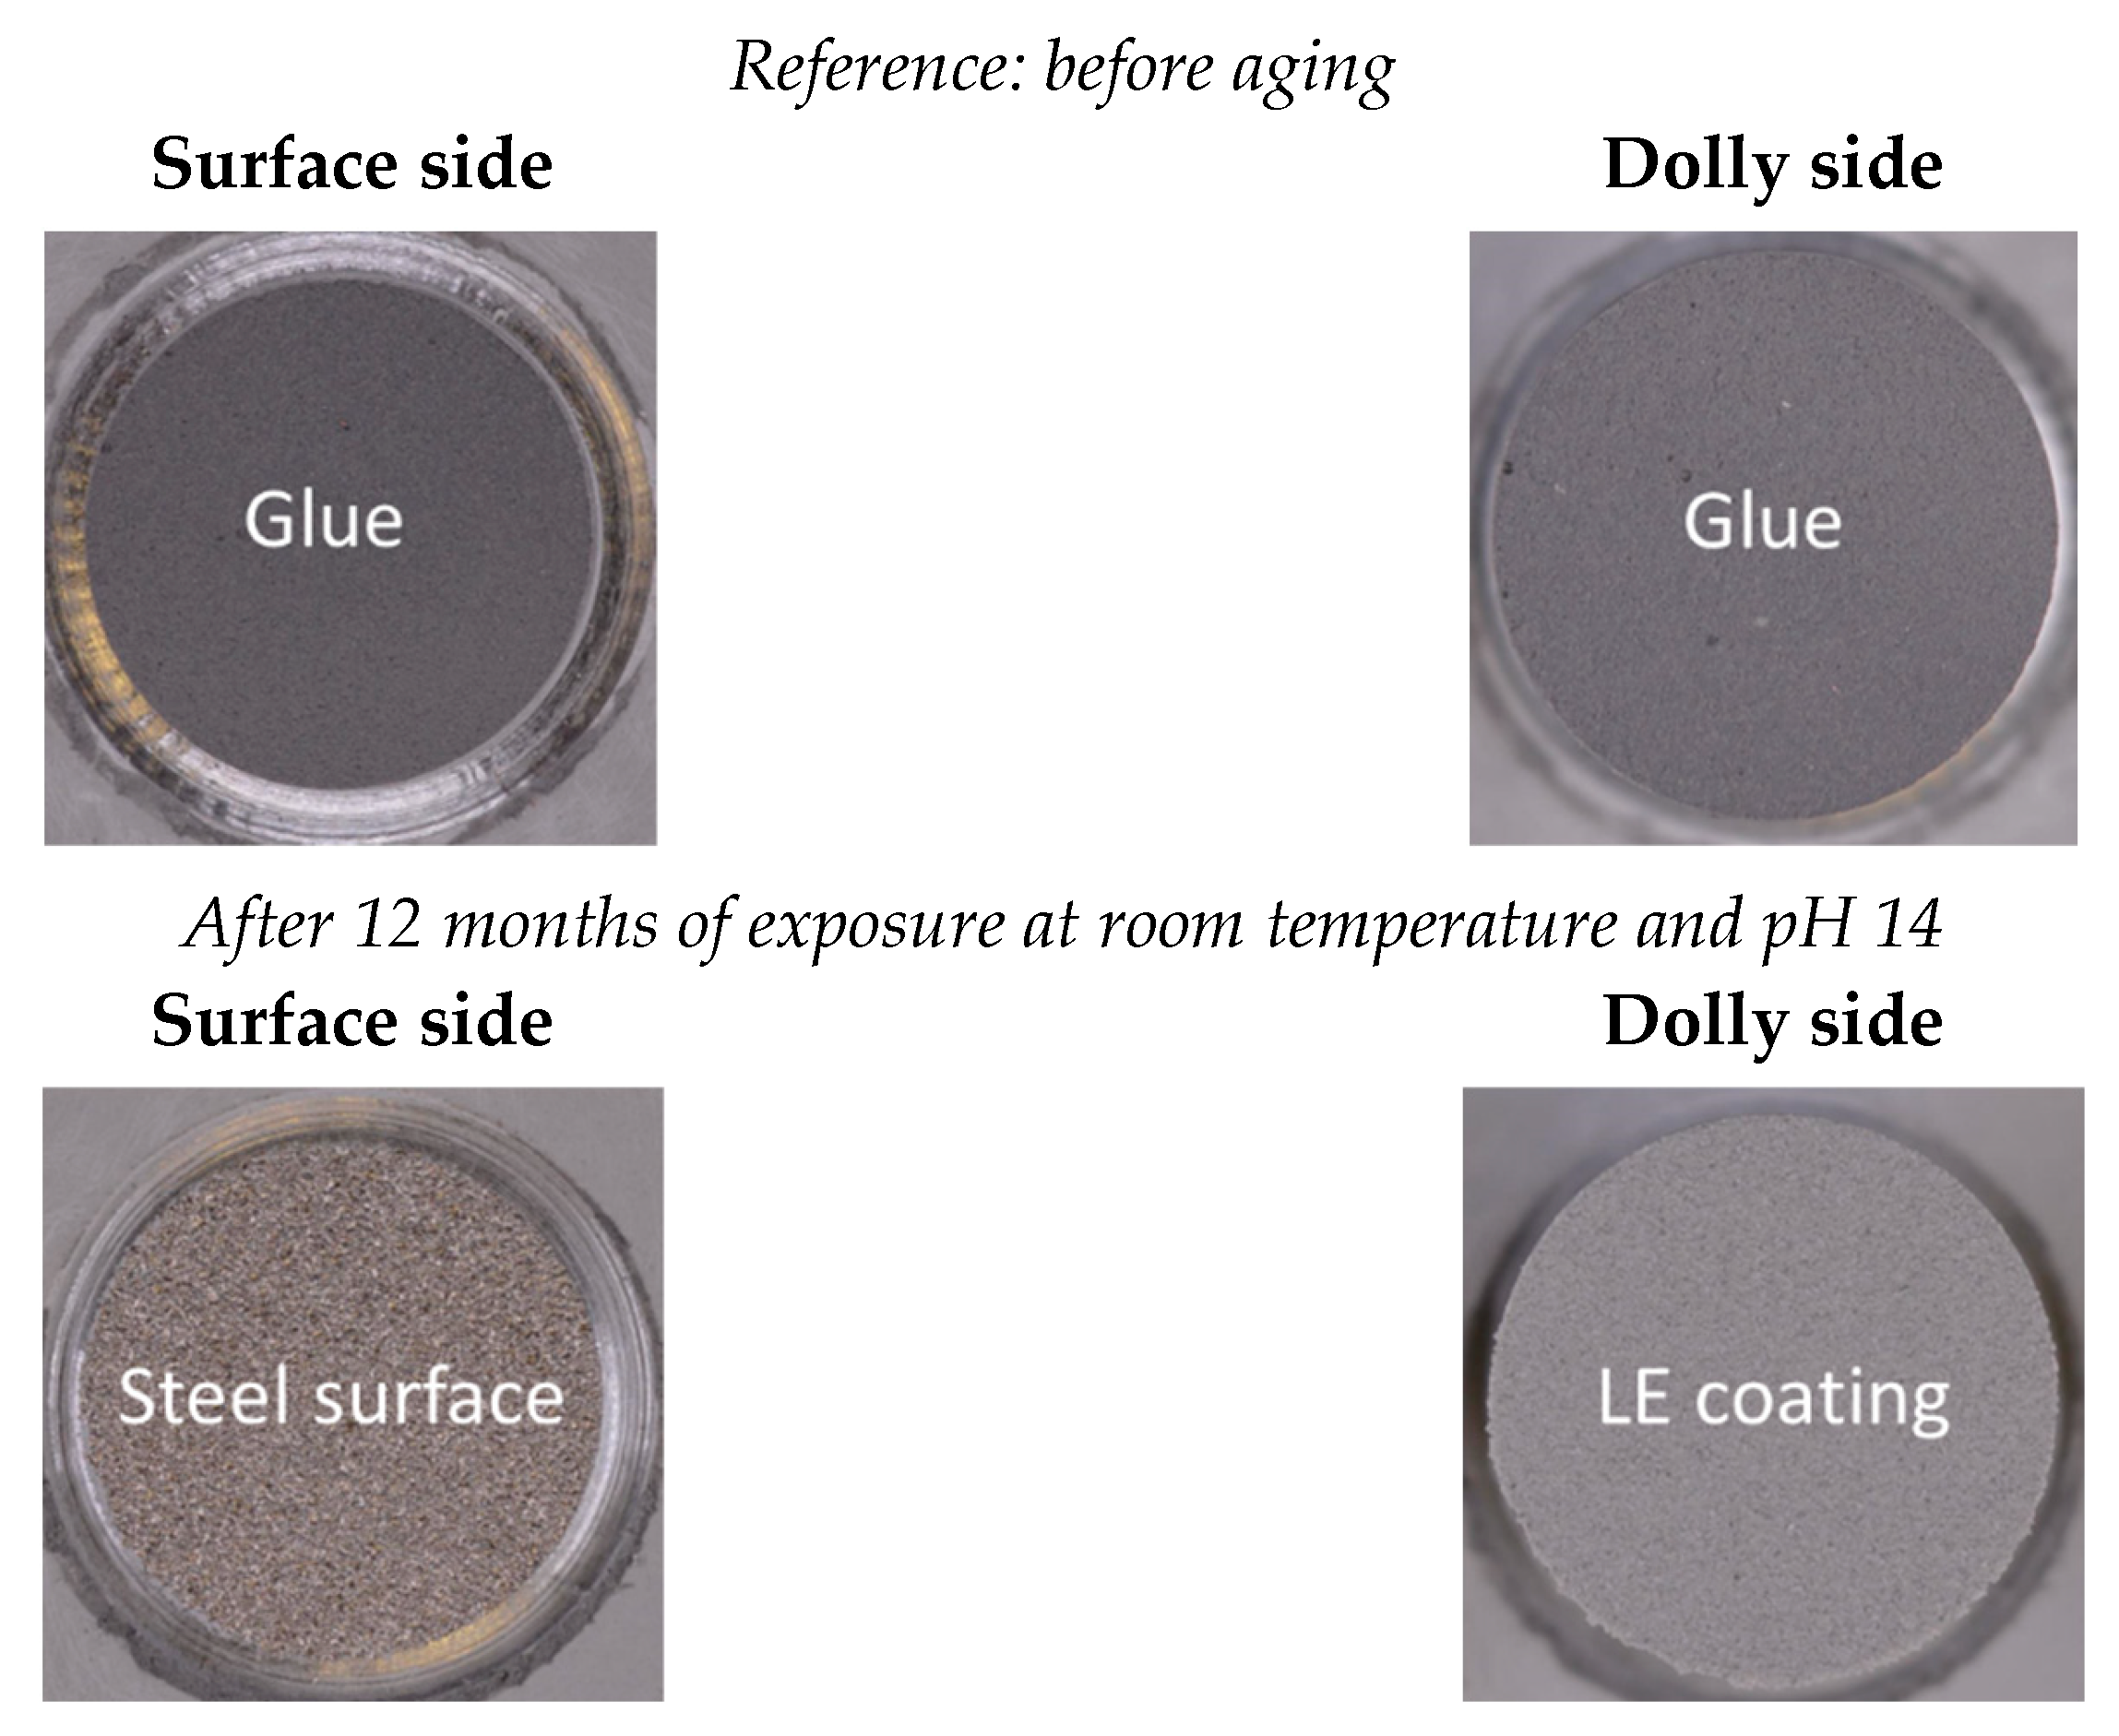
2.4.2. Adhesion Test on Coated Samples

The adhesion of the coated steel samples was measured according to the ISO 4624 standard, which is a pull-off test [22]. The basic principle of this adhesion test is to attach a pulling device (a stub or a dolly) to the coating with glue and then to apply a force to it in a direction perpendicular to the painted surface until either the coating pulls off of the substrate or failure occurs within the coating layers. The pull-off test was carried out several weeks after the end of the test, providing information about the dry adhesion. Dollies with a 20 mm diameter were glued to the surface with an Araldite 2013 adhesive. The test was performed after a 24 h drying phase at ambient temperature. Before the application of the adhesive, the coating was slightly eroded with an appropriate abrasive paper to allow for a better mechanical interlocking.

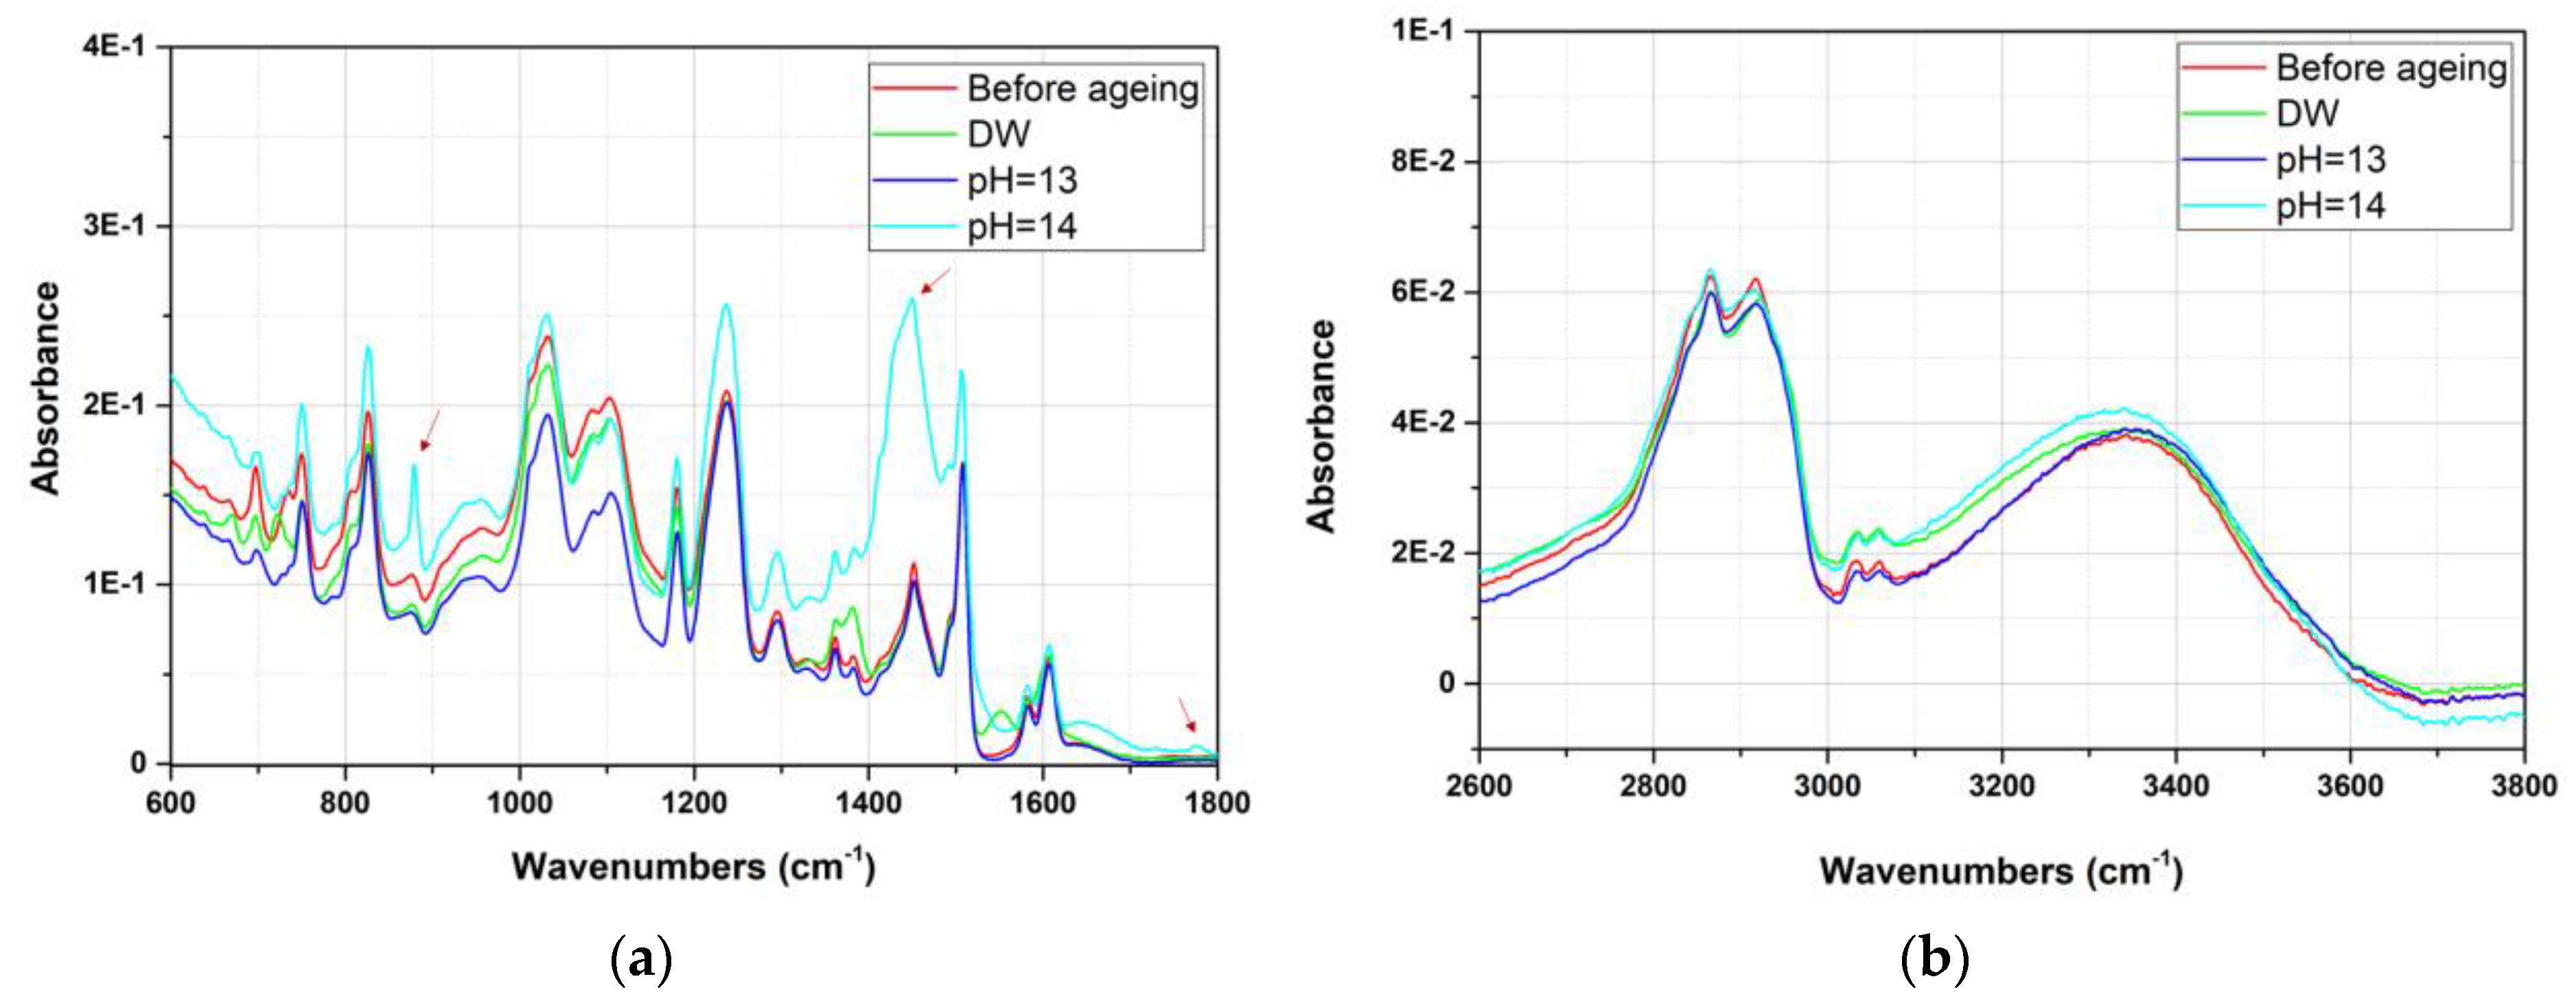
2.4.3. Characterization of the Aging of the Free Membranes

The free membranes were analyzed using a Raman confocal spectrometer from Renishaw, Wotton-under-Edge, UK (inVia Qontor model) equipped with a TE-cooled CDD camera (1024 × 256 pixels). Measurements were performed with a 785 nm laser source and a 50× (long range) objective with a numerical aperture of 0.65. The laser power was maintained at 2.6 mW to avoid samples degradation upon irradiation. The synchroscan mode was used, with 2 accumulations and 12 s of acquisition time per point. The size of the mapping was 40 × 40 µm2, with 2.5 µm between each point (288 points of analysis). At least two mappings were performed for each sample. The results presented are representative of the sample signature.
The typical Raman spectra of the LE before exposure is presented on Figure 3. It consisted of vibrational peaks from the polymeric matrix close to 1003 cm−1, between 1100 cm−1 and 1500 cm−1, close to 1587 cm−1, around 1610 cm−1, and between 2800 cm−1 and 3200 cm−1 [23,24,25]. The signal at 1003 cm−1 could also come from toluene or xylene, which are commonly used as solvents in liquid epoxy formulations [26,27]. Titanium dioxide was also observed near 446 cm−1 and 615 cm−1, which corresponded to the rutile phase, in accordance with XRD measurements [28,29,30]. Typical signals of a carbonate, most likely MgCO3, was also spotted at 1097 cm−1 [31]. The low frequency region also allowed the presence of clinochlore at 193 cm−1 [32,33]. The other Raman bands of the clinochlore, at 360 cm−1 and 675 cm−1, were overlapped with Raman bands from other coating components. The Raman band at 1610 cm−1 was used as an internal reference for intensity normalization, as it was not impacted by aging.
Infrared analyses were performed on a Thermo Nicolet 8700 FT-IR spectrometer (Thermo Electron Scientific Instruments, Madison, WI, USA), equipped with a KBr beam splitter and a DTGS detector. The infrared spectra were recorded in ATR mode using a GladiATRTM ATR accessory (Pike Technologies, Fitchburg, WI, USA) with a diamond crystal. The spectral resolution was 4 cm−1, and the acquisition time was 1 min. At least five replications were used for each sample.
In addition, XRD analyses were carried out using PANanalytical Empyrean apparatus (Malvern Panalytical, Malvern, UK) with CuKα radiation (1.5408 Å) in order to identify the mineral fraction. The LE was only analyzed at pH 14, before and after aging. SEM investigations were also performed using a Hitachi SU 3500 (Hitachi, Tokyo, Japan) with an EDX ThermoScientific NSS 312 (Thermo Fisher Scientific, Waltham, MA, USA). Cross-sections of the free membranes exposed to deionized water and solution at pH 14 were analyzed in backscattering mode at 5 keV. The cross-sections were made by cutting a portion of the LE membrane and then embedding it in an IP epoxy resin (ambient reticulation), grinding it with SiC 220, followed by polishing it down to 0.04 µm with diamond paste.
After the end of the test at room temperature, the solution in which the free membranes were aged was analyzed to highlight a possible leaching of organic and/or inorganic compounds. The presence of the total organic carbon, silicates, Ca, Mg, and Ti was measured according to NF EN 1484 [34], NF ISO 15923-1 [35], NF EN ISO 15587-1 [36], and NF EN ISO 11885 [37], respectively.

3. Results

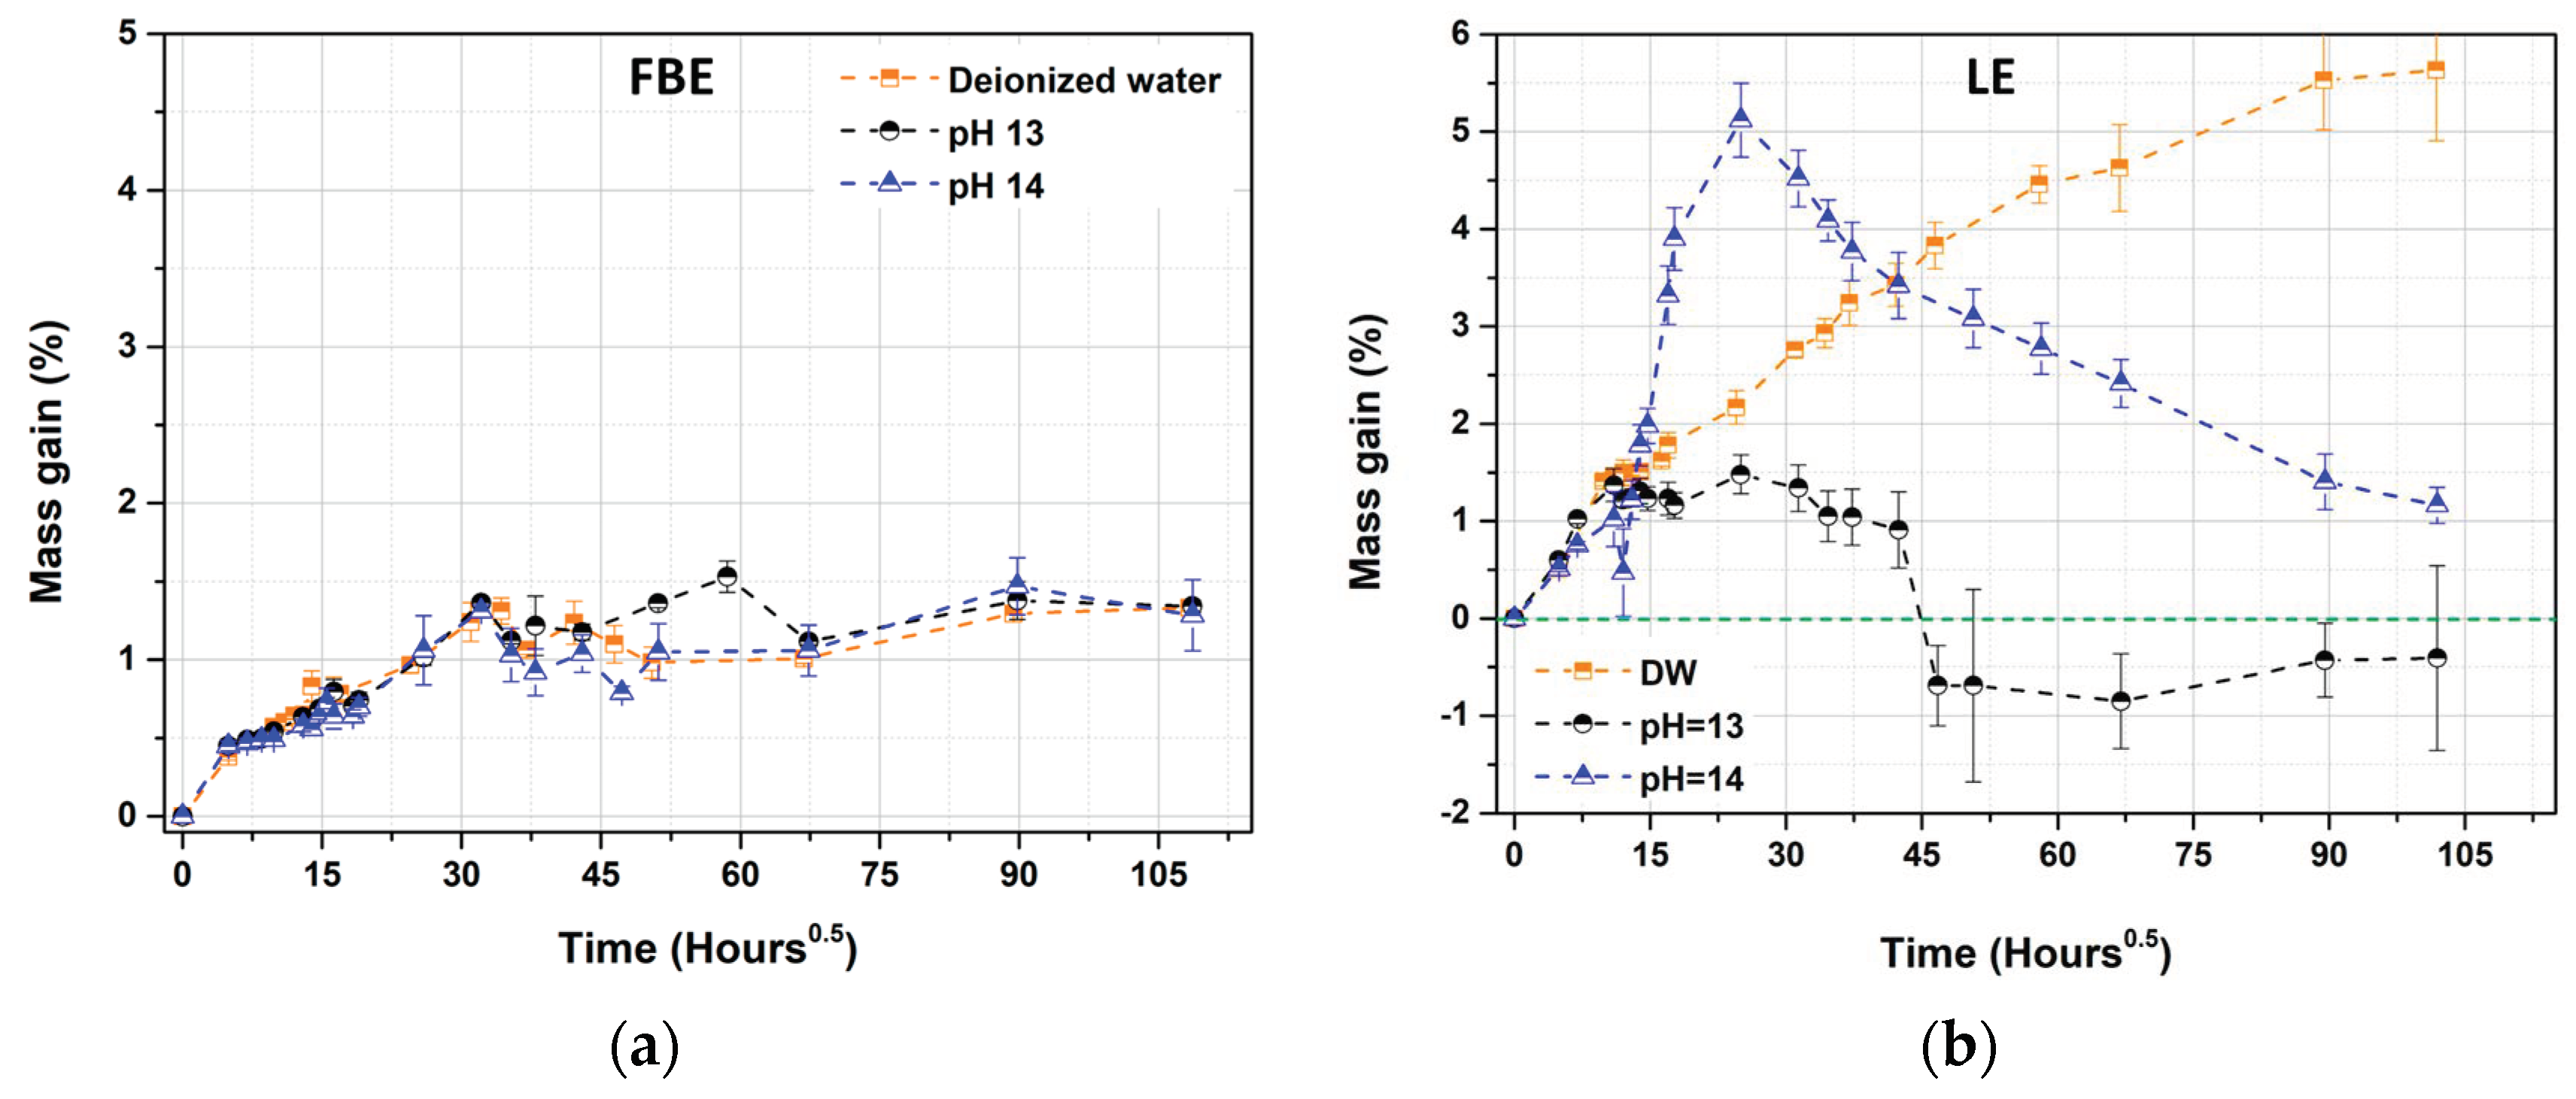
3.1. Aging Effect in Deionized Water

Before evaluating the pH effect on a possible polymer aging/degradation, the effect of immersion in deionized water was studied at room temperature. It is well known that a “simple” aging in water can induce polymer aging [38,39,40,41,42]. Water uptake can generate reversible (swelling, plasticization, etc.) and irreversible (hydrolysis of reversible groups, etc.) changes, affecting the performance of the polymer [43,44,45].
The evolution of the mass gain as a function of the square root of the time of exposure in deionized water at room temperature is shown in Figure 4. The two polymers exhibited different behaviors. A Fickian-like process was observed for the FBE membrane, whereas the behavior of the LE membrane was more similar to a Langmuir process.
In the case of the FBE membrane, two major stages were observed. The first stage, characterized by a fast mass gain, seemed to be controlled by diffusion. Epoxy polymers are permeable to water due to the free space existing between their molecular chains into which water molecules can diffuse [38]. The second stage was characterized by an equilibrium, between 1.2% and 1.5%, with a mass change rate close to zero right after the initial fast mass gain. After drying, for the FBE polymer, a near-zero value was obtained, showing no chemical interaction between the water and the polymer, as all the absorbed water was released [46]. It can be assumed that only reversible events, such as plasticization or swelling, occurred during the exposure. All the water absorbed was most likely weakly bonded through the establishment of weak energetic bonds, like Van der Waals or hydrogen bonds.
Two stages were also observed for the LE membranes. The first stage was similar to that for the FBE membrane, with a fast mass gain between 0 and 5 days. It was followed by a second stage, characterized by a constant mass increase at a slower rate until about 400 days (~100 h0.5), achieving a 5.5% mass gain. As for the FBE, the first stage was controlled by diffusion, as opposed to the method in the second stage. Despite diffusion being the main water uptake transport in epoxy polymer, a more complex phenomenon can also be observed due to, for example, a possible irreversible change of the epoxy polymer resulting from the action of water, like hydrolysis, lixiviation of components, etc. [38,39,40,43,44,45,46]. The continuous mass increase observed showed that a water saturation of the polymeric matrix was not reached, indicating a Langmuir-like process. Langmuir adsorption is common in a filled polymer where micro-cavities can be formed at the polymer/filler boundary, inducing water accumulation, e.g., blistering [43,47]. The absence of a water saturation plateau right after the initial fast mass gain could also be explained by (i) a limited water diffusion in a highly crosslinked polymer [40], (ii) a possible consumption of water molecules by a hydrolysis process, and/or (iii) an increase in the hydrophilicity of the polymer, or (iv) a decrease in the crosslinking density [38]. After one year of exposure at room temperature, the obtention of water saturation was not attained, which is consistent with the literature data, in which it was shown that a continuing water uptake for several years could occur [43]. The degradation of the LE membranes by immersion in deionized water was confirmed by the obtention of a significant mass loss (−3%) after drying at the end of the exposure. This mass loss was explained in the literature by a leaching process and the release of soluble species like polar plasticizers, and the extraction of non-cured polymer chains and/or polymer fragments due to polymer degradation [38,39]. Analysis of the solution used for the immersion has shown that the polymeric matrix has released organic compounds (1428 mg.L−1), as well as Ca2+, Mg2+, and traces of Ti4+ (below the quantification limit), all cations possibly resulting from filler leaching. Furthermore, the pH of the solution was measured, and a pH greater than to 10 was found. By comparison, the solution in which the FBE was immersed has only released traces of organic compounds (14.08 mg.L−1) and traces of Ca2+, Mg2+ and Ti4+ (all below the quantification limit).
The irreversible degradation of the LE was also highlighted using microscopic observations by SEM using cross-sectional configuration (see Figure 5). The formation of cavities and the hint of mineral filler attack were observed. EDX analysis revealed that the mineral fillers attacked were most probably made of dolomite (CaMg(CO3)2) or lizardite (Mg3Si2O5(OH)4). The cross-sectional geometry showed that the degradation occurred in the bulk of the LE, and not only at the surface (which was in contact with the aging solution).
Additional characterization was performed by Raman spectroscopy in an attempt to highlight polymer degradation or changes in the mineral fraction. From previous results, the distribution of the mineral fraction (TiO2 and MgCO3) upon aging was investigated as shown on Figure 6. Thus, the band area of the attributed species was integrated and normalized with the intensity of the 1610 cm−1 signal. In addition to the mineral fraction, the band amplitude at 1003 cm−1, typical of the aromatic cycle, also appeared to be impacted by aging, indicating a possible polymer degradation or leaching of the solvent.
A homogeneous distribution of the resin (b), as well as TiO2 (c) in the resin, was observed for the non-exposed sample, whereas the MgCO3 (d) distribution seemed more local. After immersion in deionized water, the aspect of the LE (e) began to change, but it was not drastically different. When looking at the distribution of the signal at 1003 cm−1, it seemed that its intensity was a bit decreased, but its distribution was still homogeneous. The same conclusion was drawn for the distribution of TiO2. The distribution of MgCO3 was still highly localized, but when looking at the intensity scale, the intensity was higher than for the reference. This could indicate a carbonatation process occurring through the dissolution of other phases in the polymer and the reprecipitation of MgCO3. As noticed previously, a possible dissolution of dolomite CaMg(CO3)2, due to the alkalinity of the solution, is occurring, even for immersion in deionized water, and the susceptibility of dolomite to the alkaline solution was suggested in the literature [48].

3.2. Aging Effect of Alkaline Solution at Different pH

Immersion in deionized water at room temperature has shown the susceptibility of LE to leaching and degradation, and on the contrary, the stability of the free membrane of FBE. Next, the possible effect of alkaline pH induced by a cathodic protection environment on the aging of the coating must be studied. The use of NaOH was motivated by the predominance of Na in the corrosive environment and in the coating qualification tests (NaCl). Thus, the free membranes were exposed to a solution of NaOH at pH 13 and pH 14 at room temperature.
The evolution of the mass gain versus the exposure time for the FBE and the LE samples in deionized water, with and without NaOH, at room temperature is represented in Figure 7. No real difference was noted between immersion in deionized water, with and without NaOH, showing the low susceptibility of the free membrane of FBE to alkalinity (see Figure 7a). The alkalinity of the aging solution did not change the process of water uptake, which still follows a Fickian-like process. Even the final mass gain was of the same extent, i.e., between 1.2% and 1.5%. After drying, all the absorbed water was desorbed, and no significant mass loss was observed. Analyzing the solution phase after the end of exposure revealed only traces of organic and inorganic compounds at the same level as that observed for immersion in deionized water. Further characterization by infrared or SEM observations did not reveal signs of polymer degradation or attack of the mineral fillers (see Supporting Information).
On the contrary, increasing the alkalinity of the aging solution had a significant impact on the behavior of the LE samples. Three profiles of water uptake were obtained as a function of the alkalinity (see Figure 7b). Unlike the results for immersion in deionized water, a clear mass loss was observed at pH 13 and 14 (black and blue curves). For pH 13 (black), several stages were observed, including an initial fast mass gain, showing water absorption controlled by diffusion (0–5 days), a pseudo plateau, translating a first water saturation phenomena at 1.5% of mass gain (5–50 days), followed by a rapid mass loss with a negative slope (50–75 days), and finally, a stabilization around −0.5% of mass gain. This most likely indicated a significant mass loss and was surely linked to a leaching process, as previously highlighted by immersion in deionized water [38,39,40,43,45,46]. Leaching due to the action of the pH was also evidenced by Yin et al. [49] on vinylester resin. Leaching of plasticizers from the coating formulation was also demonstrated by Roggero et al. [50]. A change in the coating film thickness could also have contributed to this negative mass gain.
For the highly alkaline solution at pH 14, several stages in the water uptake were observed, with a mass gain first observed between 0 and 5 days. It was controlled by diffusion, with a mass gain of about 1.5%, which was similar to the first stage observed for immersion in deionized water and in pH 13. The initial water absorption thus appeared not to be impacted by the alkalinity. This stage was followed by a second mass gain at a slightly lower rate, between 5 and 26 days, of about 5% (close to values observed for deionized water), the last stage being a constant mass loss, with no stabilization, even after 430 days of exposure.
The influence of the pH on the water uptake is not clearly demonstrated in the literature and seemed to depend upon the chemical nature of the polymer [45,51]. For pH 13, the mass gain never reached the values obtained for deionized water, in contrast to what was observed for the pH 14 solution. Competitive phenomena between water uptake and the membrane degradation might explain these values [39]. This suggestion is supported by solution analysis and the mass loss obtained after drying. A clear difference between water immersion and the alkaline solutions was observed, with a higher mass loss around −10% for the alkaline solutions (−3% for deionized water). At pH 13, organic compounds were detected but at the same level as for the deionized water (1475 mg.L−1 and 1428 mg.L−1, respectively). Unfortunately, the determination of the organic compounds leached for the pH 14 was not possible due to the high pH of the analyzed solution. Traces of Ca2+, Mg2+, and Ti4+ (all under quantification limits) were also detected, but their quantification may have been hindered by the alkalinity of the solution. At pH 14, the polymer degradation may have happened so fast that it left some free space for water uptake. Silicates are known to be sensitive to pH, and their dissolution rate can increase with the pH [51]. Unfortunately, solution analysis to measure silicates was not possible due to the high pH of the solution, even for deionized water, despite the attempt to lower the pH with the addition of acid.
The possible polymer degradation was investigated using of infrared spectroscopy. Free membranes of LE aged in deionized water, at pH 13 and pH 14, were characterized, and the obtained results are represented in Figure 8.
No sign of hydrolysis was observed, regardless of the conditions considered (see Figure 8b). Furthermore, no sign of hydrogen bonds was observed, even though this was expected [52,53]. This can be explained by the dry state of the film, as the infrared analysis was carried out several days after the end of the test, preventing the collection of information about the water content in the film. Gravimetric measurements during the drying of the free membranes after testing revealed that even a simple drying under laboratory conditions led to significant desorption. The only change in infrared spectra was observed for pH 14 near 880 cm−1, 1440 cm−1, and 1775 cm−1, and this was most certainly linked to a possible enrichment in MgCO3 [54,55]. This enrichment in MgCO3 could be linked to the dissolution of other phases like CaMg(CO3)2 in alkaline media [48]. As for immersion in deionized water, a hint of mineral filler dissolution was observed by SEM (see Figure 9). In addition to this dissolution, traces of cavity formation, delamination between the filler and the polymeric matrix, and cracks were noted. EDX analysis of the mineral fillers confirmed that the mineral fillers dissolved by the action of the pH were most likely CaMg(CO3)2 and lizardite, the same as the results observed in deionized water.
The distribution of MgCO3, TiO2, and the band amplitude at 1003 cm−1 (aromatic cycle) were also followed by Raman spectroscopy, as represented in Figure 10. After aging at pH 14, the surface of the LE (e) was highly impacted by the aging and became rough. Some bending of the samples was also observed due to immersion (which was also seen for deionized water), and the samples were more fragile and brittle. In regards to the distribution of the 1003 cm−1 (f), clear spots (in blue), with lowered intensities, were observable showing areas depleted in phenyl signals, indicating polymer degradation or leaching of the coating component. The principal component of the polymeric matrix being the epoxy (DGEBA containing aromatic ring), it is logical to first think that this variation is linked to the matrix. However, no other signs of degradation of the polymeric matrix were observed, either by infrared or Raman measurements. When leaching from epoxy matrix was seen in the literature and analysis carried out on the solution in which the coupons were exposed, it was found that other components, like residual solvents, unreacted hardener, plasticizers, etc., could be leached [38,39,50]. It is then more plausible that the variation observed was linked to the residual solvents or plasticizers.
The distribution of depleted areas of TiO2 (g) correlated with the area of depleted phenyl. Concerning MgCO3 (h), again the distribution was still highly localized, with a higher intensity scale than that for the reference, but lower than for the aging in deionized water. The enrichment in carbonates (MgCO3 and CaCO3) was confirmed by XRD measurements. Additional enrichment of clinochlore was also observed. It should be noted that after aging, no more lizardite was detected by XRD, which could mean that it was dissolved by the aging.

3.3. Impact of Aging in Alkaline Media on Coating Performance

Following the evolution of the coating impedance with time, through the measurement of the coating resistance, Rc seems to be a relevant approach for determining coating aging, at least in terms of electrical behavior. This parameter is already used on site as acceptation and coating quality criteria for different standards [56,57,58]. The impedance modulus at low frequency, obtained by EIS and coating resistance (Rc), can be linked by fitting EIS data with an equivalent circuit by fixing the value of the capacitance. A decrease in coating resistance leads to the appearance of an impedance plateau at low frequency. For a constant capacity, in a given frequency range, the higher the coating resistance, the sharper the impedance plateau at low frequency.

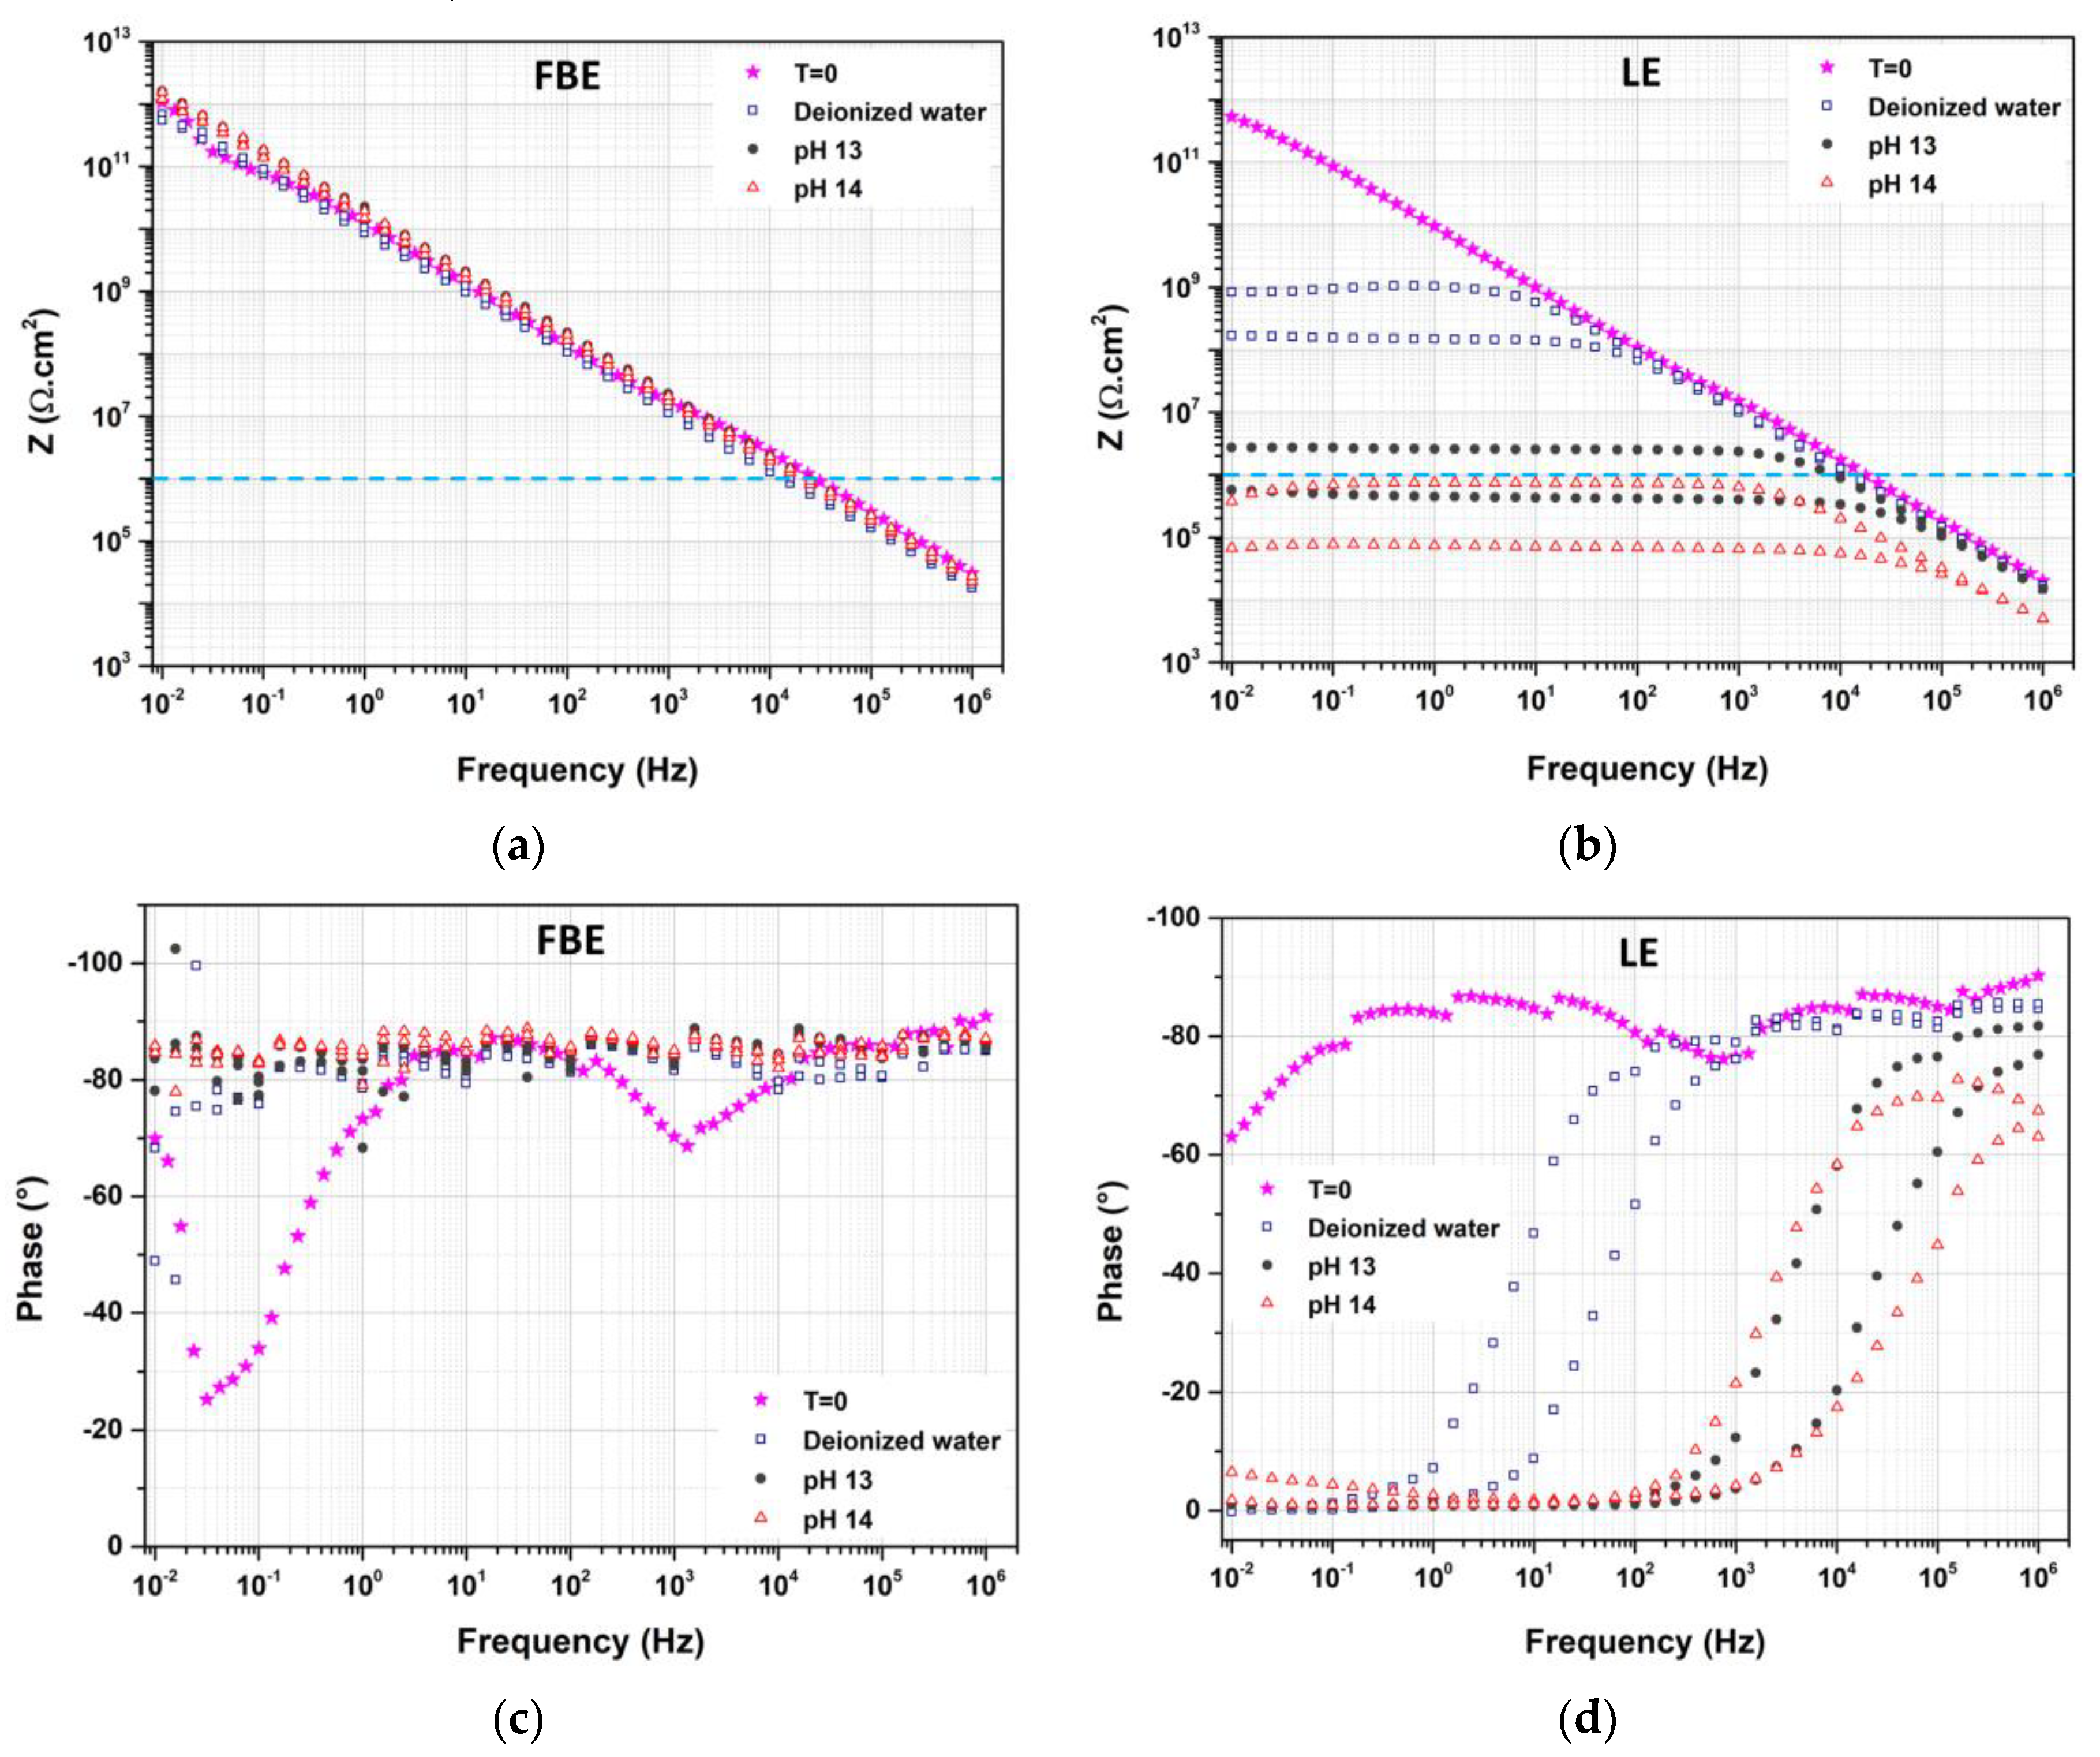
3.3.1. Free Membrane Configuration

The Bode plots (impedance modulus and phase angle), as a function of the time of exposure for free membranes of FBE and LE in deionized water at room temperature, are reported in Figure 11. The degradation of the LE due to exposure in deionized water had an impact on the barrier properties of the polymer, as shown in Figure 11. For both membranes, before exposure (pink star), a linear decrease in the impedance at a logarithm scale from 10−2 to 106 Hz, with no visible plateau, was observed. This indicated a capacitive behavior, i.e., a highly resistant coating associated with good ionic barrier properties [21,59,60]. This capacitive behavior is also visible on the phase angle plots, where the initial phase angle is around −90°. No significant change in the impedance modulus was seen for the free membrane of FBE as a function of the time of exposure. Some changes in the phase angles plots were observed, especially after 12 months of aging, which could suggest a decay in barrier properties in line with a slight decrease in the low impedance modulus.
For the LE free membrane, an impedance plateau at low frequency appeared, with the lowest value around 109 Ω.cm2, which is in line with the evolution of the phase angle. The impedance modulus decrease at low frequency can be associated with a reduction in the barrier properties of the coating, but they are not totally lost [61,62,63]. Indeed, the resistive part of the coating can be extracted from this region, representing the coating’s prevailing integrity [60,61,63]. Generally, coating failure is initiated when the low frequency impedance modulus drops below 106 Ω.cm2 [64]. This drop can be explained by the appearance of porosities in the coating due to water interaction, physically adding ionically conductive paths (microscopic pores or virtual pores) [21]. The change in the mineral fraction observed previously might explain the lowered barrier property of the free membrane of LE as part of the role that mineral fraction plays in water penetration. Vosgien Lacombre et al. [65] have evaluated the possible effect of pigment on water uptake and have shown that it might affect the extent of polymer swelling.
The Bode plots (impedance modulus and phase angle), as a function of the aging solution for the free membranes of FBE and LE, are reported in Figure 12. For the LE aged in a solution at pH 13 and pH 14, a plateau at the low frequency modulus was seen, with a modulus at low frequency lower than 106 Ω.cm2. This indicated a total loss of the barrier property. In addition to this drop of modulus at a low frequency, an increase in the capacitance was visible, particularly for the solution at pH 14. This capacitance increase might be linked to a higher water uptake at high alkaline pH (8.4% for deionized water, 8.8% at pH 13, and 9.4% at pH 14). Additional experiments (not shown) highlighted that the LE degradation was rapid in a solution at pH 14, as a total loss of barrier properties was observed after only 3 weeks of exposure. On the contrary, for the FBE, no significant loss of the barrier property was observed, regardless of the pH of the solution, which was in agreement with the results of other studies.

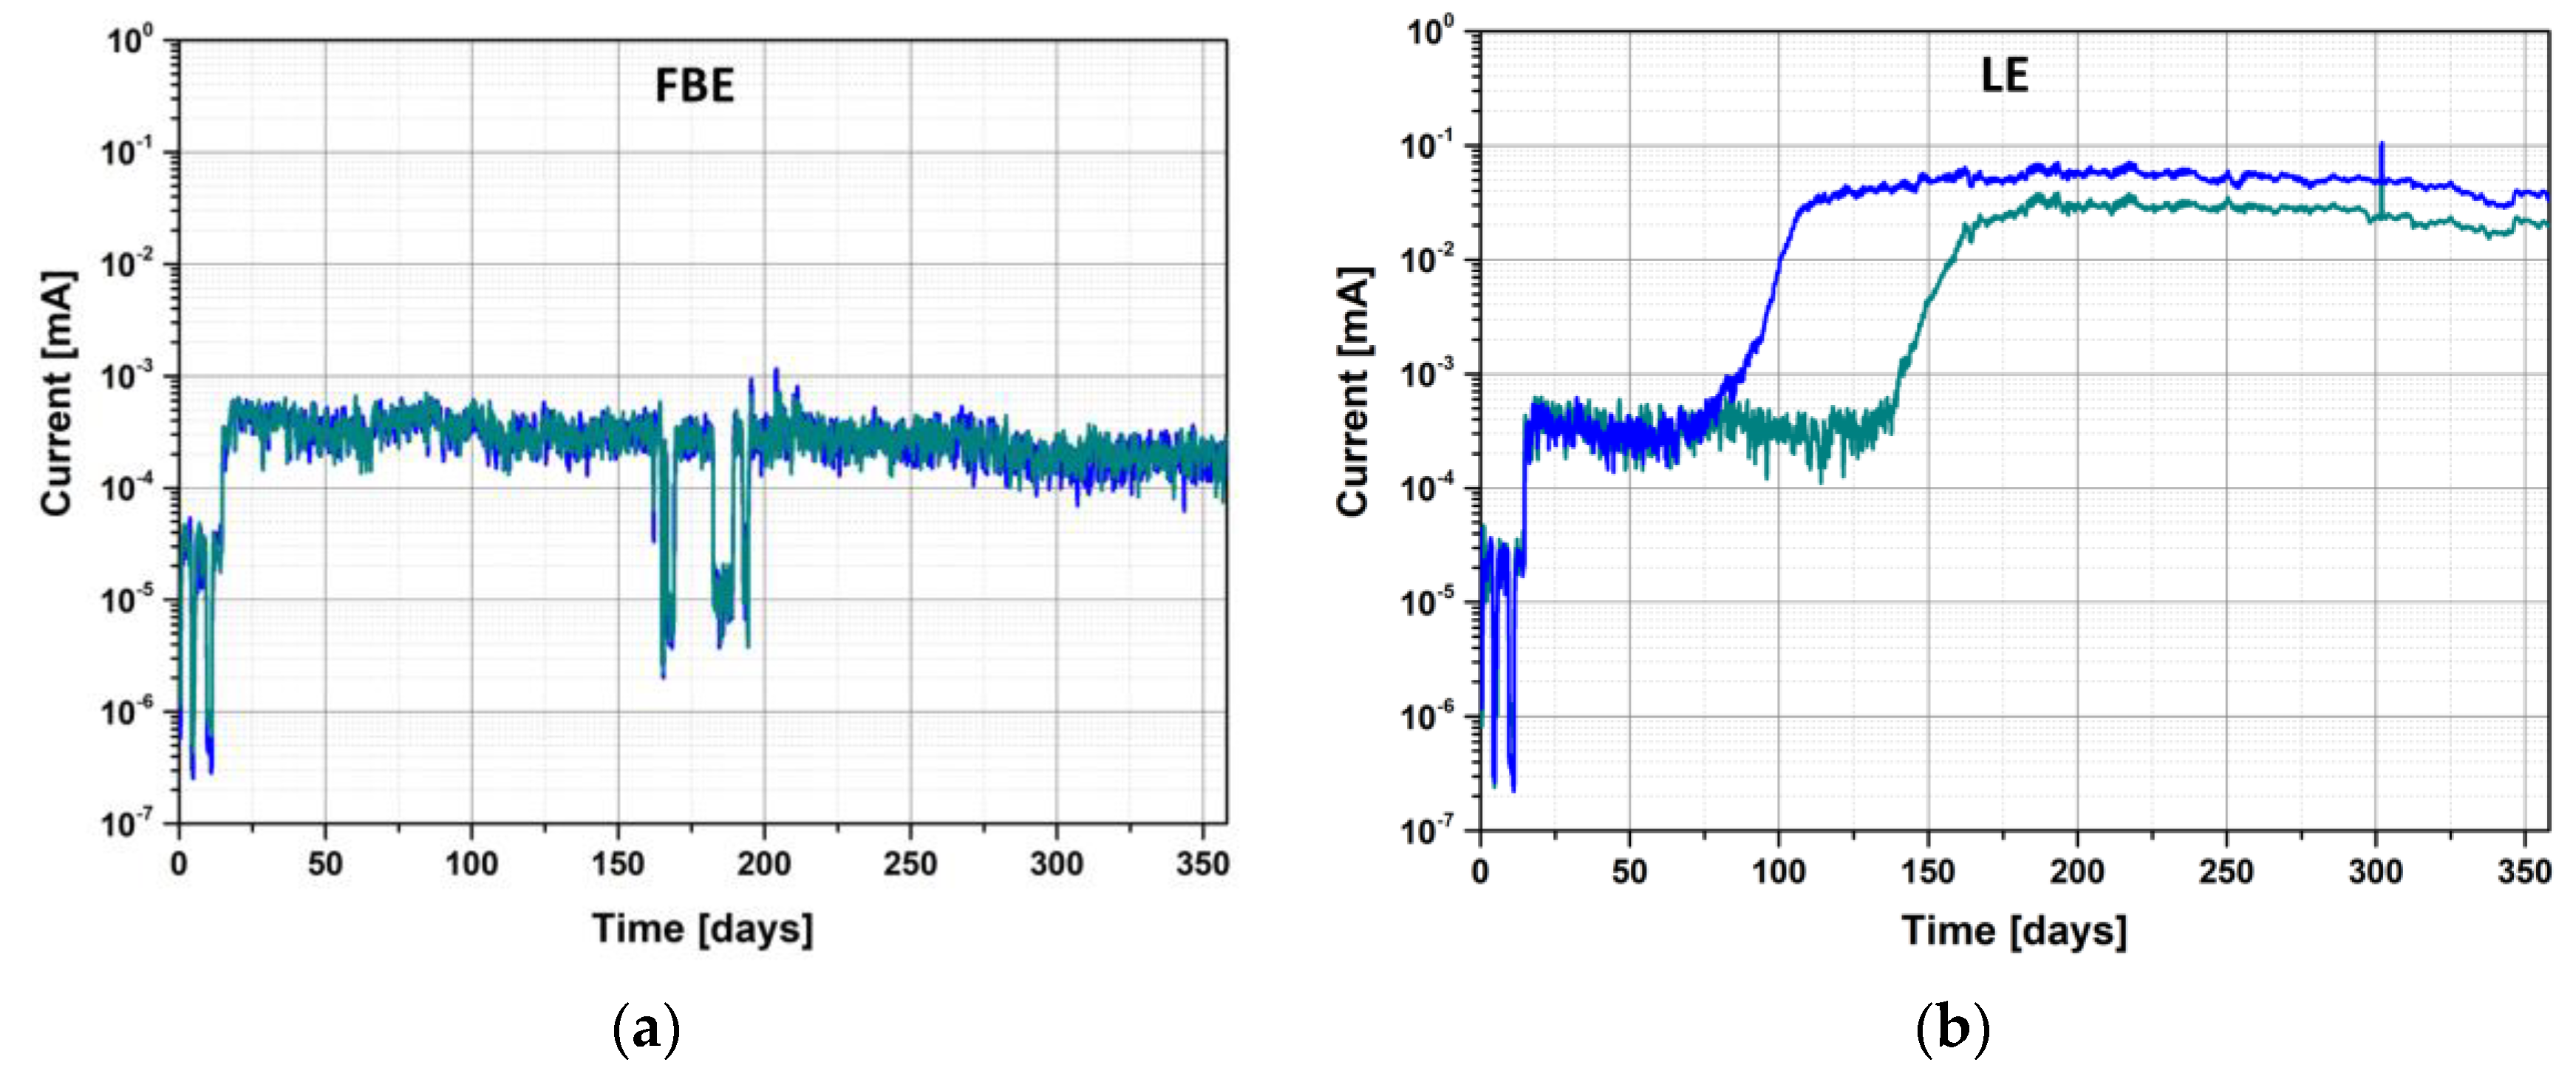
3.3.2. Coated Steel Configuration

The results for the free membranes showed that the tested LE could be impacted by alkaline aging, and its barrier properties could be reduced, whereas the FBE membrane remained quite resistant to this type of aging in terms of barrier properties. Considering these results, one might wonder if the coating would exhibit the same susceptibility when applied on steel, with only the external part of the coating (without defect and edges) exposed to the alkali environment.
The evolution of the current passing through the coating, as a function of the time of exposure for both coatings, is represented in Figure 13. No evolution of the current density was noted for the FBE, and the current values remained low, between 10−4 mA and 10−3 mA. This low current tended to show that the FBE was not impacted by the alkaline cleaning. The observed fluctuations (noise and drop to 10−4 mA) are attributed to experimental artefacts. On the contrary, for the LE, a significant increase in the current was observed between 60 and 145 days as a function of the replicate. The time to failure (current increase) was higher than that observed for the free membrane and is most probably linked to the fact that only one face of the sample was exposed to the aging solution.
This current increase was in agreement with a drop in the impedance modulus at low frequency and the appearance of a plateau, as shown in Figure 14a. At t = 0, the EIS spectrum was noisy especially, at low frequency, and was linked to the highly resistive behavior of the coated steel. As explained in the experimental section, after testing, the samples were cut to fit into the Faraday cage to confirm the results obtained directly from the experimental setup. The new EIS spectrum was recorded more than one month after the end of the exposure, which can explain the fact that the obtained impedance was higher, with no sign of a plateau at low impedance. This was most likely linked to the fact that the samples were in unsaturated conditions. When the low frequency modulus at 0.01 Hz was monitored for an aged LE at pH 14 and an unaged LE immersed in 3.5% NaCl (allowing the coating to be re-saturated in water), a drop in the impedance modulus at low frequency was observed, as represented in Figure 14b. After 12 h of exposition in 3.5% NaCl, the low frequency modulus for the aged LE (RT 12 months; pH 14) started to decrease, reaching values below the limit of 106 Ω.cm2 after 20 h of exposition, whereas the low frequency modulus of the unaged LE remained at high values. For the FBE, the impedance remained high, which was in agreement with the current monitoring.
The current monitoring and the EIS measurements suggested that upon aging, the LE lost its barrier properties. However, in the case of free membrane configuration, changes in the EIS spectra can be directly related to a change in the barrier properties of the coating, whereas in the coated steel configuration, the interface between the coating and the steel can play a significant role [66,67,68]. Indeed, Kittel et al. [66], using an experimental method for separating the inner and outer part of a coating, were able to highlight the importance of the interfacial region when it is actively participating in the protective action. In any case, a decrease in the coating barrier property can lead to more water uptake and the weakening of the interface, showing the close relationship between all coating properties. The pull-off measurements after testing clearly showed that the LE–steel interface was impacted by aging (see Figure 15). Before aging (Figure 15a,b), no interface failures were observed, and mainly high pull-off forces (>20 MPa) were obtained. After aging, only failures at the LE/steel interface were observed, and the pull-off forces dropped to values close to 7.0 MPa, on average. Thus, the drop in the low frequency modulus observed by impedance for the LE was most likely linked to a decrease in the barrier property due to aging, leading to a weakening of the steel–coating interface. Again, for the FBE, the effect of the pH was limited, and no differences, before and after aging, were observed with the pull-off test.

4. Discussion

The compatibility between coatings and cathodic protection is not only dependent on the ability of the coating to resist cathodic disbondment. Coating aging in the presence of an alkaline media must also be considered. This aging can have an impact on the water ingress, as well as the physical and chemical stability of the coating, ultimately affecting its macroscopic properties, and consequently, its capacity to protect steel [17]. Highlighting this impact requires the use of a multiscale and multi-technique approach. Water uptake measurements have proven to be a useful tool, especially when the coating is experiencing leaching, either from the coating degradation or from soluble compounds initially present. However, it was not sufficient, as it did not provide any information regarding the degradation mechanism or its impact on the macroscopical properties.
From the coatings tested in this study, two behaviors were obtained: either a resistance to alkaline media or a sensitivity to alkaline environments. In the case of the LE exposed to deionized water, a dissolution of mineral fillers supported by SEM-EDX and XRD analyses, with an enrichment in MgCO3 and a depletion of dolomite and/or lizardite, was identified as the main degradation mechanism. Raman mapping of the sample surfaces supports these results. The mineral fillers having a rather large size, ~30 µm on average, and their leaching could increase porosity. This increase in porosity led to a decrease in the barrier coating properties by adding more paths for electrolyte diffusion and weakening the steel–coating interface. The weakening or the steel–coating interface was evidenced by the adhesion test (pull-off), where a failure at the steel–coating interface was observed. In alkaline solutions, a similar degradation process was noted, but it was accelerated in comparison to the results obtained from immersion in deionized water. It also led to the observation of a higher mass loss for the alkaline solutions. For the FBE, regardless of the parameter considered (mass loss, barrier property, etc.), no sign of degradation was evidenced, either in deionized water or in the alkaline solutions. One would have expected some effect of the alkaline media, since both coatings were based on epoxy chemistry.
In the case of this work, it was not the chemical structure of the coating which was impacted by the aging, but rather the fillers and additives present in the formulation. Indeed, no clear trace of polymer degradation was found by spectroscopy analyses (infrared or Raman) for either coating (FBE and LE). On the other hand, in the case of the LE, the dissolution of the mineral fillers was clearly demonstrated. Most of the work in the literature focuses on the water uptake of epoxy resin with a particular hardener, or on the water uptake of a particular chemistry class [38,43,44,46]. Only few works integrate the influence of the other components, despite their importance in coating stability under aging [65,69]. The results obtained in this work show the importance of considering all the coating ingredients when studying industrial polymer degradation, as formulation of a commercial organic coating is complicated and can contain as many as 20 ingredients.
Despite the results obtained for the FBE and LE tested in this study, a general conclusion about the sensitivity (or the lack thereof) of the FBE/LE coating family to alkaline aging cannot be drawn. Since a coating is a complex system containing many components (organic binder, pigments, additives), all the obtained results are thus limited to the specific coating formulations and applications tested.

5. Conclusions

In this study, the possible impact of alkaline aging on two coatings: a fusion-bonded epoxy—FBE, and a liquid epoxy—LE, was investigated. These coatings were studied in two configurations, as free membranes and on coated steel. A multi-technical approach was used, combining mostly gravimetry study and electrochemical impedance spectroscopy, coupled with additional characterization employing several analytical tools. From the results, the following conclusions may be drawn:
  • The free membrane approach and methodology have been proven to an interesting way to show degradation under immersion and have a correlation with coated steel behavior.
  • For this FBE, no firm influence of the pH on polymer degradation was observed (for either a free membrane and coated steel).
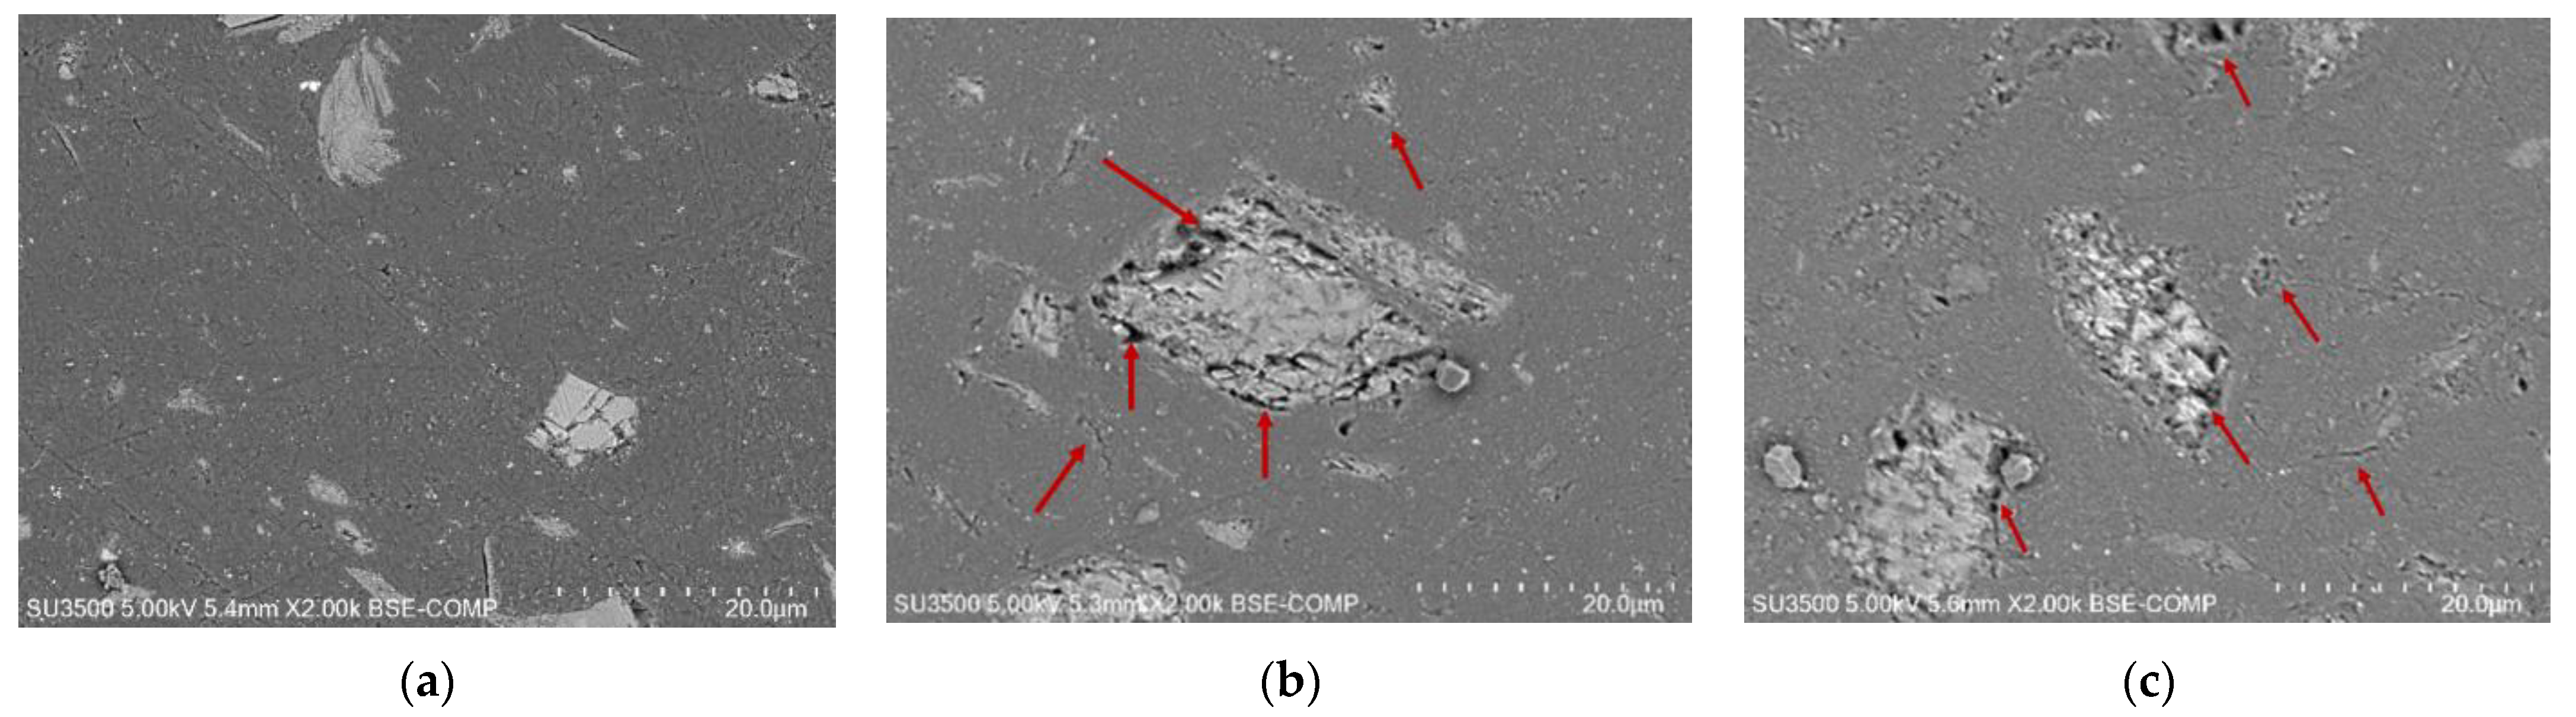
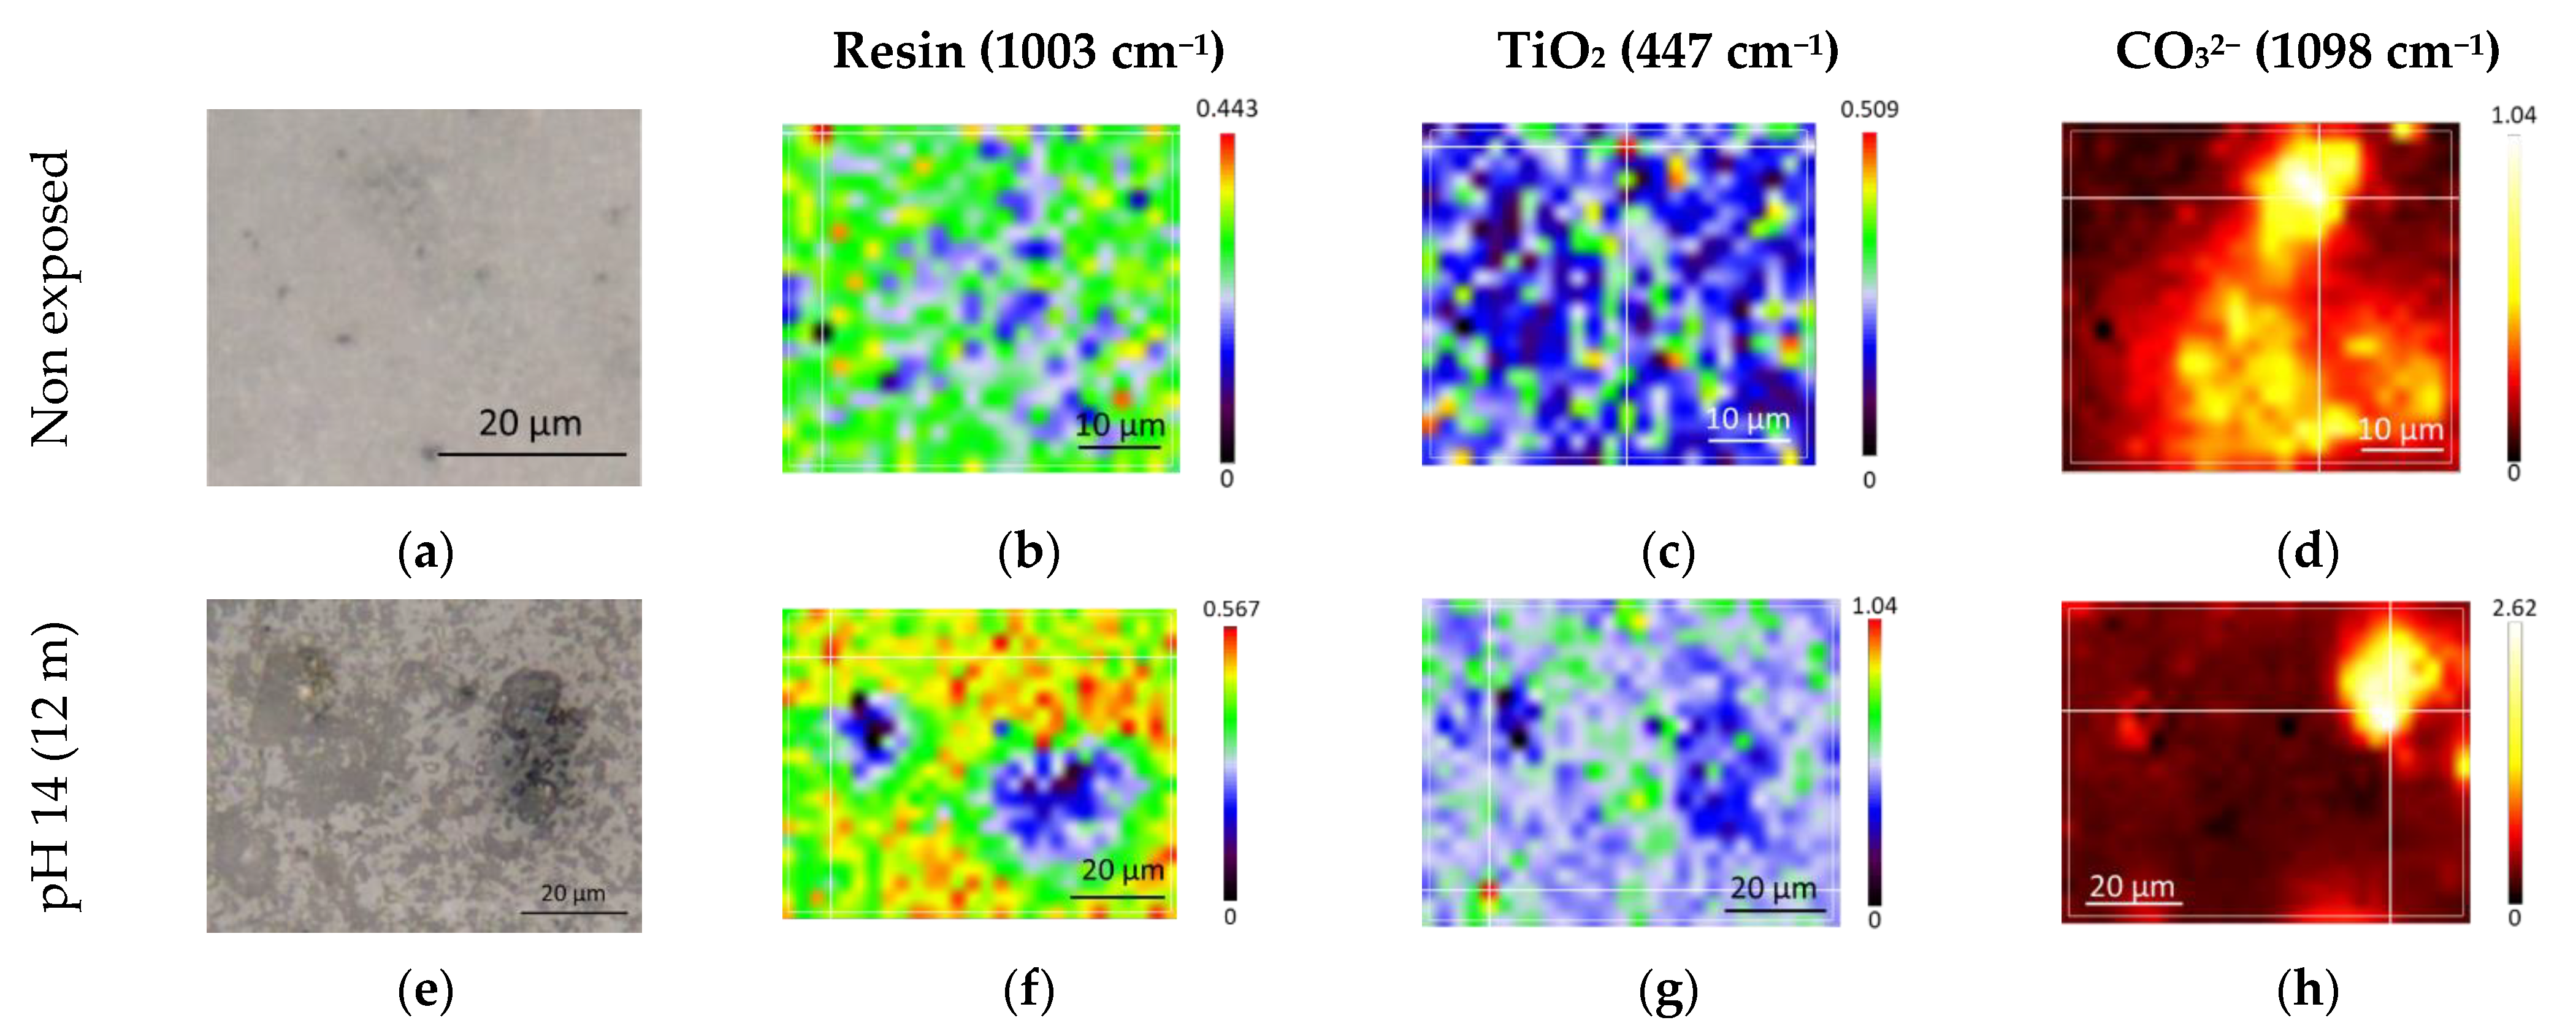
  • This LE was sensitive to aging, even in deionized water, in which the leaching of mineral fillers was highlighted. The degradation of the LE was accelerated in the alkaline solution. The leaching of mineral fillers led to a loss of barrier properties, ultimately resulting in the weakening of the polymer–steel interface, as illustrated by interfacial failure. These conclusions show the importance of considering coating aging resulting from alkalinity induced by CP.
  • The decrease in coating resistance is expected to further accelerate aging through an increase CP current demand and related local alkalinity. It should be noted that the results obtained and presented applied only to precise formulations of LE and FBE; however, the proposed chemical method appears relevant and shows the necessity of considering such specific aging in regards to coating specifications and improvements.

Supplementary Materials

The supporting information can be downloaded at: https://www.mdpi.com/article/10.3390/coatings13111949/s1.

Author Contributions

Conceptualization, K.P. and E.D.; methodology, K.P. and E.D.; validation, E.D. and N.L.; formal analysis, K.P.; investigation, K.P., E.D., M.D. and C.C.; resources, P.L.; writing—original draft preparation, K.P.; writing—review and editing, E.D., M.D., C.C., J.V., F.C., S.F., T.K. and P.L.; visualization, K.P.; supervision, E.D. and N.L.; project administration, K.P. and E.D.; funding acquisition, J.V., F.C., S.F. and T.K. All authors have read and agreed to the published version of the manuscript.

Funding

This research received no external funding.

Institutional Review Board Statement

Not applicable.

Informed Consent Statement

Not applicable.

Data Availability Statement

Data are contained within the article.

Acknowledgments

Pascal Moullec and Marie Roustan are acknowledged conducting the experimental works. François Michaud, from the University of Western Brittany, is acknowledged for performing the XRD analyses. The authors also thank the Spectroscopy and Microscopy Service Facility (SMI) of LCPME (Université de Lorraine—CNRS—https://www.lcpme.ul.cnrs.fr/) for the IR and Raman analyses.

Conflicts of Interest

The authors declare no conflict of interest.

References

  1. Koch, G.; Varney, J.; Thompson, N.; Moghissi, O.; Gould, M.; Payer, J. International Measures of Prevention, Application, and Economics of Corrosion Technologies Study. NACE Int. 2016, 216, 2–3. [Google Scholar]
  2. Thomas, N.L. The Barrier Properties of Paint Coatings. Prog. Org. Coat. 1991, 19, 101–121. [Google Scholar] [CrossRef]
  3. Pélissier, K.; Thierry, D. Powder and High-Solid Coatings as Anticorrosive Solutions for Marine and Offshore Applications? A Review. Coatings 2020, 10, 916. [Google Scholar] [CrossRef]
  4. Bierwagen, G.P. Reflections on Corrosion Control by Organic Coatings. Prog. Org. Coat. 1996, 28, 43–48. [Google Scholar] [CrossRef]
  5. Legghe, E.; Aragon, E.; Bélec, L.; Margaillan, A.; Melot, D. Correlation between Water Diffusion and Adhesion Loss: Study of an Epoxy Primer on Steel. Prog. Org. Coat. 2009, 66, 276–280. [Google Scholar] [CrossRef]
  6. Negele, O.; Funke, W. Internal Stress and Wet Adhesion of Organic Coatings. Prog. Org. Coat. 1996, 28, 285–289. [Google Scholar] [CrossRef]
  7. Perera, D.Y. On Adhesion and Stress in Organic Coatings. Prog. Org. Coat. 1996, 28, 21–23. [Google Scholar] [CrossRef]
  8. Kehr, A.; Dabiri, M.; Hislop, R.; Devadass, M. Dual-Layer Fusion Bonded Epoxy (FBE) Coatings Protect Pipelines. In Proceedings of the Indopipe Conference, Jakarta, Indonesia, 30 May–1 June 2006; pp. 3–5. [Google Scholar]
  9. Sauvant-Moynot, V.; Kittel, J.; Melot, D.; Roche, M. Three Layer Polyolefin Coatings: How the FBE Primer Properties Govern the Long Term Adhesion. In Proceedings of the 17th International Conference on Pipeline Protection, Edinburgh, UK, 17 October 2007. [Google Scholar]
  10. Sørensen, P.A.; Kiil, S.; Dam-Johansen, K.; Weinell, C.E. Influence of Substrate Topography on Cathodic Delamination of Anticorrosive Coatings. Prog. Org. Coat. 2009, 64, 142–149. [Google Scholar] [CrossRef]
  11. Knudsen, O.Ø.; Forsgren, A. Corrosion Control through Organic Coatings, 2nd ed.; Philip, A., Schweitzer, P.E., Eds.; CRC Press: Boca Raton, FL, USA, 2017; ISBN 9781498760737. [Google Scholar]
  12. Nazarov, A.; Thierry, D. Application of Scanning Kelvin Probe in the Study of Protective Paints. Front. Mater. 2019, 6, 192. [Google Scholar] [CrossRef]
  13. Diler, E.; Roustan, M. Corrosion Rate of Buried Steel after Cathodic Protection Interruption. In Proceedings of the 18th Pipeline Technology Conference, Berlin, Germany, 11 May 2023. [Google Scholar]
  14. Diler, E.; Larché, N.; Leballeur, C.; Thierry, D.; Vittonato, J.; Agel, E.; Castillon, F.; Fontaine, S.; Campaignolle, X. Influence of the Coupon Surface and Geometry on the Cathodic Protection Current Density Demand in Soils. In Proceedings of the 7th Days Cathodic Protection & Associated Coatings, Juan Les Pins, France, 7–10 June 2021. [Google Scholar]
  15. Angst, U.M. A Critical Review of the Science and Engineering of Cathodic Protection of Steel in Soil and Concrete. Corrosion 2019, 75, 1420–1433. [Google Scholar] [CrossRef]
  16. Hammond, J.S.; Holubka, J.W.; deVries, J.E.; Dickie, R.A. The Application of X-Ray Photo-Electron Spectroscopy to a Study of Interfacial Composition in Corrosion-Induced Paint de-Adhesion. Corros. Sci. 1981, 21, 239–253. [Google Scholar] [CrossRef]
  17. Löffler, T. Alkali Resistance of Coatings—Will Tests of Cathodic Disbondment Provide Reliable Statements to This Question? In Proceedings of the 17th Pipeline Technology Conference, Berlin, Germany, 7–10 March 2022. [Google Scholar]
  18. Xu, M.; Lam, C.N.C.; Wong, D.; Asselin, E. Evaluation of the Cathodic Disbondment Resistance of Pipeline Coatings—A Review. Prog. Org. Coat. 2020, 146, 105728. [Google Scholar] [CrossRef]
  19. Holub, J.; Wong, D.T.; Tan, M. Analysis of CDT Methods And Factors Affecting Cathodic Disbondment. In Proceedings of the CORROSION 2007, Nashville, TN, USA, 11–15 March 2007. [Google Scholar]
  20. Thompson, I.; Saithala, J.R. Review of Pipeline Coating Systems from an Operator’s Perspective. Corros. Eng. Sci. Technol. 2016, 51, 118–135. [Google Scholar] [CrossRef]
  21. Diler, E.; Larche, N.; Vittonato, J.; Castillon, F.; Fontaine, S.; Kerzerho, T.; Lucas, P.; Agel, E. Cathodic Protection Shielding and Prevention of the Corrosion under Disbonded Coating in Soils. In Proceedings of the AMPP 2023, Denver, CO, USA, 23 March 2023; p. 1948. [Google Scholar]
  22. ISO 4624:2016; Paints and Varnishes—Pull-off Test for Adhesion. ISO Standard: Brussels, Belgium, 2016.
  23. Davies, P.; Sohier, L.; Cognard, J.Y.; Bourmaud, A.; Choqueuse, D.; Rinnert, E.; Créac’hcadec, R. Influence of Adhesive Bond Line Thickness on Joint Strength. Int. J. Adhes. Adhes. 2009, 29, 724–736. [Google Scholar] [CrossRef]
  24. Vašková, H.; Křesálek, V. Quasi Realtime Monitoring of Epoxy Resin Crosslinking via Raman Microscopy. Int. J. Math. Models Methods Appl. Sci. 2011, 5, 1197–1204. [Google Scholar]
  25. Diniz, F.B.; De Andrade, G.F.; Martins, C.R.; De Azevedo, W.M. A Comparative Study of Epoxy and Polyurethane Based Coatings Containing Polyaniline-DBSA Pigments for Corrosion Protection on Mild Steel. Prog. Org. Coat. 2013, 76, 912–916. [Google Scholar] [CrossRef]
  26. Wilmshurst, J.K.; Bernstein, H.J. The Infrared and Raman Spectra of Toluene, Toluene-α-D3, m-Xylene, and m-Xylene-Aα′-D6. Can. J. Chem. 1957, 35, 911–925. [Google Scholar] [CrossRef]
  27. Vedad, J.; Reilly, L.; Desamero, R.Z.B.; Mojica, E.R.E. Quantitative Analysis of Xylene Mixtures Using a Handheld Raman Spectrometer. In Raman Spectroscopy in the Undergraduate Curriculum; ACS Symposium Series; ACS Publications: Washington, DC, USA, 2018; Volume 1305, pp. 129–152. [Google Scholar] [CrossRef]
  28. Strelchuk, V.V.; Budzulyak, S.I.; Budzulyak, I.M.; Ilnytsyy, R.V.; Kotsyubynskyy, V.O.; Segin, M.Y.; Yablon, L.S. Raman Spectroscopy of the Laser Irradiated Titanium Dioxide. Semicond. Phys. Quantum Electron. Optoelectron. 2010, 13, 309–313. [Google Scholar] [CrossRef]
  29. Gautam, S.K.; Singh, F.; Sulania, I.; Singh, R.G.; Kulriya, P.K.; Pippel, E. Micro-Raman Study on the Softening and Stiffening of Phonons in Rutile Titanium Dioxide Film: Competing Effects of Structural Defects, Crystallite Size, and Lattice Strain. J. Appl. Phys. 2014, 115, 143504. [Google Scholar] [CrossRef]
  30. Hong, L.V.; Le, N.T.H.; Thuan, N.C.; Thanh, N.D.; Nghia, N.X.; Phuc, N.X. Observation of the Phase Formation in TiO2 Nano Thin Film by Raman Scattering. J. Raman Spectrosc. 2005, 36, 946–949. [Google Scholar] [CrossRef]
  31. Dufresne, W.J.B.; Rufledt, C.J.; Marshall, C.P. Raman Spectroscopy of the Eight Natural Carbonate Minerals of Calcite Structure. J. Raman Spectrosc. 2018, 49, 1999–2007. [Google Scholar] [CrossRef]
  32. Kleppe, A.K.; Jephcoat, A.P.; Welch, M.D. The Effect of Pressure upon Hydrogen Bonding in Chlorite: A Raman Spectroscopic Study of Clinochlore to 26.5 GPa. Am. Mineral. 2003, 88, 567–573. [Google Scholar] [CrossRef]
  33. Ulian, G.; Moro, D.; Valdrè, G. Infrared and Raman spectroscopic features of Clinochlore Mg6Si4O10(OH)8: A density functional theory contribution. Appl. Clay Sci. 2020, 197, 105779. [Google Scholar] [CrossRef]
  34. NF EN 1484; Water Analysis Guidelines for the Determination of Total Organic Carbon (TOC) and Dissolved Organic Carbon (DOC). AFNOR: Paris, France, 1997.
  35. NF ISO 15923-1; Water Quality—Determination of Selected Parameters by Discrete Analysis Systems—Part 1: Amonium, Nitrate, Nitrite, Chloride, Orthophosphate, Sulfate and Silicate with Photometric Detection. AFNOR: Paris, France, 2014.
  36. NF EN ISO 15587-1; Water Quality—Digestion for the Determination of Selected Elements in Water—Part 1: Aqua Regia Digestion. AFNOR: Paris, France, 2002.
  37. NF EN ISO 11885; Water Quality—Determination of Selected Elements by Inductively Coupled Plasma Optical Emission Spectrometry (ICP-OES). AFNOR: Paris, France, 2009.
  38. Capiel, G.; Uicich, J.; Fasce, D.; Montemartini, P.E. Diffusion and Hydrolysis Effects during Water Aging on an Epoxy-Anhydride System. Polym. Degrad. Stab. 2018, 153, 165–171. [Google Scholar] [CrossRef]
  39. Fredj, N.; Cohendoz, S.; Mallarino, S.; Feaugas, X.; Touzain, S. Evidencing Antagonist Effects of Water Uptake and Leaching Processes in Marine Organic Coatings by Gravimetry and EIS. Prog. Org. Coat. 2010, 67, 287–295. [Google Scholar] [CrossRef]
  40. Xiao, G.Z.; Shanahan, M.E.R. Irreversible Effects of Hygrothermal Aging on DGEBA/DDA Epoxy Resin. J. Appl. Polym. Sci. 1998, 69, 363–369. [Google Scholar] [CrossRef]
  41. Colin, X.; Verdu, J. Humid Ageing of Organic Matrix Composites. In Solid Mechanics and Its Applications; Springer: Dordrecht, The Netherlands, 2014; Volume 208, pp. 47–114. [Google Scholar] [CrossRef]
  42. Antoon, M.K.; Koenig, J.L. Irreversible Effects of Moisture on the Epoxy Matrix in Glass-Reinforced Composites. J. Polym. Sci. Polym. Phys. 1981, 19, 197–212. [Google Scholar] [CrossRef]
  43. Linde, E.; Giron, N.H.; Celina, M.C. Water Diffusion with Temperature Enabling Predictions for Sorption and Transport Behavior in Thermoset Materials. Polymer 2018, 153, 653–667. [Google Scholar] [CrossRef]
  44. Del Grosso Destreri, M.; Vogelsang, J.; Fedrizzi, L.; Deflorian, F. Water Up-Take Evaluation of New Waterborne and High Solid Epoxy Coatings. Part II: Electrochemical Impedance Spectroscopy. Prog. Org. Coat. 1999, 37, 69–81. [Google Scholar] [CrossRef]
  45. Scott, P.; Lees, J.M. Water, Salt Water, and Alkaline Solution Uptake in Epoxy Thin Films. J. Appl. Polym. Sci. 2013, 130, 1898–1908. [Google Scholar] [CrossRef]
  46. Vosgien Lacombre, C.; Bouvet, G.; Trinh, D.; Mallarino, S.; Touzain, S. Water Uptake in Free Films and Coatings Using the Brasher and Kingsbury Equation: A Possible Explanation of the Different Values Obtained by Electrochemical Impedance Spectroscopy and Gravimetry. Electrochim. Acta 2017, 231, 162–170. [Google Scholar] [CrossRef]
  47. Nguyen, V.N.; Perrin, F.X.; Vernet, J.L. Water Permeability of Organic/Inorganic Hybrid Coatings Prepared by Sol–Gel Method: A Comparison between Gravimetric and Capacitance Measurements and Evaluation of Non-Fickian Sorption Models. Corros. Sci. 2005, 47, 397–412. [Google Scholar] [CrossRef]
  48. Mittermayr, F.; Klammer, D.; Köhler, S.; Dietzel, M. Dolomite Dissolution in Alkaline Cementious Media. In Proceedings of the EGU General Assembly, Vienna, Austria, 2–7 May 2010. [Google Scholar]
  49. Yin, X.; Liu, Y.; Miao, Y.; Xian, G. Water Absorption, Hydrothermal Expansion, and Thermomechanical Properties of a Vinylester Resin for Fiber-Reinforced Polymer Composites Subjected to Water or Alkaline Solution Immersion. Polymers 2019, 11, 505. [Google Scholar] [CrossRef] [PubMed]
  50. Roggero, A.; Villareal, L.; Caussé, N.; Santos, A.; Pébère, N. Correlation between the Physical Structure of a Commercially Formulated Epoxy Paint and Its Electrochemical Impedance Response. Prog. Org. Coat. 2020, 146, 105729. [Google Scholar] [CrossRef]
  51. Wang, B.; Li, D.; Xian, G.; Li, C. Effect of Immersion in Water or Alkali Solution on the Structures and Properties of Epoxy Resin. Polymers 2021, 13, 1902. [Google Scholar] [CrossRef] [PubMed]
  52. Bouvet, G.; Dang, N.; Cohendoz, S.; Feaugas, X.; Mallarino, S.; Touzain, S. Impact of Polar Groups Concentration and Free Volume on Water Sorption in Model Epoxy Free Films and Coatings. Prog. Org. Coat. 2016, 96, 32–41. [Google Scholar] [CrossRef]
  53. Morsch, S.; Lyon, S.; Greensmith, P.; Smith, S.D.; Gibbon, S.R. Water Transport in an Epoxy–Phenolic Coating. Prog. Org. Coat. 2015, 78, 293–299. [Google Scholar] [CrossRef]
  54. Grzechnik, A.; Simon, P.; Gillet, P.; McMillan, P. An Infrared Study of MgCO3 at High Pressure. Phys. B Condens. Matter 1999, 262, 67–73. [Google Scholar] [CrossRef]
  55. Tian, L.; Tahmasebi, A.; Yu, J. An Experimental Study on Thermal Decomposition Behavior of Magnesite. J. Therm. Anal. Calorim. 2014, 118, 1577–1584. [Google Scholar] [CrossRef]
  56. NF EN ISO 21809-3; Industries Du Pétrole et Du Gaz Naturel—Revêtements Externes Des Conduites Enterrées Ou Immergées Utilisées Dans Les Systèmes de Transport Par Conduites—Partie 3: Revêtements Des Joints Soudés Sur Site—Industries Du Pétrole. ISO: Geneva, Switzerland, 2016.
  57. AFNOR NF EN 10290; Tubes et Raccords En Acier Pour Canalisations Enterrées et Immergées—Revêtements Externes En Polyuréthane Ou Polyuréthane Modifié Liquides. AFNOR: Paris, France, 2002.
  58. NF EN 12068:1999; Protection Cathodique—Revêtements Organiques Extérieurs Pour La Protection Contre La Corrosion de Tubes En Acier Enterrés Ou Immergés En Conjonction Avec La Protection Cathodique—Bandes et Matériaux Rétractables. European Committee for Standardization: Brussels, Belgium, 1999.
  59. Akbarinezhad, E.; Bahremandi, M.; Faridi, H.R.; Rezaei, F. Another Approach for Ranking and Evaluating Organic Paint Coatings via Electrochemical Impedance Spectroscopy. Corros. Sci. 2009, 51, 356–363. [Google Scholar] [CrossRef]
  60. Castela, A.S.L.; Simões, A.M.; Ferreira, M.G.S. E.I.S. Evaluation of Attached and Free Polymer Films. Prog. Org. Coat. 2000, 38, 1–7. [Google Scholar] [CrossRef]
  61. Leidheiser, H. Electrical and Electrochemical Measurements as Predictors of Corrosion at the Metal–Organic Coating Interface. Prog. Org. Coat. 1979, 7, 79–104. [Google Scholar] [CrossRef]
  62. Kendig, M.; Scully, J. Basic Aspects of Electrochemical Impedance Application for the Life Prediction of Organic Coatings on Metals. Corrosion 1990, 46, 22–29. [Google Scholar] [CrossRef]
  63. Croll, S.G. Electrolyte Transport in Polymer Barrier Coatings: Perspectives from Other Disciplines. Prog. Org. Coat. 2018, 124, 41–48. [Google Scholar] [CrossRef]
  64. Shreepathi, S.; Naik, S.M.; Vattipalli, M.R. Water Transportation through Organic Coatings: Correlation between Electrochemical Impedance Measurements, Gravimetry, and Water Vapor Permeability. J. Coat. Technol. Res. 2012, 9, 411–422. [Google Scholar] [CrossRef]
  65. Vosgien Lacombre, C.; Bouvet, G.; Trinh, D.; Mallarino, S.; Touzain, S. Effect of Pigment and Temperature onto Swelling and Water Uptake during Organic Coating Ageing. Prog. Org. Coat. 2018, 124, 249–255. [Google Scholar] [CrossRef]
  66. Kittel, J.; Celati, N.; Keddam, M.; Takenouti, H. Influence of the Coating–Substrate Interactions on the Corrosion Protection: Characterisation by Impedance Spectroscopy of the Inner and Outer Parts of a Coating. Prog. Org. Coat. 2003, 46, 135–147. [Google Scholar] [CrossRef]
  67. Kittel, J.; Celati, N.; Keddam, M.; Takenouti, H. New Methods for the Study of Organic Coatings by EIS: New Insights into Attached and Free Films. Prog. Org. Coat. 2001, 41, 93–98. [Google Scholar] [CrossRef]
  68. Chen, M.; Yu, Q.S.; Reddy, C.M.; Yasuda, H.K. Model Study Investigating the Role of Interfacial Factors in Electrochemical Impedance Spectroscopy Measurements. Corrosion 2000, 56, 709–721. [Google Scholar] [CrossRef]
  69. Dolatzadeh, F.; Jalili, M.M.; Moradian, S. Influence of Various Loadings of Hydrophilic or Hydrophobic Silica Nanoparticles on Water Uptake and Porosity of a Polyurethane Coating. Mater. Corros. 2013, 64, 609–618. [Google Scholar] [CrossRef]
Figure 1. SEM images in backscattered mode of (a) an FBE membrane and (b) an LE membrane (cross-section configuration) before aging and before obtaining the corresponding EDX spectrum.
Coatings 13 01949 g001
Figure 2. Electrochemical cell used to perform EIS.
Coatings 13 01949 g002
Figure 3. Typical Raman spectrum between 50 cm−1 and 3000 cm−1 of the tested liquid epoxy.
Coatings 13 01949 g003
Figure 4. Evolution of the mass gain as a function of the time of exposure (h0.5) for free membranes of (a) FBE and (b) LE in deionized water at room temperature (three replicates).
Coatings 13 01949 g004
Figure 5. SEM images (in backscattered mode) of the LE free membrane (cross-section) (a) before aging and (b) after one year of exposure in deionized water at room temperature.
Coatings 13 01949 g005
Figure 6. Raw LE sample (top) and LE exposed to deionized water (bottom). Images (a,e) are visible images in white light; (bd,fh) are spatial distribution of species obtained by integrating their characteristic Raman peak intensities. Images (b,f) are from the resin (1003 cm−1), (c,g) are from the rutile (447 cm−1), and (d,h) are from the carbonate (1098 cm−1).
Coatings 13 01949 g006
Figure 7. Evolution of the mass gain as a function of the time of exposure (h0.5) in deionized water, with and without NaOH (three replicates), at room temperature for a free membrane of (a) FBE and (b) LE.
Coatings 13 01949 g007
Figure 8. Infrared spectra as a function of the aging conditions after 12 months of exposure for an LE free membrane (a) between 600 cm−1 and 1800 cm−1 and (b) between 2600 cm−1 and 3800 cm−1.
Coatings 13 01949 g008
Figure 9. SEM images, in backscattered mode, of the LE free membrane (cross-section) (a) before aging, (b) after one year of exposure in deionized water at room temperature, and (c) after one year of exposure in deionized water at pH 14 and at room temperature. Red arrows indicate morphological changes.
Coatings 13 01949 g009
Figure 10. Raw LE sample (top) and LE exposed to solution at pH 14 (bottom). Images (a,e) are visible images in white light; (bd,fh) are spatial distribution of species obtained by integrating their characteristic Raman peak intensity: (b,f) are for the resin (1003 cm−1), (c,g) are for the rutile (447 cm−1), and (d,h) are for the carbonate (1098 cm−1).
Coatings 13 01949 g010
Figure 11. Evolution of the impedance modulus (a,b) and the phase angle (c,d) in 3.5% NaCl as a function of the frequency and time of exposure for a free membrane of FBE (a,c) and LE (b,d) exposed in deionized water at room temperature.
Coatings 13 01949 g011
Figure 12. Evolution of the impedance modulus (a,b) and the phase angle (c,d) in 3.5% NaCl as a function of the frequency and the pH of the solution for a free membrane of FBE (a,c) and LE (b,d) exposed at room temperature after 12 months and subsequent drying.
Coatings 13 01949 g012
Figure 13. Evolution of the current passing through the coating as a function of exposure time for (a) FBE coated steel and (b) LE coated steel at room temperature and pH 14. Both replicates are represented.
Coatings 13 01949 g013
Figure 14. (a) Impedance spectrum after 12 months of exposure and (b) evolution of the low frequency modulus at 0.01 Hz as a function of the time of exposure for LE coated steel. All replicates are represented.
Coatings 13 01949 g014
Figure 15. Failure locus after the pull-off test (ISO 4624) [22], before aging and after 12 months. The labels on the pictures specify the failure locus after the pull-off test.
Coatings 13 01949 g015
Table 1. Composition of S235 steel, Fe balance.
CarbonManganesePhosphorousSulphurSilicon
0.22% max1.60% max0.05% max0.05% max0.05% max
Table 2. Free membrane aging in deionized water and NaOH.
CoatingSolutionTemperatureReplicateDurationComments
FBEDeionized water (DW)
DW + NaOH at pH 13 (4 g·L−1)
DW + NaOH at pH 14 (50 g·L−1)
RT3490 daysTwo sides exposed
LE
Disclaimer/Publisher’s Note: The statements, opinions and data contained in all publications are solely those of the individual author(s) and contributor(s) and not of MDPI and/or the editor(s). MDPI and/or the editor(s) disclaim responsibility for any injury to people or property resulting from any ideas, methods, instructions or products referred to in the content.

