Article

Gellan Gum-Montmorillonite Nanocomposites for Electrochromic Devices

by
Willian R. Caliman
1,
Franciani C. Sentanin
1,
Rodrigo C. Sabadini
1,
Rodrigo H. S. Garcia
2,
Tatiana Monaretto
3,
Luiz A. Colnago
1,2 and
Agnieszka Pawlicka
1,*
1
Instituto de Química de São Carlos, Universidade de São Paulo, Av. Trabalhador Sãocarlense 400, São Carlos 13566-590, SP, Brazil
2
Embrapa Instrumentação, Rua XV de Novembro, 1452, São Carlos 13560-970, SP, Brazil
3
INRAE, UR OPAALE, 17 Avenue de Cucillé, CS 64427, 35044 Rennes, France
*
Author to whom correspondence should be addressed.
Coatings 2023, 13(2), 350; https://doi.org/10.3390/coatings13020350
Submission received: 21 December 2022 / Revised: 17 January 2023 / Accepted: 29 January 2023 / Published: 3 February 2023
(This article belongs to the Special Issue Perspective Coatings for Optical Materials Modifications)

Abstract

:
The present paper shows the results of nanocomposite polymer electrolytes (SPEs) of montmorillonite (MMT; Na+SYN-1) and gellan gum obtained by the solution casting method. The membrane samples were characterized by ATR-FTIR, time-domain nuclear magnetic resonance (TD-NMR), and scanning electron microscopy (SEM). Then, two samples were chosen and applied in small electrochromic devices (ECDs). The ATR-FTIR revealed shifts in bands of acetate and glycosidic bonds at 1032 and 1611 cm−1, respectively, indicating an interaction between the gellan gum and Na+SYN-1. The spin–lattice relaxation time of the proton nuclei (T1) suggests the poor dispersion of MMT in the matrix, especially above 20 wt.%. However, SEM pictures pointed to a more homogeneous surface of the nanocomposite containing 40 wt.% Na+SYN-1 when compared to the sample without clay. NPEs with 10 and 40 wt.% Na+SYN-1 were applied in ECDs, and the voltammograms showed a decrease in anodic and cathodic peaks after 2519 chronocoulometric cycles for the sample with 10 wt.% Na+SYN-1 and after 420 cycles for the sample with 40 wt.% Na+SYN-1. There was also a decrease in the charge density in both ECDs and an oscillating difference in transmittance between the colored/discolored states during the chronocoulometric cycles of the ECD with GG-MMT10. Further studies may reveal more property improvements in gellan gum nanocomposites.

1. Introduction

Recently, nanocomposites have attracted much interest in research and development due to improvements in mechanical [1], thermal [2], electrical [3], and ion conduction [4] properties when compared to equivalent micro-composites. Nanocomposites are described as matrices, usually polymeric, with some sort of low-concentration of nanoscale filler such as clay [4] diffused in its medium [5]. Mixing clay minerals with polymers can result in three different structures: (i) separated, (ii) intercalated, and (iii) exfoliated, also called delaminated. The separated structure is formed when there is almost no interaction between the polymer and the clay lamellae, so the clay lamellae are inside the polymer matrix. Intercalated nanocomposites form when polymeric chains are inserted between the spaces of the lamellae of the clay, resulting in well-ordered alternating structures. Evenly dispersed lamellae in a polymeric matrix give exfoliated structures. In most cases, complete clay exfoliation is difficult to achieve, and nanocomposites result in a mixture of intercalated–flocculated or intercalated–exfoliated structures [6,7].
Researchers have developed diverse nanocomposite products, such as automotive parts [8], food packaging [9], and dyes [10]. Nanocomposite polymer electrolytes (NPEs) in the membrane form are investigated for battery applications, where montmorillonite nano clay serves as a pore-forming agent [11]. It was also shown that the addition of nano clays to plasticized and crosslinked gelatin-based electrolyte improved its ionic conductivity properties [4] and, consequently, the performance of the device.
Gellan gum is an exopolysaccharide arising from bacterial fermentation [12]. Its native form has a high content of acyl groups, and after deacetylation, their content decreases, which influences the properties of the gel [13,14]. This polysaccharide has already been studied as a raw material for hydrogels [15] and is applied in the pharmaceutical and medical fields [13,15].
Nanocomposite polymer electrolytes (NPEs) of P(VdF-HFP)-LiPF6-MMT have been studied by Borah and Deka [16]. The authors observed that the ionic conductivity of these NPEs increased with the increase in clay content and attained a maximum value of 9 × 10⁻³ S/cm at 5 wt.% of clay. Higher clay amounts promoted the ionic conductivity decrease. Recycled high-density polyethylene (HDPE) and poly(ethylene terephthalate) (PET) containing modified MMT nanocomposites presented intercalated and exfoliated silicate layers [17]. A PMMA-ABS matrix with organically modified MMT prepared by the solution casting method resulted in intercalated and exfoliated nanocomposites [6]. PMMA, PVC, PVAc, and natural polymer cellulose acetate butyrate (CAB) containing Na+-MMT displayed a uniform surface with small-sized crystallites distributed on the polymer surface (SEM) and an interaction between clay and respective polymers (FTIR) [18]. The incorporation of montmorillonite in ETPTA/PVdF-HFP semi-IPN polymer changed the local crystallinity of the polymer matrix, which increased ion-conductive amorphous regions, intervened in the interaction of ion–ion and ion–polymer, and increased the number of charge carriers [19]. PEG and poly(epsilon caprolactone) (PCL) were clicked on to azide-functional montmorillonite (MMT-N3) clay to obtain PEG-PCL/MMT nanocomposites with partially exfoliated/intercalated morphologies [20].
As the clay concentration in the hydroxyl-terminated 1,4-polybutadiene (HTPB)/organo-clay nanocomposite increased, a more homogeneous structure was obtained due to the formation of a house-of-cards structure, but it then became heterogeneous owing to the dominance of the intercalated structure [21]. Organo-modified MMT was added to PVF, and the sample containing 2 wt.% clay presented the highest porosity and ionic conductivity in comparison to the polymer without loading [22]. A paper covering modeling of polymer-clay nanocomposite interactions has been published by Suter, Groen, and Coveney [23]. They studied collections of clay mineral tactoids interacting with poly(ethylene glycol) and PVA and reported that polymers with highly favorable interactions can overcome the energy penalty of separating the clay sheets and intercalating.
Moraes et al. [24] demonstrated that the CWFP (continuous wave-free precession) sequence can be a simple and fast method to measure T1 in time-domain NMR (TD-NMR), an alternative to measure the T1 distribution in polymers, food products, and petroleum to determine their physical properties. The time to enhance the signal-to-noise ratio of NMR signals was diminished by an alternative method when Monaretto et al. [25] used several post-acquisition digital filters in TD-NMR relaxation measurements, while the traditional method increases the number of scans.
Chitosan, PEDOT:PSS, lithium trifluoromethane sulfonate, and propylene carbonate were used to prepare solid polymer electrolytes applied in electrochromic devices (ECDs) [26]. The optical contrast of ECD, that is, the transmittance difference between the colored and discolored (bleaching) states, was attained as 22% at 800 nm, the response time for coloration was 0.29 s, and bleaching occurred within 3 s. ZrO2–IPTES-graft-PVdFHFP nanocomposite electrolytes were synthesized and used to assemble ECDs [27]. The transmittance difference between the colored and discolored states was 19% by applying a potential of −4 to +4 V. PMMA/succinonitrile nanocomposites with propylene carbonate as a plasticizer and LiCLO4 as s charge carrier were used to assemble WO3/nanocomposite electrolyte/Prussian blue electrochromic devices [28]. The optical contrast was 52.4% at 695 nm after applying a potential of −1.8 and +2.5 V and remained at 44.5% between the colored and discolored states after 2250 cycles. Zhang et al. [29] synthetized PANI/TiO2 nanocomposites that presented a transmittance difference of 76.9% at 600 nm between the applied potentials of −0.7 and 0.8 V at a rate of 20 mV/s. On the other hand, not only NPEs, but also transition metal oxide-based nanocomposites were studied for ECD applications [30]. The authors synthesized cerium oxide nanorods on fluorine tin oxide (FTO) conducting substrate, which was next covered by magnetron sputtering with WO3. The best optical modulations of 15 and 22% were obtained for the samples with 0.2 and 0.1 mol/L of CeO2/WO3, respectively [30].
Nanocomposites from natural and modified polymers and clay are barely seen in the literature. Based on that, we studied the structure of gellan gum/Na+SYN-1 nanocomposites containing increasing concentrations of clay loading and 40 wt.% Li+. The molecular structure of the nanocomposites was characterized by ATR-FTIR, and the spin–lattice relaxation time of the proton nuclei T1 was obtained by time-domain nuclear magnetic resonance (TD-NMR) to verify possible polymer–clay interactions. The nanocomposite polymer electrolytes were used to assemble two ECDs, which were characterized by cyclic voltammetry, chronocoulometry, and UV-vis spectroscopy techniques.

2. Materials and Methods

Deacetylated gellan gum (KELCOGEL CG-LA) was donated by CP Kelco Brasil (Limeira, SP, Brazil). Synthetic mica-MMT SYN-1 (Barasym SSM-100) was obtained from NL Industries (Dallas, TX, USA). Formaldehyde (P.A. ACS, purity 36.5%–38%) and glycerol (P.A. ACS, purity 99.5%) were purchased from Vetec (Duque de Caxias, RJ, Brazil). HCl (P.A. ACS, purity 36.5%), NaCl (P.A. ACS, purity 99%), acetone (P.A. ACS), and ethanol (P.A. ACS) were purchased from Synth (Diadema, SP, Brazil). NaOH (purity 97.7%) was obtained from Neon (Suzano, SP, Brazil), AgNO3 (P.A.) was purchased from Tec-Lab (Jundiaí, SP, Brazil), and LiClO4 (P.A. ACS, purity 95%) was obtained from Êxodo Científica (Sumaré, SP, Brazil). Extran® MA 02 was purchased from Merck (Rio de Janeiro, RJ, Brazil), and ITO was obtained from Delta Technologies (Loveland, CO, USA).
Na+SYN-1 was purified as described elsewhere [31]. Initially, 40 g of NH4+SYN-1 was added to 4 L of deionized water and was stirred for 2 h. HCl was added to reach a pH of 3.5 for the removal of carbonate ions (CO32−). The dispersion was stirred for 20 min and centrifuged in a Hitachi model CR22GIII centrifuge at 10,000 rpm at 25 °C for 30 min to remove water-soluble salts. We discarded the supernatant, and the pellet was suspended in 4 L of deionized water. NaOH was added to the dispersion until a pH of 8 was reached. When the dispersion presented a sedimented layer, the supernatant was siphoned, and its pH was adjusted to 3.5 using HCl. NaCl was added to the separated supernatant for flocculation and cationic exchange (NH4+ to Na+). The pellet was suspended in deionized water and its pH was adjusted to 8. The pH 3.5 dispersion flocculated for 12 h. The pH 8 dispersion and the pH 3.5 clay supernatant were discarded. The clay was centrifuged at 10,000 rpm at 25 °C for 30 min and submitted to dialysis in deionized water until it produced a negative test for chloride ions by using 0.1 mol/L AgNO3. Finally, Na+SYN-1 was lyophilized on Thermo Electron Corporation Model Moduly0D equipment to be used in the nanocomposite formulations.
A total of 0.01 to 0.40 g of Na+SYN-1 was added to 20 mL of Millipore Milli-Q® water with a controlled resistivity of 18 mΩ−1cm−1 at 20 ± 2 °C in a 50 mL glass beaker, and the mixture was magnetically stirred for 24 h. The polymer was prepared by adding 7.0 g of low acyl gellan gum to 910 mL of deionized water in a 1.5 L glass beaker, and the mixture was magnetically stirred for 24 h at room temperature (approximately 20 ± 2 °C) for homogenization. Subsequently, 2.8 g of LiClO4, 0.875 mL of formaldehyde, and 2.8 g of glycerol were added to the gellan gum suspension under stirring. The polymer suspension was divided into seven parts, and each part was poured into a 250 mL beaker. Then, the prepared clay suspensions were added to six beakers following the quantities presented in Table 1, which also shows the samples’ names. The seventh part was a base suspension named GGLA-G40, and it was composed of 1.0 g of GGLA, 0.4 g of glycerol, 0.125 mL of formaldehyde, and 0.4 g of LiClO4. The mixtures were submitted to magnetic stirring for 24 h, transferred to acrylic Petri dishes, and placed in a Fanem model 520 stove at 40 °C for drying. The dry membranes were stored in a desiccator. The second reference sample—named GGLA-G0—was composed of 1.0 g of GGLA, 0.4 g of glycerol, and 0.125 mL of formaldehyde.
The nanocomposite samples were subjected to ATR-FTIR measurements on a PerkinElmer Frontier (PerkinElmer Brasil, São Paulo, Brazil) spectrometer in the range of 500 to 4000 cm−1.
1H TD-NMR measurements were performed on the 0.47 T (approximately 19.9 MHz for the 1H resonance frequency) Minispec Mq20 spectrometer (Bruker®, Bremen, Germany) at 27 °C using a 10 mm probe and a 3.6 μs π⁄2 pulse. The T1 was measured using the CWFP-T1 sequence [24,32]: a π (50.4 μs) pulse separated by a time, Tp/2, of a train of small-flip angle (100 = 2.8 μs) pulses with the phase alternated in x and -x and separated by a time, Tp. Tp and the number of small flip angles and scans were 250 μs, 2000, and 1024, respectively; the recycle delay time was 0.1 s.
The inverse Laplace transform (ILT) was performed in the CWFP-T1 using an optimal regularization parameter (α) determined by the BRD (Butler–Reeds–Dowson) method [33]. As recommended in the literature [25], some pre-processing was applied to the CWFP-T1 signal allowing the data to be processed using a single decay kernel. Savitzky–Golay filtering was performed on the CWFP-T1 signal to enhance the signal-to-noise ratio by using second-order polynomial smoothing and 11 adjacent data point windows using the Origin Pro 8.5.1 software [25].
Scanning electronic microscopy (SEM) images were acquired with a LEO-440 equipped with an EDX analyzer (Carl Zeiss do Brasil Ltd.a., São Paulo, Brazil). The samples were laid out on a double-sided carbon adhesive tape glued to an aluminum sample holder and covered with a 20 nm thick gold layer. The current applied to the beam was 10 kV. The micrograph magnifications were 200, 1000, and 5000×.
Glass/ITO was used to make working electrodes and counter electrodes for ECD. They were cut into 2 cm × 1 cm pieces and were manually cleaned with acetone and ethanol and then were subjected to ultrasonic irradiation in Branson Digital Sonifier® equipment. They were dipped in aqueous Extran® MA 02 detergent solution at a volume ratio of 1:1 for 20 min. The ultrasonic procedure was repeated using deionized water. The process was performed for the third time using commercial ethanol (92.8° INPM), and the ITO was placed in an oven at 50 °C for drying. WO3 thin films were deposited by dipping glass/ITO substrates in a WO3 sol–gel solution using a homemade dip-coating tool. The glass/ITO/WO3 substrates were annealed in an EDG model FV-2 oven, in which the temperature was raised from room to 120 °C at a rate of 20 °C/min and then maintained at 120 °C for 60 min. The counter-electrodes of CeO2-TiO2 thin films were obtained also by dip-coating glass/ITO substrates in a CeO2-TiO2 sol–gel solution. After that, the glass/ITO/CeO2-TiO2 was annealed in an EDG model FV-2 oven at a temperature of 450 °C for 15 min [34].
ECDs of glass/ITO/WO3/gellan gum-Na+SYN-1/CeO2-TiO2/ITO/glass (WO3-ECD) were assembled by sandwiching glass/ITO/WO3, gellan gum-Na+SYN-1 membrane, and CeO2-TiO2/ITO/glass. For that, the NPE membranes of GG-MMT10 and GG-MMT40 were used. Copper tapes were bonded at both non-coated ends to provide better electrical contact.
The ECDs were characterized by cyclic voltammetry (CV) and chronocoulometry. There were applied cathodic and anodic potentials for 15 s each using an Autolab model PGSTAT 302N potentiostat/galvanostat.
UV-vis spectroscopy was performed on Jasco V-670 equipment (Jasco do Brasil, Tamboré, Santana de Parnaíba—SP, Brazil) in the wavelength range from 200 to 800 nm to compare the percentage of coloration/discoloration according to the applied potentials. The transmittance change at 480, 550, and 633 nm as a function of time (30,000 s) was measured after applying cathodic potential (−2.8 V) and maintaining the ECD in the colored state to observe the change in color over time without applying potential. We called these measurements open circuit. After that, a series of chronocoulometry measurements were performed with transmittance measurements at 480, 550, and 633 nm every 45 s to observe the change in the transmittance difference in the electrochromic devices against the cathodic (coloring)/anodic (discoloring or bleaching) cycles. ECD with GG-MMT10 was measured during 2519 cycles and GG-MMT40 during 420 cycles.

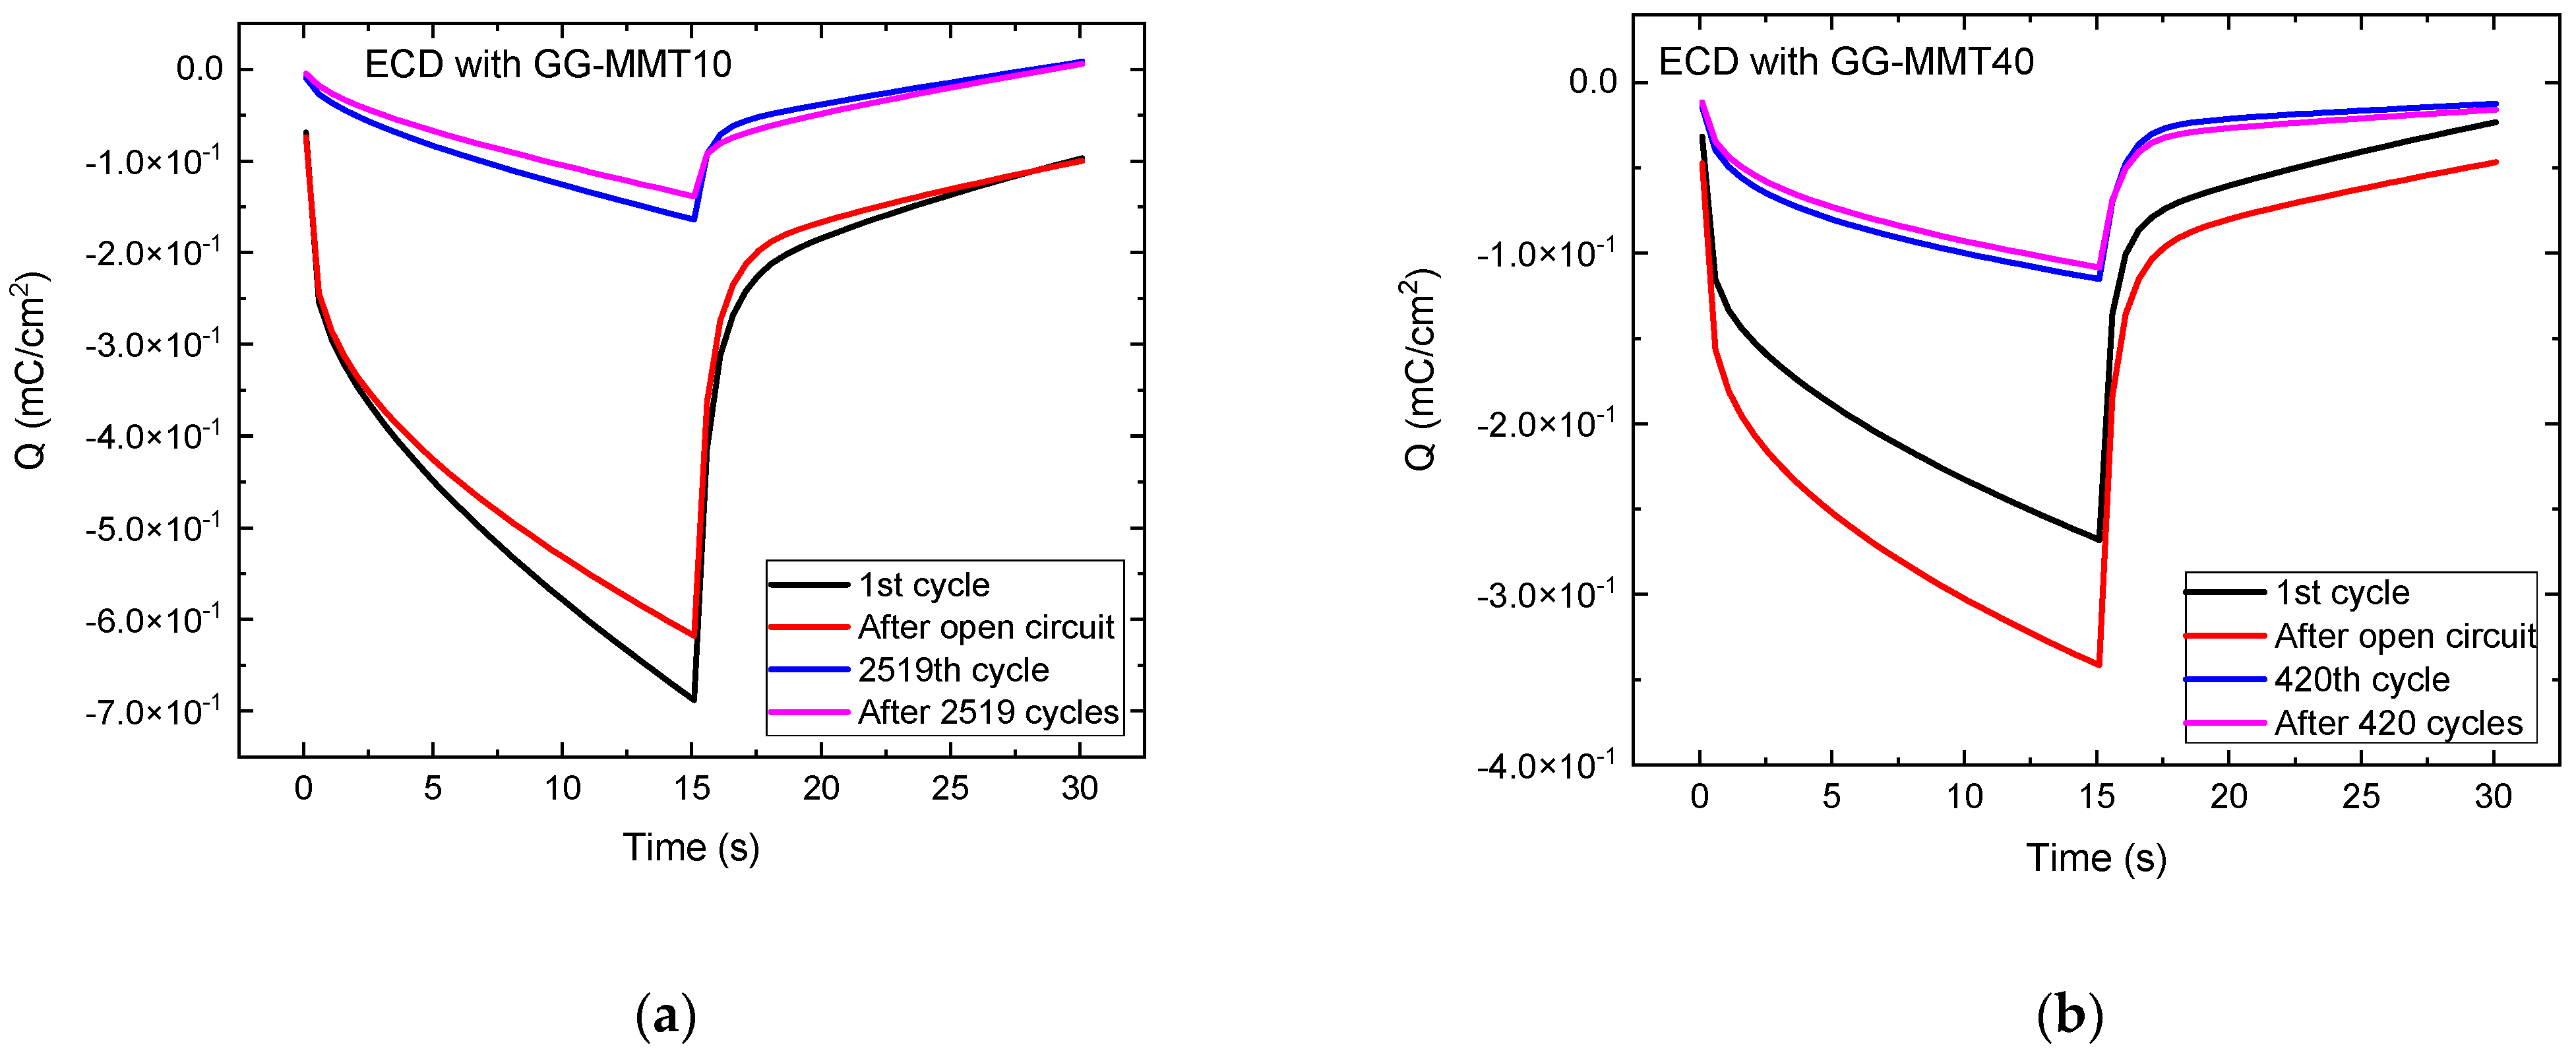
3. Results and Discussion

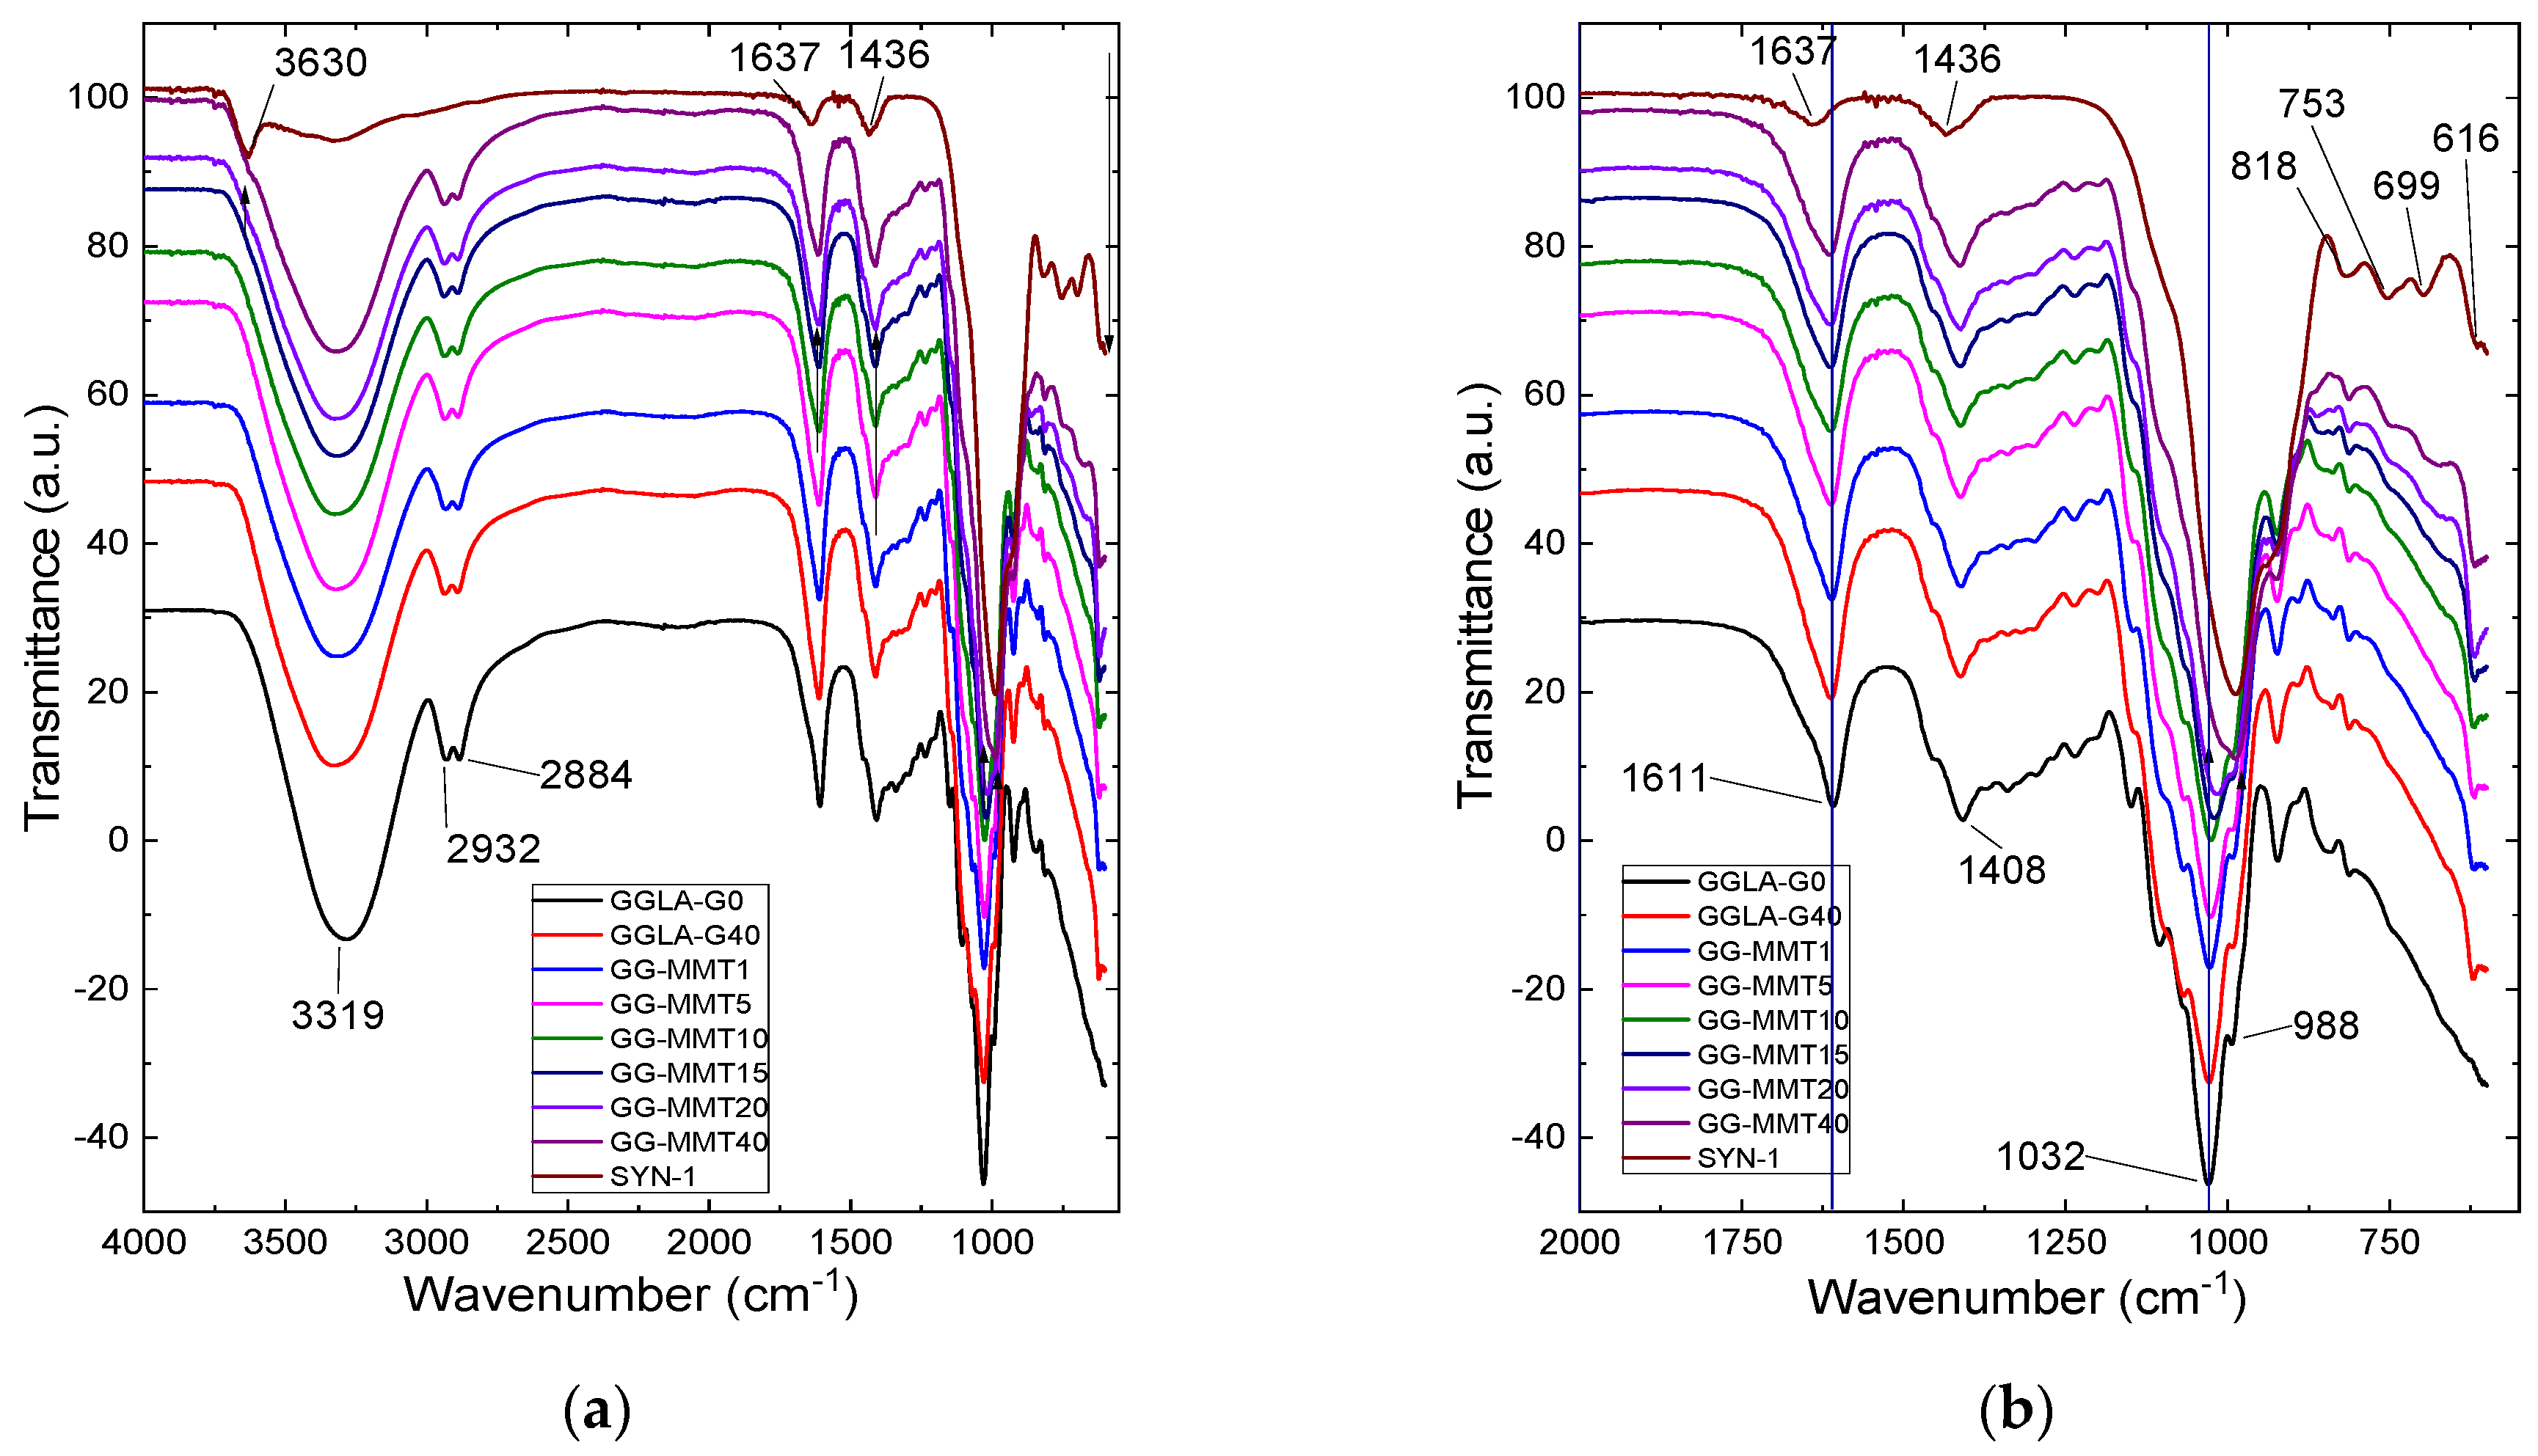
3.1. ATR-FTIR Results
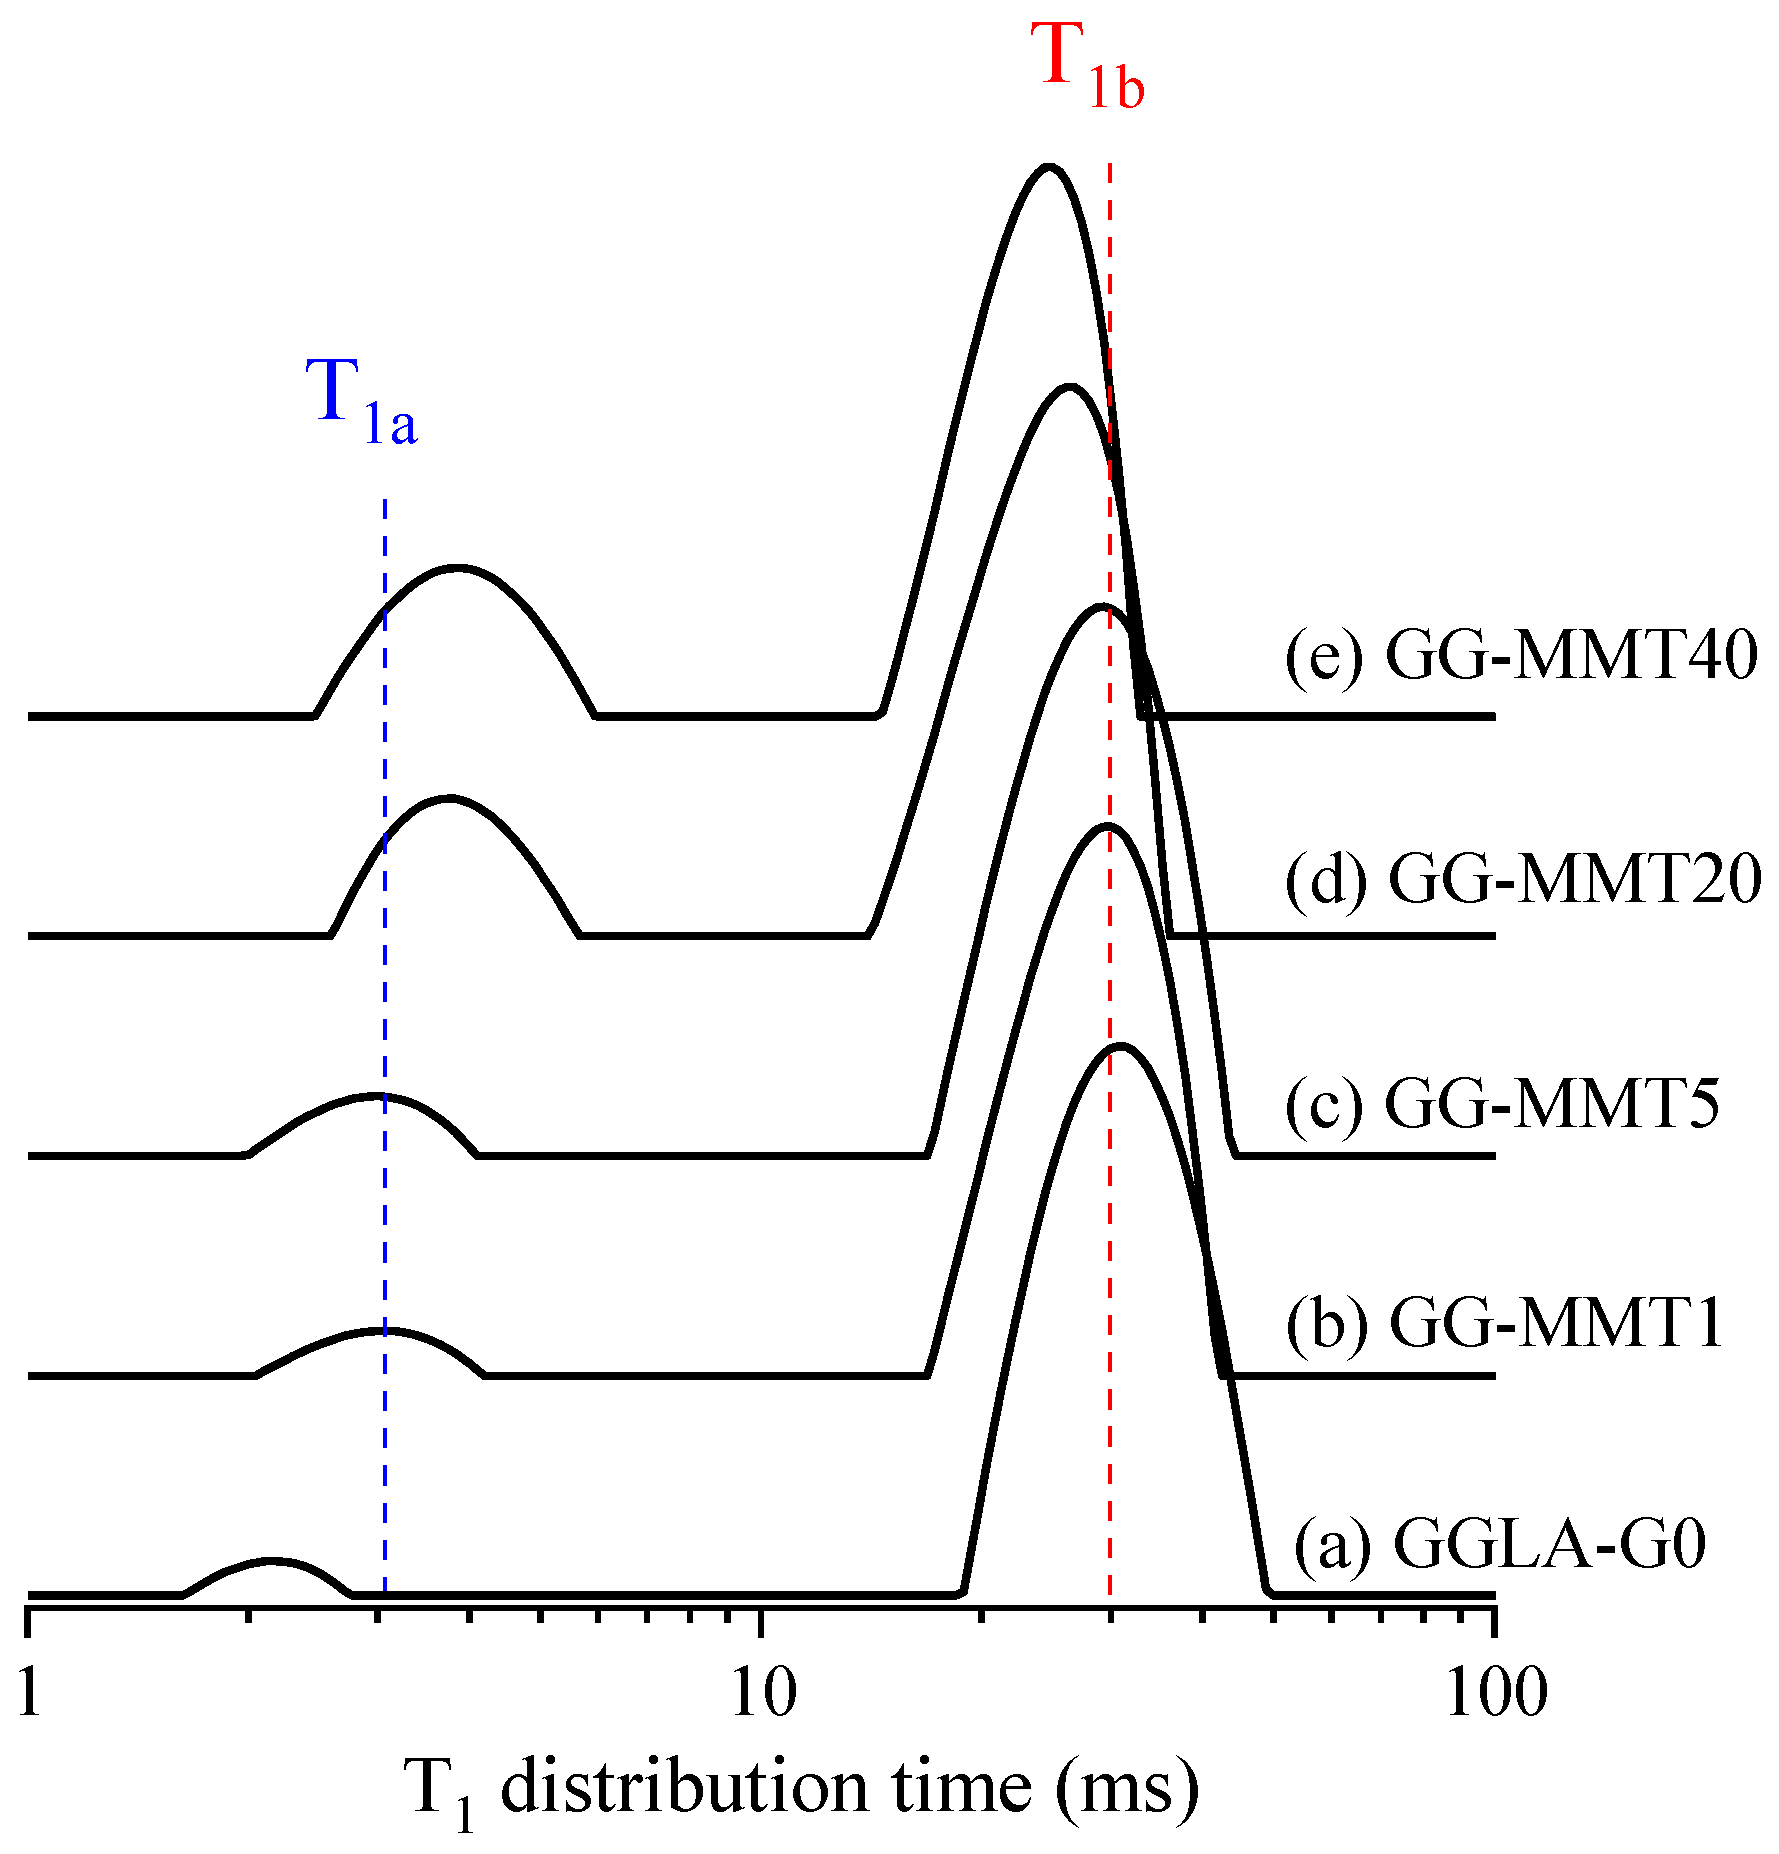
Nanocomposite samples exhibit a very wide band at 3319 cm−1, while GGLA-G0 shows a similar band at 3284 cm−1 (Figure 1). These bands correspond to the -OH stretching vibration of gellan gum. These samples also show bands at 2884 and 2932 cm−1, relative to the stretching of the -CH3 and -CH2 groups (Figure 1a). On the other hand, Na+SYN-1 exhibits a band at 3630 cm−1 that belongs to –OH stretching. The two bands observed at 1637 and 1436 cm−1 are associated with the deformation of the -OH groups of water and NH4+, respectively. At 1611 cm−1, there are the bands of the glycosidic bonds and at 1032 cm−1, the stretching of the bound acetates [14], which are shifted by 2–20 cm−1 to a lower energy when compared to samples without clay. This indicates an interaction of the gellan gum with Na+SYN-1 (Figure 1b) [18]. At 988 cm−1, there is a band in the nanocomposite and the pure clay spectra due to the Si–O stretching. Finally, the band at 818 cm−1 correlates with Si–O stretching, at 753 cm−1 to Al–O–Si, at 699 cm−1 to Si–O, and at 616 cm−1 to the coupled Al–O and Si–O [35].

3.2. T1 TD-NMR

The interaction between polymer chains and clay platelets, even as the quality of clay dispersion in clay nanocomposites, can be explored by proton spin–lattice relaxations (T1), as has been established in recent years [36,37,38]. The clay dispersion behavior is detected by the effect of the paramagnetic impurity Fe3+ (naturally found in clay such as MMT—between 2 and 5%) on the T1 of the polymers in a polymer/MMT nanocomposite [36,38]. Fe3+ ions directly affect the T1 of the protons at the interface of polymer/clay. This paramagnetic effect propagates throughout the whole sample by spin diffusion, reducing the T1 measured in the bulk nanocomposite [39]. The extent of this effect on T1 depends on the Fe3+ concentration in the MMT and the average distance between the polymer–clay interfaces. Therefore, the influence of the Fe3+ ions on the T1 of the polymer is stronger in the case of full exfoliation; a better exfoliation of the clay layers contributes to increasing the clay–polymer interfacial area, reduces the distances between the clay layers and polymers, and reduces the spin diffusion path [36,40,41,42].
In this paper, the T1 distribution time was used only as a qualitative view to analyze the trend of clay dispersion in gellan gum/MMT nanocomposites as a function of the clay content. Figure 2 shows the ILT spectra obtained from CWFP-T1 signals in the films of GGLA-G0, GG-MMT1, GG-MMT5, GG-MMT20, and GG-MMT40. All these spectra have two signals in the T1 distribution time spectra pertaining to films of GGLA-G0 and GG-MMT. As expected, the presence of the MMT shortened the T1 of the bulk polymer component (T1b is the signal with the longest T1 value in Figure 2). However, as reported for the exfoliated clay, T1b did not decrease steeply as the fraction of MMT increased [36,41,42,43].
The observed T1 of the matrix in the clay nanocomposites is attributed to the following factors: the T1 of the polymer without clay (T1polymer), the T1 associated with the molecular mobility (T1mobility), which can be affected by the interactions between the polymer and clay, and the T1 of the effect of paramagnetic Fe3+ ions (T1para). In this study, the molecular mobility effect on the relaxation of the gellan gum matrix wasinsignificant; therefore, T1mobility was not taken into account [38]. The rates of T1, T1polymer, and T1para are correlated in the equation of the approximate “sum-of-rates: 1/T1 = 1/T1polymer + 1/T1para.” This equation is commonly used to characterize nylon–clay nanocomposites, as described previously [37,38,44].
T1para is more sensitive than T1polymer to the quality of clay dispersion since it is dependent on the average separation between the clay layers and the efficiency of the proton relaxation near the clay surfaces [37]. The rate of T1para is commonly correlated to the surface-to-volume ratio ( S clay / V polymer 1 / T 1 para ), as reported previously [37,38,44]. Therefore, the higher the clay–polymer interfacial area, the shorter the T1para and the better the clay dispersion in the polymer matrix. Nevertheless, to calculate the surface-to-volume ratio, a sample with a known clay dispersion is required [36,37,38]. In this article, T1para was used only to conduct a qualitative analysis of the clay dispersion.
The 1/T1para of GG-MMT was calculated using the “sum-of-rates” equation and replacing T1 and T1polymer by the values of the T1b components from GG-MMT (Figure 2b–e) and GGLA-G0 (Figure 2a), respectively. The GG-MMT 1/T1para values increased from 1.6 s to 7.6 s with the clay increment from 1 to 40 wt.%, respectively. These results resemble the clay nanocomposites containing 3.11 wt.% of Fe3+ and with more than three clay platelets stuck together [36,45]. As the clay–polymer interfacial area reduces proportional to the number of clay platelets stuck together, the GGMMT–clay interfacial area was reduced by a factor of more than three, which indicates the poor clay dispersion as a function of the clay content [37].
Furthermore, the area of the short T1 (the shortest T1 signal (T1a) in Figure 2) on the GGLA-G0 increased according to the clay fraction increment. Multiple T1 components in clay nanocomposites are related to poor clay dispersion and indicate flocculated and intercalated systems [36,38,41,43]. Therefore, the enlargement of the T1a may be correlated with the aggregates of clay pallets in agreement with the T1b and T1para results. The enlargement in the area of the T1a distribution time becomes more significant when the clay is equal to or higher than 20 wt.%, which indicates that the clay dispersion is less homogeneous in GG-MMT20 (Figure 2d) and GG-MMT40 (Figure 2e) than in the GG-MMT1 and GG-MMT5 samples, in agreement with XRD results.

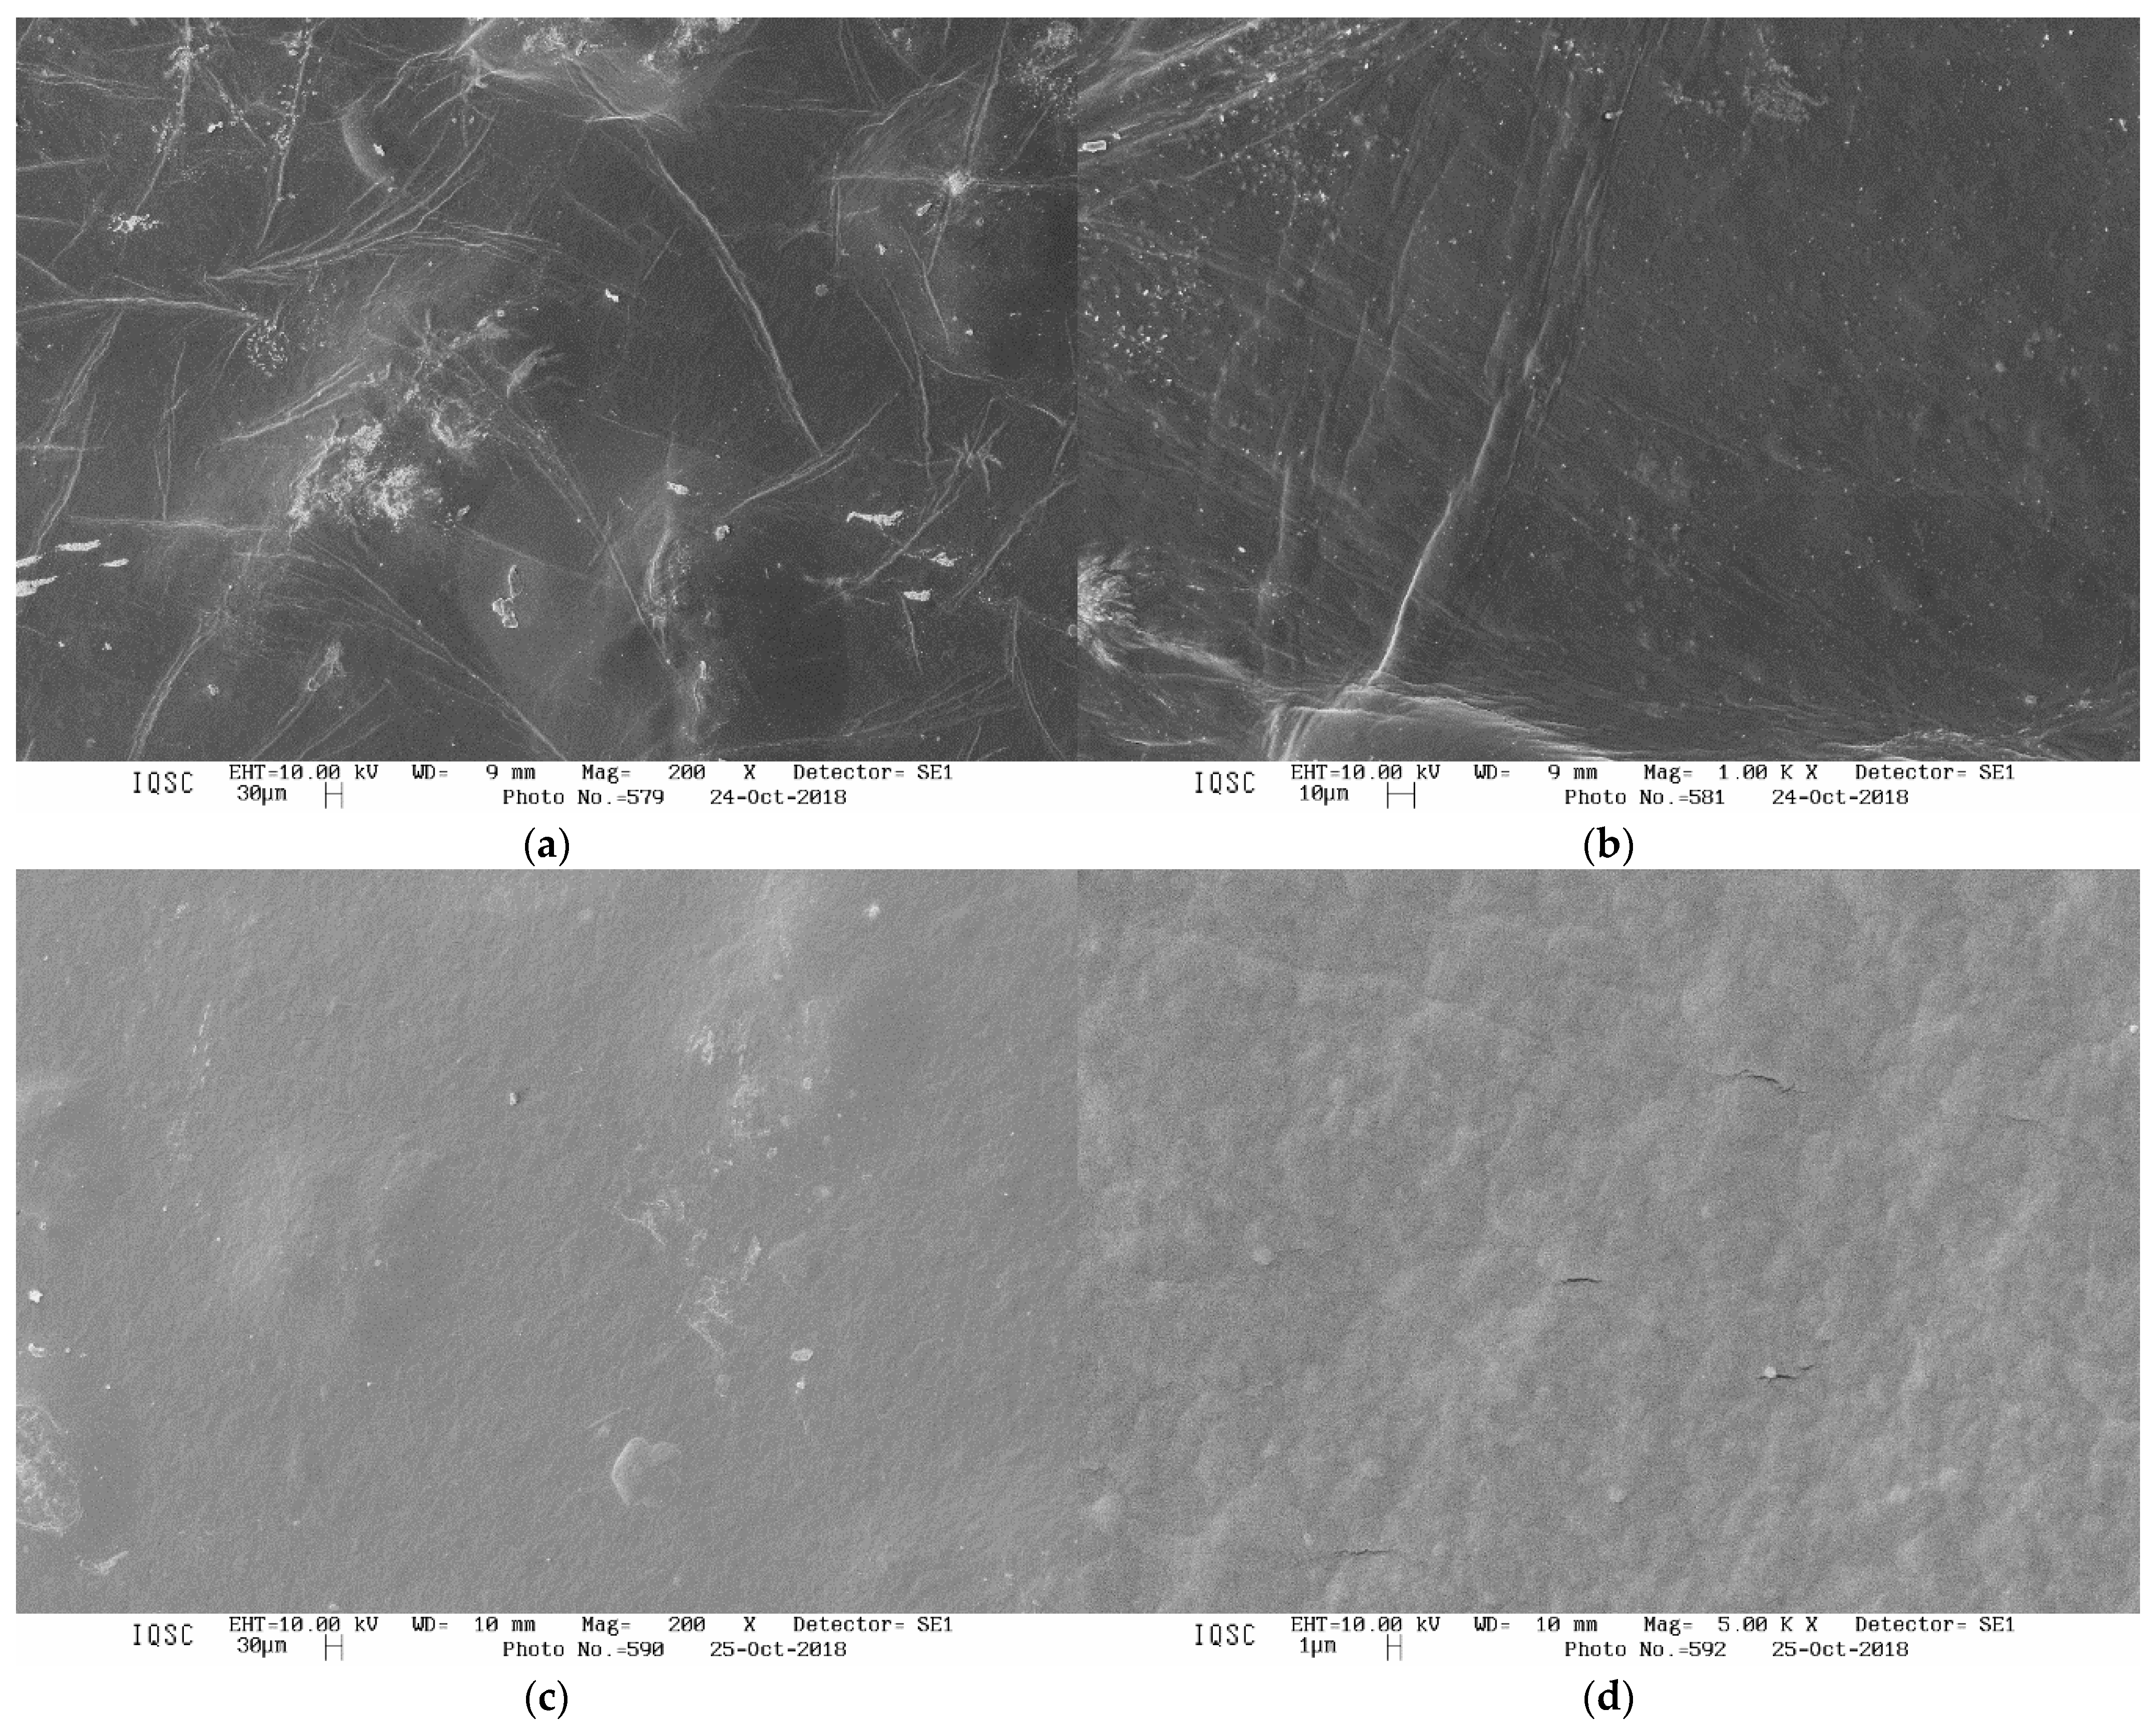
3.3. SEM Micrographs

Figure 3a,b present images of the 200 and 1000× magnification of the GGLA-G40 electrolyte surface. Disruptions which appeared in the GGLA-G40 surface were certainly generated by the high amount of LiClO4 salt. This caused an increase in the crystallinity of the material and corroborates the XRD results (not shown here) that pointed to a predominantly intercalated structure [31]. GG-MMT40 exhibits a more homogeneous surface (Figure 3c,d) and less cracks compared to GGLA-G40. Na+SYN-1 loading may have promoted this change in the surface of the material. These images contrast with those obtained by other authors [46].

3.4. Electrochromic Devices

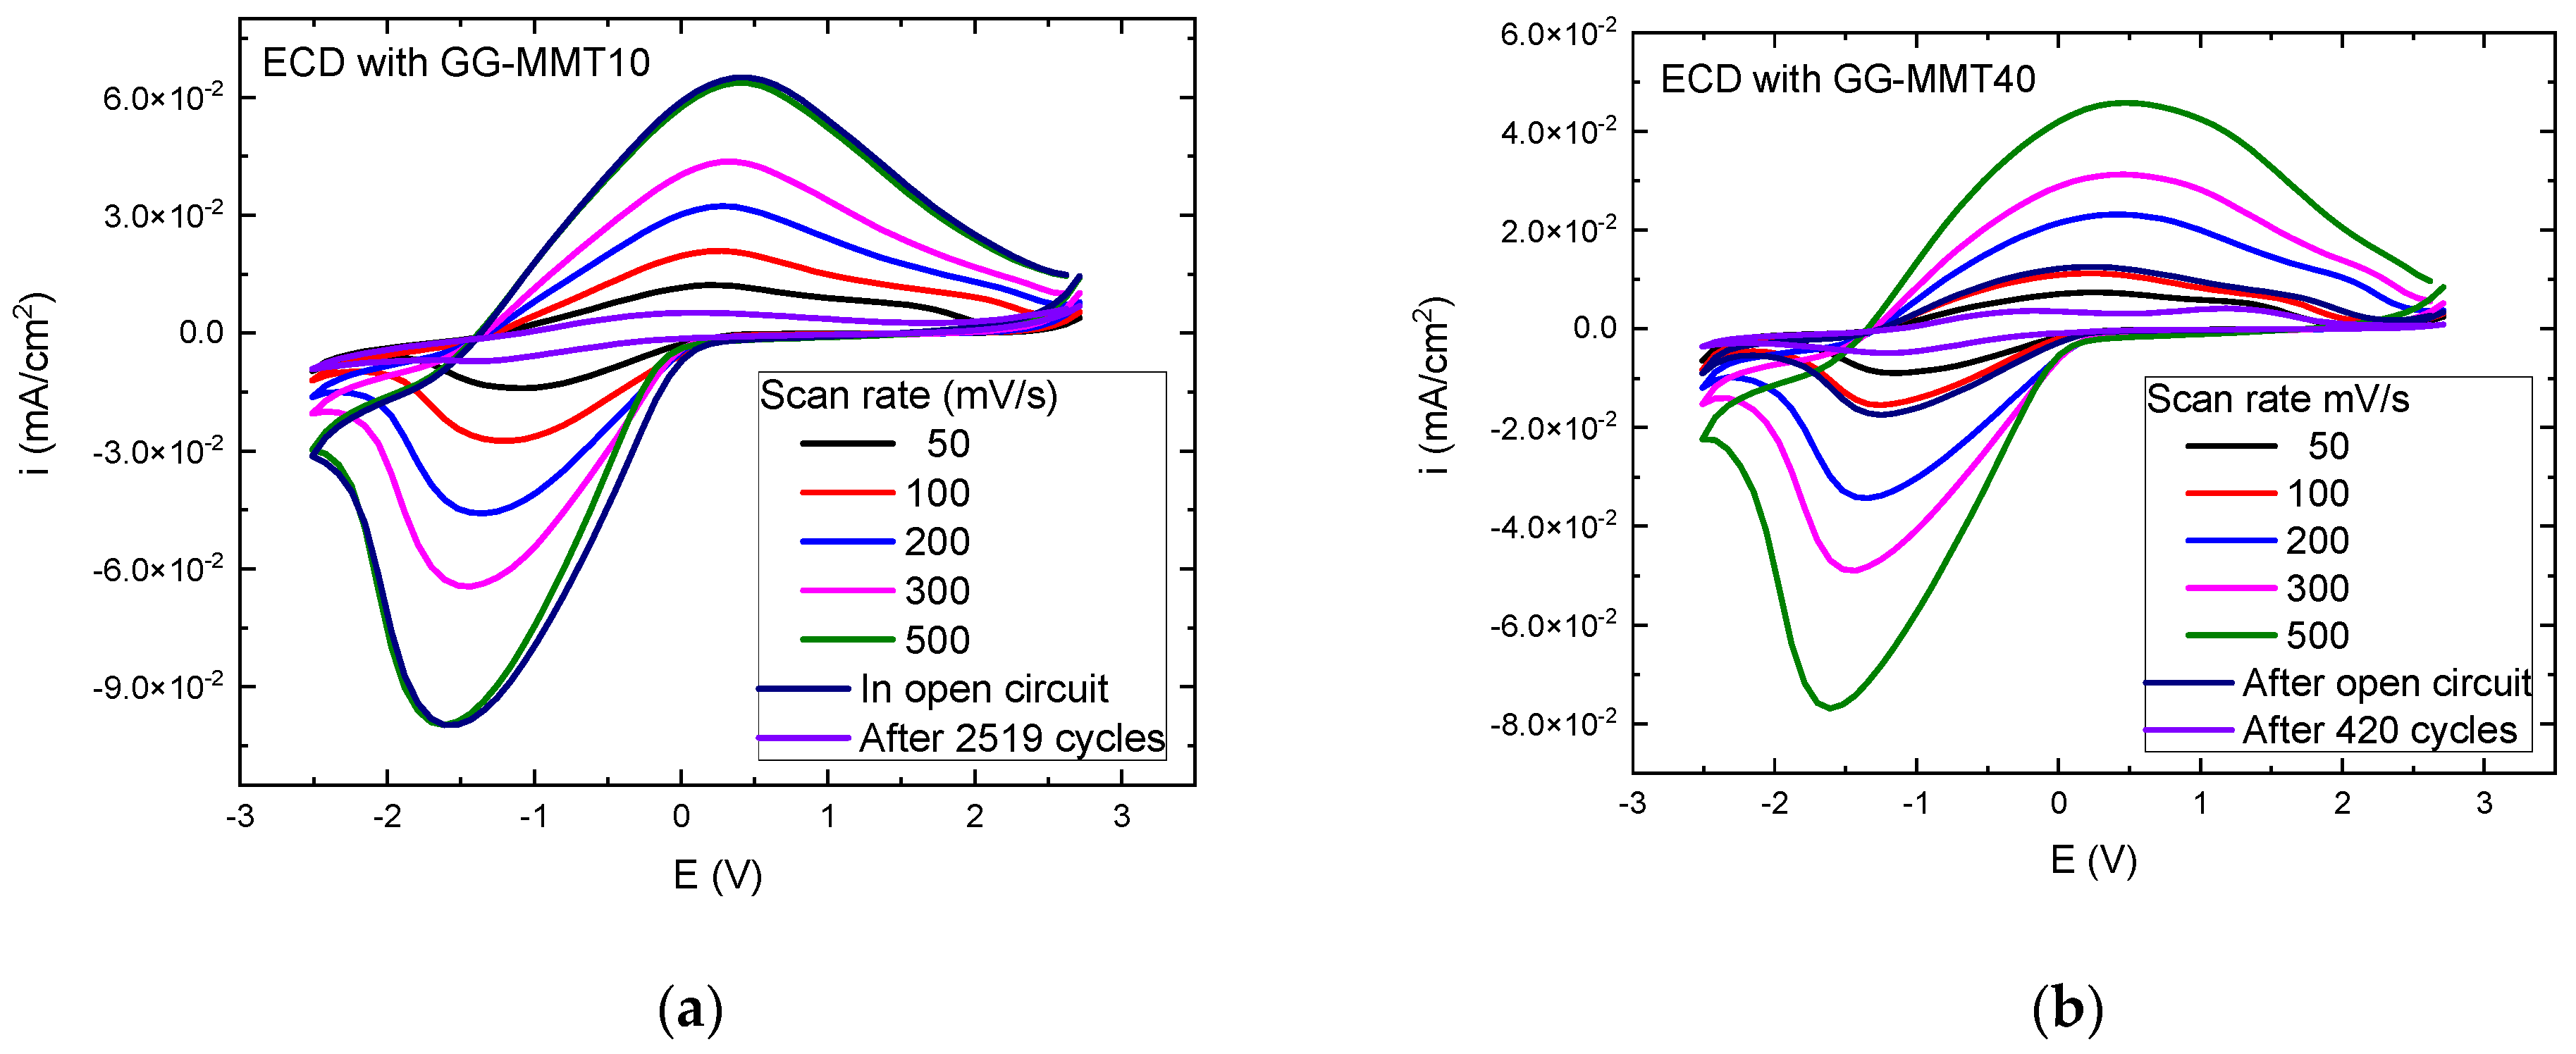
3.4.1. Cyclic Voltammetry and Chronocoulometry

Two samples, GG-MMT10 and GG-MMT40. Had the highest ionic conductivity values of 1.86 × 10⁻⁵ and 1.38 × 10⁻⁵ S/cm at 30 °C [31], respectively, and they were chosen to be applied in glass/ITO/WO3/GG-MMT10 and 40/CeO2-TiO2/ITO/glass ECDs. In comparison, the two samples without clay, i.e., GGLA-G0 and GGLA-G40, had ionic conductivities of 3.64 × 10⁻⁷ and 2.14 × 10⁻⁶ S/cm at 30 °C [31], respectively, and this is the reason why they were not tested in ECDs. Cyclic voltammetries of the WO3-ECDs were performed at scan speeds from 50 to 500 mV/s and potentials from −2.8 to 2.5 V, and the results are shown in Figure 4.
The ECD containing GG-MMT10 (Figure 4a) showed an increase in the anodic and cathodic current peaks with a rising scan speed from 1.2 × 10⁻² mA/cm2 at 50 mV/s to 6.4 × 10⁻² mA/cm2 at 500 mV/s—anodic potentials—and from −1.4 × 10⁻² to −9.9 × 10⁻² mA/cm2—cathodic potentials–which are conformable results in comparison to Leones et al. [47], Alves et al. [48], Eren et al. [49], and Deniz et al. [50]. An increase in the scan speed caused the peaks to shift to higher values for anodic potentials, ranging from 0.19 to 0.37 V, and lower values when applying cathodic potentials from −1.07 to −1.61 V. The ECD with GG-MMT40 exhibited a similar behavior (Figure 4b); however, the anodic current peak increased from 0.7 × 10⁻² mA/cm2 at 50 mV/s to 4.6 × 10⁻² mA/cm2 at 500 mV/s. At the same time, this peak shifted from 0.28 to 0.46 V. The cathodic peak deviated from −0.8 × 10⁻² (−1.16 V) to −7.6 × 10⁻² mA/cm2 (−1.61 V).
After we subjected the ECD with GG-MMT10 to a cyclic voltammetry at 100 mV/s, the curve was equal to the voltammogram at 500 mV/s before the open circuit (Figure 4a). ECD with GG-MMT40 (Figure 4b) almost reproduced the curve at 100 mV/s. A series of chronocoulometry measurements were performed together with transmittance measurements at 480, 550, and 633 nm every 45 s to observe the change in the transmittance difference in the ECDs against the cathodic/anodic cycling. After 2519 cycles, the ECD with GG-MMT10 showed a decrease in anodic and cathodic peaks compared to the first voltammograms, as described in previous work [51]. It was probably due to a degradation mechanism, as studied before [52,53]. However, it was different from that observed by Han et al. [54]. The anodic current reached 0.5 × 10⁻² mA/cm2 at 0.1 V and the cathodic current exhibit −0.7 × 10⁻² mA/cm2 at −1.3 V. On the other hand, in addition to the shrinkage of the peaks, two anodic peaks appeared in the voltammogram of the ECD with GG-MMT40 after 420 cycles, indicating that a second oxidation reaction occurred during potential application [55], a phenomenon seen in multicomponent systems or by transfer of the charge through several steps.
Figure 5 shows the charge density versus time for both ECDs. When applying a potential of −2.8 V for 15 s, the inserted charge reached approximately −0.69 mC/cm2 in the ECD with GG-MMT10 (Figure 5a) and −0.34 mC/cm2 in the ECD with GG-MMT40 (Figure 5b).
The cathodic/anodic charge ratio for both devices containing GG-MMT10 and GG-MMT40 was 0.95, higher when compared to that of Eren [26]. Such a ratio can be considered high, and this is due to the reversibility of the Li+ intercalation/deintercalation process in nanocomposites. After the series of chronocoulometric measurements, the inserted and removed charge ratio remained the same in both samples. However, there was a decrease in the density of the charge with the increase in the consecutive intercalation /deintercalation cycles. In the case of the ECD with GG-MMT10, it decreased from −0.69 to −0.14 mC/cm2 after 2519 cycles, and in the ECD with GG-MMT40, it decreased from −0.34 to −0.11 mC/cm2 after 420 cycles. Probably some degradation process occurred in the ECDs with the increasing number of chronocoulometric cycles, already observed by others [14], or some of the charges remained imprisoned in the WO3 coating, as already observed before [47,56].

3.4.2. UV-Vis Reflectance and Transmission Spectroscopy of WO3-ECDs

UV-vis reflectance and transmittance measurements of the electrochromic devices were performed before the application of any potential (as assembled), during the open circuit, and after applying a potential of −2.8 V (colored state) and then 2.5 V (discolored state). The results of these measurements are shown in Figure 6.
The reflectance spectra of the ECDs containing the GG-MMT10 show a decrease from 4 to 1.5% in the range of 200 to 320 nm (UV radiation), without exhibiting differences between the as-deposited, colored, and discolored states (Figure 6a). These values are close to those reported in the literature with an ECD containing PADA electrolytes [57]. Then, there was a sharp increase in the reflectance from 320 to 390 nm and a diminution to 550 nm, which continued decreasing much slower up to 800 nm. At 633 nm, the as-assembled ECD with GG-MMT10 exhibited a reflectance of 3.19%; in the colored state, it reached 2.85% and in the discolored it was 3.33%, indicating that the reflectance difference between the colored and discolored states was 0.48%. At 700 nm, there was a 0.55% reflectance difference between the colored and discolored states of the ECD.
Figure 6b shows the transmittance spectra of the ECD with GG-MMT10. The difference between the colored and discolored state was 0.36% at 550 nm, 4.99% at 633 nm, and 10.23% at 800 nm, indicating a rise in the transmittance difference with an increasing wavelength.
The transmittance values of the ECD with GG-MMT10 at 480, 550, and 633 nm were attained as 49.82, 54.79, and 55.42%, respectively (Figure 6c). The values at 550 nm increased to 57.55% after 174 cycles (5205 s), decreased back to 54.57% after 260 cycles (7815 s), and increased again to 58.43% after 1002.5 cycles (30,075 s), resulting in a difference of approximately 4%. An increase in transmittance, observed at 260 cycles, suggests the oxidation of the WO3 electrochromic layer [26]. The transmittance difference in GG-MMT10 (Figure 6d) kept values close to the spectra prior to the open circuit, e.g., 0.71% at 550 nm and 11.35% at 800 nm.
A series of transmittance measurements at 480, 550, and 633 nm made every 45 s was carried out in parallel to the application of the anodic and cathodic potentials through chronocoulometry (system equilibrium for 4 s and applied potentials of −2.8 and 2.5 V for 15 s each). Between 13 to 18 coloring/discoloring cycles of the ECD with GG-MMT10 (Figure 6e) there was a difference in transmittance of approximately 10% at 480 and 550 nm and 12% at 633 nm. Around the 420th cycle, this difference dropped to 1.41% at 633 nm and 0.76% at 480 nm. In the 2519th cycle, it remained as 0.5% at 633 nm. The ECD containing GG-MMT10 did not maintain the difference in transmittance between the colored/discolored states during the chronocoulometry cycles as in previous studies [28,58]. A phenomenon was observed similar to that which occurred during the open circuit (Figure 6c), with changes similar to “waves” in transmittance over time, indicating some unknown redox process in the working electrode [26].
The ECD with GG-MMT10′s transmittance spectrum, after 2519 cycles, showed practically no difference between the colored/discolored states (Figure 6f).
In the case of the ECD containing GG-MMT40 (Figure 7a), there was a difference of approximately 5% between the colored and discolored/as-deposited states in the UV range and diminution in reflectance from 230 to 300 nm, followed by an increase of up to 400 nm and a decrease of up to 800 nm. The 200 nm peak is related to the σ-σ* transition of the sp3-hybridized carbons belonging to the gellan gum, and the peak at 320 nm refers to the π-π* transition of the sp2 hybridization [59]. The reflectance difference between the colored/discolored states was 4.72% at 480 nm, 2.57% at 550 nm, and 1.84% at 633 nm, indicating a decrease between the two states with the increase in the wavelength.
The ECD with GG-MMT40 shows differences in transmittance of 2.02% at 480 nm and 11.15% at 633 nm (Figure 7b), results similar to those reached by Puguan and Kim [27] but much lower when compared to other devices [60]. It may be due to the poor electrical contact between the NPE and the ECD’s electrodes. The GG-MMT NPEs are not flexible and did not exhibit a good adherence to the electrodes. This disadvantaged the transport of charge between the electrode and the electrolyte, resulting in a low transmittance variation and probably helped ion trapping by the electrodes’ coatings [52]. On the other hand, it is noteworthy that from 200 to approximately 310 nm, both devices exhibited 0% transmittance, preventing the passage of UV radiation.
The ECD with GG-MMT40 exhibited a decrease in the transmittance in the open circuit, measured between 0 and 30,030 s (Figure 7c). The changes were 3.57% at 480 nm, 3.79% at 550 nm, and 3.05% at 633 nm, which revealed that there was a spontaneous reduction process in the working electrode. The ECDs with GG-MMT10 and GG-MMT40 exhibited a greater difference in transmittance at 550 nm after the open circuit; however, the transmittance difference in the ECD with GG-MMT40 (Figure 7d) increased more than that with GG-MMT10 (Figure 6d), i.e., from 7.23% to 15.19% at 550 nm.
Figure 7e shows that the ECD with GG-MMT40 reached a transmittance difference of 1.44% at 480 nm, 3.52% at 550 nm, and 6.79% at 633 nm in the 60th cycle. This difference gradually decreased until the 150th cycle. From this to cycle 420, the values remained between 0.25% at 480 nm and 1.05% at 633 nm. The ECD containing GG-MMT NPEs did not maintain the transmittance between the colored/discolored states’ stability during chronocoulometry cycles as seen in other studies [28,58].
Figure 7f shows that, after 420 cycles, there is still a difference in the transmittance between the colored/discolored states of 2.06% at 480 nm, 3.30% at 550 nm, and 6.32% at 633 nm. This points out that, despite the degradation observed in the electrochemical measurements, an oxy-reduction process persists with the application of cathodic and anodic potentials.

4. Conclusions

This paper presented the results of NPEs based on gellan gum and montmorillonite clay. The ATR-FTIR indicated a molecular interaction between the gellan gum and Na+SYN-1 because of shifts of 2–20 cm−1 to the lower energy of acetate and glycosidic bands. TD-NMR measurements pointed to the poor dispersion of clay in the polymeric matrix for the samples above 20 wt.%. However, the GG-MMT40 SEM pictures revealed an excellent surface homogeneity, despite the crystallinity exposed by some small disruption on the membrane surface, compared with the membranes without clay. This corroborated the XRD intercalated structure of the samples. The cyclic voltammograms of the ECDs with GG-MMT10 and GG-MMT40 showed a decrease in the anodic and cathodic peak currents after 2519 and 420 chronocoulometric cycles, respectively. Moreover, two anodic peaks appeared in the GG-MMT40 after 420 cycles, indicating that a second oxidation reaction occurred during the potential application. The chronocoulometric measurements revealed that the charge ratio remained the same in both samples. However, there was a decrease in the density of the charge as the number of cycles increased, which was probably caused by some degradation process that occurred in the ECD during the intercalation/deintercalation process. The ECD with GG-MMT10 revealed oscillating transmittance values over 2519 chronocoulometric cycles. After 2519 cycles, there was no difference in the transmittance between the colored and discolored states. The ECD with GG-MMT40 after 420 cycles showed a difference in transmittance between the colored/discolored states of 2.06% at 480 nm, 3.30% at 550 nm, and 6.32% at 633 nm. In summary, this type of nanocomposite material still needs to be analyzed regarding its mechanical and rheological properties, and it is desirable to test it in other applications.

Author Contributions

Conceptualization, A.P. and L.A.C.; methodology, F.C.S., R.C.S., T.M. and R.H.S.G.; validation, F.C.S., R.C.S., T.M. and R.H.S.G.; investigation, W.R.C., F.C.S., R.C.S., R.H.S.G. and T.M.; resources, A.P.; writing—original draft preparation, W.R.C. and R.H.S.G.; writing—review and editing, A.P. and L.A.C.; supervision, A.P. and L.A.C.; project administration, A.P. All authors have read and agreed to the published version of the manuscript.

Funding

This research was funded by the Brazilian National Council for Scientific and Technological Development (CNPq) for grant numbers 307429/2017-2, 310693/2021-7 (A.Pawlicka), and 406617/2013-9 (W.R.Caliman). It was also funded by Coordenação de Aperfeiçoamento de Pessoal de Nível Superior—Brasil (CAPES)—(Finance Code 001; grant number PNPD20131739-33002045017P6 for F.C. Sentanin fellowship number 1573926) and grant number 88881.172281/2018-01 (R.C. Sabadini).

Institutional Review Board Statement

Not applicable.

Informed Consent Statement

Not applicable.

Data Availability Statement

Not applicable.

Acknowledgments

The authors thank CP Kelco for the gellan gum samples and C.C.S. Cavalheiro for the clay.

Conflicts of Interest

The authors declare no conflict of interest.

References

  1. Adak, B.; Joshi, M.; Butola, B.S. Polyurethane/clay nanocomposites with improved helium gas barrier and mechanical properties: Direct versus master-batch melt mixing route. J. Appl. Polym. Sci. 2018, 135, 46422. [Google Scholar] [CrossRef]
  2. Pandey, P.; Mohanty, S.; Nayak, S.K. Improved flame retardancy and thermal stability of polymer/clay nanocomposites, with the incorporation of multiwalled carbon nanotube as secondary filler: Evaluation of hybrid effect of nanofillers. High Perform. Polym. 2014, 26, 826–836. [Google Scholar] [CrossRef]
  3. Narayanamoorthy, B.; Datta, K.; Eswaramoorthy, M.; Balaji, S. Improved oxygen reduction reaction catalyzed by pt/clay/Nafion nanocomposite for PEM fuel cells. ACS Appl. Mater. Int. 2012, 4, 3620–3626. [Google Scholar] [CrossRef] [PubMed]
  4. Sentanin, F.; Sabadini, R.; Barros, S.; Caliman, W.; Cavalheiro, C.; Kanicki, J.; Donoso, J.P.; Magon, C.J.; Silva, I.; Silva, M.; et al. Study of ionically conducting nanocomposites for reflective electrochromic devices. Electrochim. Acta 2019, 301, 174–182. [Google Scholar] [CrossRef]
  5. Valandro, S.R.; Lombardo, P.C.; Poli, A.L.; Horn, M.A., Jr.; Neumann, M.G.; Cavalheiro, C.C.S. Thermal properties of poly (methyl methacrylate)/organomodified montmorillonite nanocomposites obtained by in situ photopolymerization. Mat. Res. 2014, 17, 265–270. [Google Scholar] [CrossRef]
  6. Anwar, N.; Ishtiaq, M.; Shakoor, A.; Niaz, N.A.; Rizvi, T.Z.; Qasim, M.; Irfan, M.; Mahmood, A. Dielectric properties of polymer/clay nanocomposites. Polym. Polym. Comp. 2021, 29, 807–813. [Google Scholar] [CrossRef]
  7. Das, A.; Thakur, A.K. Role of clay intercalation in the structural, and thermal property of a polymer blend electrolyte. Mater. Today Proc. 2021, 47, 1665–1669. [Google Scholar] [CrossRef]
  8. Verma, G. Weathering, salt spray corrosion and mar resistance mechanism of clay (nano-platelet) reinforced polyurethane nanocomposite coatings. Prog. Org. Coat. 2019, 129, 260–270. [Google Scholar] [CrossRef]
  9. Echeverría, I.; López-Caballero, M.E.; Gómez-Guillén, M.C.; Mauri, A.N.; Montero, M.P. Active nanocomposite films based on soy proteins-montmorillonite-clove essential oil for the preservation of refrigerated bluefin tuna (Thunnus thynnus) fillets. Int. J. Food Microbiol. 2018, 266, 142–149. [Google Scholar] [CrossRef]
  10. Reddy, G.V.R.; Joshi, M.; Adak, B.; Deopura, B.L. Studies on the dyeability and dyeing mechanism of polyurethane/clay nanocomposite filaments with acid, basic and reactive dyes. Color. Technol. 2018, 134, 117–125. [Google Scholar] [CrossRef]
  11. Dyartanti, E.R.; Purwanto, A.; Widiasa, I.N.; Susanto, H. Ionic Conductivity and Cycling Stability Improvement of PVDF/Nano-Clay Using PVP as Polymer Electrolyte Membranes for LiFePO4 Batteries. Membranes 2018, 8, 36. [Google Scholar] [CrossRef] [PubMed]
  12. Lee, S.Y.; Ahn, J.-Y.; Kim, M.; Sekhon, S.S.; Cho, S.-J.; Kim, Y.-C.; Kim, Y.-H. Phenotypic and proteomic analysis of positively regulated gellan biosynthesis pathway in Sphingomonas elodea. Anim. Cells Syst. 2017, 21, 115–123. [Google Scholar] [CrossRef] [PubMed]
  13. Osmałek, T.; Froelich, A.; Tasarek, S. Application of gellan gum in pharmacy and medicine. Int. J. Pharm. 2014, 466, 328–340. [Google Scholar] [CrossRef]
  14. Noor, I.S.M.; Majid, S.R.; Arof, A.K.; Djurado, D.; Pawlicka, A. Characteristics of gellan gum-LiCF3SO3 polymer electrolyte. Solid State Ion. 2012, 225, 649–653. [Google Scholar] [CrossRef]
  15. Pacelli, S.; Paolicelli, P.; Moretti, G.; Petralito, S.; Di Giacomo, S.; Vitalone, A.; Casadei, M.A. Gellan gum methacrylate and laponite as an innovative nanocomposite hydrogel for biomedical applications. Eur. Polym. J. 2016, 77, 114–123. [Google Scholar] [CrossRef]
  16. Borah, S.; Deka, M. Study of electrical and electrochemical properties of P (VdF-HFP)-MMT based nanocomposite gel polymer electrolytes for application in energy storage devices. Mater. Sci. Eng. B 2021, 263, 114822. [Google Scholar] [CrossRef]
  17. Chen, R.S.; Ahmad, S.; Gan, S. Characterization of recycled thermoplastics-based nanocomposites: Polymer-clay compatibility, blending procedure, processing condition, and clay content effects. Compos. Part B Eng. 2017, 131, 91–99. [Google Scholar] [CrossRef]
  18. Sudhakar, Y.; Selvakumar, M.; Bhat, D.K. Investigations on thermo-mechanical properties of organically modified polymer clay nanocomposites for packaging application. Polym. Polym. Comp. 2021, 29, 1191–1199. [Google Scholar] [CrossRef]
  19. Jeon, Y.M.; Kim, S.; Lee, M.; Lee, W.B.; Park, J.H. Polymer-clay nanocomposite solid-state electrolyte with selective cation transport boosting and retarded lithium dendrite formation. Adv. Energy. Mater. 2020, 10, 2003114. [Google Scholar] [CrossRef]
  20. TaŞdelen, M.A.; AltinkÖk, Ç. In situ preparation of hetero-polymers/clay nanocomposites by CUAAC click chemistry. Turk. J. Chem. 2021, 45, 50–59. [Google Scholar] [CrossRef]
  21. Peng, W.; Feng, C.; Hou, J.; Zhang, R.; Sun, P.; Gao, Y.; Wang, X. Probing the Dynamic Structural Evolution of End-Functionalized Polybutadiene/Organo-Clay Nanocomposite Gels before and after Yielding by Nonlinear Rheology and 1H Double-Quantum NMR. Polymers 2022, 14, 1518. [Google Scholar] [CrossRef]
  22. Prasanth, R.; Shubha, N.; Hng, H.H.; Srinivasan, M. Effect of nano-clay on ionic conductivity and electrochemical properties of poly (vinylidene fluoride) based nanocomposite porous polymer membranes and their application as polymer electrolyte in lithium ion batteries. Eur. Polym. J. 2013, 49, 307–318. [Google Scholar] [CrossRef]
  23. Suter, J.L.; Groen, D.; Coveney, P.V. Chemically Specific Multiscale Modeling of Clay–Polymer Nanocomposites Reveals Intercalation Dynamics, Tactoid Self-Assembly and Emergent Materials Properties. Adv. Mater. 2015, 27, 966–984. [Google Scholar] [CrossRef] [PubMed]
  24. Moraes, T.B.; Monaretto, T.; Colnago, L.A. Rapid and simple determination of T1 relaxation times in time-domain NMR by Continuous Wave Free Precession sequence. J. Magn. Reson. 2016, 270, 1–6. [Google Scholar] [CrossRef] [PubMed]
  25. Monaretto, T.; Souza, A.; Moraes, T.B.; Bertucci-Neto, V.; Rondeau-Mouro, C.; Colnago, L.A. Enhancing signal-to-noise ratio and resolution in low-field NMR relaxation measurements using post-acquisition digital filters. Magn. Reson. Chem. 2019, 57, 616–625. [Google Scholar] [CrossRef] [PubMed]
  26. Esin, E. Li+ doped chitosan-based solid polymer electrolyte incorporated with PEDOT: PSS for electrochromic device. J. Turk. Chem. Soc. Sect. A Chem. 2019, 5, 1413–1422. [Google Scholar] [CrossRef]
  27. Puguan, J.M.C.; Kim, H. ZrO2-silane-graft-PVdFHFP hybrid polymer electrolyte: Synthesis, properties and its application on electrochromic devices. Electrochim. Acta 2017, 230, 39–48. [Google Scholar] [CrossRef]
  28. Wang, J.-Y.; Wang, M.-C.; Jan, D.-J. Synthesis of poly (methyl methacrylate)-succinonitrile composite polymer electrolyte and its application for flexible electrochromic devices. Sol. Energy Mater. Sol. Cells 2017, 160, 476–483. [Google Scholar] [CrossRef]
  29. Zhang, S.; Lei, P.; Fu, J.; Tong, X.; Wang, Z.; Cai, G. Solution-processable multicolor TiO2/polyaniline nanocomposite for integrated bifunctional electrochromic energy storage device. Appl. Surf. Sci. 2023, 607, 155015. [Google Scholar] [CrossRef]
  30. Reddy, G.A.; Shaik, H.; Kumar, K.N.; Shetty, H.D.; Jafri, R.I.; Naik, R.; Gupta, J.; Sattar, S.A.; Doreswamy, B. Synthesis, characterizations, and electrochromic studies of WO3 coated CeO2 nanorod thin films for smart window applications. Phys. B Cond. Matter 2022, 647, 414395. [Google Scholar] [CrossRef]
  31. Caliman, W.R.; Sentanin, F.C.; Sabadini, R.C.; Donoso, J.P.; Magon, C.J.; Pawlicka, A. Improved Conductivity in Gellan Gum and Montmorillonite Nanocomposites Electrolytes. Molecules 2022, 27, 8721. [Google Scholar] [CrossRef] [PubMed]
  32. Monaretto, T.; Andrade, F.D.; Moraes, T.B.; Souza, A.A.; deAzevedo, E.R.; Colnago, L.A. On resonance phase alternated CWFP sequences for rapid and simultaneous measurement of relaxation times. J. Magn. Reson. 2015, 259, 174–178. [Google Scholar] [CrossRef] [PubMed]
  33. Mitchell, J.; Chandrasekera, T.; Gladden, L. Numerical estimation of relaxation and diffusion distributions in two dimensions. Prog. Nucl. Mag. Res. Spec. 2012, 62, 34–50. [Google Scholar] [CrossRef] [PubMed]
  34. Assis, L.M.N.; Leones, R.; Kanicki, J.; Pawlicka, A.; Silva, M.M. Prussian blue for electrochromic devices. J. Electroanal Chem. 2016, 777, 33–39. [Google Scholar] [CrossRef]
  35. Madejova, J.; Komadel, P. Baseline studies of the clay minerals society source clays: Infrared methods. Clays Clay Miner. 2001, 49, 410–432. [Google Scholar] [CrossRef]
  36. Bertmer, M.; Wang, M.; Krueger, M.; Bluemich, B.; Litvinov, V.M.; van Es, M. Structural Changes from the Pure Components to Nylon 6− Montmorillonite Nanocomposites Observed by Solid-State NMR. Chem. Mater. 2007, 19, 1089–1097. [Google Scholar] [CrossRef]
  37. VanderHart, D.L.; Asano, A.; Gilman, J.W. Solid-state NMR investigation of paramagnetic nylon-6 clay nanocomposites. 2. Measurement of clay dispersion, crystal stratification, and stability of organic modifiers. Chem. Mater. 2001, 13, 3796–3809. [Google Scholar] [CrossRef]
  38. Zhang, X.; Dean, K.; Burgar, I.M. A high-resolution solid-state NMR study on starch–clay nanocomposites and the effect of aging on clay dispersion. Polym. J. 2010, 42, 689–695. [Google Scholar] [CrossRef]
  39. Samyn, F.; Bourbigot, S.; Jama, C.; Bellayer, S.; Nazare, S.; Hull, R.; Castrovinci, A.; Fina, A.; Camino, G. Crossed characterisation of polymer-layered silicate (PLS) nanocomposite morphology: TEM, X-ray diffraction, rheology and solid-state nuclear magnetic resonance measurements. Eur. Polym. J. 2008, 44, 1642–1653. [Google Scholar] [CrossRef]
  40. Xu, B.; Leisen, J.; Beckham, H.W.; Abu-Zurayk, R.; Harkin-Jones, E.; McNally, T. Evolution of clay morphology in polypropylene/montmorillonite nanocomposites upon equibiaxial stretching: A solid-state NMR and TEM approach. Macromolecules 2009, 42, 8959–8968. [Google Scholar] [CrossRef]
  41. Asano, A.; Shimizu, M.; Kurotsu, T. Effect of Paramagnetic Fe3+ on T 1H in PVA/montmorillonite-clay Nanocomposites. Chem. Lett. 2004, 33, 816–817. [Google Scholar] [CrossRef]
  42. Asano, A. NMR Studies on Polymer Materials. In Experimental Approaches of NMR Spectroscopy: Methodology and Application to Life Science and Materials Science; The Nuclear Magnetic Resonance Society of Japan, Ed.; Springer: Singapore, Singapore, 2018; pp. 313–339. [Google Scholar] [CrossRef]
  43. Bourbigot, S.; VanderHart, D.L.; Gilman, J.W.; Awad, W.H.; Davis, R.D.; Morgan, A.B.; Wilkie, C.A. Investigation of nanodispersion in polystyrene–montmorillonite nanocomposites by solid-state NMR. J. Polym. Sci. Part B Polym. Phys. 2003, 41, 3188–3213. [Google Scholar] [CrossRef]
  44. VanderHart, D.L.; Asano, A.; Gilman, J.W. NMR measurements related to clay-dispersion quality and organic-modifier stability in nylon-6/clay nanocomposites. Macromolecules 2001, 34, 3819–3822. [Google Scholar] [CrossRef]
  45. Xu, B.; Leisen, J.; Beckham, H.W. Nanoparticle dispersion in polymer nanocomposites by spin-diffusion-averaged paramagnetic enhanced NMR relaxometry: Scaling relations and applications. Phys. Chem. Chem. Phys. 2014, 16, 16790–16797. [Google Scholar] [CrossRef]
  46. Melo, C.d.; Garcia, P.S.; Grossmann, M.V.E.; Yamashita, F.; Dall′Antônia, L.H.; Mali, S. Properties of extruded xanthan-starch-clay nanocomposite films. Braz. Arch. Biol. Technol. 2011, 54, 1223–1333. [Google Scholar] [CrossRef]
  47. Leones, R.; Fernandes, M.; Sentanin, F.; Cesarino, I.; Lima, J.F.; Bermudez, V.d.Z.; Pawlicka, A.; Magon, C.J.; Donoso, J.P.; Silva, M.M. Ionically conducting Er3+-doped DNA-based biomembranes forelectrochromic devices. Electrochim. Acta 2014, 120, 327–333. [Google Scholar] [CrossRef]
  48. Alves, R.; Sentanin, F.; Sabadini, R.C.; Pawlicka, A.; Silva, M.M. Solid polymer electrolytes based on chitosan and Dy(CF3SO3)3 for electrochromic devices. Solid State Ion. 2017, 310, 112–120. [Google Scholar] [CrossRef]
  49. Eren, E.; Karaca, G.Y.; Koc, U.; Oksuz, L.; Oksuz, A.U. Electrochromic characteristics of radio frequency plasma sputtered WO3 thin films onto flexible polyethylene terephthalate substrates. Thin Solid Film. 2017, 634, 40–50. [Google Scholar] [CrossRef]
  50. Deniz, M.; Deligöz, H. Flexible self-assembled polyelectrolyte thin films based on conjugated polymer: Quartz cristal microbalance dissipation (QCM-D) and cyclic voltammetry analysis. Colloid Surf. A 2019, 563, 206–216. [Google Scholar] [CrossRef]
  51. Leones, R.; Sentanin, F.; Rodrigues, L.C.; Ferreira, R.A.S.; Marrucho, I.M.; Esperança, J.M.S.S.; Pawlicka, A.; Carlos, L.D.; Silva, M.M. Novel polymer electrolytes based on gelatin and ionic liquids. Opt. Mat. 2012, 36, 187–195. [Google Scholar] [CrossRef]
  52. Dong, D.; Wang, W.; Rougier, A.; Barnabé, A.; Dong, G.; Zhang, F.; Diao, X. Lithium trapping as a degradation mechanism of the electrochromic properties of all-solid-state WO 3//NiO devices. J. Mater. Chem. C 2018, 6, 9875–9889. [Google Scholar] [CrossRef]
  53. Tang, X.; Chen, G.; Liao, H.; Li, Z.; Zhang, J.; Luo, J. Unveiling mechanical degradation for a monolithic electrochromic device: Glass/ITO/WO3/LiClO4 (PEO)/TiO2/ITO/glass. Electrochim. Acta 2020, 329, 135182. [Google Scholar] [CrossRef]
  54. Han, T.; Dzakpasu, C.B.; Kim, D.; Kim, S.; Jeong, Y.-C.; Ryou, M.-H.; Lee, Y.M. Thin and porous polymer membrane-based electrochromic devices. J. Mater. Chem. C 2019, 7, 1042–1047. [Google Scholar] [CrossRef]
  55. Bard, A.J.; Faulkner, L.R. Electrochemical Methods: Fundamentals and Applications, 2nd ed.; Wiley: New York, NY, USA, 2000; p. 856. [Google Scholar] [CrossRef]
  56. Wen, R.-T.; Niklasson, G.A.; Granqvist, C.G. Sustainable rejuvenation of electrochromic WO3 films. ACS Appl. Mater. Int. 2015, 7, 28100–28104. [Google Scholar] [CrossRef]
  57. Chen, W.; Zhang, G.; Wu, L.; Liu, S.; Cao, M.; Yang, Y.; Peng, Y. Study of a Novel Electrochromic Device with Crystalline WO3 and Gel Electrolyte. Polymers 2022, 14, 1430. [Google Scholar] [CrossRef] [PubMed]
  58. Dong, D.; Wang, W.; Rougier, A.; Dong, G.; Da Rocha, M.; Presmanes, L.; Zrikem, K.; Song, G.; Diao, X.; Barnabé, A. Life-cycling and uncovering cation-trapping evidence of a monolithic inorganic electrochromic device: Glass/ITO/WO 3/LiTaO 3/NiO/ITO. Nanoscale 2018, 10, 16521–16530. [Google Scholar] [CrossRef] [PubMed]
  59. Applin, D.M.; Izawa, M.R.; Cloutis, E.A.; Gillis-Davis, J.J.; Pitman, K.M.; Roush, T.L.; Hendrix, A.R.; Lucey, P.G. Ultraviolet spectral reflectance of carbonaceous materials. Icarus 2018, 307, 40–82. [Google Scholar] [CrossRef]
  60. Atak, G.; Coşkun, Ö.D. Fabrication of an all solid-state electrochromic device using zirconium dioxide as an ion-conducting layer. Thin Solid Film. 2018, 664, 70–78. [Google Scholar] [CrossRef]
Figure 1. ATR-FTIR spectra of gellan gum electrolytes, gellan gum/Na+SYN-1 nanocomposites, and Na+SYN-1 clay in the range of 4000 to 550 cm−1 (a) and 2000 to 550 cm−1 (b).
Coatings 13 00350 g001
Figure 2. ILT spectra obtained from CWFP-T1 signals for the films of GGLA-G0 (a), GG-MMT1 (b), GG-MMT5 (c), GG-MMT20 (d), and GG-MMT40 (e). The blue and red dashed lines are only a guide to identifying the T1a and T1b components, respectively.
Coatings 13 00350 g002
Figure 3. SEM micrographs of GGLA-G40 (a) at 200× and (b) at 1000× and GG-MMT40 nanocomposite (c) at 200× and (d) at 1000×.
Coatings 13 00350 g003
Figure 4. Voltammograms of the WO3-ECDs with GG-MMT10 (a) and GG-MMT40 (b), measured from −2.8 to 2.5 V at 50, 100, 200, 300, and 500 mV/s after 2519 (a) and 420 (b) coloration/discoloration cycles.
Coatings 13 00350 g004
Figure 5. Charge density versus time for WO3-ECDs containing GG-MMT10 (a) and GG-MMT40 (b).
Coatings 13 00350 g005
Figure 6. Reflectance (a) and transmittance (b) spectra as assembled; transmittance spectra during the open circuit at 480, 550, and 633 nm (c); transmittance spectra after the open circuit (d); transmittance spectra during the application of 2519 coloring/discoloring cycles at 480, 550, and 633 nm (e); and transmittance spectra after 2519 coloring/discoloring cycles (f) of WO3-ECD with GG-MMT10.
Coatings 13 00350 g006
Figure 7. Reflectance (a) and transmittance (b) spectra of WO3-ECD with GG-MMT40 before the open circuit; transmittance spectra during the open circuit at 480, 550, and 633 nm (c); transmittance spectra after the open circuit (d); transmittance spectra during the application of 420 coloring/discoloring cycles at 480, 550, and 633 nm (e); and transmittance spectra after 420 coloring/discoloring cycles (f).
Coatings 13 00350 g007
Table 1. Gellan gum/Na+SYN-1 nanocomposite formulations.
SampleGellan Gum (g)Na+SYN-1 (g)
GG-MMT11.00000.0100
GG-MMT51.00000.0500
GG-MMT101.00000.1000
GG-MMT151.00000.1500
GG-MMT201.00000.2000
GG-MMT401.00000.4000
Disclaimer/Publisher’s Note: The statements, opinions and data contained in all publications are solely those of the individual author(s) and contributor(s) and not of MDPI and/or the editor(s). MDPI and/or the editor(s) disclaim responsibility for any injury to people or property resulting from any ideas, methods, instructions or products referred to in the content.

