
Measurement of Tire-Pavement Contact Tri-Axial Stress Distribution Based on Sensor Array

Abstract
:1. Introduction
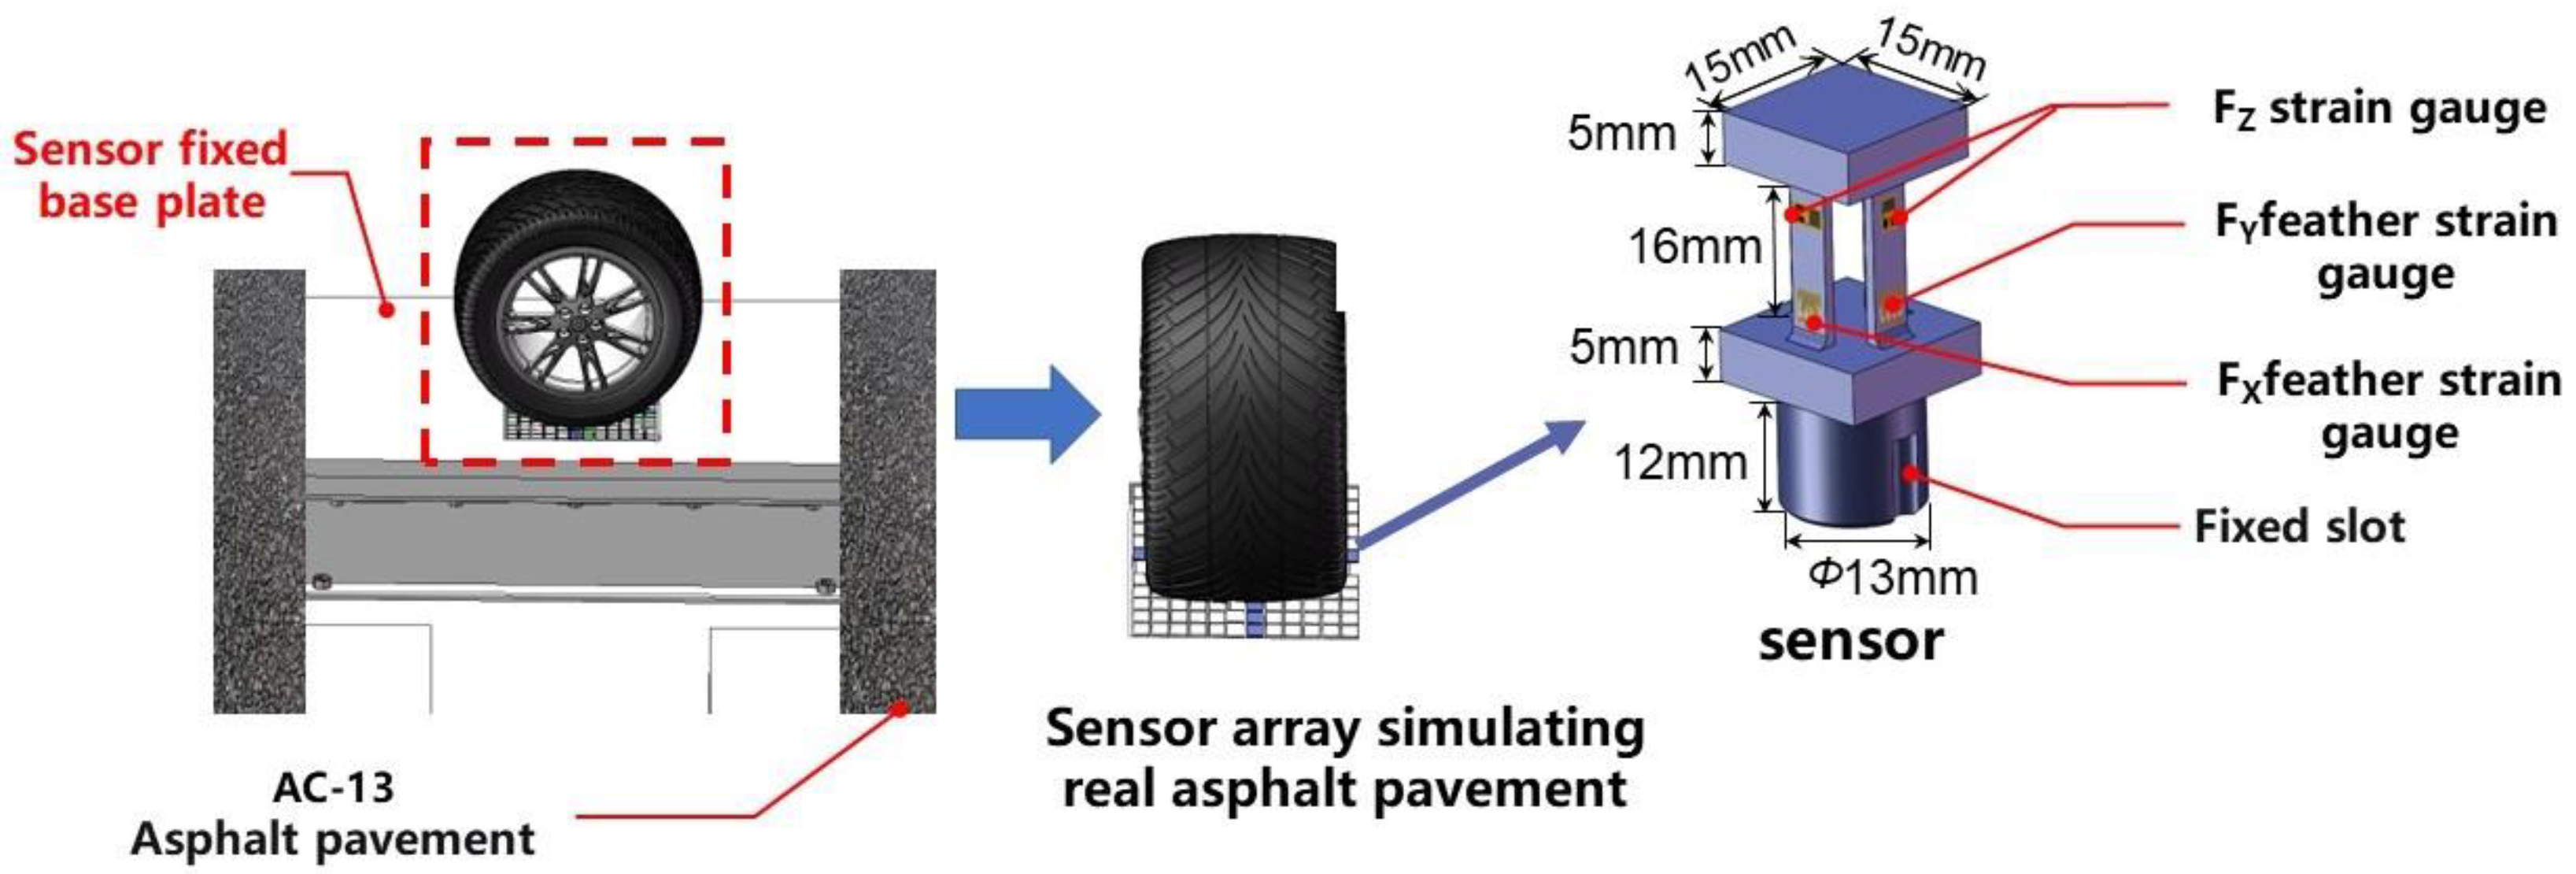
2. Sensor Design
2.1. Sensor Structure
2.2. FEA and Strain Gauge Arrangement
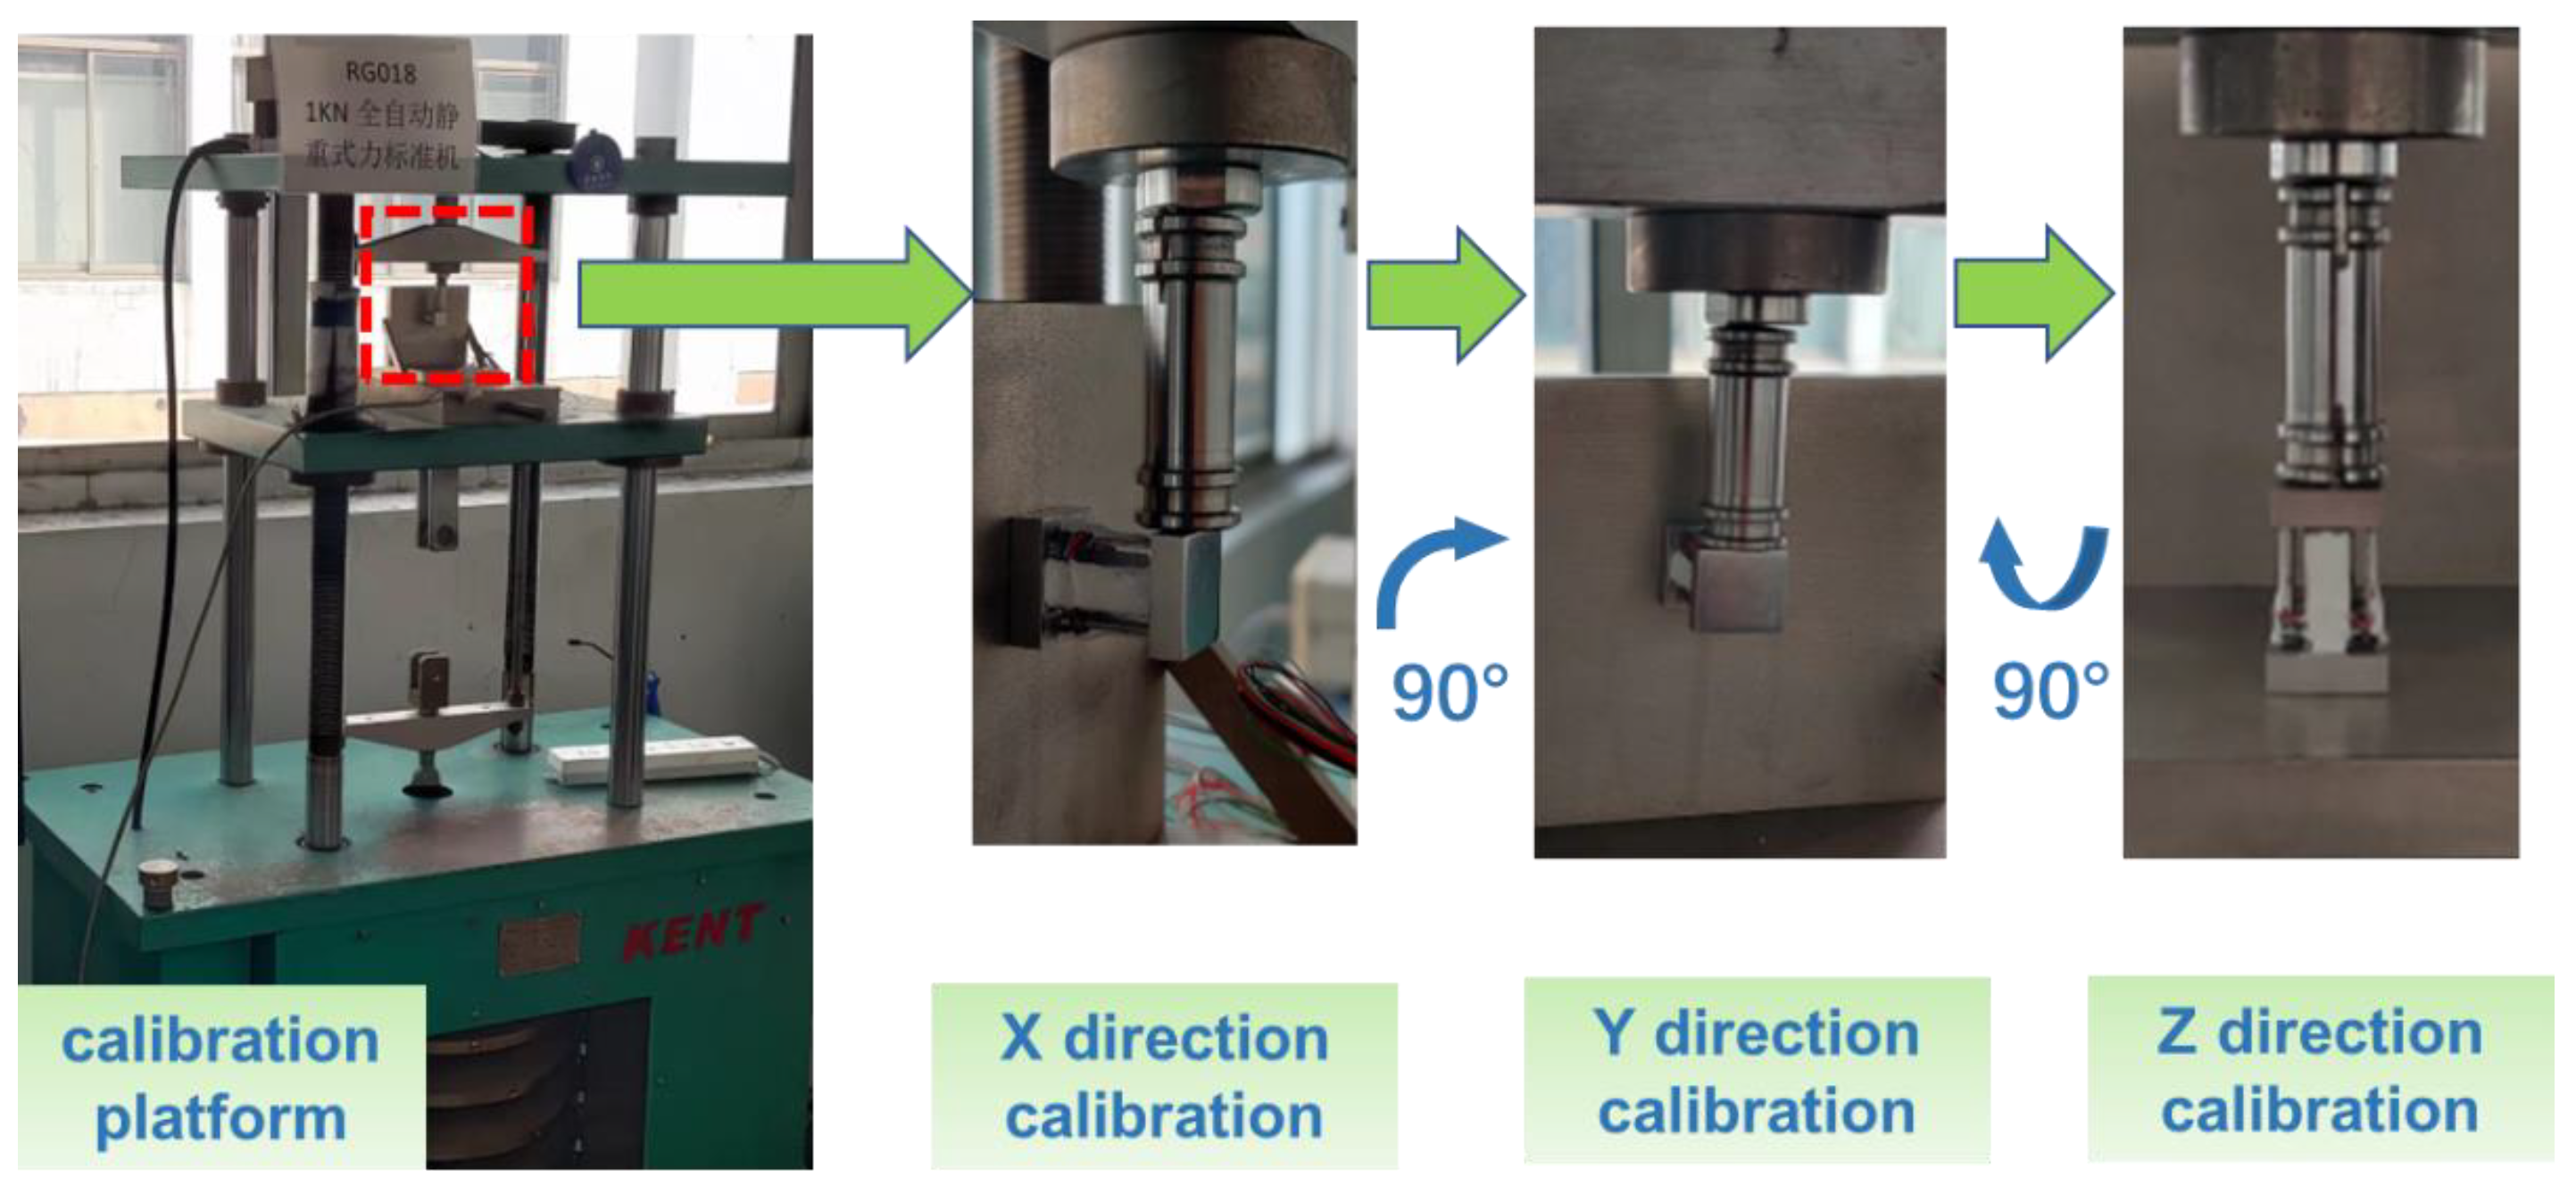
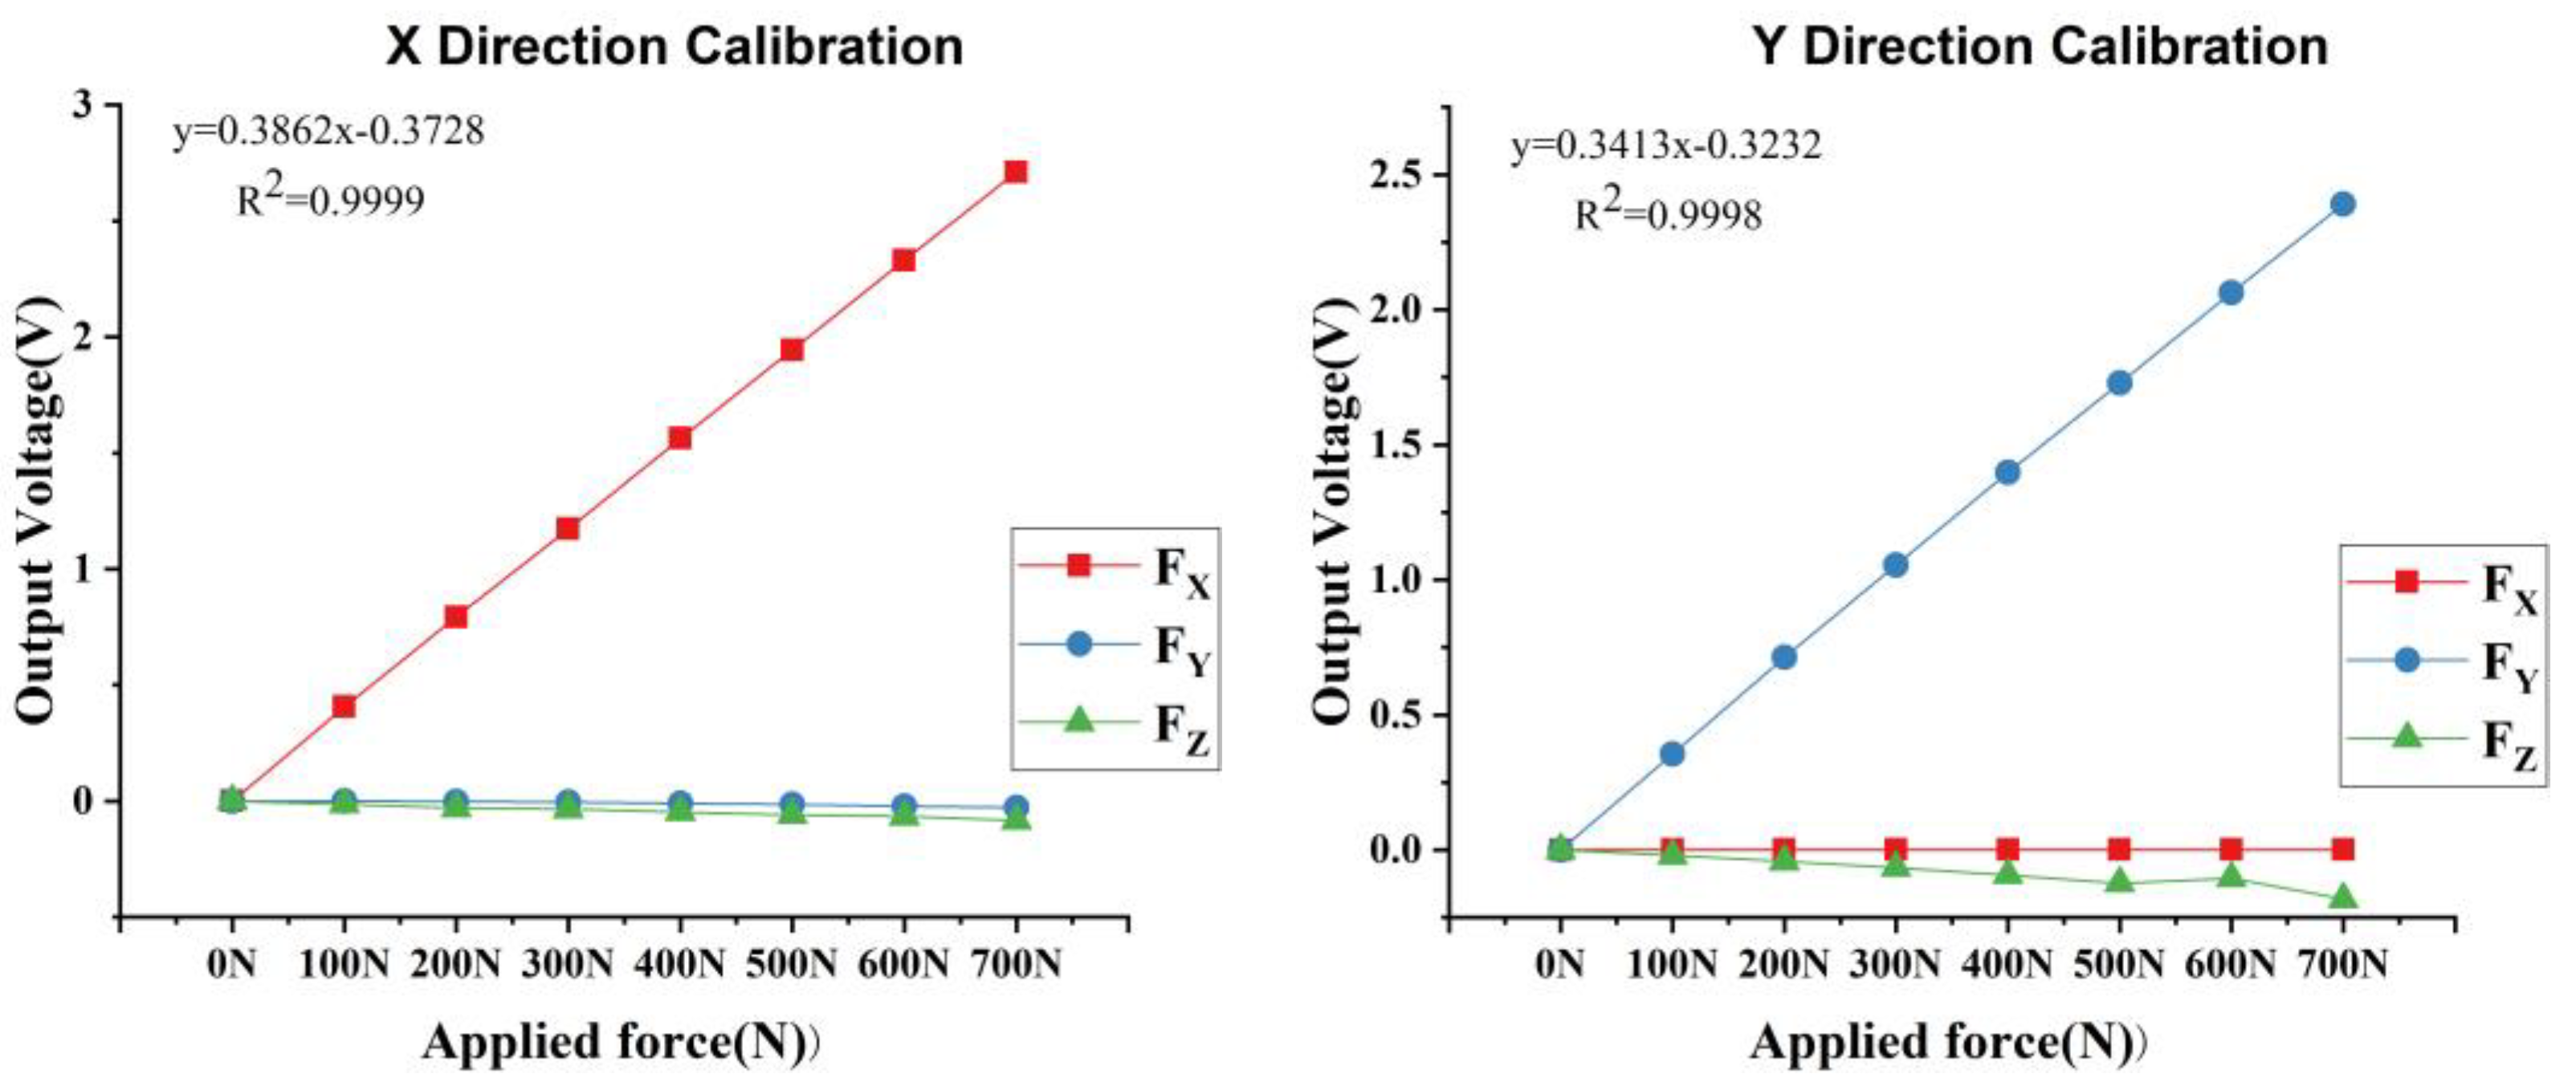
2.3. Calibration
3. Measurement System Architecture
3.1. Master System
3.2. Subsystem
- Laser speedometer: Because there is a certain error between the vehicle speedometer and the actual speed, the laser speedometer can accurately measure the relationship between the longitudinal displacement and time of the vehicle.
- Auxiliary camera: The ground marking is perpendicular to the sensor and parallel to the driving direction. The camera is attached to the underside of the car’s bumper, and it can record in real time, making sure that the tire runs over the sensor vertically.
- Infrared trigger device: The front and rear sensors are respectively equipped with a set of infrared trigger switches. When the tire blocks the first switch, the trigger acquisition system is activated. When the tire is detected to leave, the data recording stops.
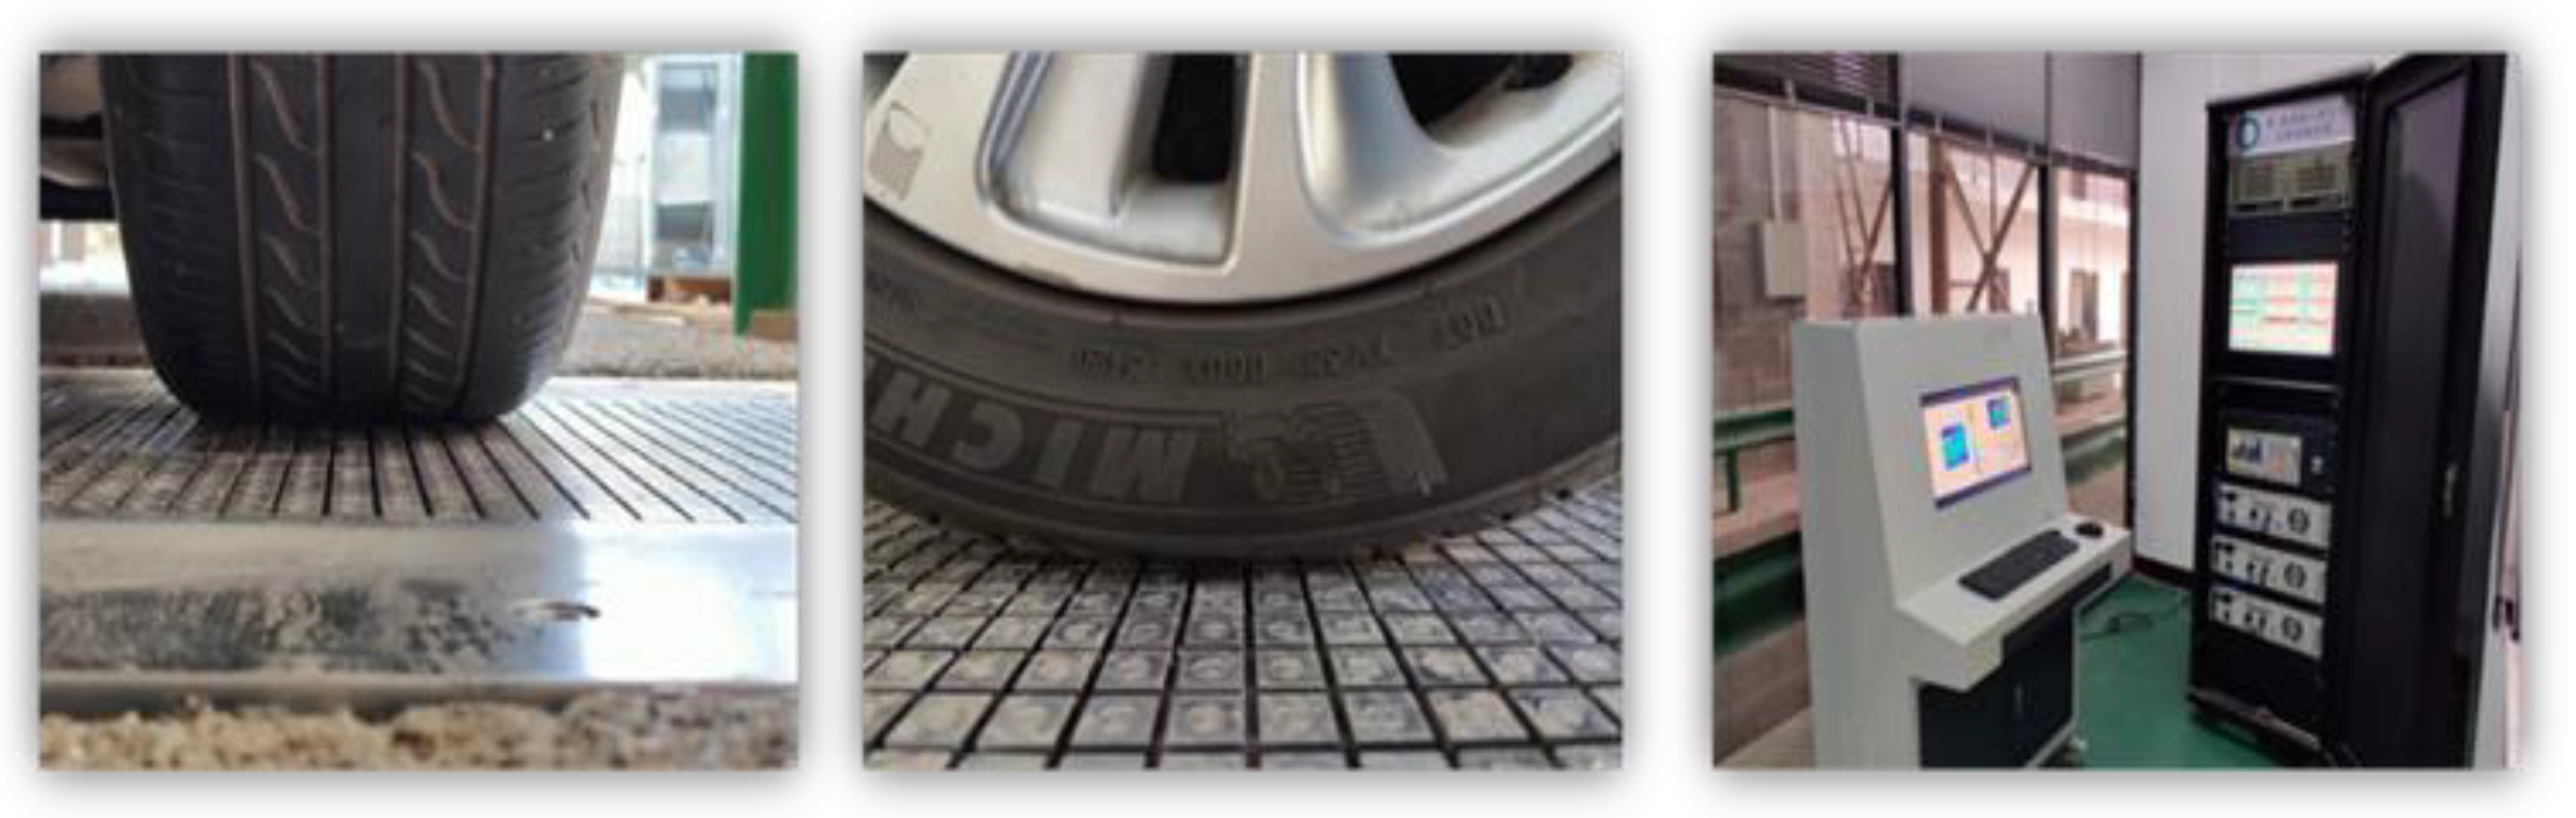
4. Real Vehicle Experiment
5. Results and Discussion
6. Conclusions
- In the constant speed of the tire, the tri-axial stress distribution is uniform and greater than the static state. The longitudinal and vertical stress values near the tire shoulder are greater than those near the tire crown, and the lateral stress is greatly affected by the asymmetric pattern of the tire.
- Due to the elasticity of rubber and the fluidity of compressed gas in the tire, the peak stress will gradually move from front to back with the rolling of the tire, and the maximum stress has a certain lag.
- The characteristics of the three-way stress distribution can be used to further explain the causes of pavement damage and provide a comparison basis for a simulation experiment.
Author Contributions
Funding
Institutional Review Board Statement
Informed Consent Statement
Data Availability Statement
Conflicts of Interest
References
- Wu, S.; Wen, H.; Zhang, W.; Shen, S.; Louay, N. Mohammad, Ahmed Faheem & Balasingam Muhunthan Field performance of top-down fatigue cracking for warm mix asphalt pavements. Int. J. Pavement Eng. 2019, 20, 33–43. [Google Scholar] [CrossRef]
- Chan, C.Y.; Huang, B.; Yan, X.; Richards, S. Investigating effects of asphalt pavement conditions on traffic accidents in Tennessee based on the pavement management system (PMS). J. Adv. Transp. 2010, 44, 150–161. [Google Scholar] [CrossRef]
- Zhao, Y.; Alae, M.; Fu, G. Investigation of mechanisms of top-down fatigue cracking of asphalt pavement. Road Mater. Pavement Des. 2018, 19, 1436–1447. [Google Scholar] [CrossRef]
- Luo, X.; Gu, F.; Ling, M.; Lytton, R.L. Review of mechanistic-empirical modeling of top-down cracking in asphalt pavements. Constr. Build. Mater. 2018, 191, 1053–1070. [Google Scholar] [CrossRef]
- Canestrari, F.; Ingrassia, L.P. A review of top-down cracking in asphalt pavements: Causes, models, experimental tools and future challenges. J. Traffic Transp. Eng. (Engl. Ed.) 2020, 7, 541–572. [Google Scholar] [CrossRef]
- JTGD50-2017; Code for Design of Asphalt Pavement for Highway, Industry Standard—Traffic; China Communications Highway Planning and Design Institute: Beijing, China, 2017; 143p.
- Els, P.S.; Stallmann, M.J.; Botha, T.R.; Guthrie, A.G.; Jimenez, E. Comparison of Tire Footprint Measurement Techniques. In Proceedings of the ASME 2016 International Design Engineering Technical Conferences and Computers and Information in Engineering Conference, Charlotte, NC, USA, 21–24 August 2016. [Google Scholar]
- Xu, T. Research on a Semi-Physical Tire Model Considering the Characteristics of the Contact Patch. Ph.D. Thesis, Jilin University, Changchun, China, 2018. [Google Scholar]
- Guo, M.; Li, X.; Ran, M.; Zhou, X.; Yan, Y. Analysis of contact stresses and rolling resistance of truck-bus tyres under different working conditions. Sustainability 2020, 12, 10603. [Google Scholar] [CrossRef]
- Jiang, X.; Zeng, C.; Gao, X.; Liu, Z.; Qiu, Y. 3D FEM analysis of flexible base asphalt pavement structure under non-uniform tyre contact pressure. Int. J. Pavement Eng. 2019, 20, 999–1011. [Google Scholar] [CrossRef]
- He, H.; Li, R.; Yang, Q.; Pei, J.; Guo, F. Analysis of the tire-pavement contact stress characteristics during vehicle maneuvering. KSCE J. Civ. Eng. 2021, 25, 2451–2463. [Google Scholar] [CrossRef]
- Wang, T.; Dong, Z.; Xu, K.; Ullah, S.; Wang, D.; Li, Y. Numerical simulation of mechanical response analysis of asphalt pavement under dynamic loads with non-uniform tire-pavement contact stresses. Constr. Build. Mater. 2022, 361, 129711. [Google Scholar] [CrossRef]
- Király, T.; Primusz, P.; Tóth, C. Simulation of Static Tyre–Pavement Interaction Using Two FE Models of Different Complexity. Appl. Sci. 2022, 12, 2388. [Google Scholar] [CrossRef]
- Oubahdou, Y.; Wallace, E.R.; Reynaud, P.; Picoux, B.; Dopeux, J.; Petit, C.; Nélias, D. Effect of the tire–Pavement contact at the surface layer when the tire is tilted in bendConstr. Build. Mater. 2021, 305, 124765. [Google Scholar] [CrossRef]
- Park, D.-W.; Martin, A.E.; Masad, E. Effects of nonuniform tire contact stresses on pavement response. J. Transp. Eng. 2005, 131, 873–879. [Google Scholar] [CrossRef]
- Park, D.W.; Fernando, E.; Leidy, J. Evaluation of Predicted Pavement Response with Measured Tire Contact Stresses. Transp. Res. Rec. 2005, 1919, 160–170. [Google Scholar] [CrossRef]
- De Beer, M.; Fisher, C.; Jooste, F.J. Determination of Pneumatic Tyre-Pavement Interface Contact Stresses under Moving Loads and some Effects on Pavements with Thin Asphalt Surfacing Layers. In Proceedings of the 8th international conference on asphalt pavements, Seattle, WA, USA, 10–14 August 1997; pp. 179–227. [Google Scholar]
- Fernando, E.G.; Musani, D.; Park, D.W.; Liu, W. Summary Report: Evaluation of Effects of Tire Size and Inflation Pressure on Tire Contact Stresses and Pavement Response; FHWA/TX-06/0-4361-1; Texas Transportation Institute: College Station, TX, USA, 2006; Volume 7, p. 288. [Google Scholar]
- Chen, B.; Zhang, X.; Yu, J.; Wang, Y. Impact of contact stress distribution on skid resistance of asphalt pavements. Constr. Build. Mater. 2017, 133, 330–339. [Google Scholar] [CrossRef]
- Zhu, J.; Sargand, S.; Khoury, I.; Tarawneh, D.; Ma, T.; Chen, F. Dynamic load responses of perpetual pavement test roads on U.S. 23: Full-scale instrumentation and evaluation. Constr. Build. Mater. 2022, 331, 127326. [Google Scholar] [CrossRef]
- Howell, W.E.; Perez, S.E.; Vogler, W.A. Aircraft tire footprint forces. In The Tire Pavement Interface, ASTM ASP 929; Pottinger, M.G., Yager, T.J., Eds.; American Society for Testing and Materials: Philadelphia, PA, USA, 1986; pp. 110–124. [Google Scholar]
- Cheli, F.; Braghin, F.; Brusarosco, M.; Mancosu, F.; Sabbioni, E. Design and testing of an innovative measurement device for tyre–road contact forces. Mech. Syst. Signal. Process. 2011, 25, 1956–1972. [Google Scholar] [CrossRef]
- Douglas, R.A. Unbound roads trafficked by heavily loaded tyres with low inflation pressure. Paper 11377. Proc. Inst. Civ. Eng. Transp. 1997, 123, 163–173. [Google Scholar]
- Douglas, R.A. Heavy load, low tire pressure rutting of unbound granular pavements. J. Transp. Eng. 1997, 123, 357–363. [Google Scholar] [CrossRef]
- de Beer, M.; Kannemeyer, L.; Fisher, C. Towards improved mechanistic design of thin asphalt layer surfacings based on actual tyre/pavement contact Stress-In-Motion (SIM) data in South Africa. In Proceedings of the 7th Conference on Asphalt Pavements forSouthern Africa (CAPSA ’99), Theme 5: Innovation in Asphalt Design, Victoria Falls, Zimbabwe, 29 August–2 September 1999. [Google Scholar]
- De Beer, M.; Fisher, C. Stress-In-Motion (SIM) system for capturing tri-axial tyre-road interaction in the contact patch. Measurement 2013, 46, 2155–2173. [Google Scholar] [CrossRef]
- Anghelache, G.; Moisescu, R.; Sorohan, S.; Buretea, D. Measuring system for investigation of tri-axial stress distribution across the tyre-road contact patch. Measurement 2011, 44, 559–568. [Google Scholar] [CrossRef]
- Xie, Y.; Yang, Q. Tyre-pavement contact stress distribution considering tyre types. Road Mater. Pavement 2019, 20, 1899–1911. [Google Scholar] [CrossRef]
- Dwyer-Joyce, R.; Drinkwater, B.W. In situ measurement of contact area and pressure distribution in machine elements. Tribol. Lett. 2003, 14, 41–52. [Google Scholar] [CrossRef]
- Manyo, E.Y.; Reynaud, P.; Picoux, B.; Tautou, R.; Nelias, D.; Allou, F.; Petit, C. Towards fast modelling of the tire-pavement contact. Eur. J. Environ. Civ. Eng. 2021, 25, 2396–2412. [Google Scholar] [CrossRef]
- Guan, J.; Zhou, X.; Liu, L.; Ran, M.; Yan, Y. Investigation of Tri-Axial Stress Sensing and Measuring Technology for Tire-Pavement Contact Surface. Coatings 2022, 12, 491. [Google Scholar] [CrossRef]


| X Direction | Y Direction | Z Direction | |
|---|---|---|---|
| Sensitivity(mV/V) | 0.54379 | 0.51827 | 0.23914 |
Disclaimer/Publisher’s Note: The statements, opinions and data contained in all publications are solely those of the individual author(s) and contributor(s) and not of MDPI and/or the editor(s). MDPI and/or the editor(s) disclaim responsibility for any injury to people or property resulting from any ideas, methods, instructions or products referred to in the content. |
© 2023 by the authors. Licensee MDPI, Basel, Switzerland. This article is an open access article distributed under the terms and conditions of the Creative Commons Attribution (CC BY) license (https://creativecommons.org/licenses/by/4.0/).
Share and Cite
Guan, J.; Zhou, X.; Liu, L.; Ran, M. Measurement of Tire-Pavement Contact Tri-Axial Stress Distribution Based on Sensor Array. Coatings 2023, 13, 416. https://doi.org/10.3390/coatings13020416
Guan J, Zhou X, Liu L, Ran M. Measurement of Tire-Pavement Contact Tri-Axial Stress Distribution Based on Sensor Array. Coatings. 2023; 13(2):416. https://doi.org/10.3390/coatings13020416
Chicago/Turabian StyleGuan, Jiaxi, Xinglin Zhou, Lu Liu, and Maoping Ran. 2023. "Measurement of Tire-Pavement Contact Tri-Axial Stress Distribution Based on Sensor Array" Coatings 13, no. 2: 416. https://doi.org/10.3390/coatings13020416
APA StyleGuan, J., Zhou, X., Liu, L., & Ran, M. (2023). Measurement of Tire-Pavement Contact Tri-Axial Stress Distribution Based on Sensor Array. Coatings, 13(2), 416. https://doi.org/10.3390/coatings13020416