1. Introduction
Recently, the concept of sustainable development has become deeply rooted in society. The recycling of solid industrial waste can not only save land resources but also protect the environment and reduce security risks. Currently, it is one of the most active areas of research that engineers and technicians are promoting worldwide. Iron tailings sand, which is produced by grinding and sorting iron ore, has a grain size of less than 4.75 mm. ITS is the main component of industrial solid waste; in China, there are about 2 billion tons in existence. This large quantity of ITS not only occupies land but also pollutes the environment [
1].
Currently, there are many pieces of research on the reuse of iron tailings sand in making construction materials such as cement, cement concrete, synthetic zeolite, and microcrystalline glass, as well as in the treatment of landscape water [
2,
3,
4,
5,
6,
7]. Many scholars have devoted themselves to the utilization of ITS as pavement engineering material and have obtained important results. The proportion of studies on concrete pavement is the largest, whereas there are relatively fewer on the application of ITS to pavement bases or subgrade fillers [
8,
9,
10,
11,
12,
13,
14]. Because of the limits of current standardized design, the ITS has low utilization in pavement engineering.
Meanwhile, the maintenance works on pavement generate a large amount of reclaimed inorganic binder stabilized aggregate (RAI) every year, which is generally used as subgrade filler or even directly discarded, resulting in a low added value to RAI [
15]. The surface of RAI has many micron-sized cement hydrate particles, which affect the strength and crack resistance in regenerate application [
16,
17]. Chemical and physical measures, for example, the removal of the laitance of aggregate by acid soaking, can effectively ameliorate these properties, but their engineering applications are difficult [
15]. Previous test results show that the recycled mixture has excellent mechanical properties, especially the compressive properties, which can meet the strength requirements of the base course on the various grades of pavement [
18].
In summary, using ITS and RAI in pavement base courses is feasible, but the content is commonly too low, and there is no engineering behind the use of both materials simultaneously. This study is based on a road resurfacing project in Shanxi Province, China, and it proposes the “ITS plus RAI” double waste treatment technology. It can reduce CO2 emissions and improve the utilization of ITS, and it can also improve the utilization level of ITS and help achieve an ecological civilization. This study evaluated the pavement performance of the recycled mixture by testing its anti-water damage, frost resistance (dry and wet freeze), shrinkage, and fatigue properties and compared it with the corresponding pavement performance of cement-stabilized aggregates (the traditional base course material). Finally, the reduction in carbon emissions per kilometer was also predicted.
2. Materials and Methods
2.1. Materials
2.1.1. Iron Tailings Sand
ITS was retrieved from Xiangfen County. The selected ITS has good cleanliness and a negligible content of harmful metal elements. The screening results and basic properties of the ITS are listed in
Table 1 and
Table 2 [
18].
2.1.2. Aggregates
The aggregates used in this study were divided into RAI and natural aggregate (NA), and the RAI was the recycled material of the base course of the underlying project. The measured crushing value of 10–15 mm reached 25.8%, and the sand equivalent of the fine aggregate of the RAI reached 75%. The screening results of the RAI are presented in
Table 3. The screening results and basic physical properties of the NA are listed in
Table 4 and
Table 5 [
18].
2.1.3. Cementitious Materials
This paper uses two cementitious materials, one of which is a special cementitious material for ITS (A), and another is cement (B). The special cementitious material is mainly composed of calcium oxide (CaO) and silicon dioxide (SiO
2), and its main components are listed in
Table 6 [
18]. The standard of cement used was PC42.5, and the basic physical properties of the cementitious material are listed in
Table 7.
2.2. Methods
2.2.1. Mix Design
This work aims to optimize ITS use by satisfying the strength design criteria of semi-rigid base materials, and the project team explored stabilizing ITS with NA [
19]. Thus, for this study, ITS and RAI blending ratios of 50%:50%, 60%:40%, and 70%:30% were adopted, with cementitious material blending ratios (external) of 4%, 6%, 8%, and 10%. The conventional cement-stabilized aggregate was selected as the comparison group. According to the aggregate sieving results, the cement-stabilized aggregates were designed with the recommended C-C-2 type grading curve, and the final mixing ratio of the design was 20~30 mm:10~20 mm:5~10 mm:0~5 mm = 23%:23%:14%:40%. All the grading curves are shown in
Figure 1. Owing to the fine particle size and high mixing amount of ITS, its grading curve is not within the existing specification design.
2.2.2. Testing Method
Heavy Compaction Test
In this study, we used the traditional heavy compaction test (the same as the test of traditional cement-stabilized aggregates), which refers to the Test Methods of Materials Stabilized with Inorganic Binders for Highway Engineering JTG E51-2009 T 0804-1994. The compaction test apparatus is shown in
Figure 2 [
18].
Unconfined Compressive Strength Test
We performed this test based on the results of the compaction test and also referring to the Test Methods of Materials Stabilized with Inorganic Binders for Highway Engineering JTG E51-2009 T 0805-1994. Firstly, we formed the specimens by using a 2000 kN press machine (
Figure 3) at a loading speed of 10 mm/min and then determined their unconfined compressive strength using a pavement material strength tester (
Figure 4) at a loading speed of 1 mm/min [
18].
Anti-Water Damage Test
Water immersion will cause some damage to the integrity of the base course material, and thus the anti-water damage properties are essential for materials stabilized with inorganic binders. Therefore, it is necessary to examine the water stability of the recycled mixture, and the water stability coefficient (water stability coefficient = strength after immersion/strength before immersion × 100%) of unconfined compressive strength at 28 d (5 d immersion) and 90 d (10 d immersion) is used as an indicator.
Frost Resistance Test
The strength of base course materials may gradually decrease under the repetition of freeze–thaw cycles, which may produce weak surfaces and even cracking damage. Thus, the frost resistance property is a vital index in the durability of base course materials, taking into account the groundwater level; therefore, this paper uses dry freeze and wet freeze tests to study the frost resistance of the recycled mixture. The freeze–thaw coefficient of unconfined compressive strength (freeze–thaw coefficient = strength after freeze–thaw/strength before freeze–thaw × 100%) was used as the index. Five freeze–thaw (−18 ± 1 °C) cycles were conducted for 28 d of regeneration age, and 10 freeze–thaw cycles were conducted for 90 d of regeneration age. The difference between a dry and wet freeze is whether the sample was immersed in water (20 ± 1 °C) after freezing.
Shrinkage Test
Beam samples with a size of 100 mm × 100 mm × 400 mm were formed at a temperature of 20 ± 2 °C and a relative humidity of not less than 95% of the environment after 7 d, and their dry shrinkage performance was tested. Daily records of the water loss and shrinkage of the sample were kept. The test was terminated when the water loss rate was almost constant through data monitoring.
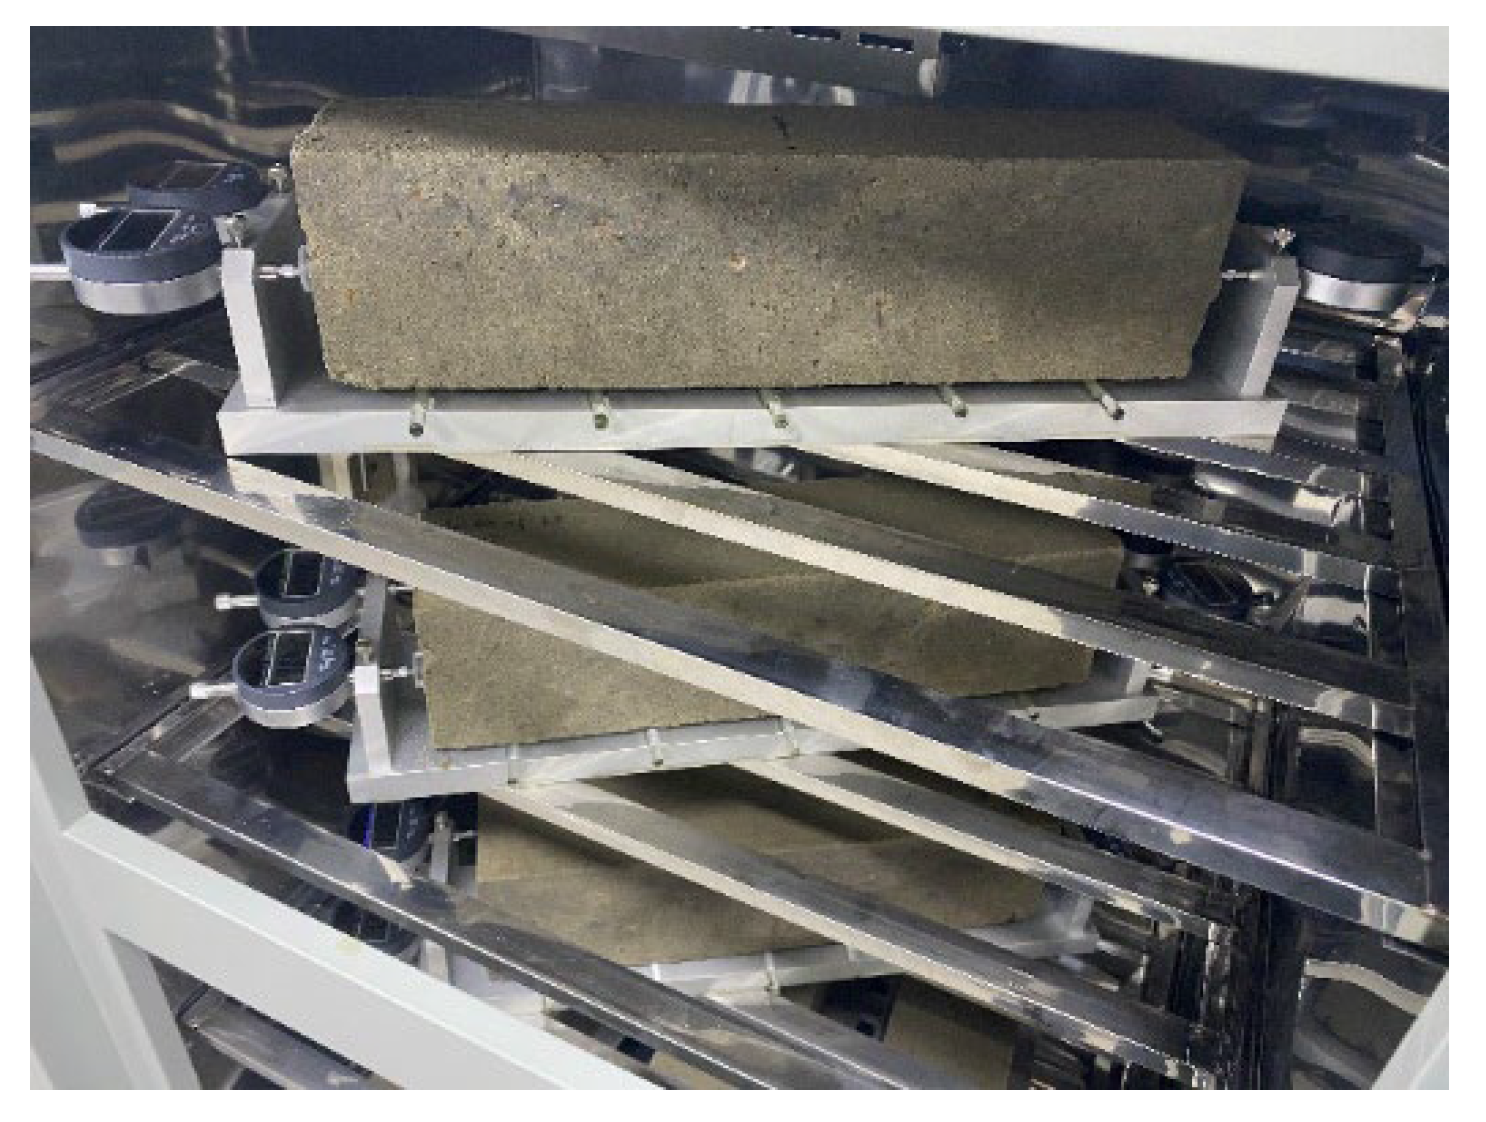
The test is similar to the dry shrinkage test. The sample was cured in an oven at 105 °C for 12 h. The test temperature level was set from 30 to −30 °C, the temperature difference at each level was 10 °C, and the holding time for each level was 4 h. The test started at 30 °C, and micrometer data were recorded 5 min before the end of the holding time. Photos of the tests are shown in
Figure 5 and
Figure 6.
Fatigue Test
Wheel loads are repetitive. Coupled with the influence of temperature and humidity, this results in a stress–strain alternating state of the base course materials in the long term and leads to a gradual decline in the strength of the pavement structure. When the repetition of the load exceeds a certain number of times, after the drop in strength, the stress generated in the pavement under load will exceed the structural resistance, causing fatigue damage. The fatigue characteristics of the basecourse materials determine the service life of the pavement. Considering that the real force exerted on the pavement is closer to the bending and tensile states, this paper studies the fatigue characteristics of the recycled mixture through a four-point bending fatigue test.
Using the UTM-25 universal testing machine (
Figure 7a) and the waveform loading in Haversine (half-sine) mode (
Figure 7b), the test loading cycle time was set to 100 ms according to the wheel action time of 0.1 s at 60 km/h. The corresponding fatigue times were obtained by setting different stress ratios.
Carbon Emissions Measurement
According to the field research, the energy consumption in the process of extracting stone from mines is approximately 1.1 kg/t, and the process of using a crusher to process the stone to the specified size after the stone is mined p
12 is approximately 0.12 kg/t, where the energy consumption is expressed in diesel fuel. According to the General Principles for Calculation of Total Production Energy Consumption GB/T2589-2008 [
20], the formula for calculating comprehensive energy consumption is expressed in Equation (1),
where
E is the total energy consumption,
n is energy species number,
ei is the ith energy substance consumed, and
pi is the ith energy conversion factor.
3. Results and Discussion
This part, the mix design of the recycled mixture and the cement-stabilized aggregates, was analyzed first.
3.1. Mix Design
3.1.1. Analysis of Test Results for the Recycled Mixture
For each group, six mixtures were tested to obtain specific data. The results of the compaction tests and 7 d unconfined compressive strength tests of the recycled mixture are presented in
Table 8 and
Figure 8.
For each group, six mixtures were tested to obtain specific data. The test results show that the recycled mixture had a satisfactory compressive strength. The specific analysis can be seen in another paper [
18]. The compressive strength of the recycled mixture in the ratio used in this study can basically meet the strength design requirement of 3~5 MPa for secondary heavy-load highways. According to the strength design requirement (4 MPa) of the pavement subgrade of the reference project, the recycled mixture A can meet the strength design requirement when the ITS is mixed at 50%. Considering the shrinkage test, the ratio of 8% of the special cementitious material is used as the comparison group one. The optimal ratios of the recycled mixtures are listed in
Table 9.
3.1.2. Analysis of Test Results of Cement-Stabilized Aggregates
The results of the compaction test and the 7 d unconfined compressive strength test of the cement-stabilized aggregate are presented in
Table 10 and
Table 11.
For each group, six mixtures were tested to obtain specific data. The test results show that the optimum water content and maximum dry density of cement-stabilized aggregate both increase with the increase in cement admixture, but its maximum dry density is greater than that of the recycled mixtures. According to the design strength requirement (4 MPa) of the reference project, the final cement content is 5%, the ratio is 20~30 mm:10~20 mm:5~10 mm:0~5 mm = 23%:23%:14%:40%, and the cement dosage is 5%, as in group two for the comparison study.
3.2. Strength Increase Characteristic
Figure 9 shows test results for recycled mixtures A, B, and C and cement-stabilized aggregate at the ages of 3, 7, 14, 28, and 90 d, and the following conclusions can be drawn.
From
Figure 9, the compressive strength increases faster from 3 to 7 d. After 28 d, the trend of increasing compressive strength gradually slowed down, and the 7 d compressive strength of the three recycled mixtures reached approximately 80% of the 90 d compressive strength. In comparison, the 7 d compressive strength of the cement-stabilized aggregate was only 66.1% of the 90 d compressive strength, and its increasing compressive strength has better sustainability. However, for the cement-stabilized aggregate, the higher the unconfined compressive strength, the more likely it is to produce shrinkage cracks [
21]. Therefore, the strength characteristics of the recycled mixture are more beneficial for engineering applications.
3.3. Anti-Water Damage Property
For each group, six mixtures were tested to obtain specific data. The anti-water damage test results are presented in
Figure 10.
From
Figure 10, the test results show that, for the recycled mixture, the water stability coefficient of mixtures A, B, and C for 28 d remains above 96% because the water immersion will decrease the strength of the recycled mixture, but this reduction in strength is offset by the hydration reaction that continues for 5 d in immersion. Hence, the strength is not lost, and the water stability coefficient even exceeds 100%. However, the increase in recycled mixture strength after 28 d is very smooth, and it is coupled with the increase in the number of days of water immersion, so the water stability coefficient of 90 d is slightly reduced. For the recycled mixture, the water stability increased slightly with an increase in ITS content, which was caused by the finer particle size of the ITS and the relatively dense surface of the sample, thus making the immersion or damage relatively slow. However, the water stability coefficient of the recycled mixture was higher than that of the cement-stabilized aggregate (96.5% at 28 d and 92.7% at 90 d), which is related to the surface and internal density of the sample (as shown in
Figure 11). In conclusion, the recycled mixture exhibited good performance in terms of water damage resistance.
3.4. Frost Resistance Property
For each group, six mixtures were tested to obtain specific data. The frost resistance test results are shown in
Figure 12 and
Figure 13.
From
Figure 12 and
Figure 13, the test results show that the freeze–thaw coefficient of 28 d is less than that of 90 d. This is because the greater the initial strength, the more stable the sample internals, and the stronger the resistance to freeze-thaw. Comparing
Figure 12 and
Figure 13, the test results show that the wet freeze coefficient is significantly higher than the dry freeze coefficient. This indicates that the wet freeze sample has a certain promotion effect on its strength after freezing and immersion, most likely because the hydration reaction continues during the immersion process, causing the strength to continue to increase. Comparing the ratios A, B, and C, it can be observed that the freeze–thaw coefficient of the recycled mixture also slightly increased with an increase in the ITS content. This indicates that ITS has a positive effect on the frost resistance of the recycled mixture, which may be caused by its denser surface. The dry freeze coefficient or wet freeze coefficient shows that the frost resistance of the recycled mixture is better than that of the cement-stabilized aggregate.
3.5. Shrinkage Characteristics
A semi-rigid base course is prone to cracking under humidity or temperature changes. Alternatively, dry shrinkage is caused by the reduction in water content, while temperature shrinkage is caused by the change in temperature. Dry shrinkage and temperature shrinkage are the two main types of shrinkage damage in a semi-rigid base course, and the joint action of the two causes cracking damage or even surface cracks [
22]. The semi-rigid subgrade shrinkage mechanism and its change law are of great significance to the road performance of base-course materials. Considering the influence of the content of special cementitious material, comparison group one (the recycled mixture with 50% content of ITS and 8% cementitious content) is included to study the dry shrinkage and temperature shrinkage characteristics of the recycled mixture through a comparative analysis.
3.5.1. Dry Shrinkage Characteristic
For each group, two mixtures were tested to obtain specific data. The test age was 60 d in this analysis, and the test results are shown in
Figure 14 and
Figure 15. The dry shrinkage coefficients are summarized in
Table 12.
The ambient temperature at the time of the installation of the sample was lower than the temperature of the curing box. Thus, referring to the principle of thermal expansion and contraction, the starting dry shrinkage strain in
Figure 15 is less than 0. The hydration product contained ettringite and other crystals, so the mixture had micro-expansion characteristics, and the dry shrinkage strain had a slightly decreasing trend on the 14th day. The water loss of the recycled mixture and cement-stabilized aggregate was the same as time elapsed. The water loss of the recycled mixture increased rapidly before the 20th day, and the increase trend slowed down after the 20th day. After the 40th day, the water loss was stable and no longer increasing, and the water loss accounted for approximately 95% of the total water loss. The dry shrinkage strain of the recycled mixture increased rapidly before the 40th day, and then it was stable and grew slowly after the 40th day. The dry shrinkage strain accounted for approximately 95% of the total dry shrinkage strain on the 40th day, while the dry shrinkage strain of the cement-stabilized aggregate accounted for 88.78% of the total dry shrinkage strain on the 20th day. In summary, for engineering applications of recycled mixture entities, the under-sealed layer should be spread as soon as possible to reduce the shrinkage caused by water dissipation.
From
Table 12, the test results show that the dry shrinkage strain of the recycled mixture is larger than that of the cement-stabilized aggregate. However, its water loss rate is more than twice that of the cement-stabilized aggregate, so its total dry shrinkage coefficient is smaller. Therefore, the dry shrinkage resistance of the recycled mixture is better than that of the cement-stabilized aggregate. For the average dry shrinkage coefficient of the ratios A, B, and C and comparison group one, the analysis of the results showed that the dry shrinkage coefficient of the recycled mixture increased by 61.4% with 2% of cementitious material, and the dry shrinkage coefficient increased by less than 10% with each increment of 10% in the amount of ITS. Therefore, the influence of the amount of cementitious material on the dry shrinkage characteristic of the recycled mixture was greater than the influence of the mixture proportion. The dry shrinkage characteristic is closely related to the cracking of the base course materials; therefore, the selection of the number of cementitious materials in engineering applications is crucial.
3.5.2. Temperature Shrinkage Characteristic
For each group, two mixtures were tested to obtain specific data. The temperature shrinkage test results are shown in
Figure 16.
From
Figure 16, for the four ratios of the recycled mixture, the test results show that their temperature shrinkage coefficient exhibits a sudden drop in the 0–10 °C temperature range and then a sharp rise. The recycled mixture has a high water content, and its surface is denser, which results in the test pieces being undried. Due to its inverse expansion characteristics, water in a volume below 4 °C began to expand, so the temperature shrinkage coefficient was reduced and reached a minimum. However, when the temperature is lower than 0 °C, ice has a large temperature shrinkage coefficient (−30 × 10
−6/°C), alleviating its expansion effect; therefore, at this time the recycled mixture is contracted, and thus the temperature shrinkage coefficient increases sharply. Comparing recycled mixture A with comparison group one, the test results show that the higher the content of cementitious material under the same ITS content, the greater the temperature shrinkage coefficient and the greater the effect on the shrinkage performance of the recycled mixture. Comparing recycled mixtures B and C with comparison group one, the test results show that the temperature shrinkage coefficient of the recycled mixture decreases with an increase in the ITS content (the decrease in RAI content). The higher the ITS content is at temperatures below 0 °C, the smaller the temperature shrinkage coefficient, which verifies that the incorporation of ITS is beneficial to the low-temperature performance of the recycled mixture. The temperature shrinkage coefficient of the cement-stabilized aggregate is significantly smaller than that of the recycled mixture, which indicates that the temperature shrinkage performance of the cement-stabilized aggregate is better. However, the dry shrinkage coefficients of both are much larger than their temperature shrinkage coefficients. Therefore, for the anti-cracking performance of the recycled mixture, it is especially important to sprinkle it with water in the early stage and spread the seal layer as soon as possible in engineering applications.
3.6. Fatigue Characteristic
According to the above research on the road performance of the recycled mixture, together with the existing research [
22], the strength characteristics of recycled mixtures A, B, and C are excellent. The module of recycled mixture C was the smallest, and the shrinkage characteristic was the worst, so its fatigue characteristic was the worst. The ITS content was the highest, so proportion C was used for the fatigue test research. For each group, six mixtures were tested to obtain specific data. Additionally, the fatigue test results are listed in
Table 13.
The fatigue regression equations for the recycled mixture (y
1) and cement-stabilized aggregate (y
2) were obtained by fitting a one-dimensional linear regression to the data in
Table 13. The fitted curves are shown in
Figure 17.
Through the analysis of variance (ANOVA), the F-test critical value table (α = 0.05) reveals that the critical value of F(1,4) in this study is 7.709 (less than 23.533 and 77.523), indicating that the regression results are significant. The residual standard deviation of equation y
1 is 0.4113, and that of equation y
2 is 0.1675. A verification of the t-distribution table shows that λ1 = λ2 = 4.604 for both equations at a 99% guarantee rate, so Δ1 = 1.864 and Δ2 = 0.771. Therefore, the fatigue equation for both at a 99% guarantee rate is obtained as expressed in Equations (2) and (3).
According to the current domestic specification [
23], the design life requirement for secondary roads is 12 years. Based on the project traffic survey and prediction, the 203 traffic of the Linxia section of the reference project after 12 years is expected to reach 9,743,300 vehicles. Using Equations (2) and (3) with this traffic volume, the recycled mixture can withstand a stress ratio of 0.50, while cement-stabilized gravel can resist 0.62. Therefore, the fatigue characteristic of the recycled mixture is slightly worse than that of the cement-stabilized gravel because the recycled mixture is less rigid.
3.7. Carbon Emissions Estimate
At present, China has the largest share of greenhouse gas emissions in the world [
18]. The 100% replacement of cement-stabilized aggregate with the recycled mixture in pavement engineering not only helps to solve the problem of ITS stockpiles but also reduces carbon emissions.
The carbon emissions will be generated in the gravel mining process, the processing process, and the rolling stage. Considering the variability of transportation distances, the carbon emissions difference generated during transportation is not considered in this work, and the carbon emissions difference between the recycled material and cement-stabilized aggregate at each stage of application is summarized in
Table 14. The comparison table for the rolling stage is shown in
Table 15.
In this work, for the convenience of calculation, the amount of diesel consumed by the rolling combination is calculated separately, so e
i only calculates aggregates, and the energy savings are
. The width of the base course of the reference project is 12 m, and its thickness is 0.2 m. The consumption of the recycled mixture per kilometer is approximately 5000 tons, so the energy savings from diesel per kilometer is 6100 kg. According to the “Highway Construction Machinery Unit Cost Quota” (JTG/T 3833-2019) [
24], which regulates the value of mechanical fuel consumption, it is calculated that rolling one kilometer of the recycled mixture will consume 4.96 kg more diesel fuel than rolling one kilometer of cement-stabilized aggregate. In summary, the diesel fuel savings that can be calculated for the whole process are 6095 kg. According to general principles, the CO
2 emissions factor is 3.0959 kg-CO
2/kg. The carbon reduction is 18,869 tCO
2. Usually, one hectare of broadleaf forest can consume 1000 kg of CO
2 per day, which can be converted to one kilometer of the recycled mixture base course, which is equivalent to recreating about 200 standard stadiums of broadleaf forest per day.
4. Conclusions
(1) The recycled mixture does not comply with the conventional grade requirements when the ITS content exceeds 50%, but it has satisfactory compressive strength characteristics. The compressive strength can be up to 7 MPa, which can meet the requirements of almost all levels of pavement under all kinds of load conditions.
(2) Because of the dense sample obtained with the recycled mixture and the continuous hydration reaction, the water stability and frost resistance of the recycled mixture are better than those of the cement-stabilized aggregate. The water stability coefficient and the frost resistance coefficient of the recycled mixture even exceed 100%.
(3) Because of the higher content of fine aggregate and the lower rigidity of the recycled mixture, its shrinkage and fatigue characteristics are worse than those of the cement-stabilized aggregate. However, in conclusion, the recycled mixture has good road performance.
(4) For engineering applications, considering that the shrinkage strain of the recycled mixture is influenced by humidity, it is recommended to spread the sealer as soon as possible after paving and curing.
(5) The proposed “ITS plus RAI” double waste treatment method can effectively reduce CO2 emissions from stone mining and processing. The engineering application in Shanxi Province shows that the carbon reduction is approximately 18.869 t of CO2, which is equivalent to regenerating about 200 standard stadiums of broadleaf forest per day.
Author Contributions
Conceptualization, H.Z., Y.D. and Y.H.; methodology, H.Z., Y.D. and J.T.; software, H.Z., Z.Q., J.T. and Y.Z.; validation, Y.D., J.T. and Y.Z.; formal analysis, H.Z., Z.Q., J.T. and Y.Z.; investigation, H.Z., Z.Q. and J.T.; resources, Y.D. and Y.H.; data curation, H.Z., Y.D. and Y.Z.; writing—original draft preparation, H.Z.; writing—review and editing, H.Z. and Y.D.; visualization, Z.Q., J.T. and Y.Z.; supervision, Y.D. and Y.H.; project administration, Y.D.; funding acquisition, Y.D. and Y.H. All authors have read and agreed to the published version of the manuscript.
Funding
This research received no external funding.
Institutional Review Board Statement
Not applicable.
Informed Consent Statement
Informed consent was obtained from all subjects involved in the study.
Data Availability Statement
The data used to support the findings of this study are included within the article.
Acknowledgments
We would like to thank China Highway Engineering Consulting Corporation for its support.
Conflicts of Interest
The authors declare no conflict of interest.
References
- Liu, A.-P.; Cao, M.-J.; Zhang, X.-T. The research status of large-scale utilization of iron tailings and its utilization methods. Chin. Met. Bull. 2019, 11, 279–280. [Google Scholar]
- Sirkeci, A.A.; Gül, A.; Bulut, G.; Arslan, F.; Onal, G.; Yüce, A.E. Recovery of Co, Ni, and Cu from the tailings of divrigi iron ore concentrator. Miner. Process. Extr. Metall. Rev. 2006, 27, 131–141. [Google Scholar] [CrossRef]
- Das, B.; Reddy, P.S.R.; Misra, V.N. Recovery of iron values from tailing dumps adopting hydrocyclone and magnetic separation techniques. Australas. Inst. Min. Metall. Publ. Ser. 2002, 2, 285–289. [Google Scholar]
- Maiti, S.K.; Nandhini, S.; Das, M. Accumulation of metals by naturally increaseing herbaceous and tree species in iron ore tailings. Int. J. Environ. Stud. 2005, 62, 593–603. [Google Scholar] [CrossRef]
- Das, S.K.; Kumar, S.; Ramachandrarao, P. Exploitation of iron ore tailing for the development of ceramic tiles. Waste Manag. 2000, 20, 725–729. [Google Scholar] [CrossRef]
- De Carvalho Izidoro, J.; Kim, M.C.; Bellelli, V.F.; Pane, M.C.; Junior, A.B.B.; Espinosa, D.C.R.; Tenório, J.A.S. Synthesis of zeolite A using the waste of iron mine tailings dam and its application for industrial effluent treatment. J. Sustain. Min. 2019, 18, 277–286. [Google Scholar]
- Gayana, B.C.; Chandar, K.R. Sustainable use of mine waste and tailings with suitable admixture as aggregates in concrete pavements-A review. Adv. Concr. Constr. 2018, 6, 221. [Google Scholar]
- Feng, P.B.; Shi, H.Y.; Zhou, C.H. Experimental research on shrinkage properties of cement stabilized iron tailings sand mixture. Appl. Mech. Mater. 2013, 423–426, 1301–1307. [Google Scholar]
- Song, H.; Feng, H.; Pan, Z. Analysis of Design Parameters of Curing Agent Stabilized Iron Tailing Base Structure. Shanghai Highw. 2020, 3, 69–72, 101. [Google Scholar]
- Bai, Q.; Zhang, H.; Bao, W. Study on the road performance of solidified iron tailings. Hunan Transp. Sci. Technol. 2020, 46, 40–43, 47. [Google Scholar]
- Bastos, L.A.D.C.; Silva, G.C.; Mendes, J.C.; Peixoto, R.A.F. Using iron ore tailings from tailing dams as road material. J. Mater. Civ. Eng. 2016, 28, 04016102. [Google Scholar] [CrossRef]
- Mohammad, H.; Gorakhki, C.A. Unconfined compressive strength of synthetic and natural mine tailings smended with fly ash and cement. J. Geotech. Geoenvironmental Eng. 2017, 143, 04017017. [Google Scholar]
- Niu, X.; Sun, Y. Numerical analysis on settlement and stability of iron ore tailings subgrade. J. Chang. Univ. Nat. Sci. Ed. 2018, 38, 9–16. [Google Scholar]
- Hou, R.; Chen, S.; Xiao, M. Study on the mechanical properties of iron tailing sand cement composite soil. China Foreign Highw. 2019, 39, 206–209. [Google Scholar]
- Gao, L.; Jia, Z.; Yuan, Z.; Wang, L.; Fu, L. Road performance evaluation of cement stabilized crushed stone milling coarse aggregate. J. China Foreign Highw. 2019, 39, 230–233. [Google Scholar]
- Ma, Z.; Li, H.; Lu, Y. Study on the properties and grading influencing factors of cement in-situ cold recycled base milling material. J. China Foreign Highw. 2018, 38, 263–268. [Google Scholar]
- Gu, W.; Xiao, P.; Yang, Y. Experimental study on shrinkage and fatigue properties of recycled cement stabilized crushed stone base materials. Concr. Cem. Prod. 2018, 12, 95–100. [Google Scholar]
- Dong, Y.; Zhang, H.; Hou, Y.; Qian, Z.; Tian, J. Study on Mechanical Properties of Recycled Mixture with High Content of Iron Tailings Sand. Adv. Mater. Sci. Eng. 2021, 2021, 7658444. [Google Scholar] [CrossRef]
- Bai, Q.; Zhang, H.; Bao, W. Experimental study on stabilization of iron tailings sand gravel by inorganic binding material. Urban Roads Bridg. Hong 2020, 4, 22, 159–161, 171. [Google Scholar]
- GB/T2589-2008; General Principles of Comprehensive Energy Consumption Calculation. National Energy Foundation and Management Standardization Technical Committee: Beijing, China, 2008.
- Sun, G. Causes and Treatment Measures of Shrinkage Cracks in Cement Stabilized Macadam Base. Road Build. Mach. Constr. Mech. 2019, 36, 83–86. [Google Scholar]
- Sha, A.; Hu, L. Structural Characteristics of Semi-rigid Base Course Material. Chin. J. Highw. 2008, 4, 1–5, 42. [Google Scholar]
- JTG D50-2017; Design Specification for Highway Asphalt Pavement. People’s Communications Press: Beijing, China, 2017.
- JTG/T 3833-2018; Fixed Cost of Highway Construction Machinery. People’s Communications Press: Beijing, China, 2019.
Figure 1.
Gradation curves.
Figure 1.
Gradation curves.
Figure 2.
Compaction test apparatus.
Figure 2.
Compaction test apparatus.
Figure 3.
2000 kN press machine.
Figure 3.
2000 kN press machine.
Figure 4.
Pavement material strength tester.
Figure 4.
Pavement material strength tester.
Figure 5.
Dry shrinkage test.
Figure 5.
Dry shrinkage test.
Figure 6.
Temperature shrinkage test.
Figure 6.
Temperature shrinkage test.
Figure 7.
Fatigue test. (a) Sample testing; (b) Data recording of test.
Figure 7.
Fatigue test. (a) Sample testing; (b) Data recording of test.
Figure 8.
Test results of 7 d compressive strength of recycled mixtures.
Figure 8.
Test results of 7 d compressive strength of recycled mixtures.
Figure 9.
Change rule of compressive strength with age.
Figure 9.
Change rule of compressive strength with age.
Figure 10.
Strength comparison before and after immersion.
Figure 10.
Strength comparison before and after immersion.
Figure 11.
Comparison of sample appearance. (a) Cement-stabilized aggregate; (b) Recycled mixture.
Figure 11.
Comparison of sample appearance. (a) Cement-stabilized aggregate; (b) Recycled mixture.
Figure 12.
Strength comparison before and after wet freeze.
Figure 12.
Strength comparison before and after wet freeze.
Figure 13.
Strength comparison before and after dry freeze.
Figure 13.
Strength comparison before and after dry freeze.
Figure 14.
Water loss variation with time.
Figure 14.
Water loss variation with time.
Figure 15.
Dry shrinkage strain variation with time.
Figure 15.
Dry shrinkage strain variation with time.
Figure 16.
Test results of temperature shrinkage coefficient.
Figure 16.
Test results of temperature shrinkage coefficient.
Figure 17.
Fatigue test regression equations.
Figure 17.
Fatigue test regression equations.
Table 1.
ITS gradation.
| Sieve Size, mm | 4.75 | 2.36 | 1.18 | 0.6 | 0.3 | 0.15 | 0.075 |
|---|
| Pass-rate, % | 100 | 99.8 | 98 | 90.4 | 60.2 | 35.8 | 13.2 |
Table 2.
Technical indexes of ITS.
Table 2.
Technical indexes of ITS.
| Fineness Modulus | Water Content
(%) | Apparent Density
(g/cm3) | Water Absorption
(%) | Sand Equivalent
(%) | SiO2
(%) | CaO
(%) | Cr
(%) | Pb
(%) |
|---|
| 1.1 | 8.2 | 2.99 | 3.7 | 82 | 41.01 | 24.35 | 0.004 | 0.001 |
Table 3.
RAI gradation.
| Sieve Size, mm | 26.5 | 19 | 16 | 13.2 | 9.5 | 4.75 |
|---|
| Pass-rate, % | 100 | 97.0 | 92.2 | 86.9 | 63.7 | 43.8 |
| Sieve Size, mm | 2.36 | 1.18 | 0.6 | 0.3 | 0.15 | 0.075 |
| Pass-rate, % | 23.2 | 14.5 | 7.7 | 3.3 | 1.4 | 0.5 |
Table 4.
NA gradation.
| Key Grain Grade (mm) | 26.5 | 19 | 9.5 | 4.75 | 2.36 | 1.18 | 0.6 | 0.075 |
|---|
| 20–25 | 90.6 | 11.2 | 0.5 | 0.5 | 0.5 | 0.5 | 0.5 | 0.3 |
| 10–20 | 100 | 92.6 | 12.8 | 0.3 | 0.3 | 0.3 | 0.3 | 0.3 |
| 5–10 | 100 | 100 | 99.3 | 14.6 | 2.3 | 2.1 | 1.4 | 1.1 |
| 0–5 | 100 | 100 | 100 | 93.1 | 60.4 | 41.4 | 26.8 | 5.2 |
Table 5.
Technical indexes of NA.
Table 5.
Technical indexes of NA.
| ProjectNames | Apparent Density (g/cm3) | Water Absorption (%) | Crush Value (%) | Sand Equivalent (%) |
|---|
| 0–3 | 2.704 | 5.39 | - | 74.4 |
| 3–5 | 2.716 | 2.25 | 5.6 |
| 5–10 | 2.713 | 2.18 | 6.8 | - |
| 10–20 | 2.712 | 1.94 | 21.3 | - |
| 20–30 | 2.709 | 0.62 | 20.8 | - |
Table 6.
Main compositions of special cementitious materials.
Table 6.
Main compositions of special cementitious materials.
| Items | CaO | Si2O | Al2O3 | MgO | SO3 | Fe2O3 | K2O | TiO2 | Na2O |
|---|
| Rate (%) | 39.98 | 27.67 | 13 | 7.656 | 2.55 | 0.69 | 0.525 | 0.517 | 0.422 |
Table 7.
Technical indices of cementitious materials.
Table 7.
Technical indices of cementitious materials.
| Names | Apparent
Density
(g/cm3) | Specific Surface Area (m2/kg) | Setting Time
(min) | Strength of 7 d
(MPa) | Strength of 28 d
(MPa) |
|---|
| Initial | Final | Compressive | Rupture | Compressive | Rupture |
|---|
| A | 2.85 | 350 | 246 | 531 | 6.8 | 2.3 | 61.2 | 8.8 |
| B | 3.03 | 393 | 283 | 367 | 18.9 | 4.1 | 50.9 | 9.6 |
Table 8.
Compaction test results of recycled mixtures.
Table 8.
Compaction test results of recycled mixtures.
Mixture
Proportion | Optimum Water Content (%) | Maximum Dry Density (g/cm3) |
|---|
| 4 | 6 | 8 | 10 | 4 | 6 | 8 | 10 |
|---|
| 50%:50% | 9.0 | 9.3 | 9.4 | 9.4 | 2.109 | 2.117 | 2.128 | 2.132 |
| 60%:40% | 8.9 | 9.2 | 9.1 | 9.1 | 2.083 | 2.089 | 2.100 | 2.114 |
| 70%:30% | 8.8 | 8.9 | 8.8 | 9.0 | 2.072 | 2.073 | 2.085 | 2.112 |
Table 9.
Optimal ratios summary.
Table 9.
Optimal ratios summary.
| Items | Recycled Mixture A | Recycled Mixture B | Recycled Mixture C |
|---|
| ITS mixing content (%) | 50 | 60 | 70 |
| Cementitious material content (%) | 6 | 8 | 8 |
Table 10.
Compaction test results of cement-stabilized aggregate.
Table 10.
Compaction test results of cement-stabilized aggregate.
| Cement Content (%) | 4.0 | 4.5 | 5.0 | 5.5 |
|---|
| Optimum water content (%) | 6.3 | 6.6 | 6.8 | 6.8 |
| Maximum dry density (g/cm3) | 2.238 | 2.266 | 2.269 | 2.289 |
Table 11.
7 d compressive strength test results of cement-stabilized aggregate.
Table 11.
7 d compressive strength test results of cement-stabilized aggregate.
| Cement Content (%) | 4.0 | 4.5 | 5.0 | 5.5 |
|---|
| Average strength (MPa) | 3.8 | 4.5 | 4.7 | 4.8 |
| Coefficient of variation (%) | 9.6 | 12.1 | 9.3 | 8.3 |
| Typical strength (MPa) | 3.3 | 3.8 | 4.1 | 4.3 |
Table 12.
Summary of coefficient of shrinkage.
Table 12.
Summary of coefficient of shrinkage.
| Scheme | A | B | C | ComparisonGroup 1 | ComparisonGroup 2 |
|---|
| Maximum water loss rate (%) | 9.105 | 9.757 | 9.868 | 8.616 | 4.384 |
| Total dry shrinkage strain (10−6) | 397.50 | 616.25 | 645.25 | 607.50 | 352.00 |
| Average shrinkage coefficient (10−6/%) | 43.66 | 63.16 | 65.39 | 70.48 | 80.30 |
Table 13.
Summary of fatigue test results.
Table 13.
Summary of fatigue test results.
| Stress Ratio | The Recycled Mixture C N1 (Times) | | Cement-Stabilized Aggregate N2 (Times) | |
|---|
| 0.6 | 5,517,661 | 6.74 | | |
| 0.65 | 3,060,325 | 6.49 | 6,723,561 | 6.83 |
| 0.7 | 2,417,235 | 6.38 | 2,133,641 | 6.33 |
| 0.75 | 491,101 | 5.69 | 923,755 | 5.97 |
| 0.8 | 36,368 | 4.56 | 110,842 | 5.04 |
| 0.85 | 670 | 2.83 | 3121 | 3.49 |
| 0.90 | | | 489 | 2.69 |
Table 14.
Variance analysis of application process.
Table 14.
Variance analysis of application process.
| Names | Aggregate Mining and Processing | Aggregate Transportation | Mix of Mixture | Mixture Transportation | Mixture Paving | Mixture Rolling |
|---|
| In works or not | √ | × | × | × | × | √ |
Table 15.
Variance analysis of rolling combinations.
Table 15.
Variance analysis of rolling combinations.
| Names | Single Drum Roller | Double Drum Roller | Rubber Tyre Roller |
|---|
| The recycled mixture rolling frequency (times) | 4 | 2 | 2 |
| Cement-stabilized aggregate rolling frequency (times) | 2 | 1 | 4 |
| Diesel oil consumption per work shift (kg) | 149.6 | 40 | 70.4 |
| Rolling speed (km/h) | 5 | 5 | 5 |
| Disclaimer/Publisher’s Note: The statements, opinions and data contained in all publications are solely those of the individual author(s) and contributor(s) and not of MDPI and/or the editor(s). MDPI and/or the editor(s) disclaim responsibility for any injury to people or property resulting from any ideas, methods, instructions or products referred to in the content. |
© 2023 by the authors. Licensee MDPI, Basel, Switzerland. This article is an open access article distributed under the terms and conditions of the Creative Commons Attribution (CC BY) license (https://creativecommons.org/licenses/by/4.0/).


