Cyclic Oxidation Behavior of Conventional and Niobium-Modified MAR-M246 Superalloy at 900 and 1000 °C
Abstract
:1. Introduction
2. Materials and Methods
3. Results
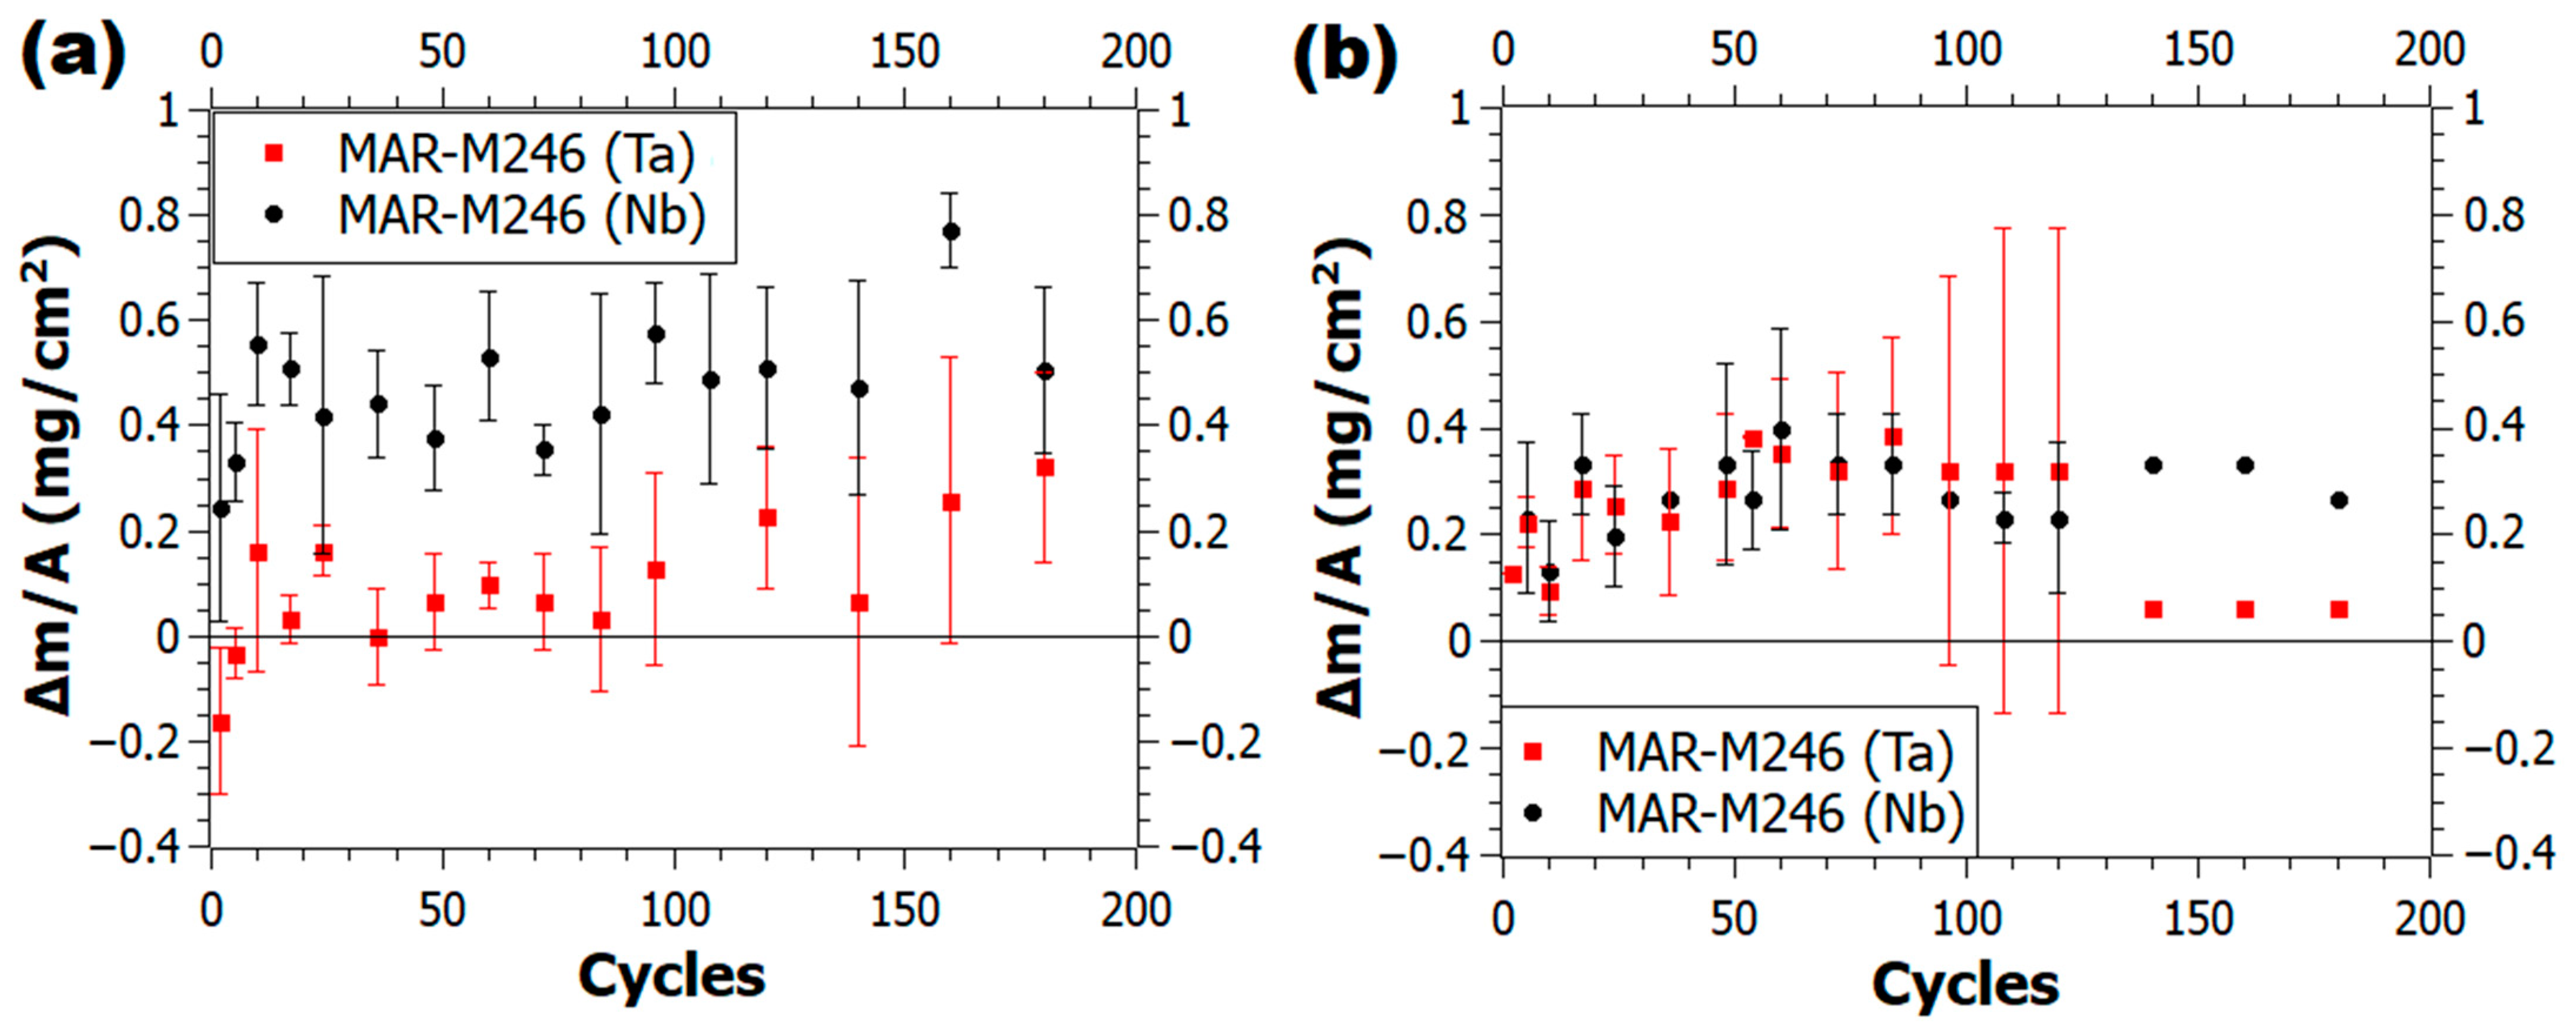
3.1. Mass Variation Kinetics
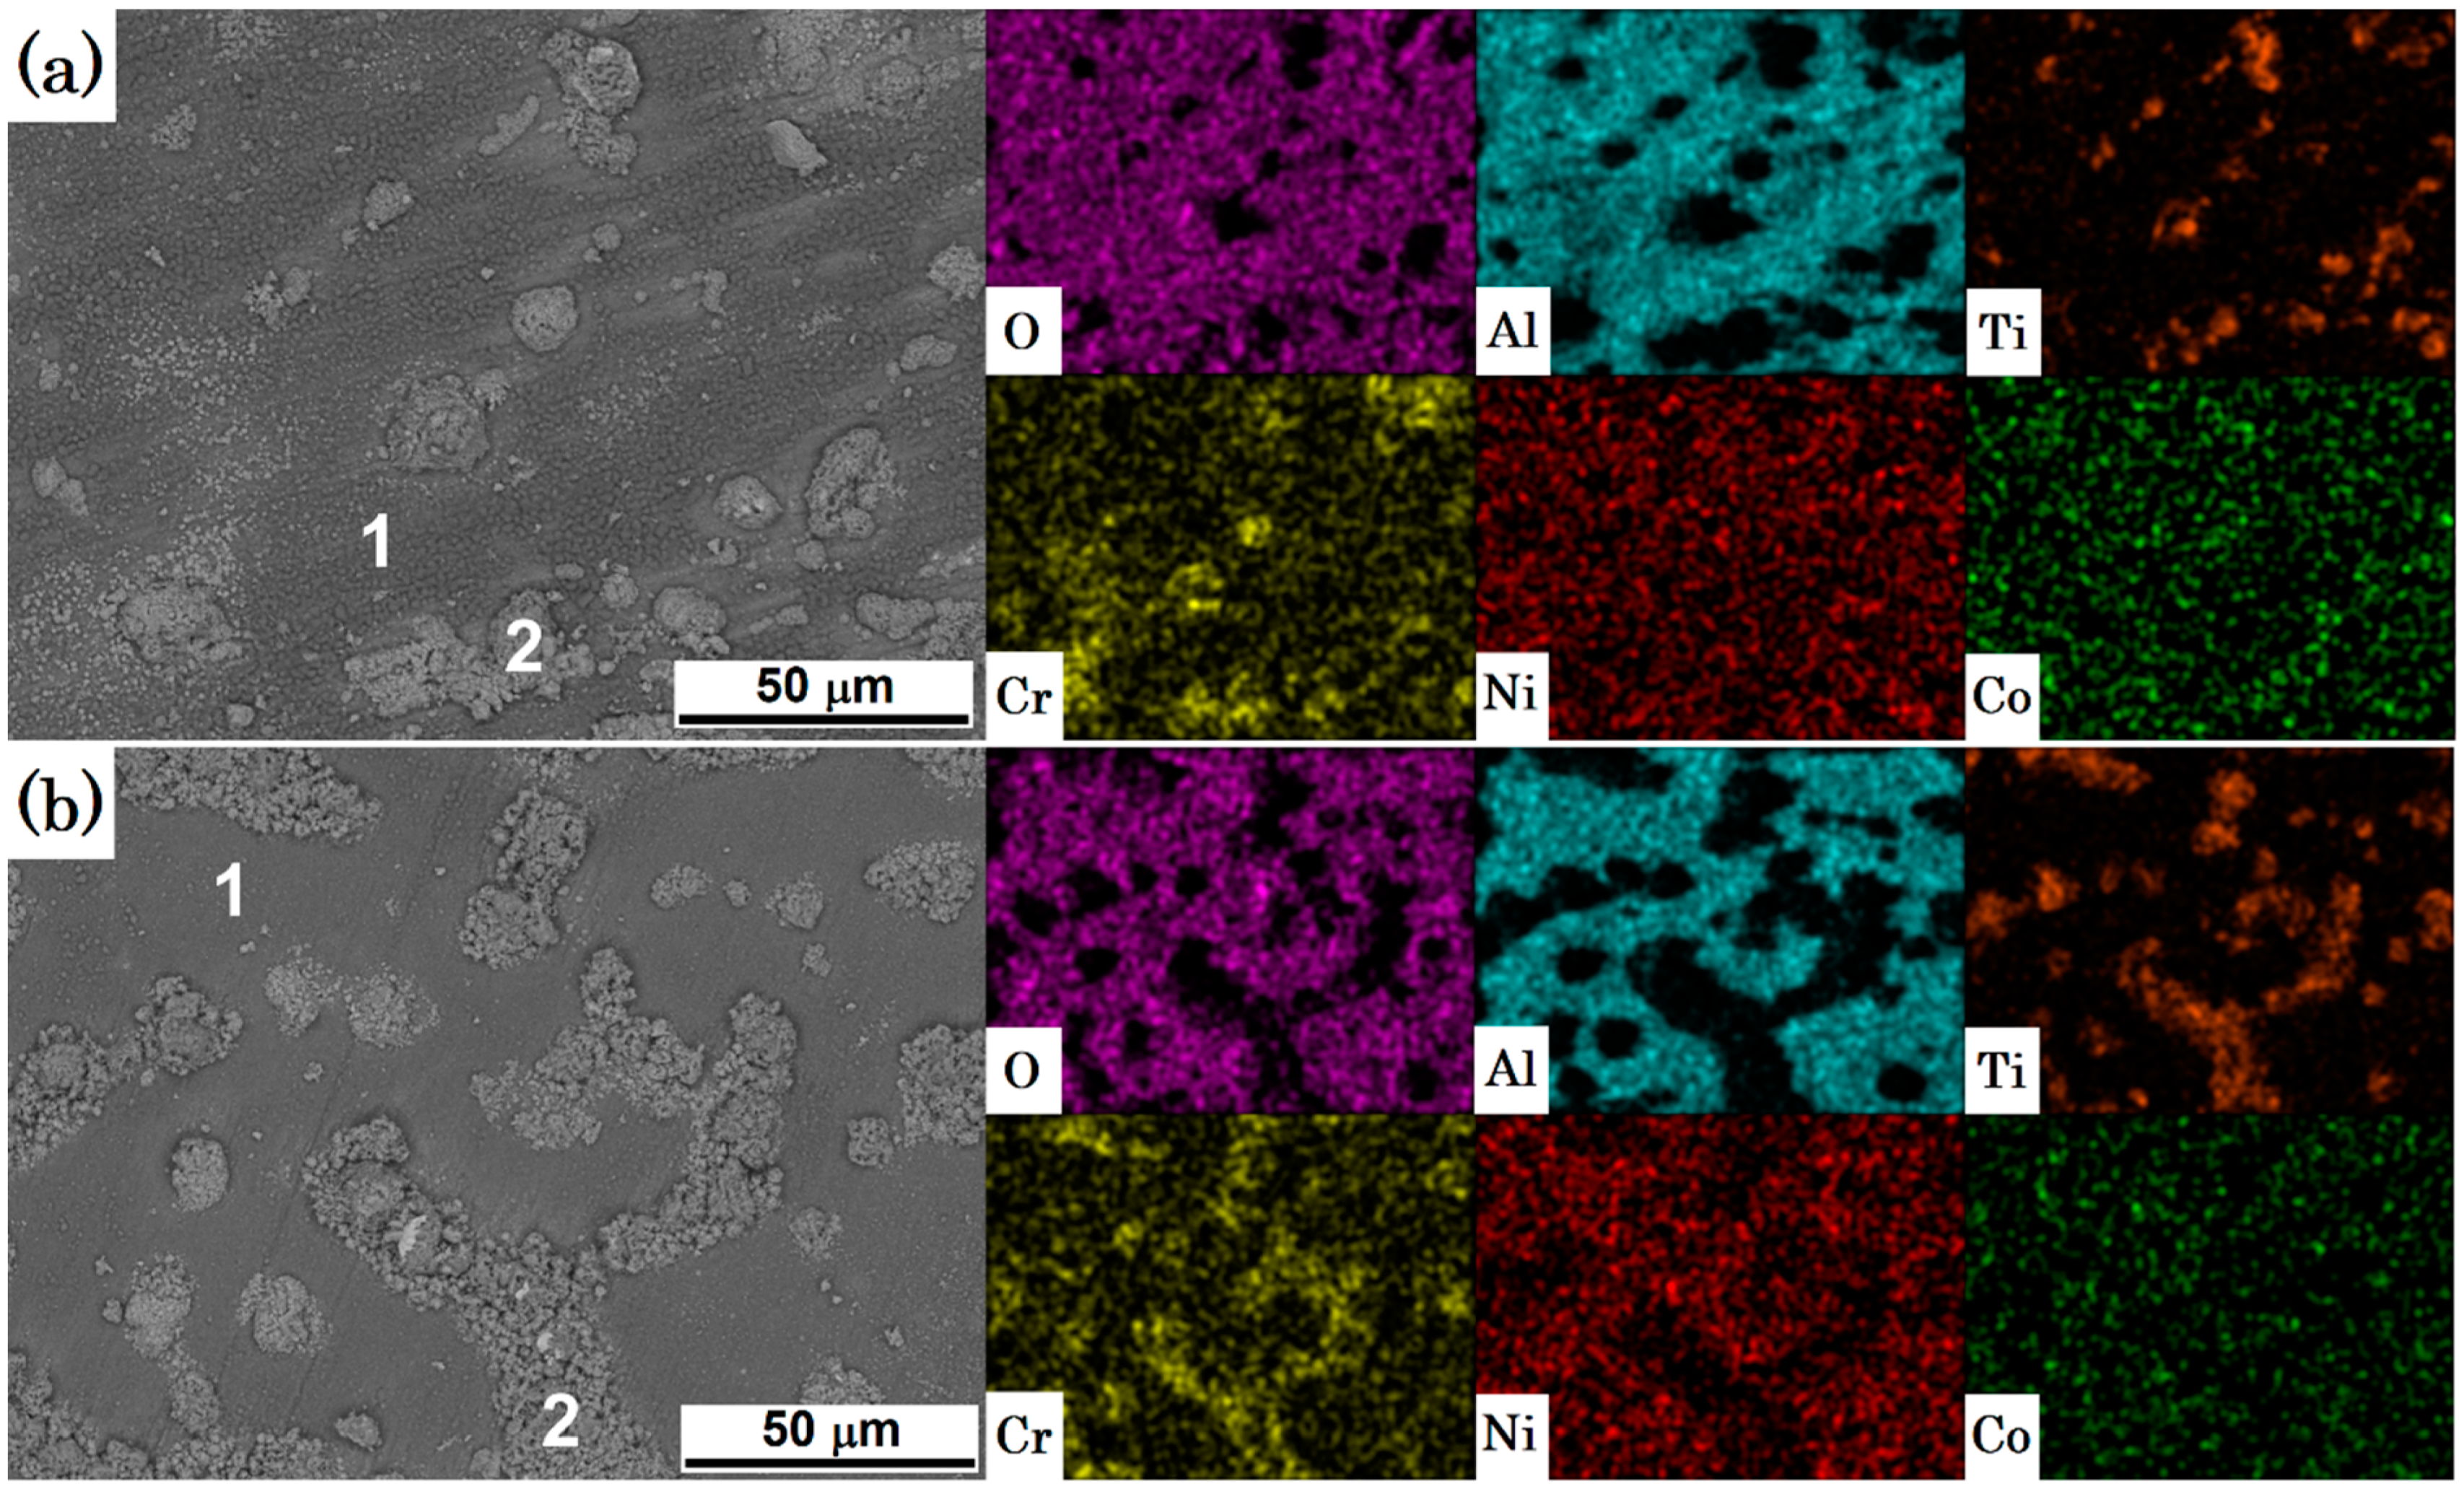
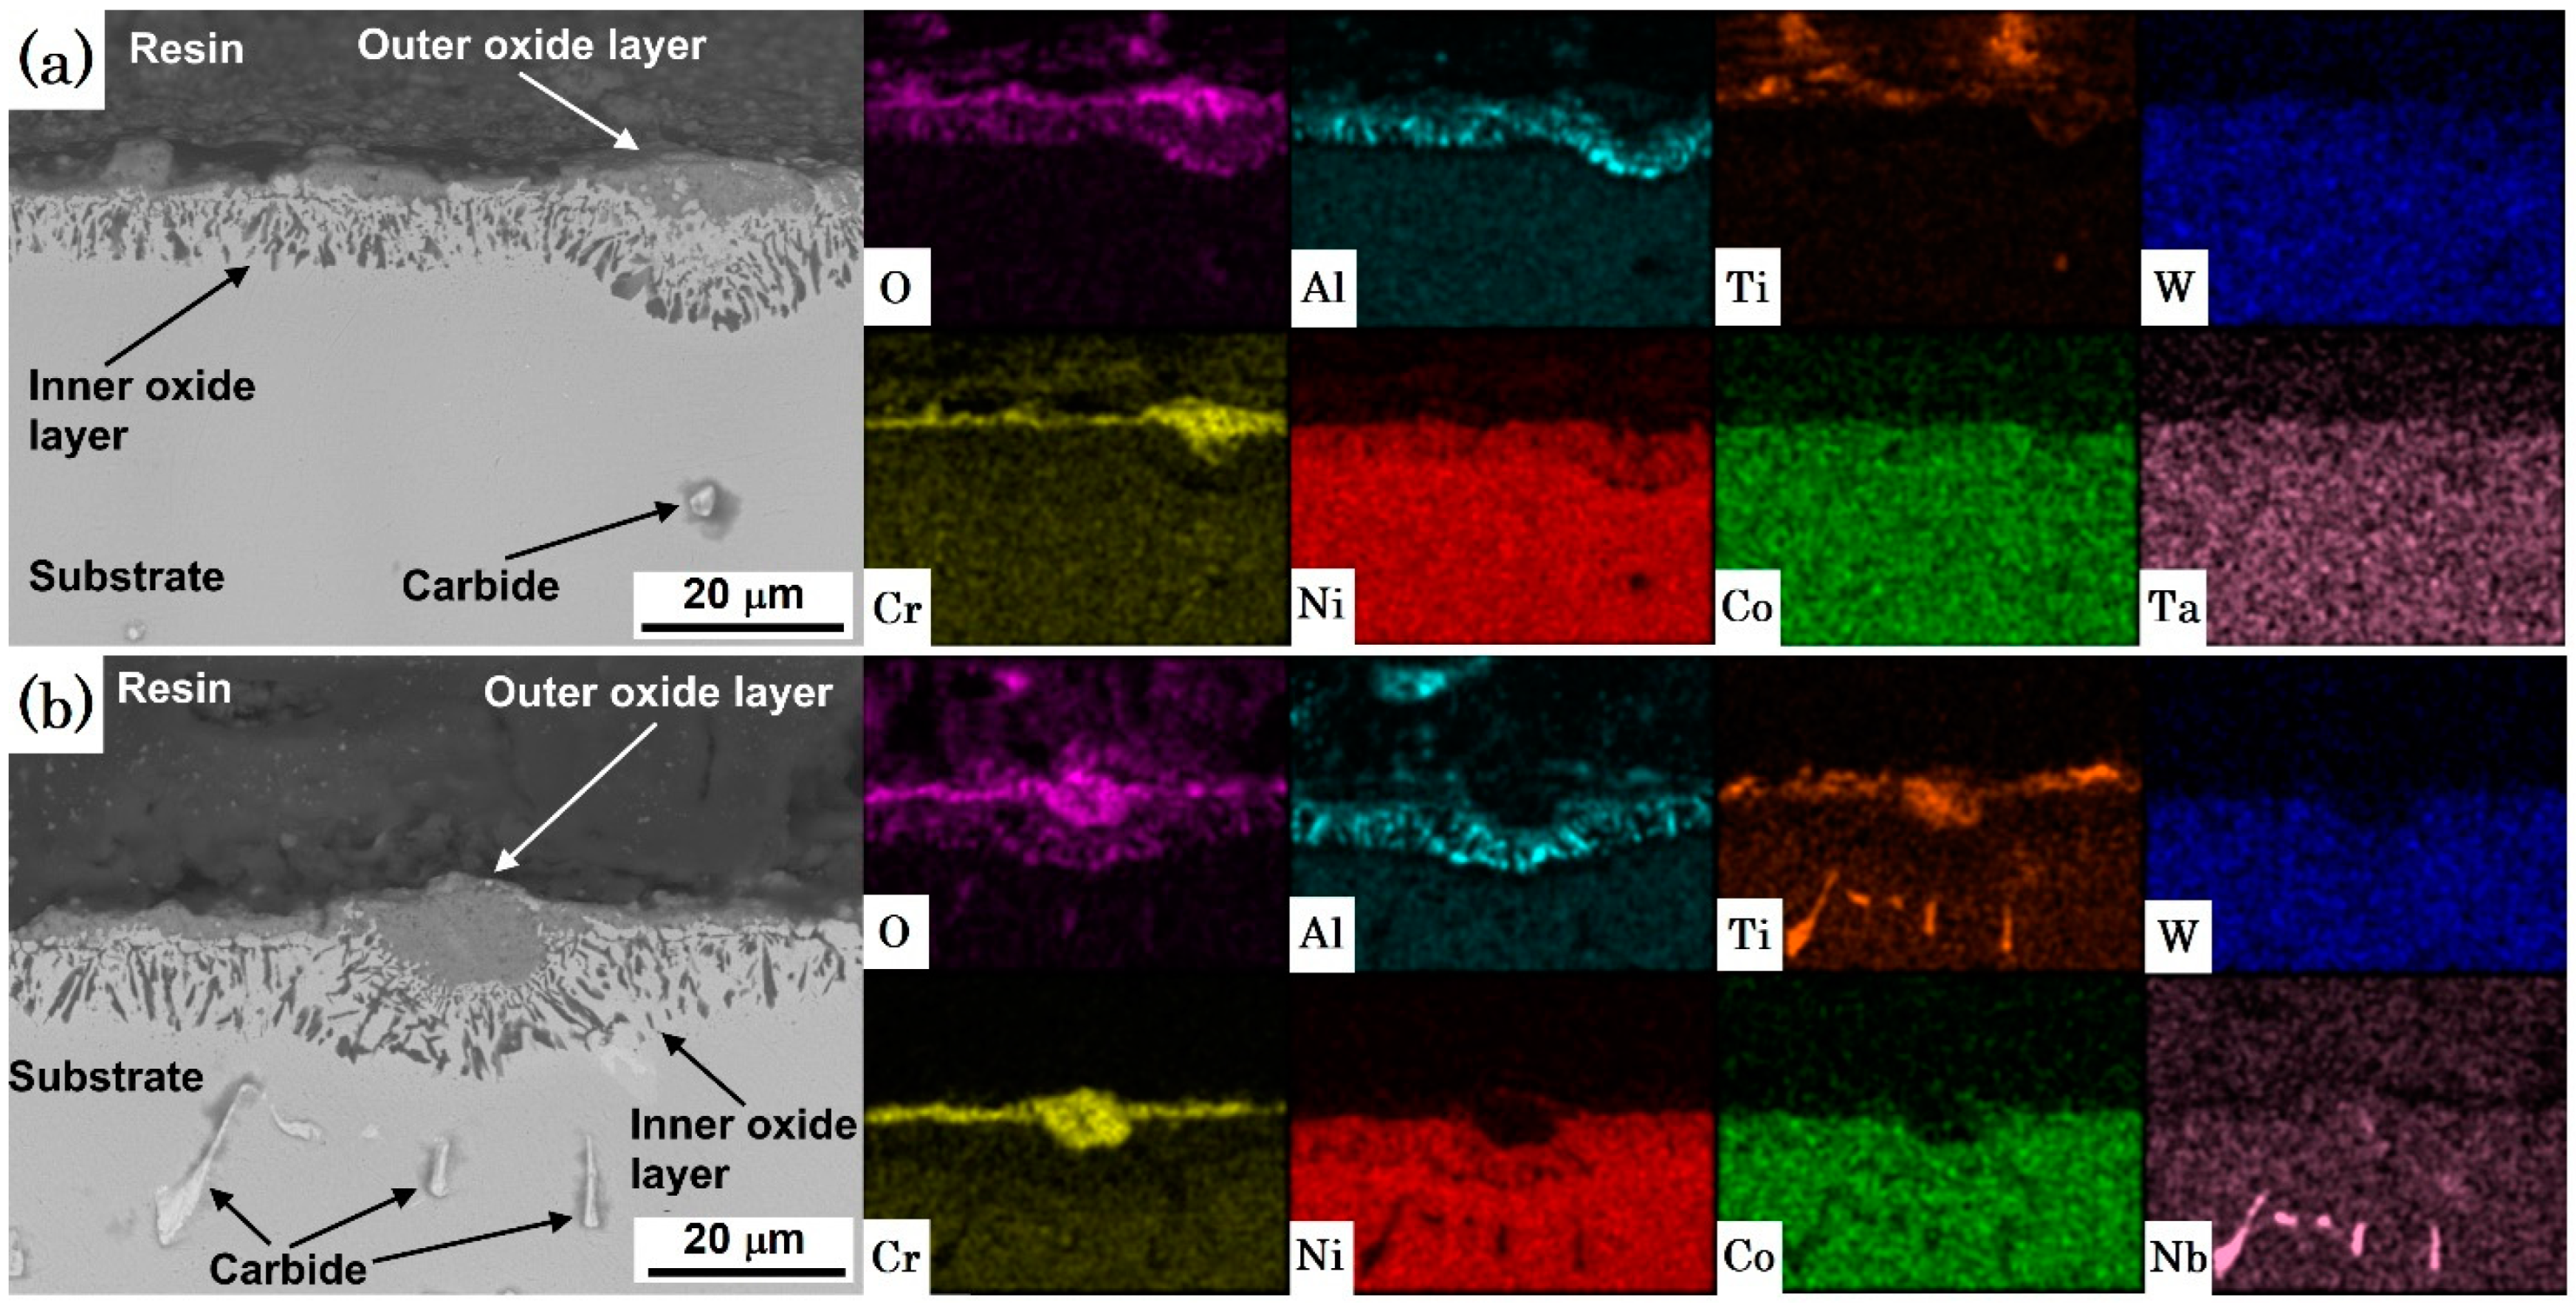
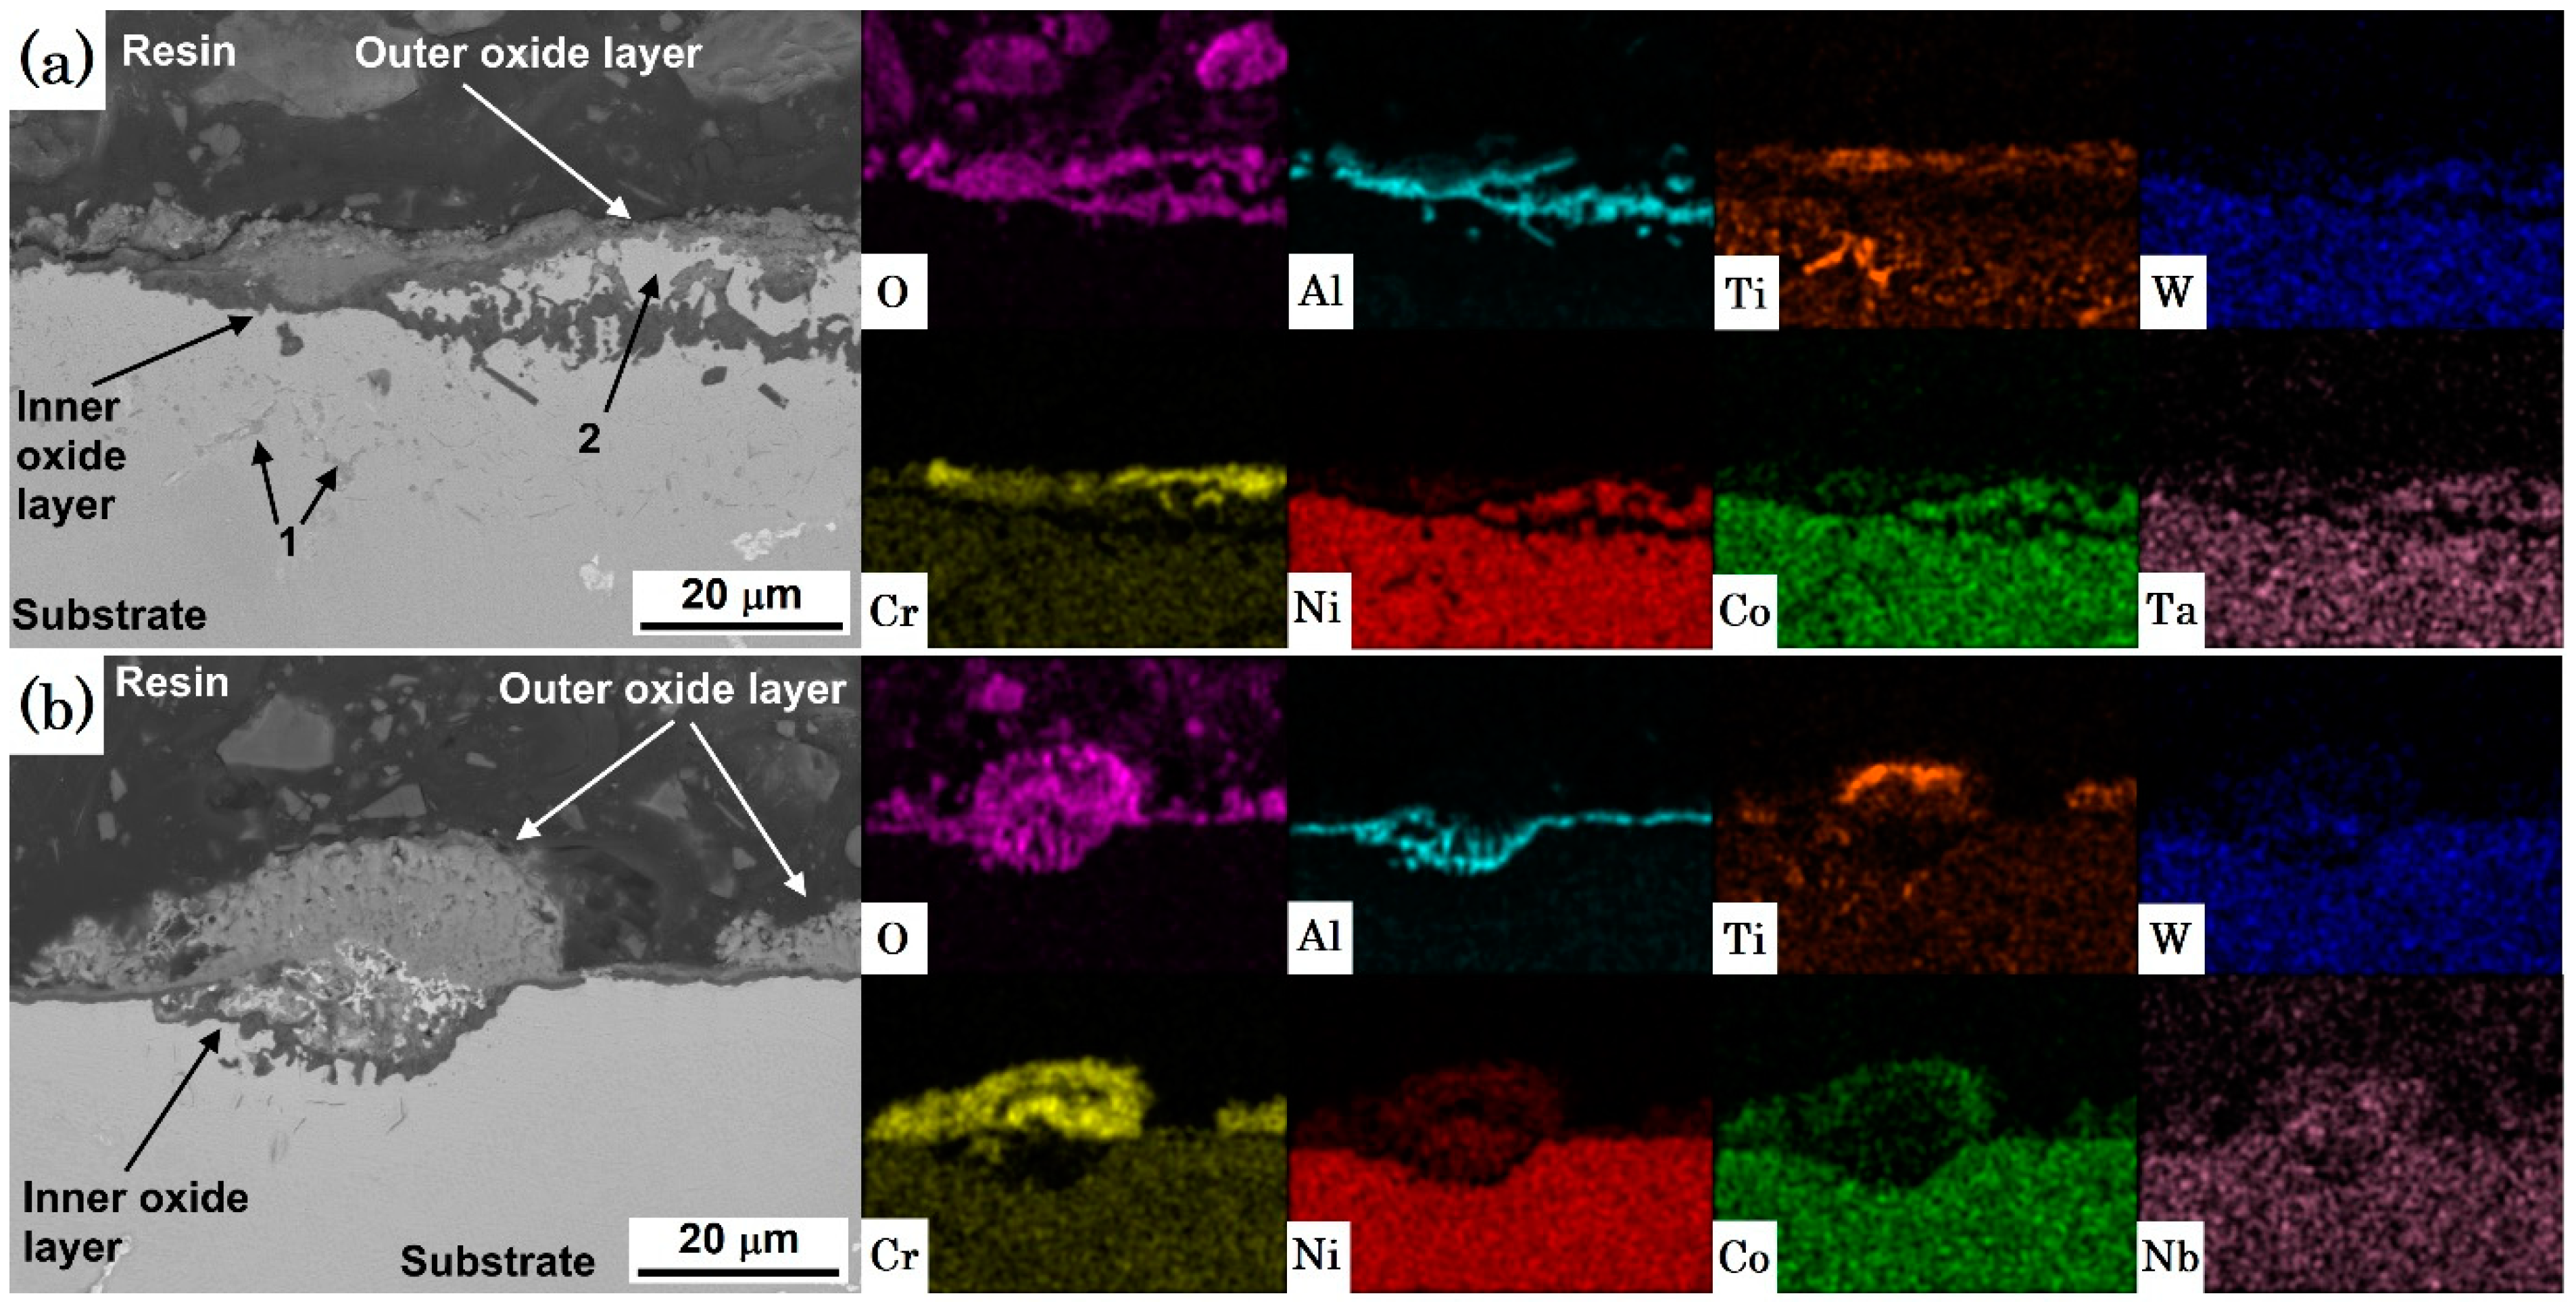
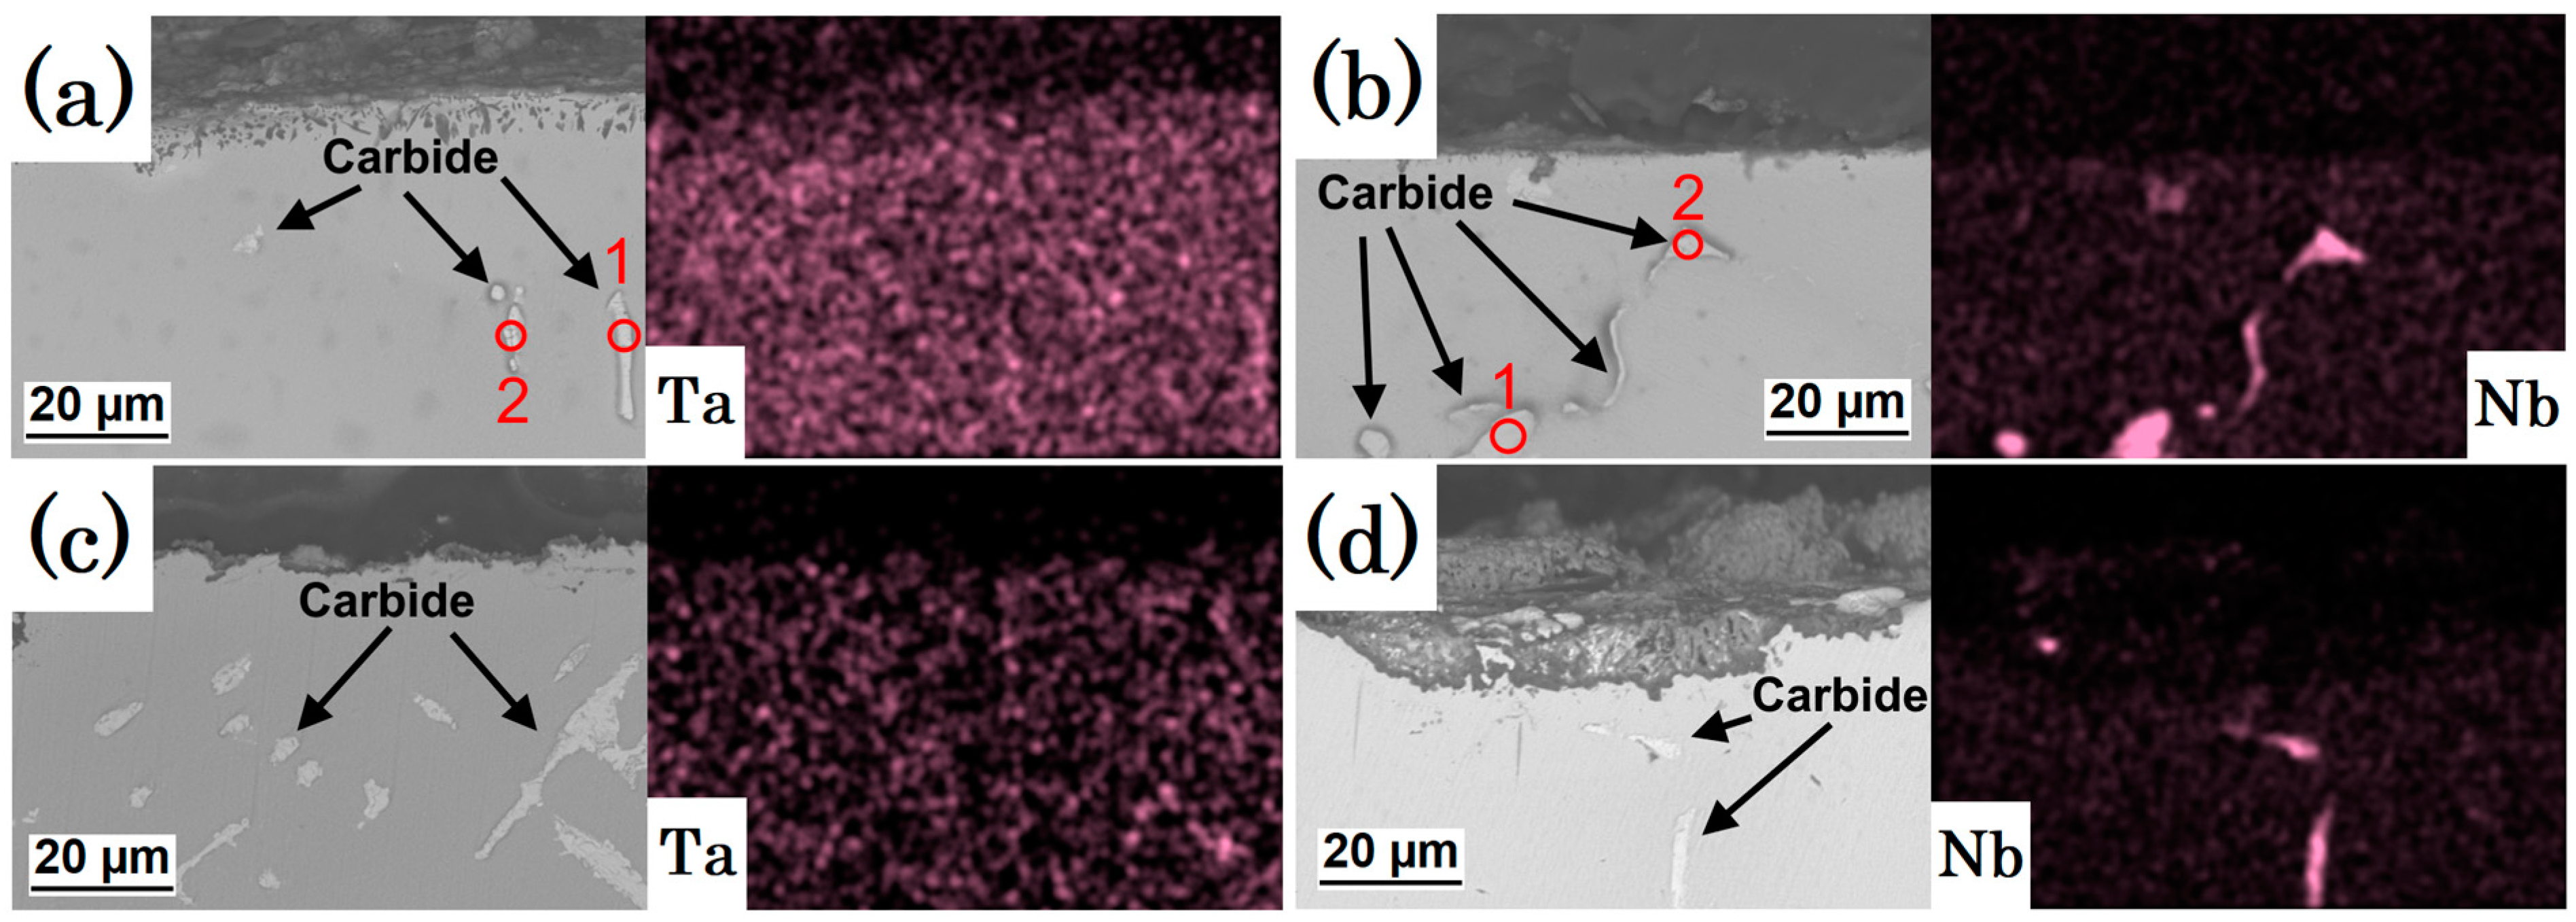
3.2. Topographic and Cross-Section SEM/EDS Analysis
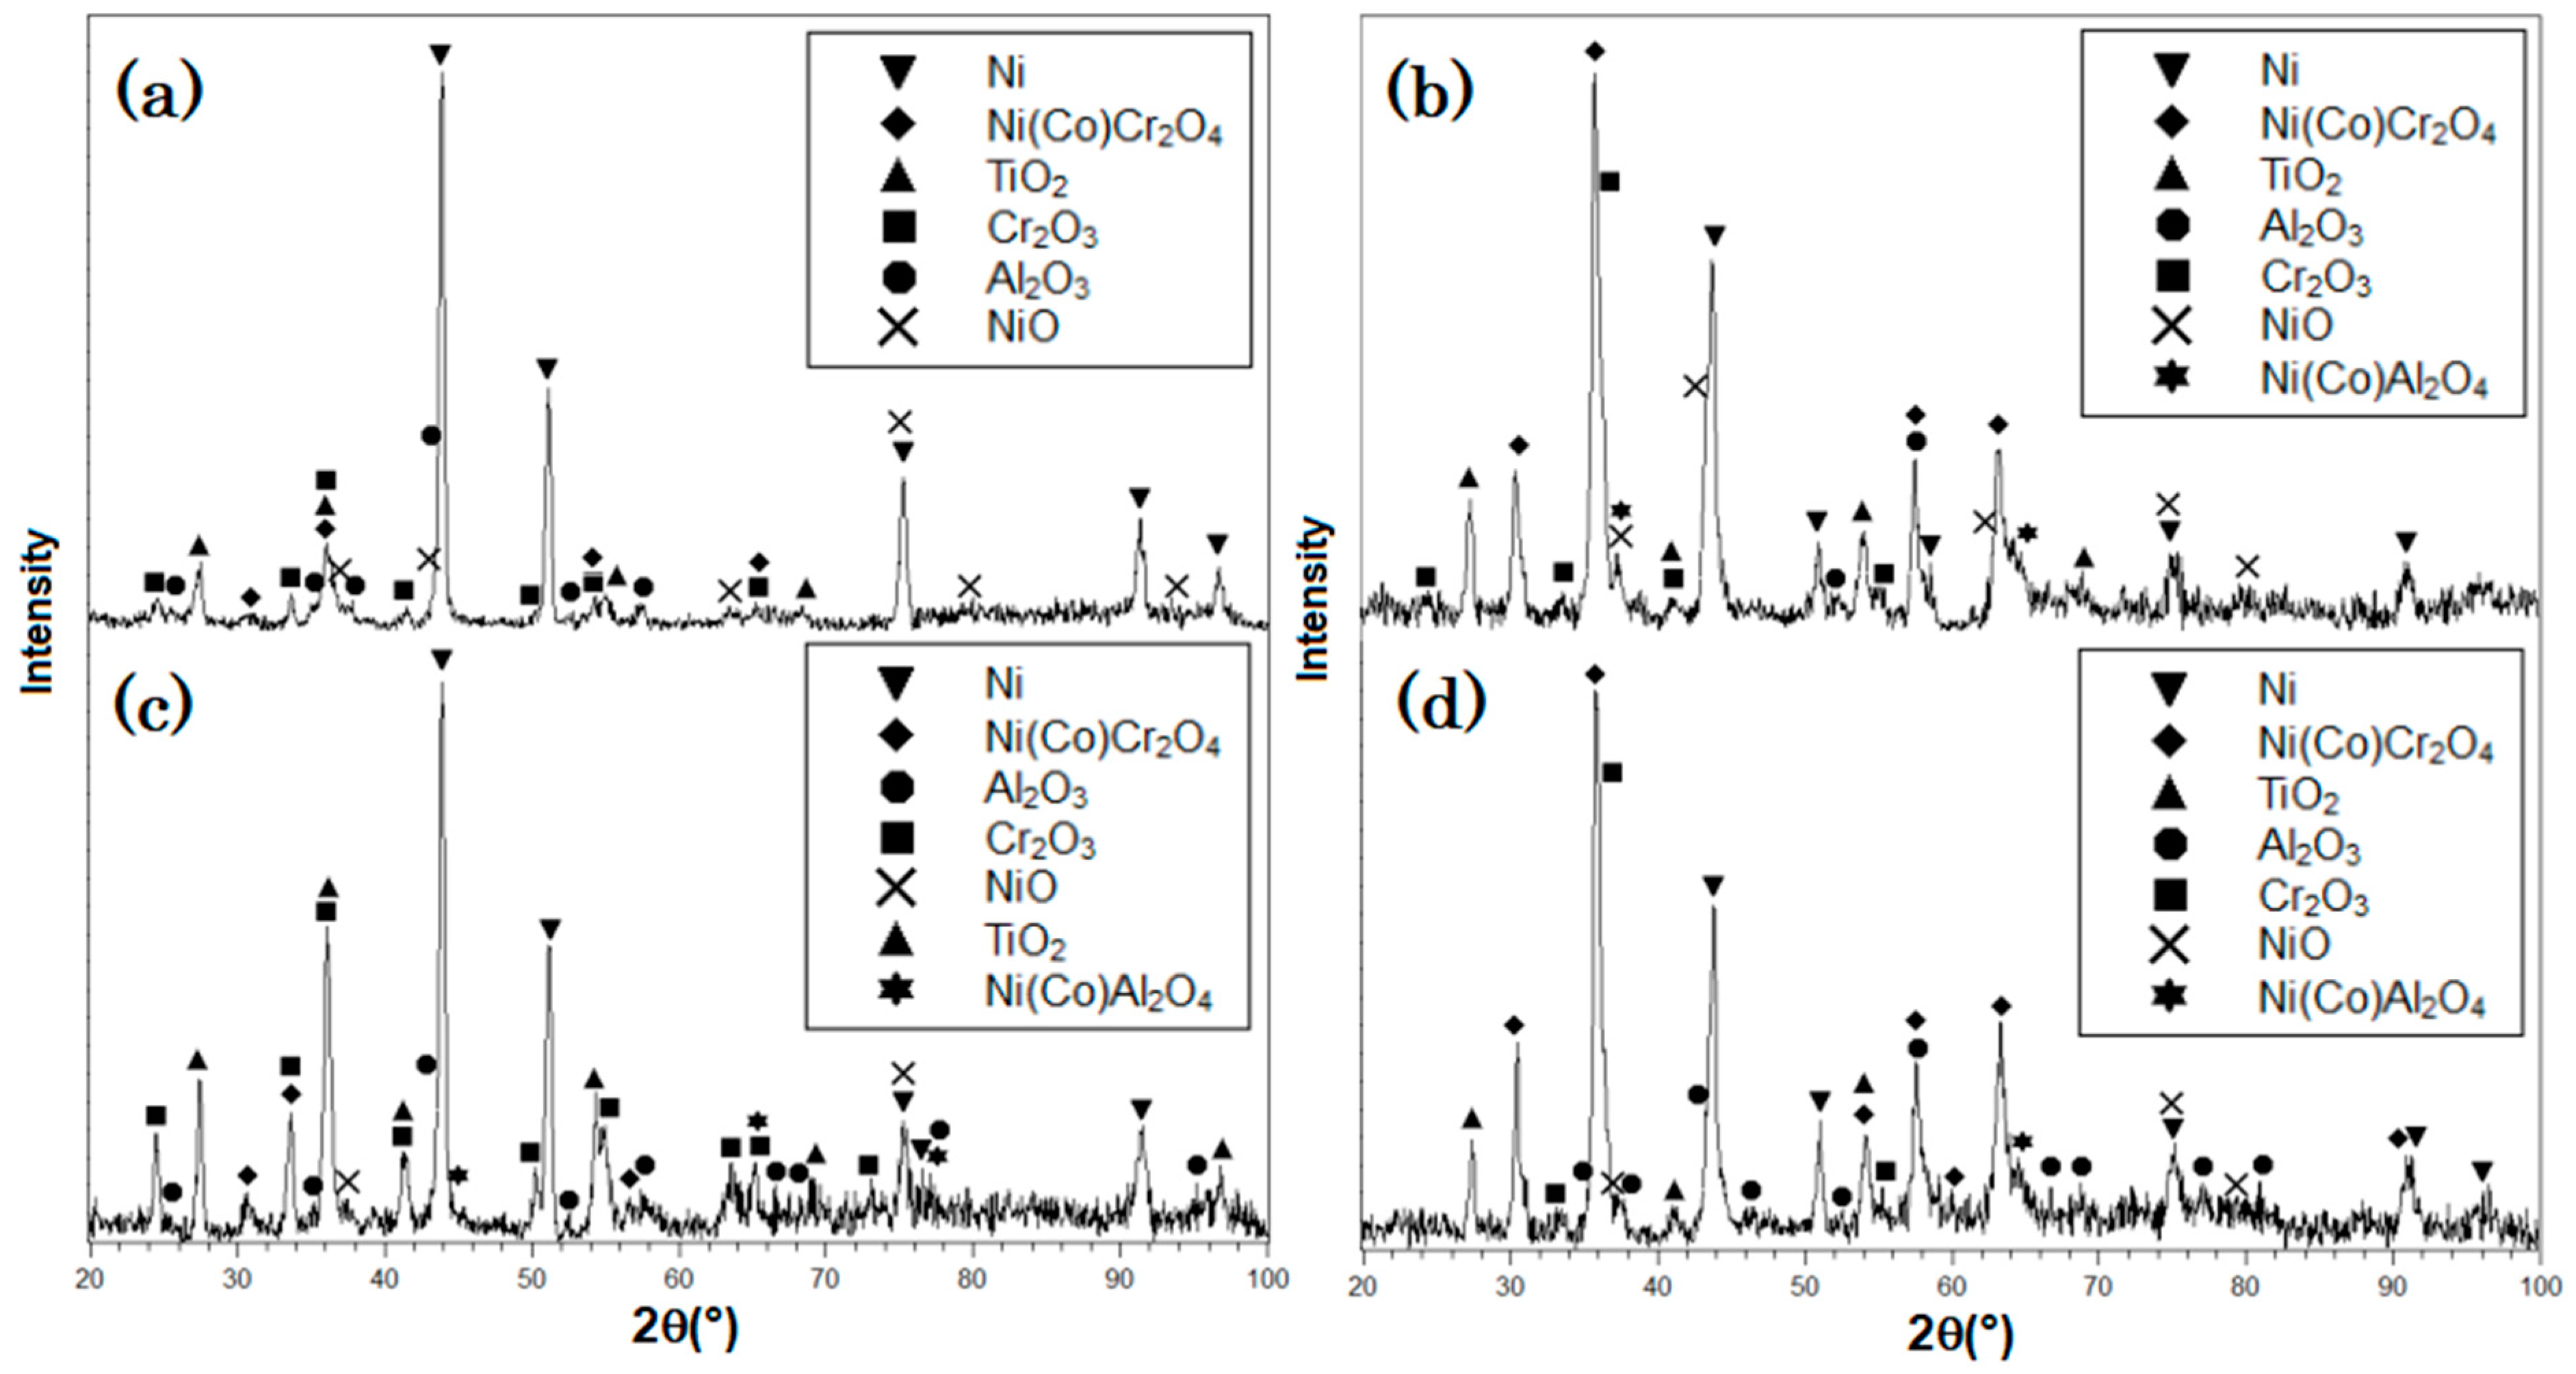
3.3. XRD Analysis
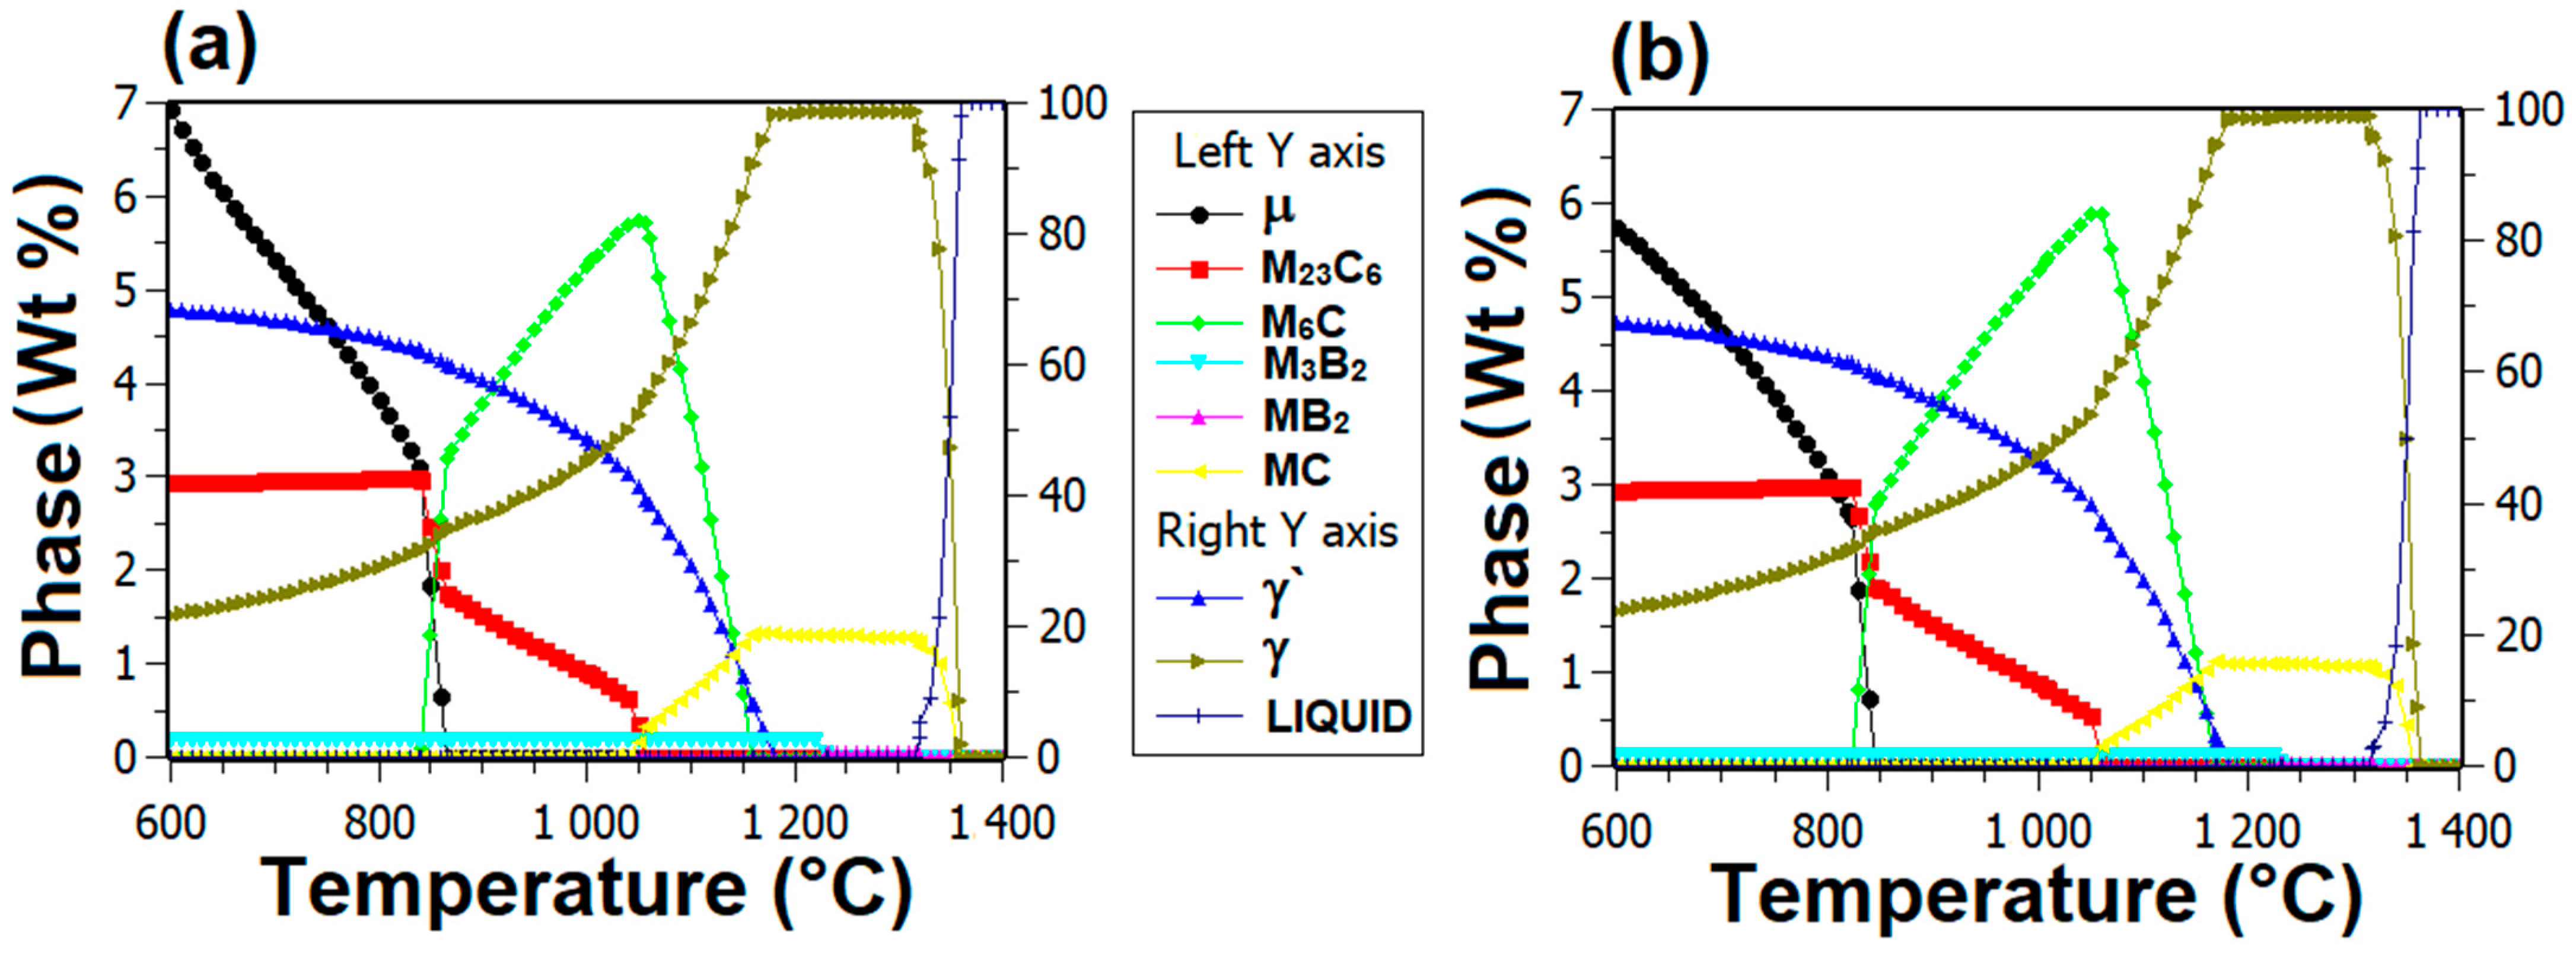
3.4. Thermodynamic Simulations
4. Conclusions
Author Contributions
Funding
Conflicts of Interest
References
- Baldan, R.; Rocha, R.; Tomasiello, R.; Costa, A.; Barboza, M.; Coelho, G.; Rosenthal, R. Solutioning and aging of MAR-M247 nickel-based superalloy. J. Mater. Eng. Perform. 2013, 22, 2574–2579. [Google Scholar] [CrossRef]
- Bhadeshia, H. Nickel Based Superalloys. Available online: http://www.phase-trans.msm.cam.ac.uk/2003/Superalloys/superalloys.html (accessed on 16 January 2021).
- Campbell, F.C. Superalloys. In Manufacturing Technology for Aerospace Structural Materials; Elsevier: Amsterdam, The Netherlands, 2006. [Google Scholar]
- Ezugwu, E.O. High speed machining of aero-engine alloys. J. Braz. Soc. Mech. Sci. Eng. 2004, 26, 1–11. [Google Scholar] [CrossRef] [Green Version]
- Reed, R.C. The Superalloys Fundamentals and Applications; Cambridge University Press: Cambridge, UK, 2006. [Google Scholar]
- Costa, A.M.S. Solidificação Direcional da Superliga MAR-M247 Modificada com Nióbio: Processamento e Caracterizações Microestruturais e Mecânicas. Ph.D. Thesis, Lorena’s School of engineering, University of São Paulo, Lorena, Brazil, 2014; p. 168. [Google Scholar]
- Jena, A.K.; Chaturvedi, M.C. Review the role of alloying elements in the design of nickel-base superalloy. J. Mater. Sci. 1984, 19, 3121–3139. [Google Scholar] [CrossRef]
- Pollock, T.M.; Tin, S. Nickel-based superalloys for advanced turbine engines: Chemistry, microstructure, and properties. J. Propuls. Power 2006, 22, 361–374. [Google Scholar] [CrossRef]
- Birks, N.; Meier, G.H.; Pettit, F.S. Introduction to the High Temperature Oxidation of Metals; Edward Arnold: London, UK, 2006. [Google Scholar]
- Lvov, G.; Levit, V.I.; Kaufman, M.J. Mechanism of primary MC carbide decomposition in Ni-base superalloys. Metall. Mater. Trans. A Phys. Metall. Mater. Sci. 2004, 35, 1669–1679. [Google Scholar] [CrossRef]
- Sun, W.; Qin, X.; Guo, J.; Lou, L.; Zhou, L. Thermal stability of primary MC carbide and its influence on the performance of cast Ni-base superalloys. Mater. Des. 2015, 69, 81–88. [Google Scholar] [CrossRef]
- Baldan, R.; Silva, A.; Nunes, C.; Couto, A.; Gabriel, S.; Alkmin, L. Solution and aging of MAR-M246 nickel-based superalloy. J. Mater. Eng. Perform. 2016, 26, 465–471. [Google Scholar] [CrossRef] [Green Version]
- Alkmin, L.B.; Chaia, N.; Utada, S.; Cormier, J.; Baldan, R.; Coelho, G.; Nunes, C.A. High Temperature Oxidation Behavior of Conventional and Nb-Modified MAR-M246 Ni-Based Superalloy. Metall. Mater. Trans. A Phys. Metall. Mater. Sci. 2021, 52, 2589–2600. [Google Scholar] [CrossRef]
- Alkmin, L.B.; Utada, S.; Chaia, N.; Reis, D.A.; Coelho, G.C.; Cormier, J.; Nunes, C.A. Creep behavior of conventional and Nb-modified as-cast MAR-M246 superalloy. Mater. Sci. Eng. A 2021, 813, 141170. [Google Scholar] [CrossRef]
- Eriş, R.; Akdeniz, M.V.; Mekhrabov, A.O. Atomic size effect of alloying elements on the formation, evolution and strengthening of γ′-Ni 3 Al precipitates in Ni-based superalloys. Intermetallics 2019, 109, 37–47. [Google Scholar] [CrossRef]
- Christofidou, K.A.; Hardy, M.C.; Li, H.; Argyrakis, C.; Kitaguchi, H.; Jones, N.G.; Mignanelli, P.M.; Wilson, A.S.; Messe, O.; Pickering, J.; et al. On the Effect of Nb on the Microstructure and Properties of Next Generation Polycrystalline Powder Metallurgy Ni-Based Superalloys. Metall. Mater. Trans. A Phys. Metall. Mater. Sci. 2018, 49, 3896–3907. [Google Scholar] [CrossRef] [Green Version]
- Mallikarjuna, H.T.; Richards, N.L.; Caley, W.F. Isothermal Oxidation Comparison of Three Ni-Based Superalloys. J. Mater. Eng. Perform. 2017, 26, 2014–2023. [Google Scholar] [CrossRef]
- Smialek, J.L.; Bonacuse, P.J. Compositional effects on the cyclic oxidation resistance of conventional superalloys. Mater. High Temp. 2016, 33, 489–500. [Google Scholar] [CrossRef] [Green Version]
- Weng, F.; Yu, H.; Chen, C.; Wan, K. Fabrication of Ni-Based Superalloys Containing Nb and Their High Temperature Oxidation Behaviors. Mater. Manuf. Process. 2015, 30, 1364–1369. [Google Scholar] [CrossRef]
- Zhou, D.; Ye, X.; Teng, J.; Li, C.; Li, Y. Effect of Nb on microstructure and mechanical property of novel powder metallurgy superalloys during long-term thermal exposure. Materials 2021, 14, 656. [Google Scholar] [CrossRef] [PubMed]
- Ye, X.; Yang, B.; Nie, Y.; Yu, S.; Li, Y. Influence of Nb addition on the oxidation behavior of novel Ni-base superalloy. Corros. Sci. 2021, 185, 109436. [Google Scholar] [CrossRef]
- Baldan, R.; Guimarães, R.; Nunes, C.; Gabriel, S.; Coelho, G. Oxidation behavior of the niobium-modified MAR-M247 superalloy at 1000 °C in air. Oxid. Met. 2014, 83, 151–166. [Google Scholar] [CrossRef]
- Sundararaman, M.; Mukhopadhyay, P.; Banerjee, S. Carbide Precipitation in Nickel Base Superalloys 718 and 625 and Their Effect on Mechanical Properties. Miner. Met. Mater. Soc. 1997, 718, 625–706. [Google Scholar]
- Kim, H.; Park, S.; Seo, S.; Yoo, Y.; Jeong, H.; Jang, H. High temperature oxidation resistance of Ni-(5∼13)Co-(10∼16)Cr-(5∼9)W-5Al-(1∼1.5)Ti-(3∼6)Ta alloys. Met. Mater. Int. 2016, 22, 789–796. [Google Scholar] [CrossRef]
- Baldan, R.; Latu-Romein, L.; Wouters, Y.; Chaia, N.; Alkmin, L.; Malafaia, A.M. Isothermal short-term oxidation behavior of MAR-M246 nickel-based superalloy at 800 °C and 1000 °C. Mater. Corros. 2022, 73, 1236–1247. [Google Scholar] [CrossRef]
- Das, D.K.; Singh, V.; Joshi, S.V. High temperature oxidation behavior of directionally solidified nickel base superalloy CM—247LC. Mater. Sci. Technol. 2003, 19, 695–708. [Google Scholar] [CrossRef]


| Elements (wt. %) | MAR-M246(Ta) | MAR-M246(Nb) |
|---|---|---|
| Cr | 9.0 | 9.09 |
| Co | 10.0 | 9.94 |
| Mo | 2.5 | 2.46 |
| W | 10.0 | 10.1 |
| Al | 5.5 | 5.44 |
| Ti | 1.5 | 1.44 |
| Ta | 1.5 | - |
| Nb | - | 0.84 |
| C | 0.15 | 0.15 |
| B | 0.015 | 0.01 |
| Zr | 0.05 | 0.05 |
| Ni | Bal. | Bal. |
| Alloy | Cycles | Oxidation Products | Oxidation Products |
|---|---|---|---|
| at 900 °C | at 1000 °C | ||
| MAR-M246(Ta) | 180 | TiO2, Al2O3, Cr2O3, | TiO2, Al2O3, Cr2O3, NiO, |
| NiO, Ni(Co)Cr2O4 | Ni(Co)Cr2O4, Ni(Co)Al2O4 | ||
| MAR-M246(Nb) | 180 | TiO2, Al2O3, Cr2O3, NiO, | TiO2, Al2O3, Cr2O3, NiO, |
| Ni(Co)Cr2O4, Ni(Al)Cr2O4 | Ni(Co)Cr2O4, Ni(Co)Al2O4 |
Disclaimer/Publisher’s Note: The statements, opinions and data contained in all publications are solely those of the individual author(s) and contributor(s) and not of MDPI and/or the editor(s). MDPI and/or the editor(s) disclaim responsibility for any injury to people or property resulting from any ideas, methods, instructions or products referred to in the content. |
© 2023 by the authors. Licensee MDPI, Basel, Switzerland. This article is an open access article distributed under the terms and conditions of the Creative Commons Attribution (CC BY) license (https://creativecommons.org/licenses/by/4.0/).
Share and Cite
de Faria Cunha, F.A.; de Andrade Reis, R.; Gonçalves, S.P.; Fernandes, F.A.P.; Baldan, R.; de Sousa Malafaia, A.M. Cyclic Oxidation Behavior of Conventional and Niobium-Modified MAR-M246 Superalloy at 900 and 1000 °C. Coatings 2023, 13, 519. https://doi.org/10.3390/coatings13030519
de Faria Cunha FA, de Andrade Reis R, Gonçalves SP, Fernandes FAP, Baldan R, de Sousa Malafaia AM. Cyclic Oxidation Behavior of Conventional and Niobium-Modified MAR-M246 Superalloy at 900 and 1000 °C. Coatings. 2023; 13(3):519. https://doi.org/10.3390/coatings13030519
Chicago/Turabian Stylede Faria Cunha, Filipe Augusto, Rodrigo de Andrade Reis, Samantha Pinto Gonçalves, Frederico Augusto Pires Fernandes, Renato Baldan, and Artur Mariano de Sousa Malafaia. 2023. "Cyclic Oxidation Behavior of Conventional and Niobium-Modified MAR-M246 Superalloy at 900 and 1000 °C" Coatings 13, no. 3: 519. https://doi.org/10.3390/coatings13030519
APA Stylede Faria Cunha, F. A., de Andrade Reis, R., Gonçalves, S. P., Fernandes, F. A. P., Baldan, R., & de Sousa Malafaia, A. M. (2023). Cyclic Oxidation Behavior of Conventional and Niobium-Modified MAR-M246 Superalloy at 900 and 1000 °C. Coatings, 13(3), 519. https://doi.org/10.3390/coatings13030519


