Article

The Influence of Galvanizing on the Surface Quality and Part Precision of S235J0 Alloy Machined by Turning

by
Sandor Ravai-Nagy
1,
Aurel Mihail Titu
2,* and
Alina Bianca Pop
1,*
1
Department of Engineering and Technology Management, Faculty of Engineering, Northern University Centre of Baia Mare, Technical University of Cluj-Napoca, 62A, Victor Babes Street, 430083 Baia Mare, Romania
2
Industrial Engineering and Management Department, Faculty of Engineering, “Lucian Blaga” University of Sibiu, 10 Victoriei Street, 550024 Sibiu, Romania
*
Authors to whom correspondence should be addressed.
Coatings 2023, 13(4), 701; https://doi.org/10.3390/coatings13040701
Submission received: 13 February 2023 / Revised: 20 March 2023 / Accepted: 28 March 2023 / Published: 30 March 2023
(This article belongs to the Special Issue Surface Modification of Magnesium, Aluminum Alloys, and Steel)

Abstract

:
This scientific paper aims to determine the optimal economic roughness of galvanized surfaces by studying the influence of turning surface roughness on the quality of galvanizing. The thickness of the zinc layer, its corrosion resistance, and the precision of the galvanized parts were also examined. S235J0 steel samples were processed using a turning operation to obtain different roughness values. Three galvanizing technologies, galvanic galvanizing, hot dip galvanizing, and hot dip galvanizing with centrifugation, were used in the experiments. The surface evolution from turning to zinc layer deposition was monitored, and parts were subjected to salt spray corrosion resistance testing. Statistical analysis confirmed the stability of the technologies used and the accuracy of the experimental data. Optimal roughness ranges for galvanizing were determined based on the quality of the surface before galvanizing and the galvanizing technology used. The findings show that avoiding small roughness values leads to savings in the machining phases. From the dimensional accuracy perspective, the parts have smaller dimensions after galvanizing, and the dimensional accuracy decreases. The study confirms that steel parts are protected from corrosion, and degradation of the zinc layer is more advanced in sections with less roughness. The optimal surface roughness values before galvanizing were determined to be Ra < 3.657 m in the case of HDG, Ra < 3.344 m in the case of HDG+C, and Ra > 2.928 μm in the case of ZP. The conclusions drawn from this study introduce new directions of research.

1. Introduction

For machined components, the surface quality and the parts’ precision are crucial factors that influence the product’s overall performance. Galvanizing is a common method for preventing the corrosion of steel components. Yet, it can also have an impact on the part’s accuracy and the surface quality of machined components. The current understanding of the impact of galvanizing on the surface quality and component accuracy of S235J0 alloy machined by turning is summarized in this section.
By having them hot dipped in zinc, steel components may be successfully shielded from corrosion, which can lower their durability and sustainability. The authors of [1] offered a cutting-edge examination of the “liquid-metal-aided cracking” of precast structural steel components in hot zinc baths and makes suggestions for a quantitative evaluation approach to prevent this cracking.
When iron or steel is hot dip galvanized, a multilayer, corrosion-resistant covering of metallic zinc and zinc–iron alloy is produced [2,3]. As the steel is immersed in the metal, a metallurgical reaction takes place between iron in the steel and molten zinc [4,5]. The coating forms perpendicular to all the surfaces because of the reaction’s diffusion process, giving the part a uniform thickness [2]. Surface preparation by the hot dip galvanizing process strives to give the cleanest steel surface possible by removing all oxides and other contaminating residues [6]. As impure steel will not react with zinc, meticulous surface preparation is essential [7].
Steel is initially immersed in a degreasing bath, such as a caustic alkaline solution, to remove organic impurities such as dirt, oil, and grease from its surface. After degreasing, the steel is washed with water [8,9].
The remaining oxides and mill scale are removed by pickling the steel in a mild solution of sulfuric or hydrochloric acid [10]. Once all the oxides have been removed from the steel, it is washed with water once again before proceeding to the last stage of surface preparation [11].
After that, flux is poured over the steel. Flux is used to clear the steel of any oxidation left over from the pickling procedure and to provide a barrier to halt oxidation before the steel enters the galvanizing kettle [12]. One sort of flux is stored in a separate tank, has a moderately acidic composition made up of a combination of zinc chloride and ammonium chloride, and is slightly alkaline [13,14]. The top flux, a distinct type of flux, performs the same function in the galvanizing kettle by floating on top of the liquid zinc [15].
After degreasing, pickling, and pickling again, the steel’s surface is almost white metal, spotless, and devoid of any oxides or other impurities that may interfere with the reaction of molten iron and zinc in the galvanizing kettle [16,17]. After being completely cleaned, the steel is ready to be put in the zinc bath [18].
After being cleaned with alkaline, the surface activity of hot dip galvanized steel was measured in [2] by exposing the cleaned samples to wet supercritical carbon dioxide, followed by the extraction and measurement of the resulting corrosion products. Several free alkalinities in the cleaning bath were explored to find out more about how the surface activity of zinc changed at different levels of surface attack. Corroded galvanized steel exhibits restricted and localized surface reactivity, with intermetallic particles and grain boundaries making a substantial contribution.
Uncleaned samples only produced zinc corrosion products in and around these locations. Measuring zinc reactivity might be difficult when one is developing an industrial cleaning sequence for galvanized steel. By carefully exposing clean samples to wet supercritical carbon dioxide, and then measuring the quantity of oxidized zinc, clean samples may be quickly tested for their reactivity to zinc.
An overview of several innovations and tried-and-true best practices in flow chemistry and flow process management is given in [3].
Due to their numerous uses, more than 45 million tons of galvanized steel sheets were sold globally in 2018. For surfaces rich in zinc, many industrially used adhesives, chemical conversions, and passivation layers have been developed. Hot dip galvanized coatings are often used in the construction of vehicle bodywork because, following the phosphating process, they offer excellent corrosion protection, and the vehicles can then be painted [19].
Adhesion can rise at low Zn coverage levels, but it significantly reduces at high Zn coverage levels, according to [20], which investigated the effect of Zn on interface stability and adhesion.
The topics in [21,22] and [23,24] dealt with the chemical make-up and toxicity of hydro-chloric acid pickling sludge generated by the hot dip galvanized steel industry. The authors of [25,26] investigated how well hot dip galvanized steel coated with modified hexagonal boron nitride nanosheets doped with acrylic acid resisted corrosion.
In two additional studies on this topic by the authors of [25,26,27] and [28,29,30], Al2O3/SiO2 nanocomposite coatings on hot dip galvanized steel deposited by chemical immersion and sol-gel coating were examined for their oxidation resistance and the effect of aluminum concentration on the formation of an inhibition layer during hot dip galvanizing.
For this research, the authors of [31] examined the impact of galvanizing on the turning-machined surface quality of S235JR steel. The investigation discovered that the surface roughness of the machined components was dramatically enhanced by galvanizing. According to the authors, the development of a substantial zinc layer on the component’s surface was what caused the rise in roughness.
In research published in [32], the authors looked at how galvanizing affected the precision with which S235JR steel components were turned. The investigation discovered that the dimensional correctness of the machined components was significantly impacted by galvanizing. According to the authors, this impact was brought on by the components developing a thick zinc coating, which changed the machining conditions and caused dimensional inaccuracies.
The effect of galvanizing on the surface roughness and part accuracy of S235J0 steel components machined by turning was examined in different research in [33]. According to the study, galvanizing drastically decreased the part accuracy of the machined components and increased their surface roughness. According to the authors, this impact arose from a thick zinc coating that built up on the surface of the components, changing the machining conditions and leading to surface flaws and dimensional errors.
In conclusion, the turning of S235J0 alloy can considerably affect the surface quality and component accuracy via the galvanizing process. Surface flaws, increased surface roughness, and dimensional mistakes come from the creation of a thick zinc coating during galvanizing, which affects the machining conditions. The impact of galvanizing on the surface quality and part accuracy of machined components must, thus, be considered during the design and production processes.
The fundamental objective of the work involves determining the economic roughness of the galvanized surface. The following specific objectives are defined to achieve the desired goal:
  • Study the influence of surface roughness processed by turning on the quality of the surface obtained by galvanizing.
  • Study the influence of galvanizing technology on the dimensional accuracy of the landmarks.
  • Track the thickness and quality of the zinc layer through the prism of its resistance to corrosion depending on the galvanizing technology.
The need for research emerges from the perspective of increasing productivity and decreasing the amount of energy used during surface chipping in the context of preparing these surfaces for galvanizing.
The novel and original contributions of this scientific work are constituted by the following elements:
  • We provide a new way to approach the research by analyzing the galvanizing technologies available on the market in the context of their use in the industry.
  • The experimental data are interpreted using many criteria from the point of view of the size of the part after galvanizing, the quality of the surface, and the corrosion resistance of each studied surface.
  • We consider the possibility to anticipate the roughness obtained after galvanizing.

2. Research Methodology

A batch of 9 parts was made by turning using 9 bars of diameter 25 mm made from the material S235J0.
S235J0 was chosen for this study because of its widespread use in many industries, outstanding mechanical qualities, and relatively inexpensive cost. Galvanizing has an impact on surface quality and precision turned parts. To achieve an optimum performance and longevity, it is crucial to comprehend how the galvanizing process influences the accuracy and surface quality of items created from this material. S235J0 is an appropriate candidate for this study, since it is a typical carbon steel that can be easily machined using conventional machining methods.
After turning, we marked 5 sections on each part with a length of 25 mm and a diameter of 22 mm. The cutting parameters were defined based on a full factorial experiment and assume feed variation.
Since it enables a systematic and thorough investigation of each factor’s impact on the response variable, in the case of surface roughness, a full factorial design with combinations of cutting parameters was used for the study. It is feasible to determine the most important variables and how they interact by trying every combination of cutting parameters. In comparison to other experimental designs, the adoption of a full factorial design also offers a higher level of statistical power and precision. A full factorial design can help to clarify the impacts of the cutting parameters of speed and feed rate, which are commonly acknowledged as the most significant elements determining surface roughness in machining.
The variation in this parameter define the roughness of the machined surface (Table 1).
Figure 1 shows a part processed by turning.
The samples were processed using the CNC lathe, HAAS TL-2, with the cutting tool being a lathe knife with the following characteristics:
  • Lathe body: PVJBR2020K11 (Walter) (ISO 2936-2).
  • Cutting insert: VBMT110308-FP6, WPP20S (Walter Tiger tec).
The HAAS TL-2 CNC lathe is a well-known and commonly used machine tool in the machining industry. It is appropriate for this investigation because of its high level of precision and accuracy. For machining cylindrical components, the use of a lathe knife as the cutting tool is frequently used since it offers an excellent surface quality and dimensional precision. Additionally, utilizing a lathe knife makes it simpler to regulate and alter the cutting parameters, which is crucial for this study because it aims to examine how the cutting parameters affect the precision and quality of the machined components’ surfaces.
The cutting insert utilized in the investigation was VBMT110308-FP6, WPP20S. This insert is a carbide cutting tool that is frequently used in turning activities.
The cutting insert VBMT110308-FP6, WPP20S is a triangular-shaped insert used for turning operations. The geometry of the insert is as follows:
VBMT: ISO code for triangular insert
  • Length of the insert: 11 mm;
  • Width of the insert: 3 mm;
  • Thickness of the insert: 8 mm;
  • Chip breaker code: FP6;
  • Coating type: WPP20S.
The angles of the insert are as follows:
  • Rake angle (γ): 0°;
  • Clearance angle (α): 7°;
  • Cutting angle (β): 80°.
The coating type, WPP20S, is a multilayer coating that provides high wear resistance and heat resistance. The chip breaker code, FP6, is a standard chip breaker for finishing and medium-level machining operations.
The reason for choosing this cutting insert is that it is commonly used in industrial applications for finishing and medium-level machining operations on steel materials. Its geometry and angles make it suitable for producing a good surface finish and minimizing tool wear, which are important in the study of the influence of galvanizing on the surface quality and part precision machined by turning. Additionally, the multilayer coating provides high wear resistance, which is necessary when machining materials such as steel that can cause tool wear.
Of the 9 samples processed by turning, they will be used for the study of galvanizing technologies as follows:
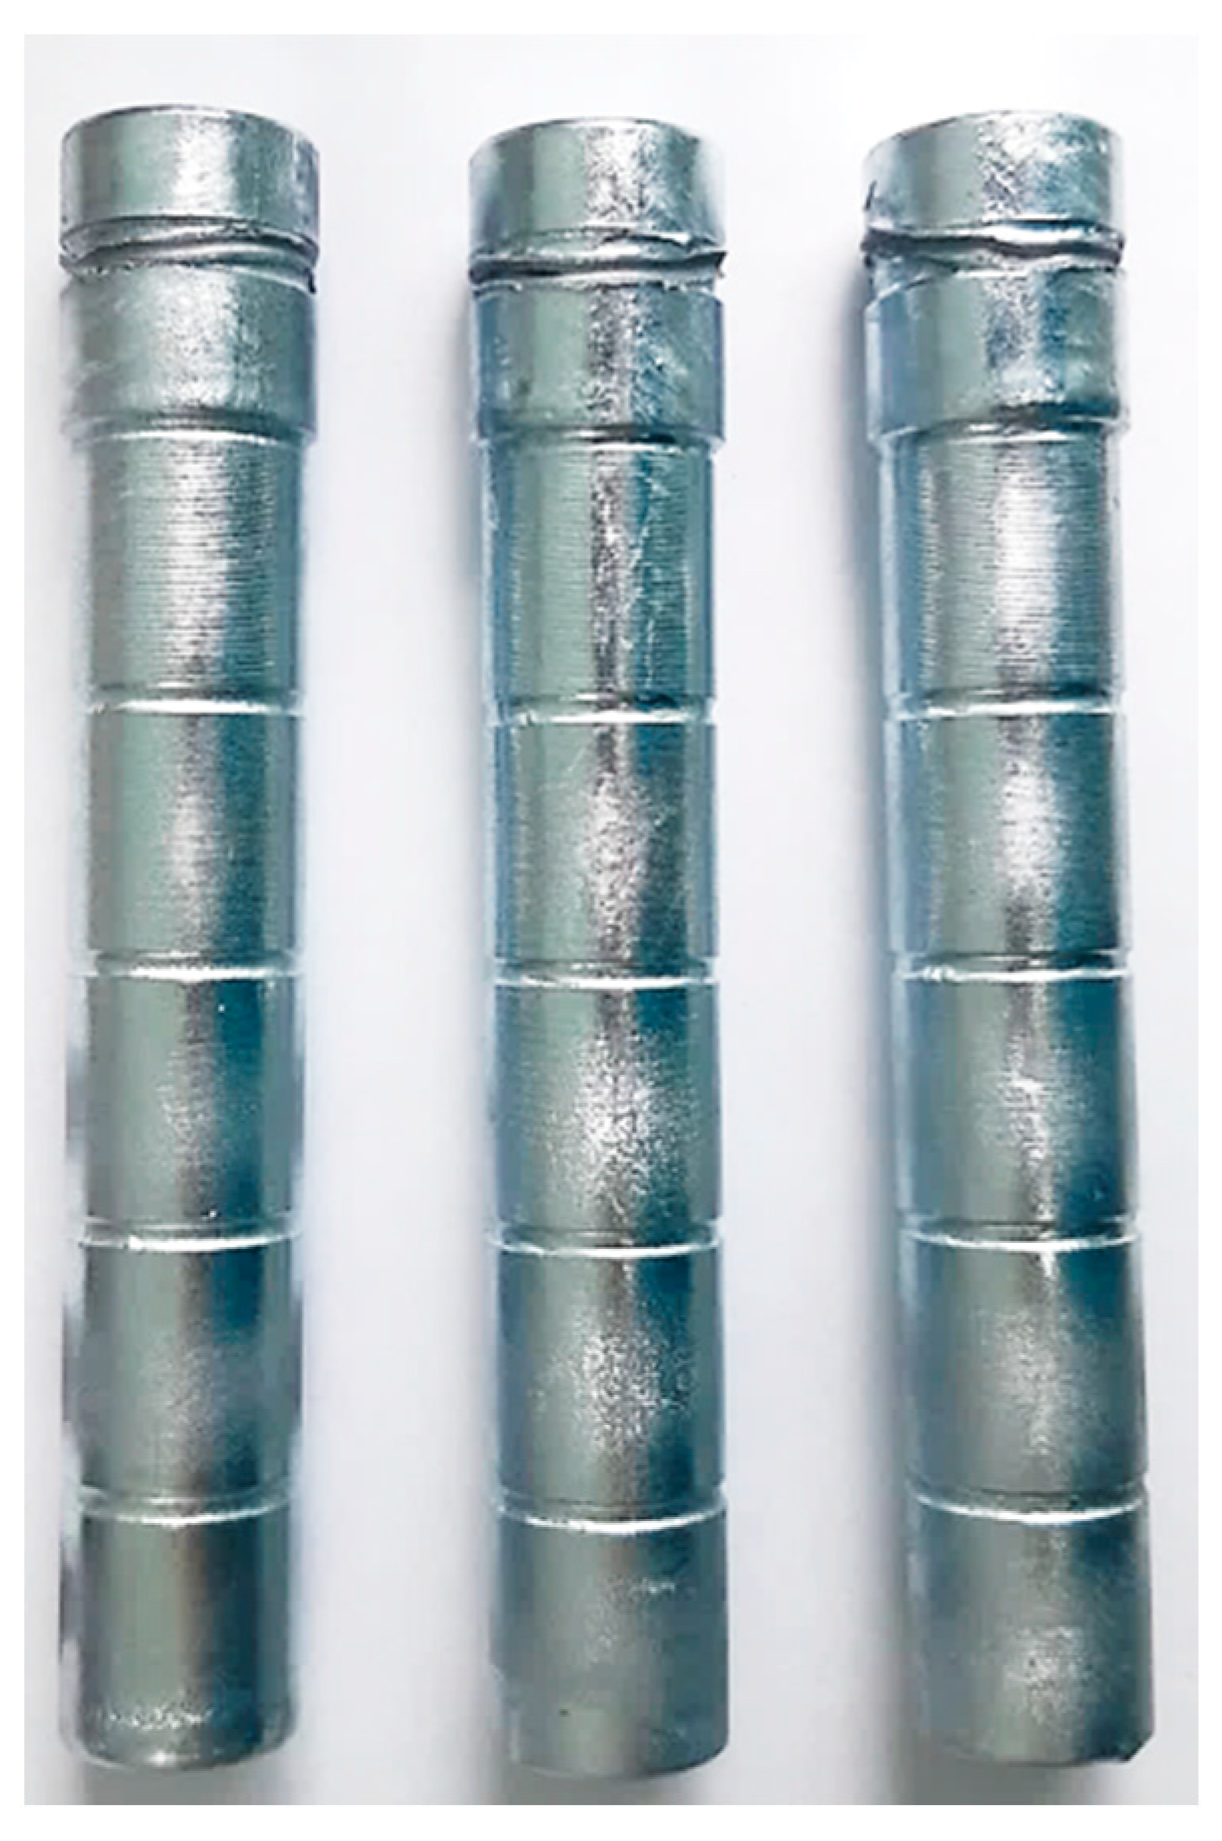
  • Three test pieces—for hot dip galvanizing and centrifugation (Figure 2);
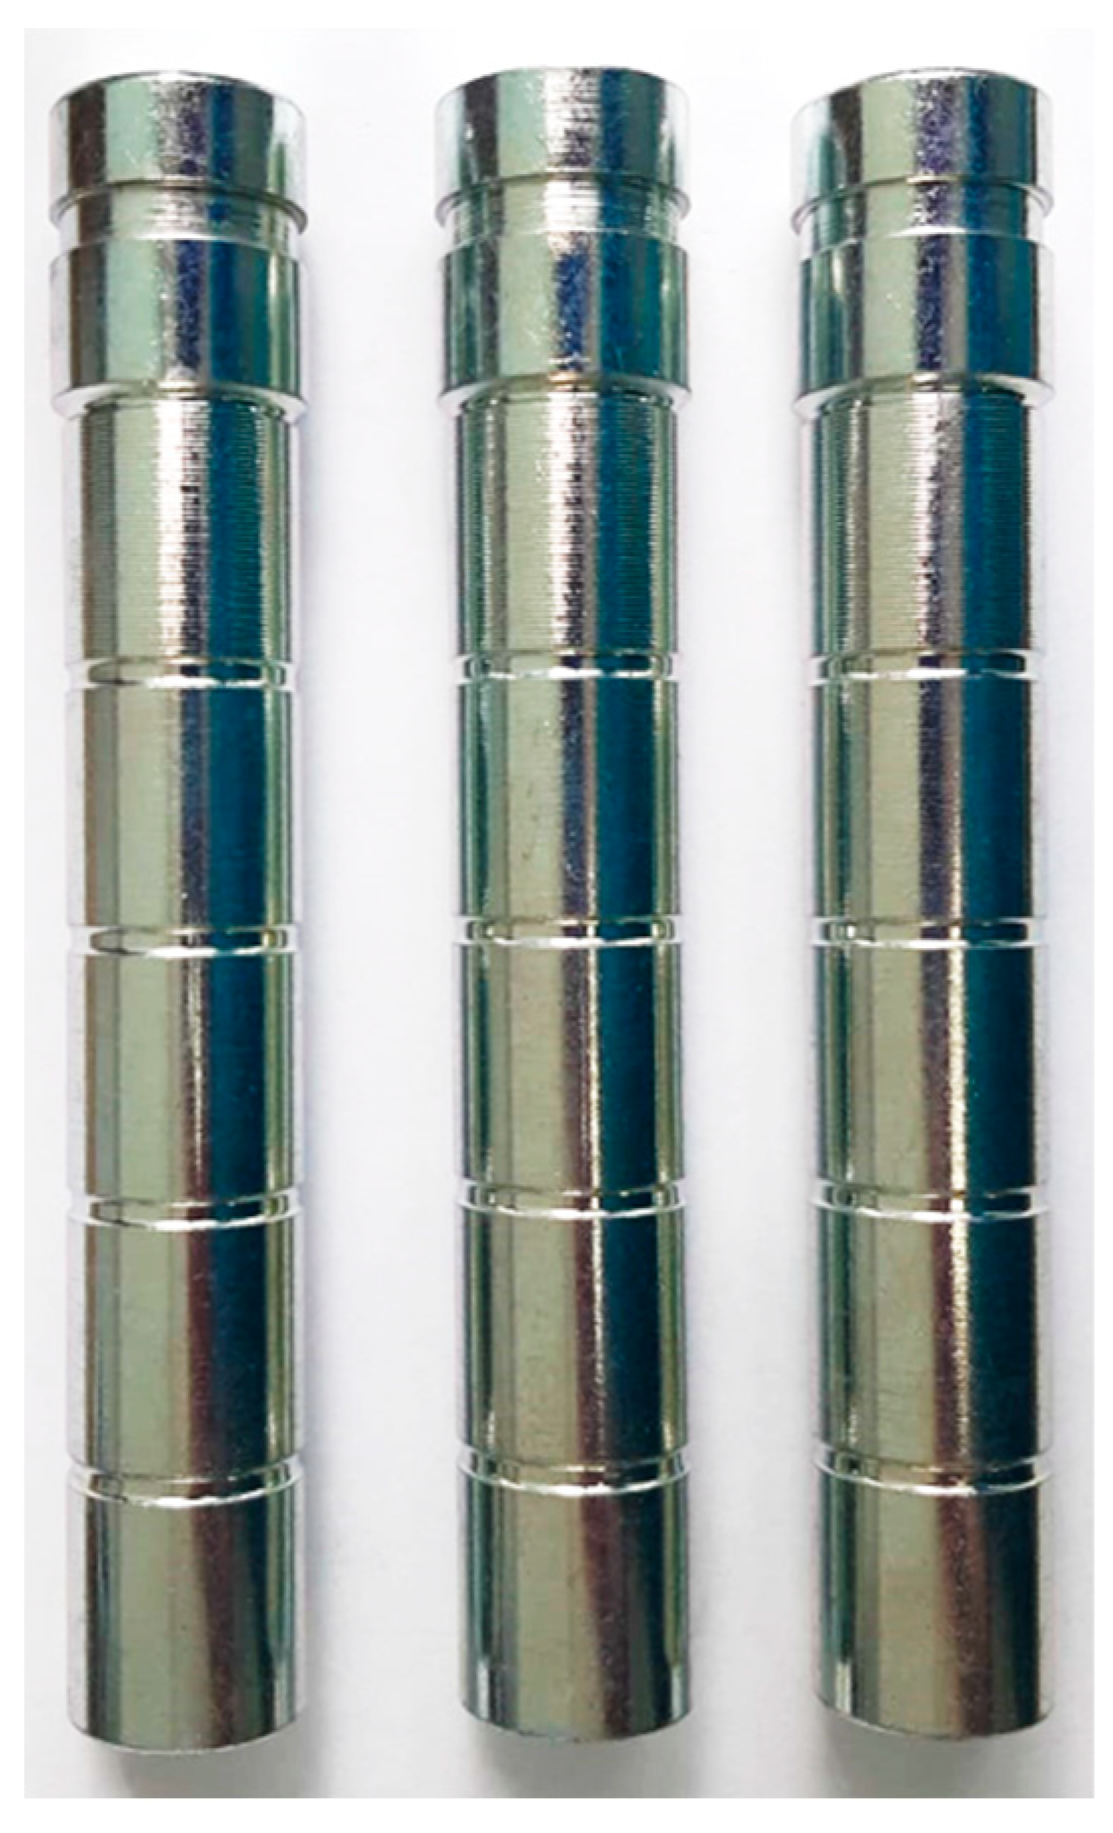
  • Three test pieces—hot dip galvanizing only with immersion (Figure 3);
  • Three test pieces—for galvanic galvanizing (Figure 4).
In Table 2, the working method is presented schematically.
According to Montgomery’s 3 principles, the procedure for repeating experiments to determine the constancy of measurements, involves repeating the experiment 3 ÷ 7 times for each set of values of the input parameters. In the present research, considering that 3 galvanizing technologies are addressed, each experiment was repeated 3 times.
The characteristics of the baths in which thermal galvanizing was carried out are:
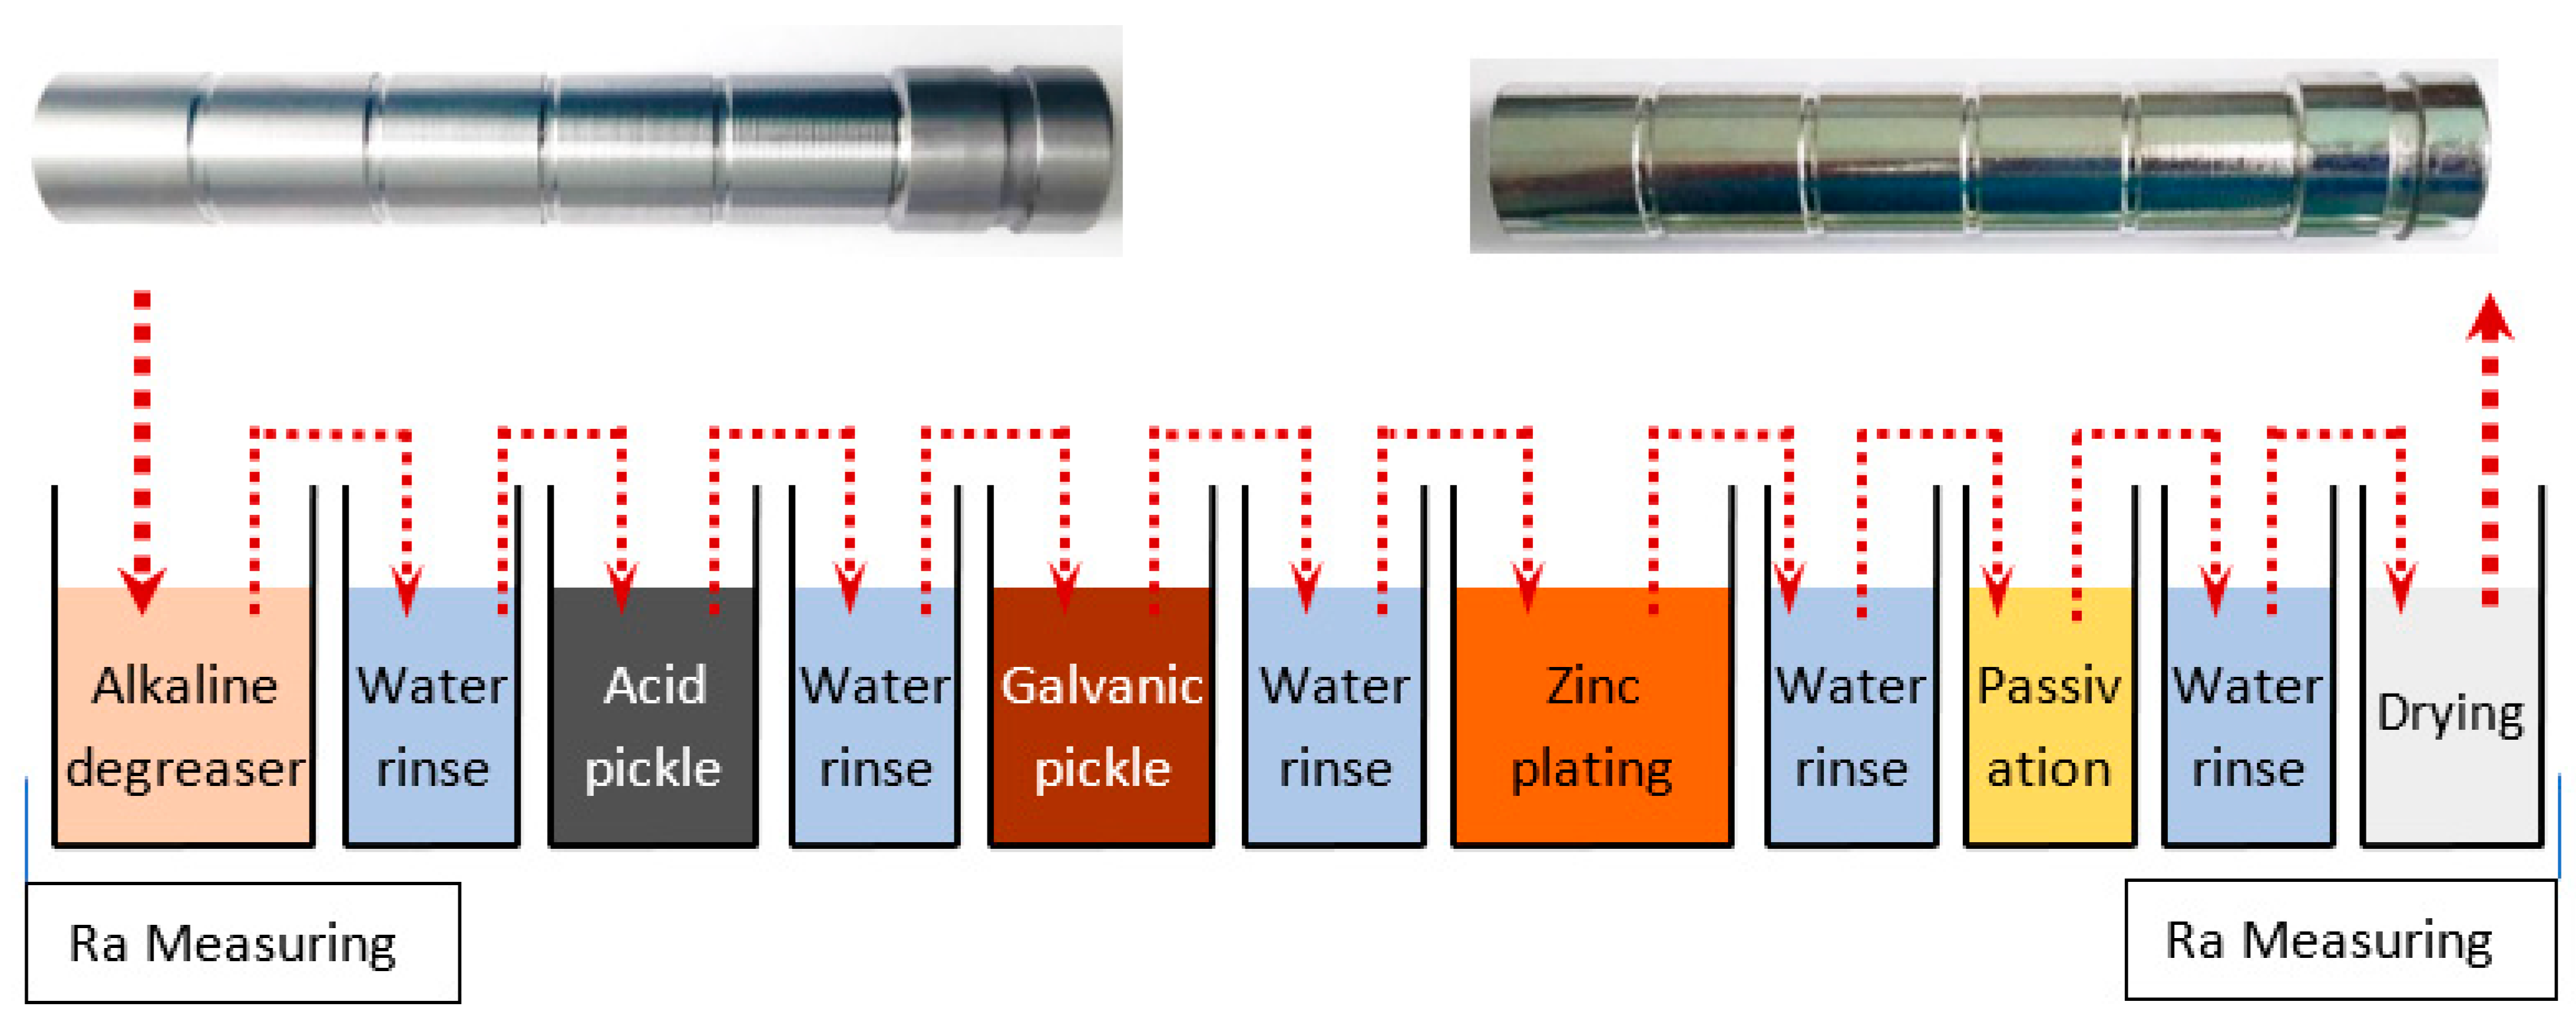
  • Degreasing and washing in an alkaline solution. The solution used was Ferro clean 7135/1.
    Features of the washroom:
    Temperature: 50 °C;
    PH: 6.1;
    Bubbling with compressed air.
    Holding time: 15 min.
  • Water rinse.
    Holding time: 10 min; compressed air bubbling.
  • Pickling. It was carried out in a hydrochloric acid bath.
    Pickling bath characteristics:
    Temperature: 25 °C;
    Bath concentration: 29%.
    Holding time: 20 min.
  • Water rinse.
    Holding time: 10 min; compressed air bubbling.
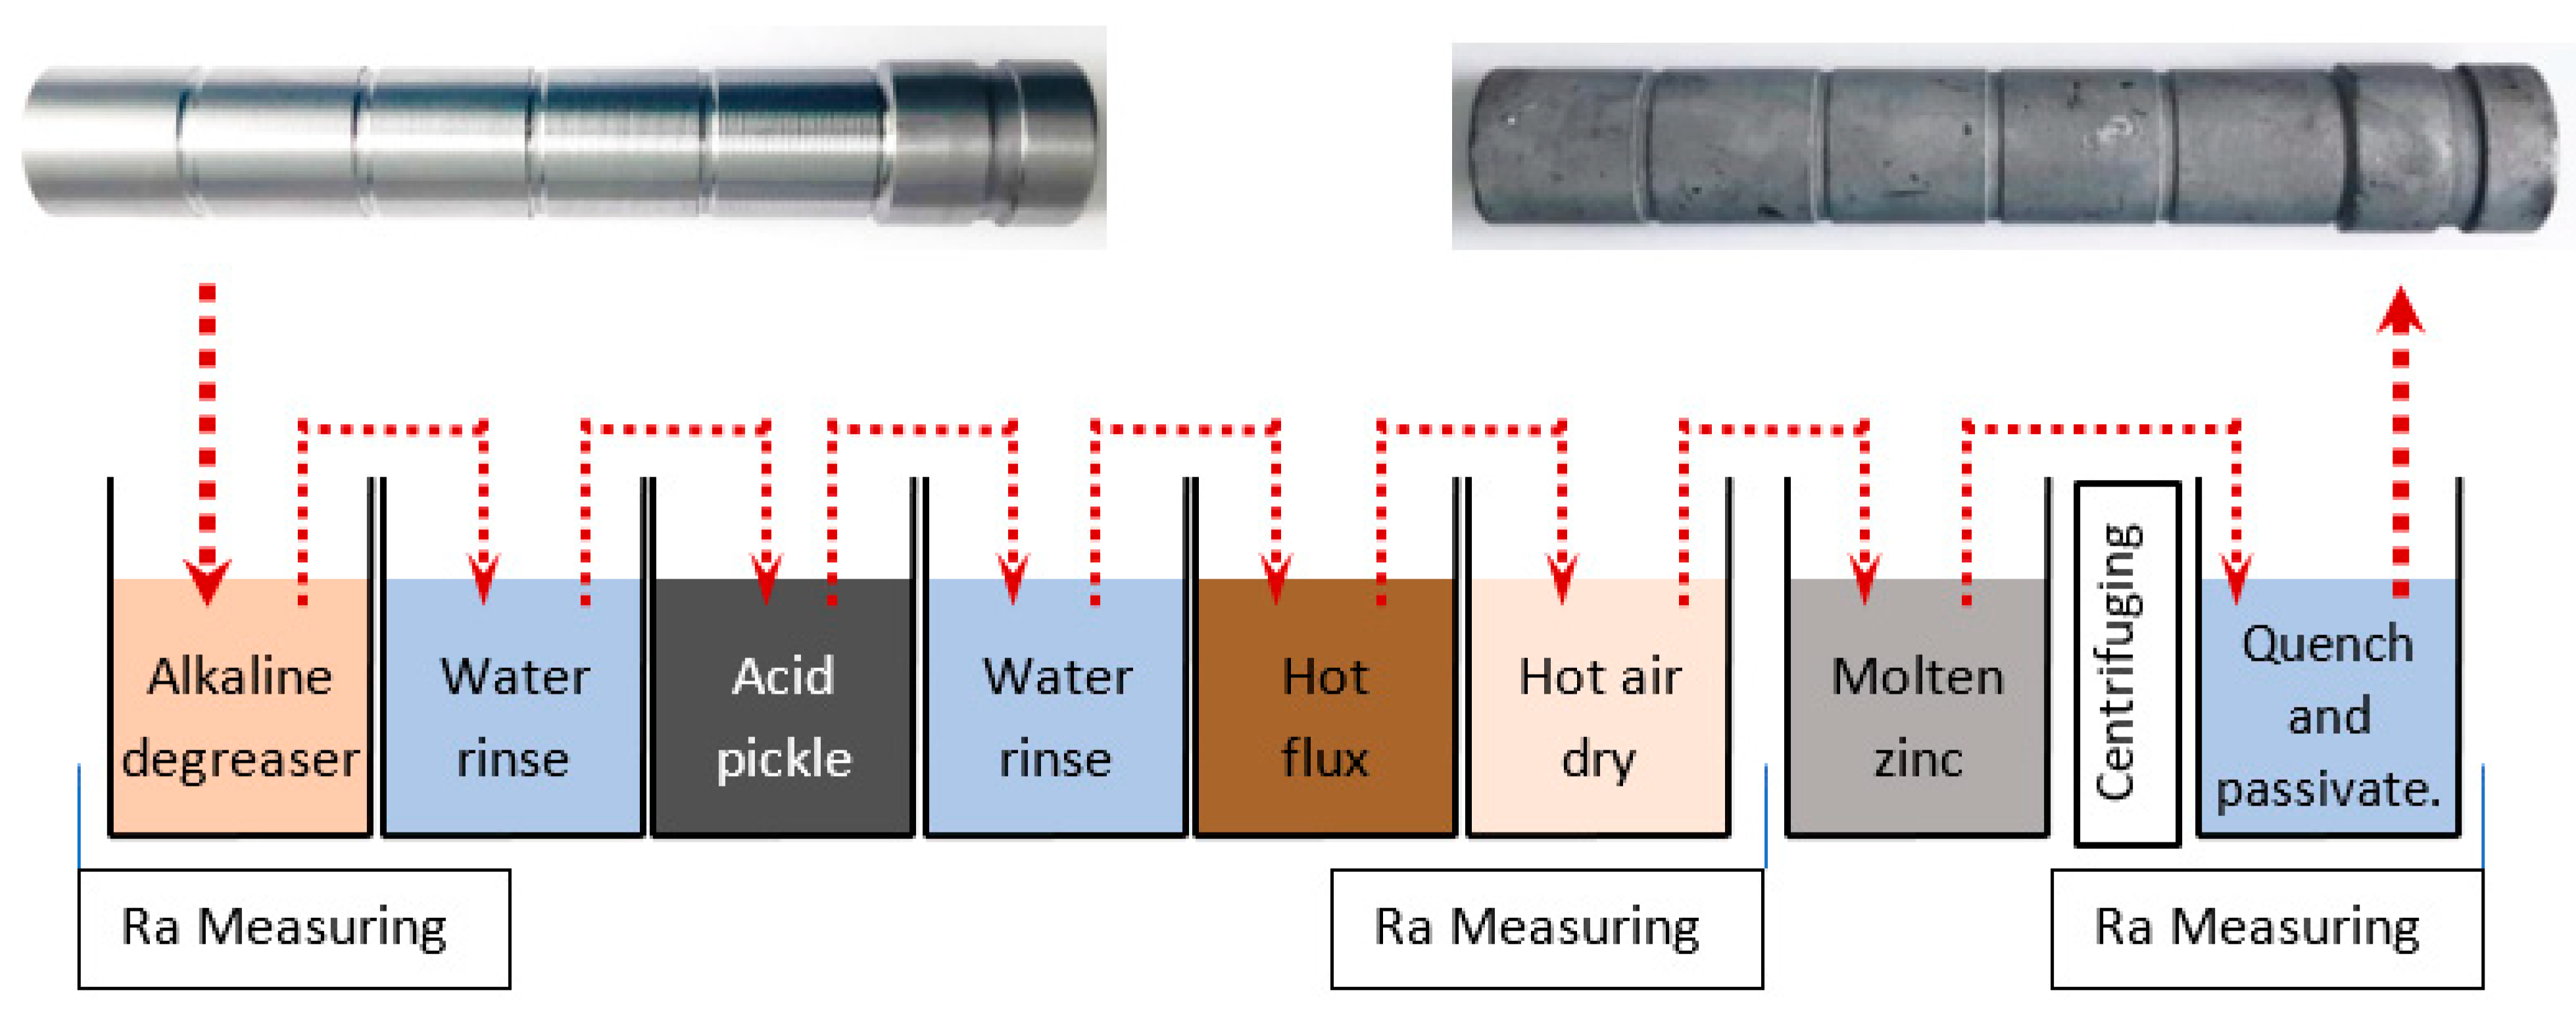
  • Fluxing (preparation of the galvanizing surface and anti-corrosion protection during the drying of the part) was carried out in the basin by immersion. The solution used is based on zinc chloride (Zinc chloride (ZnCl2)).
    Bathroom features:
    Temperature: 45 °C;
    PH: 4.0;
    No bubbling.
    Holding time: 5 min.
  • Drying was carried out in a closed heated enclosure with indoor air recirculation.
    Characteristics of the dryer:
    Temperature: 80 °C;
    Air recirculation.
    Holding time: 40 min.
  • Immersion in molten zinc.
  • Galvanized pool temperature: 550 °C for hot dip galvanized parts only.
    Temperature of the galvanizing pool: 600 °C for hot dip galvanized parts with centrifugation;
    Holding time: 5 min.
  • Centrifugation was used for hot dip galvanized samples with immersion and centrifugation.
  • Passivation and oxidation were achieved in a water bath by immersion. Holding time: about 1–2 min.
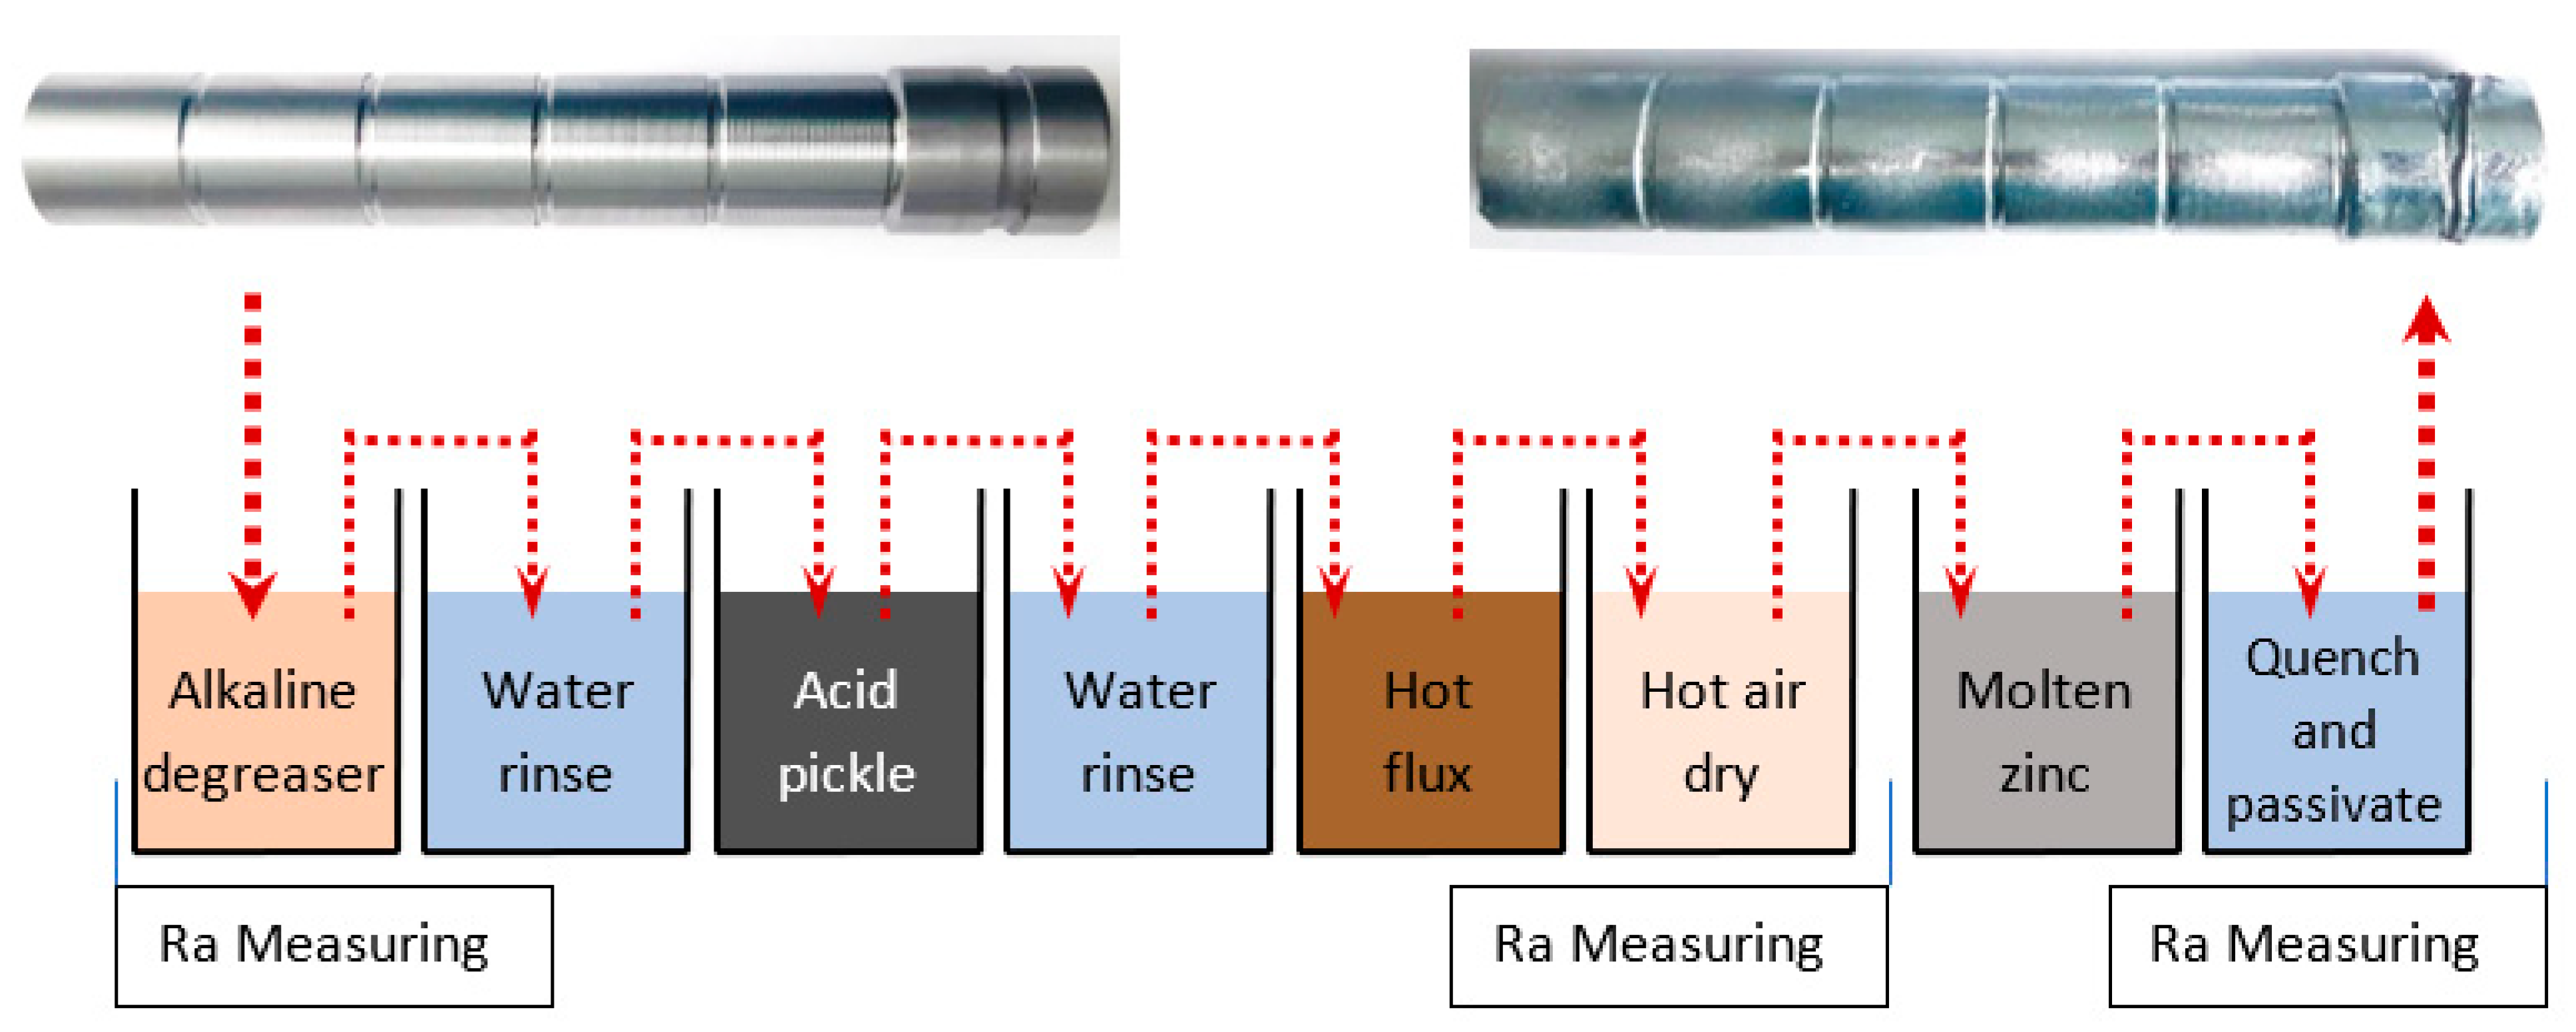
The technological flows specific to each galvanizing technology are summarized in Figure 5, Figure 6 and Figure 7.
The characteristics of the baths in which the electrolytic treatment was carried out are presented below:
  • Degreasing and washing in an alkaline solution. The solution used was made from AK16 + RV111 compounds.
    Temperature: 60 °C;
    Bubbling with compressed air;
    Holding time: 10 min.
  • Washing in the basin with water and bubbling with compressed air.
    Temperature: 20 °C;
    Holding time: 0.5 min.
  • Pickling was carried out in a hydrochloric acid (HCl) + BEF30 bath.
    Temperature: 25 °C;
    Holding time: 5 min.
  • Electrolytic and anodic degreasing were used (anodic cleaning). The solution used was made of E1-DEG.
    Temperature: 25 °C;
    Holding time: 4 min.
  • Zinc plating was carried out in an alkaline solution made with Slotonit OT.
    Maintenance time: 30 min;
    Temperature: 20–25 °C;
    pH: 5–5.5;
    Current intensity: 1.5–2 A;
    Current voltage: 100 V.
  • Passivation was carried out in a solution made with Slatopas Z20Blue and nitric acid.
    Holding time: 1 min;
    Temperature: 20–25 °C;
    pH: 1.7–2.
  • The drying chamber had a controlled environment.
    The temperature has circulated: 50 °C;
    Maintenance time: 10 min.

3. Performing Measurements

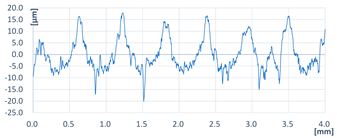
Longitudinal roughness measurements were taken using Mitutoyo SURFTEST SJ-210 after the key stages of the technology of obtaining a galvanized part. Thus, the roughness was measured after each of the following operations: turning, pickling, and galvanizing.
The decision to take roughness measurements longitudinally instead of transversely on the samples was based on several factors. Firstly, the longitudinal direction of the sample is typically the direction in which it is subjected to the greatest stresses during use.
Additionally, it is more practical to make roughness measurements longitudinally on these samples because this direction aligns with the direction of the cutting tool used in the turning process. This ensures that the measurements are more accurate and consistent. In contrast, measuring the roughness in the transverse direction would require repositioning the sample, which could introduce errors and variability into the measurements.
Overall, while it would be ideal to measure roughness in both longitudinal and transverse directions, the decision to focus on the longitudinal direction was made to ensure accurate and practical results that are relevant to the performance of the steel in the analyzed applications.
Given that the part utilized in the experiment has a cylindrical shape, it was only feasible to measure the roughness after cylinder generation using the selected surf tester. When it comes to turning, the roughness measured after cylinder generation is invariably greater than the one measured in the transverse direction after the generation of the cylinder.
Table 3 shows the technical data of the surface tester.
Display resolution: 0.001 µm. The resolution of the display, which is the smallest unit the device can measure and display, is specified by this option. To record even the smallest changes in the surface profile, a high resolution is preferred.
Measurement units: mm. The surface roughness data’s unit of measurement is determined by this parameter. As millimeters (mm) are a widely used unit of length measurement in industrial and technical applications, it is the reason why it was chosen.
Measurement standard: ISO 4287:1997. The international standard that is used to set the measurement parameters for surface roughness is specified by this parameter. By using a standardized measuring technique, one can guarantee that the findings will be the same for all gadgets and programs.
Sampling length: λc = 0.8 mm. The length of the profile that is utilized to calculate the surface roughness characteristics is determined by this parameter. The measurement material’s surface roughness characteristics are the reason what led to the choice of 0.8 mm.
Number of cut-offs: N = 5. The number of wavelength bands that are employed to remove the high-frequency components of the surface profile is specified by this parameter. To correctly collect surface roughness data while removing noise, five cut-offs are often employed.
Evaluation length: 4 mm. The length of the surface profile that is utilized to determine the surface roughness characteristics is specified by this parameter. The measurement of the material’s surface roughness influenced the decision to use a value of 4 mm.
Measuring speed: 0.5 mm/s. The device’s motion along the surface of the material being measured is specified by this parameter. The material’s surface roughness characteristics and the desired level of measurement accuracy influenced the decision to use a value of 0.5 mm/s. By reducing the effects of vibration and noise, a slower measuring speed can improve the accuracy of the surface roughness measurement.
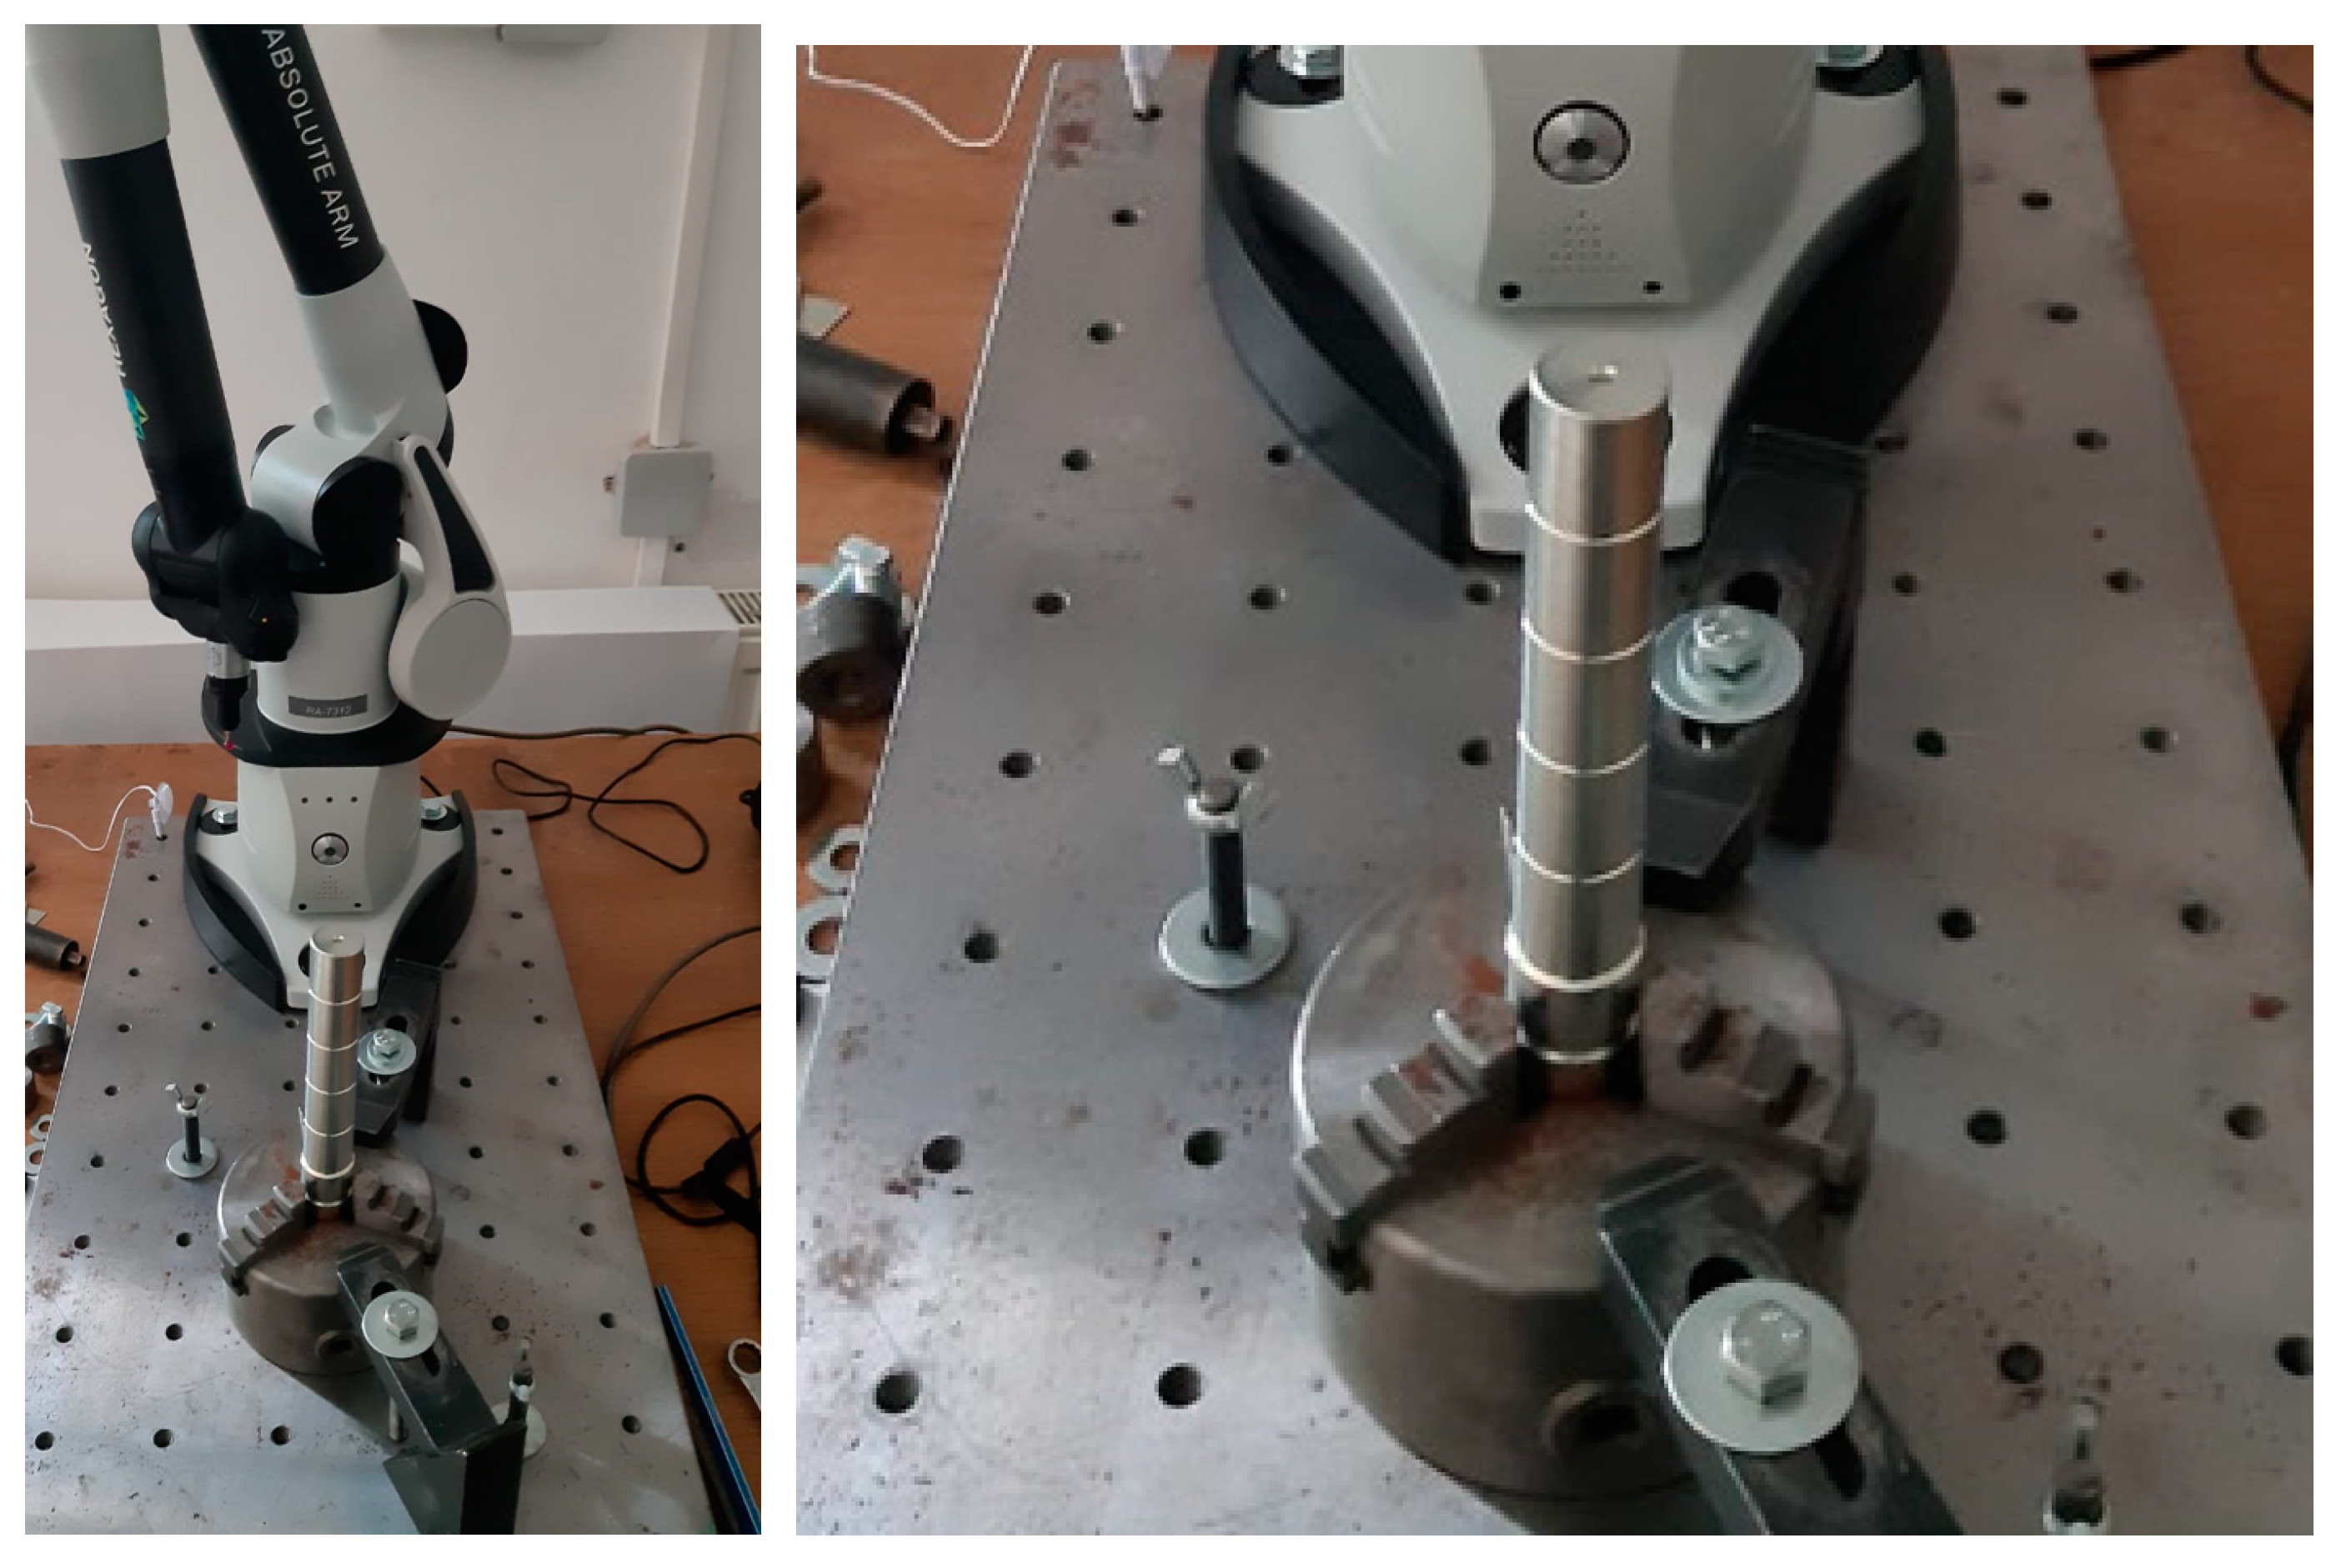
The determination of diameters and cylindricity was performed using the 3D Absolute Arm RA-7312 measuring arm. The measurement of each part section was made by direct palpation of the surface at 24 points. Based on the palpated points, we determined the diameter of the section and the deviation from its cylindricity. During the measurements, the measuring arm was equipped with a ruby probe with a diameter of 6 mm. Figure 8 shows the technological measuring assembly composed of a rigid table on which the MEASURING ARMS RA-7312 is fixed to the device used for fixing the measuring sample. The gage clamp in this case is a 3-pin universal one.
In Table 4, we present the specifications of the RA-7312 measuring arm.
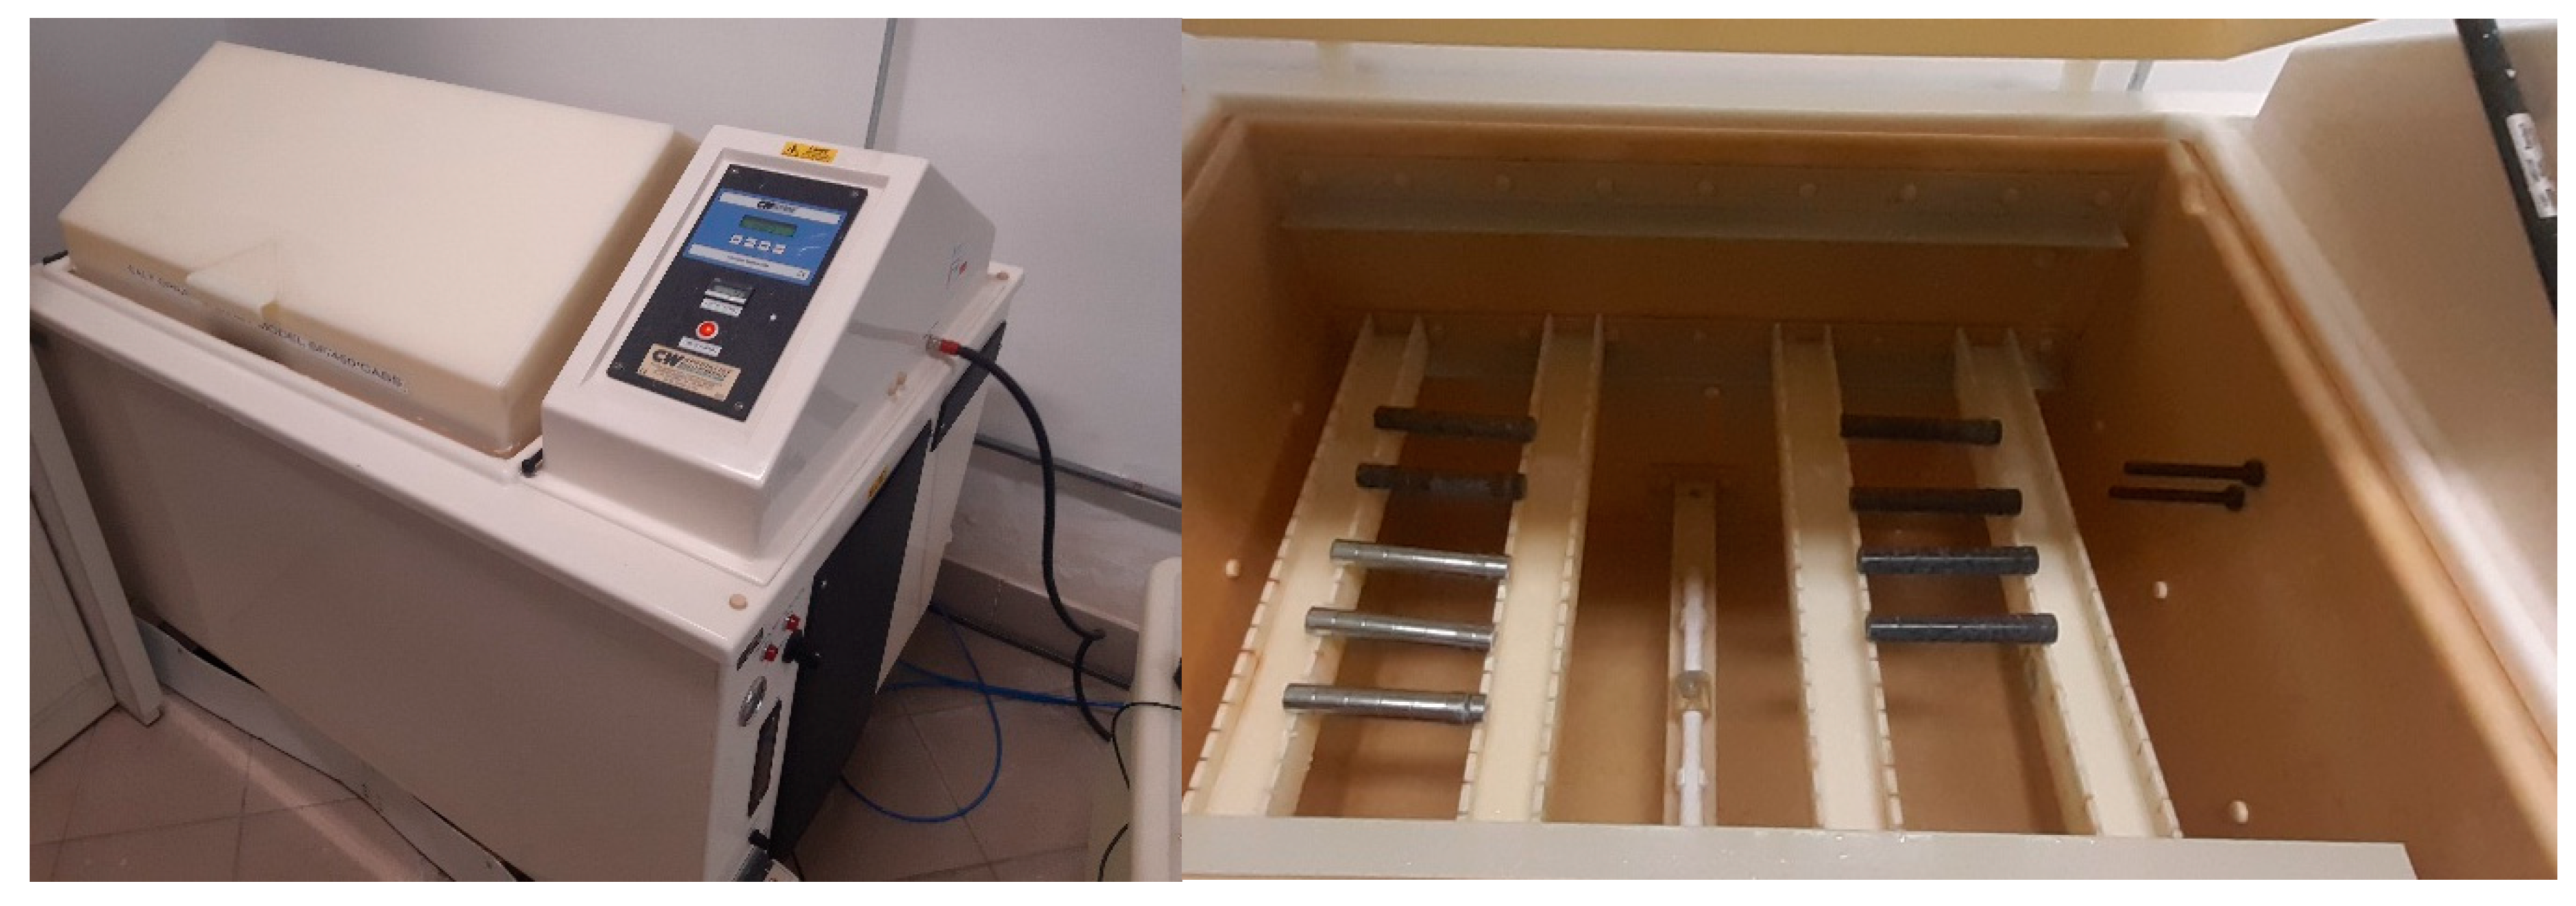
To check the corrosion resistance, the samples were subjected to the salt spray corrosion test. The test is standardized according to ISO 9227:2017 (corrosion tests in artificial atmospheres—salt spray tests). The equipment used was a salt spray cabinet SF/450/CASS manufactured by C&W Specialist Equipment located in Mississauga, Ontario, Canada (Figure 9).
Characteristics of the corrosive environment:
  • Temperature: 35 °C;
  • Concentration of saline solution: 50 gr/L;
  • Salt used: NaCl;
  • Flow of saline solution: 1.5 mL/h.

4. Processing and Interpretation of Experimental Data

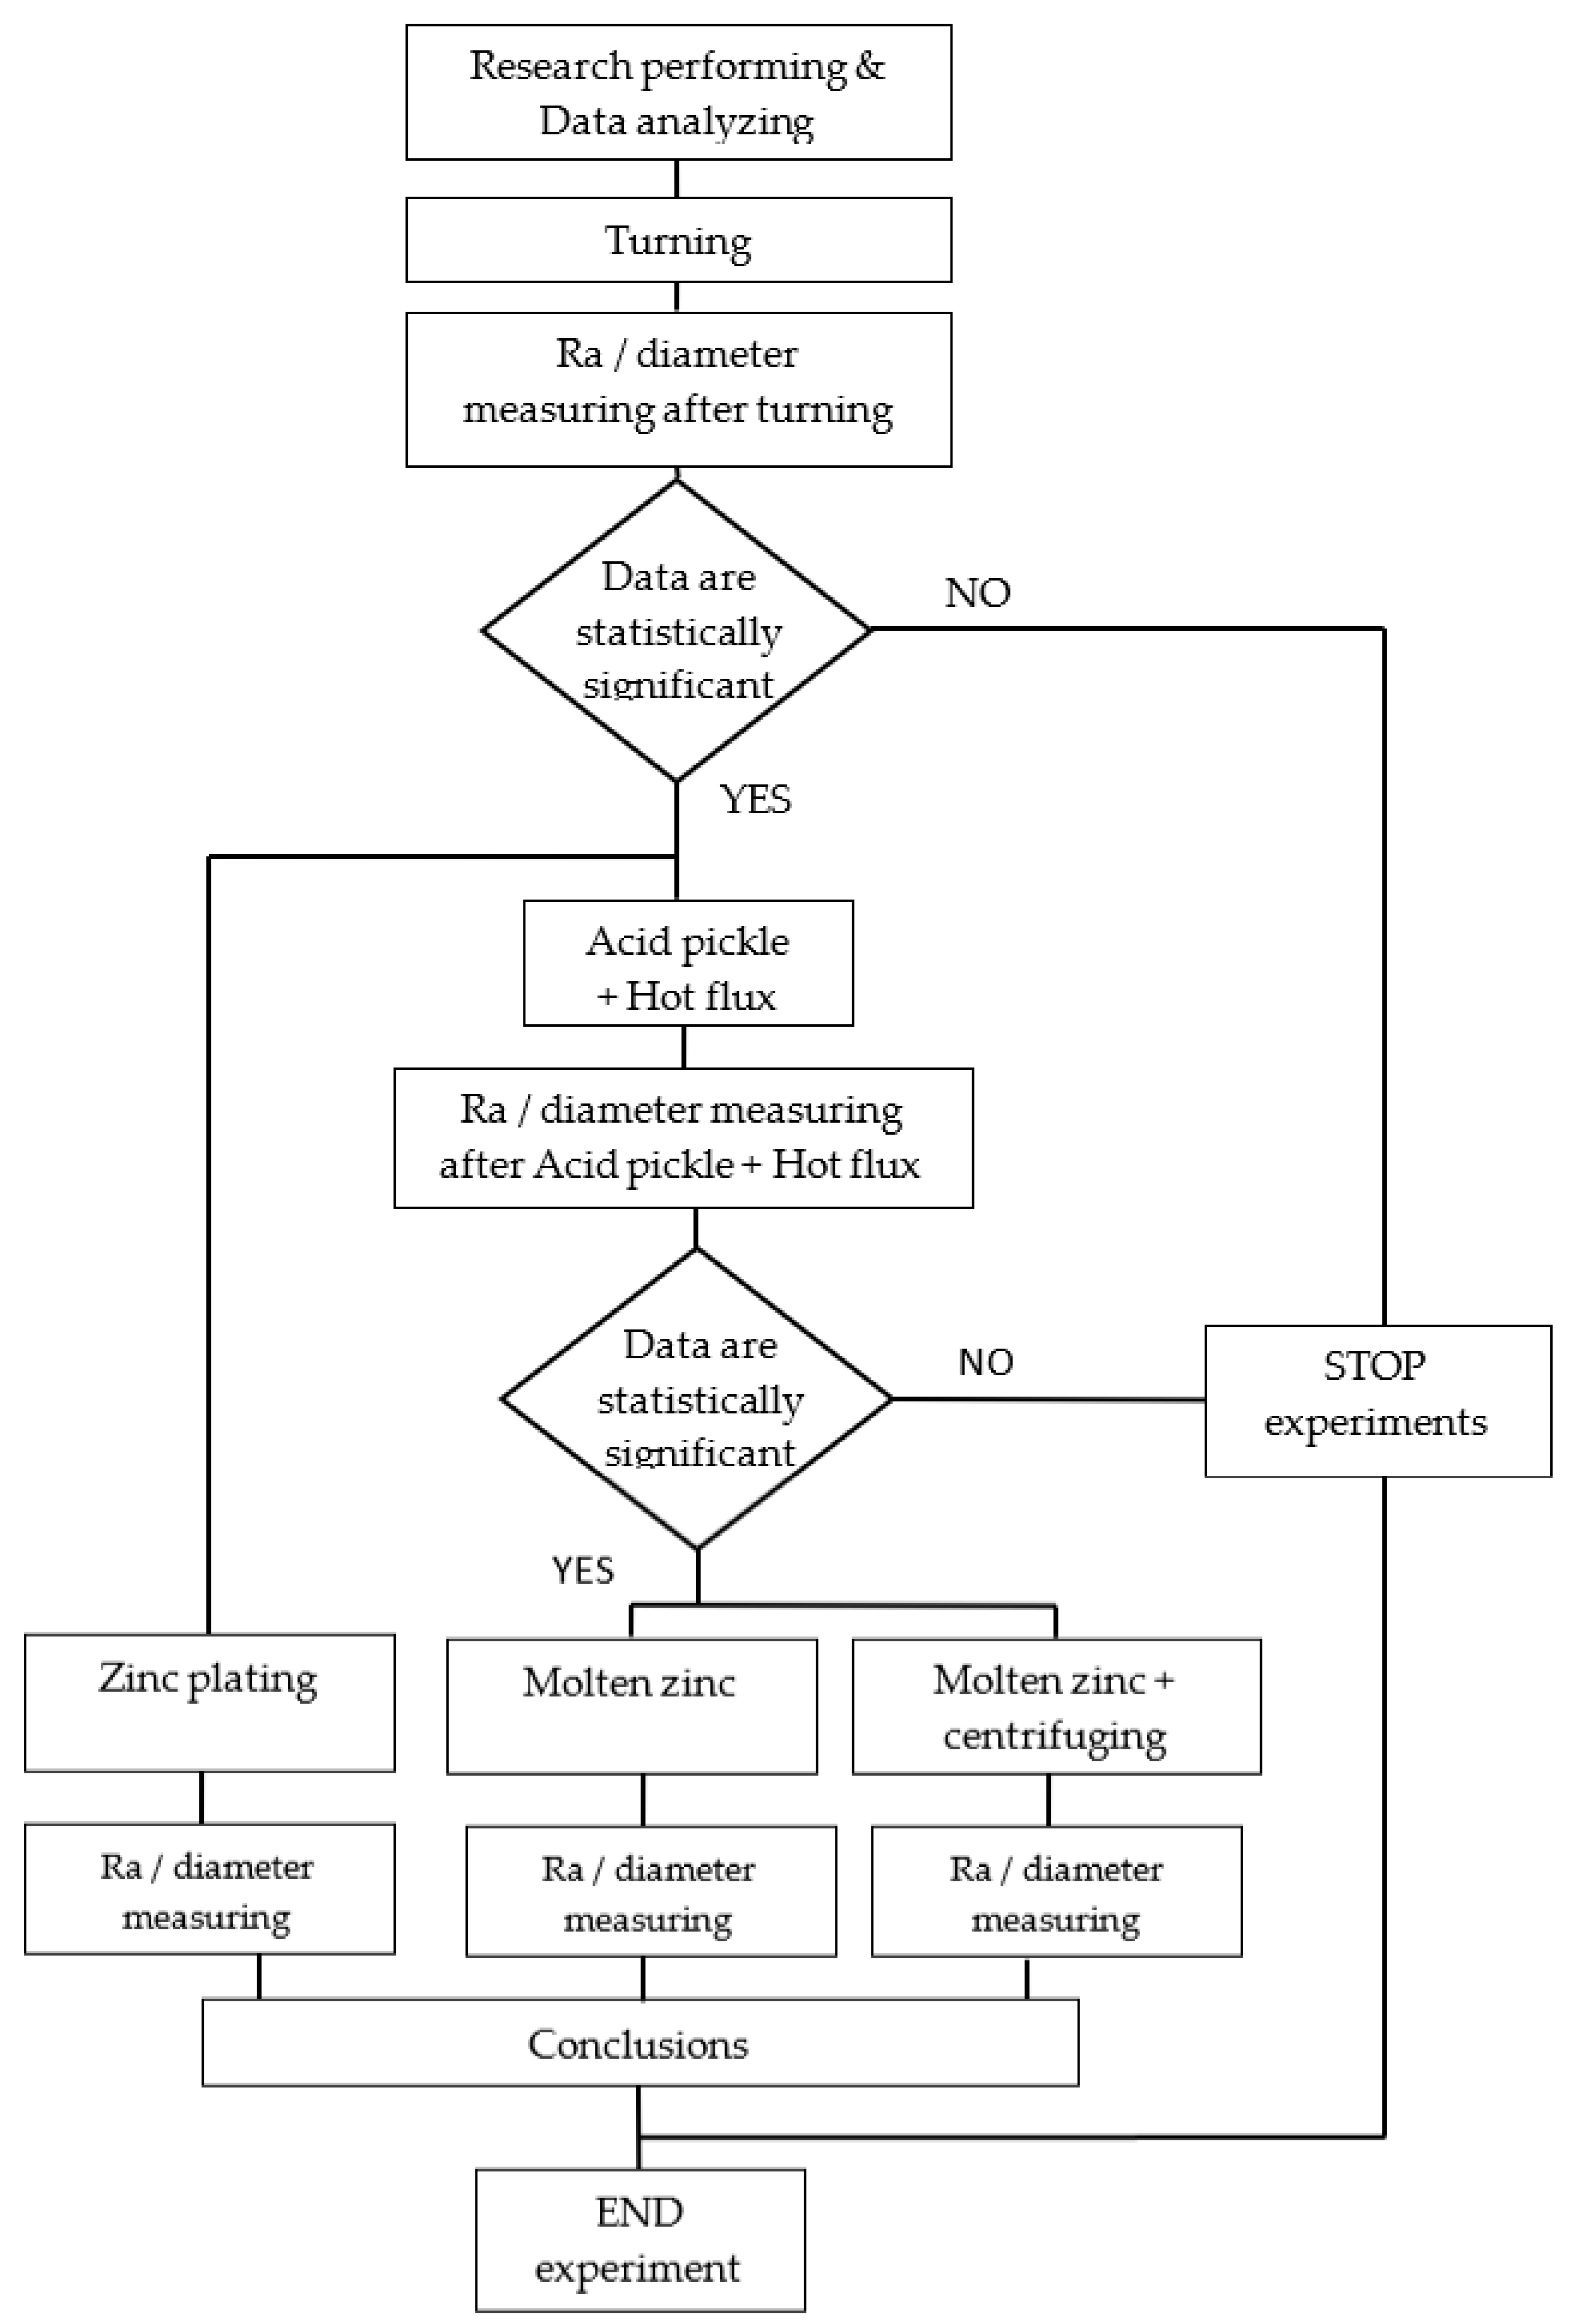
Nine samples were processed in the first phase by turning. Later, they were stripped and galvanized according to the galvanizing technologies presented previously (Figure 10).
Table 5 shows the Ra roughness measurements, as follows:
  • S1, S2, and S3—hot dip galvanized only;
  • S4, S5, and S6—hot dip galvanized with immersion and centrifugation;
  • S7, S8, and S9—galvanized.
The experimental data related to the surface roughness of the 9 samples, depending on the feed obtained after turning, are centralized in Table 5.
Standard uncertainties were combined using the root-sum-square (RSS) method to obtain an estimate of the overall measurement uncertainty: u Ra = Σ u Ra 2 = 1.584   µ m .
Therefore, the results are expressed as Ra values with an associated uncertainty: Ra = 2.5 ± 1.6 µm (where 2.5 is the mean Ra value and 1.6 is the estimated measurement uncertainty).
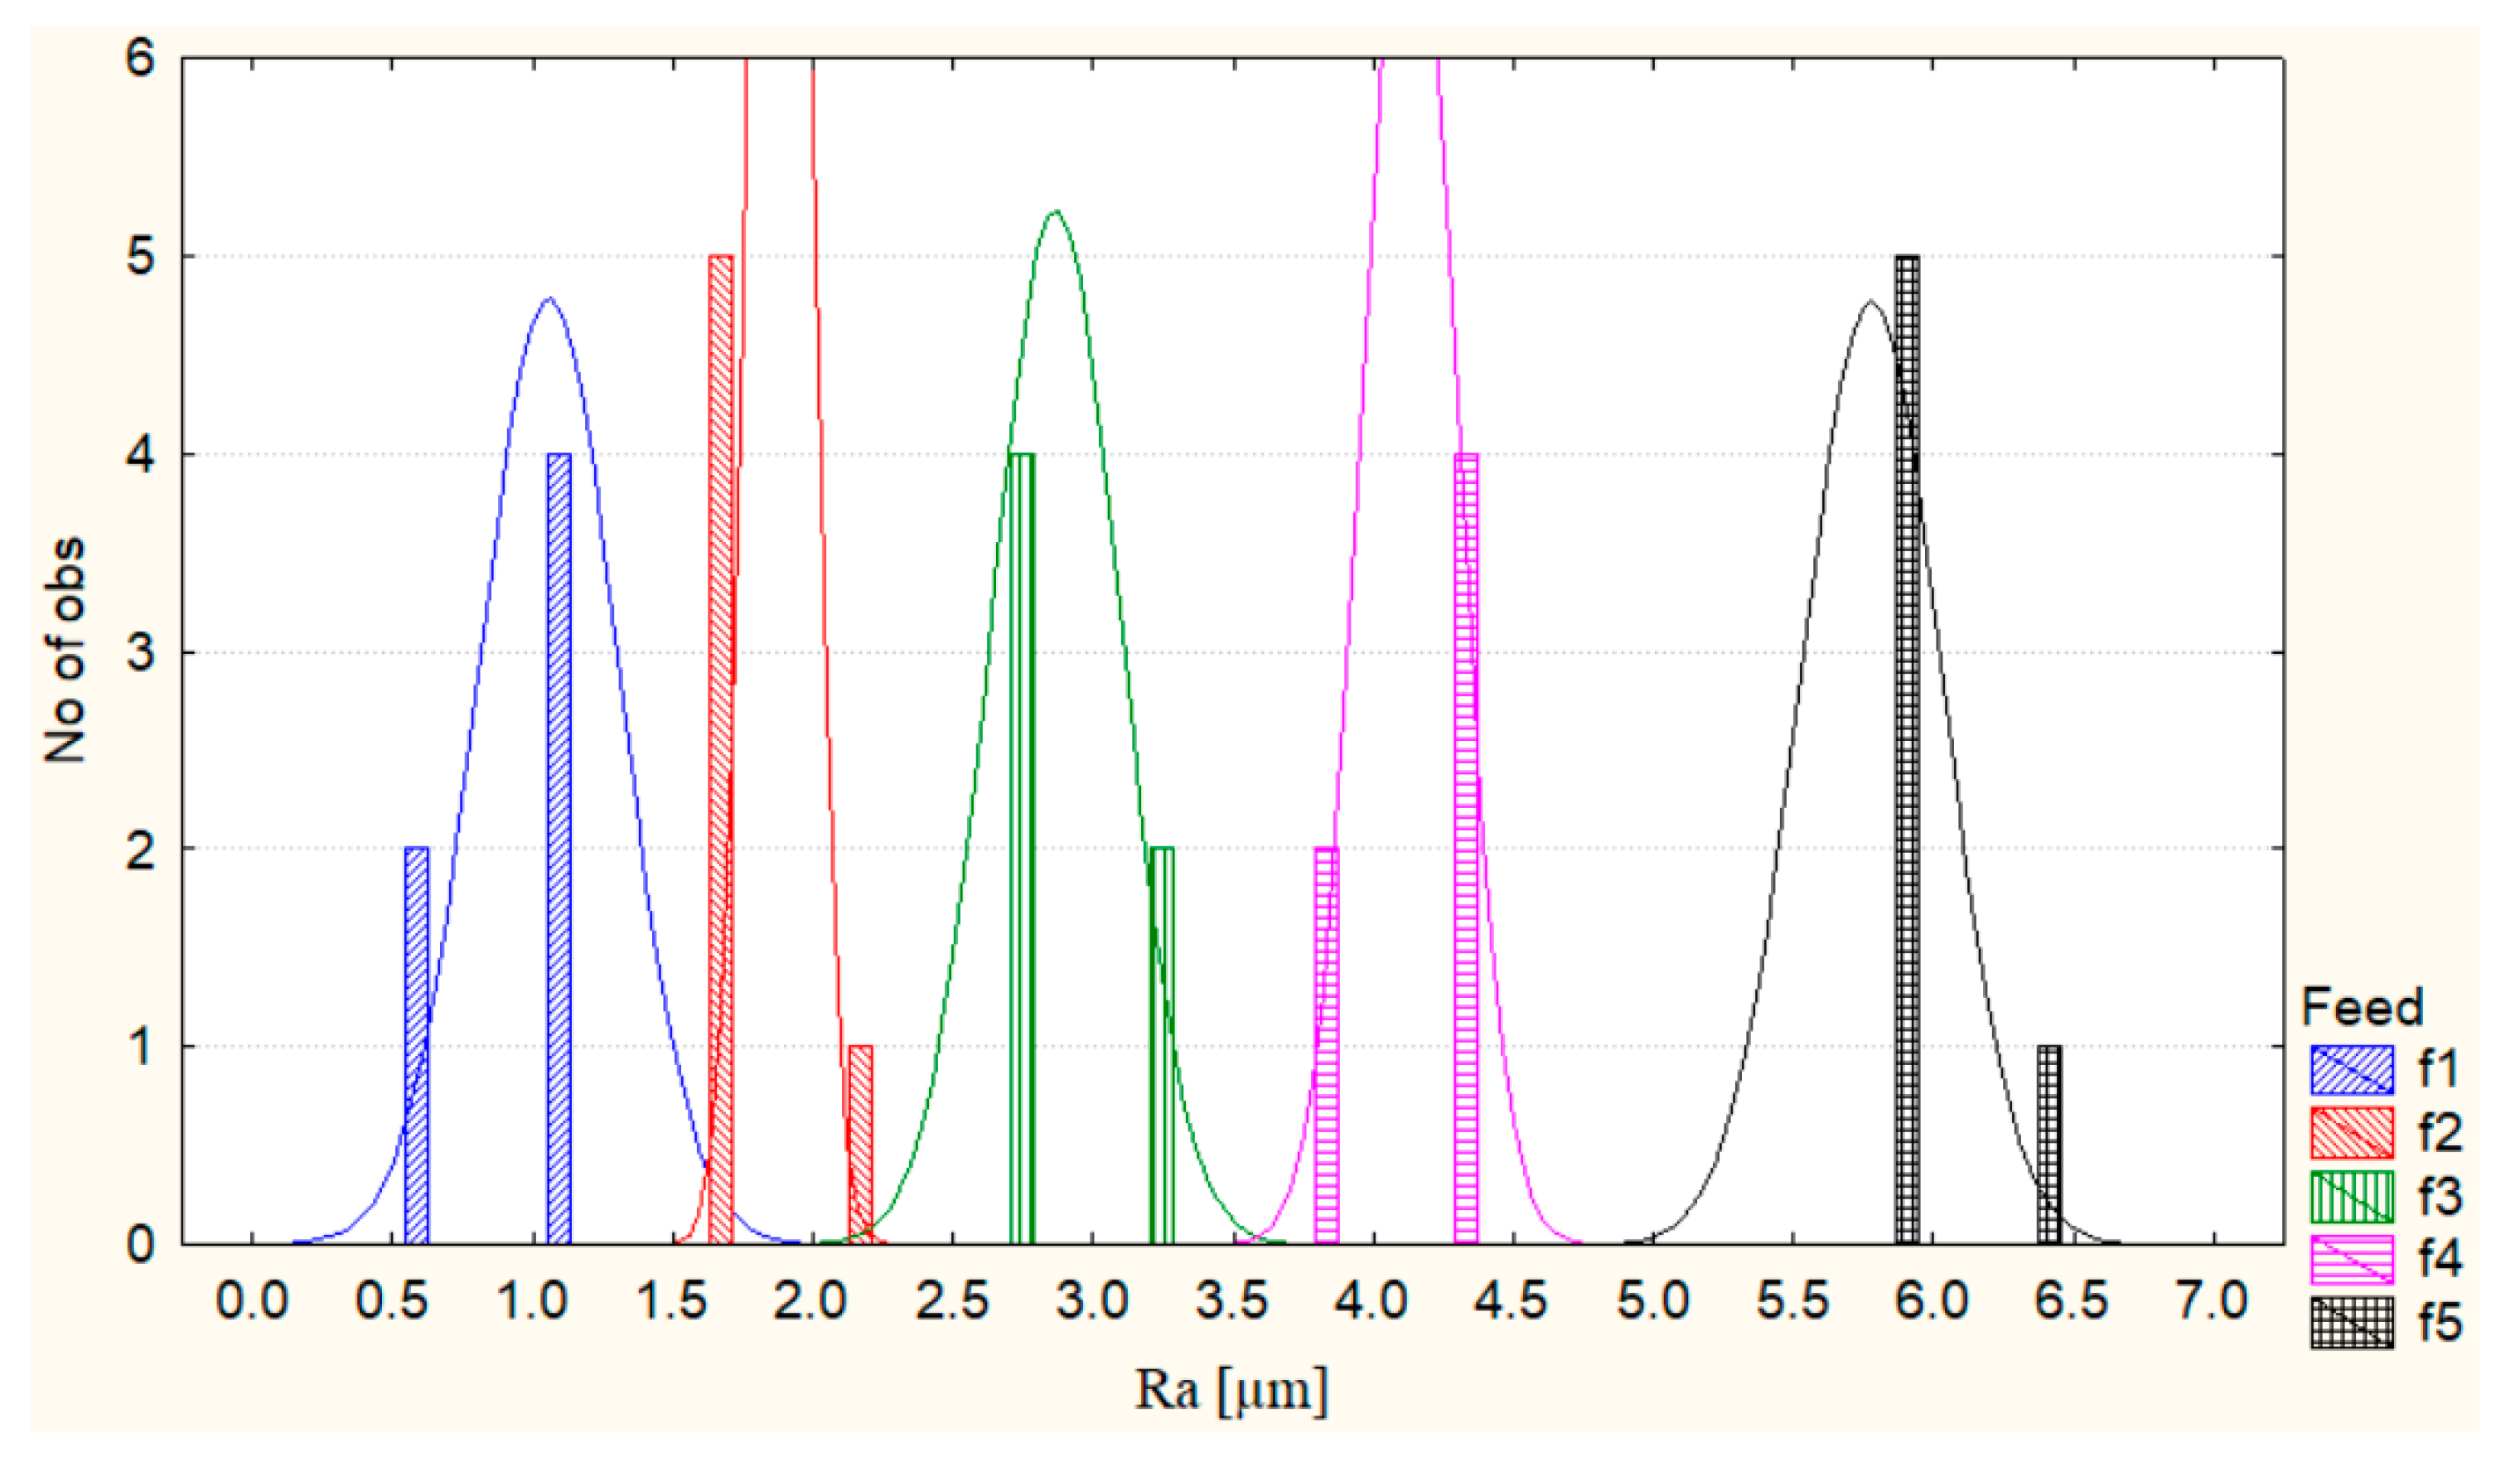
Figure 11 shows the histograms of the data obtained after turning the 5 cutting parameters, in which the variable parameter is the feed.
Next, using the scatter plot procedure, we compared the data in 5 rows in Figure 12.
Next, the F-test in the ANOVA table was used to determine whether there were any means that differ significantly from one another (Table 6).
The table shows the results of ANOVA analysis with two sources of variation: between groups and within groups. The analysis aimed to determine if there were statistically significant differences between the means of five groups.
The “Sum of Squares” column shows the amount of variability that can be attributed to each source of variation. The “Df” column represents the degrees of freedom, which is the number of observations minus the number of parameters estimated.
The “Mean Square” column is obtained by dividing the sum of squares by the degrees of freedom. The “F-Ratio” column represents the test statistic obtained by dividing the mean square of the between groups data by the mean square of the within groups data. The “p-value” column represents the probability of obtaining a test statistic as extreme or more extreme than the one observed, assuming that the null hypothesis is true.
In this case, the F-Ratio is very high (2528.06) and the p-value is very low (0.0000), indicating strong evidence against the null hypothesis. Therefore, we can conclude that there are statistically significant differences between at least two of the five groups.
As there is just one source of variation considered in the ANOVA analysis in this case—the differences between groups—it is not needed to calculate and provide the % contribution rates. When there are several sources of variation, the percentage contribution rates are often used to demonstrate the relative importance of each source of variation. Calculating the percent contribution rates is not essential in this situation, since the sole source of variance is the between groups element.
We examined the Multiple Range Tests to identify which means are significantly different from which others (Table 7).
To identify which means are significantly different from which others, this table uses a multiple comparison approach. The estimated difference between each pair of means is displayed in the bottom half of the output. Ten pairs have an asterisk next to them, signifying that there are statistically significant differences between them at a 95.0% confidence level. Columns of Xs are used to identify 5 homogenous groups. The levels with Xs establish a set of means within each column that do not differ significantly from one another. Fisher’s least significant difference (LSD) process is the approach that was utilized to distinguish between the means. When we were this approach, there was a 5.0% chance that each pair of means would be labeled as substantially different when the real difference was 0.
At an intermediate stage of the hot dip galvanizing process, the surface quality was also examined. As a result, information about pickling was produced. Since electrolytic galvanizing is an automatic process that cannot be interfered with, this intermediate measurement was not possible.
Table 8 displays the measured roughness’s as a function of feed following pickling.
Figure 13 and Figure 14 shows the histograms and scatter plot obtained after processing measured data after the pickling process.
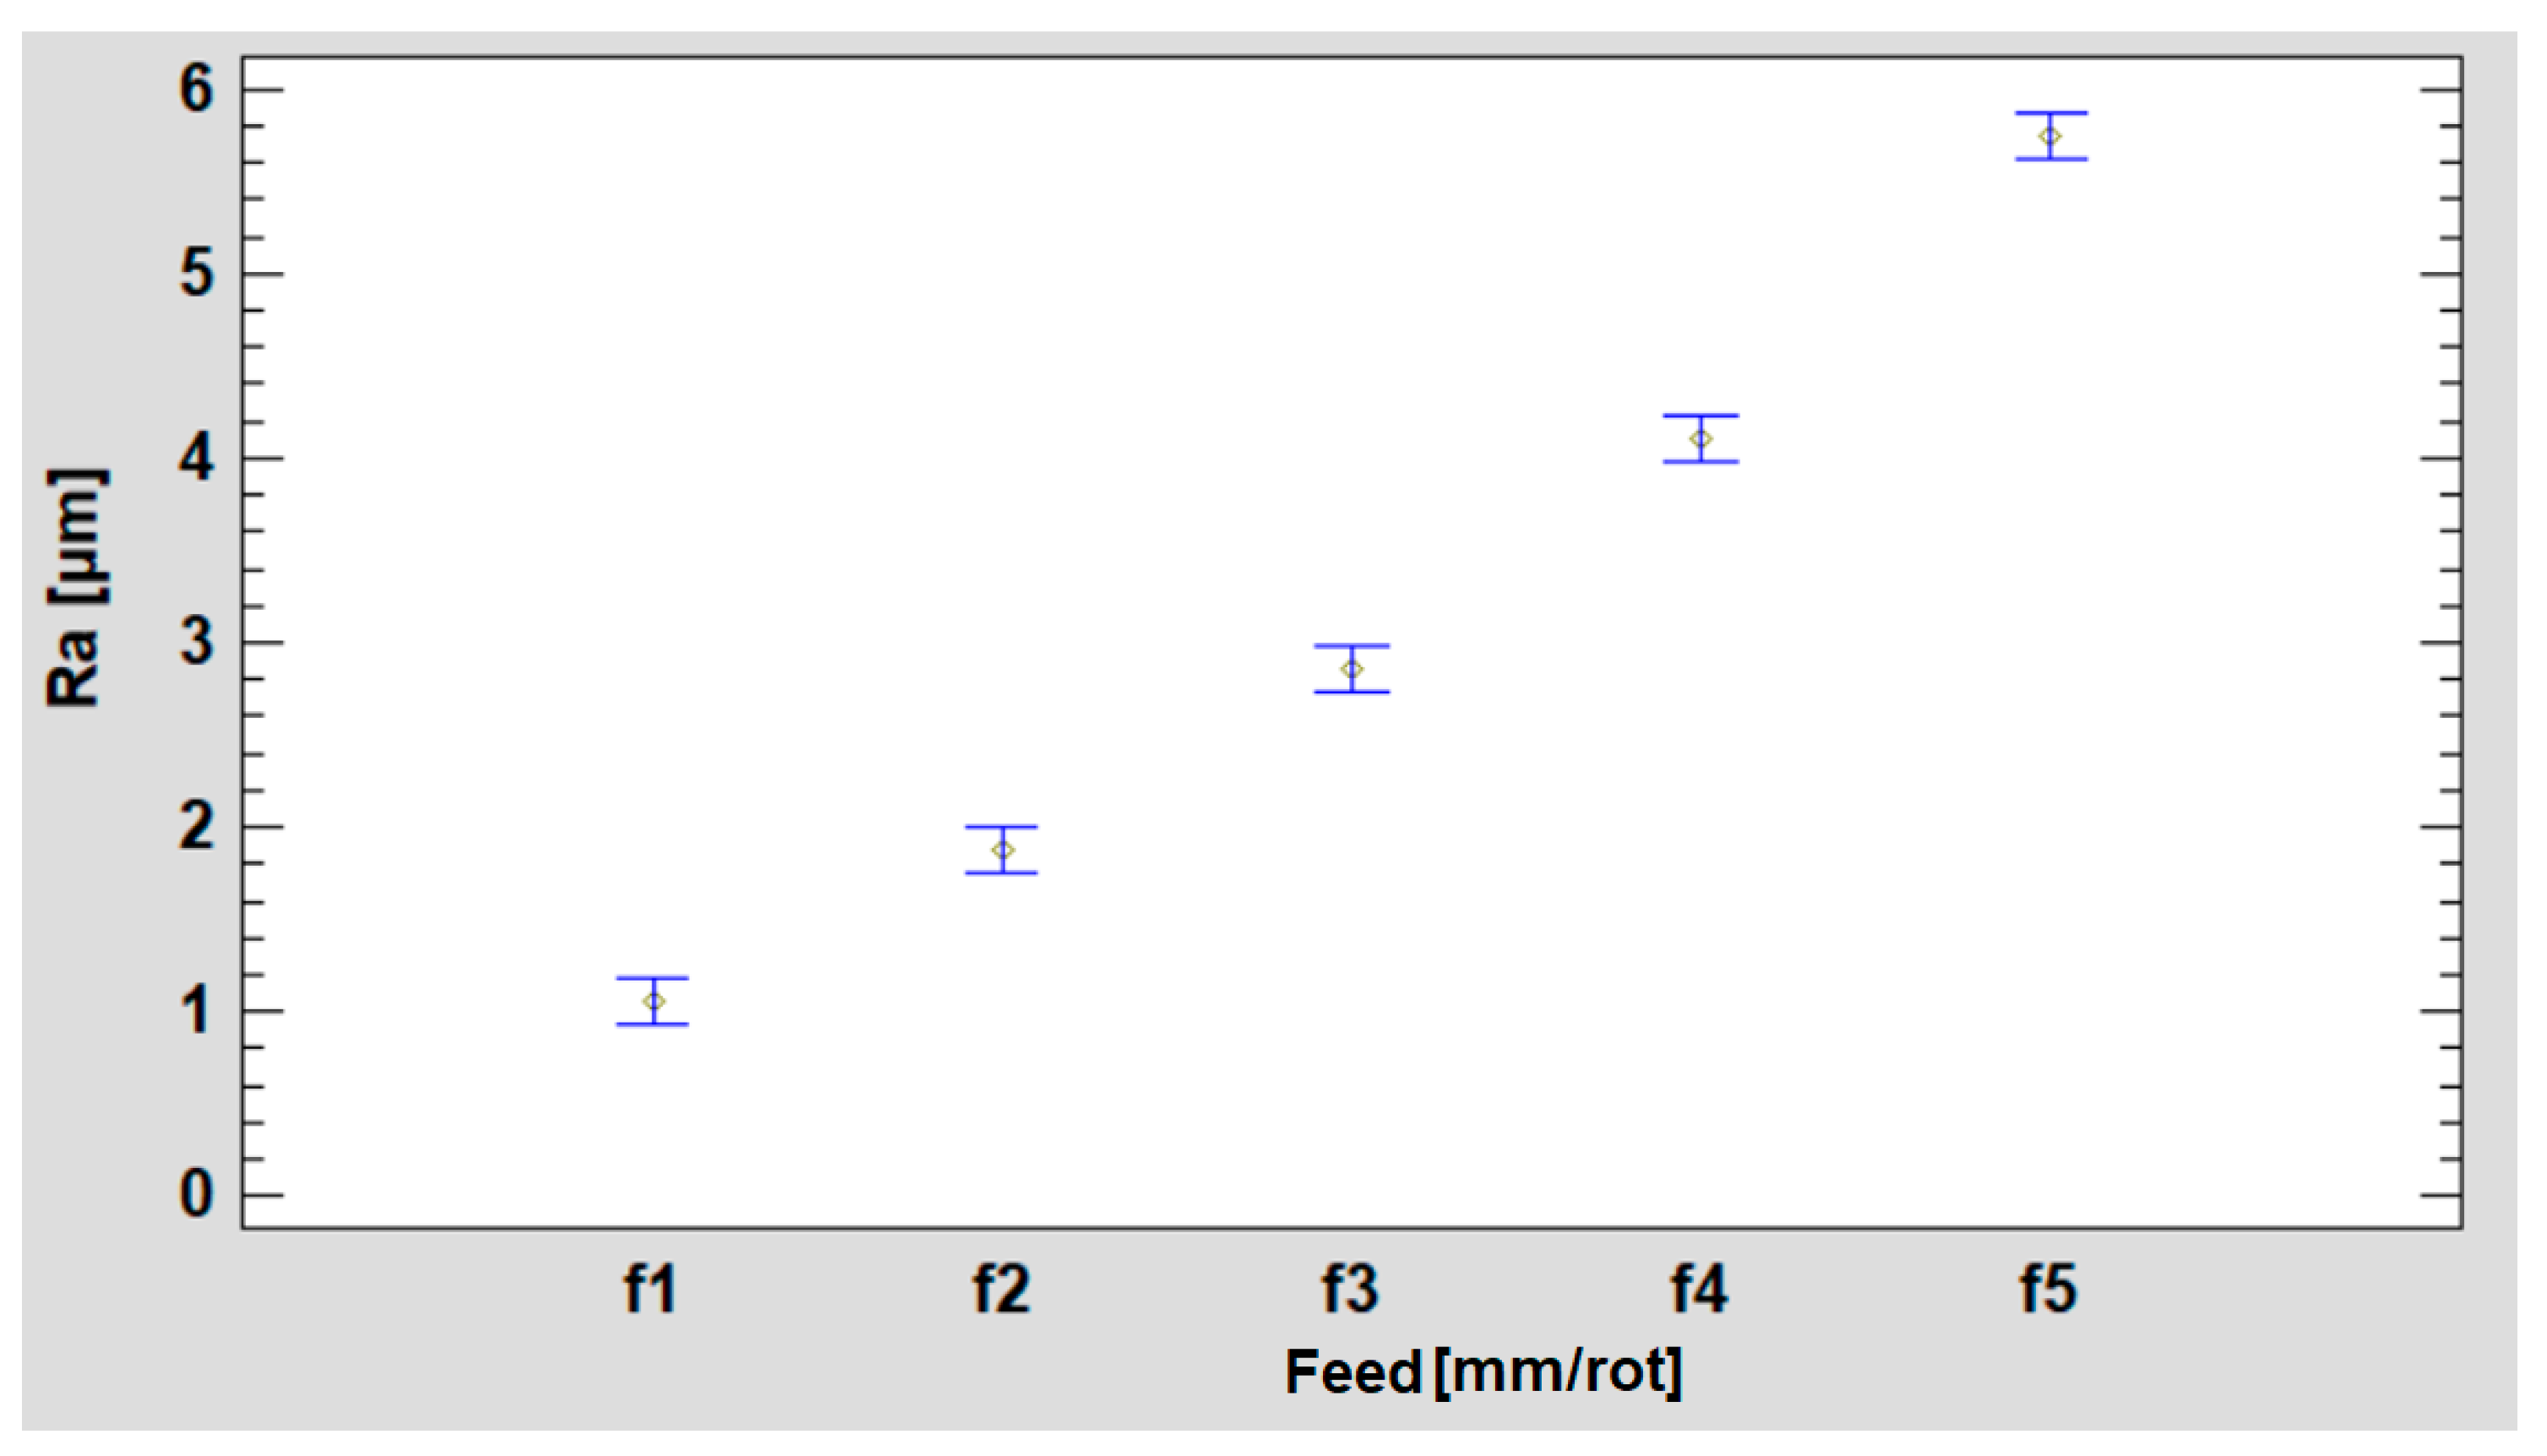
To facilitate the interpretation of the obtained data, Table 9 presents the means with 95.0 percent LSD intervals.
The means for each column of data are displayed in this table. Additionally, it displays the standard error of each mean, a measurement of sample variability. The pooled standard deviation is divided by the square root of the total number of observations at each level to produce the standard error. The table also shows the range surrounding each mean. The Fisher’s least significant difference (LSD) approach served as the foundation for the intervals currently provided. They are designed so that if two means are equal, their intervals will almost always coincide (95.0%). The means plot displays graphical intervals (Figure 15).
The statistics shown in Table 10 were used to examine whether the standard deviations within each of the five columns were the same, which is the null hypothesis. The P-value is of special significance here. At the 95.0% confidence level, there is no statistically significant difference in the standard deviations because the P-value is larger than or equal to 0.05. The standard deviations for each pair of samples are also different in the table. A statistically significant difference between the two sigmas at the 5% significance level is shown by a p-value below 0.05, which is zero here.
The surface roughness measurements for each of the three galvanizing procedures discussed in this work are shown in Table 11 as a function of the advance variation.
To estimate the measurement uncertainty for the data in the table, we calculated the standard deviation of each set of measurements, and then used the formula for the standard uncertainty of the mean: u   = s n , where u is the standard uncertainty of the mean, s is the standard deviation, and n is the number of measurements:
s   = 1.188 1.379 2 + ( 1.448 1.907 ) 2 + 1.502 0.435 2   3 = 0.808   µ m
Then, we calculated the standard uncertainty of the mean: u = 0.808 3 = 0.467   µ m .
We repeated this process for each set of measurements and obtained the following standard uncertainties:
HDG—Ra:
f1: 0.467 µm;
f2: 0.408 µm;
f3: 0.049 µm;
f4: 0.153 µm;
f5: 0.105 µm.
HDG+C—Ra:
f1: 0.562 µm;
f2: 0.268 µm;
f3: 0.071 µm;
f4: 0.157 µm;
f5: 0.110 µm.
ZE—Ra:
f1: 0.005 µm;
f2: 0.051 µm;
f3: 0.021 µm;
f4: 0.087 µm;
f5: 0.136 µm.
These numbers indicate the average measurement uncertainty for each set of measurements, and they may be used to calculate the measurement uncertainty. To conduct a thorough assessment of the measurement uncertainty, additional sources of uncertainty including operator bias and instrument uncertainty also had to be considered.
For example, to estimate the standard uncertainty of the mean for the HDG Ra measurements at a feed rate of f1 = 0.14 mm/rot, we calculated the standard deviation of the three measurements:
Table 12 shows the diameters and deviations from cylindricity measured for each section by direct probing with the 3D measuring arm.
To estimate the measurement uncertainty for the given data, we first identified the sources of uncertainty. The main sources of uncertainty were:
  • Repeatability of the measuring arm;
  • Calibration uncertainty of the measuring arm;
  • Operator influence;
  • Environmental factors (such as temperature, vibration, etc.).
We estimated the overall measurement uncertainty by combining the uncertainties from each of these sources using the square root sum (RSS) method.
Assuming that the repeatability uncertainty and the calibration uncertainty of the measuring arm were negligible, we estimated the measurement uncertainty using the following formula: u = k · Δ L   L .
where u is the measurement uncertainty, k is the coverage factor (usually 2 for 95% confidence), ΔL is the measurement interval, and L is the number of measurements.
Therefore, the estimated measurement uncertainties for each parameter were:
Turning:
Diameter: 0.005 mm;
Cylindricity: 0.002 mm.
Galvanizing:
Diameter: 0.008 mm;
Cylindricity: 0.004 mm;
Increase in diameter after galvanizing: 0.008 mm.
The variation in the turned surface after galvanizing is shown in Table 13.
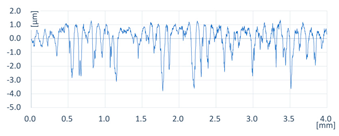
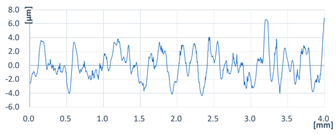
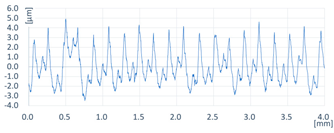
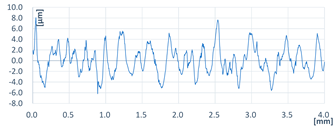
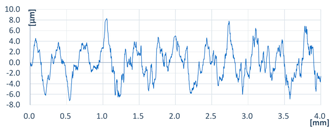
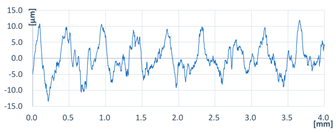
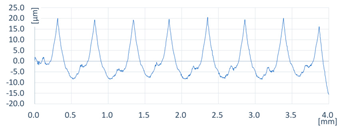
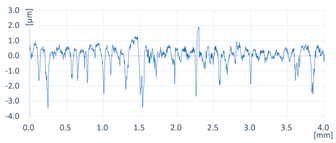
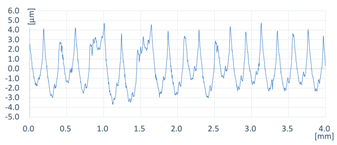
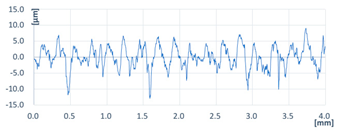
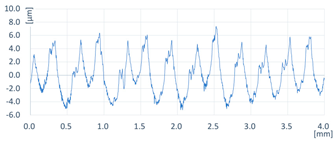
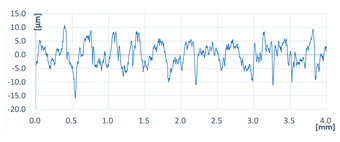
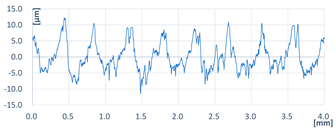
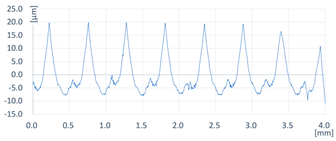
By analyzing the profilograms in the case of the roughness of the first 2 samples, it was found that zinc completely covers the profile as a result of turning, and a different profile was formed. In contrast, at roughness values of 4 and 5, the roughness profile of the zinc layer is influenced by the roughness of the initial surface. Marks left by the chipping tool were also identified after galvanizing. It can be seen on the profilograms that zinc completely or partially covers the voids and the roughness protrusions. The protrusions of the profile are rounded and became more robust.
In Table 14, the evolution of the samples according to the galvanizing technology is graphically presented in terms of their resistance to corrosion classified according to the time intervals.
When they were galvanized by immersion, in the case of surfaces with high Ra values, zinc remains in the traces left by the tool. In this context, a thicker protective layer is formed that will better resist corrosion, but the zinc consumption is higher.
After carrying out the corrosion test in salt fog, which assumed a duration of 240 h, it was found that at the beginning, the appearances of the parts were very different, in the sense that the technology with which the galvanizing was carried out could be differentiated. After 240 h of exposure to salt fog, the appearance of the parts became uniform, and the zinc layer was affected, but no rust appeared.
In the case of electrolytic galvanizing, the commercial appearance of salt spray exposure began to disappear after 96 h.

5. Results

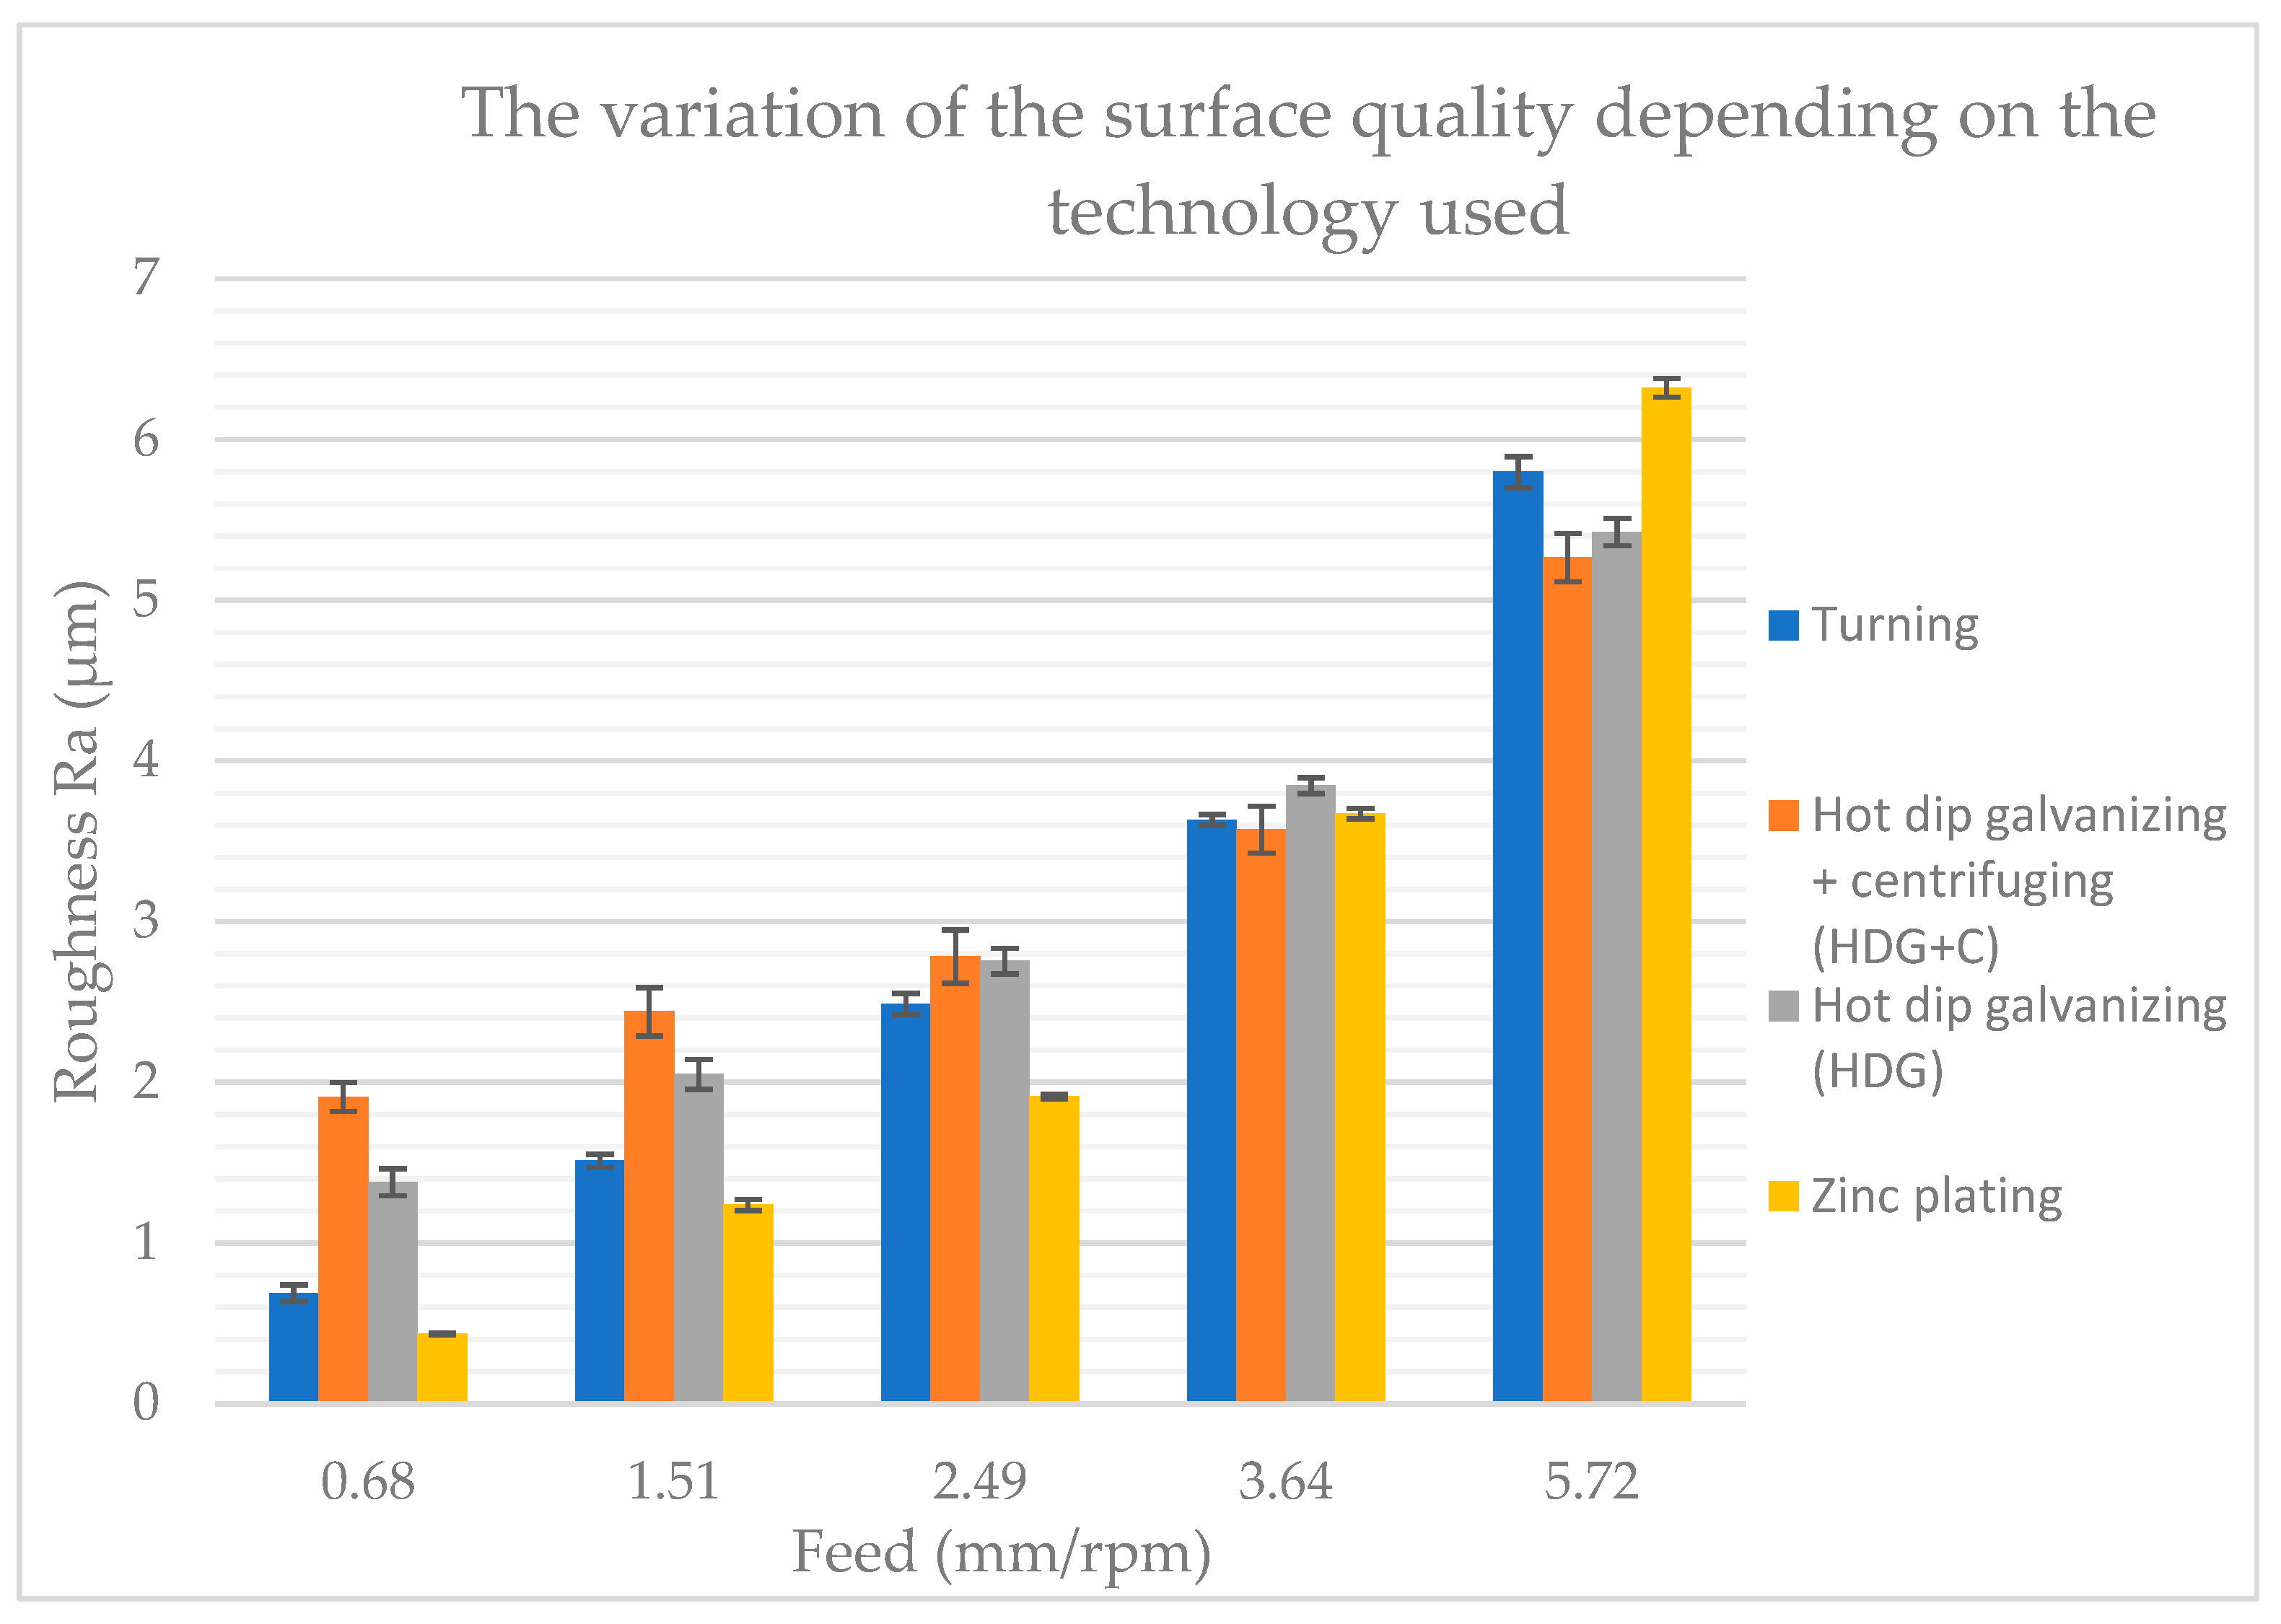
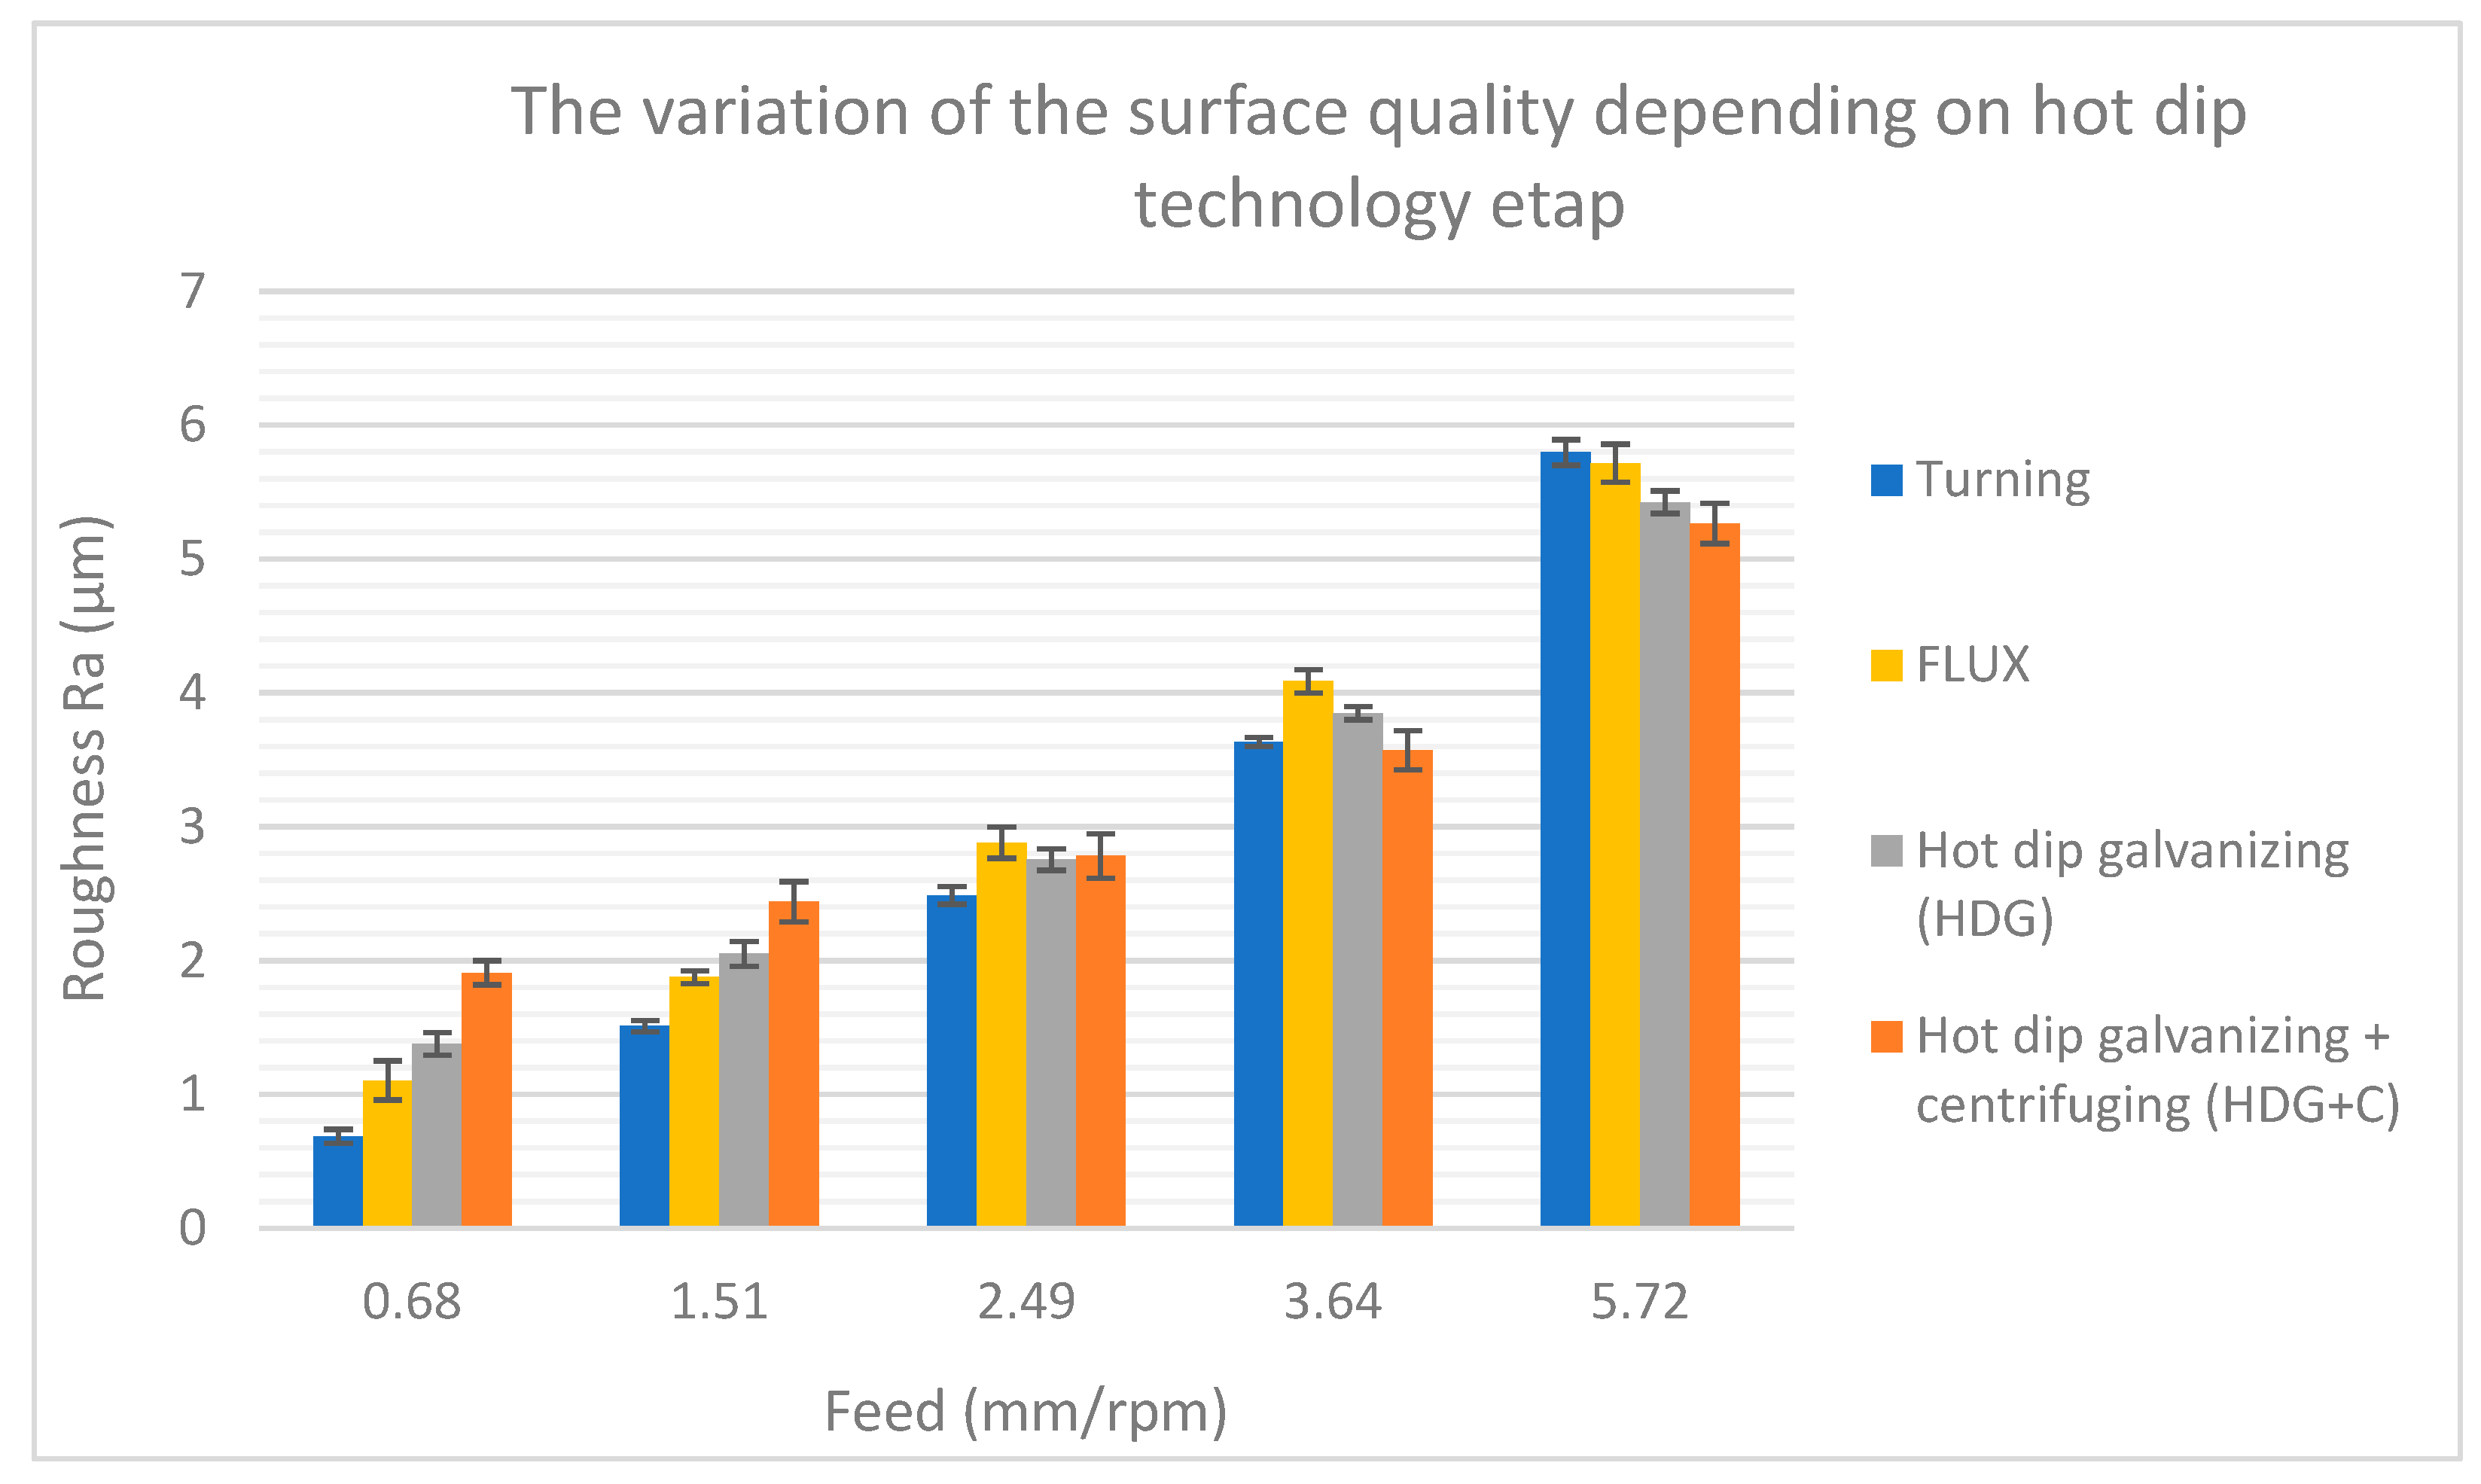
By analyzing the data from Table 14 and the representation of these data in Figure 16, a variation in the roughness of the turned surface after galvanizing was found in the case of galvanizing.
Surfaces with low roughness undergo changes because of thermal galvanizing, in the sense that their roughness increases. Conversely, surfaces with a more initial roughness will have a less roughness after galvanizing.
In the case of electrolytic galvanizing for surfaces with roughness Ra = (0.68–2.49) obtained by turning, after galvanizing, their roughness values decreased significantly. In the case of roughness values of 3.64–5.72 obtained after turning, they were accentuated after electrolytic galvanizing.
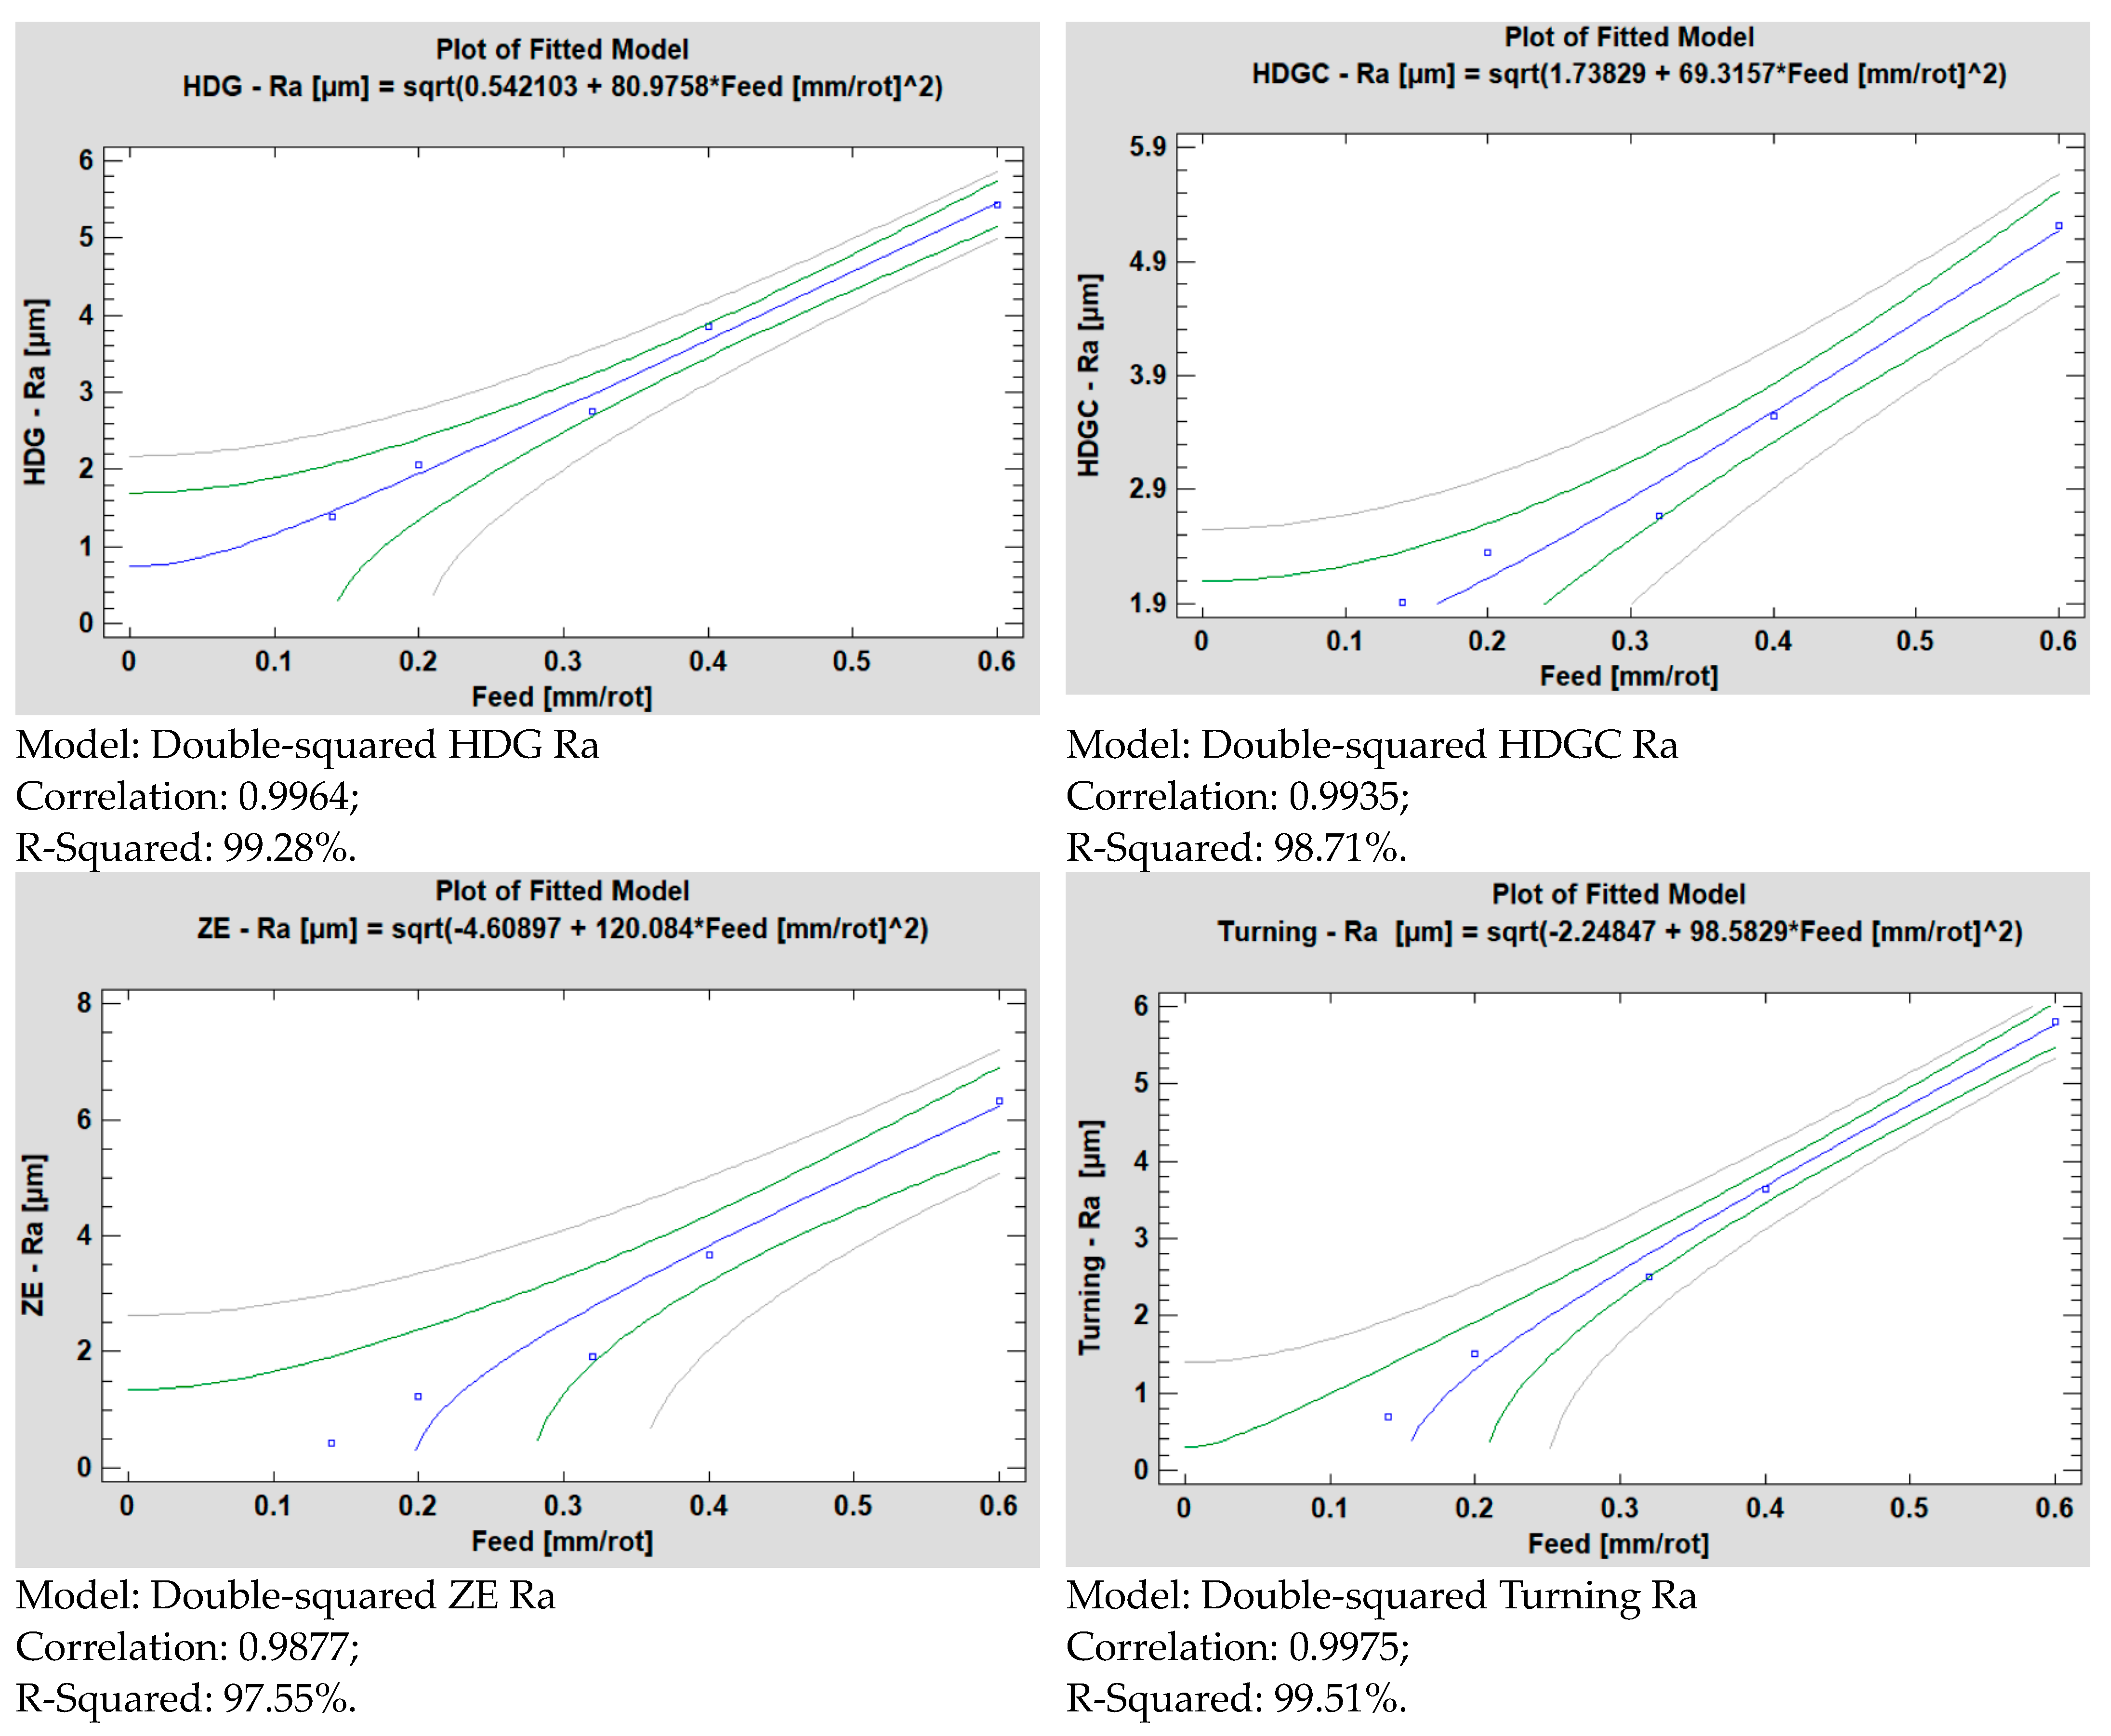
To determine the optimal roughness in the case of each galvanizing technology, at which the turning costs will be the lowest, the quality of the galvanized surface was as high as possible, and roughness variation Equations (1)–(4) were determined.
Optimal roughness values for each galvanizing technology were obtained using the same equation of the variation in the roughness of the turned surface after galvanizing (Figure 17). This evolution is presented graphically in Figure 18a–c and was based on Equations (5)–(7).
The R-Squared statistic indicates that the model as fitted explains:
  • A total of 99.28% of the variability in HDG—Ra (µm).
  • A total of 98.71% of the variability in HDGC—Ra (µm).
  • A total of 97.55% of the variability in ZE—Ra (µm).
  • A total of 99.51% of the variability during turning—Ra (µm).
Equations of surface roughness variation depend on the technology used:
Ra HDG = 0.542103 + 80.9758 · Feed 2
Ra HDGC = 1.73829 + 69.3157 · Feed 2
Ra ZE = 4.60897 + 120.084 · Feed 2
Ra turning = 2.24847 + 98.5829 · Feed 2
The equations for determining the optimal roughness values are as follows:
For HDG galvanizing technology:
Ra turning = 2.24847 + 98.5829 · Feed 2 Ra HDG = 0.542103 + 80.9758 · Feed 2
For HDGC galvanizing technology:
Ra turning = 2.24847 + 98.5829 · Feed 2 Ra HDGC = 1.73829 + 69.3157 · Feed 2
For ZE galvanizing technology:
Ra turning = 2.24847 + 98.5829 · Feed 2 Ra ZE = 4.60897 + 120.084 · Feed 2
After solving the equations, common punches (optimal Ra) were obtained:
HDG: Ra = 3.657 µm;
HDGC: Ra = 3.344 µm;
ZE: Ra = 2.928 µm.
Based on the measurements of roughness and diameters after the pickling stage, which is considered to be an intermediate stage of galvanizing, destruction of the quality of the turned surface was found, which can be seen in Figure 19; however, after the deposition of the zinc layer, this roughness decreases.
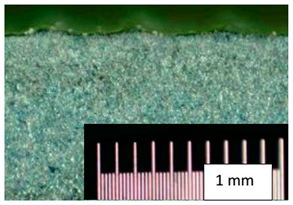
To expand the study and explain the phenomenon observed and presented in Figure 16 and Figure 18 regarding the changes in the roughness values of the turned surface after galvanizing, microscopic analyses of the surface of the galvanized parts and of the section of the zinc layer were carried out.
For the data represented in Figure 16, standard derivations were calculated, and these values were plotted on a graph. The same was performed for the graph in Figure 19.
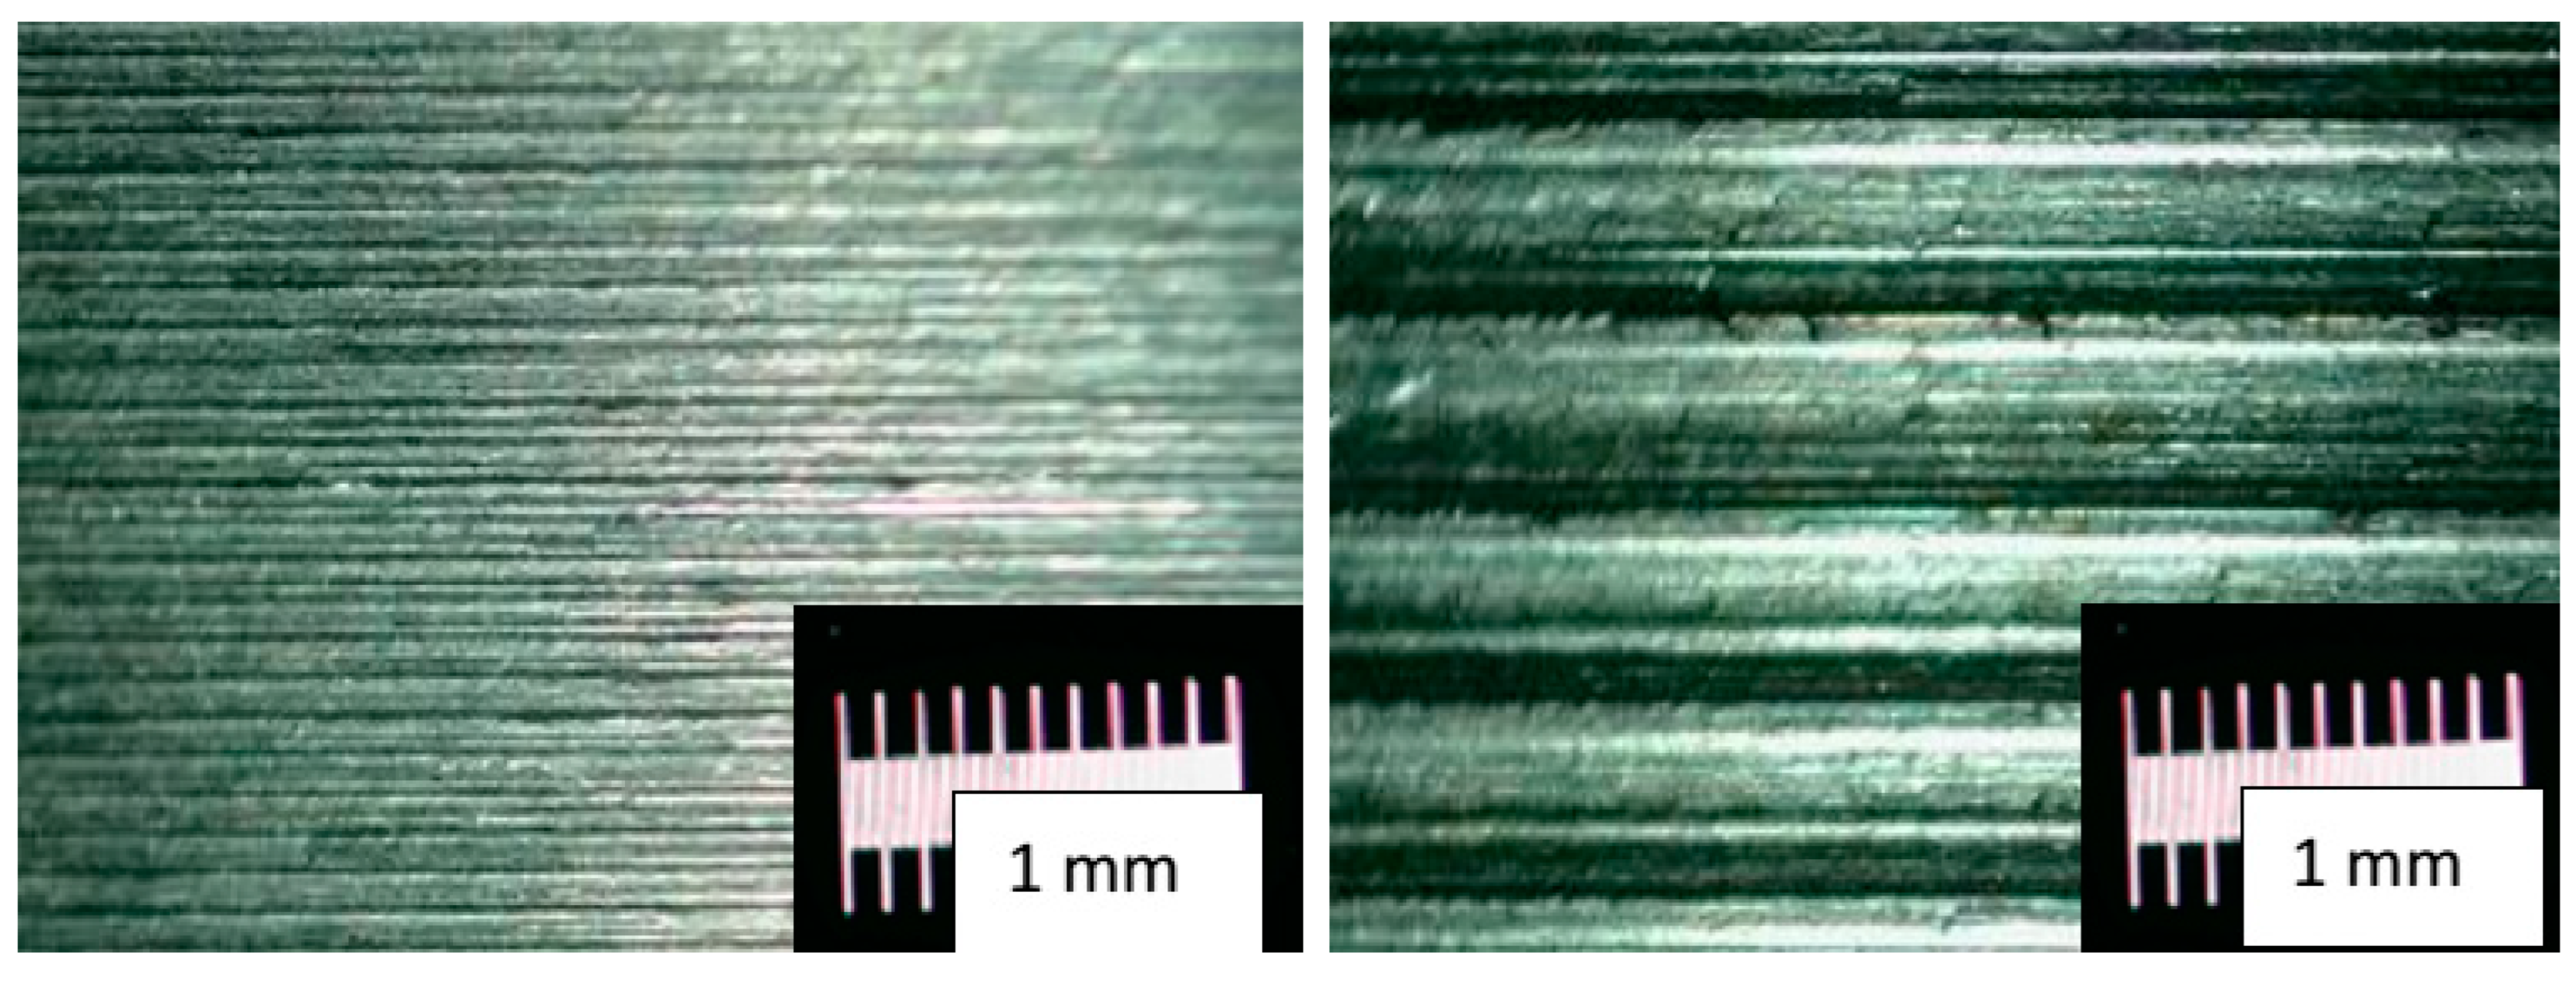
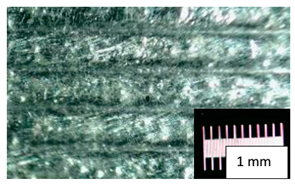
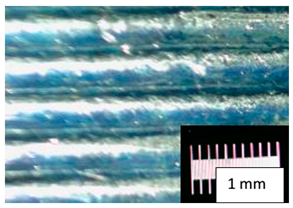
Figure 20 shows the surfaces of sections 1 with Ra = 0.435 μm (f1 = 0.14 mm/rot) and 5 with Ra = 6.323 μm (f5 = 0.6 mm/rot) of a samples used in the study before galvanizing.
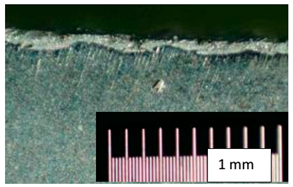
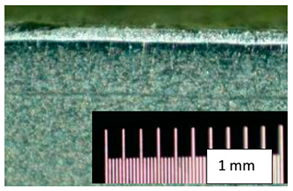
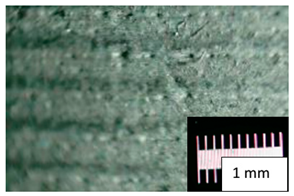
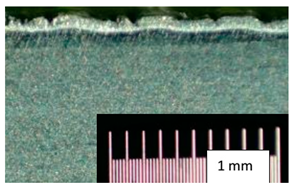
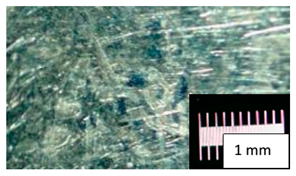
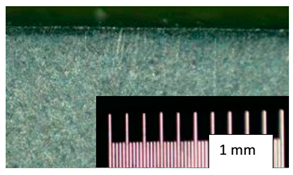
Table 15 shows the surface of the sample and the structure of the deposited zinc layer depending on the initial roughness obtained by chipping and the galvanizing technology applied. Sections 1 and 5 are shown in Table 15 because they underwent significant changes in roughness following galvanization. In the case of Section 1 with Ra = 0.435 μm, processed with the feed f1 = 0.14 mm/rot, after galvanizing, it was found that the initial roughness increased and the quality of the surface deteriorated. In the case of Section 5, with Ra = 6.323 μm processed with advance f5 = 0.6 mm/rot, a decrease in the roughness value after galvanizing was observed.
The increase in roughness after galvanizing the turned surfaces with Ra = 0.435 μm (f1 = 0.14 mm/rot) according to Table 15 is due to the texture of the zinc layer after its recrystallization on the steel surface.
The compact zinc layer follows the profile of the steel surface. In the case of roughness Ra = 0.435 μm of the steel piece, zinc completely covers the profile due to turning. In this case, after galvanizing, roughness is influenced only by zinc recrystallization.
In the case of roughness Ra = 6.323 μm (f5 = 0.6 mm/rot), the traces left by the lathe knife can be distinguished on the surface of the piece. In the case of hot dip galvanizing, these voids are partially filled by the zinc layer. In dip galvanizing only, the profile left by the lathe knife is almost filled with zinc.
In the case of galvanic galvanizing or immersion + centrifugation, the tool mark is only partially filled with zinc. Filling the lathe knife trace with zinc results in decreased surface roughness after galvanizing. This aspect can also be observed on the profilograms in Table 13.
In this case, (Ra = 6.323 μm) after galvanizing, roughness is influenced both by the texture of the recrystallized zinc layer and by the macrostructure of the surface obtained after turning.
According to the data in Table 13, depending on the galvanizing technology, the diameter of the parts increased. From the measured values of the initial turned diameter and the one after galvanizing, it was possible to determine the value by which the diameter of the parts changes depending on the galvanizing technology. These data can be used to determine the elevation at which turning is performed to obtain the final elevation of the galvanized piece.

6. Discussion

After determining the variation curves of the roughness of the galvanized surface
  • depending on the quality of the surface before galvanizing and
  • depending on the galvanizing technology used,
optimal ranges of the pre-processing parts were determined. This optimal roughness is related to the realization of superior qualities of the galvanized piece (Figure 18a–c).
As a result of the conducted experiment, it was found that it is useful to avoid processing the surfaces before galvanizing to improve the roughness:
  • Ra < 3.657 μm—in the case of HDG;
  • Ra < 3.344 μm—in the case of HDG+C;
  • Ra > 2.928 μm—in the case of ZP (because after the deposition of the zinc layer by electrolysis, the roughness of the surfaces decreases).
Avoiding small roughness values leads to the use of low feeds, which leads to savings in the machining phases.
From the point of view of dimensions and dimensional accuracy, it appears that:
  • To obtain a given dimension after galvanizing, the parts, depending on the galvanizing technology, will be turned with smaller dimensions with:
    • 0.16 mm/diameter (0.08 mm/radius) in the case of HDG;
    • 0.09 mm/diameter (0.047 mm/radius) in the case of HDG+C;
    • 0.03 mm/diameter (0.014 mm/radius) in the case of ZP.
  • From the point of view of dimensional accuracy, it was found that it decreases after galvanizing. The changes in the tolerance field depending on the galvanizing technology are:
    • +0.01 mm in the case of HDG;
    • +0.001 mm in the case of HDG+C;
    • +0.01 mm in the case of ZP.
From the point of view of corrosion, after carrying out a corrosion test with salt fog with a duration of 240 h, it could be observed that:
  • Degradation of the zinc layer appears, as expected;
  • Rust does not appear, the steel part is protected from corrosion regardless of the galvanizing technology;
  • The degradation of the zinc layer is more advanced in the case of sections with less roughness. Zinc plating on the surfaces of sections with Ra = 0.68–2.49 shows a more pronounced degradation compared to that of the sections with roughness Ra = 3.64–5.72.
The results that were obtained were addressed from the perspective of the process’ physics. The optimal roughness values and optimal roughness ranges were obtained by analyzing the variation curves of the roughness of the galvanized surface in terms of the quality of the surface prior to galvanizing and the galvanizing process employed. These ideal roughness values are connected to the attainment of the galvanized piece’s exceptional attributes. To isolate its impact on the outcomes, the study was conducted at a single cutting speed.
Depending on the galvanizing technology used, it was discovered that the components need to be converted to smaller dimensions to ensure dimensional accuracy. After galvanizing, it was discovered that the dimensional accuracy decreases due to changes in the tolerance field.
From the standpoint of corrosion, it was noted that the steel component is protected against corrosion, regardless of the galvanizing process utilized, and rust does not emerge. Nevertheless, in parts with less roughness, the zinc layer’s deterioration is more progressed.
Overall, the collected data were carefully examined and offer important, new information on how galvanizing affects the quality of the surface and precision-turned parts.

7. Conclusions

In conclusion, this research aimed to determine the ideal economic roughness of galvanized surfaces by analyzing the impact of turning surface roughness on the quality of galvanizing, as well as the thickness of the zinc layer and its corrosion resistance.
The research reveals that while the steel components are protected from corrosion and minimizing small roughness values results in cost savings throughout the machining stages, the zinc layer’s deterioration is more advanced in areas with reduced roughness.
Optimal roughness ranges for each galvanizing process were established, and it was found that after galvanizing, the parts’ dimensions were smaller, and their dimensional accuracy decreased.
The results show how versatile our technique is since the optimal roughness ranges may be used with many types of materials and technologies.
Our method’s originality is in the identification of optimum roughness ranges, which can result in cost savings and improved galvanizing process efficiency.
The practical implications of this study and its capacity to offer novel insights into how galvanizing influences the quality of the surface and precision-turned parts constitute its scientific contribution.
Our technique does, however, have some drawbacks, such as the fact that the analysis was only conducted at one cutting speed.
Future studies may look at the impact of varied cutting speeds on the best roughness ranges. In conclusion, this study introduces new research directions and provides valuable insights for enhancing the effectiveness and quality of the galvanizing process.

Author Contributions

Conceptualization, S.R.-N., A.B.P. and A.M.T.; methodology, A.B.P. and A.M.T.; software, S.R.-N. and A.B.P.; validation, S.R.-N., A.B.P. and A.M.T.; formal analysis, A.B.P.; investigation, S.R.-N.; resources, S.R.-N.; data curation, A.B.P. and S.R.-N.; writing—original draft preparation, S.R.-N., A.B.P. and A.M.T.; writing—review and editing, S.R.-N., A.B.P. and A.M.T.; visualization, S.R.-N., A.B.P. and A.M.T.; supervision, A.M.T.; project administration, S.R.-N. All authors have read and agreed to the published version of the manuscript.

Funding

This research received no external funding.

Institutional Review Board Statement

Not applicable.

Informed Consent Statement

Not applicable.

Data Availability Statement

Not applicable.

Conflicts of Interest

The authors declare no conflict of interest.

References

  1. Feldmann, M.; Pinger, T.; Schäfer, D.; Pope, R.; Smith, W.; Sedlacek, G. Hot-Dip-Zinc-Coating of Prefabricated Structural Steel Components; JRC Scientific and Technical Reports; European Commission: Brussels, Belgium, 2010; pp. 13–14. [Google Scholar]
  2. Saarimaa, V.; Lange, C.; Paunikallio, T.; Kaleva, A.; Nikkanen, J.-P.; Levänen, E.; Väisänen, P.; Markkula, A. Evaluation of surface activity of hot-dip galvanized steel after alkaline cleaning. J. Coat. Technol. Res. 2020, 17, 285–292. [Google Scholar] [CrossRef]
  3. Cook, T.H. Composition, testing, and control of hot dip galvanizing flux. Met. Finish. 2003, 101, 22–35. [Google Scholar] [CrossRef]
  4. Morikubo, S.; Yukio, K.; Daisuke, E.; Aoi, N.; Yasuhiko, T. Effect of ammonia stripping and influence of contaminants in zinc plating wastewater. J. Environ. Manag. 2021, 298, 113459. [Google Scholar] [CrossRef]
  5. Chotirach, M.; Rattanawaleedirojn, P.; Boonyongmaneerat, Y.; Chanajaree, R.; Schmid, K.; Metzner, M.; Rodthongkum, N. Systematic investigation of brightener’s effects on alkaline non-cyanide zinc electroplating using HPLC and molecular modeling. Mater. Chem. Phys. 2022, 277, 125567. [Google Scholar] [CrossRef]
  6. Li, C.; Kingsbury, R.; Zhou, L.; Shyamsunder, A.; Persson, K.A.; Nazar, L.F. Tuning the solvation structure in aqueous zinc batteries to maximize Zn-ion intercalation and optimize dendrite-free zinc plating. ACS Energy Lett. 2022, 7, 533–540. [Google Scholar] [CrossRef]
  7. Wang, Y.; Chen, Y.; Liu, W.; Ni, X.; Qing, P.; Zhao, Q.; Wei, W.; Ji, X.; Ma, J.; Chen, L. Uniform and dendrite-free zinc deposition enabled by in situ formed AgZn 3 for the zinc metal anode. J. Mater. Chem. A 2021, 9, 8452–8461. [Google Scholar] [CrossRef]
  8. Li, H.; Jia, W.; Chen, P.; Wang, L.; Yan, X.; Yang, Y.Y. Zinc Deposition Characteristics on Different Substrates for Aqueous Zinc Ion Battery. Appl. Surf. Sci. 2023, 607, 155111. [Google Scholar] [CrossRef]
  9. Kania, H.; Mendala, J.; Kozuba, J.; Saternus, M. Development of Bath Chemical Composition for Batch Hot-Dip Galvanizing—A Review. Materials 2020, 13, 4168. [Google Scholar] [CrossRef]
  10. Tayyebi, K.; Sun, M.; Karimi, K. Residual stresses of heat-treated and hot-dip galvanized RHS cold-formed by different methods. J. Constr. Steel Res. 2020, 169, 106071. [Google Scholar] [CrossRef]
  11. Yu, Z.; Hu, J.; Meng, H. A review of recent developments in coating systems for hot-dip galvanized steel. Front. Mater. 2020, 7, 74. [Google Scholar] [CrossRef] [Green Version]
  12. Peng, S.; Xie, S.K.; Xiao, F.; Lu, J.T. Corrosion behavior of spangle on a batch hot-dip galvanized Zn-0.05 Al-0.2 Sb coating in 3.5 wt.% NaCl solution. Corros. Sci. 2020, 163, 108237. [Google Scholar] [CrossRef]
  13. Al-Negheimish, A.; Hussain, R.R.; Alhozaimy, A.; Singh, D.D.N. Corrosion performance of hot-dip galvanized zinc-aluminum coated steel rebars in comparison to the conventional pure zinc coated rebars in concrete environment. Constr. Build. Mater. 2021, 274, 121921. [Google Scholar] [CrossRef]
  14. Sun, M.; Ma, Z. Effects of heat-treatment and hot-dip galvanizing on mechanical properties of RHS. J. Constr. Steel Res. 2019, 153, 603–617. [Google Scholar] [CrossRef]
  15. Hu, S.; Xu, C.; Srinivasakannan, C.; Tan, X.; Ni, S.; Zhang, J.; Li, X.; Zhang, H.; Li, S. Recovery of zinc and iron from hot-dip galvanizing spent pickle liquor using solvent extraction. J. Mol. Liq. 2022, 362, 119741. [Google Scholar] [CrossRef]
  16. Hernández-Betancur, J.D.; Hernández, H.F.; Ocampo-Carmona, L.M. A holistic framework for assessing hot-dip galvanizing process sustainability. J. Clean. Prod. 2019, 206, 755–766. [Google Scholar] [CrossRef]
  17. Meeusen, M.; Zardet, L.; Homborg, A.M.; Lekka, M.; Andreatta, F.; Fedrizzi, L.; Boelen, B.; Mol, J.M.C.; Terryn, H. The effect of time evolution and timing of the electrochemical data recording of corrosion inhibitor protection of hot-dip galvanized steel. Corros. Sci. 2020, 173, 108780. [Google Scholar] [CrossRef]
  18. Najafabadi, E.P.; Heidarpour, A.; Raina, S. Hot-dip galvanizing of high and ultra-high strength thin-walled CHS steel tubes: Mechanical performance and coating characteristics. Thin-Walled Struct. 2021, 164, 107744. [Google Scholar] [CrossRef]
  19. Cetinkaya, B.W.; Junge, F.; Mueller, G.; Haakmann, F.; Schierbaum, K.; Giza, M. Impact of alkaline and acid treatment on the surface chemistry of a hot-dip galvanized Zn–Al–Mg coating. J. Mater. Res. Technol. 2020, 9, 16445–16458. [Google Scholar] [CrossRef]
  20. Scheiber, D.; Essl, W.; Strutzenberger, J.; Goodwin, F.; Spitaler, J.; Reiss, G. Morphology of Fe2Al5 particles and the interface to WC coating in the context of hot-dip galvanizing: An ab initio study. J. Alloys Compd. 2020, 824, 153854. [Google Scholar] [CrossRef]
  21. Fan, Y.; Yang, H.; Fan, H.; Liu, Q.; Lv, C.; Zhao, X.; Yang, M.; Wu, J.; Cao, X. Corrosion resistance of modified hexagonal boron nitride (h-BN) nanosheets doped acrylic acid coating on hot-dip galvanized steel. Materials 2020, 13, 2340. [Google Scholar] [CrossRef]
  22. Xu, Y.; Zhang, Y.; Shu, Y.; Song, H.; Shu, X.; Ma, Y.; Hao, L.; Zhang, X.; Ren, X.; Wang, Z.; et al. Composition and Leaching Toxicity of Hydrochloric Acid Pickling Sludge Generated from the Hot-Dip Galvanized Steel Industry. ACS Omega 2022, 7, 13826–13840. [Google Scholar] [CrossRef] [PubMed]
  23. Comparini, A.; Del Pace, I.; Giurlani, W.; Emanuele, R.; Verrucchi, M.; Bonechi, M.; Innocenti, M. Electroplating on Al6082 Aluminium: A New Green and Sustainable Approach. Coatings 2023, 13, 13. [Google Scholar] [CrossRef]
  24. Liu, P.; Wang, S.; Wang, C.; Zhao, X. Study on Microstructure and Properties of Mechanically Deposited Zn-Sn Coating. Coatings 2022, 12, 1919. [Google Scholar] [CrossRef]
  25. Jiang, W.; Liu, Y.; Wang, J.; Li, R.; Liu, X.; Ai, S. Facile and Eco-Friendly Preparation of Mild Steel Based Superhydrophobic Surfaces without Chemical Modifications. Coatings 2022, 12, 737. [Google Scholar] [CrossRef]
  26. Nunes, M.S.; Bandeira, R.M.; Figueiredo, F.C.; dos Santos Junior, J.R.; de Matos, J.M.E. Corrosion protection of stainless steel by a new and low-cost organic coating obtained from cashew nutshell liquid. J. Appl. Polym. Sci. 2023, 140, e53420. [Google Scholar] [CrossRef]
  27. Selles, M.A.; Schmid, S.R.; Sanchez-Caballero, S.; Perez-Bernabeu, E.; Reig, M.J. Upper-bound modelization of an ironed three-layered polymer-coated steel strip. Int. J. Adv. Manuf. Technol. 2012, 60, 161–171. [Google Scholar] [CrossRef]
  28. Selles, M.A.; Schmid, S.R.; Seguí, V.J. Ironability of a three-layered polymer-coated steel. Part 1: Experimental investigation. J. Mater. Process. Technol. 2008, 202, 7–14. [Google Scholar] [CrossRef]
  29. Min, T.; Gao, Y.; Huang, X.; Gong, Z.; Li, K.; Ma, S. Effects of aluminum concentration on the formation of inhibition layer during hot-dip galvanizing. Int. J. Heat Mass Transf. 2018, 127, 394–402. [Google Scholar] [CrossRef]
  30. Yang, T.C.; Chin, T.S.; Chang, J.K.; Lin, C.S. Oxidation resistance of Al2O3/SiO2 nanocomposite coating on hot-dip galvanized steel deposited by chemical immersion and sol-gel coating. Surf. Coat. Technol. 2020, 404, 126457. [Google Scholar] [CrossRef]
  31. Lipiäinen, K.; Ahola, A.; Kaijalainen, A.; Björk, T. Fatigue performance and the effect of manufacturing quality on the uncoated and hot-dip galvanized ultra-high-strength steel laser cut edges. Int. J. Fatigue 2022, 164, 107127. [Google Scholar] [CrossRef]
  32. Kumar, R.; Hynes, N.R.J. Prediction and optimization of surface roughness in thermal drilling using integrated ANFIS and GA approach. Eng. Sci. Technol. Int. J. 2020, 23, 30–41. [Google Scholar] [CrossRef]
  33. Pramanik, A.; Islam, M.N.; Basak, A.K.; Dong, Y.; Littlefair, G.; Prakash, C. Optimizing dimensional accuracy of titanium alloy features produced by wire electrical discharge machining. Mater. Manuf. Process. 2019, 34, 1083–1090. [Google Scholar] [CrossRef]
Figure 1. Processed parts.
Coatings 13 00701 g001
Figure 2. Hot dip galvanized parts with centrifugation.
Coatings 13 00701 g002
Figure 3. Hot dip galvanized parts not immersed.
Coatings 13 00701 g003
Figure 4. Galvanic galvanized parts.
Coatings 13 00701 g004
Figure 5. The technological flow specific to hot dip galvanizing and centrifugation.
Coatings 13 00701 g005
Figure 6. Specific technological flow of hot dip galvanizing with priming only.
Coatings 13 00701 g006
Figure 7. Specific technological flow of galvanic galvanizing.
Coatings 13 00701 g007
Figure 8. The technological assembly for measuring the parts.
Coatings 13 00701 g008
Figure 9. Salt spray cabinet SF/450/CASS and the parts during the corrosion test.
Coatings 13 00701 g009
Figure 10. Diagrams for the experiment, measurements, and analysis of the experimental data.
Coatings 13 00701 g010
Figure 11. Histogram of the data measured after machining by turning.
Coatings 13 00701 g011
Figure 12. Scatter plot of the measurements of Ra after turning on the sample sections.
Coatings 13 00701 g012
Figure 13. Histograms of Ra measurements after pickling.
Coatings 13 00701 g013
Figure 14. Scatter plot of the Ra measurements after pickling on the sample sections.
Coatings 13 00701 g014
Figure 15. Ra means plot of the surface after hot flux.
Coatings 13 00701 g015
Figure 16. The variation in the surface quality depends on the technology used.
Coatings 13 00701 g016
Figure 17. Plot of fitted model for the Ra variation according to the turning technology.
Coatings 13 00701 g017
Figure 18. (a) Determining the optimal roughness before hot dip galvanizing + centrifuging (HDG+C). (b) Determining the optimal roughness before hot dip galvanizing (HDG). (c) Determining the optimal roughness before zinc plating (ZP).
Coatings 13 00701 g018
Figure 19. Variation in the surface roughness Ra according to the phases of the galvanizing technology.
Coatings 13 00701 g019
Figure 20. Sample surface with Ra = 0.435 μm (f1 = 0.14 mm/rot) and Ra = 6.323 μm (f5 = 0.6 mm/rot), which were obtained after turning.
Coatings 13 00701 g020
Table 1. Combinations of cutting parameters established according to the full factorial experiment.
Spindle Speed (rpm)Feed (mm/rot)Desired Roughness after Turning Ra (µm)Average Roughness Obtained after Turning Ra (µm)Part Section
18000.140.8—specific to the finish0.6845
0.21.6—specific to the finish1.5124
0.322.52.4883
0.43.2—specific to the semifinished3.6352
0.66.3—specific to roughing5.7211
Table 2. Gantt chart of activities.
TechnologiesSample
Turning S1S2S3S4S5S6S7S8S9
ControlRa measurement, diameter, diameter tolerance
Pickling + fluxS1S2S3S4S5S6
ControlRa measurement, diameter, diameter tolerance
Hot dip galvanizingS1S2S3
Hot dip galvanizing and centrifugation S4S5S6
Electrolytic galvanizing S7S8S9
ControlRa measurement, diameter, diameter tolerance
Saline mist testDetermination of corrosion resistance.
Conclusions regardingHot dip galvanizingHot dip galvanizing and centrifugationElectrolytic galvanizing
ConclusionsComparison of technologies
Table 3. Features of the Mitutoyo SURFTEST SJ-210 surf test.
Mitutoyo SURFTEST SJ-210—Technical Data
Coatings 13 00701 i001
Display resolution:0.001 µm
Measurement unitsmm
Measurement standardISO 4287:1997
FilterGauss
Sampling Lengthλc = 0.8 mm
Number of Cut-OffsN = 5
Evaluation length 4 mm
Measuring speed0.5 mm/s
Table 4. RA-7312 measuring arm specifications.
Measuring range1.2 m/3.9 ft.
Point repeatability0.014 mm/0.0006 in.ASME B89.4.22
Volumetric accuracy±0.025 mm/0.0010 in.
MPEp8 µmISO 10360-2
MPEe5 + L/40 ≤ 18 µm
Table 5. Centralization of Ra measurements after turning.
Ra (µm)Standard Uncertainty of the Mean Ra
Samplef1f2f3f4f5Mean Ra (µm)Std. dev. (µm)u (Ra) (µm)
S10.5711.5112.6323.6495.8932.4512.0540.919
S20.6061.3992.5423.6725.8242.3972.1210.948
S30.7001.5842.3153.5525.7362.3771.6200.728
S40.7221.4352.5623.7405.4252.5771.5680.713
S50.5471.5772.3753.6605.6772.3671.6630.757
S60.9421.4952.6813.6245.7552.6991.3640.613
S70.6691.5692.3883.5916.0052.6441.6020.718
S80.7161.5662.5533.6825.9932.7021.6550.741
S90.7081.3932.5343.6265.9322.6381.7220.772
Table 6. ANOVA analysis.
SourceSum of SquaresDfMean SquareF-Ratiop-Value
Between groups143.7435.92492528.060.0000
Within groups0.568418400.0142105
Total (Corr.)144.26844
Table 7. Multiple range tests. Method: 95.0 percent LSD.
CountMeanHomogeneous Groups
f190.686778X
f291.50322X
f392.50911X
f493.644X
f595.80444X
ContrastSig.Difference+/−Limits
f1–f2*−0.8164440.113575
f1–f3*−1.822330.113575
f1–f4*−2.957220.113575
f1–f5*−5.117670.113575
f2–f3*−1.005890.113575
f2–f4*−2.140780.113575
f2–f5*−4.301220.113575
f3–f4*−1.134890.113575
f3–f5*−3.295330.113575
f4–f5*−2.160440.113575
* Denotes a statistically significant difference.
Table 8. Centralization of Ra measurements after pickling.
Ra (µm)
Samplef1f2f3f4f5
S10.6561.7372.7603.9165.819
S20.9621.8262.7584.2235.673
S31.4221.9143.0653.9655.525
S41.1422.0222.7664.0025.735
S51.0991.8392.5754.3015.531
S61.0331.8863.1914.2446.203
Table 9. Means with 95.0 percent LSD intervals.
Stand. Error
CountMean(Pooled s)Lower LimitUpper Limit
f161.052330.08454870.9292041.17546
f261.870670.08454871.747541.9938
f362.85250.08454872.729372.97563
f464.10850.08454873.985374.23163
f565.747670.08454875.624545.8708
Total303.12633
Table 10. Variance check.
Testp-Value
Levene’s0.9035090.4769
ComparisonSigma1Sigma2F-Ratiop-Value
f1/f20.2499940.09579076.811030.0552
f1/f30.2499940.2287851.1940.8505
f1/f40.2499940.1658422.272330.3887
f1/f50.2499940.2508690.9930340.9941
f2/f30.09579070.2287850.1753040.0789
f2/f40.09579070.1658420.3336250.2535
f2/f50.09579070.2508690.1457980.0544
f3/f40.2287850.1658421.903130.4971
f3/f50.2287850.2508690.8316880.8447
f4/f50.1658420.2508690.4370110.3848
Table 11. Centralization of Ra measurements for each galvanizing technology studied.
HDG—RaHDG+C—RaZE—Ra
Feed (mm/rot)S1S2S3MediaS4S5S6MediaS7S8S9Media
f1 = 0.141.1881.4481.5021.3791.8412.1791.7031.9070.4460.4330.4250.435
f2 = 0.21.8472.0922.2142.0512.2362.8671.9482.3501.2551.2991.1611.238
f3 = 0.322.9382.6592.6682.7552.7732.2043.0142.6631.9421.8911.9061.913
f4 = 0.43.7463.9423.8583.8483.2783.6903.6553.5413.7253.5983.6953.673
f5 = 0.65.3885.6105.2775.4255.4355.2015.0035.2136.4556.2896.2276.323
Table 12. Centralization of the measured values of the section diameters and deviations from cylindricity on the 9 samples.
PartSection TurningGalvanizingIncrease in Diameter after Galvanizing
DiameterCylindricityDiameterCylindricity ValueAverage per Process
S1
immersion and centrifugation
T122.0330.0122.210.0220.1770.16
T222.0610.00922.2230.0090.162
T322.0810.0122.2330.010.152
T422.0990.01222.2520.0150.153
T522.1350.01322.2870.0150.152
S2
immersion and centrifugation
T122.0330.00822.1780.0570.145
T222.0590.0122.20.0080.141
T322.0780.00922.2320.0770.154
T422.0980.0122.2430.0130.145
T522.1340.02422.2780.0230.144
S3
immersion and centrifugation
T122.0370.00822.2120.0130.175
T222.0670.00922.2360.0220.169
T322.0860.01622.2460.0150.16
T422.0910.01722.2530.0240.162
T522.140.01222.2920.0140.152
S4
only immersion
T122.030.00722.1170.0060.0870.09
T222.0620.00922.1570.0070.095
T322.0850.0122.180.0090.095
T422.0990.01622.1910.0090.092
T522.1440.01422.2280.0150.084
S5
only immersion
T122.030.00822.1220.0060.092
T222.070.00922.1630.0080.093
T322.0770.00922.1680.0130.091
T422.0960.01222.1810.0130.085
T522.1350.01522.2150.0270.08
S6
only immersion
T122.0410.00822.1330.010.092
T222.0630.00722.1610.0140.098
T322.0860.01122.1850.0130.099
T422.1070.01422.2030.0080.096
T522.1460.01522.2360.0180.09
S7
galvanic
T121.9990.00722.0480.0220.0490.03
T222.0240.00822.060.0160.036
T322.0370.00622.0660.0170.029
T422.0620.01222.0850.0190.023
T522.0880.01722.1040.0260.016
S8
galvanic
T122.0030.00322.0460.0190.043
T222.0280.00622.0580.0160.03
T322.0410.00522.070.0120.029
T422.0610.00822.0850.010.024
T522.0880.01422.1020.0220.014
S9
galvanic
T122.0030.00722.0430.020.04
T222.0250.00522.0580.0140.033
T322.0380.00622.0670.0170.029
T422.060.0122.0810.0150.021
T522.0830.01322.10.0220.017
Table 13. Variation in the turned surface after galvanizing.
Pt/Galvanizing TechnologyFeed (mm/rot)Surface after TurningSurface after Galvanizing
S2
Dip galvanized
f1 = 0.14Coatings 13 00701 i002Coatings 13 00701 i003
f2 = 0.2Coatings 13 00701 i004Coatings 13 00701 i005
f3 = 0.32Coatings 13 00701 i006Coatings 13 00701 i007
f4 = 0.4Coatings 13 00701 i008Coatings 13 00701 i009
f5 = 0.6Coatings 13 00701 i010Coatings 13 00701 i011
S5
Galvanized by immersion + centrifugation
f1 = 0.14Coatings 13 00701 i012Coatings 13 00701 i013
f2 = 0.2Coatings 13 00701 i014Coatings 13 00701 i015
f3 = 0.32Coatings 13 00701 i016Coatings 13 00701 i017
f4 = 0.4Coatings 13 00701 i018Coatings 13 00701 i019
f5 = 0.6Coatings 13 00701 i020Coatings 13 00701 i021
Table 14. Corrosion resistance.
No. HoursThe TechnologyPart
Fixation Section 1Section 2Section 3Section 4Section 5
0 hDip galvanizingCoatings 13 00701 i022
Galvanizing + centrifugationCoatings 13 00701 i023
Electrolytic galvanizingCoatings 13 00701 i024
24 hDip galvanizingCoatings 13 00701 i025
Galvanizing + centrifugationCoatings 13 00701 i026
Electrolytic galvanizingCoatings 13 00701 i027
96 hDip galvanizingCoatings 13 00701 i028
Galvanizing + centrifugationCoatings 13 00701 i029
Electrolytic galvanizingCoatings 13 00701 i030
168 hDip galvanizingCoatings 13 00701 i031
Galvanizing + centrifugationCoatings 13 00701 i032
Electrolytic galvanizingCoatings 13 00701 i033
240 hDip galvanizingCoatings 13 00701 i034
Galvanizing + centrifugationCoatings 13 00701 i035
Electrolytic galvanizingCoatings 13 00701 i036
Table 15. The surface of the sample and the structure of the deposited zinc layer depend on the initial roughness obtained by chipping and the applied galvanizing technology.
Galvanizing TechnologyInitial Roughness/Advance
Ra (μm)/Feed (mm/rot)
The Surface of the PieceZinc Layer
HDGRa = 0.435 μm
f1 = 0.14 mm/rot
Coatings 13 00701 i037Coatings 13 00701 i038
Ra = 6.323 μm
f5 = 0.6 mm/rot
Coatings 13 00701 i039Coatings 13 00701 i040
HDG+CRa = 0.435 μm
f1 = 0.14 mm/rot
Coatings 13 00701 i041Coatings 13 00701 i042
Ra = 6.323 μm
f5 = 0.6 mm/rot
Coatings 13 00701 i043Coatings 13 00701 i044
ZPRa = 0.435 μm
f1 = 0.14 mm/rot
Coatings 13 00701 i045Coatings 13 00701 i046
Ra = 6.323 μm
f5 = 0.6 mm/rot
Coatings 13 00701 i047Coatings 13 00701 i048
Disclaimer/Publisher’s Note: The statements, opinions and data contained in all publications are solely those of the individual author(s) and contributor(s) and not of MDPI and/or the editor(s). MDPI and/or the editor(s) disclaim responsibility for any injury to people or property resulting from any ideas, methods, instructions or products referred to in the content.