Article

Experimental Study on Bond Behavior between Steel Rebar and PVA Fiber-Reinforced Concrete

College of Civil Engineering, Xiangtan University, Xiangtan 411105, China
*
Author to whom correspondence should be addressed.
Coatings 2023, 13(4), 740; https://doi.org/10.3390/coatings13040740
Submission received: 15 March 2023 / Revised: 1 April 2023 / Accepted: 3 April 2023 / Published: 5 April 2023

Abstract

:
An experimental test was performed to study the bond behavior between steel rebar and concrete reinforced by polyvinyl alcohol (PVA) fibers. Twenty specimens were prepared and subjected to the pull-out test. Four different fiber volume contents (0%, 0.2%, 0.4%, and 0.6%) were considered and the concrete with the strength grade of C35 was designed in the present study. The effects of PVA fibers, rebar diameter, and cover depth on bond behavior were clarified. The effects of PVA fibers on the mechanical property of concrete were also studied. The results show that PVA fibers decreased the compressive strength of concrete, but increased splitting tensile, flexural, and direct tensile strength. PVA fibers negatively affected bonding in the ascending branch both for the pull-out and the splitting failure cases, but improved the bonding in the descending branch after peak stress for the splitting failure case. In the present test, the maximum decrement of bond strength was about 16.2% for specimens with less than 0.6% PVA fibers. PVA fibers restricted both the macro-cracking and micro-cracking for the splitting cases, the former were much more significant than the latter. The effects of rebar diameter and cover depth on bonding became slight and significant with the increasing content of PVA fibers, respectively.

1. Introduction

Polyvinyl alcohol (PVA) fibers are a kind of organic synthetic material, which has many advantages compared with other fiber materials. PVA fibers have high strength and ductility with a relatively high elastic modulus, outstanding resistance to corrosion without toxicity, high hydrophilicity in alkaline environments in concrete, strong bonding with cement matrix, low cost, and effective restriction of cracking of concrete over the long term [1,2,3,4]. PVA fibers have been widely used in many applications in civil engineering such as the fiber-cement used as an asbestos replacement, Engineered Cementitious Composites (ECC), strengthening of enlarged sections for concrete structures, and various kinds of shotcrete, and play a promising role in fire resistance, toughening, and anti-cracking in concrete [5].
Extensive work has been carried out to investigate the effects of PVA fibers on the mechanical properties of concrete. It has been reported that PVA fibers increased the splitting tensile strength and flexure strength of concrete compared to plain concrete [6,7,8,9]. The addition of PVA fibers slightly affects the pre-cracking behavior of concrete but substantially improved the post-cracking response, enhancing the ductility and toughness [10,11,12]. Nuruddin et al. [13,14] studied and compared the effects of PVA fibers on the static and dynamic behavior of concrete and structures. They found that the static behaviors of concrete were improved while the dynamic properties were not affected by a low content of PVA fibers [13]. PVA fibers, however, improved the ductility and damping ratio of the concrete beams under four-point loading cases [14]. Some works have also been performed to study the durability of PVA fiber-reinforced concrete. It was reported that PVA fibers enhanced the frost resistance, carbonization resistance, and fatigue life of concrete [15,16,17,18]. Zhou et al.’s study showed that the addition of PVA fibers can enhance the strain capacity and crack resistance of ECC under uniaxial tensile [19]. In addition, Ayub et al. added PVA fibers to FRC to increase the optimal compressive strength strain from 9.08% to 19.62% [20]. Nowadays, however, very few works have been performed to clarify the effects of PVA fibers on bond behavior between concrete and steel rebars.
The bonding between concrete and steel rebars is a key factor for concrete structures, which relates to the design, construction, and behavior of structures [21,22,23,24,25]. In the past few years, many works have been performed to study the bond performance between steel rebar and fiber-reinforced concrete [26,27,28,29,30,31]. Most of these works, however, focused on cases with steel fibers and steel–PVA hybrid fibers. Some of these reported that the addition of steel fibers resulted in more ductile bond behavior and the bond strength increased with increasing content of steel fibers [32]. While others hold that the addition of fibers showed no measurable effect or even a passive effect on bond strength [33]. There is still a disagreement about the effects of steel fibers on bond behavior. For the case of steel–PVA hybrid fibers, most of the works showed an obvious positive effect on bond strength due to the synergetic influences in inhibiting the cracking at multiple scales and stages [34,35]. The material properties and the mechanism of single PVA fibers (only PVA fibers) are different from that of steel fibers or hybrid fibers, resulting in a difference in bonding mechanism. The effects of single PVA fibers on the bond behavior between concrete and steel rebar are still not well understood.
In this paper, an experimental test is proposed to study the effects of PVA fibers on the bond behavior between rebar and concrete. Twenty pull-out specimens were prepared and subjected to a bonding test. The effects of PVA fibers, rebar diameter, and cover depth on bond behavior were clarified. Several conclusions are drawn based on the study.

2. Experimental Program

2.1. Pull-Out Specimens

Twenty pull-out specimens were prepared for the test. The specimens were designed as a steel rebar embedded inside a 150 mm × 150 mm × 150 mm concrete cube. The steel rebars were 360 mm long with an equal embedment length in the concrete for all the specimens. The embedment length was 60 mm, which was achieved using two pieces of PVC tubing installed adjacent to the embedment region to avoid the contact between the concrete and the bar, as shown in Figure 1.
The factors considered in the test included four fiber volume contents (0%, 0.2%, 0.4%, and 0.6%), three rebar diameters (12 mm, 14 mm, and 16 mm), and three concrete cover thicknesses (30 mm, 50 mm, and 70 mm). It should be noted that the concrete cover depths were 69 mm, 68 mm, and 67 mm for specimens with 12 mm, 14 mm, and 16 mm rebars in the center region, respectively. The three cases were defined as the specimens with concrete cover depths of 70 mm.
The specimens designations consist of three parts. The first part indicates the PVA fiber volume ratio where 0, 0.2, 0.4, and 0.6 indicated the fiber volume contents of 0%, 0.2% 0.4%, and 0.6%, respectively. The second part of the specimen label references the rebar diameters. The third part marks the concrete cover depths. For example, PVA0.2-d12-c70 indicates that the fiber volume content is 0.2%, the rebar diameter is 14 mm, and the concrete cover depth is 70 mm. The details of the specimens are listed in Table 1.

2.2. Materials and Mixture Design

Ordinary Portland cement, coarse aggregate, local river sand, water, and polycarboxylate superplasticizer were used in the present study. The cement employed in the test was 42.5 ordinary Portland cement. The coarse aggregate was continuously graded crushed stone with a maximum aggregate size of 20 mm. The fine aggregate was natural siliceous sand from the Xiangjiang River in China. The fineness modulus of the sand was 1.82. PVA fibers produced by Kuraray in Japan were used in the present test, as shown in Figure 2. The length and diameter of the fiber were 12 mm and 39 μm, respectively. The tensile strength and the elastic modulus were 1.6 GPa and 42 GPa, respectively. Grade 400 strength ribbed rebars were employed with different diameters. In addition, the tested yield strength (fy) and ultimate tensile strength (fu) were 454 and 521 MPa for the 12 mm rebar, 439 and 585 MPa for the 14 mm rebar, and 494 and 615 MPa for the 16 mm rebar.
All the specimens had a similar mix proportion of cement, water, water-reducing agent, coarse aggregate, and fine aggregate with the different contents of PVA fibers. The content of cement was 485 kg/m3. The water/cement ratio was 0.42. The contents of coarse aggregate and fine aggregate were 1092 kg/m3 and 619 kg/m3, respectively. The ratio of the coarse aggregate to the fine aggregate was 1.76. The content of the water-reducing agent was 0.8% of the cement. The water-reduction efficiency was 26%.
The concrete mixtures were prepared in a forced mixer. The cement, fine aggregate, and coarse aggregate were first mixed thoroughly for 2 min. Then, 70% of the water and water-reducing agents were added to the mixture and then the remaining 30%. After each addition, the mixtures were mixed for 1 min. After that, the PVA fibers would be gradually dispersed into the mixture and mixed for another 2 min. In the present test, all the specimens with the same content of PVA fibers were cast using the concrete mixture from the same batch, i.e., a total of four batches of the concrete mixture were prepared. Additionally, the PVA fibers were found to be uniformly distributed in the concrete mixtures in the present test by using the mixing program.
The concrete slump was employed to measure the fluidity of fresh concrete mixtures. The tested slumps of the four batches of concrete mixtures were 180 mm, 102 mm, 45 mm, and 12 mm, respectively. The content of PVA fiber in the four batches was 0%, 0.2%, 0.4%, and 0.6%, respectively. The slump decreased by about 93% when the content of PVA fibers increased from 0% to 0.6%. This indicated that the content of PVA fibers significantly affected the fluidity of the fresh concrete. The same phenomenon had also been reported by many other researchers [36]. The reasons could be attributed to the rough surface of PVA fibers, leading to significant friction between the fibers and cement mortar.
The pull-out specimens with the same content of PVA fibers were cast with the concrete mixture from the same batch. Meanwhile, some samples used for mechanical properties tests were also prepared by using the concrete mixture from the same batch (see details in the following section). All these specimens were demolded after 24 h and cured at a temperature of 20 ± 2 °C and relative humidity (RH) of 95%. After 28 days of curing, these specimens would be subjected to the mechanical property tests and pull-out test.

2.3. Mechanical Property of PVA Fiber-Reinforced Concrete

The compressive strength, splitting tensile strength, flexural strength, and direct tensile strength were tested for the four batches of concrete mixtures with different contents of PVA fibers. The compressive strength, splitting tensile strength, and flexural strength tests were tested based on the standard of GB/T 50081-2019 while the direct tensile strength was tested based on the method suggested by Dashti J [37]. Cubes with 150 mm length were used to test the compressive strength and splitting tensile strength of concrete. Prisms with 100 mm × 100 mm cross-section and 400 mm length were used to test the flexural strength. Dog-bone-shaped specimens were used to determine the tensile strength under monotonic axial tension. The middle part of the specimens is 100 mm wide, 100 mm thick, and 150 mm in length. Three samples were prepared and tested, and the mean value was reported. The details of the samples and the test set-up are shown in Figure 3.
Figure 4 shows the compressive strength, splitting tensile strength, flexural strength, and direct tensile strength of specimens with different contents of PVA fibers. PVA fibers showed different influences on these ultimate strengths. The compressive strength of the specimens gradually decreased with the increasing content of PVA fibers. For instance, the compressive strength decreased about 4.4%, 12.3%, and 6.9% for specimens with 0.2%, 0.4%, and 0.6% PVA fibers compared with the specimens without PVA fibers, respectively. The addition of the PVA fibers, however, improved the splitting tensile strength, flexural strength, and direct tensile strength of the specimens, as shown in Figure 4b. The splitting tensile strength, for example, increased about 21.38%, 25.72%, and 33.70% for specimens with 0.2%, 0.4%, and 0.6% PVA fibers compared with the specimens without PVA fibers, respectively.
It was interesting to note that the increase in splitting tensile strength was much greater than that of the flexural strength and direct tensile strength. The increase in direct tensile strength were about 5.26%, 8.77%, and 14.03% for specimens with 0.2%, 0.4%, and 0.6% PVA fibers, respectively. The corresponding increase in flexural strength were 4.82%, 12.65%, and 14.76%. The increases were small compared with the increase in splitting tensile strength. This could be attributed to the reliable anchorage of PVA fibers under the compressive force for the case of the splitting tensile test. It was difficult to pull out the PVA fibers which improved the splitting tensile strength.

2.4. Pull-Out Test of Specimens

The pull-out test was carried out by using an MTS machine with a maximum axial force capacity of 100 kN. A special loading frame was designed for the present test, as shown in Figure 5. The loading end of the specimens and the loading frame were fixed by the upper and lower clamps of the MTS, respectively. The position of the upper plate of the loading frame can be adjusted to contact the specimen surface, which was used to minimize the effect of uneven stress and to prevent unexpected lateral movement of the specimens during the loading process. The pull-out force was automatically measured by the test machine. The relative slip between the steel bar and concrete was measured by an extensometer clamped at the free end of the specimens. Additionally, a dial indicator was set transversely on the specimen surface to measure the development of the crack during the loading test.
The pull-out tests were monotonically loaded using a displacement-control mode at a speed of 1 mm/min. The experimental data, including the pull-out force, relative slip, and crack width, were synchronously collected with a frequency of 1 s. The tests would be stopped as the specimens split or the residual pull-out force became constant. It should be noted that, in this study, the slip measured at the free end was used to represent the slip characteristics of the specimen. Additionally, the average bond stress along the embedded length of rebar was used to represent the stress characteristics, which can be expressed as
τ = F π d L
where F is the measured pull-out force; d is the nominal diameter of the steel bar; and L is the embedded length of the steel bar in the concrete.

3. Bond Behavior between Rebar and PVA Fiber-Reinforced Concrete

The test results of the pull-out specimens, including the failure mode, the bond stress at onset slip of free end τons, residual bond stress τr, maximum bond stress τmax, and slip corresponding to the maximum stress S0 are summarized in Table 2. It should be noted that τr is the bond stress corresponding to the slip of 0.45 times of the spacing between steel ribs, which was proposed by Zhao et al. [38]. The bond stress–slip curves for all the specimens are shown in Figure 6.

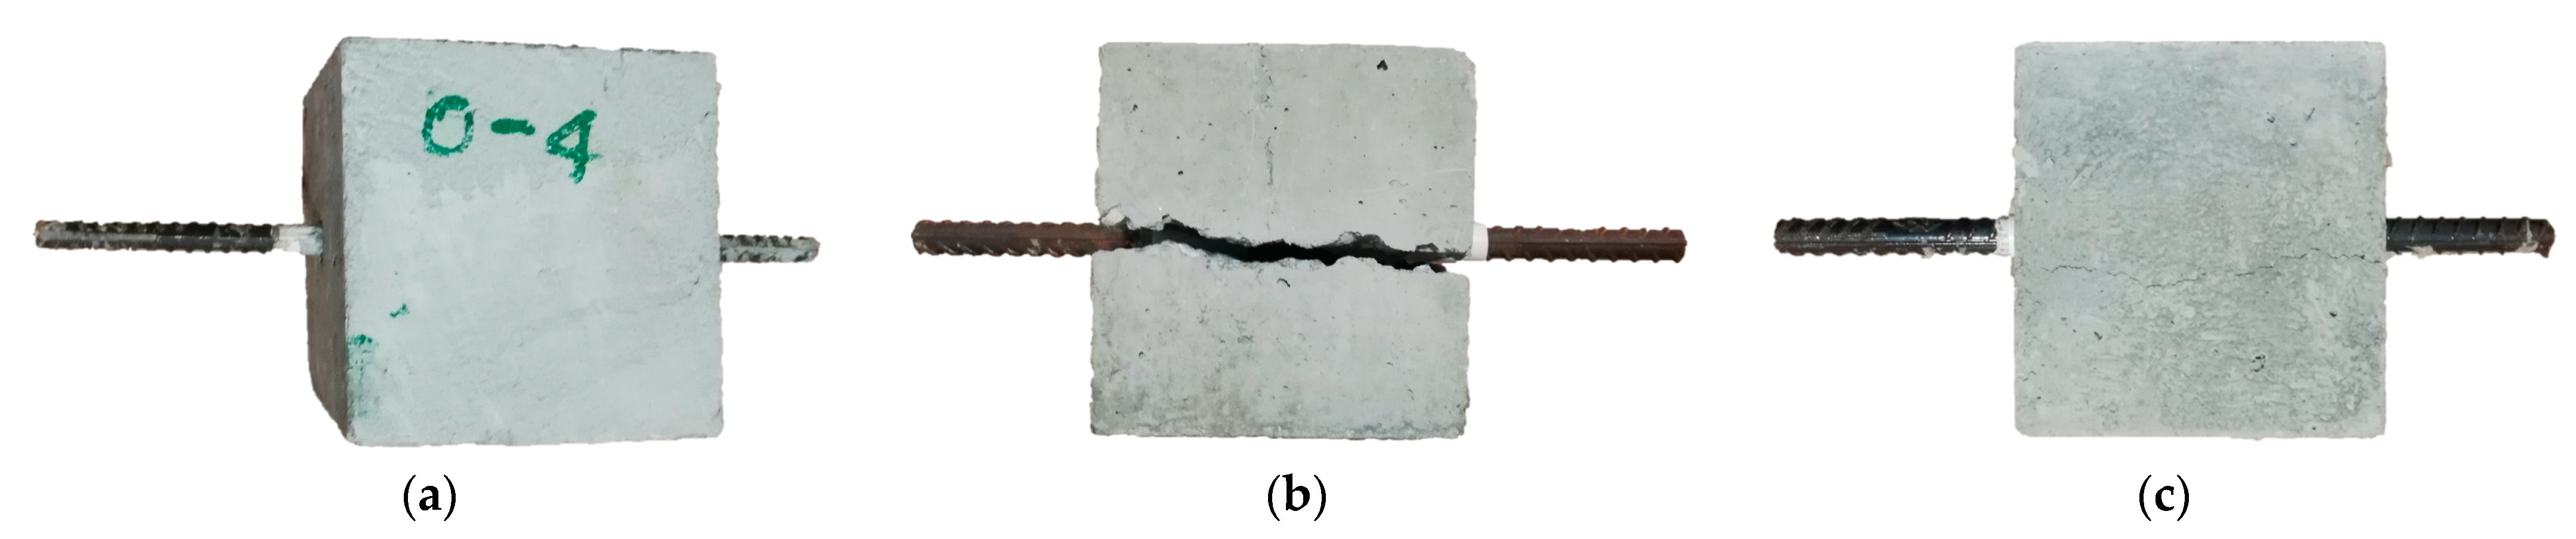
3.1. Failure of Pull-Out Specimens

Three different failure modes were observed in the present test: pull-out failure, splitting failure, and splitting–pull-out failure. For the first failure mode, the specimens failed gradually as the steel rebar was pulled out without concrete cracking. In this case, the bond stress–slip curves contained typical three-branch characteristics including ascending, descending, and residual branches. For the second failure mode, the specimens failed suddenly as the splitting of the concrete was accompanied by a loud crash. Afterwards, the concrete members were completely broken apart. The bond stress–slip curves of the contents only contained the ascending branch. For the third mode, the specimens maintained integrity and the bond stress was not completely lost after the splitting of the concrete. In this case, the bond stress–slip curve contained the typical three-branch characteristics and showed a quasilinear degeneration in the descending branch. The final failure of these three modes are shown in Figure 7.
The failure modes of all specimens are summarized in Table 1. It can be found that the ratio of cover depth to steel rebar diameter (c/d) significantly affected the failure mode of the specimens. The d12-c70 series specimens (with a rebar diameter of 12 mm and cover depth of 70 mm) and the d14-c70 series specimens (with a rebar diameter of 14 mm and cover depth of 70 mm) failed by the pull-out mode. The corresponding ratios of cover depth to steel rebar diameter were 5.75 and 4.86, respectively. For the other specimens, the ratios of cover depth to steel rebar diameter were less than 4.19. Most of these specimens failed by splitting mode or splitting–pull-out mode except for some specimens with additional PVA fibers. This indicates that specimens are more prone to pull-out failures if the ratio of cover depth to rebar diameter is greater than 4.86. This is consistent with the results reported in previous research studies [39]. It was concluded that the specimen were more prone to pull-out failure rather than splitting failure when the ratio of cover depth to rebar diameter was greater than 4.5~5.
The addition of PVA fibers showed a positive effect on the failure of specimens with a small ratio of cover depth to rebar diameter. As summarized in Table 1, the d12-c50 series specimens and d16-c70 series specimens have similar ratios of cover depth to rebar diameter, which are 4.17 and 4.19, respectively. The failure mode of these specimens changed with the increase in the addition of PVA fibers. For the d12-c50 series, the plain specimen failed by the splitting–pull-out mode while the other fiber-reinforced specimens failed by the pull-out mode. For the d16-c70 series, specimens with 0% and 0.2% PVA fibers failed by the splitting mode. The failure changed to the splitting–pull-out mode as the PVA fibers increased to 0.4% and 0.6%. The bridging effect of PVA fibers delays the appearance and propagation of cracks, which improves the damage tolerance of the concrete and changes the specimens’ failure in a more ductile way.
In addition, the rebar diameter also showed a significant effect on the failure of specimens with ratios of cover depth to rebar diameter less than 4.5~5. All the d12-c30 series specimens failed by the splitting-pull-out mode. The corresponding ratio of cover depth to rebar diameter is 2.5. However, some of the d16-c70 series specimens with a high ratio of cover depth to rebar diameter (c/d = 4.19) failed by the more brittle splitting mode. This indicates that for specimens with a low ratio of cover depth to rebar diameter, the rebar diameter, i.e., the height of the rib, plays an important role in its failure modes. Large diameter rebars with a high rib lead to greater expansion stress during the pull-out procedure, easily resulting in the splitting of the specimens.
After the pull-out test, the specimens were split apart to visually inspect the damage of the rebar and concrete. The split parts were similar for all the specimens. Typical split parts are shown in Figure 8, which come from splitting failure specimen PVA0.2-d16-c70. The concrete between the ribs of steel rebar was smashed while no damage was found on the rebars for specimens that failed by pull-out and splitting. This indicates that the failure of all the specimens is started by the trapping of concrete particles between the rebar ribs. For the pull-out case, the concrete within the ribs would be totally polished by the rebars. For the splitting case, the further slip would cause the splitting of the concrete cover, which is restricted by PVA fibers. In the present test, PVA fibers were found to be pulled out rather than pulled off (see details in Figure 8c). In addition, it can be seen from Figure 8c that the obvious PVA fiber bridging effect limited the development of cracks, thus improving the performance of the concrete.

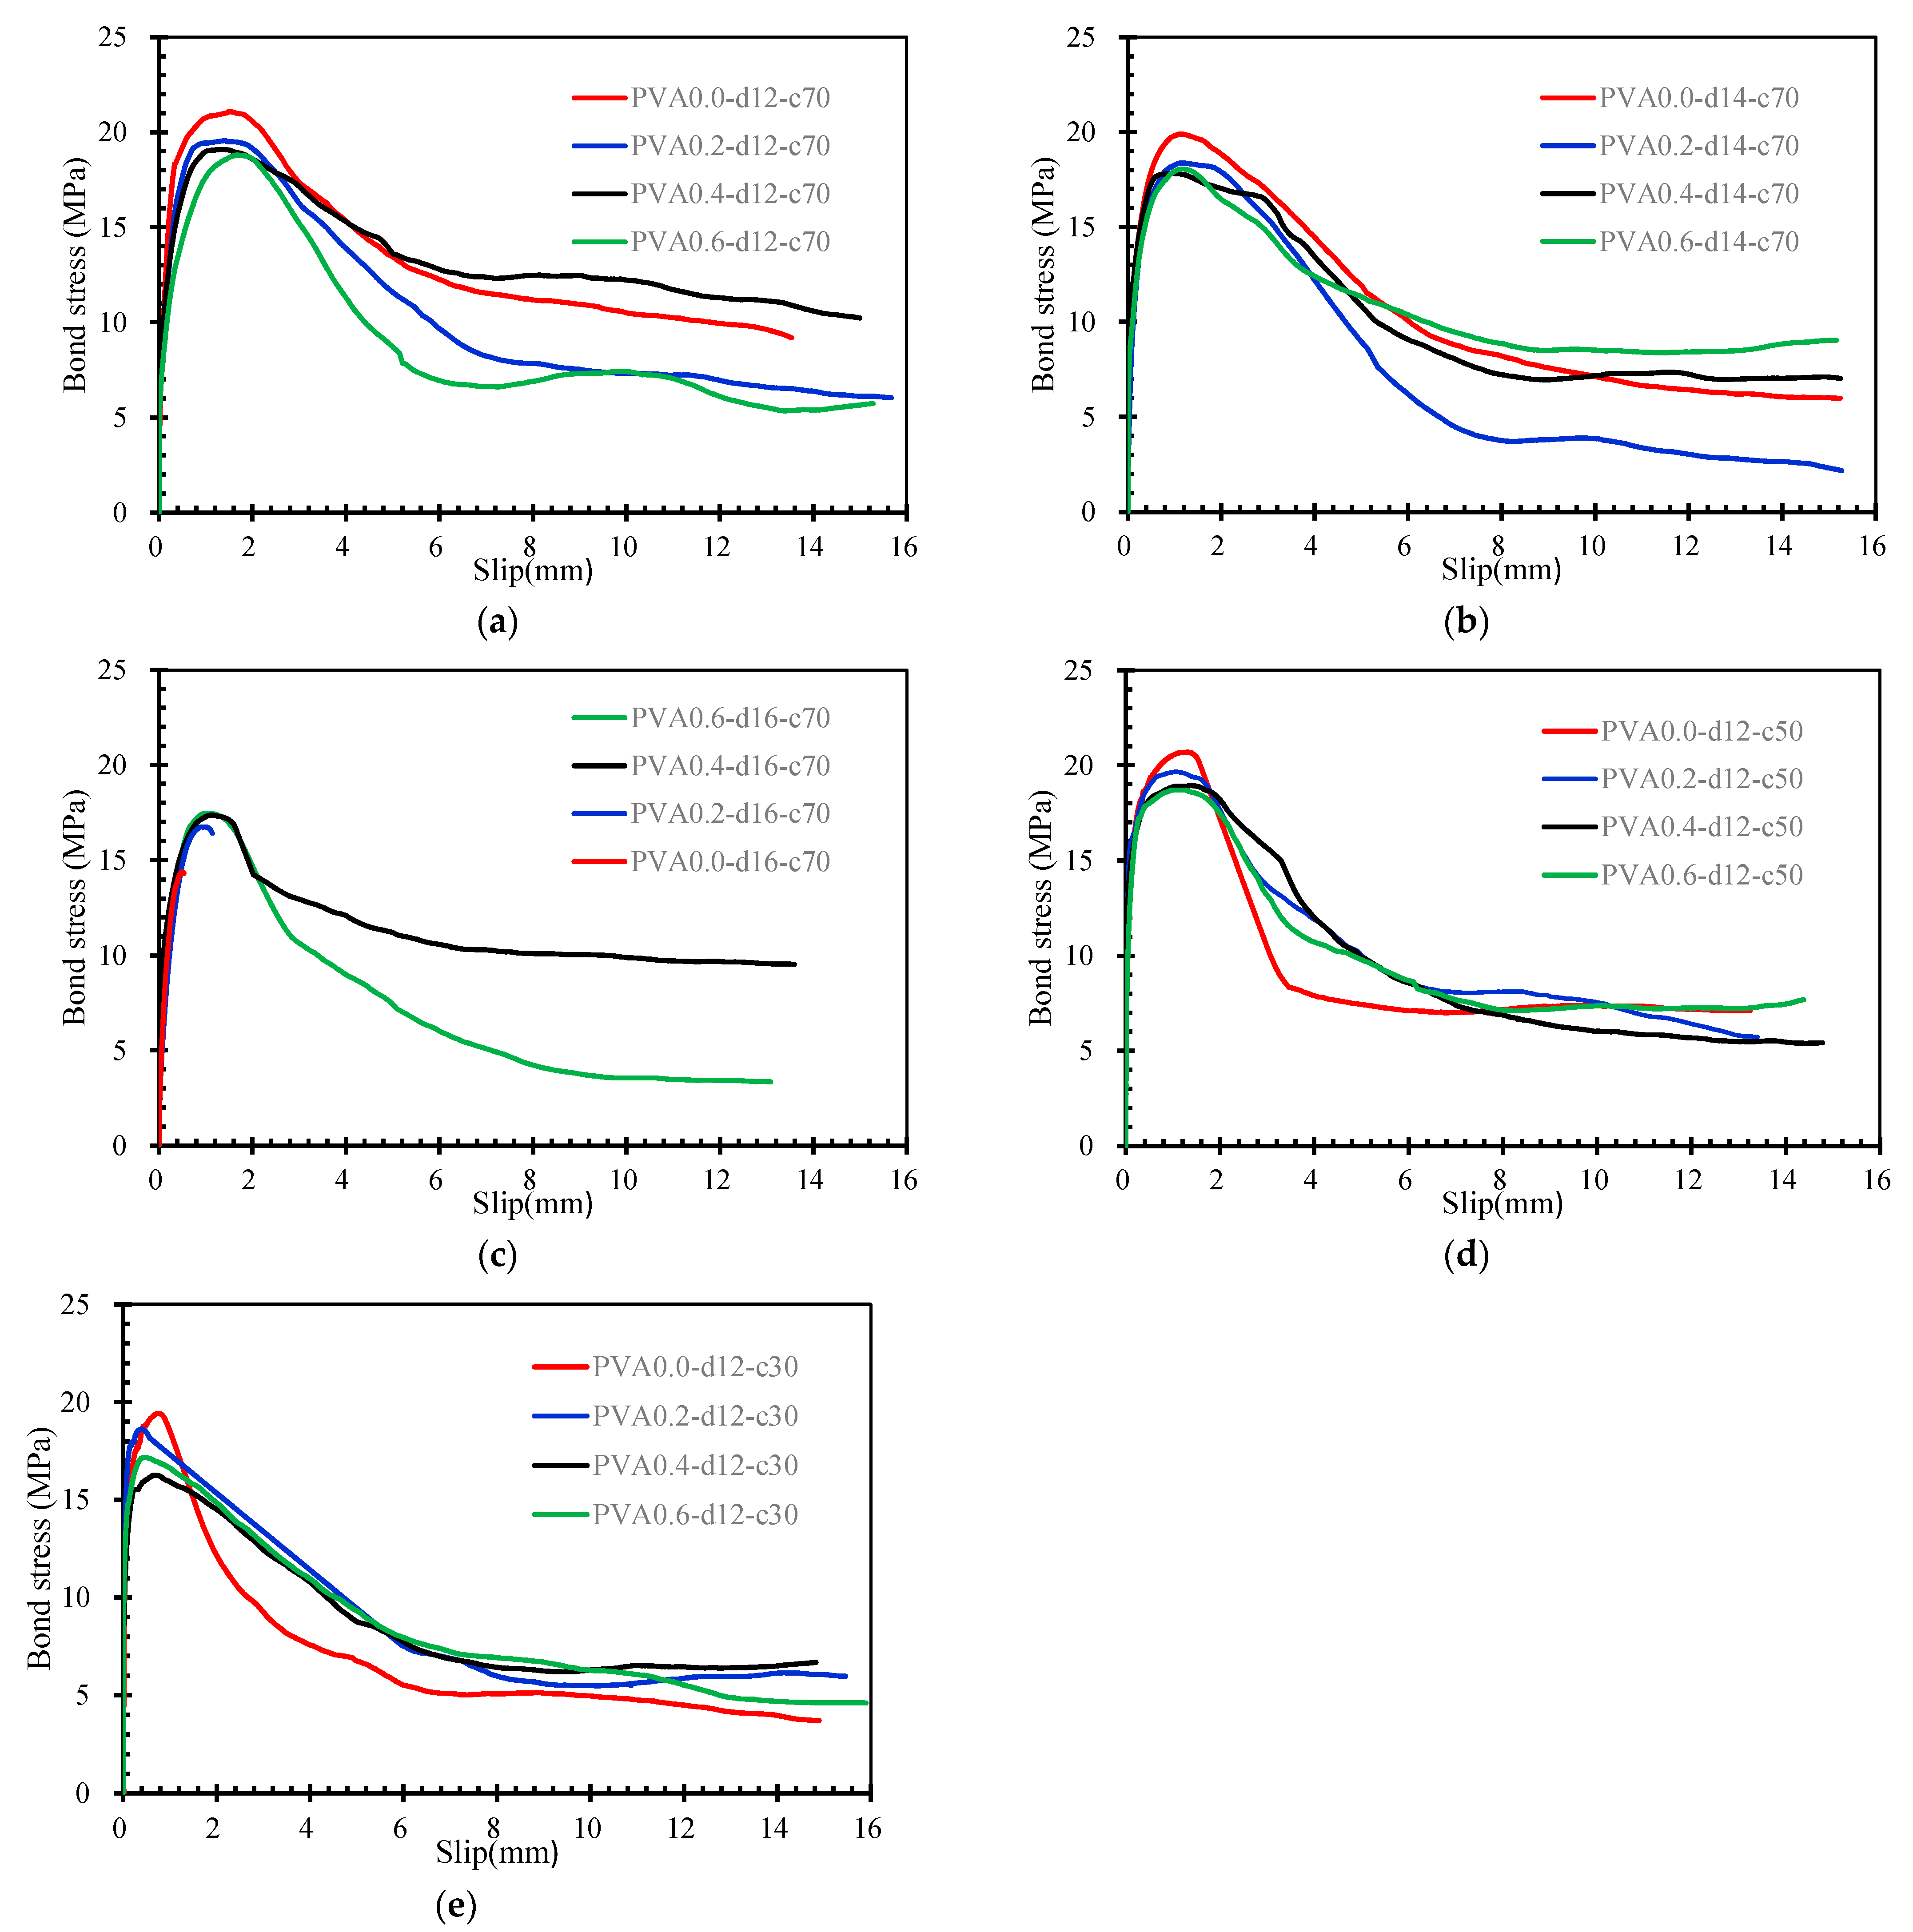
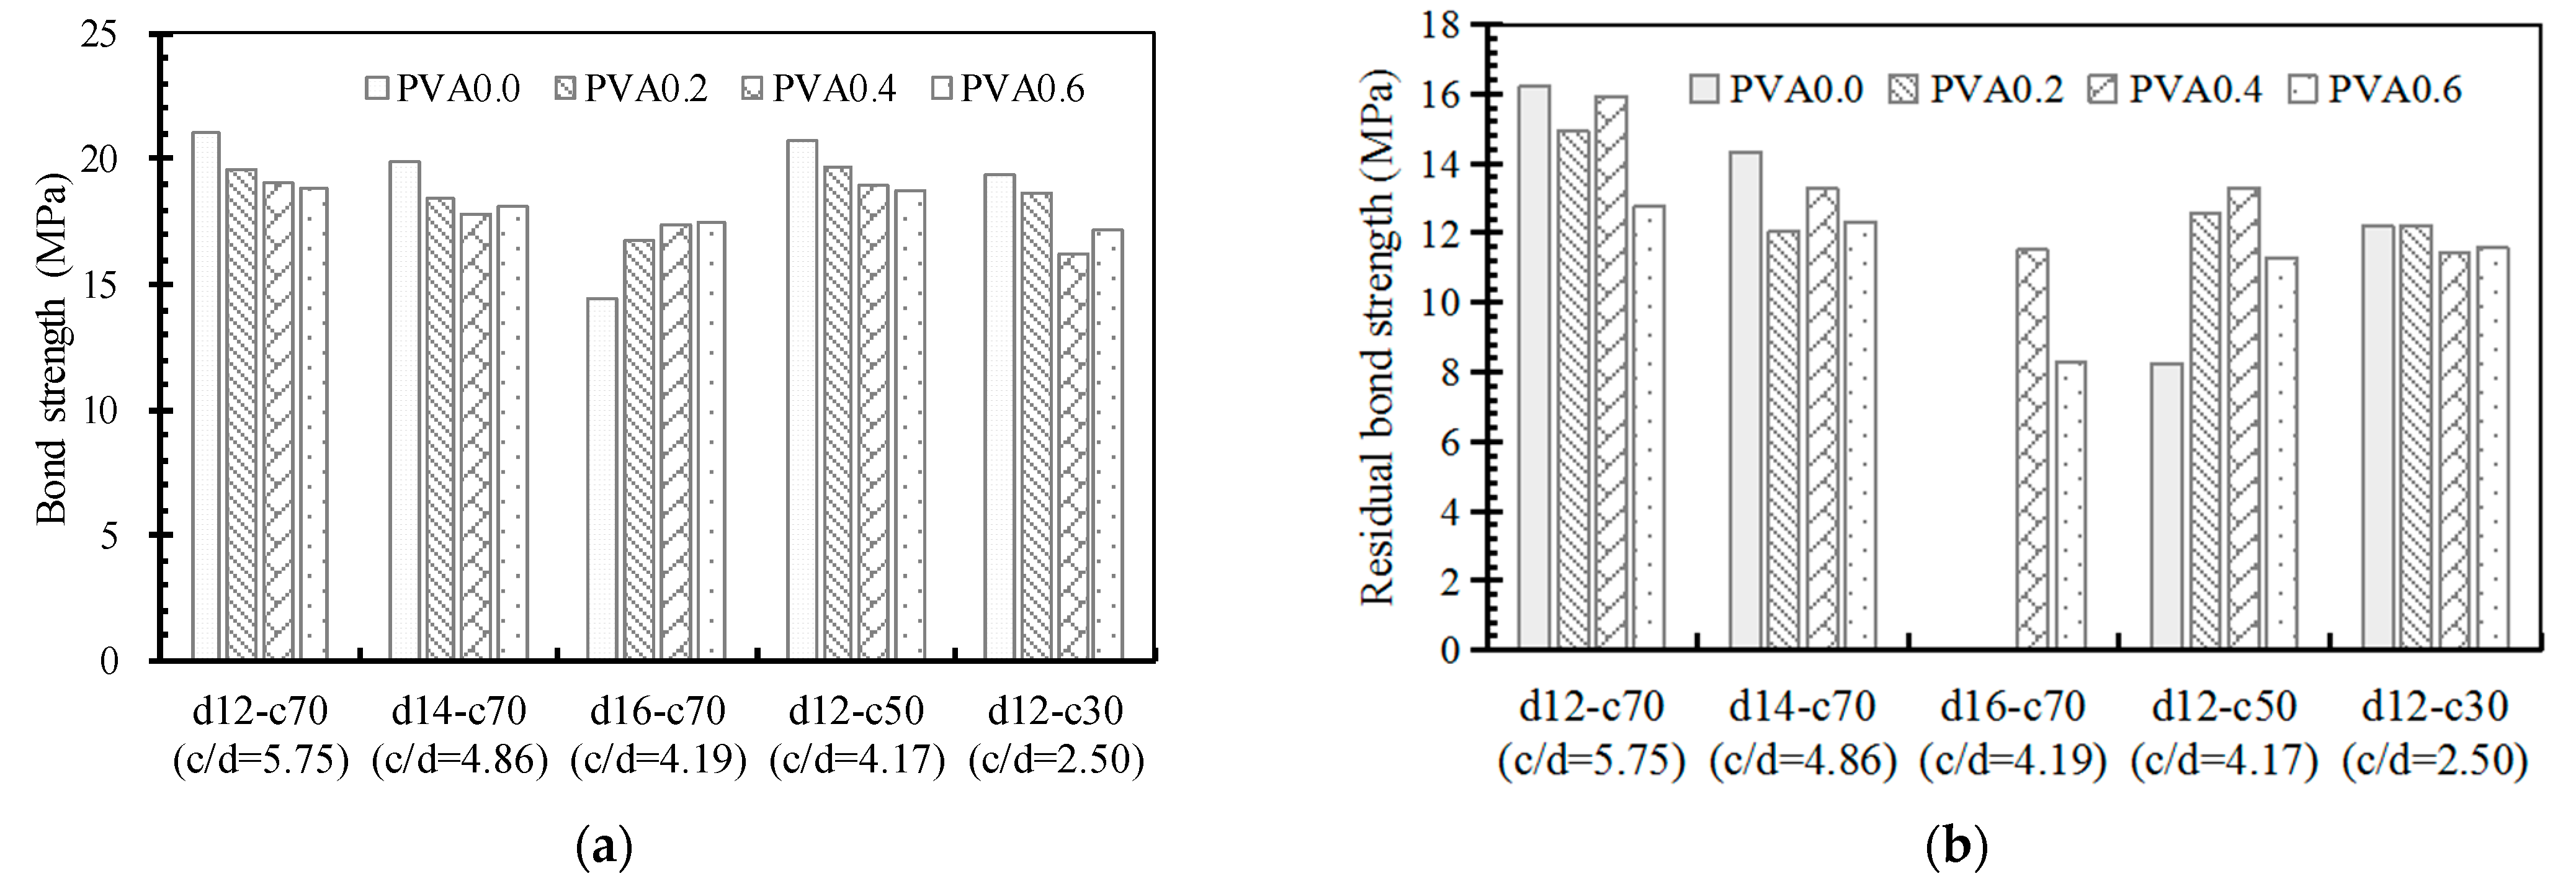
3.2. Effects of PVA Fibers

Figure 6 shows the bond stress–slip curves for specimens with different contents of PVA fibers. As mentioned before, the curves are significantly affected by the failure modes, i.e., the ratio of cover depth to rebar diameter. Moreover, the addition of PVA fibers also showed a significant effect on the bond stress–slip curves. The slope of the ascending branch and the bond strength decreased with the increase in PVA fibers. The slope of the ascending branch reflects the bond stiffness of the sample, which is mainly determined by the shear action between the concrete and the rib. According to Section 2.2, the addition of polyvinyl alcohol fiber would lead to a decrease of the flow performance of newly mixed concrete, which would affect the compactness of concrete, thus reducing the shear effect between the concrete and reinforcement, and ultimately leading to the decline of the bond strength between the concrete and reinforcement. The same phenomenon has been reported by many other researchers [40,41]. The details of the bond strengths of the specimens are shown in Figure 9a. All the specimens showed a descending trend in bond strength with the increase in PVA fibers except the d16-c70 series specimens. In this experiment, the maximum bond strength decrease of the d12-c30 series samples, d12-c50 series samples, and d12-c70 series samples with the increase in PVA fiber content was about 16.2%, 9.6%, 10.3%, and 10.4%, respectively. In the d16-c70 series, the additional of PVA fibers changed the failure of the specimens from the splitting mode to splitting–pull-out mode, which increased correspondingly the bond strength with a maximum increase of about 21.3%. In general, the addition of PVA fibers showed a negative effect on bond stiffness and bond strength between the rebar and concrete for both pull-out and splitting cases. The details of the residual bond strength of the samples are shown in Figure 9b. Similarly, except for the d12-c50 series of samples, the residual bond strength of all samples decreased with the increase in PVA fibers, and the maximum decrease was about 27.9%. This indicates that the content of PVA fibers has a more adverse effect on the residual binding strength of samples. It can be clearly seen from Figure 6 that for the PVA0.0-d16-c70 and PVA0.2-d16-c70 samples, due to the lack of effective restraint in the concrete, splitting failure occurred immediately after reaching the peak load, and then the load rapidly dropped to 0. Therefore, the bond stress–slip curve did not decline and the residual bond strength was 0.
The slip corresponding to maximum bond stress and the bond stress at the onset of free end slip for specimens with different contents of PVA fibers are shown in Figure 10 and Figure 11, respectively. It can be found that the PVA fibers had negligible effects on the corresponding slip to maximum bond stress and the bond stress at the onset of slip. For each series of specimens with the same cover depth and rebar diameter, the changes in the slip and the onset bond stress did not correspond with the increase in PVA fibers. The slip corresponding to maximum bond stress, however, was more significantly affected by the ratio of cover depth to rebar diameter, i.e., the failure mode of specimens. The specimens that failed by pull-out mode usually had a large corresponding slip. The smaller the ratio of cover depth to rebar diameter, the smaller the corresponding slip. The bond stress at the onset of slip seemed to be further affected by the diameter of the rebars. The pull-out failure specimens had similar onset bond stresses. The splitting failure specimens had high onset bond stresses for cases with small rebar diameters. The details are discussed in the following sections.
The additional PVA fibers, however, had a positive effect on the descending branches for specimens that failed by the splitting–pull-out mode. Figure 6e shows the bond stress–slip curves for the d12-c30 series specimens. The bond stress decreased very rapidly in the descending branch for the plain specimen without additional PVA fibers. The decrease in bond stress in the other fiber-reinforced specimens, however, became slow. Additionally, the decrease in bond stress seemed to be linear with the increase in slip. This indicates that PVA fibers can restrict the degradation of bond stress in a linear manner for splitting–pull-out failure specimens. This could be attributed to the bridging effects of PVA fibers after the splitting of the specimens, which effectively restrained the cracking and slowed down the decrease in bond stress.
Figure 12 shows the propagation of splitting cracks for the d12-c30 series specimens. For the plain specimens, the splitting crack appeared at low load stress and gradually propagated with the increase in applied load stress. There was a sudden widening in cracking and the width rapidly increased to a greater value after the peak load stress. Afterwards, the splitting crack was almost unchanged during the further load procedure. The propagation of splitting cracks in the specimens with 0.2% PVA fibers was similar to that of the plain specimen, but with a narrow crack at the end. For specimens with 0.4% and 0.6% PVA fibers, the load stresses corresponding to the appearance of splitting cracks significantly increased. Additionally, there was no sudden widening of the cracks after the peak load stress. The final crack width became much narrower compared to that on the plain specimen. PVA fibers play a positive effect in restricting the splitting cracks.
The details about the comparison of cracking load stress and maximum crack width for specimens with different contents of PVA fibers are shown in Figure 13. Specimens with 0.2%, 0.4%, and 0.6% PVA fibers had increased cracking load stress by about 8.37%, 31.44%, and 42.43% and decreased the final crack width by about 36.23%, 59.02%, and 65.08%, respectively. The changes in the final crack width were more obvious. This indicates that the PVA fibers restrict both the micro-cracking and macro-cracking of specimens that failed by splitting. The restriction effect on macro-cracking seemed much more significant than that on micro-cracking. In the process of steel bar pull out, with the increase in stress, the PVA fibers effectively bridged the cracks generated by the steel bars in the process of concrete pull out, and the bridge effect diagram is shown in Figure 14.

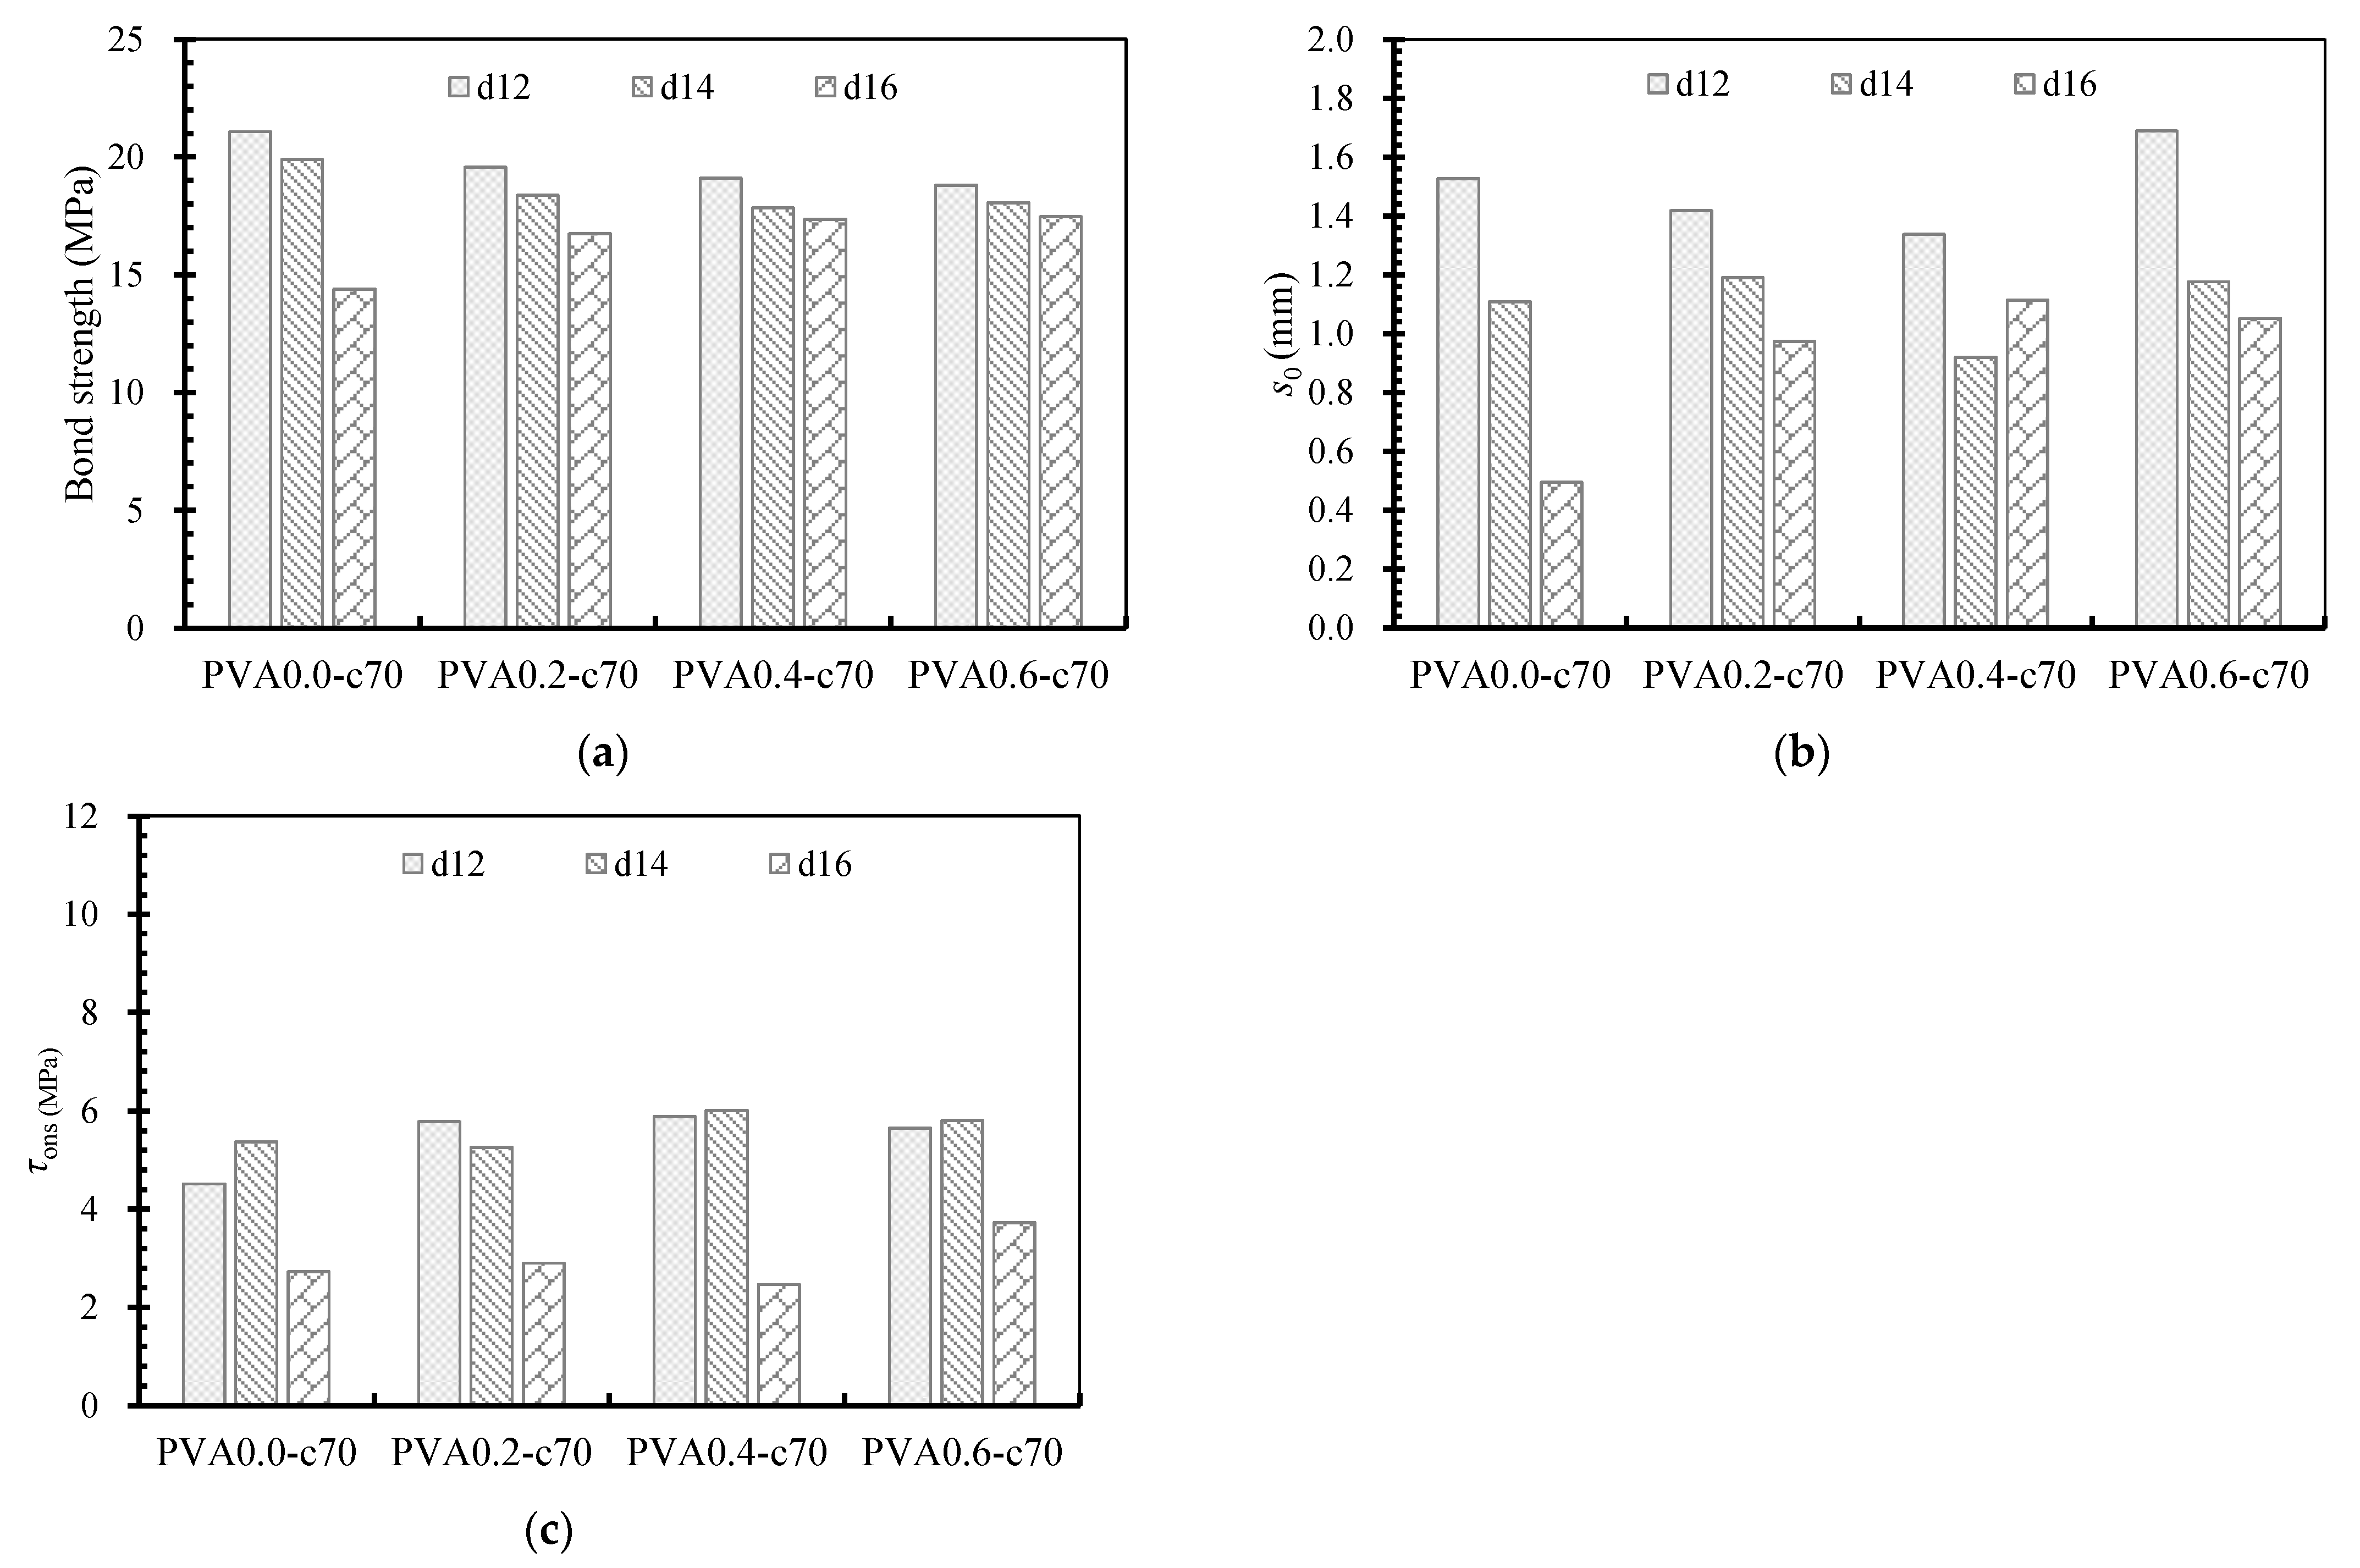
3.3. Effects of Rebar Diameter

Figure 15 shows the bond stress–slip curves for the specimens with different rebar diameters. Rebar diameter affected the failure mode of the specimens. The ratio of cover depth to steel rebar diameter is inversely linked to rebar diameter. In the present test, the failure mode of the specimens was changed from the pull-out mode to splitting mode as the diameter of the rebar exceeded 16 mm. The bond stress–slip curves degraded from three branches to one branch, as shown in Figure 15a,b. Moreover, rebar diameter also affected the initial bonding stiffness and bond strength of the specimens. The initial bonding stiffness is measured as the slope of the bond stress–slip curve at the initial slip. The initial bond stiffness K0 is the slope of the bond stress–slip curve at the time of the initial slip. In this paper, the secant slope corresponding to one-half of the maximum bond stress was used to measure the initial bond stiffness of different specimens, and the results are shown in Table 2. Compared with large reinforcement specimens, the initial bond stiffness of the bond stress–slip curve of small reinforcement specimens during the initial slip stage was significantly larger. This indicates that specimens with small-diameter rebars have great initial bonding stiffness and bond strength compared to specimens with large-diameter rebars. The difference of bond stress–slip curves in specimens with 12 mm, 14 mm, and 16 mm rebars became smaller with the increase in PVA fibers.
The details about the comparison of bond strength, slip corresponding to bond strength, and the bond stress at the onset of free end slip for specimens with different rebars are summarized in Figure 16. Almost all of the bond strength, slip corresponding to bond strength, and the bond stress at the onset of free end slip decreased with the increase in rebar diameter. For example, the increase of rebar diameter from 12 mm to 14 mm and 16 mm in the PVA0.2-c70 series specimens decreased the bond strength by about 6.1% and 14.4%, decreased the corresponding slip by about 16.0% and 31.3%, decrease the bond stress at the onset of free end slip by about 9.1% and 49.9%, respectively. The larger the diameter of the steel rebar, the smaller the bond strength, the corresponding slip, and the bond stress at the onset of free end slip. These results are consistent with previous studies [42,43,44]. This could be attributed firstly to the more uneven distribution of bond stress along the rebars with large diameters than that of rebars with small diameters. Secondly, rebars with a large diameter tend to more easily trap bleeding water, resulting in more voids around the rebars, reducing the concrete and rib shear between the steel bars, thus reducing the interaction between the steel and concrete. Finally, the shear effect between the reinforced concrete and rib is the main part of the bonding force of reinforcement. According to the measured steel contour data, with the increase in the diameter of the reinforcement, the relative spacing of the reinforcement ribs decreases, and the relative height of transverse ribs decreases, leading to the reduction of the shear effect between the reinforcement and concrete, thus reducing the bonding force between the reinforcement and concrete.
The negative effects of a large rebar on bond behavior between concrete and rebar were slightly reduced with the increase in PVA fibers. For instance, the decreases in bond strength were 5.6% and 31.7% in the plain specimens as the rebar diameter increased from 12 mm to 14 mm and 16 mm, respectively. For specimens with 0.6% PVA fibers, the decrease in bond strength were only 4.0% and 7.1%, respectively. Similar effects were also been investigated in the slip corresponding to bond strength and the bond stress at the onset of free end slip. This indicates that PVA fibers have relatively positive effects on the bond behavior of specimens with large-diameter rebars.

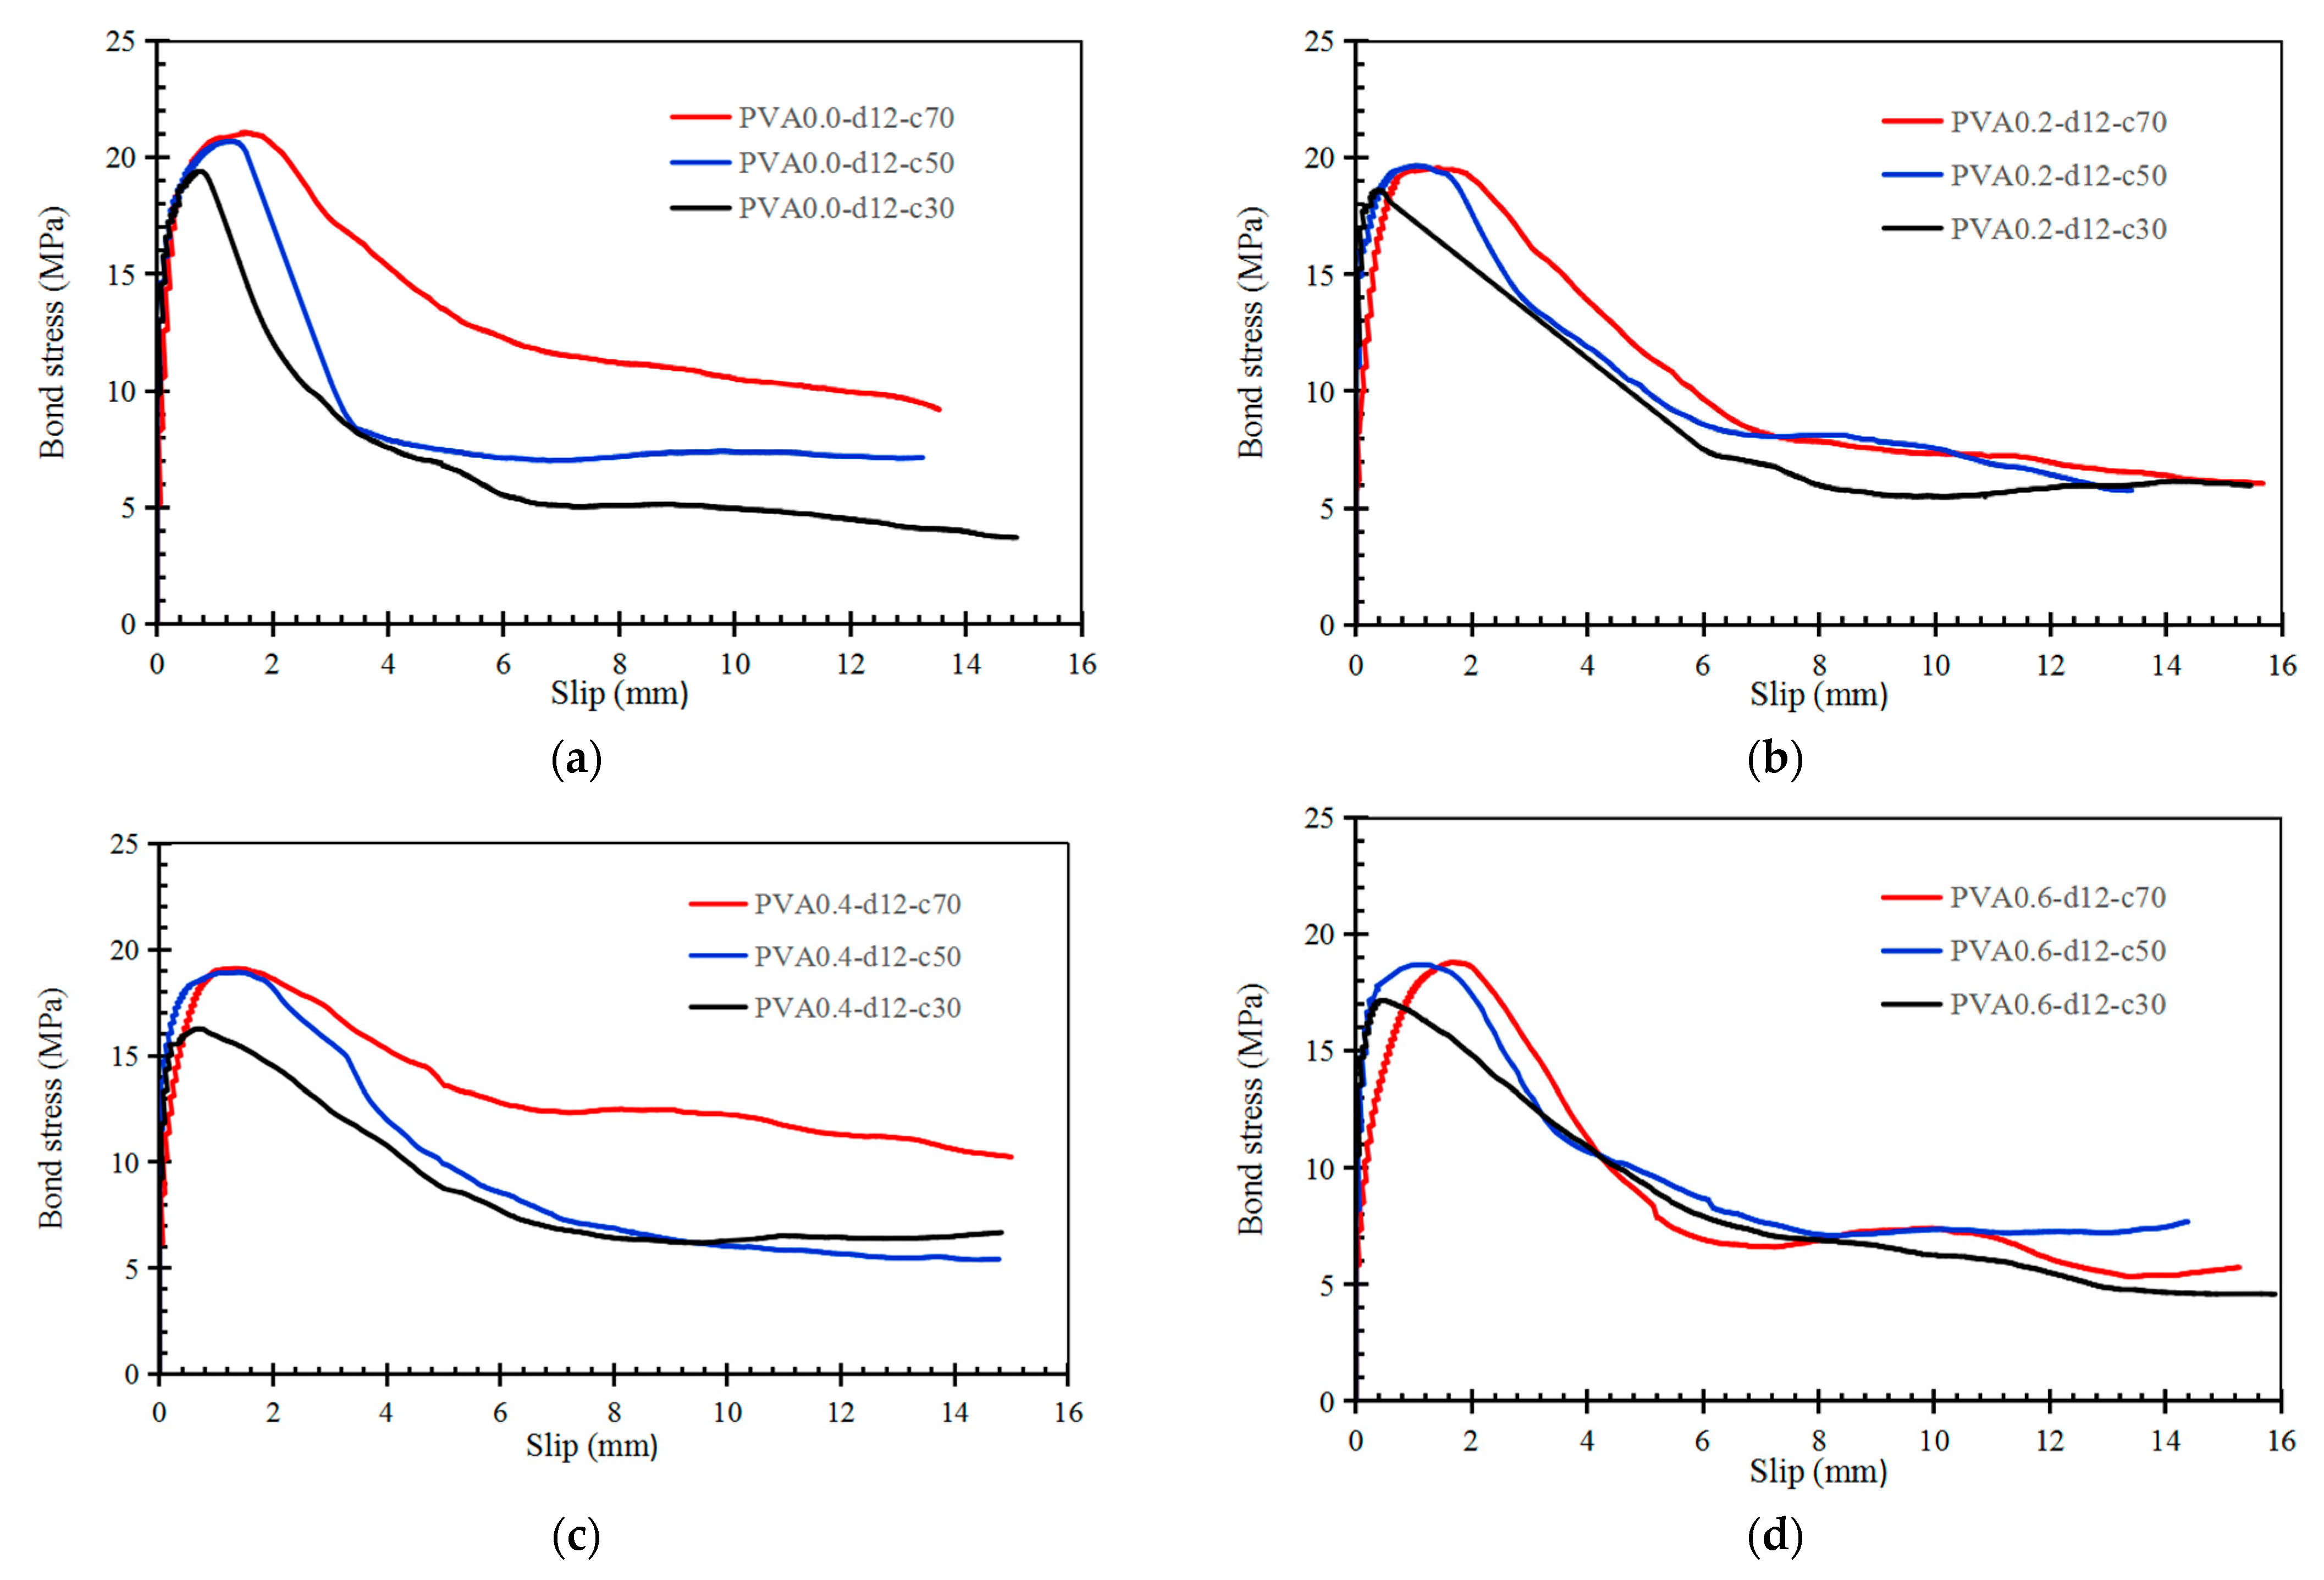
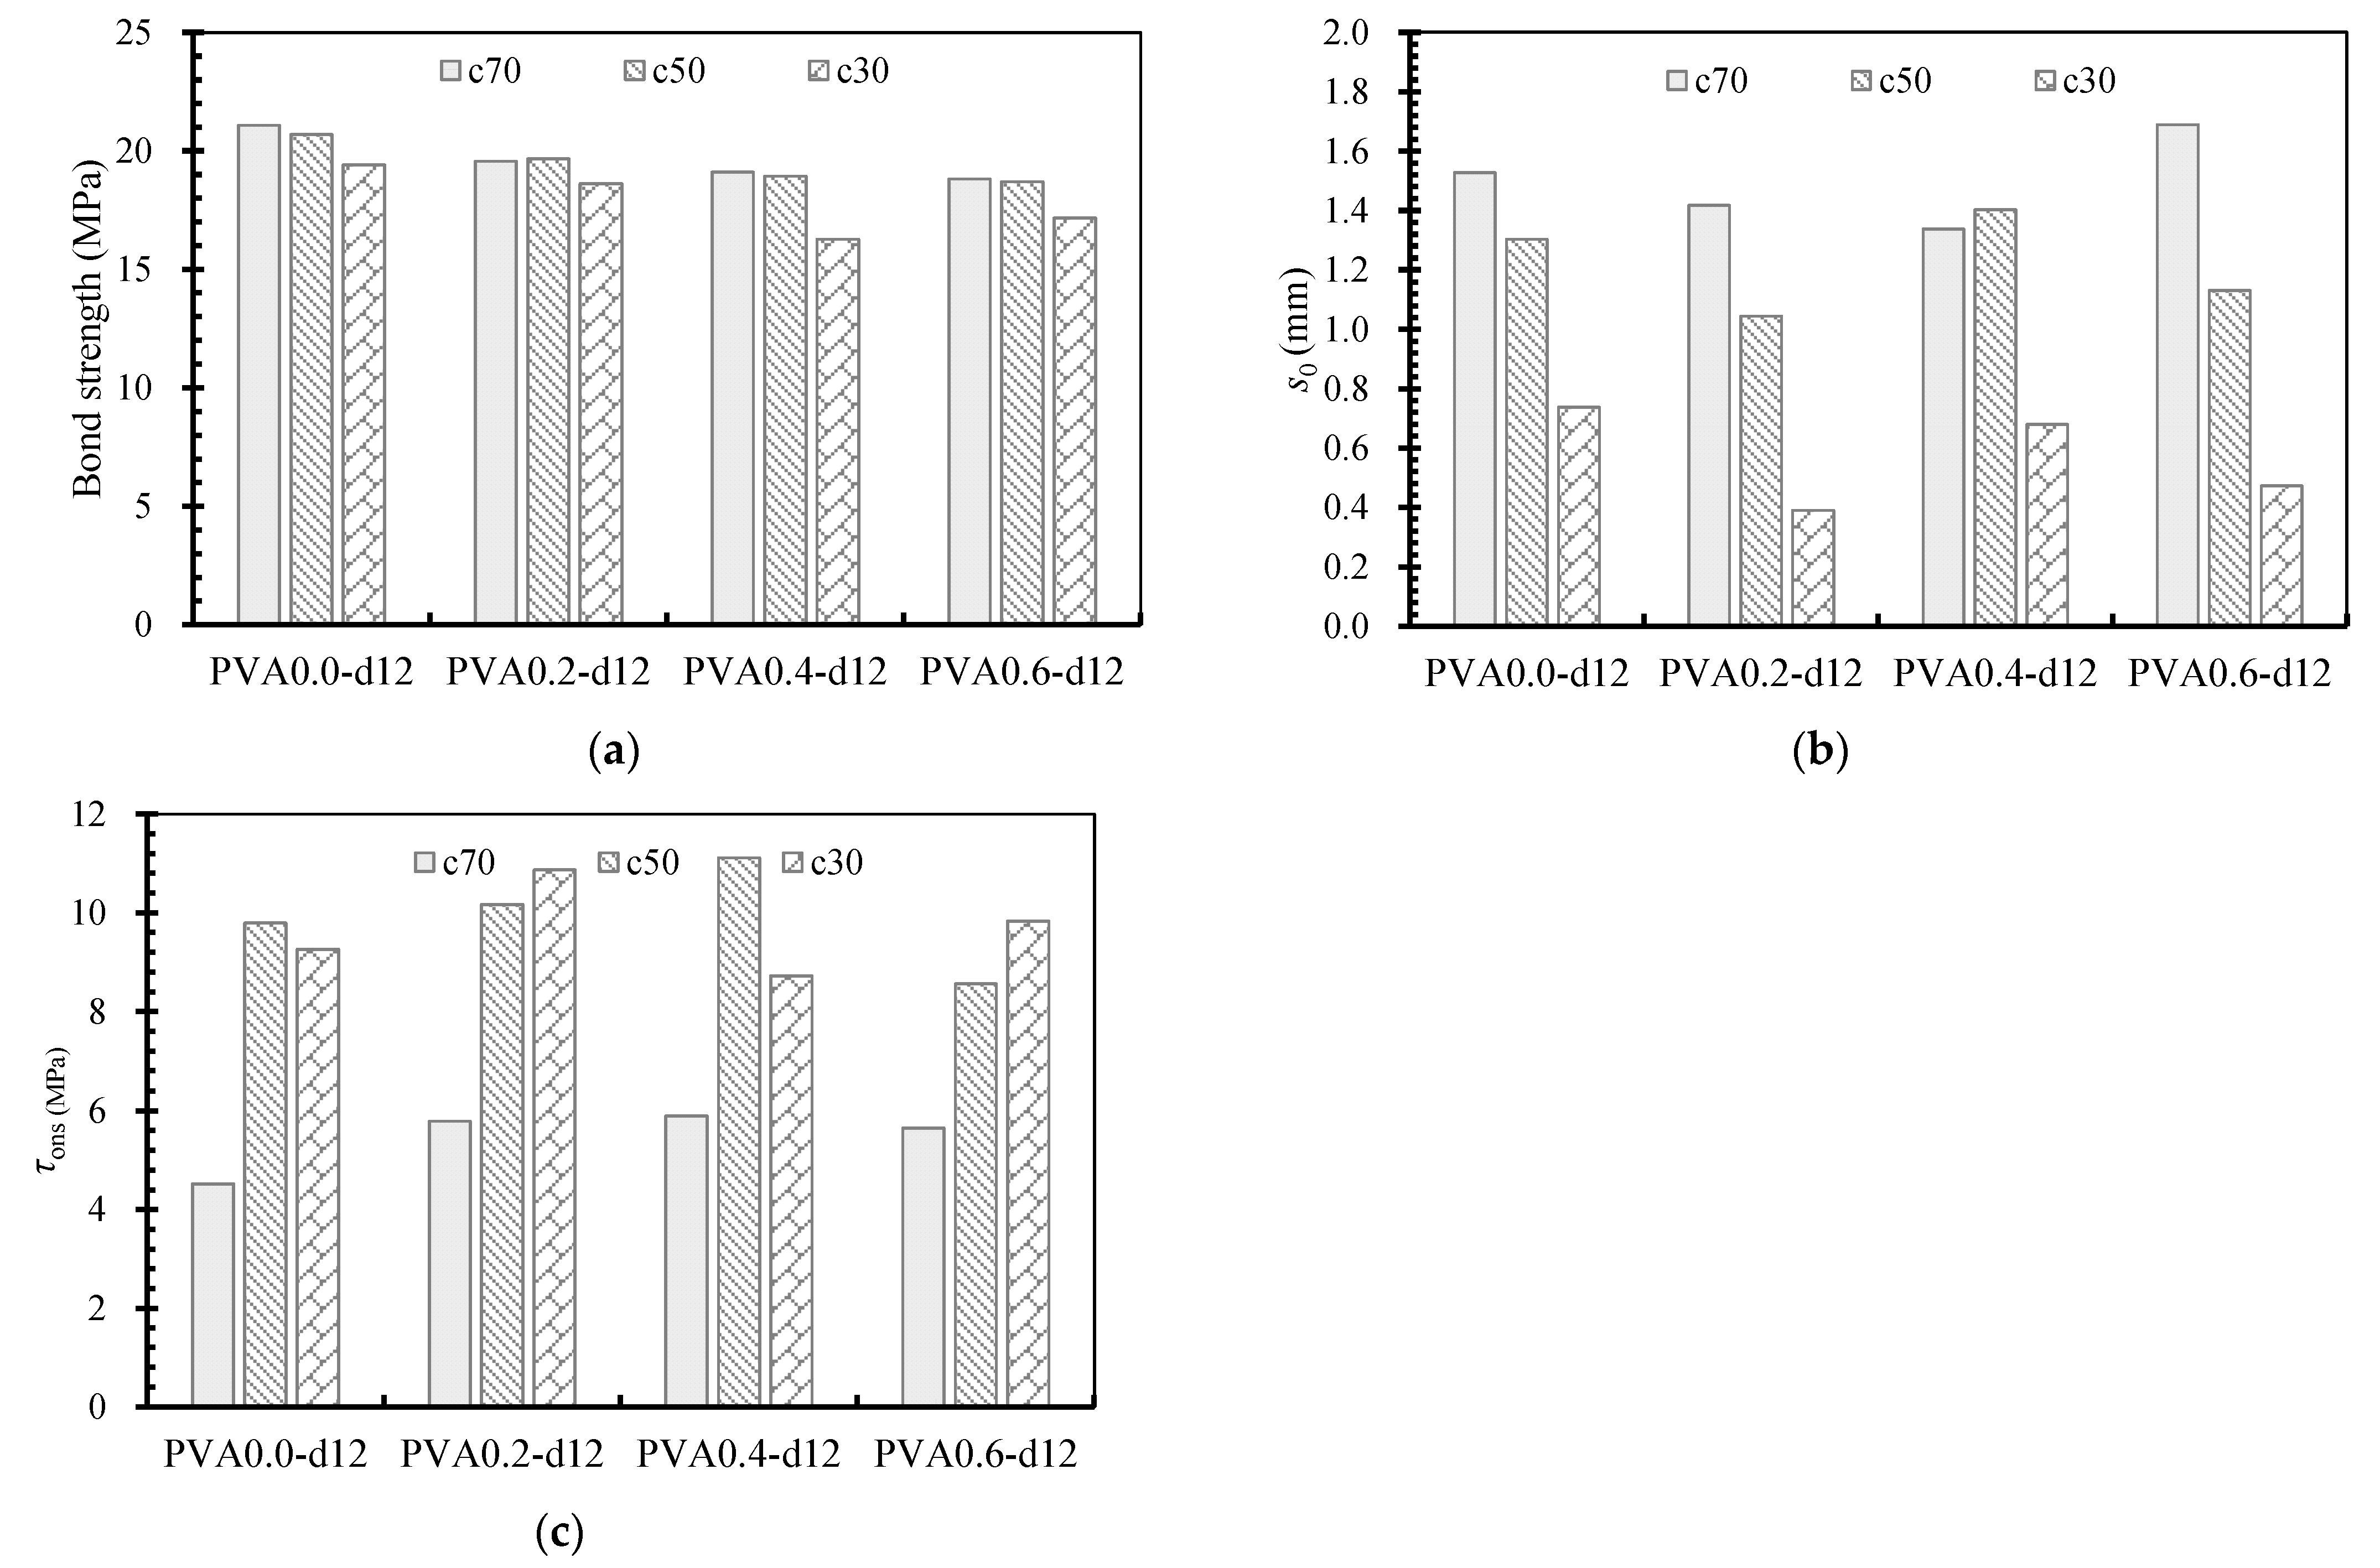
3.4. Effects of Cover Depth

Figure 17 shows the bond stress–slip curves for specimens with different cover depths. The samples in each subgraph have the same content of PVA fibers and rebar diameter, but the cover depth is different. The curves match well with the failure modes for specimens with different cover depths. The curves show a rapid descent for specimens with thin covers after the maximum bond stress, while there was an obvious flat segment for specimens with thick covers. The bond strength of the specimens decreased with the decrease in cover depth. Moreover, the cover depth also affected the initial bond stiffness of the specimen. Specimens with thin coves had high initial stiffnesses. The more PVA fibers, the greater the difference in initial bond stiffness caused by cover depth.
These results could be attributed to the different methods of energy consumption during the loading procedure. For the specimens with a thick cover, the energy is consumed mainly through the shear crushing of local concrete between the ribs. Meanwhile, the energy consumption in the thin case is controlled by the cracking of the cover. The covers usually have large areas compared with the local concrete between the ribs. The splitting cracking of the cover would consume a large amount of energy without many slips, resulting in a corresponding high bond stiffness. The addition of PVA fibers improved the toughness and tensile strength of the concrete, increasing the energy dissipation of the concrete. This can overcome the adverse effects of additional voids and maintain the initial bond stiffness with the increase in PVA fibers. For specimens with thick covers, more additional voids appear in the concrete with the increase in fibers, causing corresponding degradation of energy consumption. Therefore, specimens with thick covers have lower initial bond stiffness than the specimen with thin covers, especially for the case with more PVA fibers.
The details about the comparison of bond strength, slip corresponding to bond strength, and the bond stress at the onset of free end slip for specimens with different cover depths are summarized in Figure 18. The bond strength and the corresponding slip of specimens decreased with the decrease in cover depth, while the bond stress at the onset of free end slip increase significantly with the decrease in cover depth. For instance, the decrease in cover depth from 70 mm to 50 mm and 30 mm in the PVA0.6-d12 series specimens decreased the bond strength by about 0.6% and 8.7%, decreased the corresponding slip about 33.1% and 72.0%, but increased the bond stress at the onset of free end slip by about 51.5% and 74.0%, respectively. The reason for the positive effect of a thin cover of the bond stress at the onset of free end slip could be similar to that for the initial bond stiffness, as discussed previously.

4. Conclusions

This study experimentally investigated the effects of PVA fibers on bond behavior between rebar and concrete. The effects of PVA fibers, rebar diameter, and cover depth on bond behavior were clarified. The following preliminary conclusions can be drawn based on the present study:
(1)
PVA fibers show a negative effect on the compressive strength of concrete, but a positive effect on splitting tensile, flexural, and direct tensile strength. In the present test, the maximum decrease in compressive strength was 12.3%, and the maximum increase in splitting tensile, flexural, and direct tensile strength were 33.7%, 12.9%, and 14.0%, respectively, for concrete with PVA fiber contents less than 0.6%. The increase in splitting tensile strength was more significant than that in flexural and direct tensile strength.
(2)
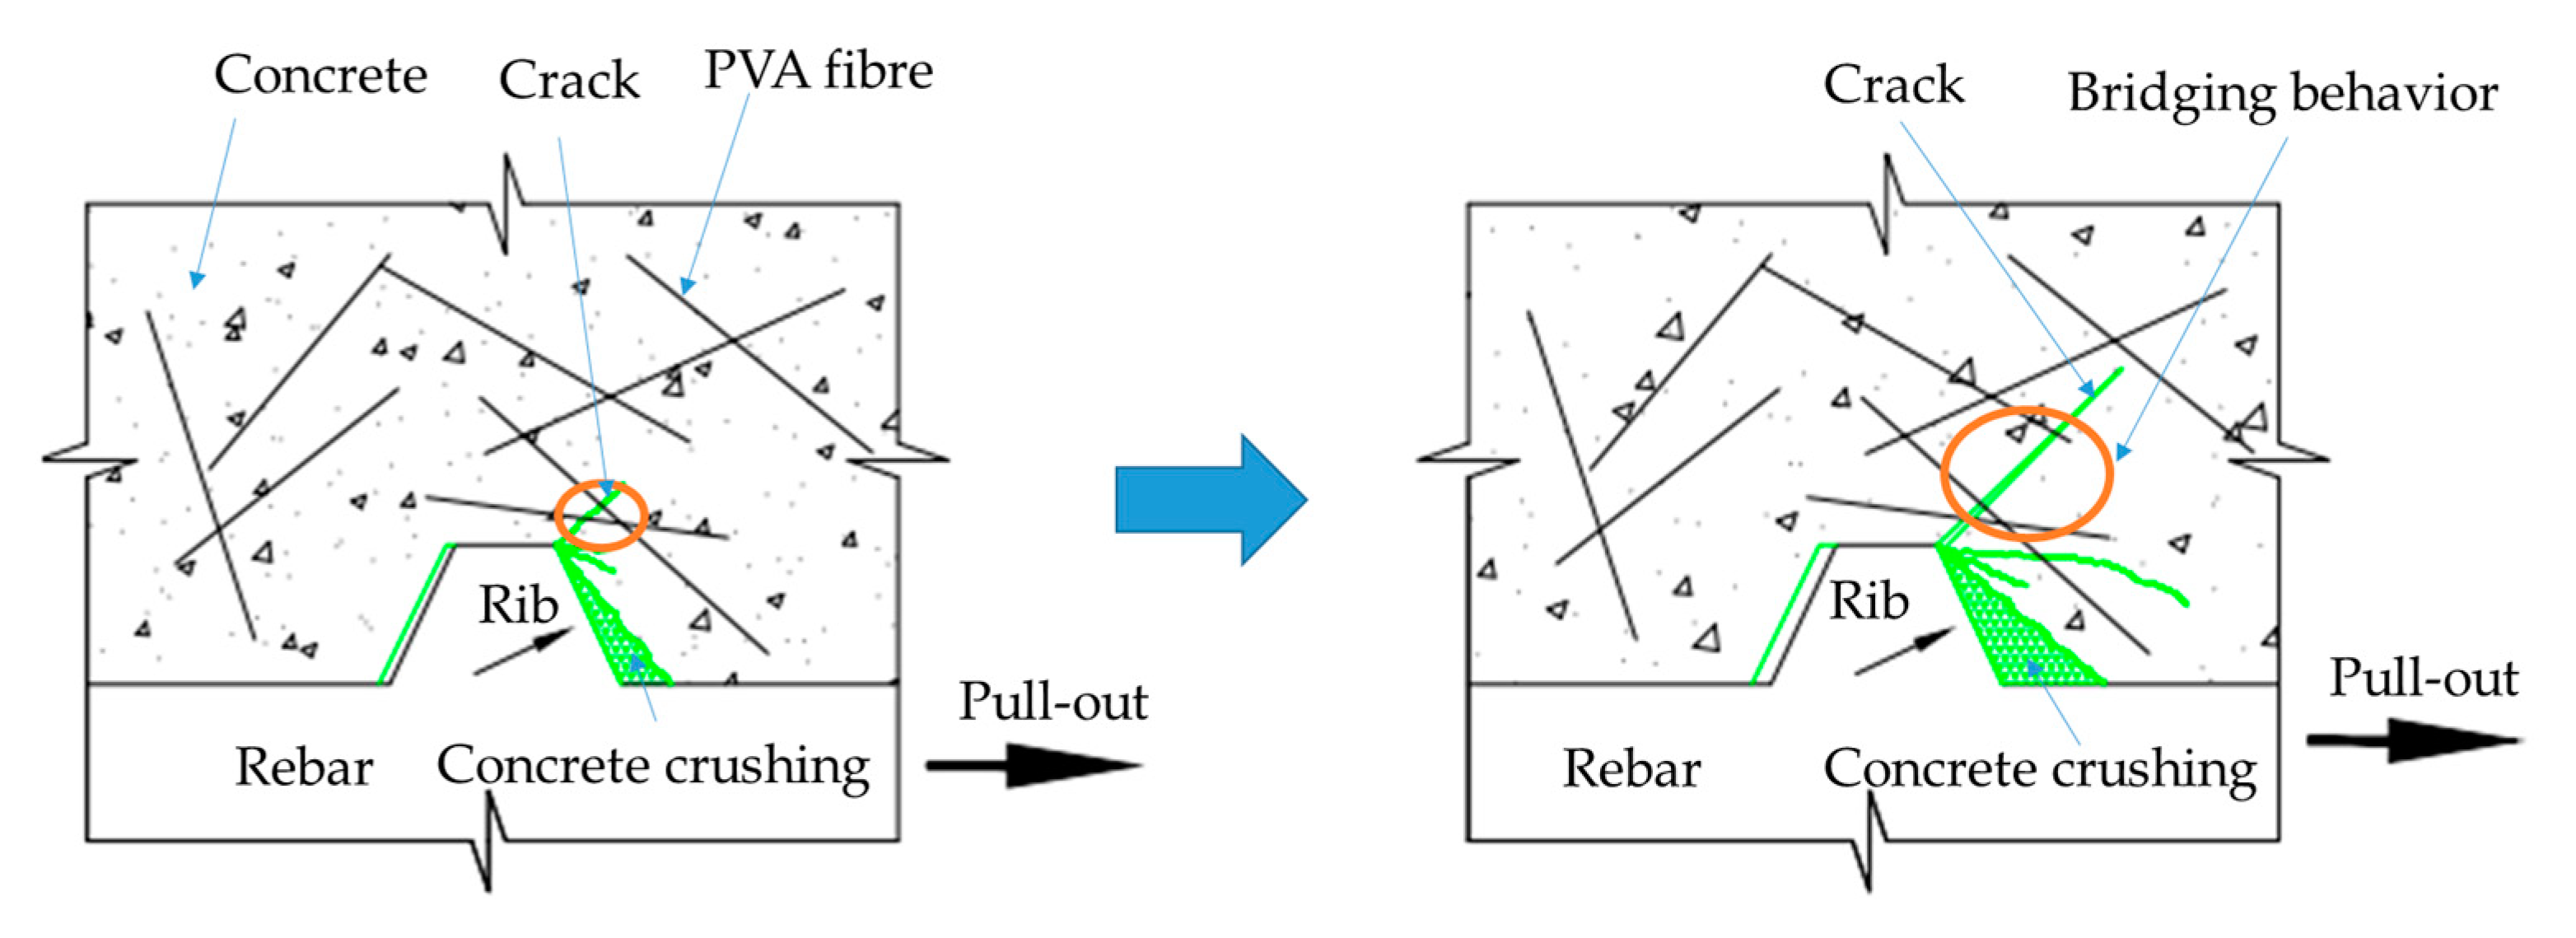
The failure mode of bonding specimens depends mainly on the ratio of cover depth to steel rebar diameter. Specimen were more prone to pull-out failure when the ratio of cover depth to rebar diameter was greater than 4.5–5.0. For specimens with a small ratio of cover depth to rebar diameter, the splitting of concrete was more significantly affected by rebar diameter rather than cover depth. PVA fibers can restrict the splitting cracks and improve the failure of the specimen in a more ductile way.
(3)
PVA fibers generally show a negative effect on bond behavior, but a positive effect on the descending branch in the case of splitting failure. In the present test, PVA fibers decreased the initial bond stiffness and bond strength for the cases with both pull-out and splitting failures. The maximum decrease in bond strength was about 16.2% with PVA fiber contents less than 0.6%. PVA fibers restricted both the macro-cracking and micro-cracking for splitting cases, with the former effects seeming much more significant than latter.
(4)
Specimens with small rebars had greater initial bonding stiffness and bond strength than specimens with large rebars. The difference in bond behavior caused by rebar diameter became smaller with the increase in PVA fibers. A thin cover decreased the bond strength of the specimens, but increased the initial bond stiffness of specimens. The more PVA fibers, the greater the difference in initial bond stiffness caused by cover depth.
It should be noted that only one sample was tested in the pull-out test rather than repeated samples, which would lead to some discrepancies. Further studies with more repeated samples are needed in the future.

Author Contributions

Writing—original draft, X.Z., Q.L. and Y.W.; Writing—review & editing, X.Z. All authors have read and agreed to the published version of the manuscript.

Funding

This work reported here was conducted with the financial supports from the Education Department Research Foundation of Hunan Province (Grant No. 21B0170), the Natural Science Foundation of Hunan Province of China (Grant No. 2021JJ40540), and the Special Funds for the Construction of Innovative Provinces in Hunan, China (Nos. 2019RS1059).

Informed Consent Statement

Informed consent was obtained from all subjects involved in the study.

Data Availability Statement

All data generated or analyzed during this study are included in this article.

Acknowledgments

This work was conducted with financial support from the Education Department Research Foundation of Hunan Province (Grant No. 21B0170), the Natural Science Foundation of Hunan Province of China (Grant No. 2021JJ40540), and the Special Funds for the Construction of Innovative Provinces in Hunan, China (No. 2019RS1059). The supports are gratefully acknowledged.

Conflicts of Interest

The authors declare no conflict of interest.

References

  1. Pakravan, H.R.; Jamshidi, M.; Latifi, M. Study on fiber hybridization effect of engineered cementitious composites with low- and high-modulus polymeric fibers. Constr. Build. Mater. 2016, 112, 739–746. [Google Scholar] [CrossRef]
  2. Juarez, C.A.; Fajardo, G.; Monroy, S.; Duran-Herrera, A.; Valdez, P.; Magniont, C. Comparative study between natural and PVA fibers to reduce plastic shrinkage cracking in cement-based composite. Constr. Build. Mater. 2015, 91, 164–170. [Google Scholar] [CrossRef]
  3. Zanotti, C.; Borges, P.H.R.; Bhutta, A.; Banthia, N. Bond strength between concrete substrate and metakaolin geopolymer repair mortar: Effect of curing regime and PVA fiber reinforcement. Cem. Concr. Compos. 2017, 80, 307–316. [Google Scholar] [CrossRef]
  4. Passuello, A.; Moriconi, G.; Shah, S.P. Cracking behavior of concrete with shrinkage reducing admixtures and PVA fibers. Cem. Concr. Compos. 2009, 31, 699–704. [Google Scholar] [CrossRef]
  5. Said, M.; Abd El-Azim, A.A.; Ali, M.M.; EI-Ghazaly, H.; Shaaban, I. Effect of elevated temperature on axially and eccentrically loaded columns containing Polyvinyl Alcohol (PVA) fibers. Eng. Struct. 2020, 204, 110065. [Google Scholar] [CrossRef]
  6. Wang, J.; Dai, Q.; Si, R.; Guo, S. Investigation of properties and performances of Polyvinyl Alcohol (PVA) fiber-reinforced rubber concrete. Constr. Build. Mater. 2018, 193, 631–642. [Google Scholar] [CrossRef]
  7. Abushawashi, N.; Vimonsatit, V. Material Classification and Composite Elastic Modulus of Hybrid PVA Fiber Ferrocement. J. Mater. Civ. Eng. 2016, 28, 04016073. [Google Scholar] [CrossRef]
  8. Liu, F.; Ding, W.; Qiao, Y. Experimental investigation on the flexural behavior of hybrid steel-PVA fiber reinforced concrete containing fly ash and slag powder. Constr. Build. Mater. 2019, 228, 116706. [Google Scholar] [CrossRef]
  9. Nuruddin, M.F.; Ullah Khan, S.; Shafiq, N.; Ayub, T. Strength Prediction Models for PVA Fiber-Reinforced High-Strength Concrete. J. Mater. Civ. Eng. 2015, 27, 04015034. [Google Scholar] [CrossRef]
  10. Pan, J.; Cai, J.; Ma, H.; Leung, C.K.Y. Development of Multiscale Fiber-Reinforced Engineered Cementitious Composites with PVA Fiber and CaCO3 Whisker. J. Mater. Civ. Eng. 2018, 30, 04018106. [Google Scholar] [CrossRef]
  11. Sun, L.; Hao, Q.; Zhao, J.; Wu, D.; Yang, F. Stress strain behavior of hybrid steel-PVA fiber reinforced cementitious composites under uniaxial compression. Constr. Build. Mater. 2018, 188, 349–360. [Google Scholar] [CrossRef]
  12. Shafiq, N.; Ayub, T.; Khan, S.U. Investigating the performance of PVA and basalt fibre reinforced beams subjected to flexural action. Compos. Struct. 2016, 153, 30–41. [Google Scholar] [CrossRef]
  13. Noushini, A.; Samali, B.; Vessalas, K. Effect of polyvinyl alcohol (PVA) fibre on dynamic and material properties of fibre reinforced concrete. Constr. Build. Mater. 2013, 49, 374–383. [Google Scholar] [CrossRef]
  14. Noushini, A.; Samali, B.; Vessalas, K. Ductility and Damping Characteristics of PVA-FRC Beam Elements. Adv. Struct. Eng. 2016, 18, 1763–1787. [Google Scholar] [CrossRef]
  15. Nam, J.; Kim, G.; Lee, B.; Hasegawa, R.; Hama, Y. Frost resistance of polyvinyl alcohol fiber and polypropylene fiber reinforced cementitious composites under freeze thaw cycling. Compos. Part B Eng. 2016, 90, 241–250. [Google Scholar] [CrossRef]
  16. Feng, J.; Su, Y.; Qian, C. Coupled effect of PP fiber, PVA fiber and bacteria on self-healing efficiency of early-age cracks in concrete. Constr. Build. Mater. 2019, 228, 116–118. [Google Scholar] [CrossRef]
  17. Jang, J.G.; Kim, H.K.; Kim, T.S.; Min, B.J.; Lee, H.K. Improved flexural fatigue resistance of PVA fiber-reinforced concrete subjected to freezing and thawing cycles. Constr. Build. Mater. 2014, 59, 129–135. [Google Scholar] [CrossRef]
  18. Şahmaran, M.; Özbay, E.; Yücel, H.E.; Lachemi, M.; Li, V.C. Frost resistance and microstructure of Engineered Cementitious Composites: Influence of fly ash and micro poly-vinyl-alcohol fiber. Cem. Concr. Compos. 2012, 34, 156–165. [Google Scholar] [CrossRef]
  19. Zhou, J.; Pan, J.; Leung, C.K. Mechanical behavior of fiber-reinforced engineered cementitious composites in uniaxial compression. J. Mater. Civ. Eng. 2014, 27, 04014111. [Google Scholar] [CrossRef]
  20. Ayub, T.; Khan, S.U.; Ayub, A. Nalytical model for the compressive stress–strain behavior of PVA-FRC. Constr. Build. Mater. 2019, 214, 581–593. [Google Scholar] [CrossRef]
  21. Zhang, X.; Zhang, W.; Luo, Y.; Wang, L.; Peng, J.; Zhang, J. Interface shear strength between self-compacting concrete and carbonated concrete. J. Mater. Civ. Eng. 2020, 32, 04020113. [Google Scholar] [CrossRef]
  22. Nguyen, H.-A.; Chang, T.-P.; Shih, J.-Y. Engineering Properties and Bonding Behavior of Self-Compacting Concrete Made with No-Cement Binder. J. Mater. Civ. Eng. 2018, 30, 04017294. [Google Scholar] [CrossRef]
  23. Wardeh, G.; Ghorbel, E.; Gomart, H.; Fiorio, B. Experimental and analytical study of bond behavior betweenrecycled aggregate concrete and steel bars using a pullout test. Struct. Concr. 2017, 18, 811–825. [Google Scholar] [CrossRef]
  24. Alabduljabbar, H.; West, J. Bond behavior of cleaned corroded rebar repaired by partial depth repair. Structures 2020, 27, 813–823. [Google Scholar] [CrossRef]
  25. Zhang, X.; He, F.; Chen, J.; Yang, C.; Xu, F. Orientation of steel fibers in concrete attracted by magnetized rebar and its effects on bond behavior. Cem. Concr. Compos. 2023, 138, 104977. [Google Scholar] [CrossRef]
  26. Shen, D.; Li, C.; Feng, Z.; Wen, C.; Qjha, B. Influence of strain rate on bond behavior of concrete members reinforced with basalt fiber-reinforced polymer rebars. Constr. Build. Mater. 2019, 228, 116755. [Google Scholar] [CrossRef]
  27. Hou, L.; Zhou, B.; Guo, S.; Zhuang, N.; Chen, D. Bond-slip behavior between pre-corroded rebar and steel fiber reinforced concrete. Constr. Build. Mater. 2018, 182, 637–645. [Google Scholar] [CrossRef]
  28. Alyousef, R.; Topper, T.; Al-Mayah, A. Effect of FRP Wrapping on Fatigue Bond Behavior of Spliced Concrete Beams. J. Compos. Constr. 2016, 20, 04015030. [Google Scholar] [CrossRef]
  29. Wu, K.; Chen, F.; Chen, C.; Zheng, H.; Xu, J. Load-Transfer Mechanism and Bond-Stress Components in Steel and Steel Fiber–Reinforced Concrete Structure. J. Struct. Eng. 2019, 145, 04019160. [Google Scholar] [CrossRef]
  30. Hou, L.; Ye, Z.; Zhou, B.; Shen, C.; Aslani, F.; Chen, D. Bond behavior of reinforcement embedded in steel fiber reinforced concrete under chloride attack. Struct. Concr. 2019, 20, 2242–2255. [Google Scholar] [CrossRef]
  31. Akbarzadeh Bengar, H.; Ahmadi Zarrinkolaei, F. Effect of steel fibers and concrete cover on bond behavior between steel deformed bar and concrete under high temperature. Structures 2021, 32, 1507–1521. [Google Scholar] [CrossRef]
  32. Aslani, F.; Nejadi, S. Bond characteristics of steel fiber and deformed reinforcing steel bar embedded in steel fiber reinforced self-compacting concrete (SFRSCC). Cent. Eur. J. Eng. 2012, 2, 445–470. [Google Scholar] [CrossRef]
  33. Dancygier, A.N.; Katz, A.; Wexler, U. Bond between deformed reinforcement and normal and high-strength concrete with and without fibers. Mater. Struct. 2010, 43, 839–856. [Google Scholar] [CrossRef]
  34. Deshpande, A.A.; Kumar, D.; Ranade, R. Temperature effects on the bond behavior between deformed steel reinforcing bars and hybrid fiber-reinforced strain-hardening cementitious composite. Constr. Build. Mater. 2020, 233, 117337. [Google Scholar] [CrossRef]
  35. Ganesan, N.; Indira, P.V.; Sabeena, M.V. Bond stress slip response of bars embedded in hybrid fibre reinforced high performance concrete. Constr. Build. Mater. 2014, 50, 108–115. [Google Scholar] [CrossRef]
  36. Tabatabaeian, M.; Khaloo, A.; Joshaghani, A. Experimental investigation on effects of hybrid fibers on rheological, mechanical, and durability properties of high-strength SCC. Constr. Build. Mater. 2017, 147, 497–509. [Google Scholar] [CrossRef]
  37. Dashti, J.; Nematzadeh, M. Compressive and direct tensile behavior of concrete containing Forta-Ferro fiber and calcium aluminate cement subjected to sulfuric acid attack with optimized design. Constr. Build. Mater. 2020, 253, 118999. [Google Scholar] [CrossRef]
  38. Zhao, W.; Xiao, J. On bond-slip constitutive model between ribbed steel bars and concrete, 04. Eng. Mech. 2011, 28, 164–171. (In Chinese) [Google Scholar]
  39. Lin, H.; Zhao, Y.; Ozbolt, J.; Feng, P.; Jiang, C. Analytical model for the bond stress-slip relationship of deformed bars in normal strength concrete. Constr. Build. Mater. 2019, 198, 570–586. [Google Scholar] [CrossRef]
  40. Alberti, M.G.; Enfedaque, A.; Gálvez, J.C. The effect of fibres in the rheology of self-compacting concrete. Construction and Building Materials 2019, 219, 144–153. [Google Scholar] [CrossRef]
  41. Huang, L.; Xu, L.; Chi, Y.; Deng, F.; Zhang, A. Bond strength of deformed bar embedded in steel-polypropylene hybrid fiber reinforced concrete. Constr. Build. Mater. 2019, 218, 176–192. [Google Scholar] [CrossRef]
  42. Hung, C.-C.; Lee, H.-S.; Chan, S.N. Tension-stiffening effect in steel-reinforced UHPC composites: Constitutive model and effects of steel fibers, loading patterns, and rebar sizes. Compos. Part B Eng. 2019, 158, 269–278. [Google Scholar] [CrossRef]
  43. Yoo, D.-Y.; Kwon, K.-Y.; Park, J.-J.; Yoon, Y.-S. Local bond-slip response of GFRP rebar in ultra-high-performance fiber-reinforced concrete. Compos. Struct. 2015, 120, 53–64. [Google Scholar] [CrossRef]
  44. Paswan, R.; Rahman, M.R.; Singh, S.K.; Singh, B. Bond Behavior of Reinforcing Steel Bar and Geopolymer Concrete. J. Mater. Civ. Eng. 2020, 32, 04020167. [Google Scholar] [CrossRef]
Figure 1. Detail of the specimen (unit: mm).
Coatings 13 00740 g001
Figure 2. PVA fibers.
Coatings 13 00740 g002
Figure 3. Details of mechanical property tests: (a) compressive strength; (b) splitting tensile strength; (c) flexural strength; (d) direct tensile strength.
Coatings 13 00740 g003
Figure 4. The effect of PVA fibers on the mechanical properties of concrete: (a) compressive strength; (b) splitting tensile strength, direct tensile strength, and flexural strength.
Coatings 13 00740 g004
Figure 5. Set-up of the pull-out test. (a) loading instrument; (b) detail device.
Coatings 13 00740 g005
Figure 6. Bond stress–slip curves for the specimens. (a) d12-c70 series (c/d = 5.75); (b) d14-c70 series (c/d = 4.86); (c) d16-c70 series (c/d = 4.19); (d) d12-c50 series (c/d = 4.17); (e) d12-c30 series (c/d = 2.50).
Coatings 13 00740 g006
Figure 7. Typical failure of specimens: (a) pull-out failure, (b) splitting failure, and (c) splitting-pull-out failure.
Coatings 13 00740 g007
Figure 8. Pull-out failure mode details: (a) PVA0.2-d16-c70 series; (b) bonding section; (c) external crack.
Coatings 13 00740 g008
Figure 9. Bond strength and residual bond strength of specimens with different contents of PVA fibers. (a) Bond strength; (b) residual bond strength.
Coatings 13 00740 g009
Figure 10. Slip corresponding to maximum bond stress of specimens.
Coatings 13 00740 g010
Figure 11. Bond stress at onset of free end slip of specimens.
Coatings 13 00740 g011
Figure 12. Propagation of splitting crack in d12-c30 series specimens.
Coatings 13 00740 g012
Figure 13. Effects of PVA fibers on splitting cracks.
Coatings 13 00740 g013
Figure 14. Bridging action of PVA fibers.
Coatings 13 00740 g014
Figure 15. Bond stress–slip curves for the specimens with different rebar diameters. (a) PVA0.0-c70 series; (b) PVA0.2-c70 series; (c) PVA0.4-c70 series; (d) PVA0.6-c70 series.
Coatings 13 00740 g015
Figure 16. Effects of rebar diameter on bond behaviors. (a) Bond strength; (b) slip corresponding to bond strength; (c) bond stress at onset of free end slip.
Coatings 13 00740 g016
Figure 17. Bond stress–slip curves for the specimens with different cover depth. (a) PVA0.0-d12 series; (b) PVA0.2-d12 series; (c) PVA0.4-d12 series; (d) PVA0.6-d12 series.
Coatings 13 00740 g017
Figure 18. Effects of cover depth on bond behaviors. (a) Bond strength (b) Slip corresponding to bond strength (c) Bond stress at onset of free end slip.
Coatings 13 00740 g018
Table 1. Details of the specimens.
Pull-Out TestContent of PVA Fiber (%)Rebar Diameters (mm)Cover Thicknesses (mm)
PVA0.0-d12-c300.01230
PVA0.2-d12-c300.21230
PVA0.4-d12-c300.41230
PVA0.6-d12-c300.61230
PVA0.0-d12-c500.01250
PVA0.2-d12-c500.21250
PVA0.4-d12-c500.41250
PVA0.6-d12-c500.61250
PVA0.0-d12-c700.01270
PVA0.2-d12-c700.21270
PVA0.4-d12-c700.41270
PVA0.6-d12-c700.61270
PVA0.0-d14-c700.01470
PVA0.2-d14-c700.21470
PVA0.4-d14-c700.41470
PVA0.6-d14-c700.61470
PVA0.0-d16-c700.01670
PVA0.2-d16-c700.21670
PVA0.4-d16-c700.41670
PVA0.6-d16-c700.61670
Table 2. Experimental parameters and results of pull-out tests.
TestContent of Fiber (%)fcu (MPa)ft (MPa)fts (MPa)ftf (MPa)Failure Modeτons (MPa)τmax (MPa)τr (MPa)S0 (mm)K0
(MPa/mm)
PVA0.0-d12-c30039.982.852.763.32S-P9.2619.418.020.72511
PVA0.2-d12-c300.238.213.003.353.48S-P10.8718.6112.200.39931
PVA0.4-d12-c300.435.063.103.473.74S-P8.7216.2611.450.68739
PVA0.6-d12-c300.637.233.253.693.81S-P9.8317.1711.590.47973
PVA0.0-d12-c50039.982.852.763.32S-P9.7920.698.251.30470
PVA0.2-d12-c500.238.213.003.353.48P10.1719.6612.581.04756
PVA0.4-d12-c500.435.063.103.473.74P11.1118.9313.311.40315
PVA0.6-d12-c500.637.233.253.693.81P8.5618.7011.291.13283
PVA0.0-d12-c70039.982.852.763.32P4.5221.0816.241.53105
PVA0.2-d12-c700.238.213.003.353.48P5.7919.5714.941.42109
PVA0.4-d12-c700.435.063.103.473.74P5.8919.1015.931.34115
PVA0.6-d12-c700.637.233.253.693.81P5.6518.9112.791.6965
PVA0.0-d14-c70039.982.852.763.32P5.3819.9014.321.1195
PVA0.2-d14-c700.238.213.003.353.48P5.2618.3812.061.1997
PVA0.4-d14-c700.435.063.103.473.74P6.0117.8313.290.92108
PVA0.6-d14-c700.637.233.253.693.81P5.8118.0612.331.18106
PVA0.0-d16-c70039.982.852.763.32S2.7314.4000.573
PVA0.2-d16-c700.238.213.003.353.48S2.9016.7400.9751
PVA0.4-d16-c700.435.063.103.473.74S-P2.4717.3711.511.1168
PVA0.6-d16-c700.637.233.253.693.81S-P3.7217.478.301.0564
Notes: P means pull-out failure of specimens; S means splitting failure of specimens; S-P means splitting–pull-out failure of specimens.
Disclaimer/Publisher’s Note: The statements, opinions and data contained in all publications are solely those of the individual author(s) and contributor(s) and not of MDPI and/or the editor(s). MDPI and/or the editor(s) disclaim responsibility for any injury to people or property resulting from any ideas, methods, instructions or products referred to in the content.

