Abstract
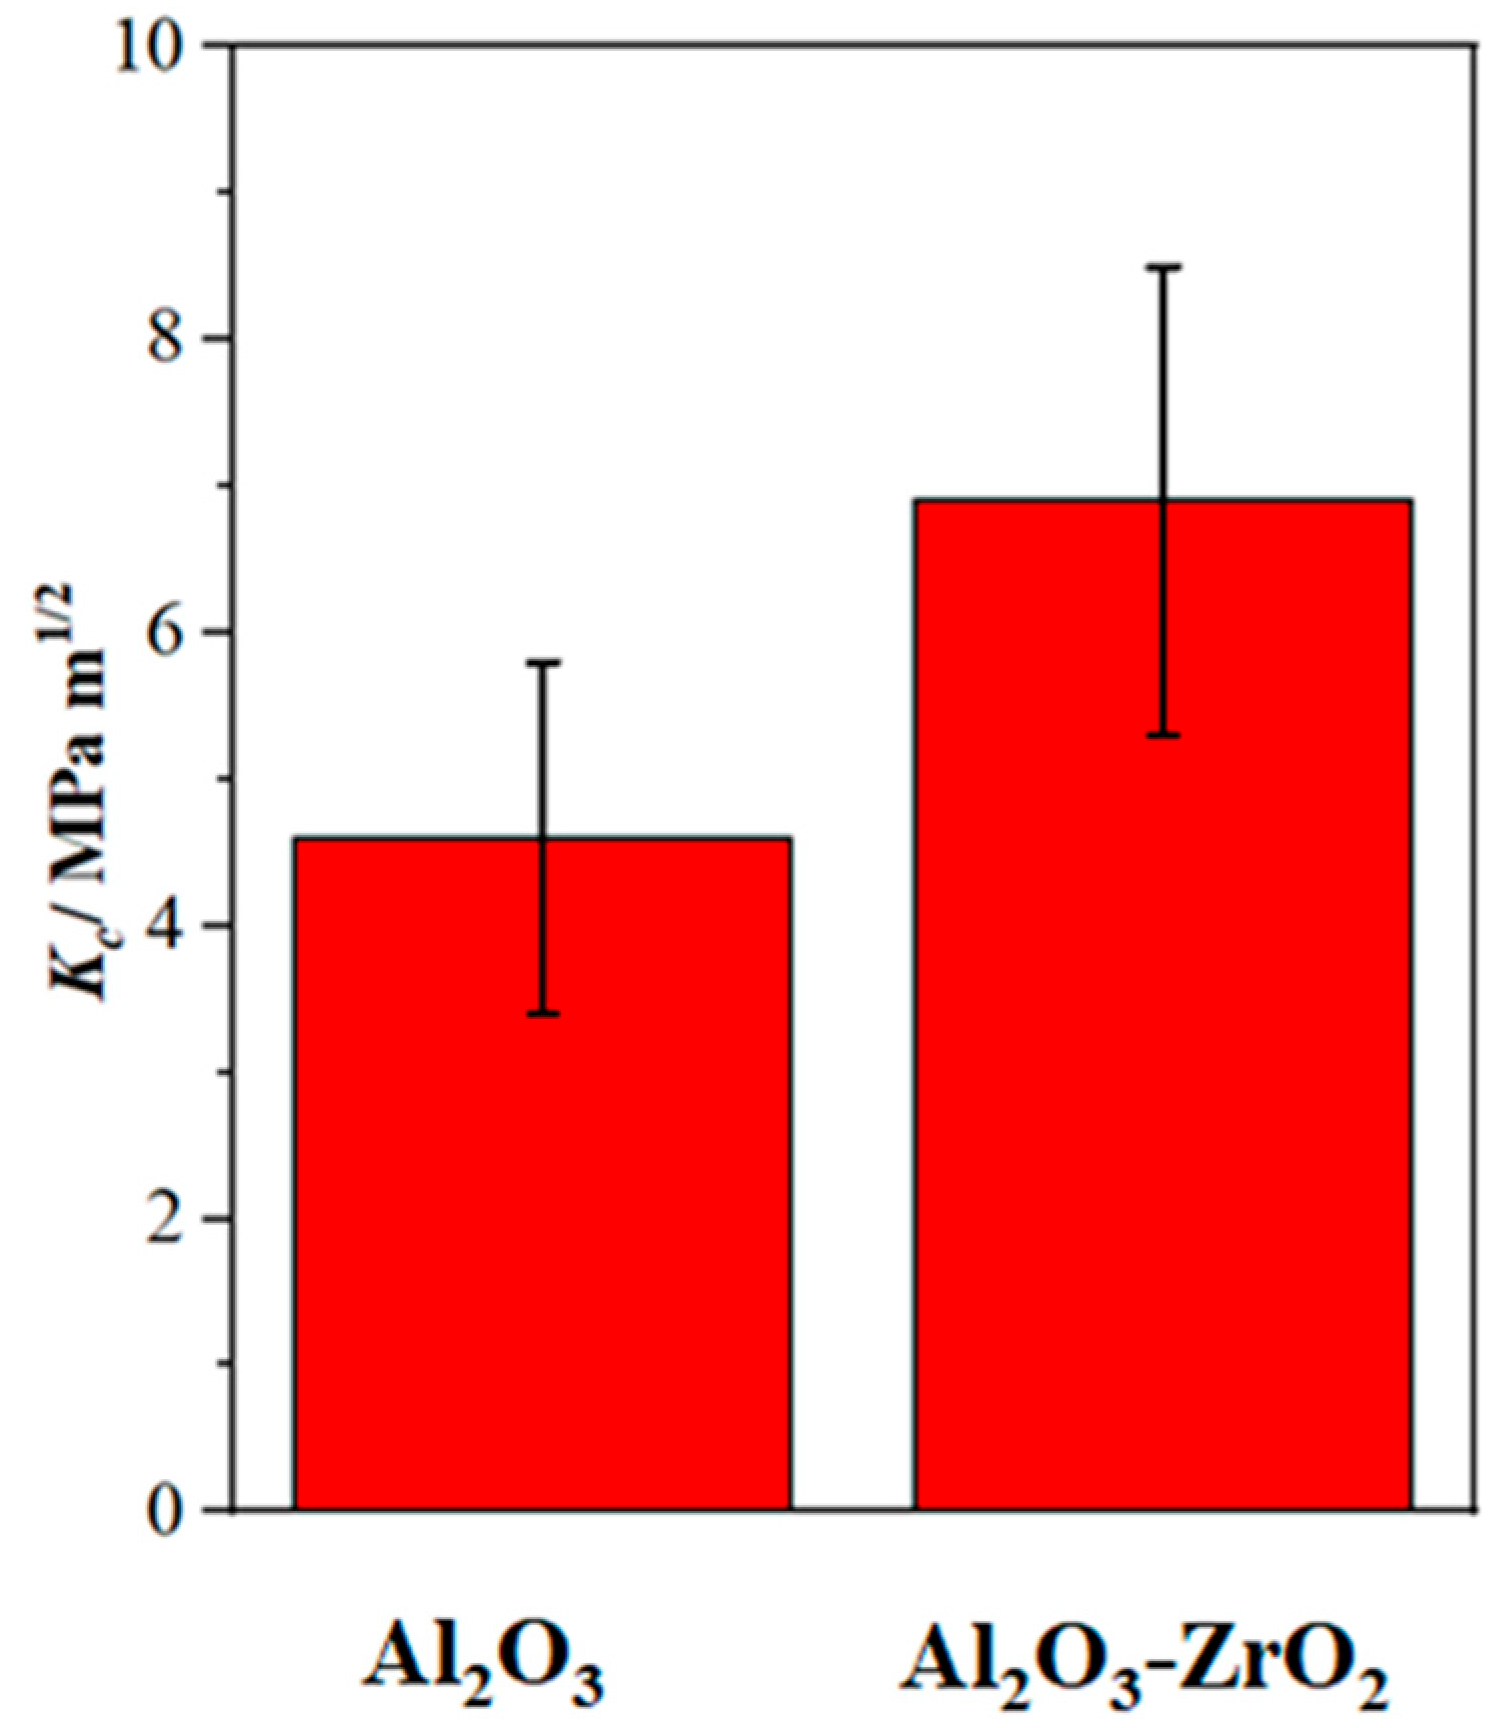
Al2O3 coatings, which can be produced by plasma electrolytic oxidation (PEO) on aluminum substrates, provide an excellent protection against corrosion and wear. However, due to the brittle nature of the oxide ceramic, the fracture toughness is limited. One approach to enhance the tolerance to fracture is the incorporation of ZrO2 to form zirconia toughened alumina (ZTA). In addition to its use as a bulk material, the application as a coating material enables a broader field of application. In this study, an Al2O3-ZrO2 composite coating was applied on a 6082 aluminum alloy using an aluminate-phosphate-based electrolytic solution containing a Zr-based salt. Polarization measurement as an indicator of the passivability of a given system revealed that Zr-based salt improves the passivation of the aluminum alloy. The coatings’ characteristics were evaluated by SEM, EDS, and XRD. ZrO2 incorporated into alumina as a metastable high-temperature modification led to a thicker coating with new morphologies including lamellar and dendritic structures. Nano-indentation showed that the incorporated Zr increase the average hardness of the compact layer from 16 GPa to 18 GPa. The fracture toughness of the coatings was investigated locally with nano-scratches applied on the compact outer layer of the coatings’ cross-sections. The Zr-containing electrolytic solution resulted in a coating with significantly higher fracture toughness (6.9 MPa∙m1/2) in comparison with the Zr-free electrolytic solution (4.6 MPa∙m1/2). Therefore, it is shown, that the PEO process stabilized a high-temperature allotrope of zirconia at room temperature without the need for rare-earth dopants such as Y2O3. Furthermore, it was demonstrated that the nano-scratch method is a suitable and accurate technique for the investigation of the fracture toughness of coatings with inherent cracks.
1. Introduction
Al2O3 is widely utilized in various applications, which require high wear resistance at elevated temperatures, thanks to its excellent mechanical and electric properties. However, Al2O3 has deficient fracture toughness and high brittleness [1], which can be a limiting factor for the application. To compensate this disadvantage and improve the fracture behavior, ZrO2 can be incorporated into Al2O3 to form zirconia toughened alumina (ZTA), which is well-known for its high-temperature mechanical strength, appropriate thermal shock resistance and low thermal conductivity as well as high fracture toughness [1,2]. In addition to its use as a bulk material, the application of ZTA as a coating enables a broader field of application due to the combination of a high-temperature and wear-resistant coating and a ductile substrate. Al2O3-ZrO2 composite coatings have been fabricated by thermal spraying [1,3], laser deposition [4], and plasma electrolytic oxidation [2,5,6,7].
Plasma electrolytic oxidation (PEO) is an advanced form of the anodizing process, which is often implemented in an environmentally friendly alkaline electrolyte under different electrical regimes including direct or alternating current at voltages higher than the ignition voltage leading to micro-discharges across the grown oxide [8,9,10,11,12,13].
Literature review shows that PEO Al2O3-ZrO2 coating may be produced through addition of ZrO2 nanoparticles [2], or Zr-based salt additives such as potassium zirconium carbonate (K2[Zr(CO3)2(OH)2]) [14], and dipotassium hexafluorozirconate (K2ZrF6) [7,15] into the electrolytic solution. Matykina et al. [2] prepared this coating in phosphate-based and silicate-based electrolytes, which contain monoclinic ZrO2 nano particles (m-ZrO2), and observed that the phosphate-based electrolytic solution developed high-temperature forms of zirconia including tetragonal ZrO2 (t-ZrO2) and/or cubic ZrO2 (c-ZrO2). Both phases could not be distinguished clearly by X-ray diffraction (XRD) because of overlapping diffraction peaks. However, the electrolyte with ZrO2 nano-particles is a suspension and therefore, it is potentially unstable. Especially in the context of the complex hydrodynamic conditions present within the discharge zone, reproducible coating results can only be expected to a limited extent. This may prove to be a disadvantage during the upscaling of the PEO process.
Rehman et al. [5] prepared corrosion-resistant Al2O3-ZrO2 coatings in a phosphate-based electrolyte through a two-step PEO process using K2ZrF6 additive. However, poisonous HF gas may evolve during the PEO process owing to the local acidification of the oxide/electrolyte interface. It was established that K2[Zr(CO3)2(OH)2] can produce viable ZrO2-containing coatings trough a PEO process [14,16].
When determining mechanical properties of thin coatings, standardized methods used for bulk materials have to be adapted in most cases. The standardized test method for the determination of fracture toughness of advanced ceramics is defined in ASTM C1421-18 [17]. In addition to this testing method, other strategies based on micro- or nano-indentation with a sharp probe have been established, mostly for analyzing bulk dental ceramics [18]; however, the application for coatings is also possible [19,20]. The common method is the Vickers-indentation fracture test where the fracture toughness, Kc, is calculated by a Vickers probe by using the following equation [21]:
where E and H are Young’s modulus and hardness, respectively. F and c0 are the indentation load and the average length of the radial cracks promoted by the indentation, respectively. α is a dimensionless constant [21]. Equation (1) has undergone numerous modifications in the past few years of research, incorporating factors such as crack type, residual stress, and plastic dissipation within the material. These parameters are obtained using dimensional analysis and empirical data; however, to date, there is no analytical model that fully supports them. In addition, it is critical to measure the length of the crack growing from the four corners of the indent accurately [22]. However, the application of this method for PEO coatings is challenging as the determination of cracks generated by nano-indentation is impeded by the inherent micro-cracks in the coating [23].
Another technique to evaluate the fracture toughness of a wide range of materials including ceramics, metals, and polymers is the nano-scratch test [22]. Four scratch-based methods have been utilized to calculate the fracture toughness: one is derived from linear-elastic fracture mechanics (LEFM), and the other three methods are developed on microscopic energetic size effect laws (MESEL) [24]. It is well-established that LEFM is applicable to brittle materials such as ceramics and glasses [24]. Using LEFM, the following equation was derived (lateral force Fl, the perimeter p, the horizontal projected load bearing contact area A) [25]:
As seen in Equation (2), fracture toughness can be estimated straightforward using nano-scratch tests. For scratch tests, it is necessary to apply normal loads which are neither too large nor too small in order to avoid crack-free and severe-damage regimes [24].
The main focus for the present study is the formation of Al2O3-ZrO2 coatings using PEO and the evaluation of the role of incorporated zirconia phases on the fracture toughness. The PEO Al2O3-ZrO2 coating was prepared using a stable aluminate-phosphate electrolytic solution, which contains K2[Zr(CO3)2(OH)2] as a non-toxic Zr-based salt. To establish, if zirconia incorporated in the PEO coating could enhance the fracture toughness as it does in bulk materials, nano-scratch tests are utilized for the determination of local fracture toughness.
2. Materials and Methods
2.1. Sample Preparation
Precision-turned cylindrical specimens of a 6082 Al alloy in peak-aged condition with a diameter of 16.5 mm and a height of 10 mm were used as substrates. Heat-shrinkable epoxy tubes were used for masking the specimen to ensure electrical insulation and to prevent any edge effects. The procedure was described in detail in [26]. The substrates were degreased in ethanol, etched in 3 wt%-NaOH solution at 50 °C for 20 s, and finally washed in distilled water and dried.
2.2. Polarization Test
Polarization method is an appropriate technique for the evaluation of the passivation capability of the electrolyte/substrate combination [26]. Therefore, polarization measurements were used for the study of the effect of Zr-based salt on the passivation of the substrate. Polarization measurements were conducted with an applied potential of up to 100 V, which does not trigger discharges. The time-dependent potential φ(t) and current density i(t) were recorded during the test. In order to quantify the passivation behavior of the different substrate/electrolyte combinations, the passivation parameter σ [27] was determined for all tests by integrating the i(t) curve between t = 100 and 220 s. A three-electrode system including Ag/AgCl (3 mol/L KCl) as the reference electrode, a platinum sheet as the counter electrode and 6082 Al alloy as the working electrode were used. Further details regarding the method can be found [27].
2.3. Plasma Electrolytic Oxidation Treatment
A power source pe861UA-500-10-24-S (plating electronics, Sexau, Germany) and a capsuled treatment station (Scheigenpflug, Leipzig, Germany) with a 5 L container were used for the production of PEO coatings. The experimental setup including the equipment for process diagnostic is described in detail in [26]. The reference coating was prepared in an electrolytic solution containing 0.2 mol/L NaAl2O (VWR Chemicals, Radnor, PA, USA) and 0.035 mol/L Na2HPO4 (Sigma-Aldrich, Saint Louis, MO, USA). The pH of the bath was adjusted up to 12 using dilute KOH (Sigma-Aldrich, Saint Louis, USA). In order to prepare the Al2O3-ZrO2 composite, 0.1 mol/L of the Zr-based salt K2[Zr(CO3)2(OH)2] (Lehvoss, Hamburg, Germany) was added to the reference electrolyte and the pH was raised to 12 by KOH. These electrolytes are summarized in Table 1.

Table 1.
Composition and pH of the electrolytic solutions used for the production of PEO coatings.
The process voltage was recorded with a ScopeCorder DL850 (Yokogawa, Musashino, Japan). In addition, the current signal was obtained by measuring the voltage drop over a shunt resistor (Isabellenhütte, Dillenburg, Germany). In order to capture optical process information and electrical process data simultaneously, a photodiode was placed near the working electrode. Further details are described in [26].
2.4. Coating Characterization
To analyze the cross-sectional morphology of the prepared coatings, a scanning electron microscope (SEM, model LEO 1455VP) and a field-emission SEM (FESEM, NEON 40EsB, Zeiss, Jena, Germany) were used. The specimens were cut and embedded in epoxy resin. The cross-sections were ground using SiC papers and polished with diamond paste. Cleaning was carried out ultrasonically in ethanol. Finally, the specimens were dried through airflow. Elemental analyses of the cross-section of the coatings were carried out using Energy Dispersive X-ray (EDX) spectroscopy. The average thickness of the coating was determined using at least 15 measuring points in the cross-section images through the software Image J 1.44p (version 1.6).
The X-ray diffractometer D8 Discover (Bruker, Billerica, MA, USA) was carried out using a Co Kα radiation source with point focus, a 2 mm pinhole aperture, and a LYNXEYE-XE-T detector. Accelerating voltage and tube current were 35 kV and 40 mA, respectively. PDF2 (2014) database of the International Centre for Diffraction data (ICDD) was employed for the identification of the phases.
2.5. Nanoindentation Measurement
A nano-indenter UNAT (ASMEC, Dresden, Germany) with a Berkovich indenter was used for the nanoindentation experiments on the polished cross-section of the coatings. The outer layer of the coating was used, as it was compact and therefore more suitable for subsequent investigations on the fracture toughness. At least 15 indents for each coating were performed using a normal load of 100 mN with a loading time of 10 s, a holding time of 5 s, and an unloading time of 4 s. The Oliver–Pharr method was used for the calculation of the hardness and indentation modulus [28].
2.6. Nano-Scratch Experiment and Methods for Calculating the Fracture Toughness
Nano-scratch tests were carried out with the nano-indenter UNAT (ASMEC, Dresden, Germany) as short, high-resolution scratches using a lateral force unit. The procedure for a standard scratch test includes three main steps: pre-scan, scratching and post-scan which is explained in detail in [29]. Using a spherical diamond tip with a diameter (R) of 10 µm, a linearly progressive normal load (Fn) of up to 300 mN was applied on the polished cross-section of the PEO coatings. The nano-scratch was applied through scanning at 3 µm/s over a 10 µm track. The load of pre- and post-scans was 1 mN. As there is no literature to compare with, the scratching parameters for the PEO coatings were experimentally determined. It is important to mention that the PEO coating without incorporated zirconia served as the reference coating and its lower fracture resistance determined the used nano-scratch parameters. The software of UNAT-InspectorX recorded the variations of penetration depth (Pd), lateral force (Fl), and normal force (Fn) in relation to the scratch distance. To avoid the effect of pores and cracks in the coating on the calculated fracture toughness, the scratches were applied merely on the compact parts of the coating outer layer, which is illustrated in Section 3.3. In addition, it will be shown that Zr affects the microstructure of the outer layer of the PEO coating, significantly. Therefore, the capability of Zr for enhancing fracture toughness of PEO alumina was studied by focusing on the compact outer layer. As the application of nano-scratch tests is a novel strategy for the evaluation of fracture toughness of PEO coatings, they were carried out on three samples of each coating condition for sufficient statistical reliability. Overall, at least 15 nano-scratches were applied for each condition.
For a spherical indenter, Equation (3) can be extracted from Equation (2) [25]:
When using an indenter diameter of R = 10 µm, Equation (3) can be rewritten as the following numerical-value equation:
where the units for Fl, Kc and dp are mN, MPa∙m1/2, and µm, respectively. Based on Equation (4), Kc can be calculated through the linear fitting of the Fl–dp/R curve.
3. Results
3.1. Polarization Measurements
Polarization measurements were conducted in the reference electrolyte and the Zr electrolyte. The results are presented in Figure 1.

Figure 1.
(a) φ(t)- and i(t)- diagrams of the polarization measurements recorded on 6082 Al alloy in the reference electrolyte and the Zr electrolyte. (b) The passivation parameter σ determined by integrating the i(t) curve between t = 100 and 220 s. With the addition of Zr-based salt into the electrolyte, the passive region of the substrate is extended, which indicates a positive effect regarding the passivation behavior.
The i(t) curve can be divided into the three regions “active”, “passive”, and “transpassive” based on a model proposed by Krysmann and Kurze [10]. First, an ion-conducting oxide layer is formed on the substrate by the anodic polarization and results in a sharp peak called “active peak” in the i(t) curve. The oxide layer thickens and this appears as a low-slope region indicating a “passive region” in the plot. Continuously increasing voltage allows for the evolution of oxygen molecules on the anode, leading to a sharp increase in the current density (“transpassive region”). As seen in Figure 1a, the addition of Zr-based salt into the bath extends the passive region of the substrate, indicating the positive effect on the passivability of the substrate. This is confirmed by the σ-value, which is (103 ± 5) As/dm² for the reference electrolyte and (71 ± 8) As/dm² for the Zr containing solution. Lower σ-values correspond to a better passivation.
3.2. Process Diagnostics
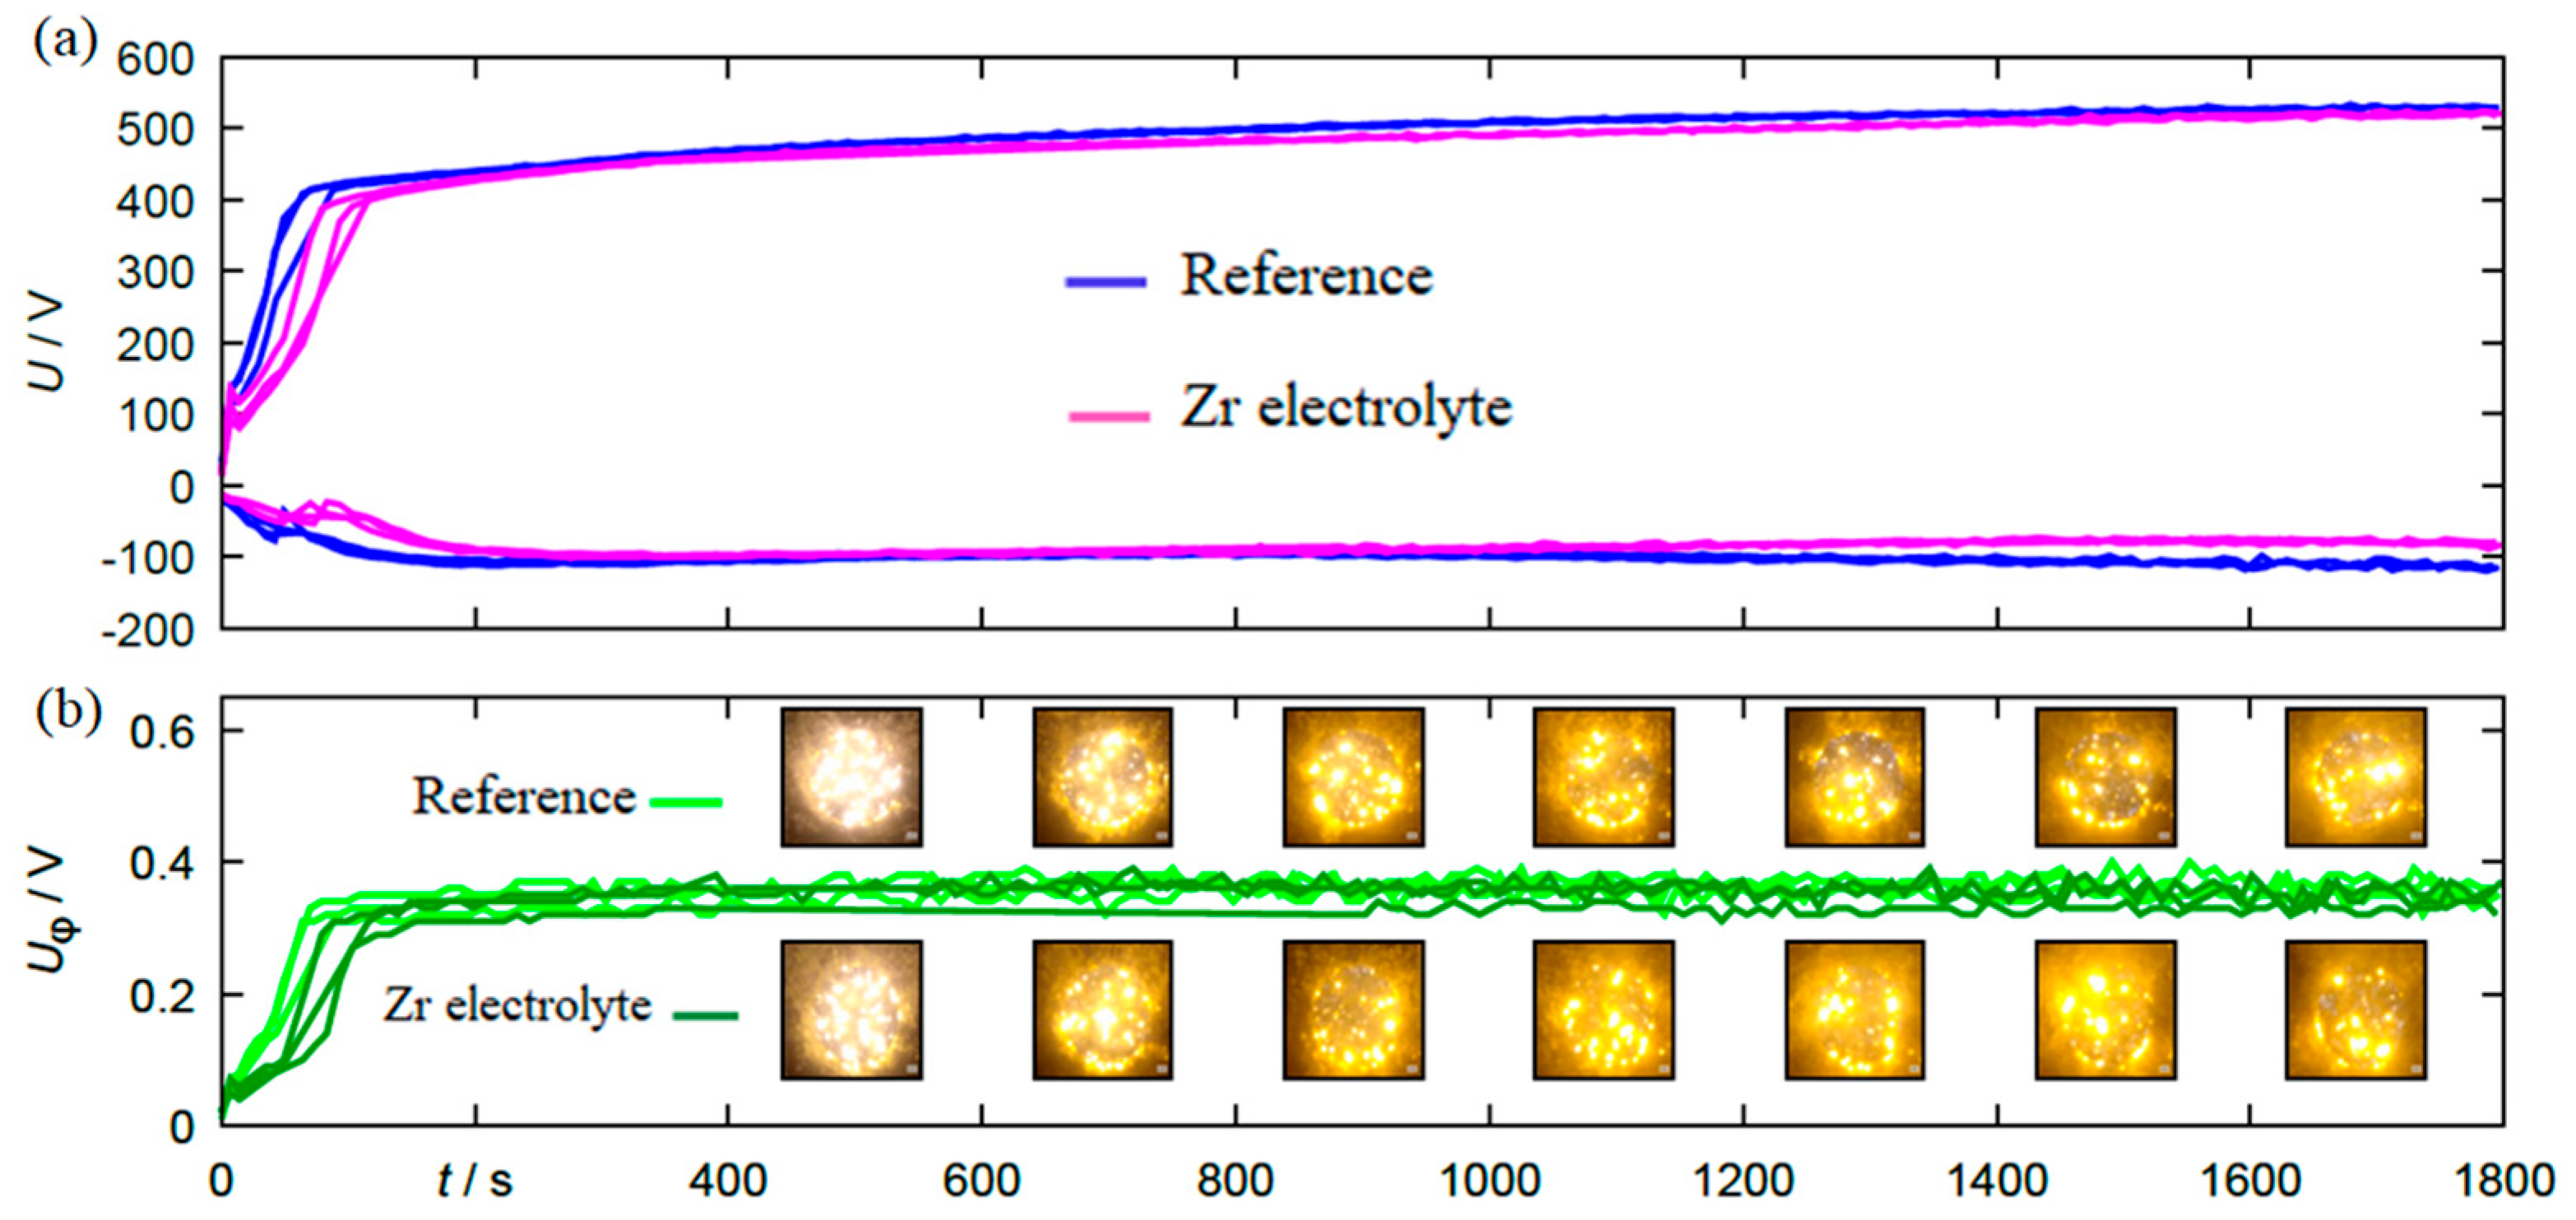
The results of the electrical and optical process diagnostics are summarized in Figure 2. Figure 2a shows the course of the anodic and cathodic peak voltage over the process time.
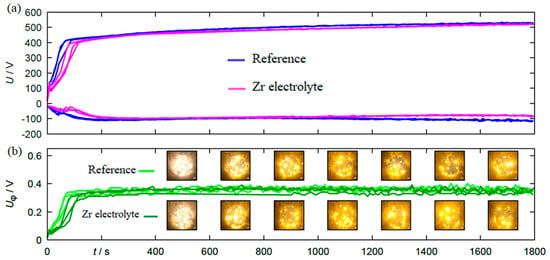
Figure 2.
(a) The course of anodic and cathodic peak voltage and (b) the photo-voltage for specimens coated by PEO process in the reference electrolyte and the Zr electrolyte.
Figure 2b shows the maximum photovoltage as well as single frames of the video recordings placed to the corresponding process stage. Both the voltage envelopes and the course of the photovoltage show good reproducibility for the individual experimental repetitions within the same electrolyte. A direct comparison of the electrical, photoelectrical and optical process data between the experiments in the two different electrolytes additionally shows that there are no major differences in the process behavior. Only the process initiation is delayed by a few seconds in the Zr electrolyte, which should result in generally similar coatings. Thus, in principle, the produced sample material is suitable for direct comparisons with regard to mechanical characterizations.
3.3. Microstructure and Phase Analyses
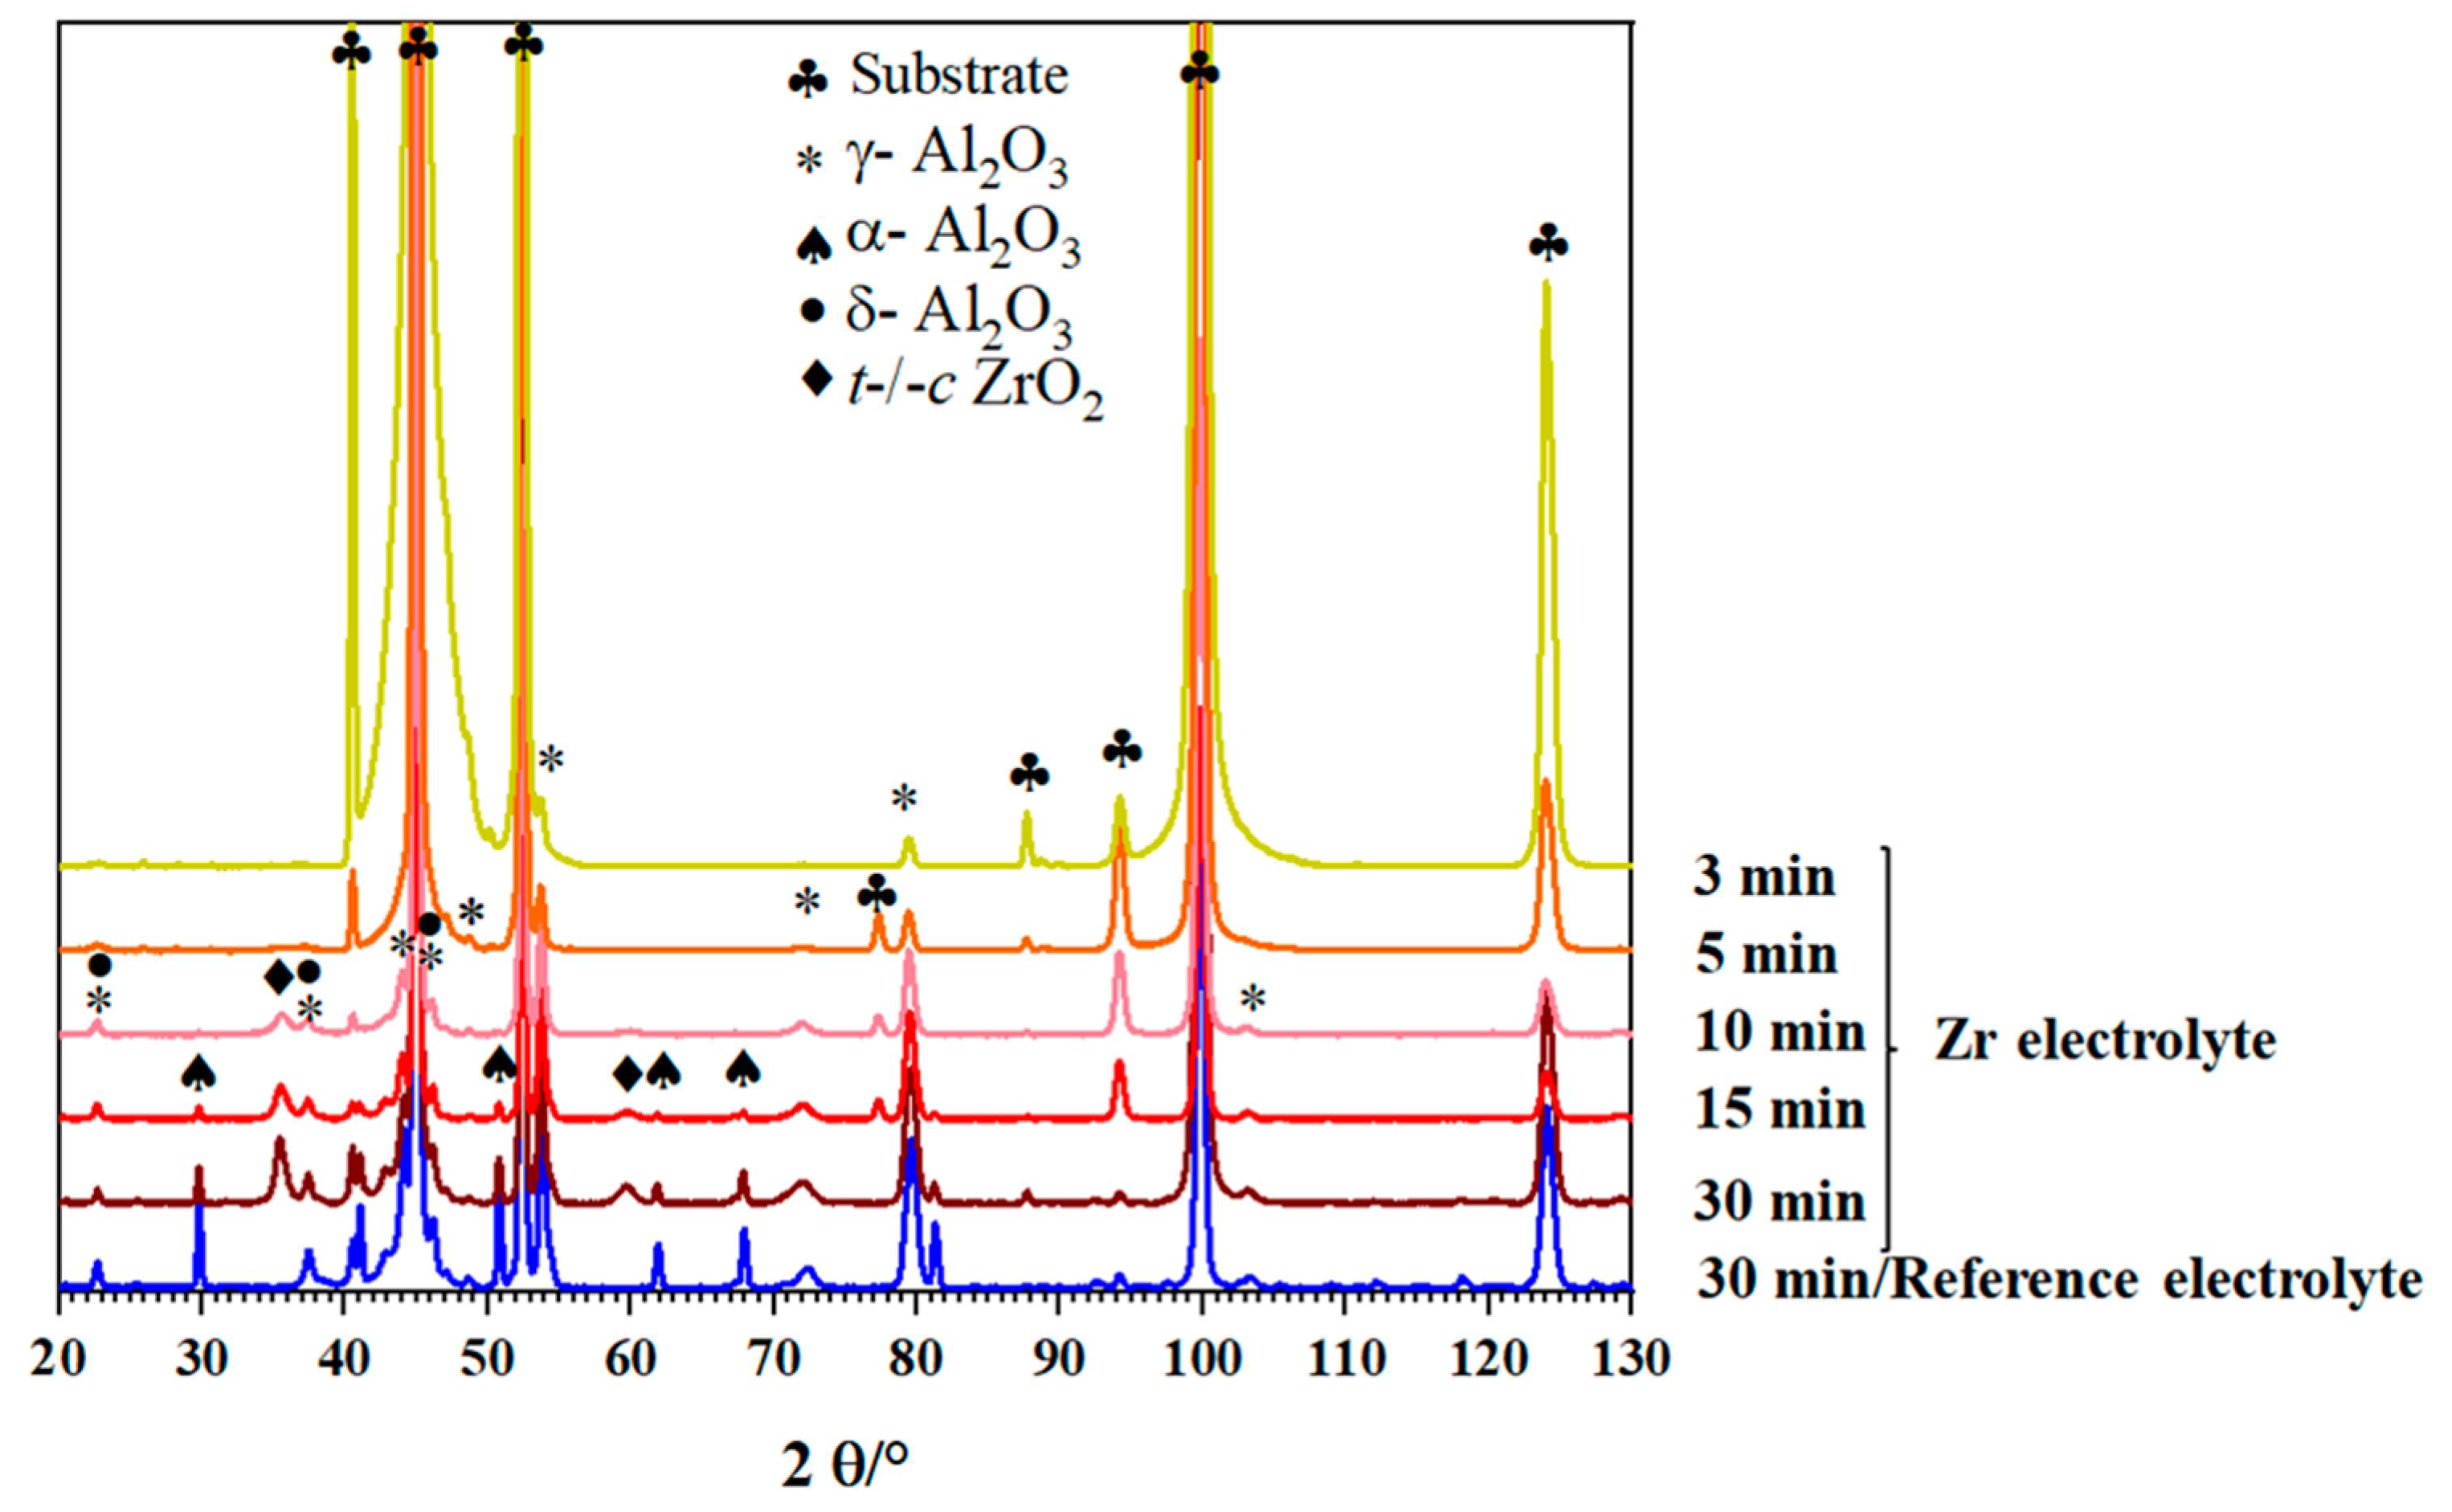
Figure 3 shows the XRD diagrams of the PEO coatings produced under alternating-current (AC) mode in the Zr electrolyte for different process times. For comparison, the diffraction diagram of the reference coating is also shown.
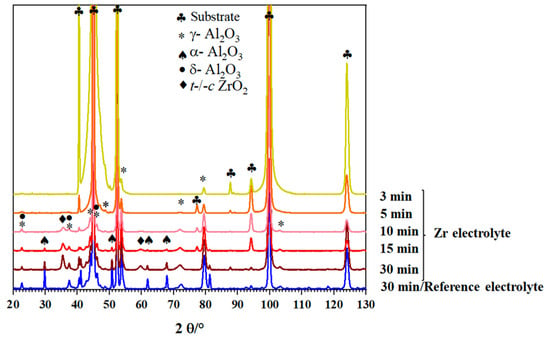
Figure 3.
XRD diagrams of coatings prepared from the Zr electrolyte during different process times compared to the reference coating at 30 min process time.
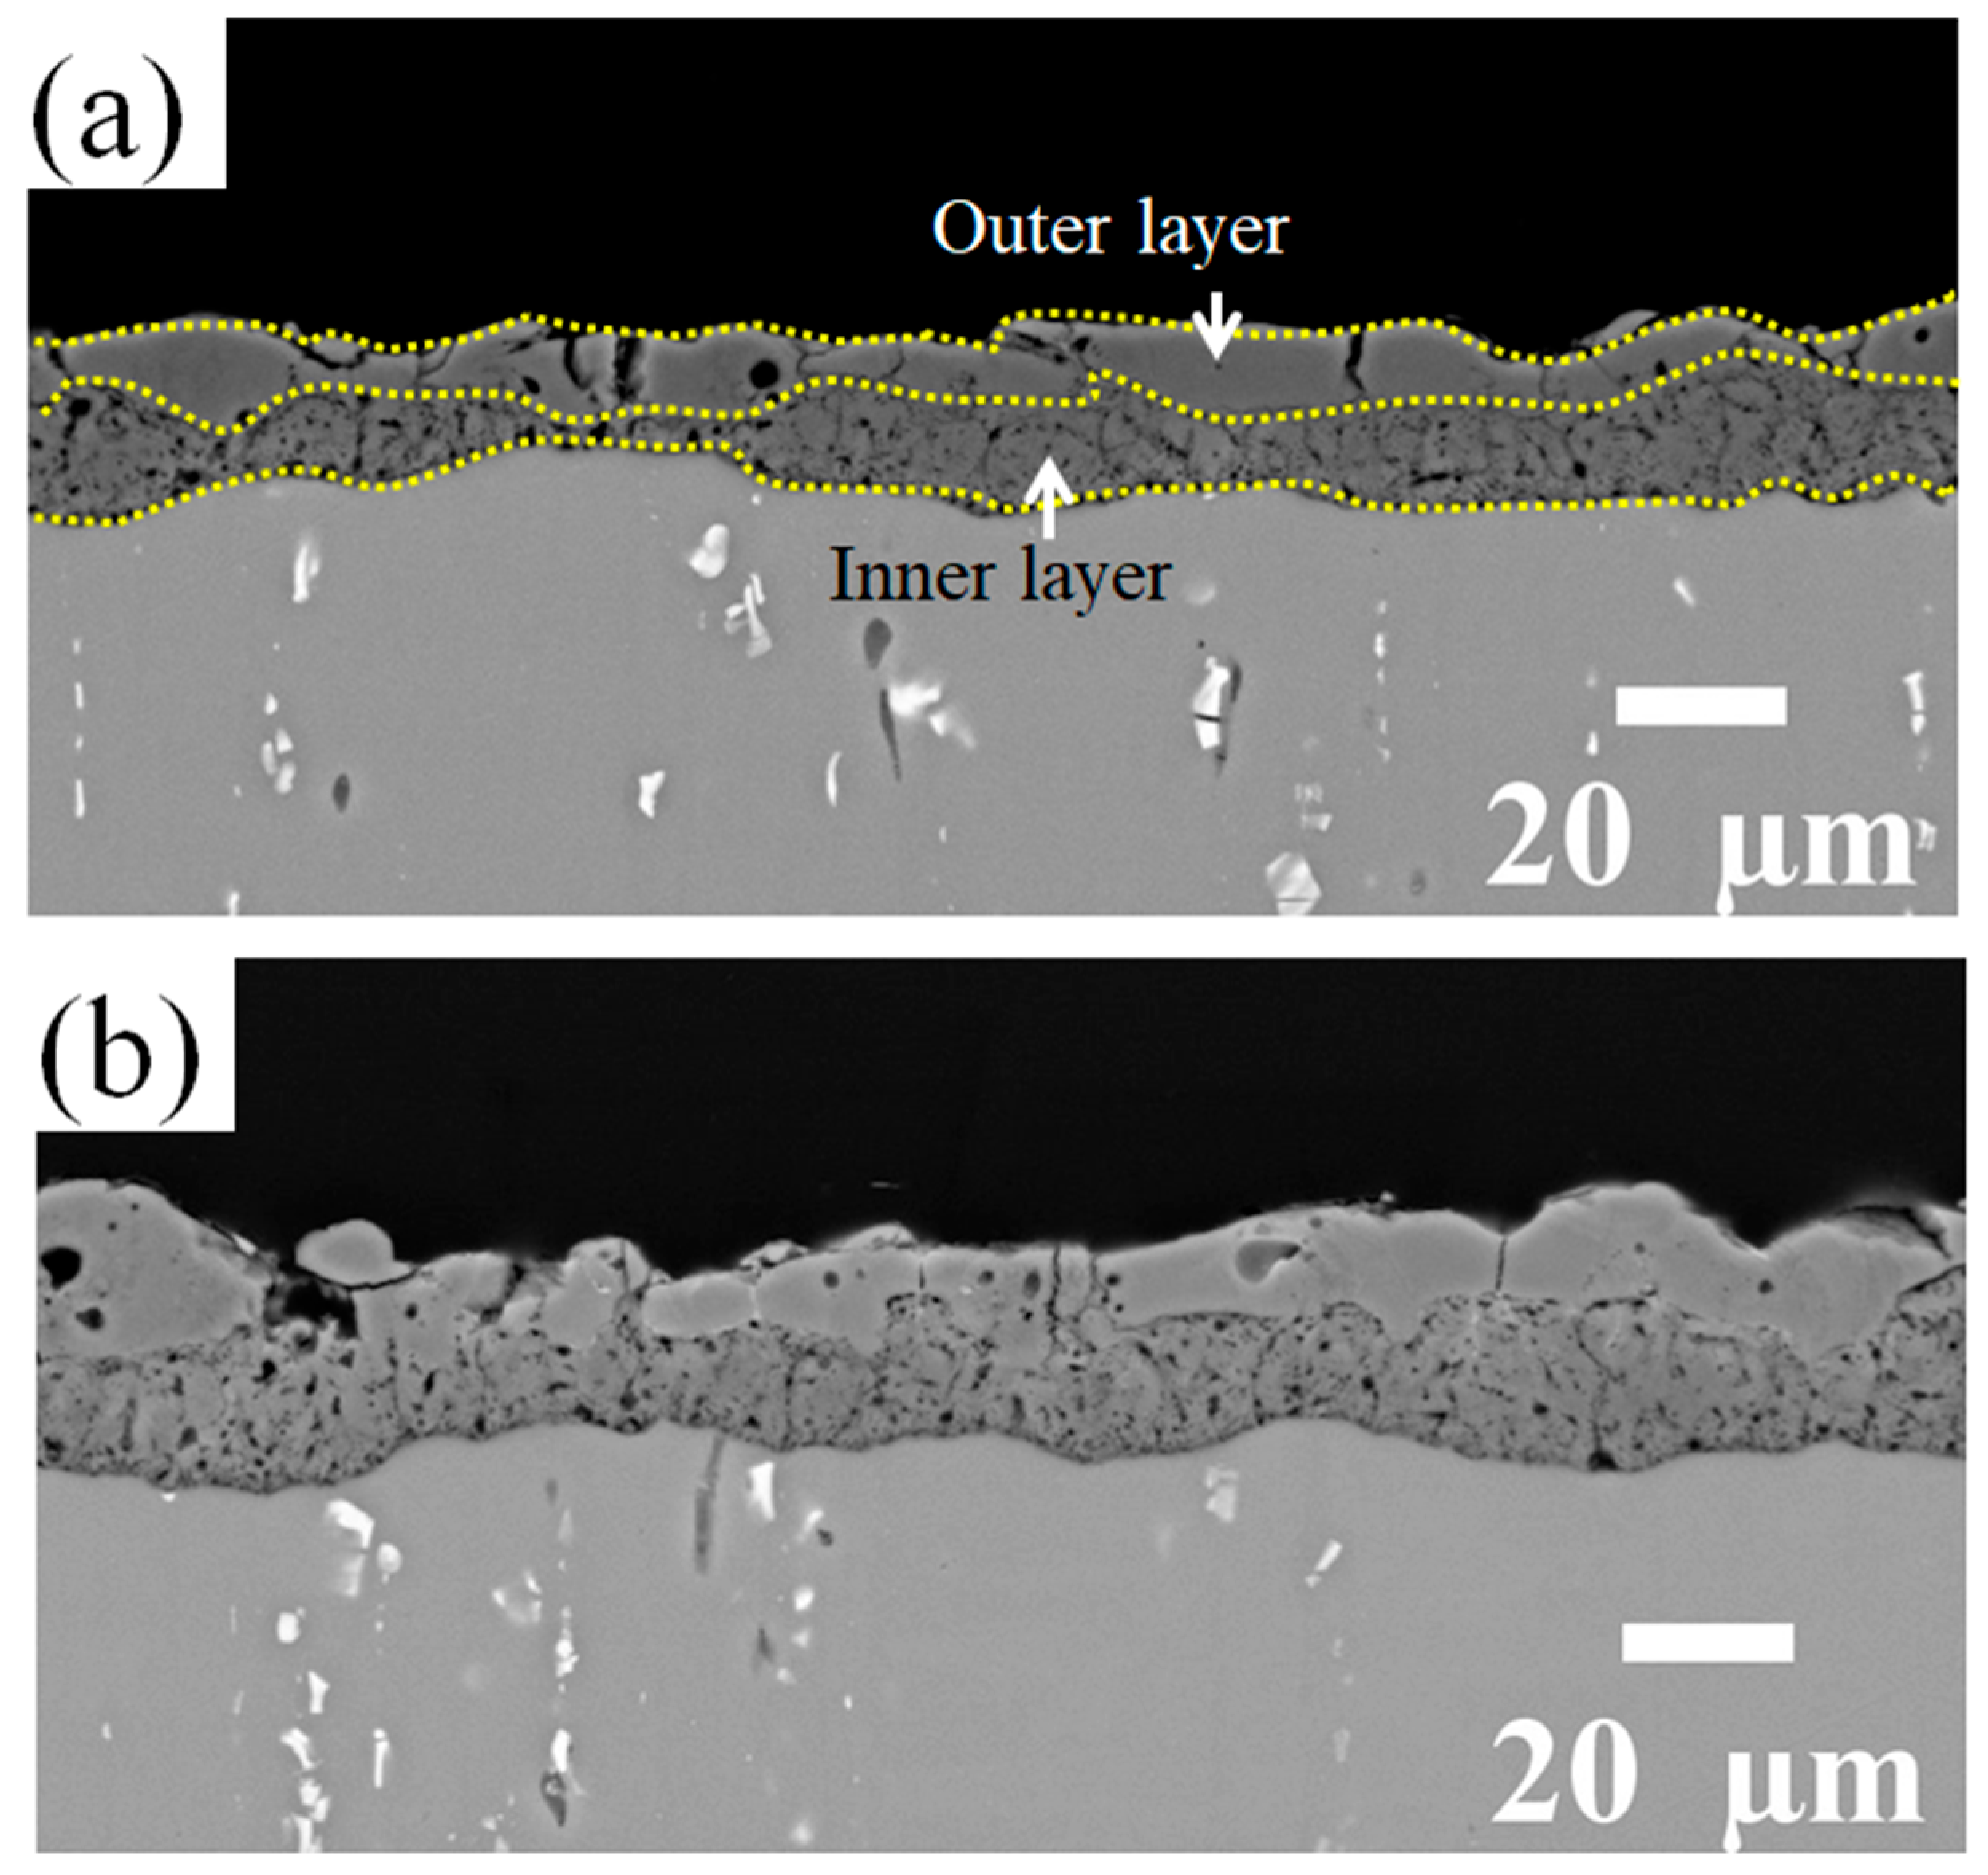
The coating produced in the reference electrolyte is mainly composed of γ-Al2O3 (JCPDS card number: 01-074-2206) and α-Al2O3 (JCPDS card number: 01-046-1212) as well as δ-Al2O3 (JCPDS card number: 00-056-1186). By adding the Zr-based compound to the PEO bath, diffraction peaks of α-Al2O3 become weaker, while the peaks related to t/c-ZrO2 phases (JCPDS card number: 00-050-1089) appear. In order to study the evolution of the phase composition, PEO composite coatings were prepared using different process times (3 min, 5 min, 10 min, and 15 min). As can be seen in Figure 3, the increase in the process time causes the formation of other alumina phases including δ-Al2O3 and α-Al2O3 in addition to γ-Al2O3, similar to the coatings from the reference electrolyte. In addition, t/c-ZrO2 is detectable in the coatings for processing times longer than 10 min. Figure 4a,b present cross-sectional SEM images using the backscattered electrons detector (BSD) of the Al2O3 and Al2O3-ZrO2 coatings, respectively.
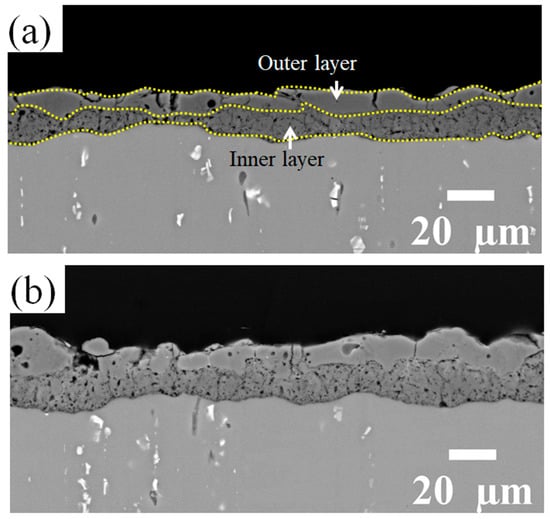
Figure 4.
BSD cross-section images of (a) the reference coating and (b) the coating prepared in the Zr electrolyte. Both PEO coatings exhibit a two-layered structure with a more compact outer layer.
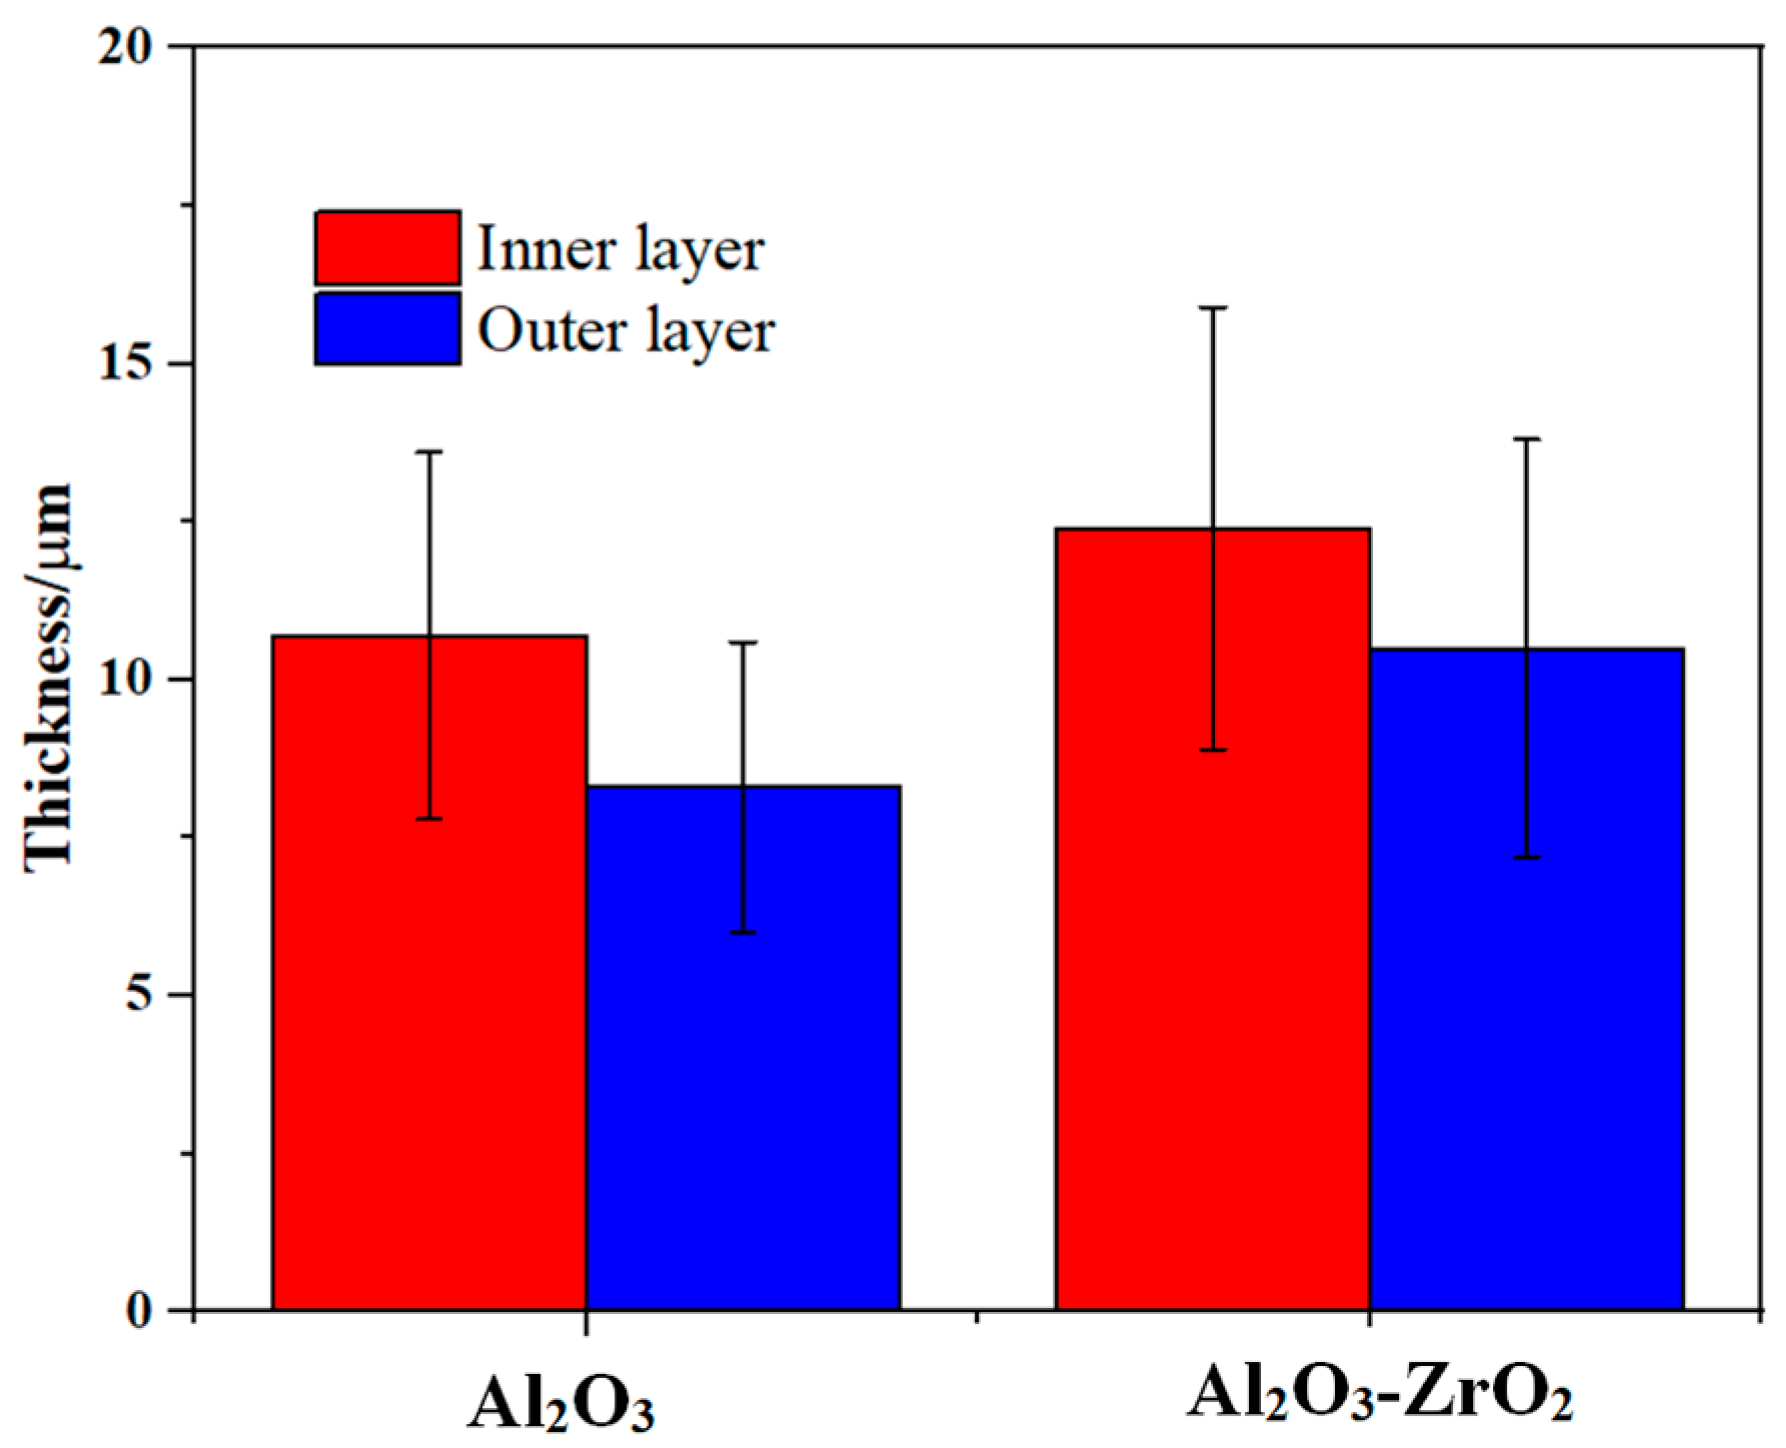
Both coatings have a two-layered structure, which includes a more compact outer layer with vertical cracks, and micro-pores and a finely porous inner layer. However, with the addition of Zr-based salt, the number of vertical cracks in the outer layer is decreased, and they are shallower. The thickness of the layers is presented in Figure 5. The addition of Zr-based salt into the PEO bath increased the thickness of the coating’s outer layer from 10 µm to 12 µm and that of the inner layer from 8 µm to 11 µm when using identical parameters in the PEO process.
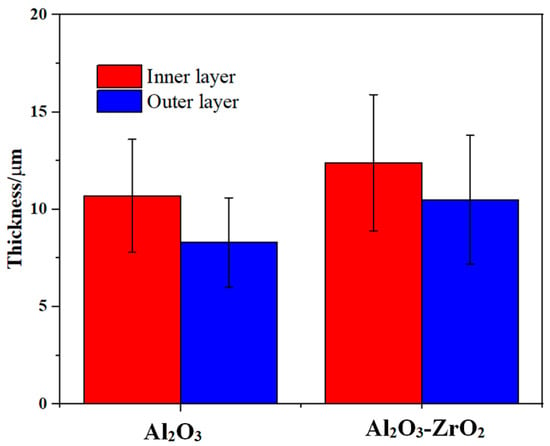
Figure 5.
Average value and standard deviation of the thickness of the outer and inner layers of the reference coating and the coating prepared in the Zr electrolyte extracted from the cross-section images in Figure 4. The formed composite coating exhibited a higher thickness for identical processing time, when compared to the reference coating.
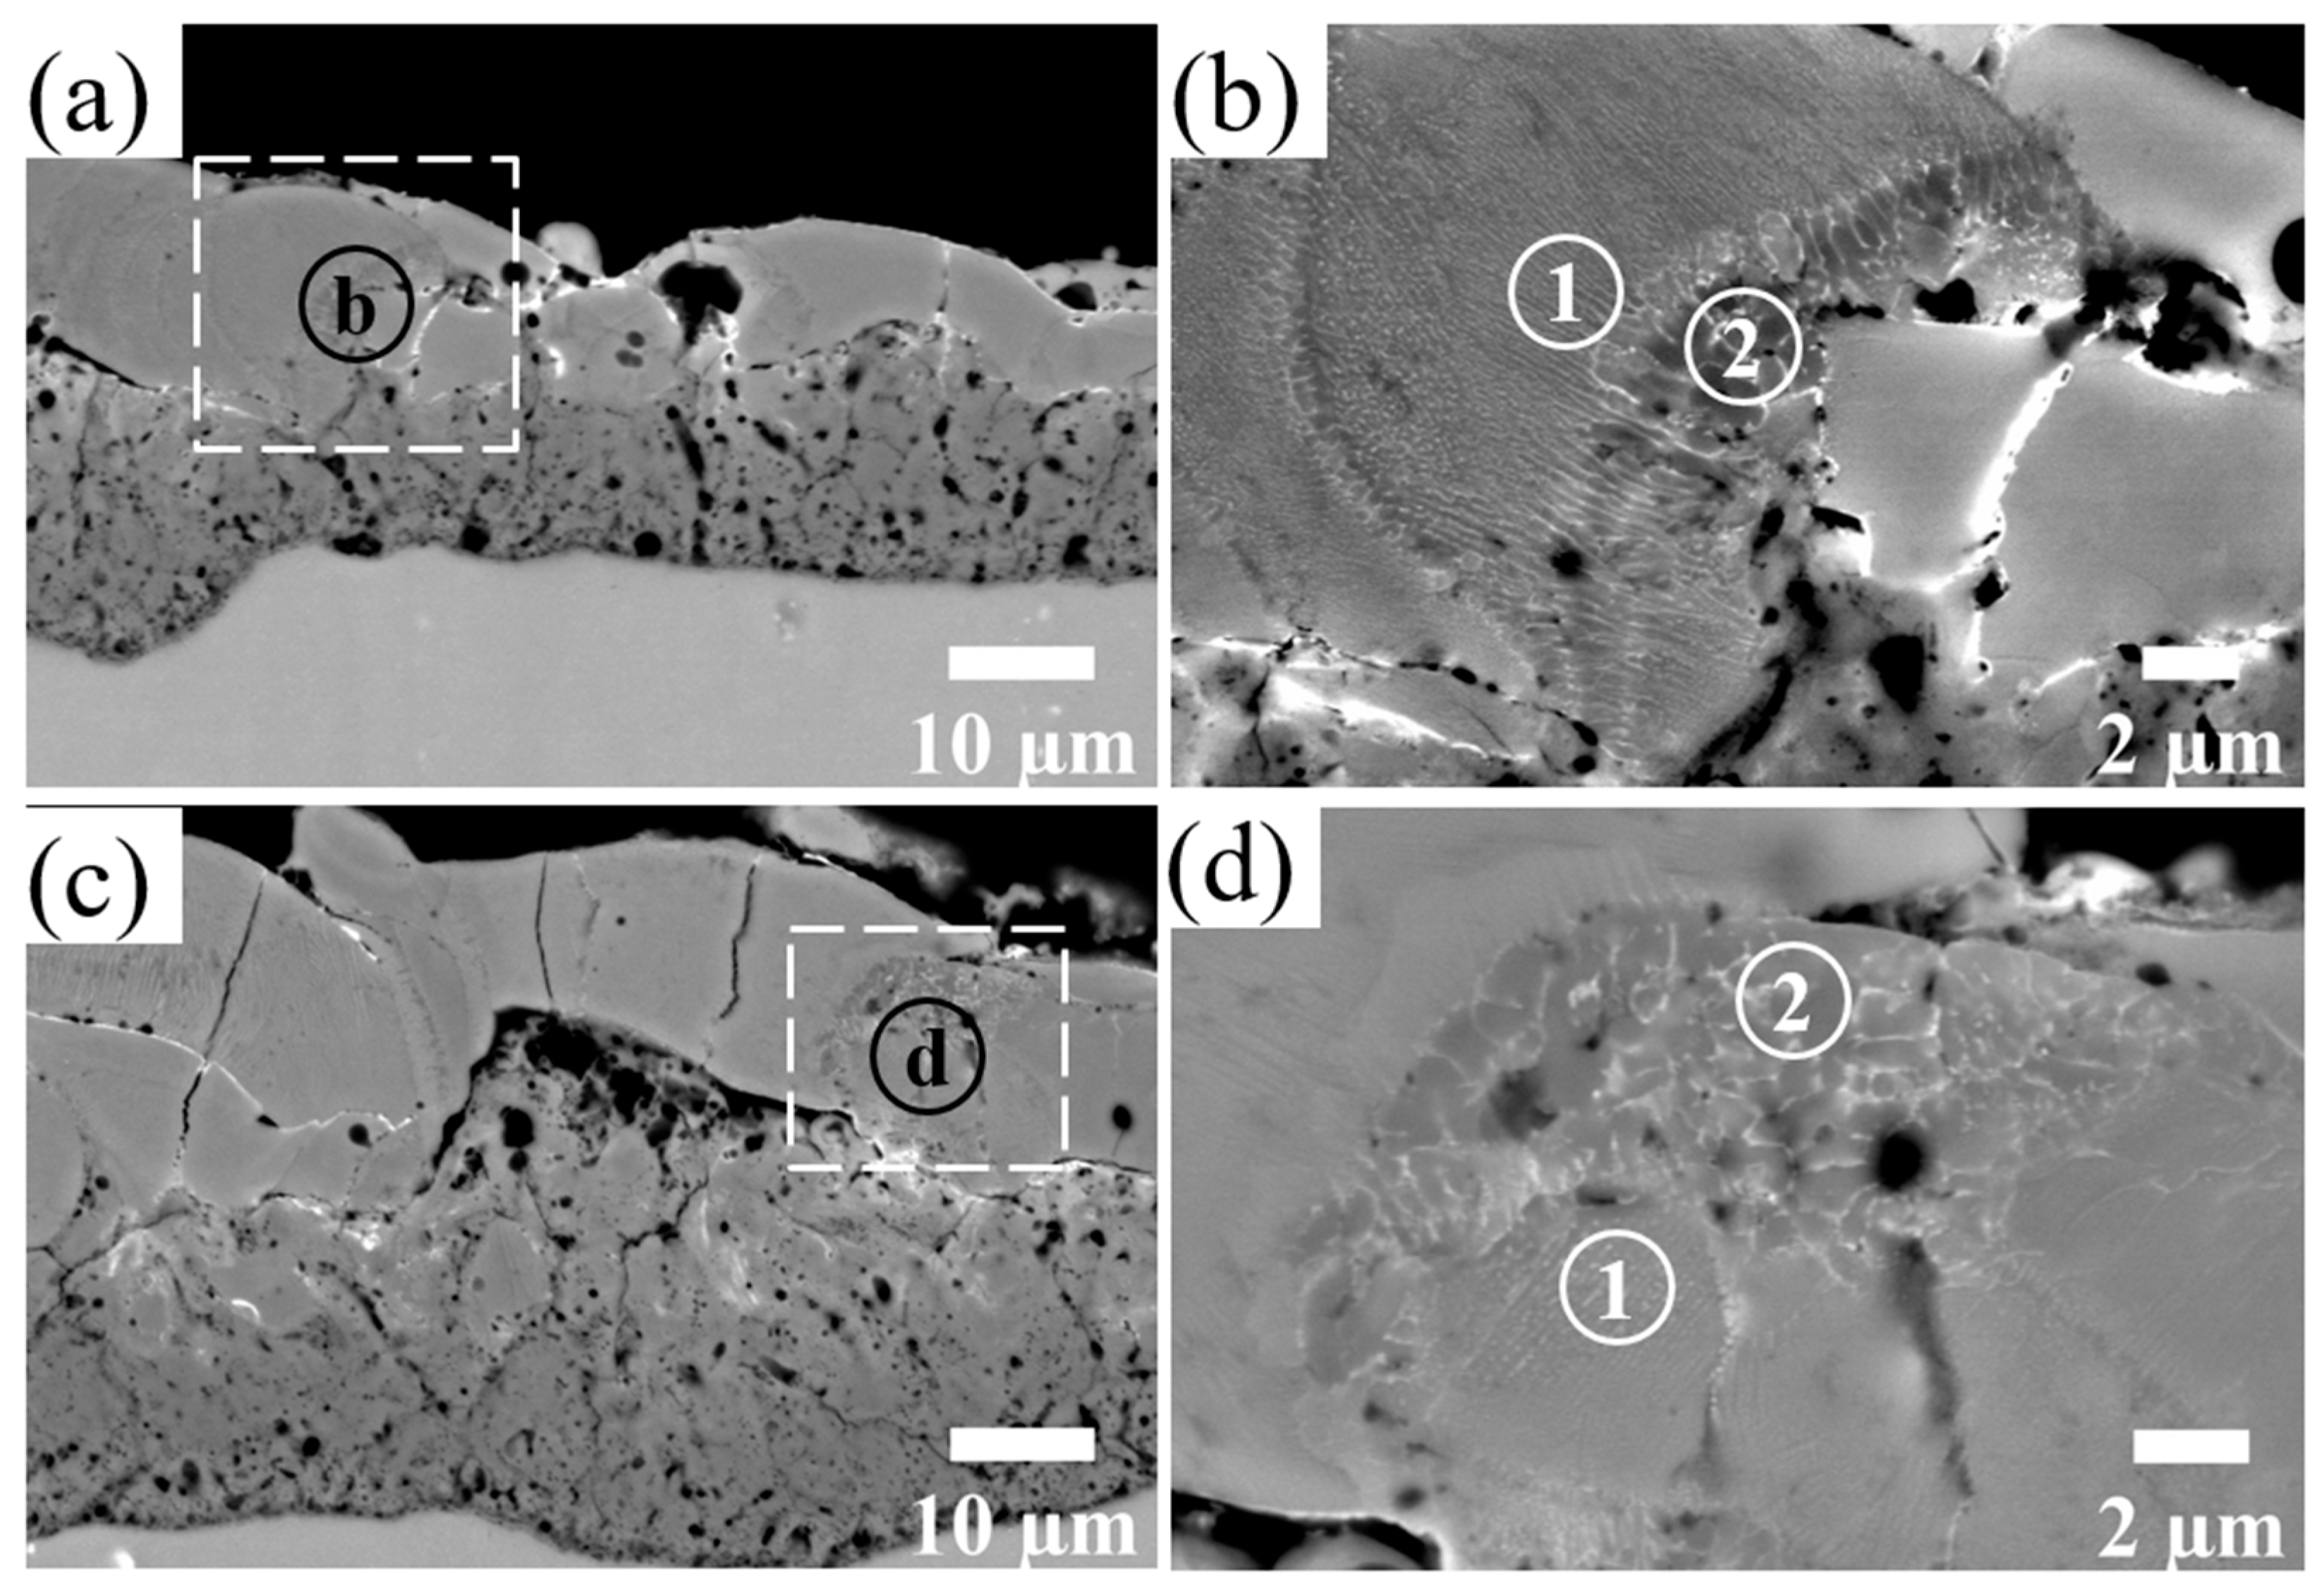
EDS analyses were carried out on the cross-sections of the coatings. However, due to the overlapping of Zr Lα and P Kα lines, it is only possible to detect the existence of the two elements with EDS but not to distinguish between them. Therefore, in addition, FESEM was used to identify the Zr distribution using a BSD and the contrast in the micrograph resulting from the difference in the atomic numbers (ZP = 15 and ZZr = 40).
The relatively light-gray regions of the coating in the BSD images indicate an increased amount of Zr relative to the adjacent material. In Figure 6b,d, the detailed examination of the outer layer reveals either zones with a more lamellar structure such as region 1 or zones with a typical dendritic structure such as region 2.
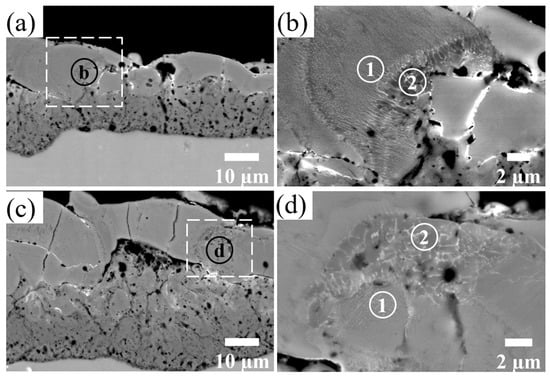
Figure 6.
BSD images of the cross-section of the Al2O3-ZrO2 coating with different magnifications. Images (b,d) show the magnified areas of images (a,c), respectively. Regions containing Zr either have lamellar (regions 1) or dendritic (regions 2) structures.
3.4. Mechanical Testing
3.4.1. Nano-Indentation Tests
Determined via nano-indentation on the outer layer of the polished cross-sections, the hardness values of the reference and the Al2O3-ZrO2 coatings were (16 ± 4) GPa and (18 ± 2) GPa, respectively. Furthermore, Young’s moduli of the reference and Al2O3-ZrO2 coatings were (178 ± 29) GPa and (208 ± 14) GPa, respectively. Therefore, coatings prepared in the Zr electrolyte show higher hardness and higher Young’s modulus with a lower standard deviation in comparison with the reference coating.
3.4.2. Nano-Scratch Test
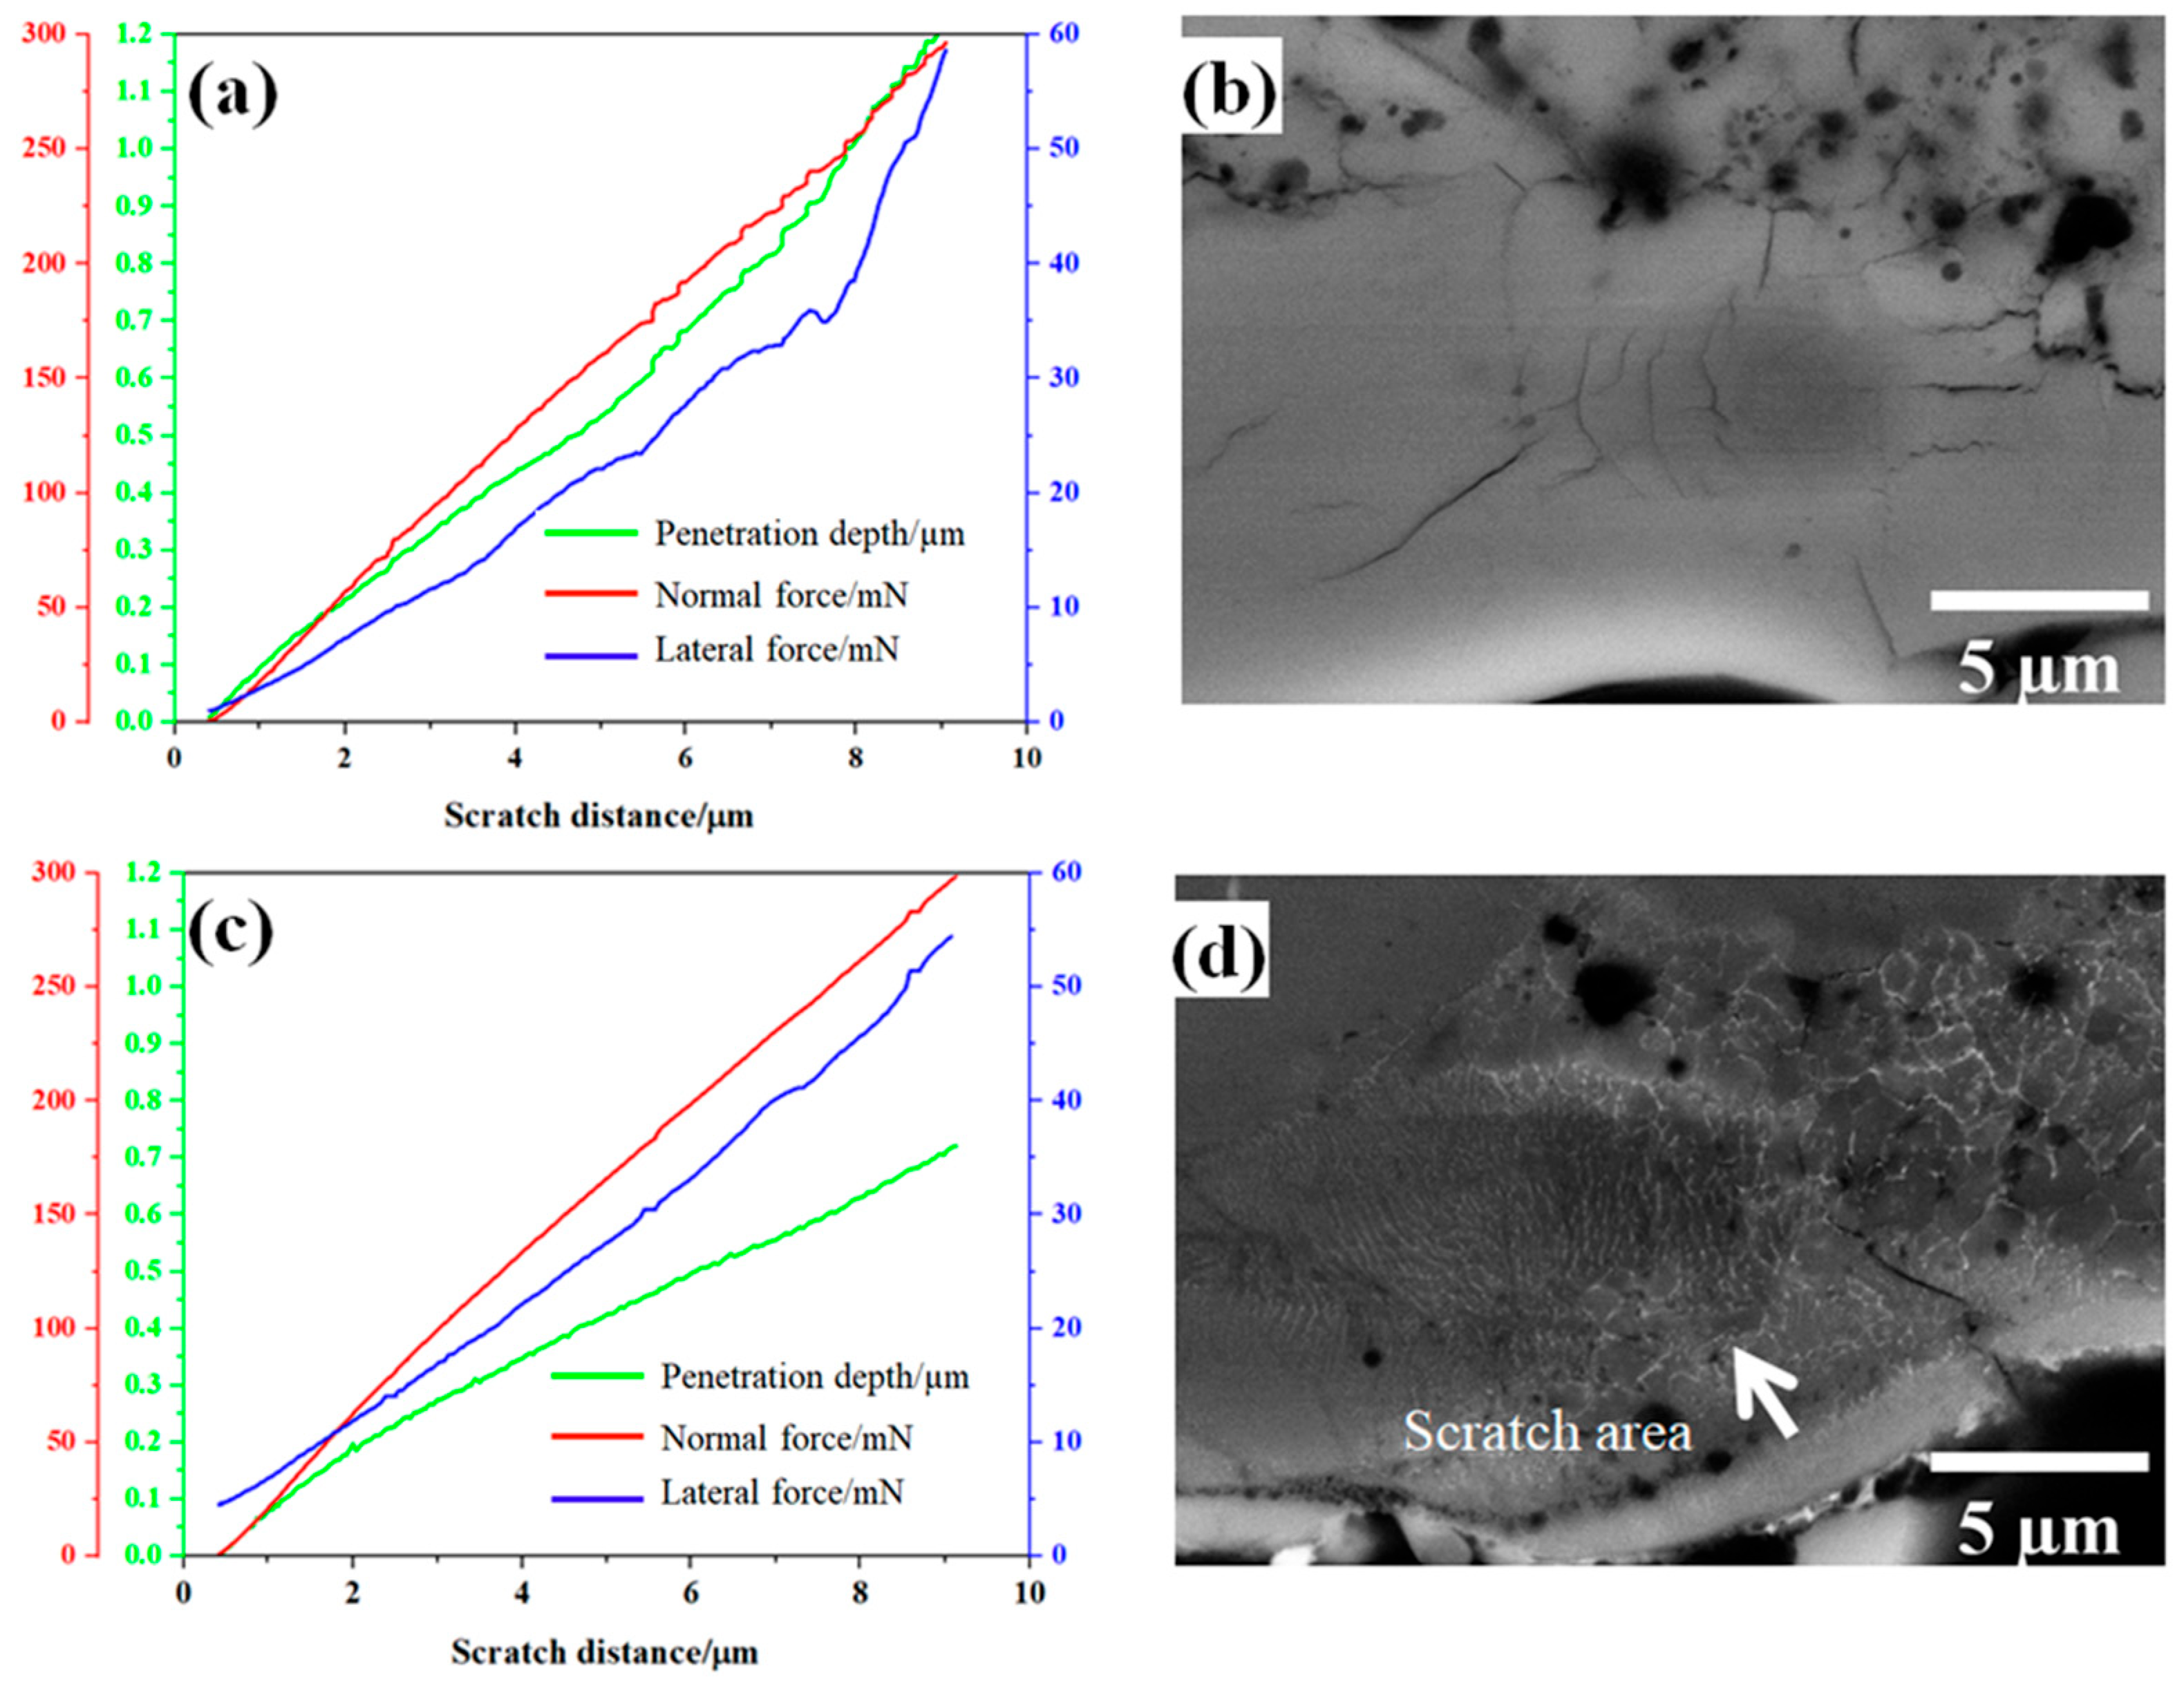
Figure 7 shows representative nano-scratch results and BSD images for the reference and the Al2O3-ZrO2 coatings.
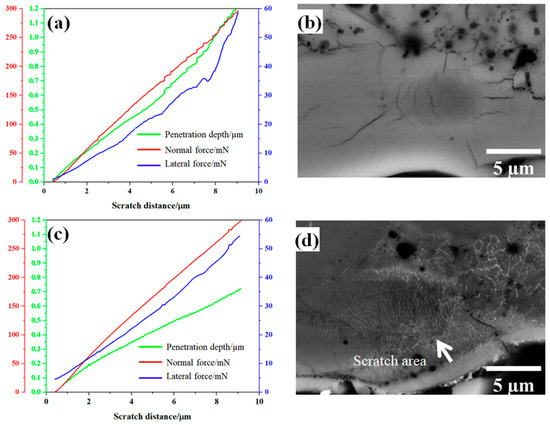
Figure 7.
Nano-scratch results and BDS images of one representative scratch on the Al2O3 reference coating (a,b) and the Al2O3-ZrO2 coating (c,d).
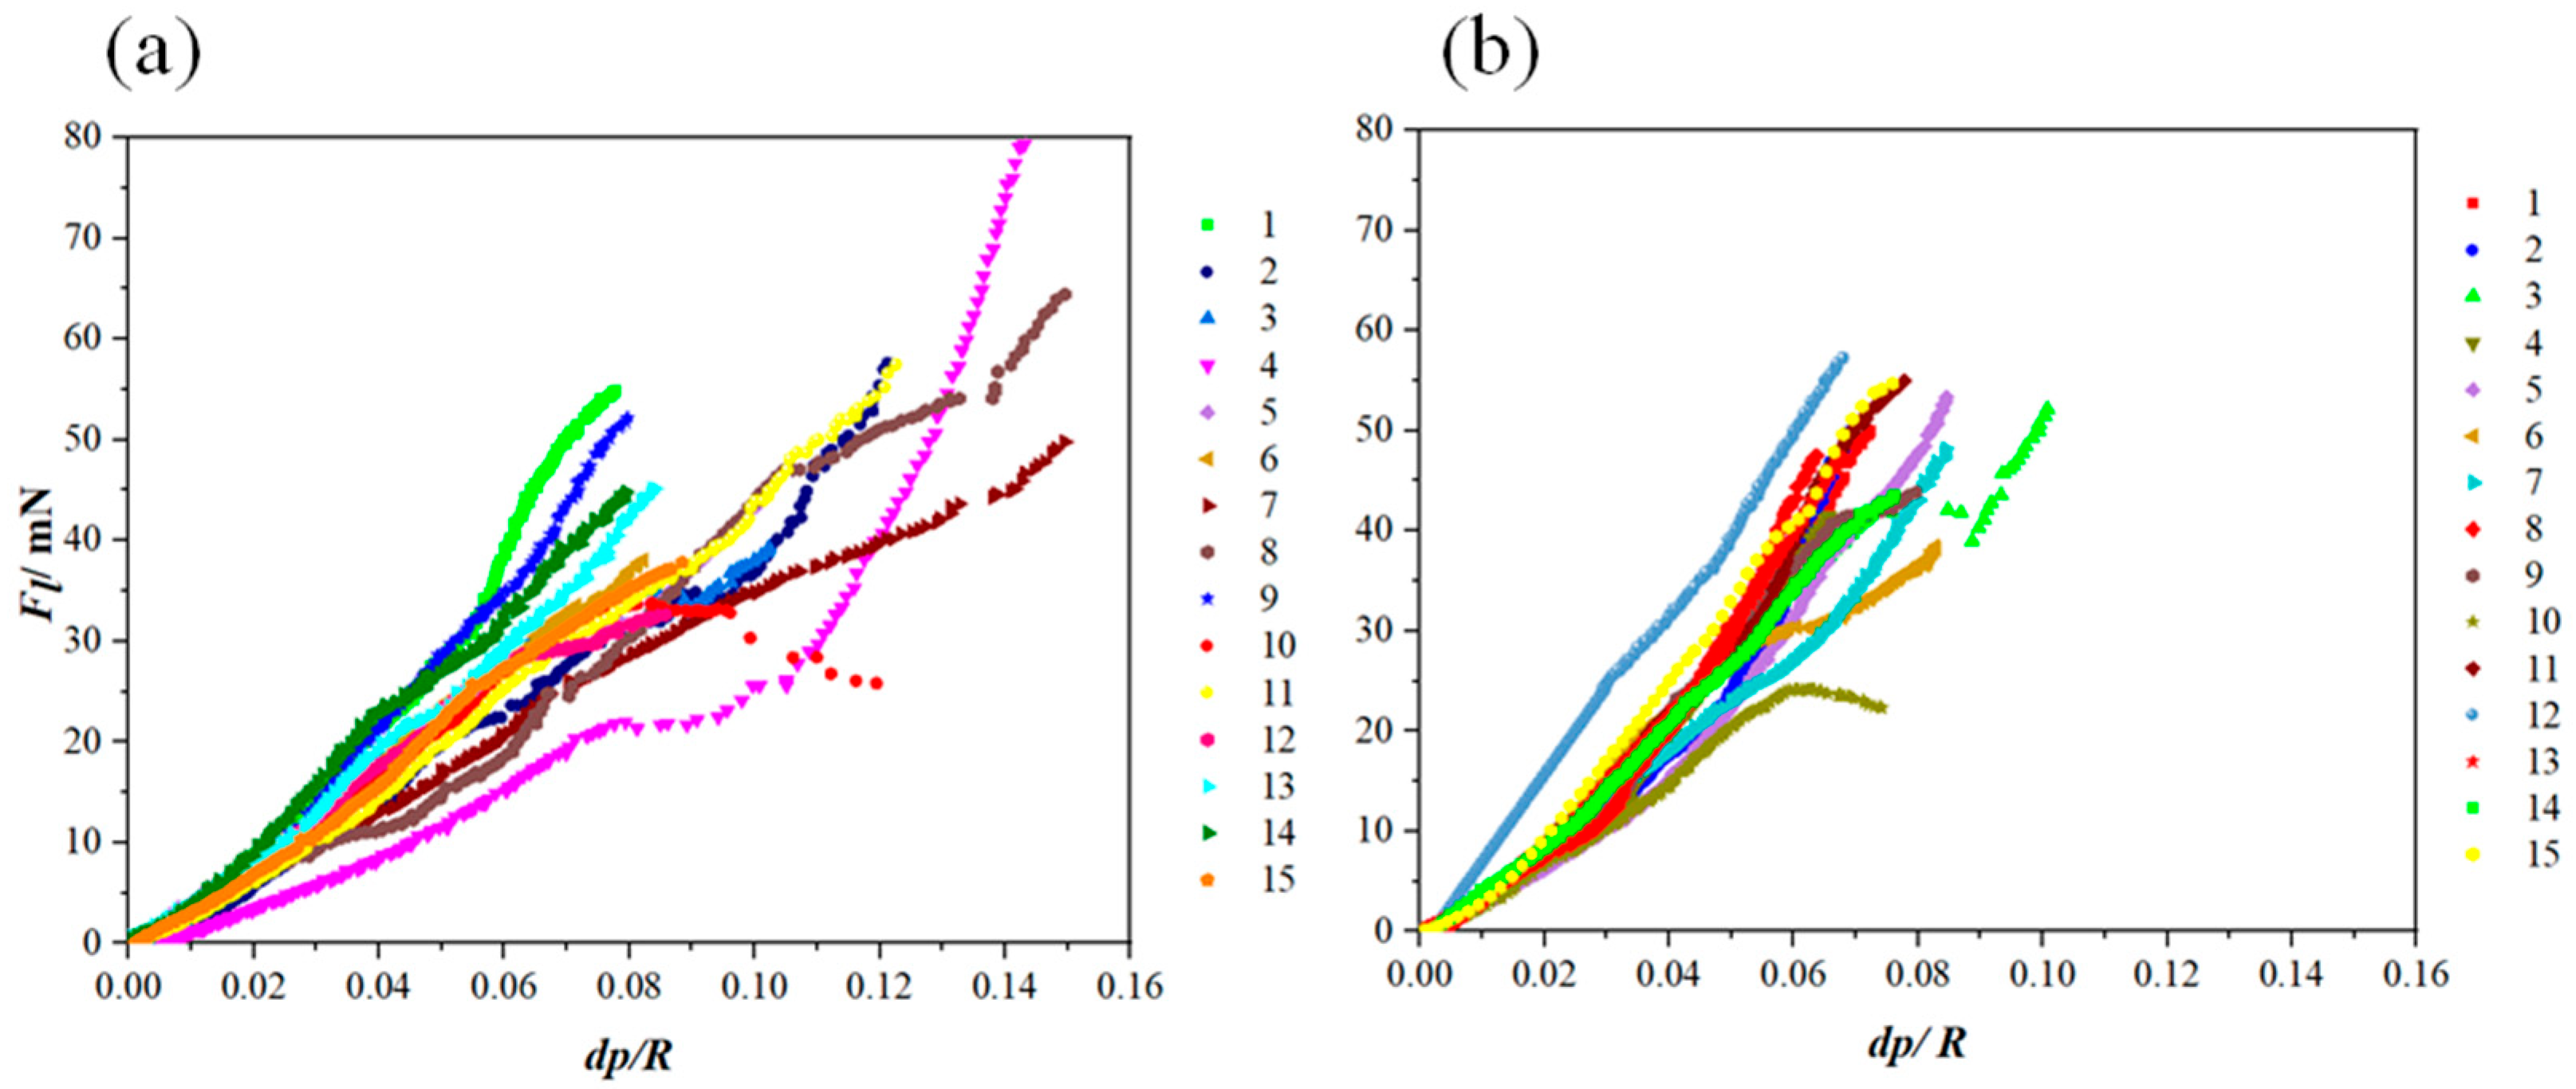
Based on Equation (4), Kc can be calculated through the linear fitting of the Fl (dp/R) curve. The results are presented in Figure 8. According to the linear behavior of the lateral force vs. (dp/R), an appropriate fitting range for each scratch was determined. It has to be noted that the data under small and large loads should be discarded in the curve Fl (dp/R). Under small loads, elastic–plastic deformation occurs, and the cracking plane is not well-developed. When subjected to large loads, the coating failure becomes severe and the cracking behavior becomes complex, thereby rendering the assumption of a semi-circular plane invalid. [24].
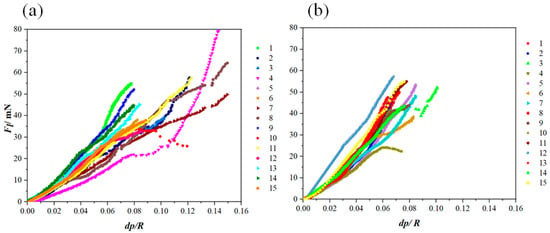
Figure 8.
Fl (dp/R) curves extracted from the nano-scratch results applied on (a) the reference coatings and (b) the Al2O3-ZrO2 coatings.
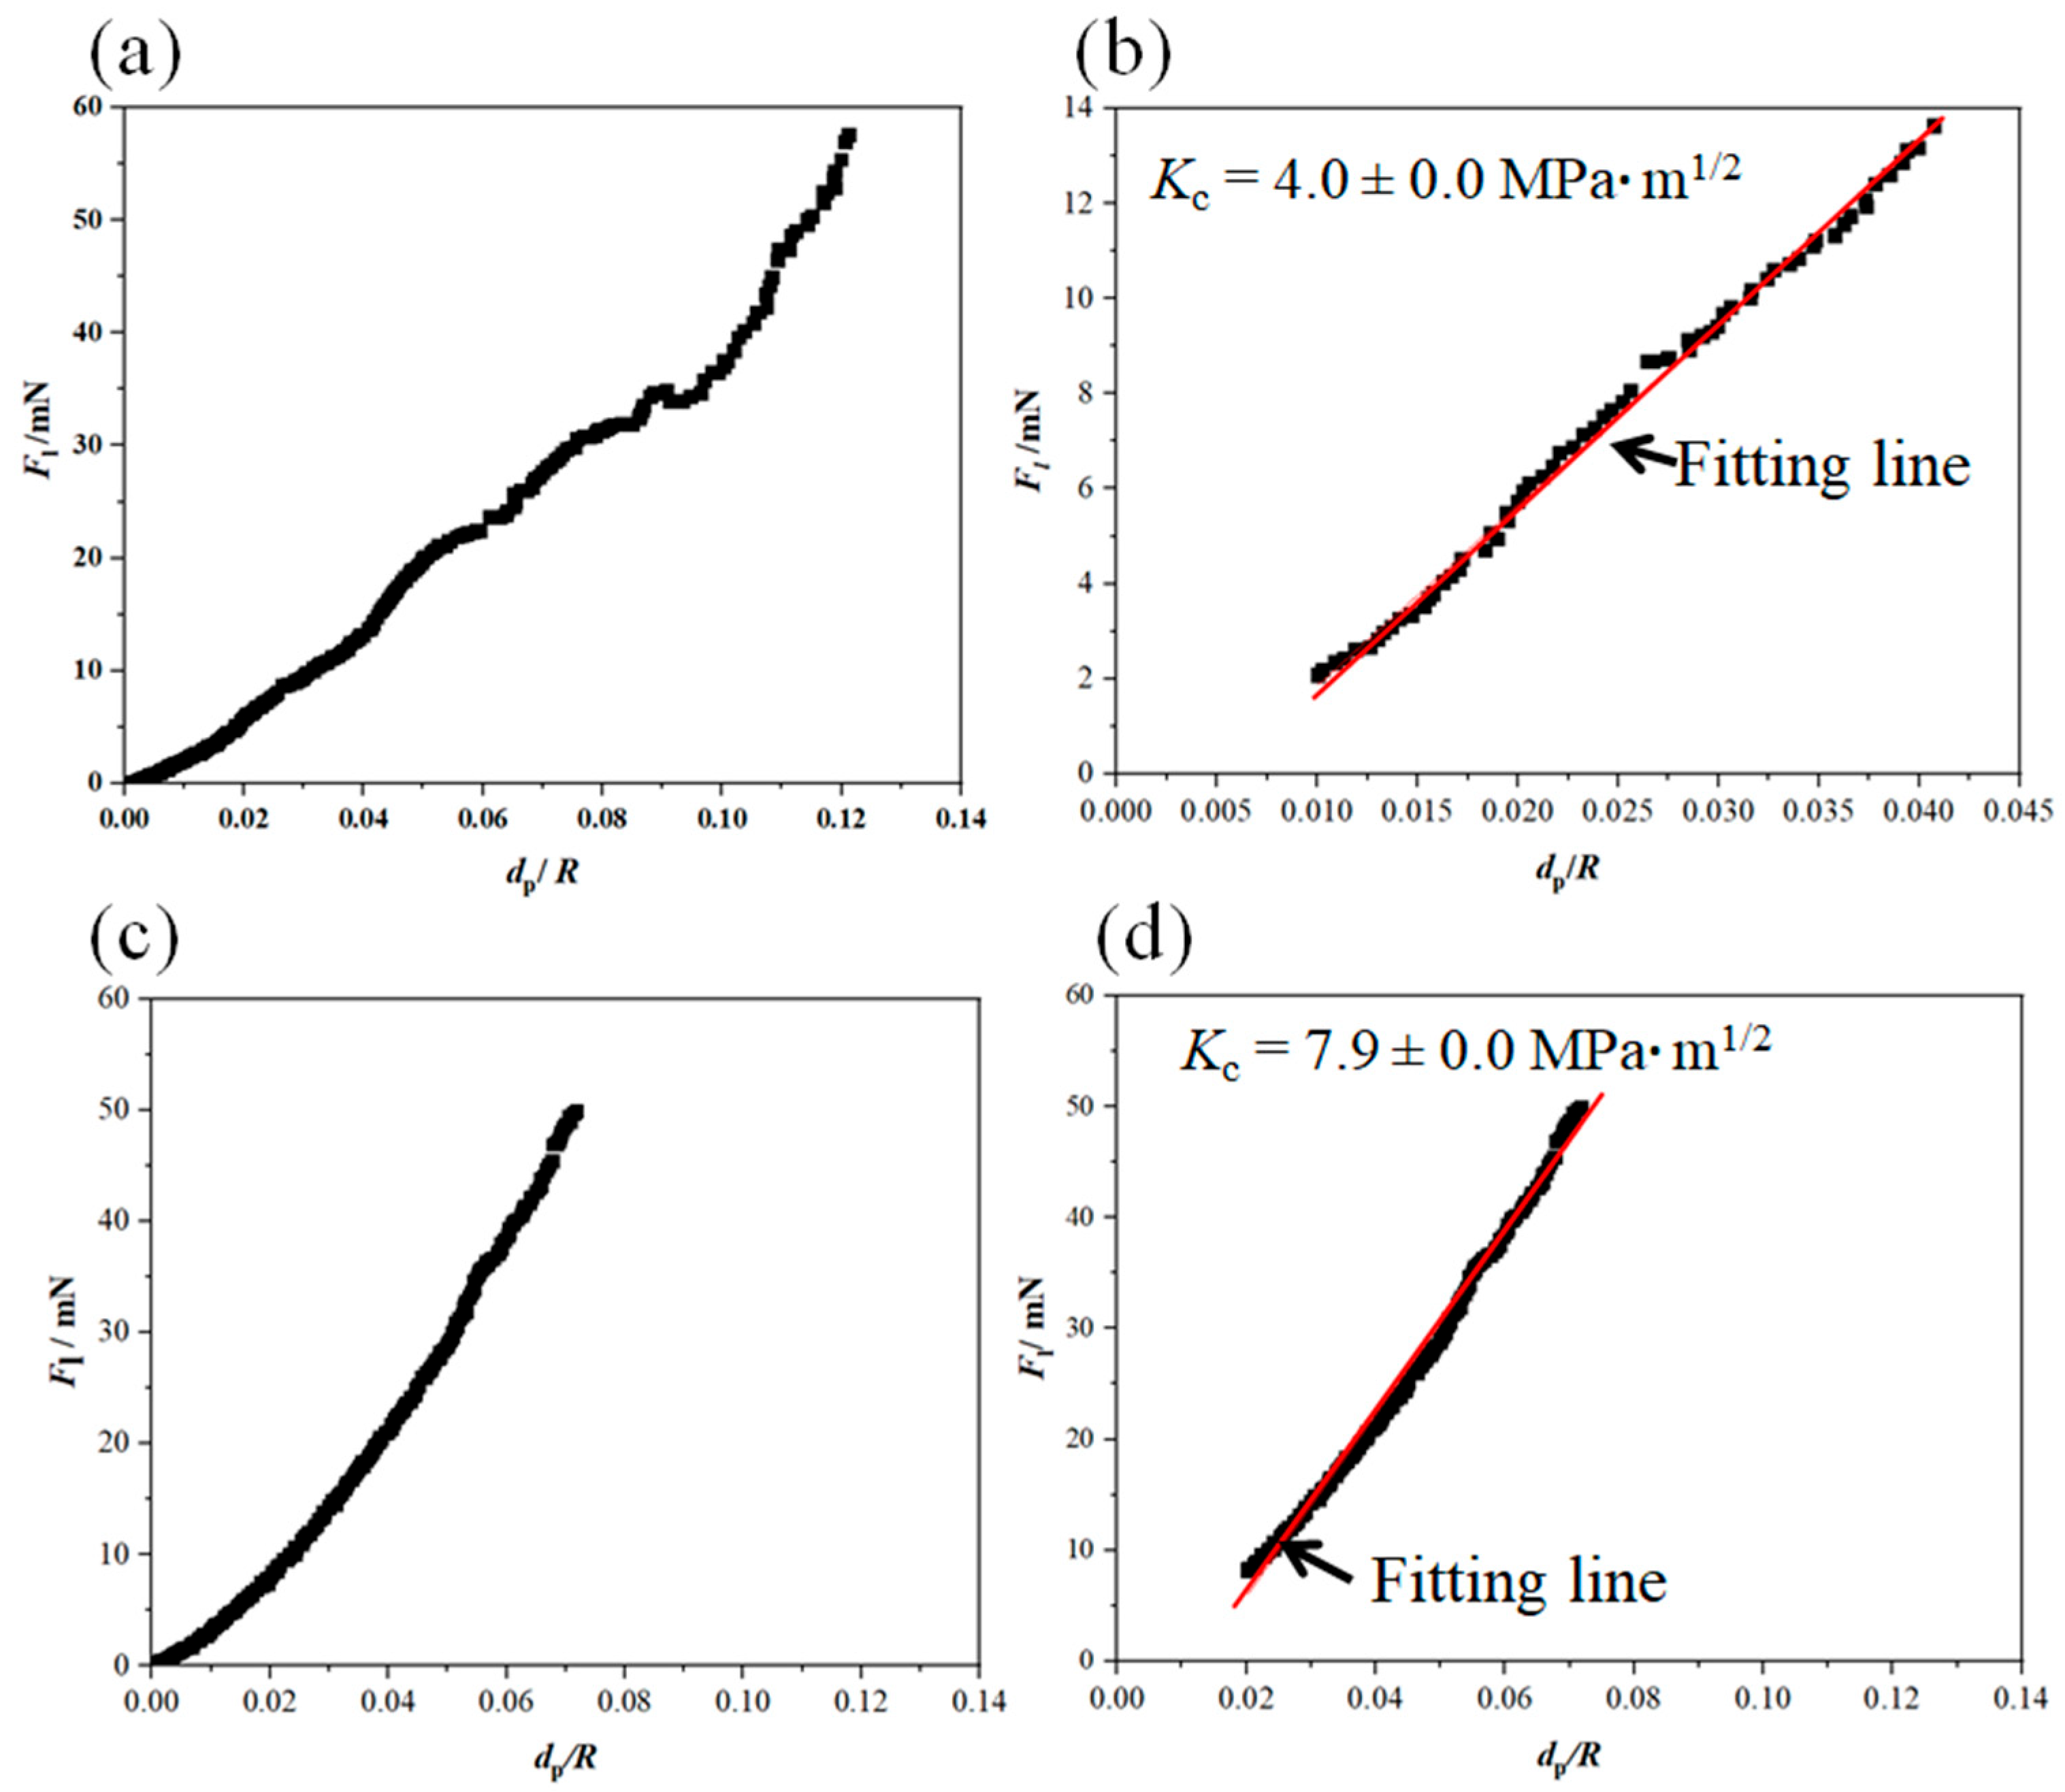
Figure 9 shows Fl (dp/R) curves and the fitting curves of the scratches shown in Figure 7. In addition, Table 2 and Table 3 summarize the fitting range, slope of fitting curve for each scratch and the calculated local fracture toughness for the reference coating and the coating prepared from Zr-containing electrolyte. As seen in Figure 7, Figure 8 and Figure 9, the normal force of 300 mN led to a deeper penetration into the Al2O3 coating in comparison with the Al2O3-ZrO2 coating. Therefore, the scratch resulted in severer damage in the Al2O3 coating when compared to the Al2O3-ZrO2 coating. This is also clearly noticeable in the BSD images of the scratches. As seen in Figure 7b, sharp and deep cracks were formed and propagated on the cross-section of the Al2O3 coating due to the scratch test. However, the scratch in the Al2O3-ZrO2 coating is barely detectable and no cracks are visible (see Figure 7d). Using this approach, the average fracture toughness of the Al2O3 reference and the Al2O3-ZrO2 coatings were calculated and are presented in Figure 10. The incorporation of Zr into alumina caused an increase in the fracture toughness to (6.9 ± 1.5) MPa·m1/2 when compared to (4.6 ± 1.1) MPa·m1/2 for the reference coating.
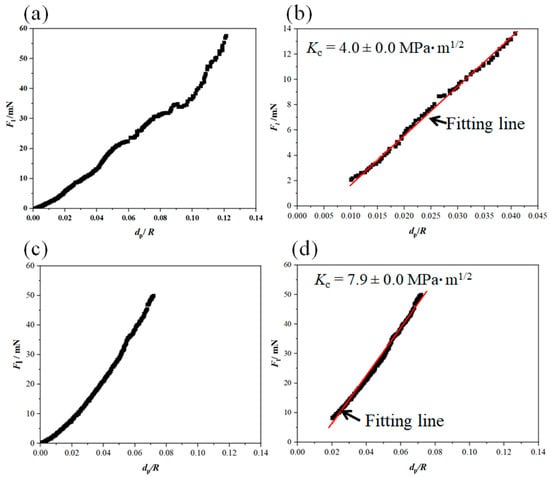
Figure 9.
Fl (dp/R) curve and the related fitting-range curve for the nano-scratch on the Al2O3 coating (a,b) and on the Al2O3-ZrO2 coating (c,d). These curves were extracted from the nano-scratch results presented in Figure 7.

Table 2.
The fitting range of Fl (dp/R) curves and the related slopes used for the calculation of the fracture toughness of the Al2O3 coatings.

Table 3.
The fitting range of Fl (dp/R) curves and the related slopes used for the calculation of the fracture toughness of the Al2O3-ZrO2 coatings.
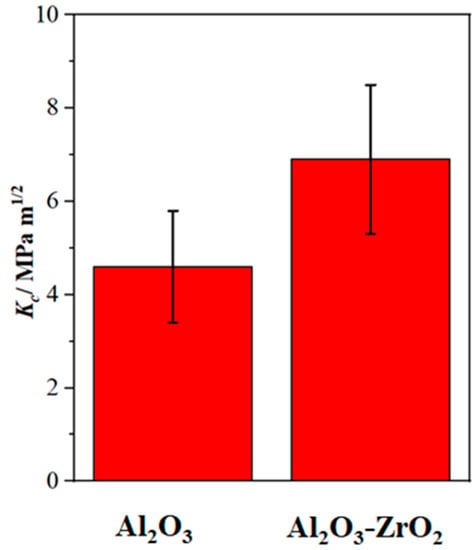
Figure 10.
The average fracture toughness with the standard deviation of the Al2O3 and the Al2O3-ZrO2 coatings. The Al2O3-ZrO2 coating exhibits significantly higher fracture toughness when compared to the Al2O3 reference coating.
4. Discussion
A well-established way for enhancing the fracture toughness of Al2O3 is adding ZrO2 into an alumina matrix. K2[Zr(CO3)2(OH)2] might be decomposed under thermal plasma condition and produces ZrO2, which is incorporated into the PEO coating according to [30]:
XRD analyses confirmed that the addition of the Zr-based salt into the PEO bath resulted in the incorporation of a metastable high-temperature modification of zirconia (either t-ZrO2 or c-ZrO2) into the alumina matrix, which is composed of various allotropes.
γ-Al2O3 and δ-Al2O3 are metastable modifications of alumina, and α-Al2O3 (corundum) is a thermodynamically stable polymorph of alumina [31]. In the PEO treatment, heat and mass transfers play important roles in the phase formation [32]. Metastable polymorphs, especially γ-Al2O3, develop due to high cooling rates of molten material in direct contact with the electrolyte and the substrate [32]. The δ-Al2O3 is formed through the structural ordering of γ-Al2O3 and its existence indicates that α-Al2O3 is developed through a two-step order–disorder structural transformation [33].
Zirconia exhibits three distinct structural polymorphs: m-ZrO2 from room temperature to 1170 °C, which is the most common one; t-ZrO2 is stable in the temperature range of 1170–2370 °C and has been widely used in materials science due to its high fracture toughness; and the cubic phase (c-ZrO2, from 2370 °C to the melting point) known as ‘diamond-like’ zirconia [34]. As seen in Figure 3, the PEO process resulted in the incorporation of a high-temperature allotrope of zirconia (t- or c-ZrO2) into the coating. The lack of transformation of t/c-ZrO2 to m-ZrO2 in the prepared PEO coating might be owing to the stabilization of t/c-ZrO2 by the simultaneous in situ formation of Al2O3 during the PEO process [6]. In addition, rapid cooling of Al2O3-ZrO2 eutectic mixture could cause the appearance of t- or c-ZrO2. The incorporation of ZrO2 into alumina resulted in the formation of dendritic and lamellar structures in the outer layer. In addition, the total thickness of the coating increased by the addition of Zr-based salt for equal process parameters when comparing to the reference electrolyte. As melting and solidification are two main processes involved in PEO, the increase in the growth rate of the coating might be due to the low melting point of the alumina–zirconia mixture in comparison with pure alumina. In addition, the enhancement of the passivability of the Al alloy with Zr-based salt can further increase the growth rate of PEO coating.
As observed, the incorporation of zirconia into the PEO alumina coating enhanced the fracture toughness effectively. In addition, the fracture toughness of the prepared Al2O3 and Al2O3-ZrO2 coatings is comparable with the bulk Al2O3 (4.40 MPa·m1/2) and bulk Al2O3-ZrO2 (6–12 MPa·m1/2), respectively [35]. This indicates that the PEO process is an effective way for the fabrication of ZTA coatings, especially since the PEO process results in the stabilization of a high-temperature allotrope of zirconia (t- or c-ZrO2) at room temperature without the need for rare-earth dopants such as Y2O3. The improvement of the mechanical parameters including hardness and fracture toughness might be related to the effect of zirconia on the microstructural properties of alumina. As seen in SEM images (Figure 6), the incorporation of zirconia developed new morphologies including dendritic and lamellar ones. Adding zirconia to alumina can lead to microstructural refinement, which results in the enhancement of the strength of the ceramic. In addition, zirconia may segregate along alumina grain boundaries and hinder the formation of cracks or promote crack deflection and crack pinning [4]. The other well-established toughening mechanism of alumina caused by zirconia is that t-ZrO2 could be transformed to m-ZrO2 due to stress induced by the interaction of the crack with ZrO2. This transformation is accompanied by a volume expansion and could hinder the crack propagation [36].
Furthermore, it could be shown that nano-scratch tests can be utilized as an accurate and powerful technique for the evaluation of the fracture toughness of ceramic coatings. Here, fracture toughness is determined directly by the scratch results and there is no need for the measurement of crack lengths in the four corners of the indent, which is a challenge in inherently crack-containing materials such as PEO coatings.
5. Summary and Conclusions
K2[Zr(CO3)2(OH)2] salt was added to an aluminate-phosphate-based electrolyte to form an Al2O3-ZrO2 coating by a PEO process. The prepared coating had a double-layer microstructure with a finely porous inner layer and a dense outer layer. The addition of the Zr-based salt enhanced the growth rate and improved the integrity of the outer layer. This was attributed to the improvement of passivablity of the substrate by the Zr-based salt. New morphologies (lamella and dendrites) appeared in the coating prepared from the Zr electrolyte. Zirconia was incorporated as a metastable high-temperature modification into the alumina coating. Nano-indentation test indicated that Zr-based salt led to an increase in the hardness of the outer layer from 16 GPa to 18 GPa. In addition, by applying nano-scratch tests on the outer layer, an increase in the local fracture toughness from 4.6 MPa·m1/2 to 6.9 MPa·m1/2 occurred. Regarding the comparability of the fracture toughness results with the literature, it was shown that the nano-scratch method could be an appropriate replacement for nano- or micro-indentation techniques for the evaluation of fracture toughness in materials with inherent cracks and porosity. Further research must be carried out focusing on a more homogenous distribution of the formed zirconia phases to achieve ZTA coatings produced by PEO with an excellent bonding to the aluminum substrate.
Author Contributions
Conceptualization, M.H., F.S. and L.W.; data curation, M.H.; methodology, M.H., F.S. and L.W.; validation, M.H., F.S. and L.W.; investigation, M.H.; resources, T.L.; writing—original draft preparation, M.H.; writing—review and editing, F.S., L.W. and T.L.; visualization, M.H.; supervision, T.L.; project administration, T.L.; funding acquisition, T.L. All authors have read and agreed to the published version of the manuscript.
Funding
This research was funded by the German Research Foundation (Deutsche Forschungsgemeinschaft/DFG), Grant No. 500196783, project LA-1274/67-1.
Institutional Review Board Statement
Not applicable.
Informed Consent Statement
Not applicable.
Data Availability Statement
The authors confirm that the data supporting the findings of this study are available within the article.
Conflicts of Interest
The authors declare no conflict of interest.
References
- Huang, T.; Song, P.; Li, C.; Shu, Y.; Sun, B.; Ji, Q.; Arif, M.; Yi, J. Phase transition and interface evolution of Al2O3/ZrO2 particles in plasma-sprayed coatings. Ceram. Int. 2020, 46, 12275–12281. [Google Scholar] [CrossRef]
- Matykina, E.; Arrabal, R.; Skeldon, P.; Thompson, G.E. Incorporation of zirconia nanoparticles into coatings formed on aluminium by AC plasma electrolytic oxidation. J. Appl. Electrochem. 2008, 38, 1375–1383. [Google Scholar] [CrossRef]
- Tarasi, F.; Medraj, M.; Dolatabadi, A.; Oberste-berghaus, J.; Moreau, C. Structural considerations in plasma spraying of the alumina—Zirconia composite. Surf. Coat. Technol. 2011, 205, 5437–5443. [Google Scholar] [CrossRef]
- Pappas, J.M.; Thakur, A.R.; Dong, X. Effects of zirconia doping on additively manufactured alumina ceramics by laser direct deposition. Mater. Des. 2020, 192, 108711. [Google Scholar] [CrossRef]
- Rehman, Z.U.; Shin, S.H.; Kaseem, M.; Uzair, M.; Koo, B.H. Towards a compact coating formed on Al6061 alloy in phosphate based electrolyte via two-step PEO process and K2ZrF6 additives. Surf. Coat. Technol. 2017, 328, 355–360. [Google Scholar] [CrossRef]
- Wang, P.; Li, J.; Guo, Y.; Yang, Z.; Wang, J. In situ formation of Al2O3–ZrO2–Y2O3 composite ceramic coating by plasma electrolytic oxidation on ZAlSi12Cu3Ni2 alloy. Mater. High Temp. 2018, 35, 363–370. [Google Scholar] [CrossRef]
- Barati, N.; Yerokhin, A.; Golestanifard, F.; Rastegari, S.; Meletis, E.I. Alumina-zirconia coatings produced by Plasma Electrolytic Oxidation on Al alloy for corrosion resistance improvement. J. Alloys Compd. 2017, 724, 435–442. [Google Scholar] [CrossRef]
- Sieber, M.; Simchen, F.; Morgenstern, R.; Scharf, I.; Lampke, T. Plasma electrolytic oxidation of high-strength aluminium alloys—Substrate effect on wear and corrosion performance. Metals 2018, 8, 356. [Google Scholar] [CrossRef]
- Yerokhin, A.L.; Voevodin, A.A.; Lyubimov, V.V.; Zabinski, J.; Donley, M. Plasma electrolytic fabrication of oxide ceramic surface layers for tribotechnical purposes on aluminium alloys. Surf. Coat. Technol. 1998, 110, 140–146. [Google Scholar] [CrossRef]
- Simchen, F.; Sieber, M.; Lampke, T. Electrolyte influence on ignition of plasma electrolytic oxidation processes on light metals. Surf. Coat. Technol. 2017, 315, 205–213. [Google Scholar] [CrossRef]
- Kaseem, M.; Kwon, J.H.; Ko, Y.G. Modification of a porous oxide layer formed on an Al-Zn-Mg alloy via plasma electrolytic oxidation and post treatment using oxalate ions. RSC Adv. 2016, 6, 107109–107113. [Google Scholar] [CrossRef]
- Student, M.; Pohrelyuk, I.; Padgurskas, J.; Posuvailo, V.; Hvozdets’ kyi, V.; Zadorozhna, K.; Chumalo, H.; Veselivska, H.; Kovalchuk, I.; Kychma, A. Influence of Plasma Electrolytic Oxidation of Cast Al-Si Alloys on Their Phase Composition and Abrasive Wear Resistance. Coatings 2023, 13, 637. [Google Scholar] [CrossRef]
- Rodriguez, L.; Paris, J.-Y.Y.; Denape, J.; Delbé, K. Micro-Arcs Oxidation Layer Formation on Aluminium and Coatings Tribological Properties—A Review. Coatings 2023, 13, 373. [Google Scholar] [CrossRef]
- Akatsu, T.; Kato, T.; Shinoda, Y.; Wakai, F.; Access, O. Zirconia based ceramic coating on a metal with plasma electrolytic oxidation. In Proceedings of the IOP Conference Series: Materials Science and Engineering; IOP Publishing: Bristol, UK, 2011; Volume 18, p. 202005. [Google Scholar]
- Alloy, A.; Xie, X.; Yang, E.; Zhang, Z.; Wei, W.; Li, D.; Zhao, X.; Yang, R. Effects of K2TiF6 and Electrolyte Temperatures on Energy Consumption and Properties of MAO Coatings on 6063. Materials 2023, 16, 1830. [Google Scholar]
- Akatsu, T.; Kato, T.; Shinoda, Y.; Wakai, F. Thermal barrier coating made of porous zirconium oxide on a nickel-based single crystal superalloy formed by plasma electrolytic oxidation. Surf. Coat. Technol. 2013, 223, 47–51. [Google Scholar] [CrossRef]
- Lee, B.; Kwon, J.-S.; Khalid, M.W.; Kim, K.-M.; Kim, J.; Lim, K.M.; Hong, S.H. Boron nitride nanoplatelets as reinforcement material for dental ceramics. Dent. Mater. 2020, 36, 744–754. [Google Scholar] [CrossRef]
- Pinto, P.A.; Colas, G.; Filleter, T.; De Souza, G.M. Surface and mechanical characterization of dental yttria-stabilized tetragonal zirconia polycrystals (3Y-TZP) after different aging processes. Microsc. Microanal. 2016, 22, 1179–1188. [Google Scholar] [CrossRef]
- Chen, J. Indentation-based methods to assess fracture toughness for thin coatings. J. Phys. D Appl. Phys. 2012, 45, 203001. [Google Scholar] [CrossRef]
- Karimzadeh, A.; Ayatollahi, M.R. Mechanical properties of biomaterials determined by nano-indentation and nano-scratch tests. In Nanomechanical Analysis of High Performance Materials; Springer: Berlin, Germany, 2014; pp. 189–207. [Google Scholar]
- Sebastiani, M.; Johanns, K.E.; Herbert, E.G.; Pharr, G.M. Measurement of fracture toughness by nanoindentation methods: Recent advances and future challenges. Curr. Opin. Solid State Mater. Sci. 2015, 19, 324–333. [Google Scholar] [CrossRef]
- Akono, A.; Randall, N.X. Experimental determination of the fracture toughness via microscratch tests: Application to polymers, ceramics, and metals. J. Mater. Res. 2011, 27, 485–493. [Google Scholar] [CrossRef]
- Hashemzadeh, M.; Raeissi, K.; Ashrafizadeh, F.; Hakimizad, A.; Santamaria, M. The incorporation mechanism of colloidal TiO2 nanoparticles and their effect on properties of the coatings grown on 7075 Al alloy from silicate-based solution using plasma electrolytic solution. Trans. Nonferrous Met. Soc. China 2021, 31, 3659–3676. [Google Scholar]
- Liu, M.; Xu, Z.; Fu, R. Micromechanical and microstructure characterization of BaO-Sm2O3–5TiO2 ceramic with addition of Al2O3. Ceram. Int. 2022, 48, 992–1005. [Google Scholar] [CrossRef]
- Zhang, D.; Sun, Y.; Gao, C.; Liu, M. Measurement of fracture toughness of copper via constant-load microscratch with a spherical indenter. Wear 2020, 444–445, 203158. [Google Scholar] [CrossRef]
- Simchen, F.; Masoud-Nia, N.; Mehner, T.; Lampke, T. Formation of corundum-rich alumina coatings on low-carbon steel by plasma electrolytic oxidation. In Proceedings of the IOP Conference Series: Materials Science and Engineering; IOP Publishing: Bristol, UK, 2021; Volume 1147, p. 12007. [Google Scholar]
- Simchen, F.; Sieber, M.; Mehner, T.; Lampke, T. Characterisation Method of the Passivation Mechanisms during the pre-discharge Stage of Plasma Electrolytic Oxidation indicating the Mode of Action of Fluorides in PEO of Magnesium. Coatings 2020, 10, 965. [Google Scholar] [CrossRef]
- Oliver, W.C.; Pharr, G.M. Measurement of hardness and elastic modulus by instrumented indentation: Advances in understanding and refinements to methodology. J. Mater. Res. 2004, 19, 3–20. [Google Scholar] [CrossRef]
- Huang, L.Y.; Zhao, J.W.; Xu, K.W.; Lu, J. A new method for evaluating the scratch resistance of diamond-like carbon films by the nano-scratch technique. Diam. Relat. Mater. 2002, 11, 1454–1459. [Google Scholar] [CrossRef]
- Ryu, T.; Joon Choi, Y.; Hwang, S.; Sohn, H.Y.; Kimw, I. Synthesis of yttria-stabilized Zirconia Nanopowders by a Thermal Plasma Process. J. Am. Ceram. Soc. 2010, 93, 3130–3135. [Google Scholar] [CrossRef]
- Ruppi, S. Deposition, microstructure and properties of texture-controlled CVD α-Al2O3 coatings. Int. J. Refract. Met. Hard Mater. 2005, 23, 306–316. [Google Scholar] [CrossRef]
- Belozerov, V.; Sobol, O.; Mahatilova, A.; Subbotina, V.; Taha, A.T.; Ubeidulla, F.; Safwan, M.; Al-qawabah, S.M.; Belozerov, V.; Sobol, O.; et al. Effect of electrolysis regimes on the structure and properties of coatings on aluminum alloys formed by anode-cathode micro arc oxidation. Mater. Sci. 2018, 1, 43–47. [Google Scholar] [CrossRef]
- Levin, I.; Brandon, D. Metastable alumina polymorphs: Crystal structures and transition sequences. J. Am. Ceram. Soc. 1998, 81, 1995–2012. [Google Scholar] [CrossRef]
- Pimentel, H.R.X.; Aguiar, D.L.M.; San Gil, R.A.S.; Souza, E.F.; Ferreira, A.R.; Leitão, A.A.; Alencastro, R.B.; Menezes, S.M.C.; Chiaro, S.S.X. 17O MAS NMR and first principles calculations of ZrO2 polymorphs. Chem. Phys. Lett. 2013, 555, 96–100. [Google Scholar] [CrossRef]
- Abbas, S.; Maleksaeedi, S.; Kolos, E.; Ruys, A.J. Processing and properties of zirconia-toughened alumina prepared by gelcasting. Materials 2015, 8, 4344–4362. [Google Scholar] [CrossRef] [PubMed]
- De Aza, A.H.; Chevalier, J.; Fantozzi, G.; Schehl, M.; Torrecillas, R. Crack growth resistance of zirconia toughened alumina ceramics for joint prostheses. Key Eng. Mater. 2002, 23, 937–945. [Google Scholar] [CrossRef]
Disclaimer/Publisher’s Note: The statements, opinions and data contained in all publications are solely those of the individual author(s) and contributor(s) and not of MDPI and/or the editor(s). MDPI and/or the editor(s) disclaim responsibility for any injury to people or property resulting from any ideas, methods, instructions or products referred to in the content. |
© 2023 by the authors. Licensee MDPI, Basel, Switzerland. This article is an open access article distributed under the terms and conditions of the Creative Commons Attribution (CC BY) license (https://creativecommons.org/licenses/by/4.0/).


