Article

Firefly Algorithm and Neural Network Employment for Dilution Analysis of Super Duplex Stainless Steel Clads over AISI 1020 Steel Using Gas Tungsten Arc Process

1
Sant Longowal Institute of Engineering and Technology, Longowal 148106, Punjab, India
2
Department of Electrical Engineering, JSS Academy of Technical Education, Noida 201301, Uttar Pradesh, India
3
Department of Mechanical Engineering, G.L. Bajaj Institute of Technology and Management, Greater Noida 201306, Uttar Pradesh, India
4
Department of Mechanical Engineering, School of Mechanical, Chemical and Materials Engineering, Adama Science and Technology University, Adama P.O. Box 1888, Ethiopia
5
Department of Electrical Engineering, College of Engineering, King Khalid University, Abha 61411, Saudi Arabia
6
Department of Electrical Engineering, Faculty of Engineering, Aswan University, Aswan 81528, Egypt
*
Authors to whom correspondence should be addressed.
Coatings 2023, 13(5), 841; https://doi.org/10.3390/coatings13050841
Submission received: 28 February 2023 / Revised: 25 April 2023 / Accepted: 26 April 2023 / Published: 27 April 2023

Abstract

:
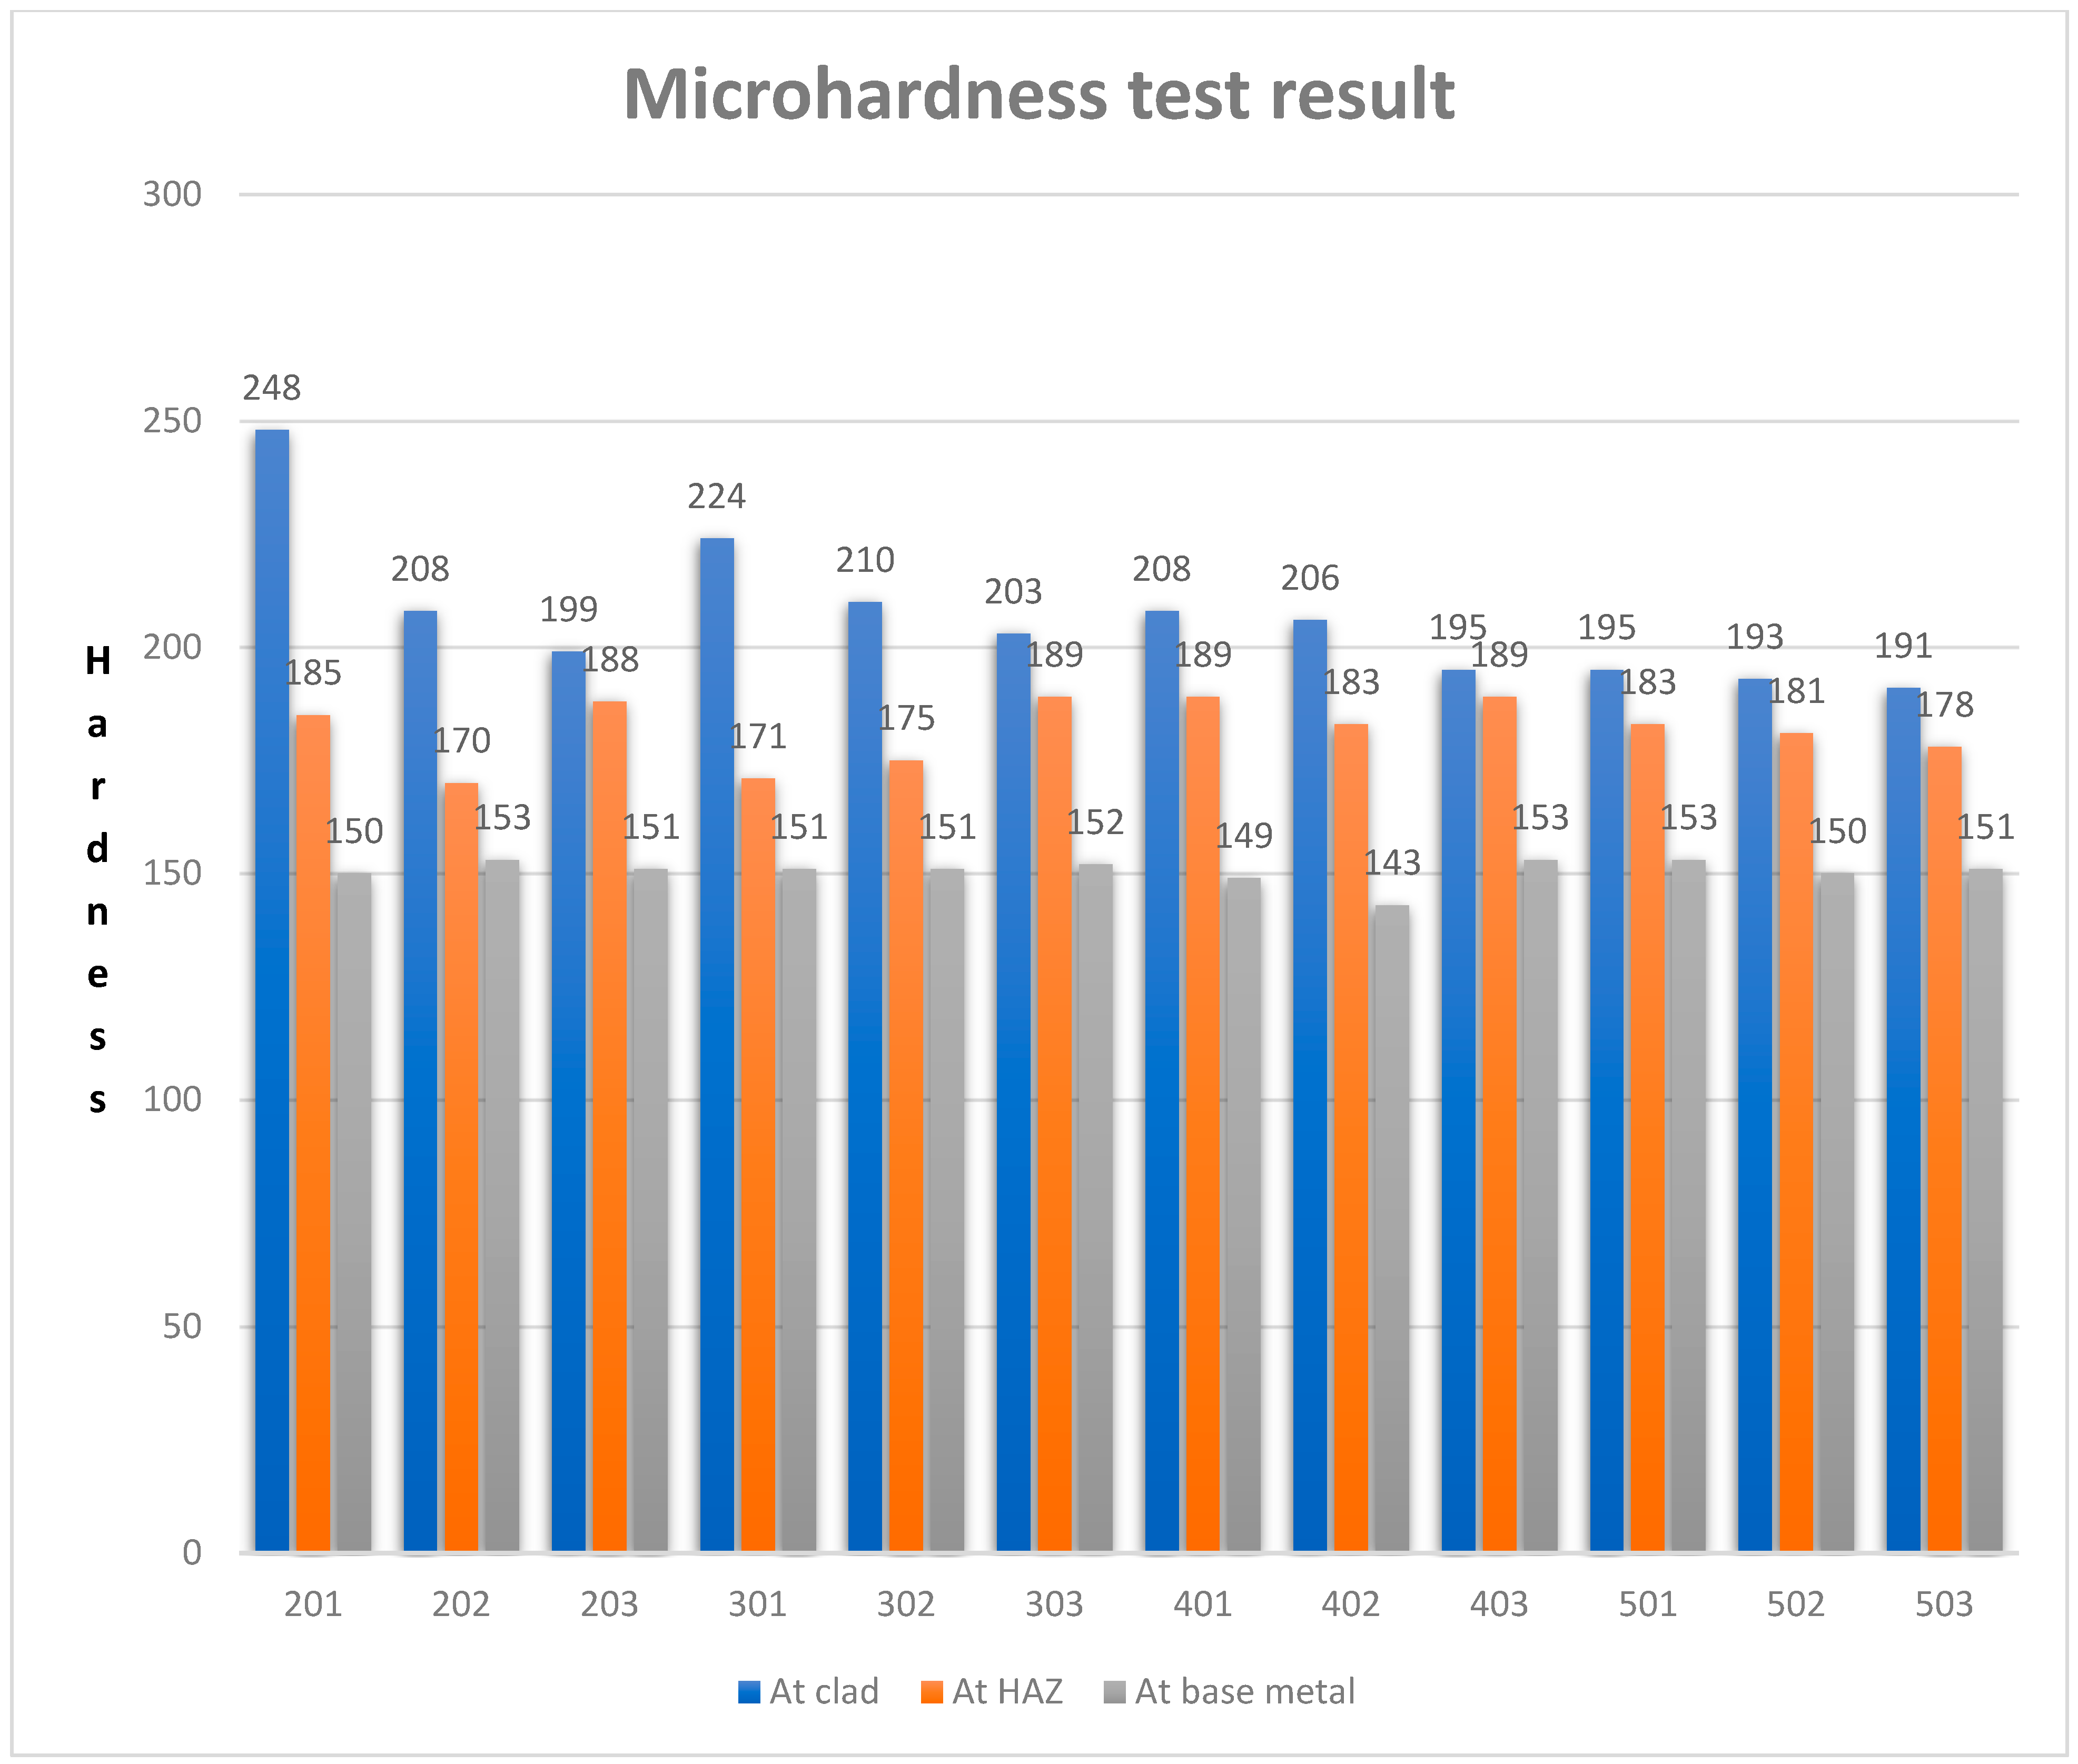
Traditional low-carbon steels provide the strength needed to satisfy industrial demands. Low-carbon steel’s poor corrosion resistance is one of its main drawbacks. Due to this restriction, corrosion-resistant materials such as super duplex stainless steels are frequently used for cladding onto the surface of low-carbon steel. The cladded surface possesses superior chloride stress corrosion cracking resistance, pitting and crevice corrosion resistance, yield strength, ductility, and impact toughness. Mild steel with measurements of 300 × 300 × 12 mm has been selected as the substrate material, and super duplex stainless steel (S32950) with an electrode diameter of 2.4 mm has been selected as the filler wire. Gas Tungsten Arc (GTA) cladding was performed onto the surface of low-carbon steel for experimentation. The clad was deposited in the flat position with four different currents, i.e., 120 A, 130 A, 140 A, and 150 A. Cladding was performed on different layers of each current level, i.e., single layer, double layers, and triple layers. After experimenting and overviewing the outcomes, it can be concluded that the optimum input parameters would be a 3-layered clad at a 140 A current level. Cladding of the super duplex stainless steel over mild steel improves the corrosive properties. The percentage ratio of reactivation current density to activation current density (Ir/Ia%) improves from 29% (mild steel) to 4.1% at the top layer and 11.9% at the intermediate layer. The microhardness of the clad decreases with an increase in both the current level and the number of layers. Microhardness varies between 191–248 at the clad, 170–189 at the HAZ, and 143–153 at the substrate for a 1 kgf load. Dilution refers to the change in the cladding alloy composition due to the mixing of the molten matrix. The composition of the clad changes under a high dilution, resulting in a decrease in the mechanical as well as corrosion properties of the clad. However, if the dilution is too small, the bond between the substrate and the clad is poor. Therefore, dilution is one of the most important process control parameters and the key to obtaining high-quality cladding. Thus, the dilution effect is also analyzed on all three clad layers deposited at various current levels using the firefly algorithm (FA) and artificial neural network (ANN). It is observed that dilution levels are found to be more approachable to the experimental setup data with FA in comparison to ANN for various current levels.

1. Introduction

Cladding is the procedure of forming a protective coating in which a metal is coupled under higher pressure and higher temperature with another metal. It gives several desired properties which are not found in single metal. In cladding, the base material is chosen considering its cost or structural properties and filler material used for surface protection. It is necessary to provide an optimum number of clad layers to obtain the desired dilution for the proper bonding of the clad material to the substrate. Cladding can be performed using several welding processes either manually, semi-automatically, or automatically. As a result, the surface of the metals that are presently available is changed with bare welding rods, covered electrodes, coiled wire, paste, and powders [1]. Austenitic stainless steel and nickel-based amalgam are excellent non-corrosive and heat-resistant alloys that are better suited for the cladding of pressure vessels in petrochemical industries. It can be produced using a variety of settings for the welding variables, fluxes, and strips or electrodes. Traditional low-carbon steels provide the strength needed to satisfy industrial demands. Because low-carbon steels generally have low costs and are easily available, these steels are preferred for fabrication works. The low-carbon steel’s poor corrosion resistance is one of its main drawbacks. Due to this restriction, corrosion-resistant materials, including stainless steel, have been developed. The microstructure of stainless steel has a direct impact on its properties. At about 300 °C, duplex stainless steels break down into the ferrite phase and form intermetallic phases that reduce their ability to resist corrosion and maintain their mechanical qualities. Due to its superior chloride stress corrosion cracking resistance, pitting and crevice corrosion resistance, yield strength, ductility, impact toughness, and weldability, super duplex stainless steel is frequently used in weld cladding [2]. Super duplex stainless steel could be deposited to enhance the surfaced layer’s durability under a high-temperature corrosive environment [3,4]. The manufacturing sectors of India are crucial to the nation’s economic development. Effective calculation, avoidance, and management of corrosion present difficult challenges for these sectors. It has become essential for Indian industries to improve production by reducing the loss from downtime as well as any accidents while also making the best use of human effort and resources in order to compete with rapidly expanding Asian nations such as China. A disturbing percentage of the overall expense of corrosion across all sectors is contributed by the cost of rust in the chemical, nature, manufacturing, shipping, oil and gas, and petrochemical industries. This essay provides a general summary of corrosion costs in India and their relationship to GDP [5,6,7,8]. Duplex stainless steel’s joint durability may be negatively impacted by nitrogen loss from laser welding melt ponds. When laser welding, this impact can be reduced by using nitrogen as a shielding gas. Nitrogen usage causes the welded metal to contain more austenite, resulting in higher degrees of toughness [9,10,11,12,13]. Microstructures as well as the welding pool shape of 304 stainless steel during GTAW are being studied theoretically as well as experimentally. A research project looking at how changes in heat input affect the microstructure of less activated ferritic martensitic steel weld metal produced by the GTAW method of GTAW fusing inline phase characterization for ultra ferritic stainless-steel welding. Additionally, neural network analysis was conducted on a joint bead shape of austenitic stainless steel GTAW. Chloride Pitting Corrosion Resistance: Weldability of Nitrogen-Containing Austenitic Stainless Steel, Part I. [14] At room temperature, the impact of magnetite concentration on stress-induced cracking within duplex stainless steel weld alloys has been discussed in [14,15,16,17,18,19]. A grid-integrated wind-driven DFIG is optimized for invasive weeds for sensorless regulation. A solar MPPT with simplified propagation using a fusion firefly algorithm in partial shading situations and a flux-cored arc forging method using a multivariate stochastic optimization method have been discussed in [20,21,22].
The improvement in the dilution characteristic level for the various current levels with a hardware setup and its validation with the firefly algorithm and ANN is the novelty of the proposed scheme. Such novelty makes it different from the existing literature.

2. Design of Experiment

The analysis of experimental data, which leads to the optimization of process parameters, is frequently accomplished using the Design of Experiments (DOE) technique. It is a method of practical, experimental, and statistical modeling that is used to concurrently solve several equations utilizing quantitative results from well-designed experiments using multiple regression analyses. It is a systematic structured method for analyzing any scenario where the outcome depends on one or more independent factors. It is frequently applied to complicated issues where more than one variable may have an impact on the outcome and where two or more factors may interact. Using the ideal number of experimental observations, it can provide the answers to specific queries about a system’s behavior. The impact of two separate parameters has been examined using a historical data design with twelve sample data. Important components for conducting the experiment and determining their impact on the dilution are the current and clad layer. The other factors were all constant. For the study of the data, one numeric factor—current—and one categorical factor—clad layers—have been chosen. Except for the ones being considered, both direct and indirect parameters have indeed been kept constant. A discrete type of numerical factor with four levels has been chosen for the current, and a nominal type of categorical factor with three levels has been chosen for clad layer. Input parameters with their level and units are shown in Table 1, and the design matrix developed to analyze the 12 responses of historical data is shown in Table 2.

2.1. Base Metal and Filler Metal

With measurements of 300 × 300 × 12 mm, AISI 1020 (mild steel) had been chosen as the base material. Before cladding, the surface was thoroughly cleaned with acetone to get rid of any oxide scales and surface contaminants and then polished to a smooth finish to eliminate all dirt, oil, grease, and rust. Mild steel was chosen as it was the most affordable type of steel and also had outstanding mechanical qualities, such as strength and toughness. It was chosen as the substrate for the super duplex stainless steel cladding in order to make the active surface corrosion resistant. As a result, the clad mild steel might be made accessible as a highly affordable alternative to the super duplex stainless-steel substrate. The GTA method was used to clad super duplex stainless steel (S32950), as in this welding process, a non-consumable tungsten electrode is used, and shielding of weld pool against the atmospheric gases is provided by inert gases such as orgon, helium, or a mixture of these two gases. Additionally, GTA clads are neat and free from spatters owing to better process control capabilities. Super duplex stainless steel (S32950) had been chosen as a filler wire with a diameter of 2.4 mm. Table 3 shows the chemical composition of the base metal used.

2.2. Cladding

GTA was used for laying claddings, as it is the most versatile process. Parameters selected for cladding after conducting trial runs are presented in Table 4. GTA setup used having the following specifications:
  • Manufacturer: Tech Pro, Pvt. Ltd., Delhi, India;
  • Supply voltage: 380/415/440 V;
  • Cladding current range: 5 A–350 A (DC);
  • Open circuit voltage: 80 V.
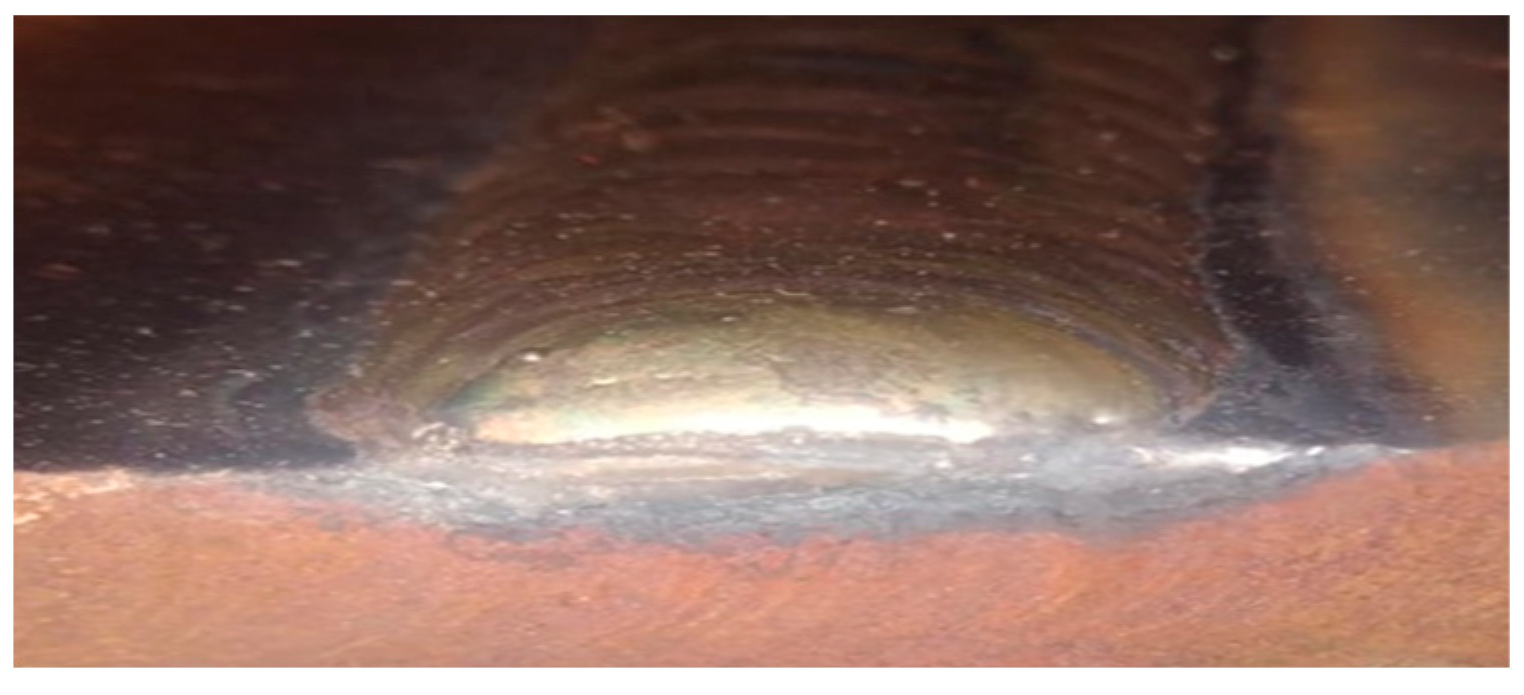
The substrate surfaces were cleaned with acetone to eliminate any oxide scales and impurities before even being prepared for cladding. This process removed all dirt, oil, grease, and rust from the surfaces. The rolling orientation of the substrate plate was chosen as that of the orientation of the cladding. First, trial runs were conducted to find out the current range to be used. The GTA cladding was conducted in the flat position with four different currents: 120 A, 130 A, 140 A, and 150 A. Additionally, different layers for each current setting were laid: single layer, double layers, and triple layers. Various layers of cladding were deposited simultaneously without maintaining any interpass temperature. The cladding plate and its cross-section are shown in Figure 1 and Figure 2.

2.3. Preparation of Microhardness, Optical Microscopy, Pitting Corrosion, and Ferrite Percentage Evaluation Specimens

After cladding the AISI 1020 steel plate with super duplex stainless steel via the GTA process, different specimens for metallurgical and pitting corrosion studies were extracted. The method adopted for sectioning and specimen preparation for performing different tests are discussed in the following subsection. Different specimens required for performing tests were machined out from the clad plate in the transverse direction to cladding. The sectioning was carried out using a wire-cut electric discharge machine (WEDM) with a 0.5 mm wire diameter. WEDM was used to reduce material wastage, achieve dimensional accuracy, and avoid overheating test specimens.
Microhardness, optical microscopy, and pitting corrosion studies of the clad specimens were carried out on their cross-sectional area, which includes layers, viz., single, double, and triple. The specimen for microhardness, metallographic, and pitting corrosion studies were prepared in accordance with ASTM E3-11 standards (ASTM, 2011a). The operation involved in preparing different test specimens, including cutting, grinding, polishing, and etching is discussed below.
Cutting: Cutting of welded samples could be performed by various operations such as power hacksaw, wire-cut electric discharge machining (WEDM), plasma-cutting torches, abrasive wheels, etc. In this present research work, wire-cut electric discharge machining (WEDM) was used for sectioning because it results in a superior surface finish, maintains dimensional accuracy, and retains material properties as less heat was generated and minimum wastage of material.
Grinding: Fully automatic surface grinder with a magnetic chuck and movable table was used for surface grinding/finishing. Grinding was performed to remove all the dents/marks and scales from the area to be polished. Coolant was pumped onto the grinding wheel as well as the specimen to protect it from excessive heat produced during grinding.
Polishing: Metallographic and pitting corrosion test specimens were polished to a mirror-like and less scratchy appearance. Proper polishing is necessary for qualitative and quantitative accurate interpretations of metallographic and pitting corrosion and determining ferrite content present in the substrate and clads. Specimens were ground manually using emery papers ranging in fineness from 100–3000 equivalent mesh and then polished using alumina suspensions and velvet cloth.
Etching: Etching was carried out to reveal the microstructure of the metal sample. An etchant usually breaks the grain boundaries, which enables us to distinguish them evidently, so that grain size, shape, and orientation can be studied. The specimen to be etched should be carefully cleaned and should be free from grease, oil, rust, oxides, and the remnants of polishing materials. Subsequently, after etching, the specimen was splashed properly with water, rinsed with ethanol, and dried by forced hot air to avoid the watermark formation. Since metallic etched surfaces are extremely reactive and can smear rapidly in the air, predominantly in humid atmospheres, etched specimens were thus stored in sealed desiccators.

3. Testing

3.1. Microstructure Characterization

From the clad plate, several cladded specimens of the proper sizes were sectioned off and processed for metallographic testing using normal polishing techniques, which entailed grinding with various emery grades before polishing with diamond paste. Etching was conducted by immersing the specimens in the respective etchant containing CuCl2 (5 gm) + Ethanol (100 mL) + HCl (100 mL), followed by cleaning the etched surface with acetone. The surfaces were then examined using an optical microscope to take micrographs of various areas of the various clad layers for the purpose of examining various microstructural phases.

3.2. Micrograph Hardness Test

Metallographically ready specimens were subjected to microhardness assessment using a microhardness tester of 1 kg to 10 kg capacity and applied testing condition of 1 kg load with a dwell time of 15 s. Different layers, i.e., single, double, and triple layers of the clads were observed along the clad center to study microhardness variation across different clad layers of SDSS and in AISI 1020 substrate.

3.3. Double Loop Electrochemical Potentio-Kinetic Reactivation Tests (DL-EPR)

Using the DL-EPR test, which involved interoperable kinetic scanning in an appropriate electrolyte from an active to a passive domain (activation or anodic scan), accompanied by a restoration to the initial potential, the corrosion resistance of SDSS claddings was assessed (reverse or reactivation scan). The counter, reference, and work electrodes were, successively, a platinum foil, a saturated calomel electrode (SCE), as well as a test specimen. The DLEPR tests were performed in a modified 2 M H2SO4 + 1 M HCl solution at 35 ± 10 °C. For the purpose of removing the dissolved oxygen prior to the test, the solutions were blasted with high-purity N2 at a flow rate of 0.3 L/min for 30 min. The tested samples have clad layers (exposed area: 0.196 cm2). The specimen was progressively ground from 280 to 1500 grit with a succession of emery sheets and polished to a mirror finish with a 2.5 m diamond paste afterward in order to lessen the impact of surface condition on the test result. The sample was cathodically polarized at 750 mV/SCE for 3 min prior to the DLEPR test procedure in order to increase repeatability. The test was initiated in an anodic manner from −100 mV/SCE + Ecorr (corrosion potential) at 1 mV/s until the potential hit 600 mV/SCE + Ecorro in the passive area after the open-circuit potential (Eocp) had stabilized for around 1 h. When the potential had once more approached Ecorro, the scan was then reversed in the cathodic direction. In both the forward and reverse scans, the current of activation (Ia) and reactivation (Ir) were measured. The ratio (Ir/Ia) × 100% was calculated to rank the localized corrosion susceptibility.

3.4. Dilution

Dilution is usually taken to be the proportion of the cross-sectional area of melted base material to the entire cross-sectional area of the fusion zone and is described as the percentage of base material in the resulting clad layer deposit. To perform the test of dilution, samples were sectioned, polished, and etched in a solution of CuCl2 (5 gm) + Ethanol (100 mL) + HCl (100 mL). Digital photographs were taken from the etched surface of the samples, and then dilution (D) was calculated via image analyzer software, i.e., ImageJ (Fiji) software.

3.5. Ferrite Number

The ferrite content in the specimen was measured with the help of a ferrite scope from Fischer. This handy equipment provides rapid and accurate data via highly mobile digital technology. Ferrite content measurement was used to measure the ferrite content in SDSS clads. Test results can be represented by ferrite number (FN) or by ferrite content (%).

4. Result and Discussion

4.1. Pitting Corrosion Test (DLEPR)

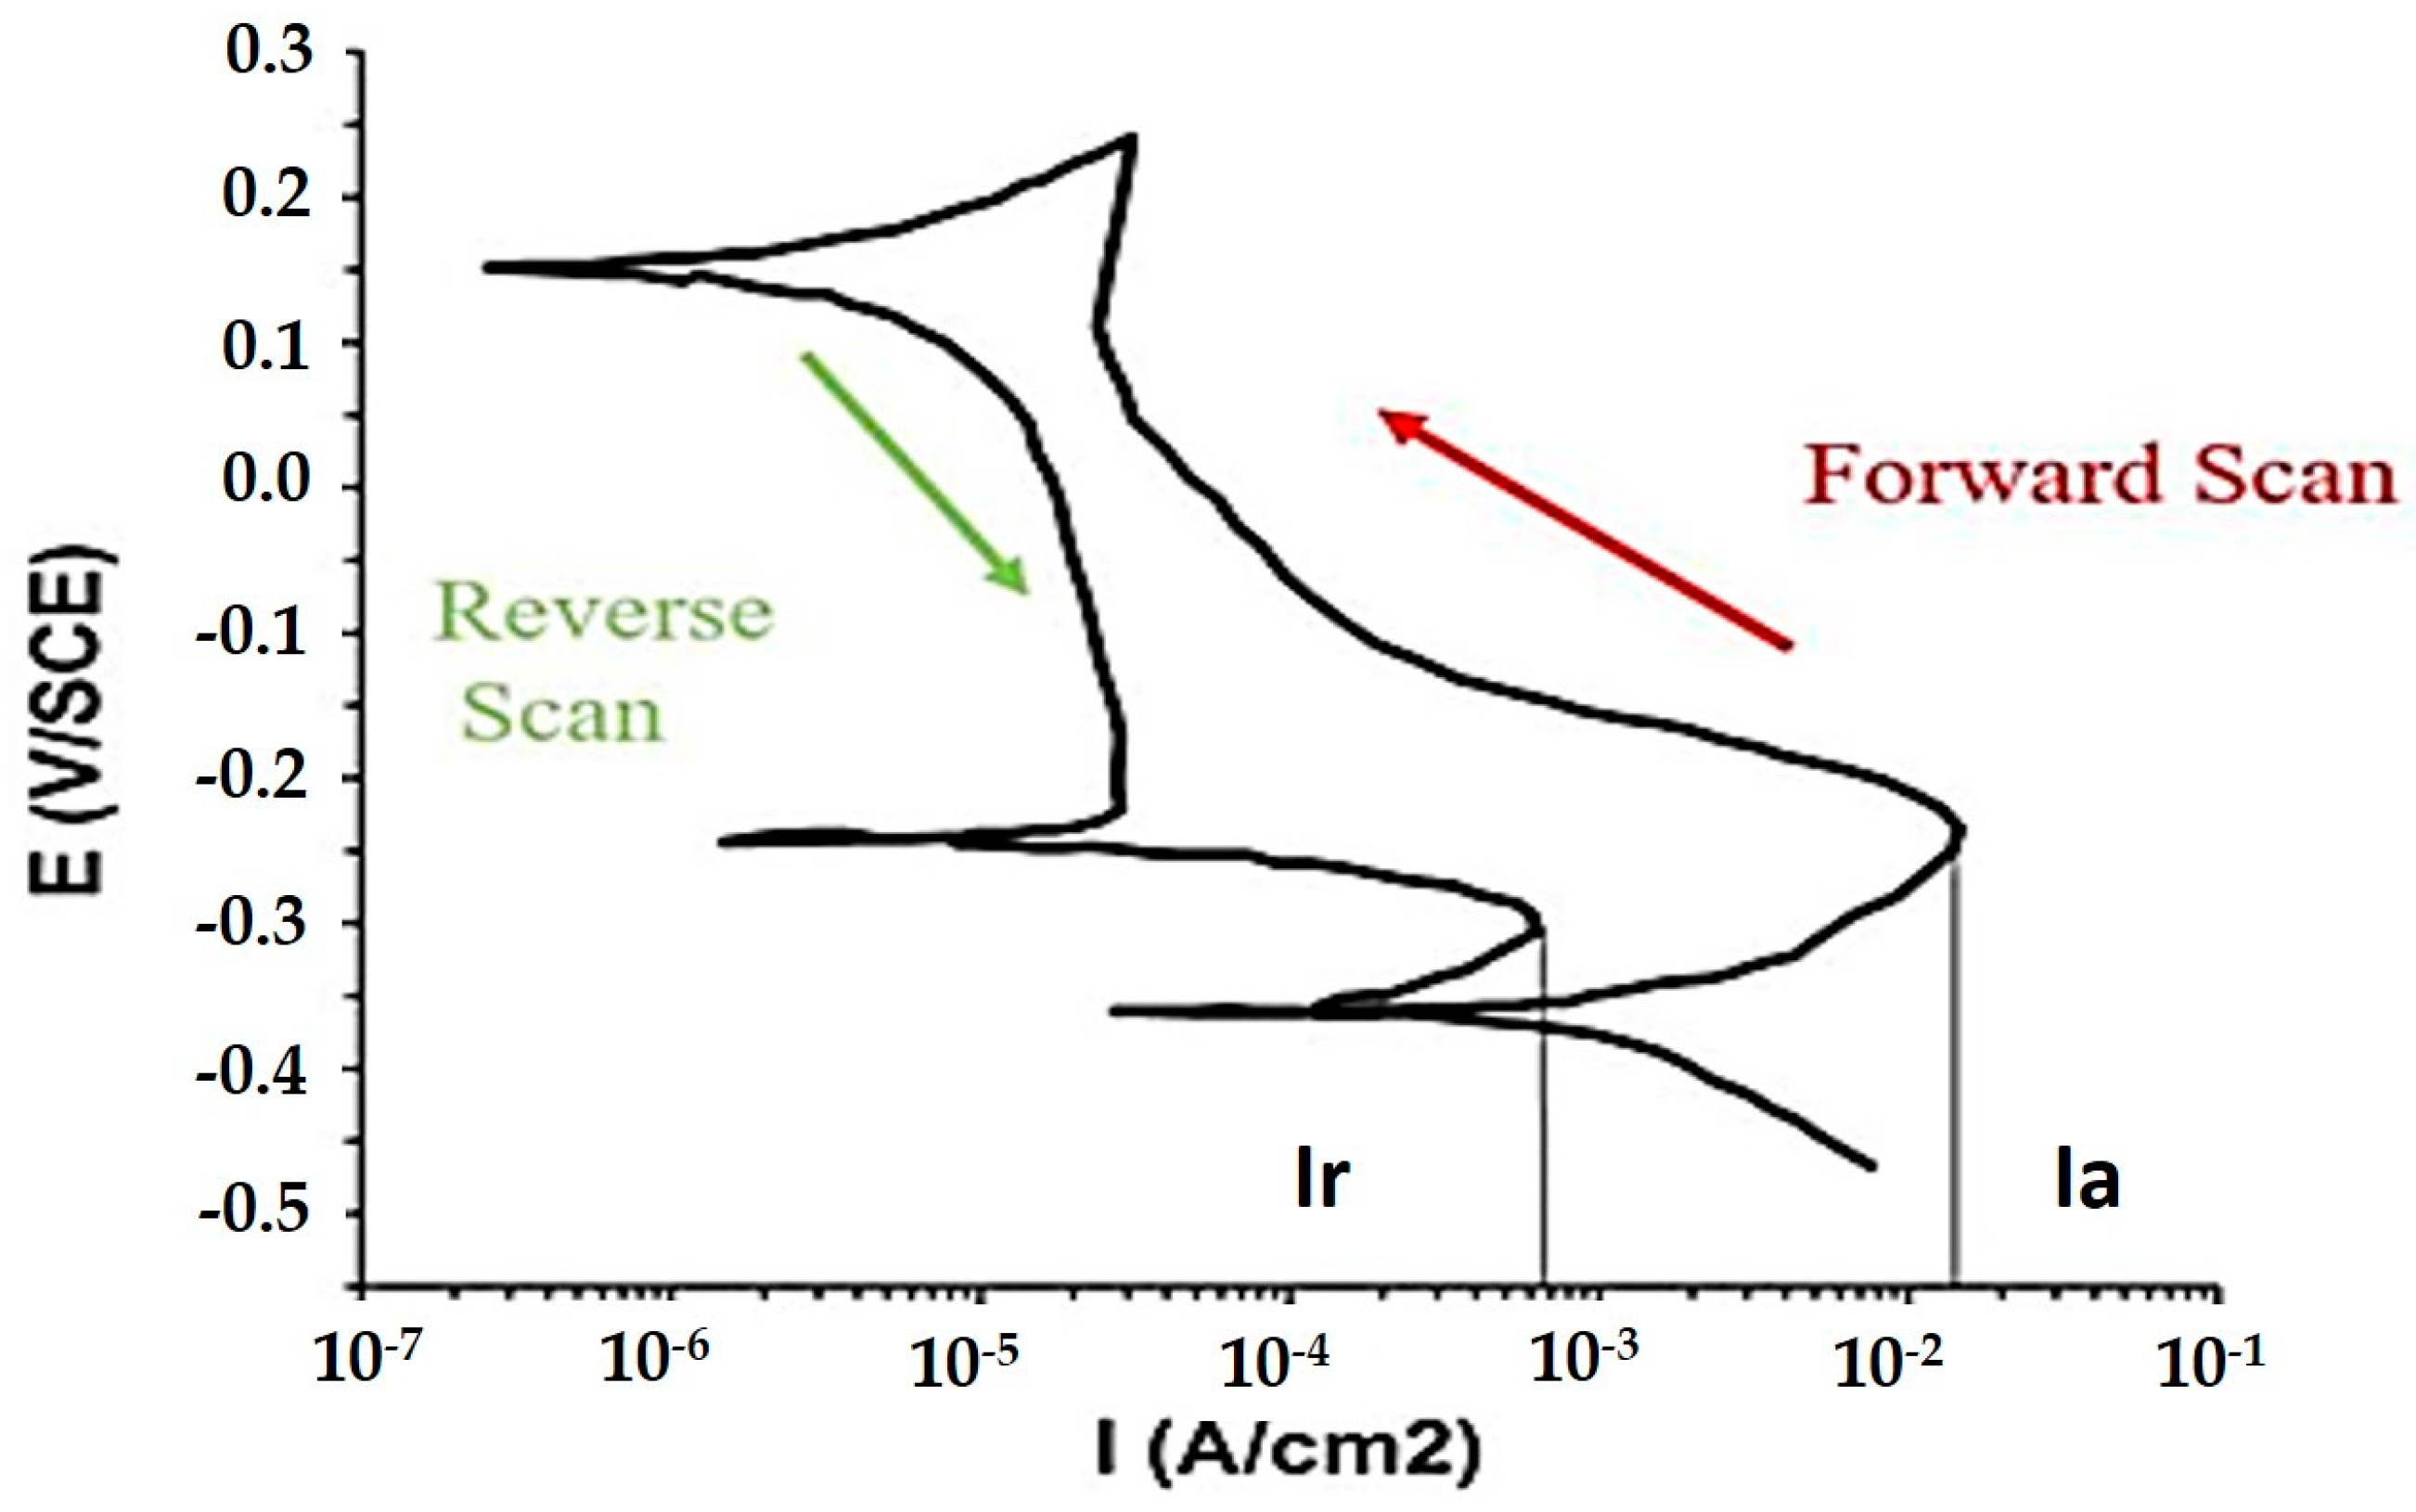
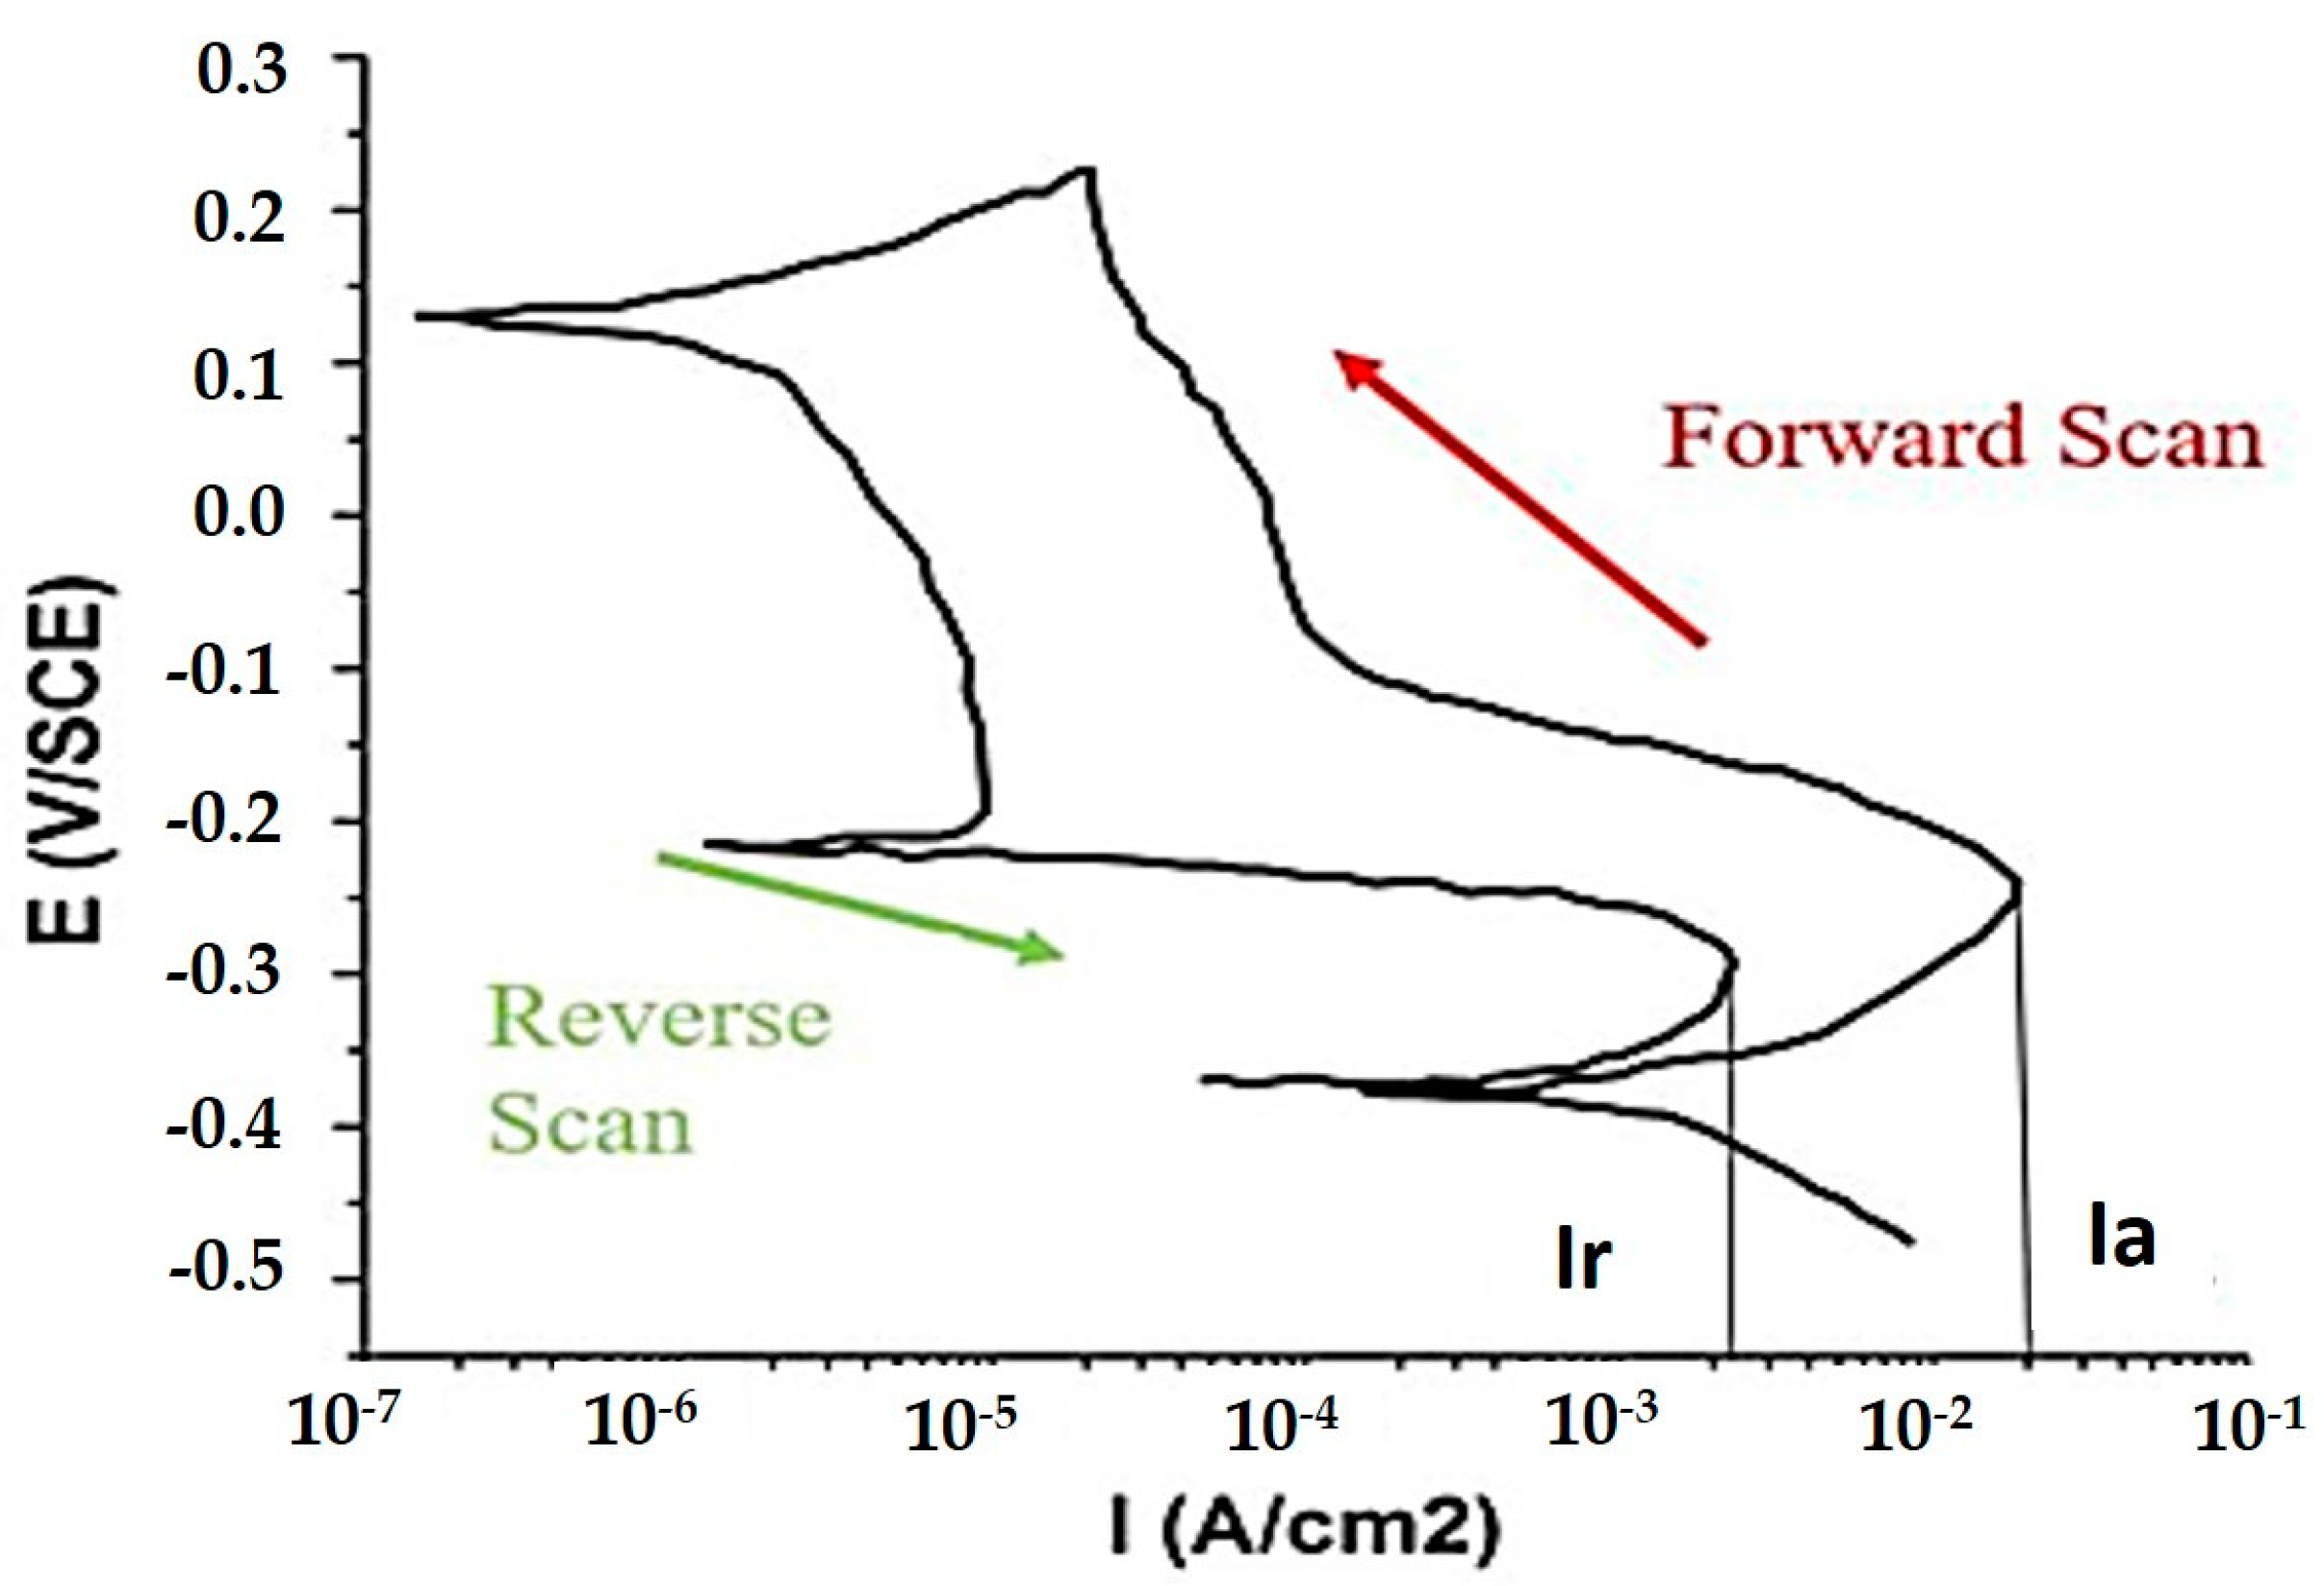
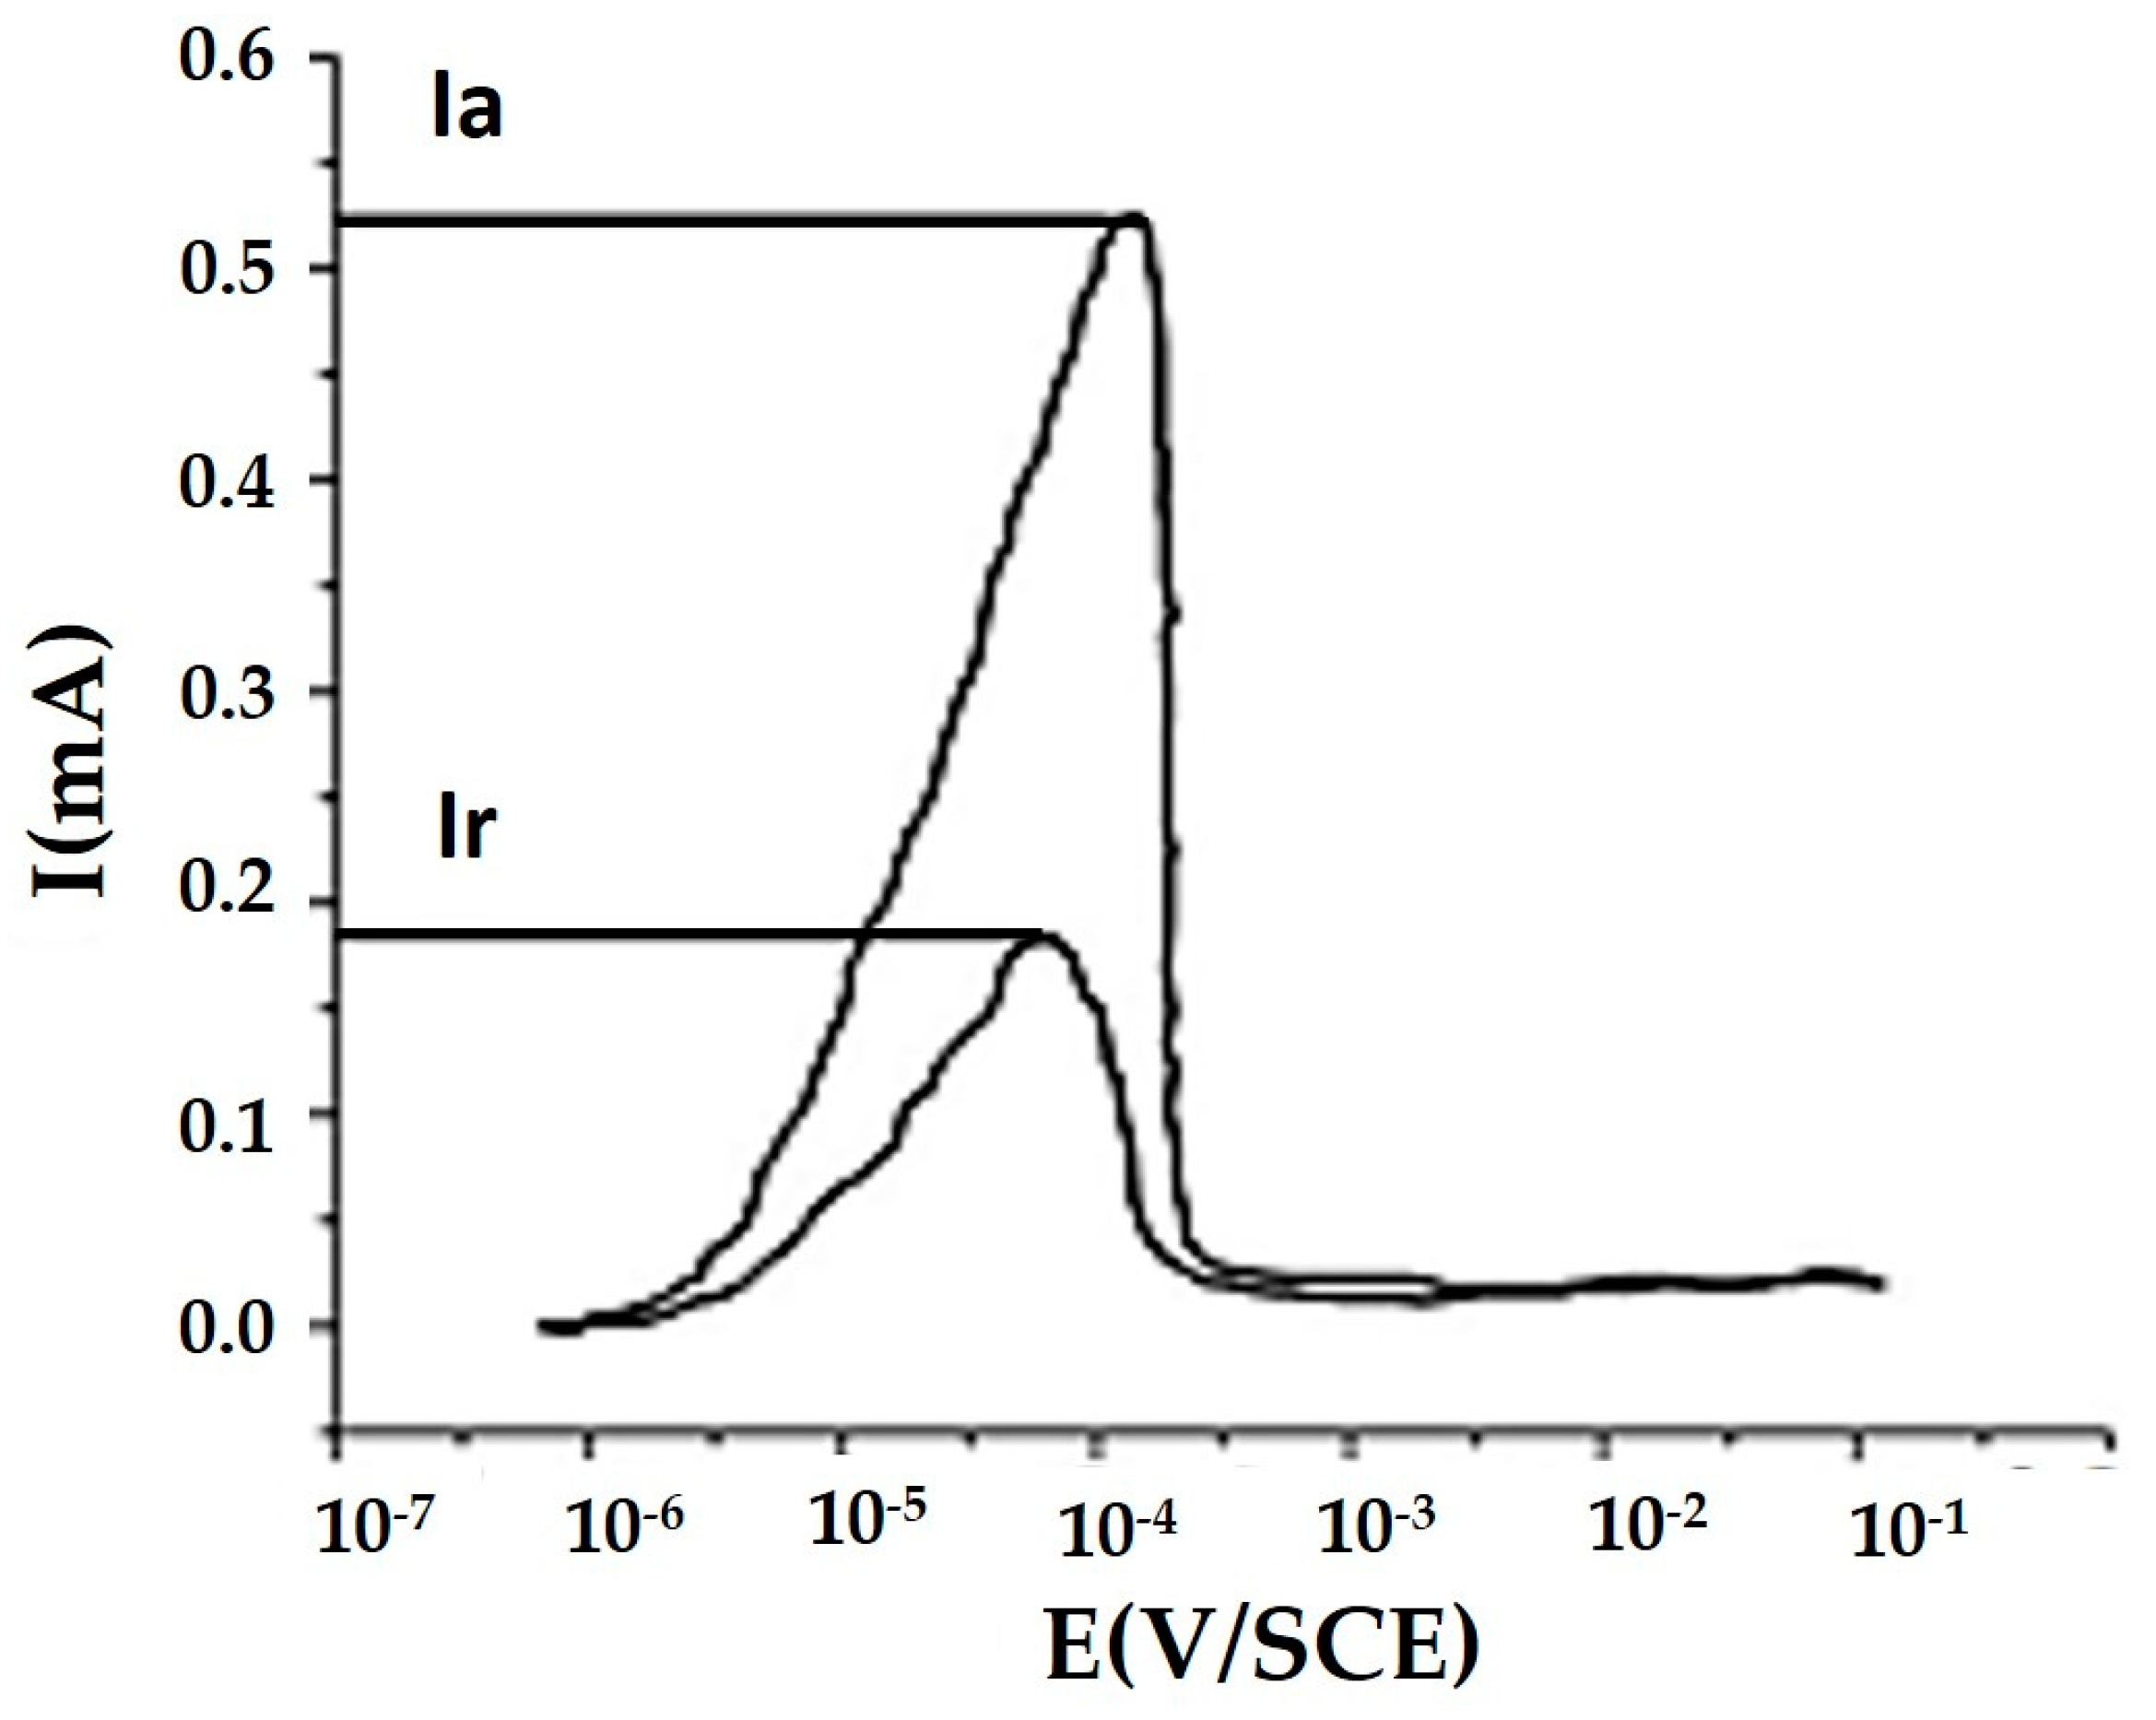
Figure 3 and Figure 4 show the DL-EPR curves of the top clad layer and intermediate clad layer with pure argon as the shielding gas in 2 M H2SO4 + 1 M HCl solution at 35 °C. Figure 5 shows the DLEPR curve of the substrate AISI 1020 steel. The Ir/Ia values after the DL-EPR measurements are listed in Table 5. It can be observed that the value of Ia was almost the same for the top clad and intermediate clad layers; however, a significant difference of 1.606 E-3 (A/cm2) in Ir values of the top clad and intermediate clad layers has been observed. Ir/Ia% values showed a remarkable difference of 7.8% between the top clad layer and the intermediate clad layer. The lower the Ir/Ia% value, the better the pitting corrosion resistance/localized corrosion. Thus, the top clad layer demonstrated a lower Ir/Ia value (4.1%), indicating better resistance to pitting corrosion in acidified chloride environment. The Ir/Ia% of 11.9% observed in the case of the intermediate clad layer demonstrate that the intermediate clad layer possesses higher pitting corrosion/localized corrosion resistance in acidified chloride environment compared to AISI 1020 steel having Ir/Ia of 29.6%, but not as much compared to the top clad layer. So, it is clear from the above results that after cladding super duplex stainless steel over mild steel, the corrosive properties show significant improvement.

4.2. Microhardness

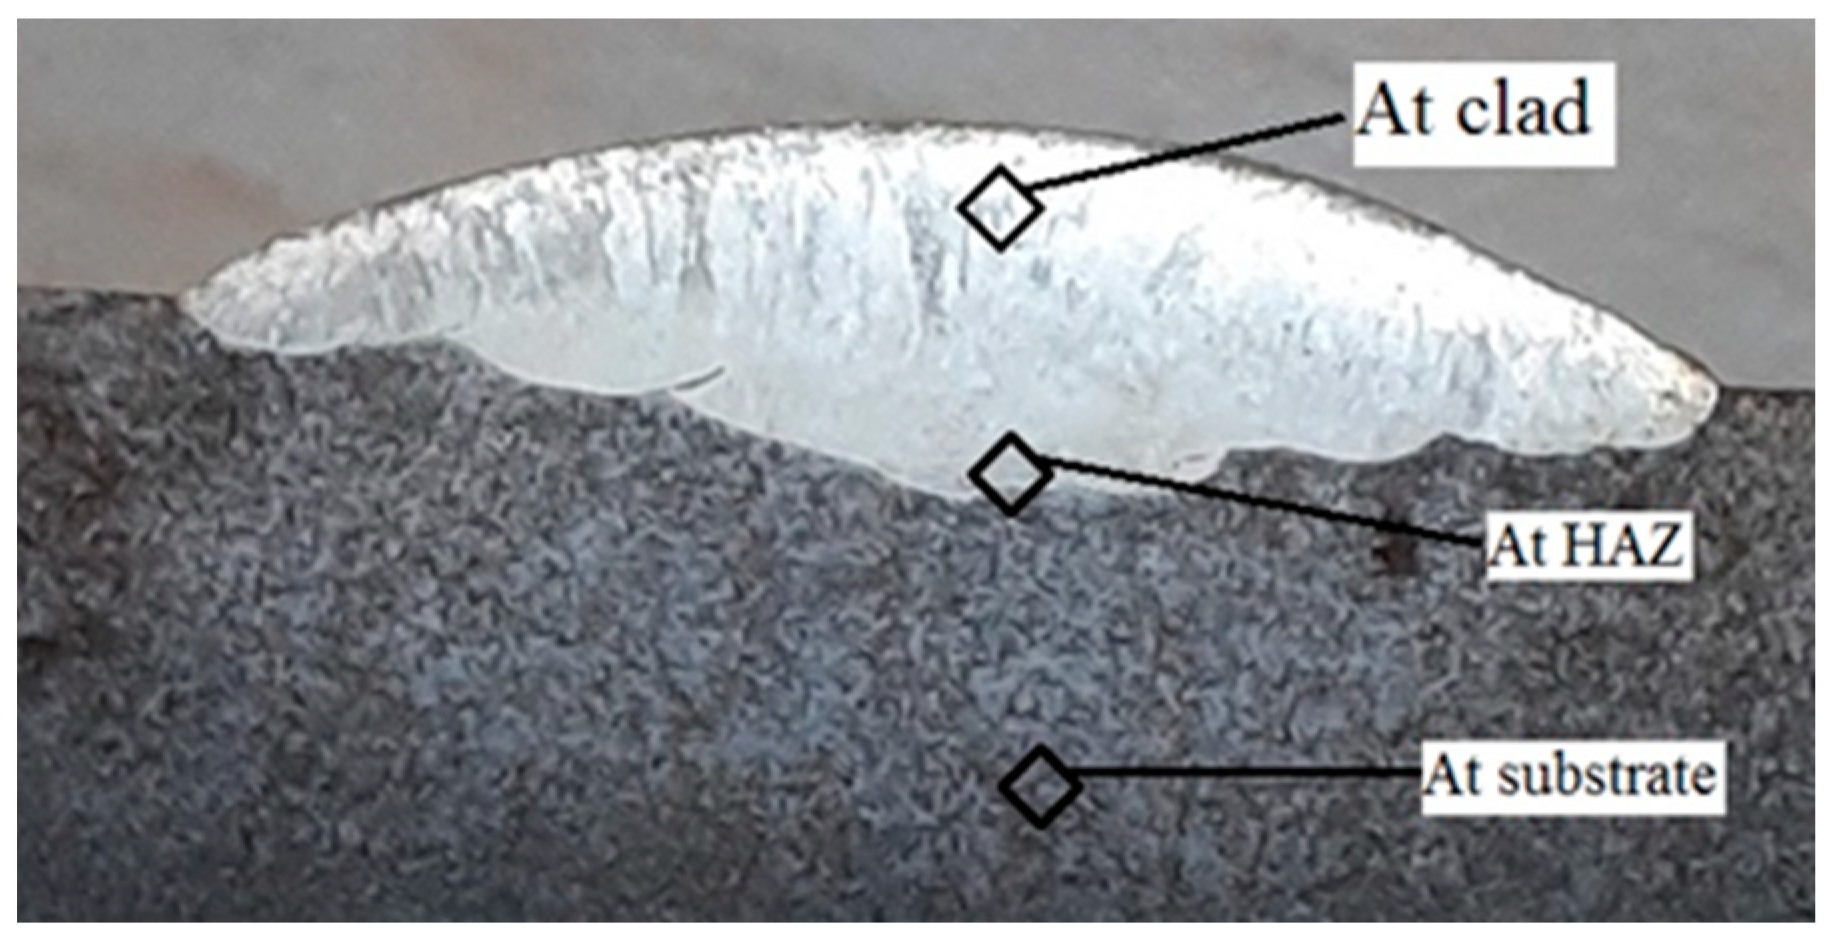
Hardness plays an important role in the wear behavior of materials. Microhardness at the clad, heat-affected zone, and base metal have been determined using a Vickers hardness tester confirming ASTM-E384. Figure 6 shows the different zone at which the microhardness value has been taken and the graphical representation of the microhardness value at the different zone with variation in current and layers. It can be observed from Figure 7 that microhardness of the clad decreases with an increase in both the current level and the number of layers. Due to the high heat input, initially, the grains get softer, but after cooling down to ambient temperature, the grains become coarser, resulting in a noticeable decrement in the microhardness values of SDSS clads. Additionally, decreasing trends in microhardness amongst the top, intermediate, and bottom layers can be attributed to the fact that the re-melting retards the cooling rate of the previous layers of the clad surface because of whichever grain coarsening occurs in the previously cladded layers.

4.3. Microstructure Characterization

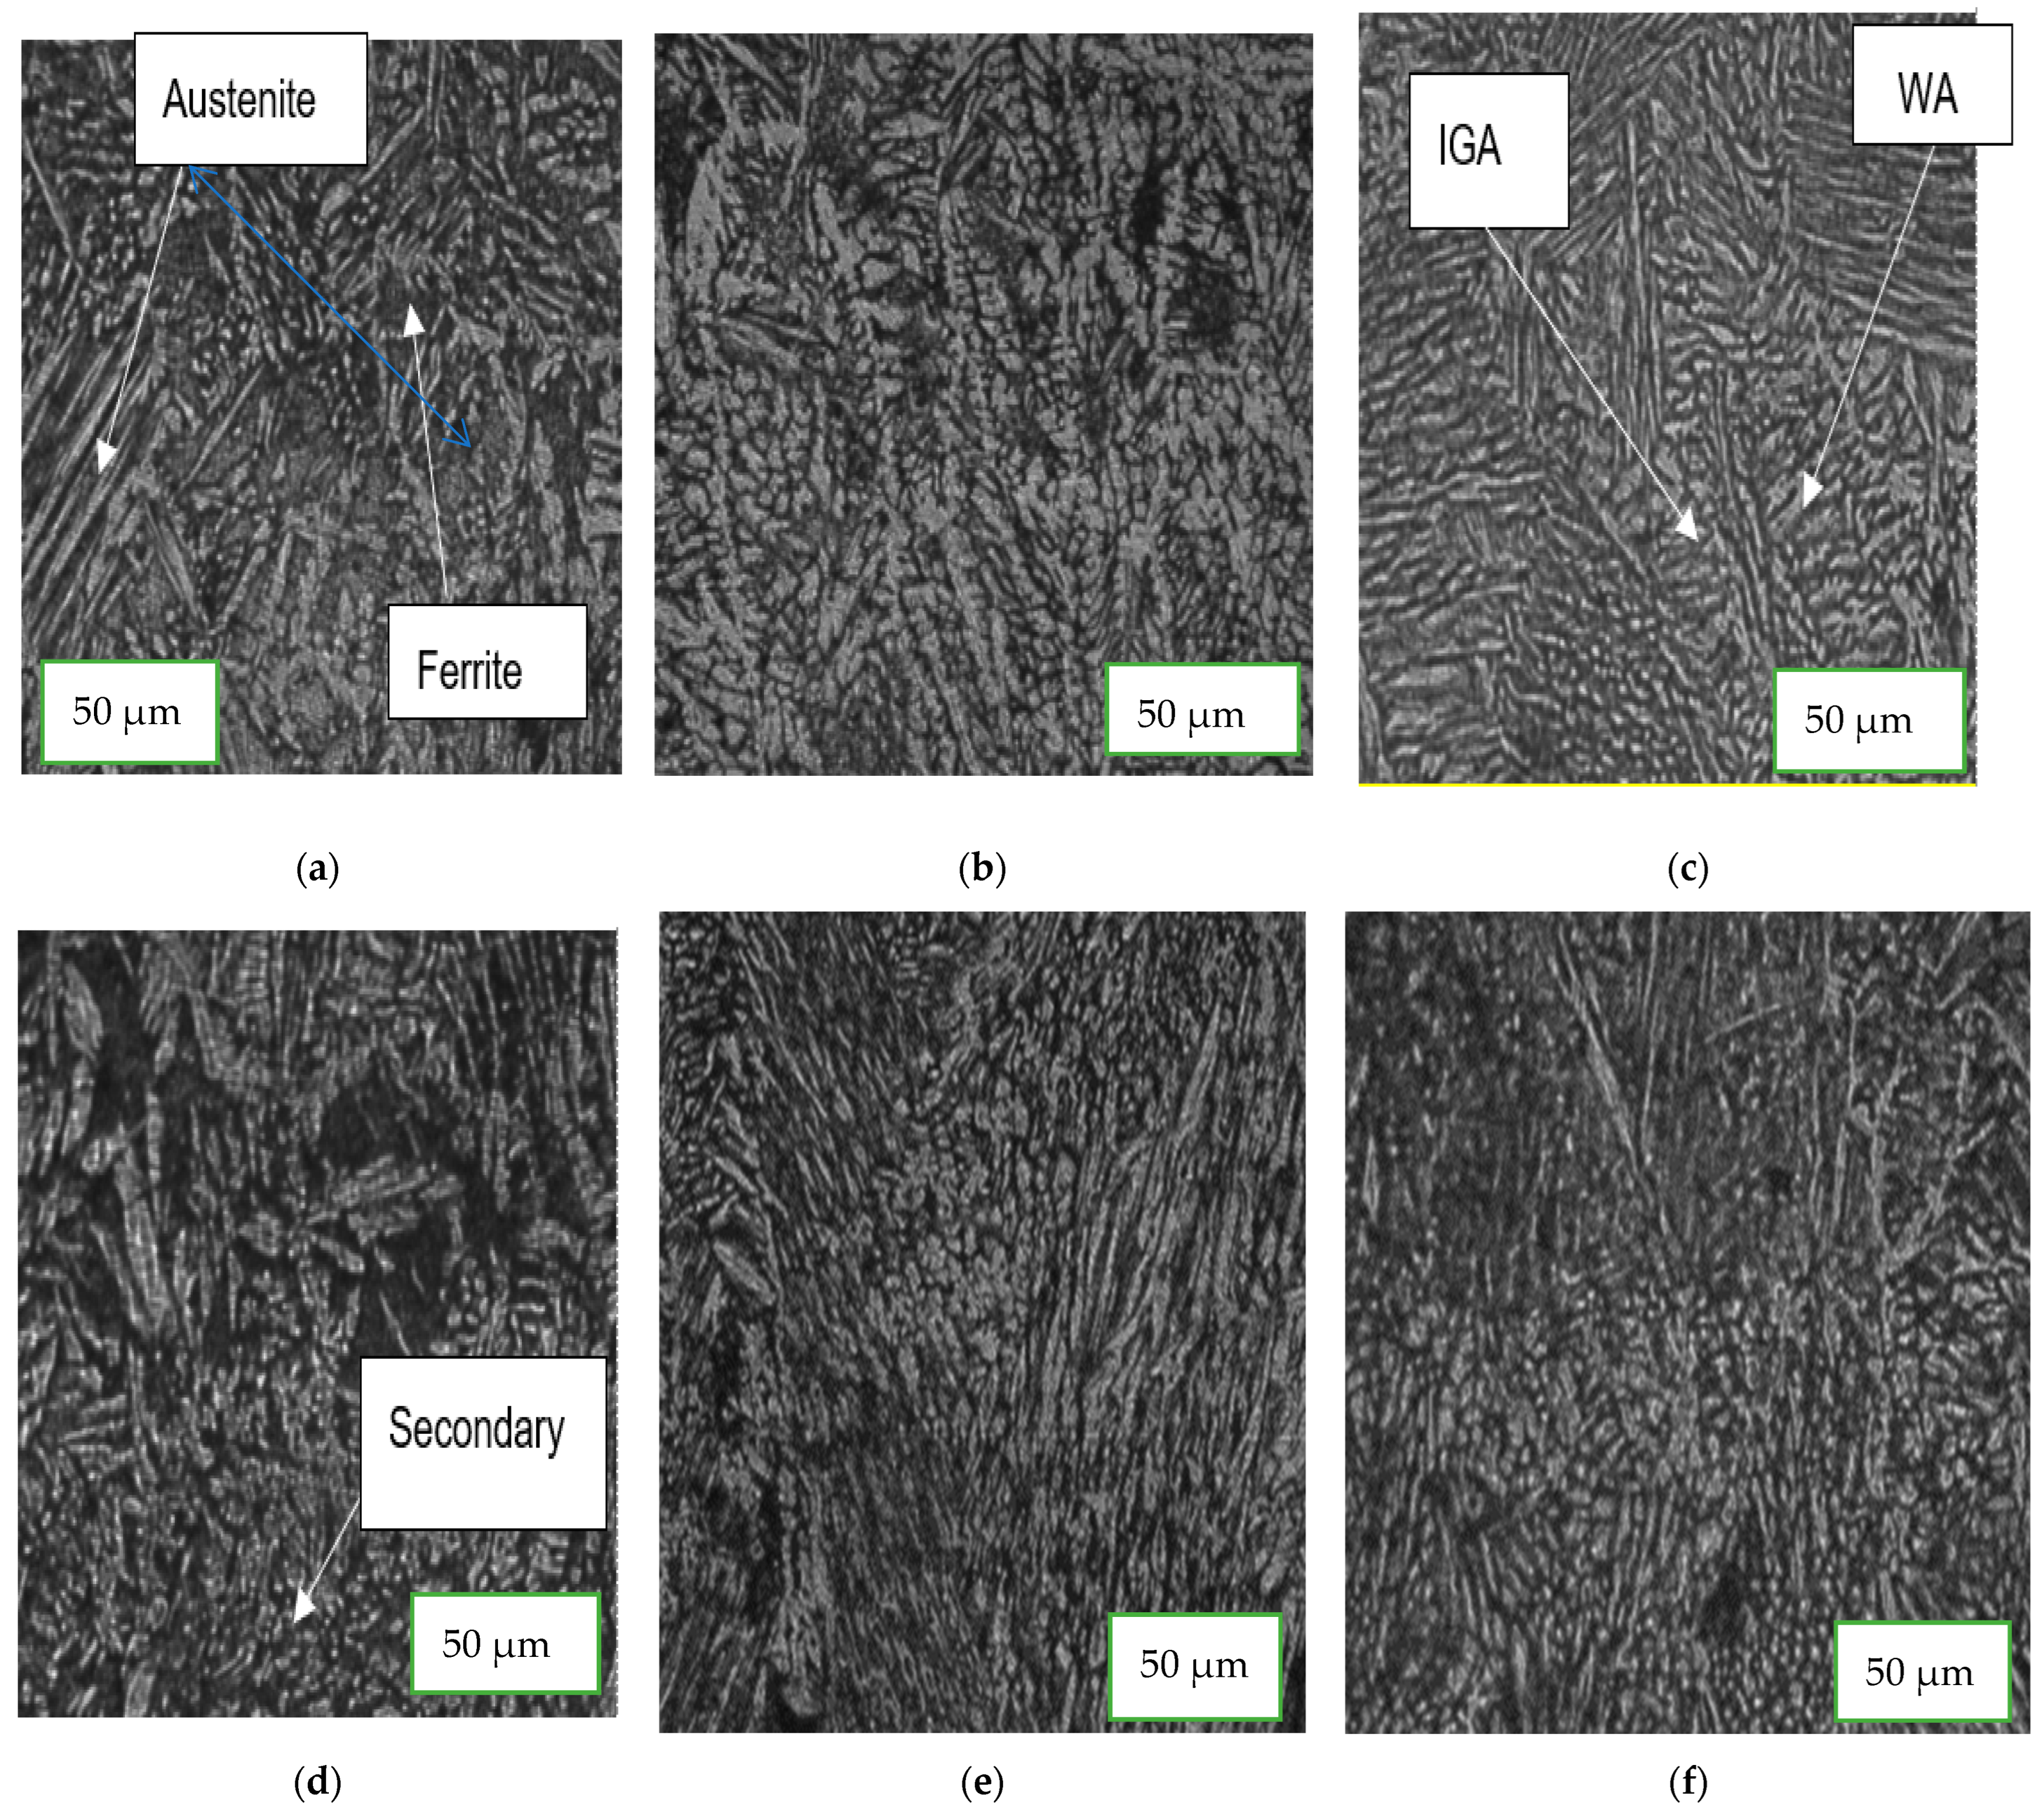
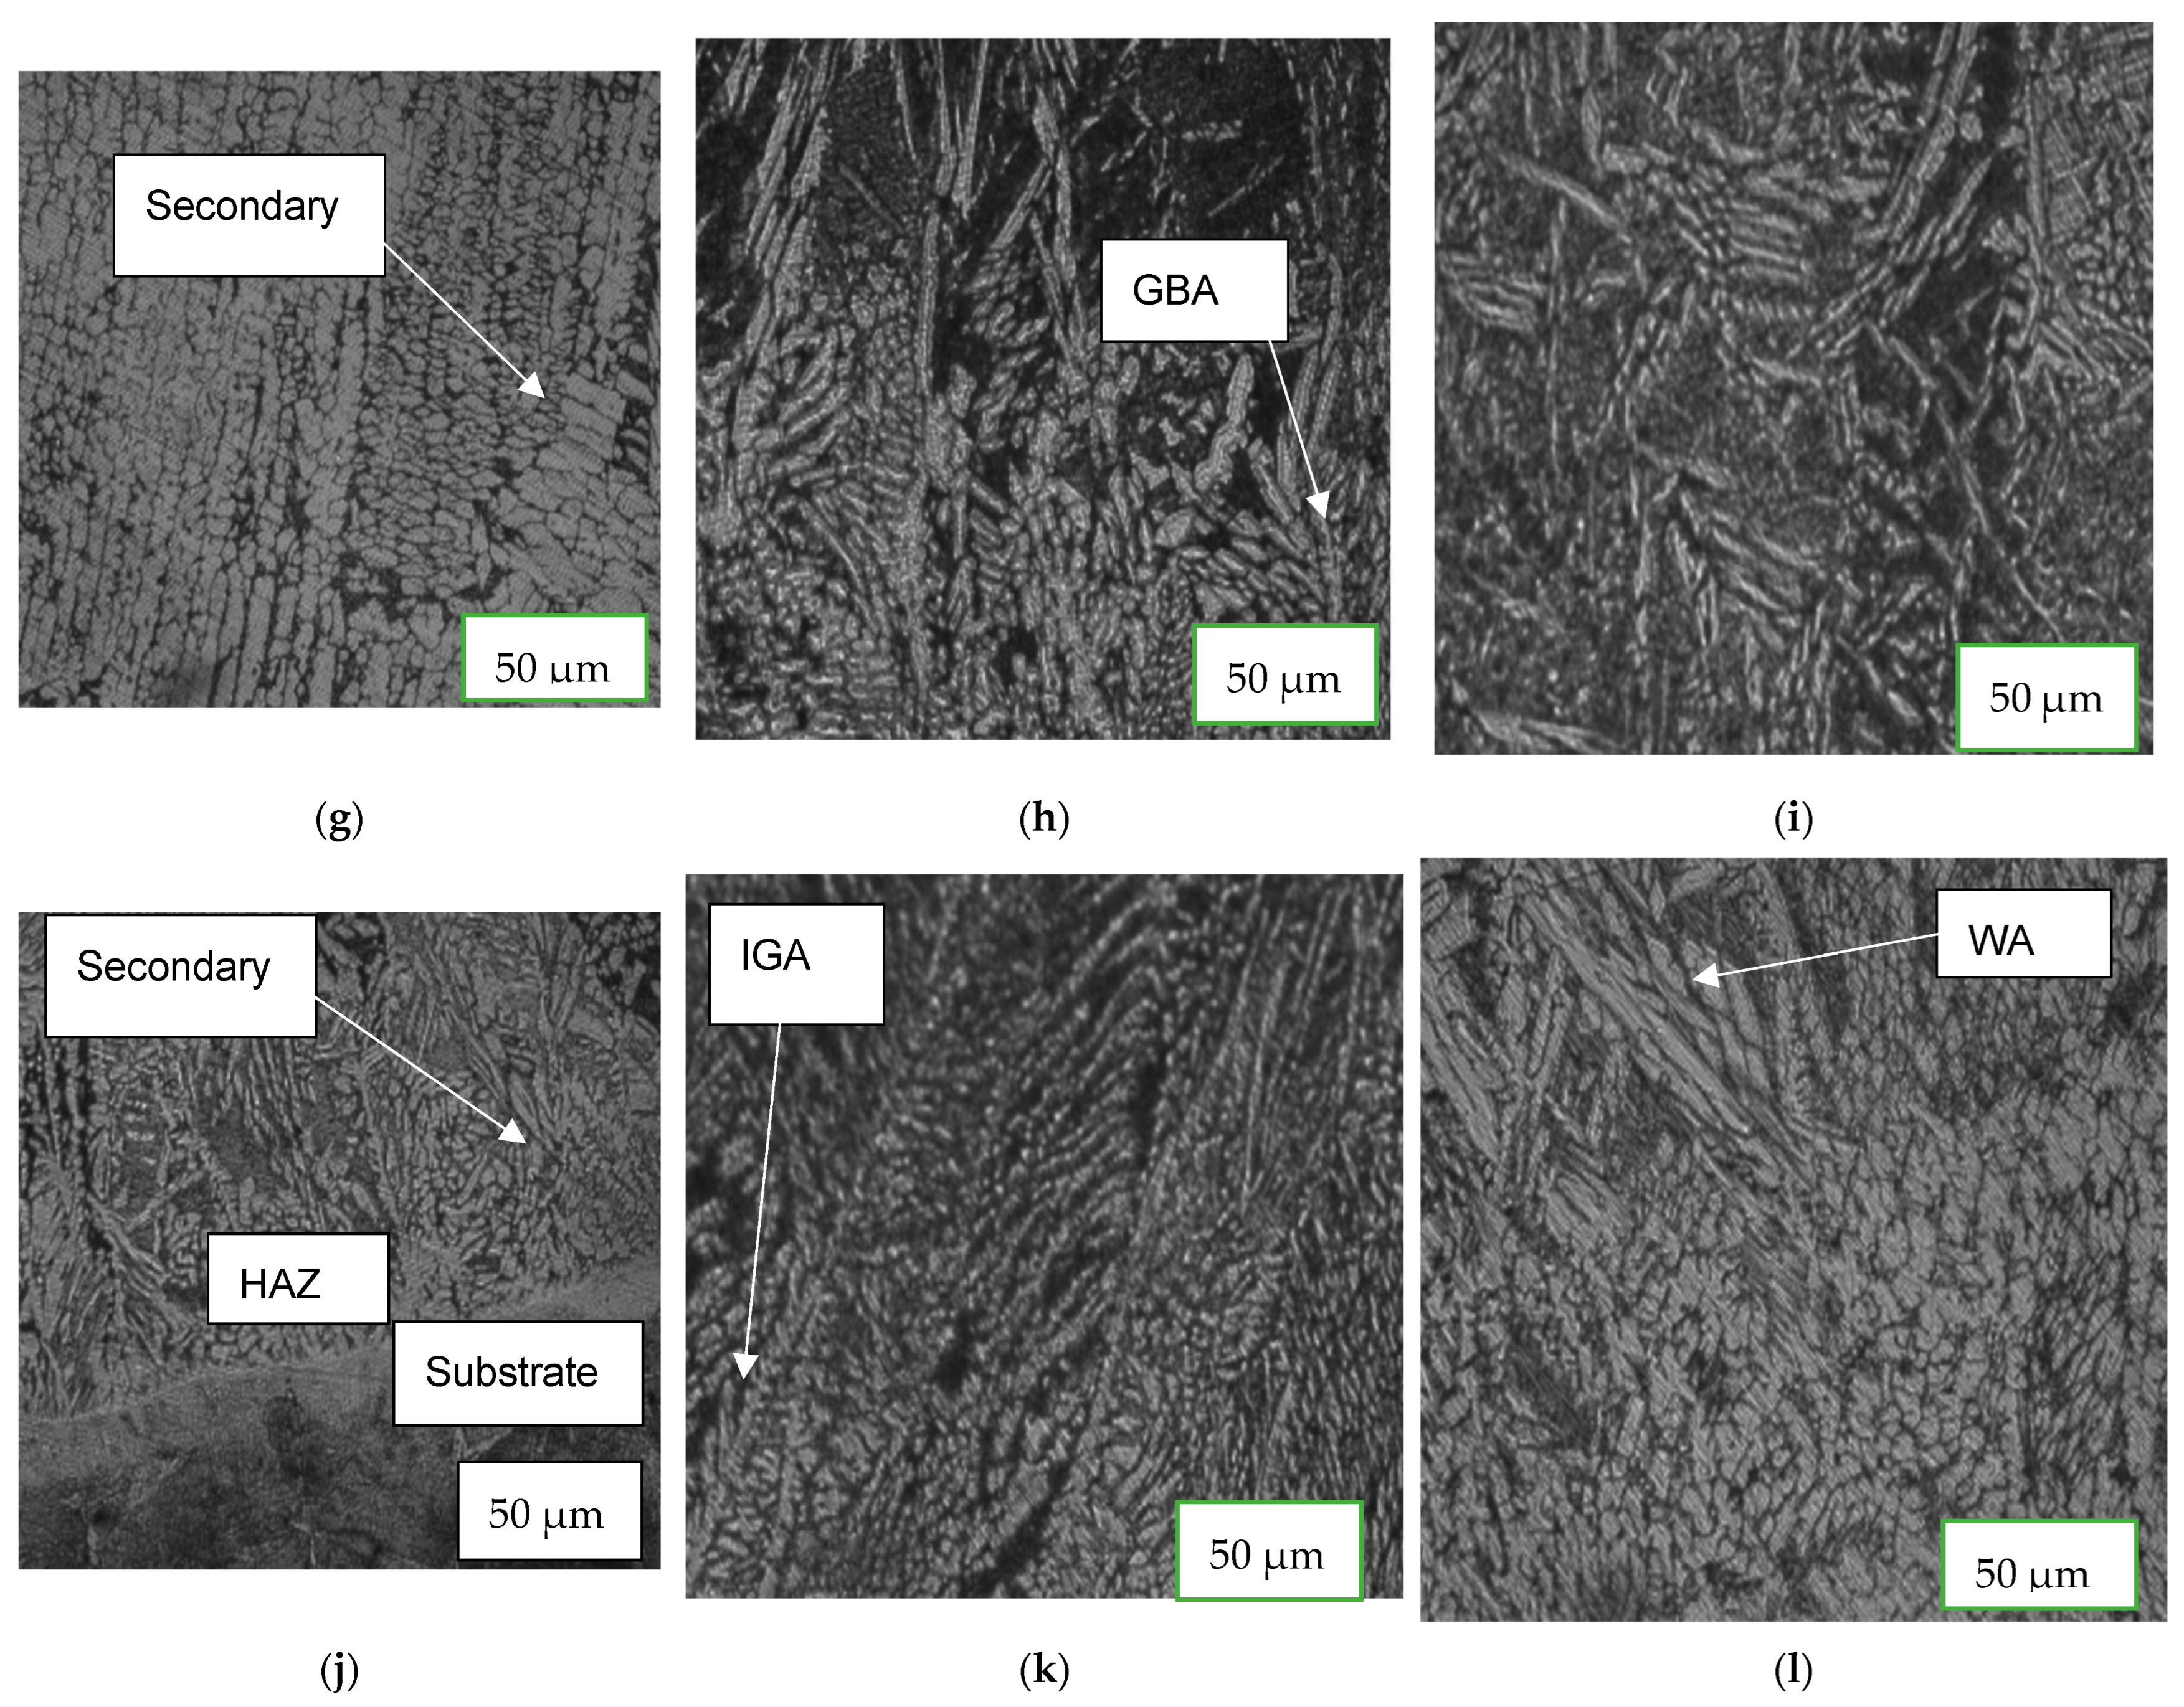
Generally, austenite contains two types: primary austenite and secondary austenite γ2. The primary austenite is mainly formed from the subsequent solid-state phase transition of the ferrite after being solidified from molten metal. There are four different types of primary austenite in the WM and HAZ, including grain boundary austenite (GBA), Widmanstatten austenite (WA), intragranular austenite (IGA), and partially transformed austenite. The typical microstructures of clad layers at different current levels are shown in Figure 8. When a new layer is laid onto the previous layer, re-melting of the previously laid clad layer takes place. Hence, intragranular primary austenite and secondary austenite are formed at HAZ. The amount of austenite formed is higher in HAZ than that in clad, as observed in Figure 8j. The clad region comprises grain boundary austenite, intragranular, and Widmanstatten austenite formed in a ferrite matrix. Coarse ferrite grains are observed in the clad region. From Figure 8c,f,i,l, it can be concluded that on increasing the current level, the grains become coarser, which implies that microhardness is decreasing. When high heat input is employed, large grain sizes and higher contents of austenite are observed in Figure 8b,e,h,k.

4.4. Ferrite Number

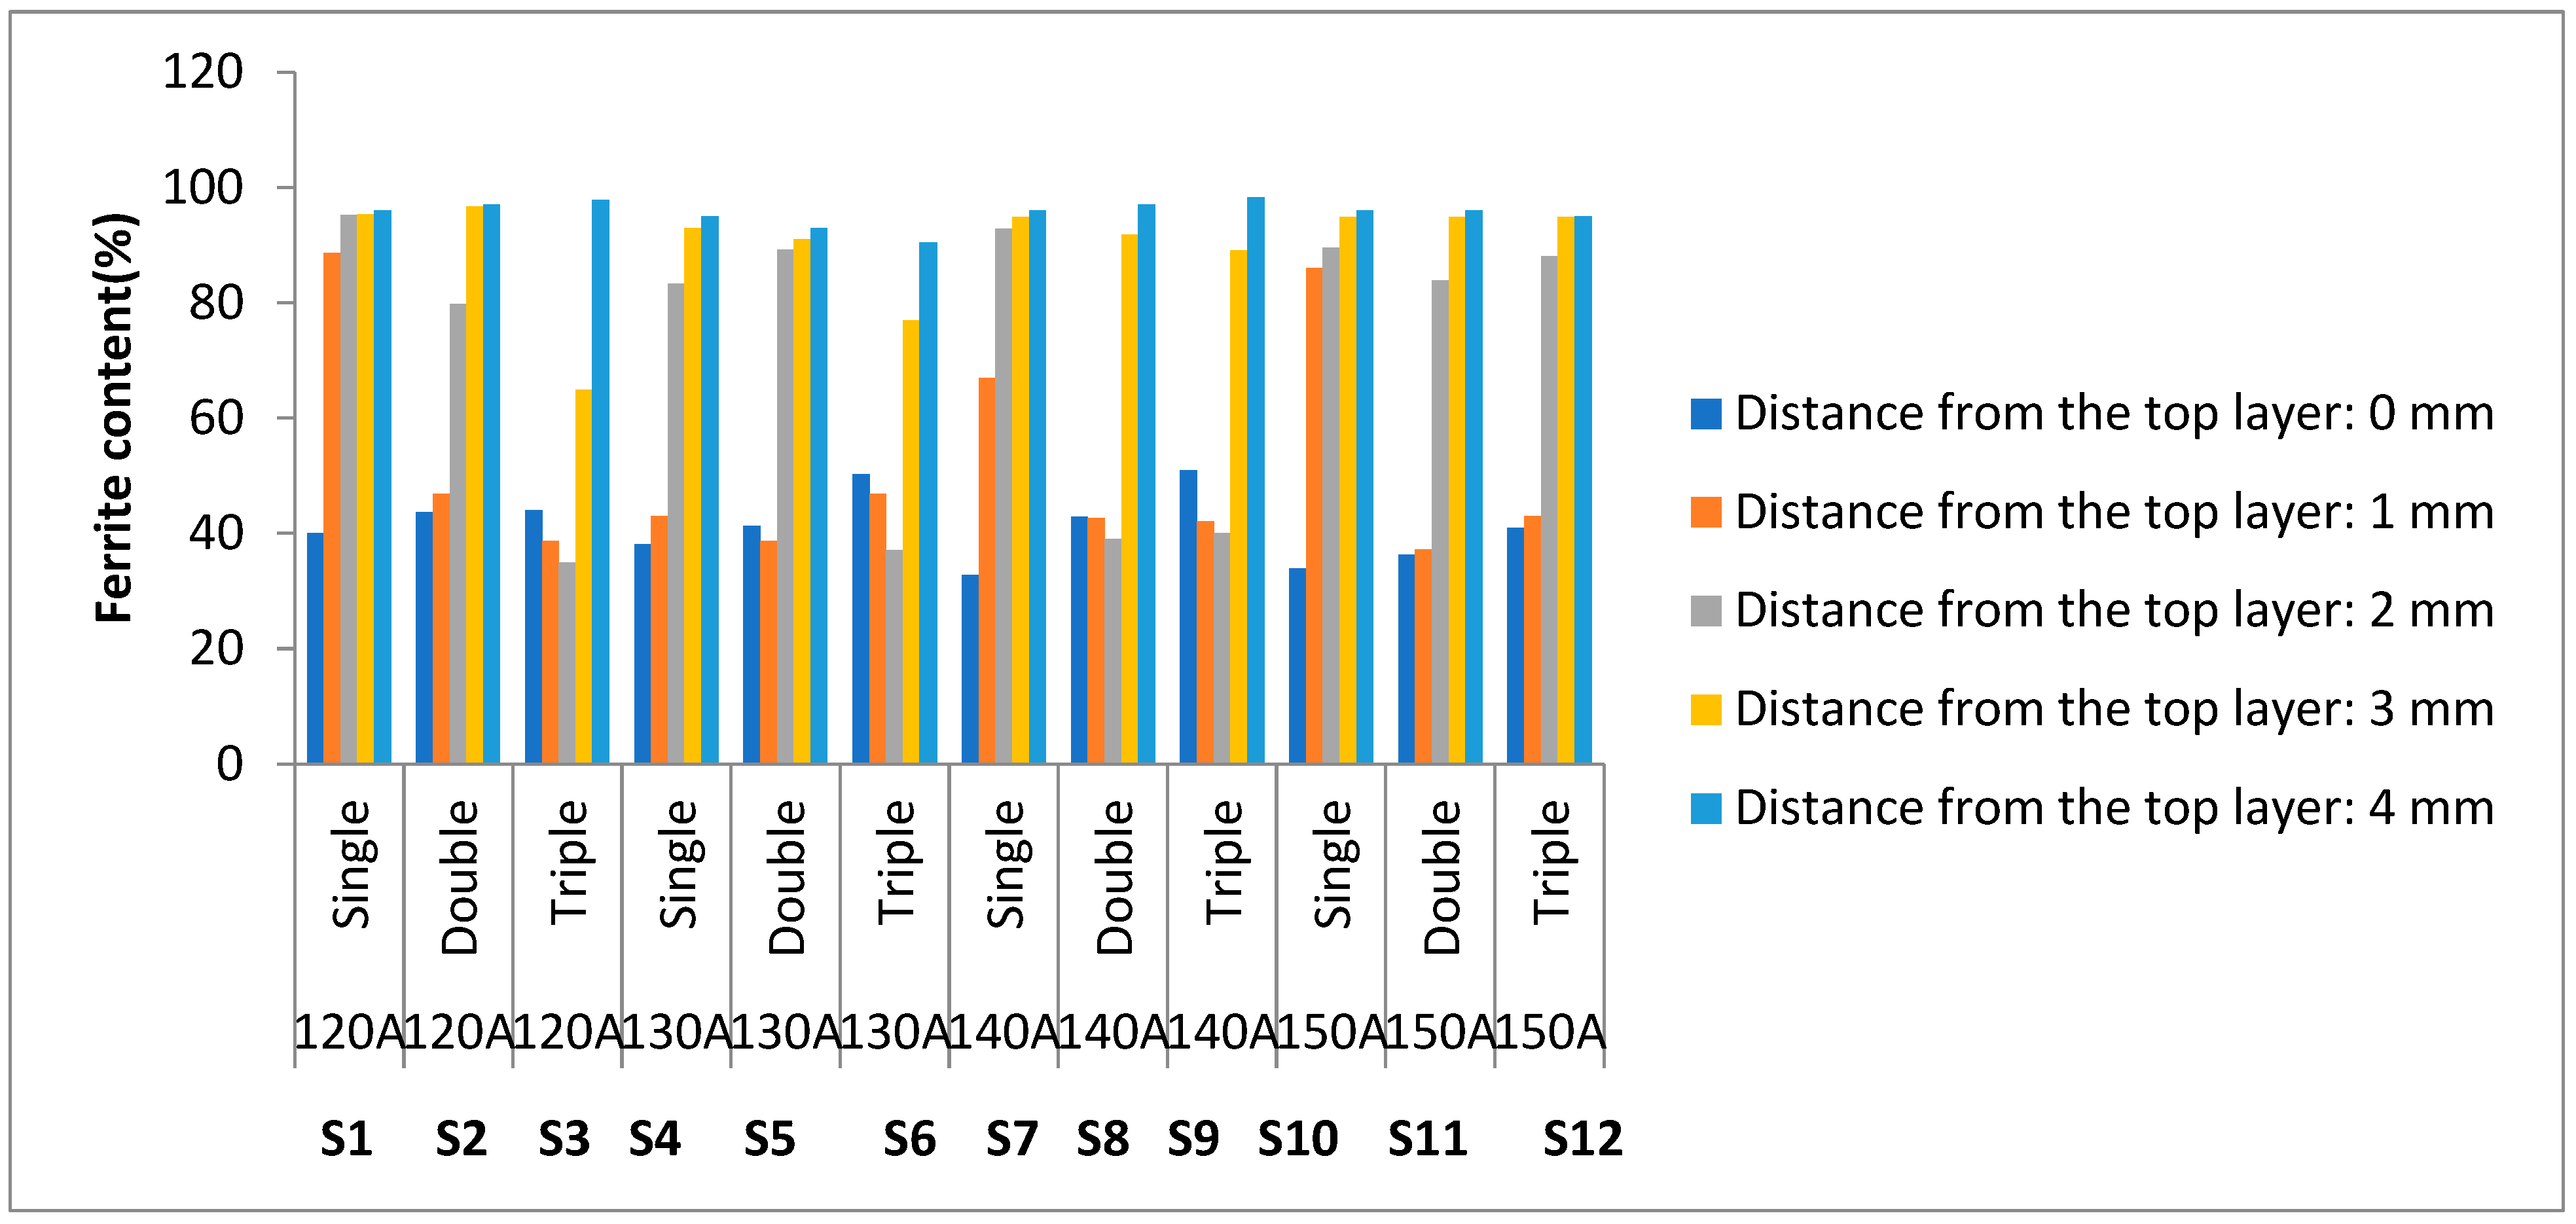
Ferrite content measurement was conducted using Fisher’s ferrite scope, and the results are presented in Figure 9. The result shows that an increase in the number of clad layers increases the ferrite content. Generally, austenite contains two types: primary austenite and secondary austenite γ2. Intragranular primary austenite and secondary austenite are formed at the root. The reheating of clad layers is the main reason for the formation of secondary austenite. Secondary austenite formation takes place near the HAZ, so ferrite content decreases near the HAZ, which is clearly shown in the result of ferrite content. So, in a single-layered clad, the value of the ferrite number increases from top to bottom due to the dilution effect. However, in a double-layered clad, higher ferrite content is noticed at the clad cap compared to the single-layer-clad cap; this shows that the composition retains itself more at the second-layer-clad cap. From top to bottom, the ferrite number first decreases and then increases. Ferrite number decreases due to the conversion of ferrite into austenite after re-melting and increases due to the dilution effect. In a triple-layered clad, at the top layers, SDSS retains its composition, i.e., the austenite/ferrite ratio approaches almost 1:1, as the effect of dilution is minimum at the top layers. Again, in the case of triple layers, from top to bottom, ferrite number first decreases and then increases due to the formation of a secondary austenite and the dilution effect of the substrate, respectively. So, it can be concluded that after evaluating the ferrite content, a greater number of layers is preferable to keep the dilution minimum, but it cannot be exceeded; otherwise, the cost of cladding will also get soot up. Additionally, an optimization solution would be helpful for the determination of the optimum number of layers required.

4.5. Dilution

Dilution can be defined as the proportion of base material in the resultant clad layer deposited, usually taken to be the ratio of the cross-sectional area of melted base material to the total cross-sectional area of the fusion zone. The dilution (D) was obtained using the following formula:
D = (Area of the base material)/(total molten area).
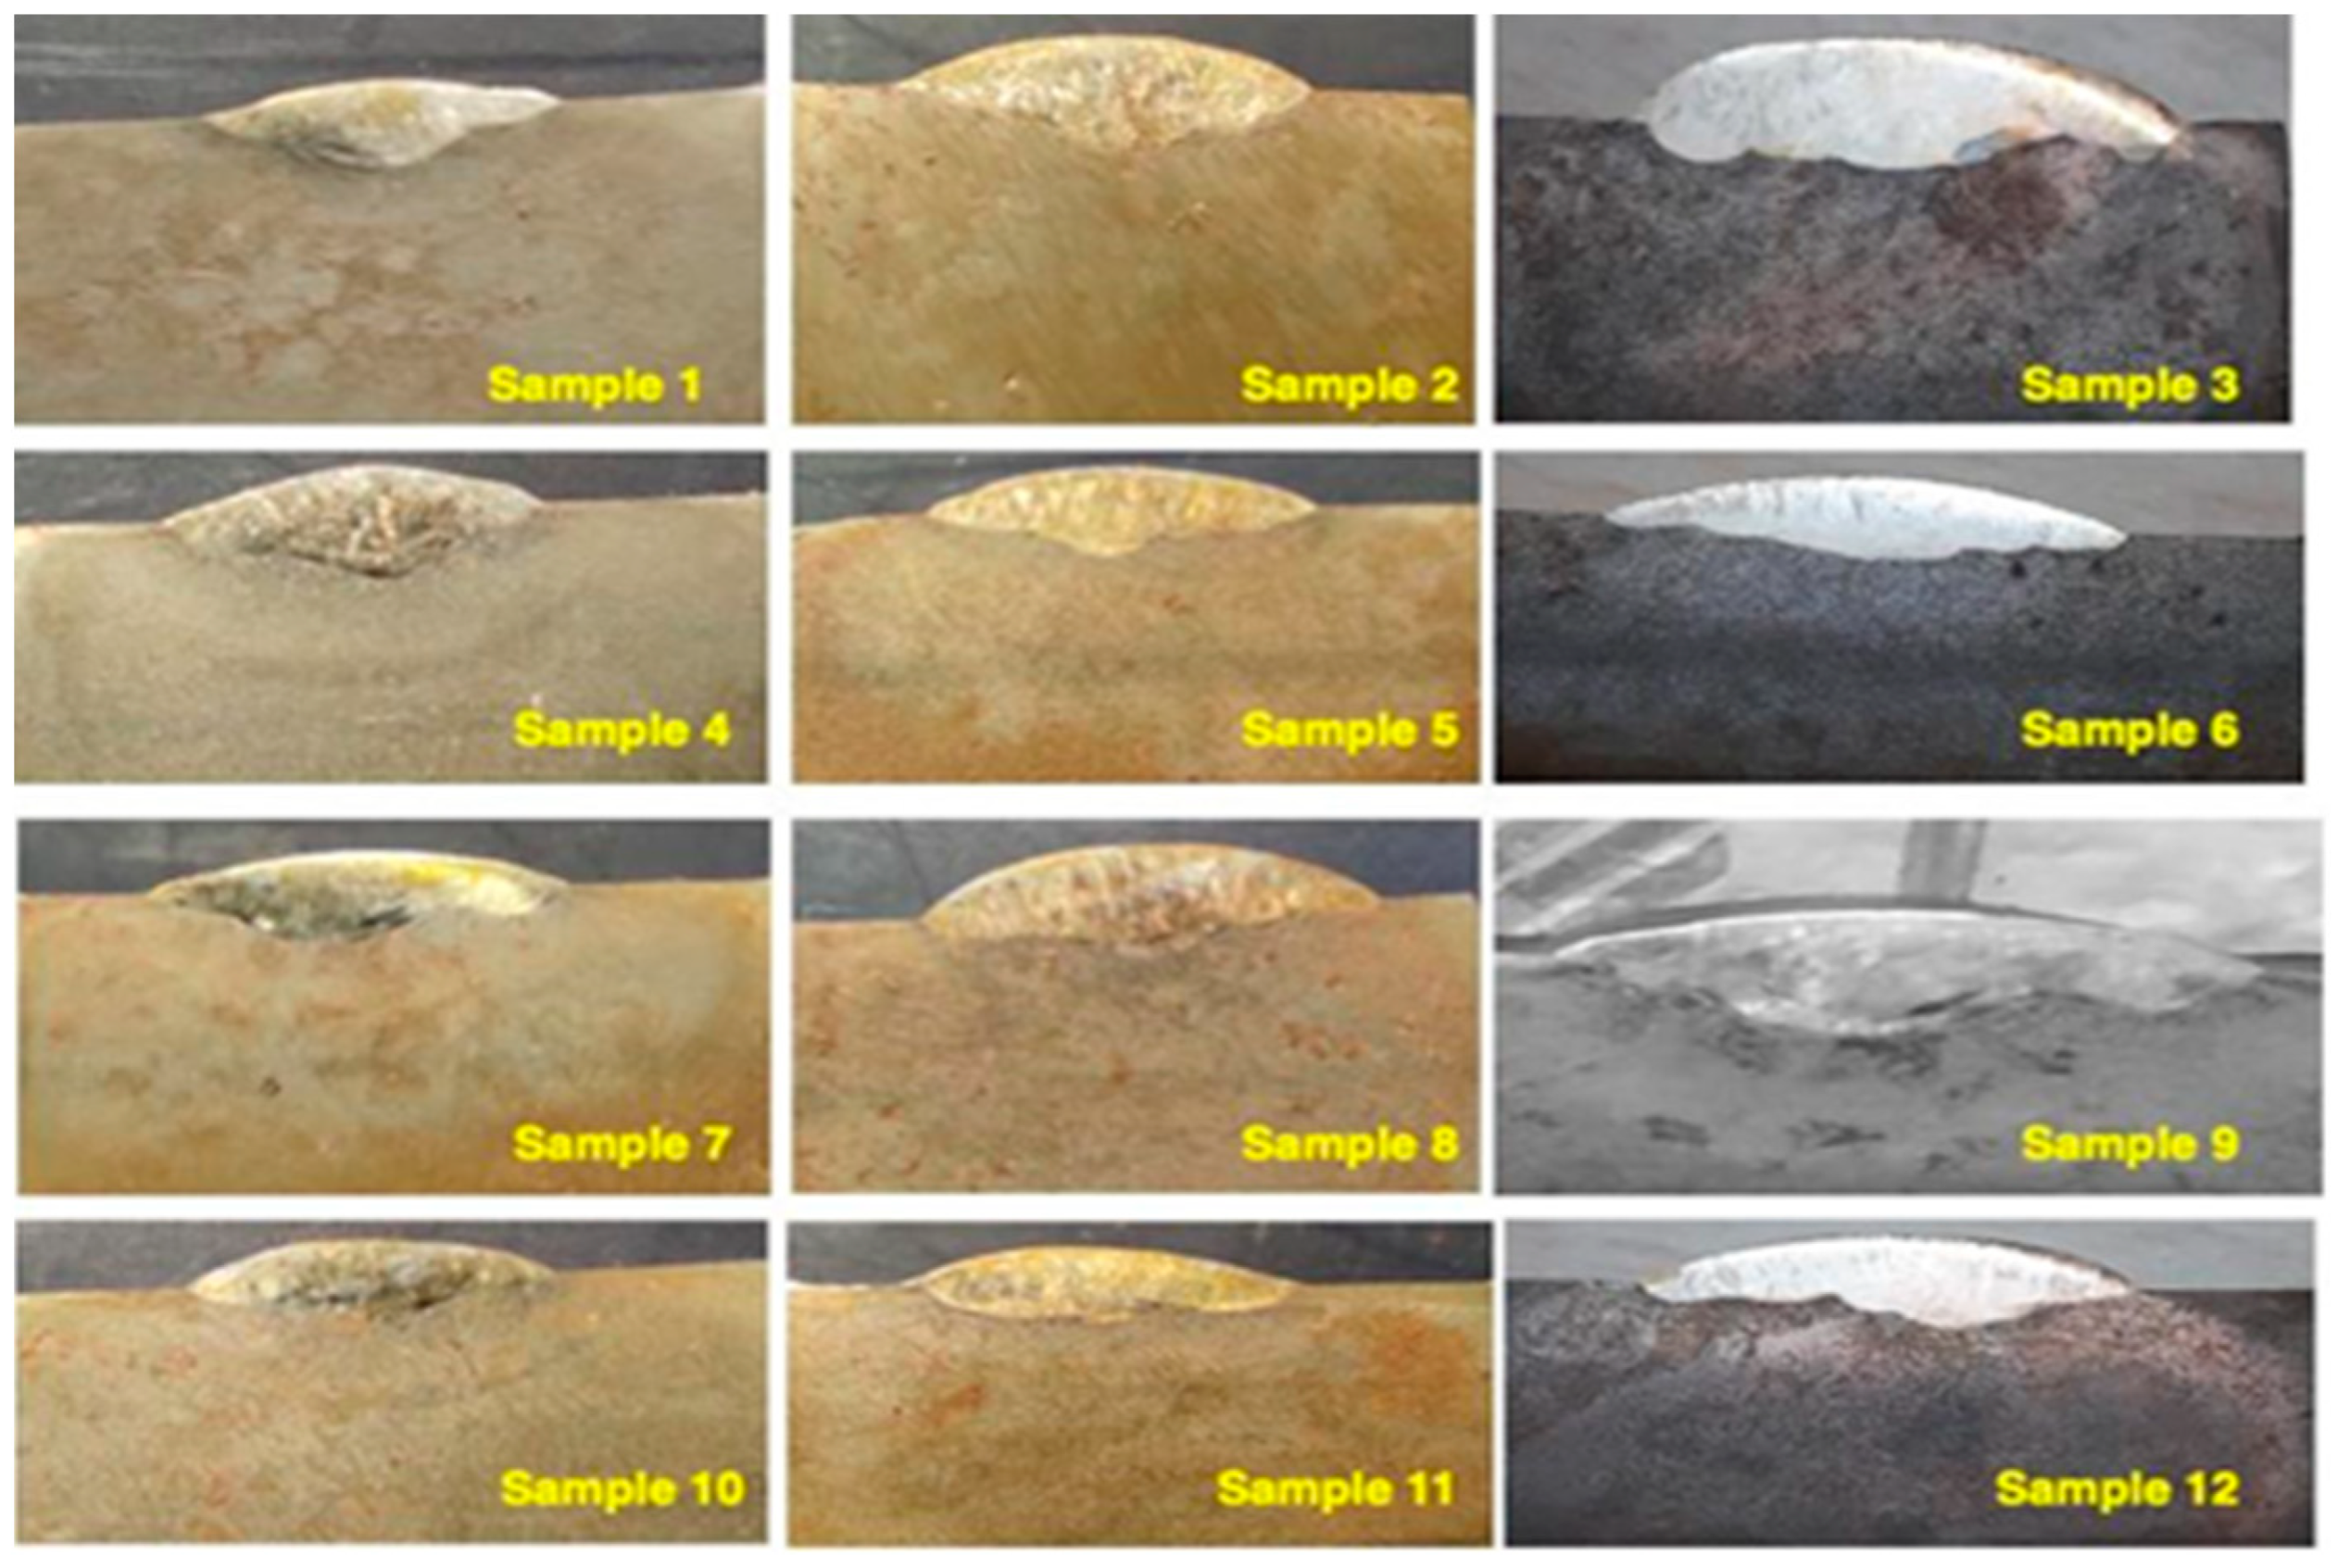
Digital macrographs of the polished surface of different cladded specimens were taken via image analyzer software, i.e., ImageJ (Fiji) software, as shown in Figure 10, and complete clads profiles were obtained. Dilution (D) for each specimen was calculated using Equation (1). The graphical representation of variation in the dilution with change in the current level and number of clad layers is shown in Figure 11. Dilution depends upon the clad penetration, width, and reinforcement. If the penetration is high compared to the width and reinforcement, dilution increases, and if the penetration is low compared to the width and reinforcement, dilution decreases. For cladding purposes, low dilution is required because low dilution due to the reinforcement as well as the width of the clad increases, resulting in a larger coverage area onto the substrate surface. Additionally, the effective constituents required in the clad layers retain themselves. For a single-layered clad, on increasing the current level, the deposition rate of filler wire increases, resulting in an increase in the clad reinforcement compared to the penetration level, so the value of dilution decreases, which is also shown in Figure 11. In the case of double layers of clads on increasing current level, dilution decreases, as the increment in the clad width as well as reinforcement is more due to simultaneous re-melting of the previously laid clad layer in addition to the new layer. In the case of triple-layered clads, on increasing current level, no significant change in dilution is noticed. It can be observed from Figure 11 that the dilution is almost constant at ~35%. This is because on increasing the current level, clad width increases more compared to that of reinforcement.

4.6. Optimization of the Dilution Result

Assuming a cubic relationship in the first instance and considering all the possible two-factor interactions and confounded interactions, it could be written as follows in Equation (2):
Y = b0 + b1A + b2B [1] + b3B [2] + b4AB [1] + b5AB [2] + b6A2 + b7A2B [1] +b8A2B [2] + b9A.
The factorial design of twelve experimentations is implemented via the software, Design-for-expert (DX 11) version 11, as well as a model illustrating the relationships between both the response Y (dilution) and the processing parameters (welding current and the clad layers B) for coded values of each processing parameters is developed. The variance analysis has been used to assess the appropriateness of the derived models’ validity and quality of fit (ANOVA). When all other factors are maintained constant, the coefficient estimate shows the expected change in reaction per unit change in factor value. The average response of all the runs is the interception in an orthogonal design. Depending on the factor values, the coefficients modify the average around it. When the factors are perpendicular, the VIFs are 1. Whenever the factors are multi-colinear, the VIFs are higher than 1. The greater the VIF, the more intense the correlation of the variables. VIFs under 10 are generally considered tolerable. The estimated coefficient is shown in Table 6.

4.6.1. Regression Equation of Dilution

It is possible to anticipate the reaction for specific levels of each element using the equation expressed in terms of coded factors. By definition, the factors’ high levels are recorded as +1 and their low levels as −1. By evaluating the factor coefficients from Equations (3)–(6), the coded equation is helpful in determining the relative impact of the components.
D = +44.65 − 5.60*A + 11.31*B [1] − 2.29*B [2] − 3.97*AB [1] − 0.2425*AB [2] + 0.4894*A2 − 2.29*A2B [1] + 2.26*A2B [2] + 2.15*A3
For a single layer, the relevant equation is expressed as follows:
D = −1574.24150 + 36.42282*Current − 0.266525*Current2 + 0.000638*Current3
For double layers, the relevant equation is expressed as follows:
D = 1253.26250 + 31.21742*Current − 0.246325*Current2 + 0.000638*Current3
For triple layers, the relevant equation is expressed as follows:
D = −1480.07600 + 34.18077*Current − 0.256200*Current2 + 0.000638*Current3

4.6.2. Effect of Current on Dilution

Variation in dilution with currents for single, double, and triple layers is shown in Figure 12. Moreover, the optimized input value for dilution must be determined.
To determine the optimized value from the input parameters, first decide the criteria for each input and output parameter which are as follows:
  • The current value should be in the range of 120 A–150 A;
  • Clad layers should be single, double, or triple;
  • The response, i.e., dilution, should be minimum.
After applying this condition in the software design-for-expert (DX11), the optimum results are shown in Table 7.
From the above solution, it is clear that, on 140.83 A current with 3 layers of the clad, the dilution is minimum, and it has maximum desirability.

4.7. Artificial Neural Network (ANN) for the Optimization of the Dilution

The dilution effect is now further analyzed with ANN. The design aspect of ANN is referred to in [20]. For the given system, the design of ANN has been considered via an extended Equation (2). This equation can be expressed as a general expression of ANN as shown in Equation (7).
Y = W 1 X 1 + W 2 X 2 + W 3 X 3 + W 4 X 4
This output will be checked with its reference value, which gives an error that is given in Equation (8).
E = ( Y Y ref ) 2 2
The error will update the new weight, as shown in Equation (9).
W new = W old η E W old
The structure and deployment of ANN for the estimation of dilution are shown in Figure 12.

4.8. Design and Development of Firefly Algorithm (FA) for the Optimization of the Dilution

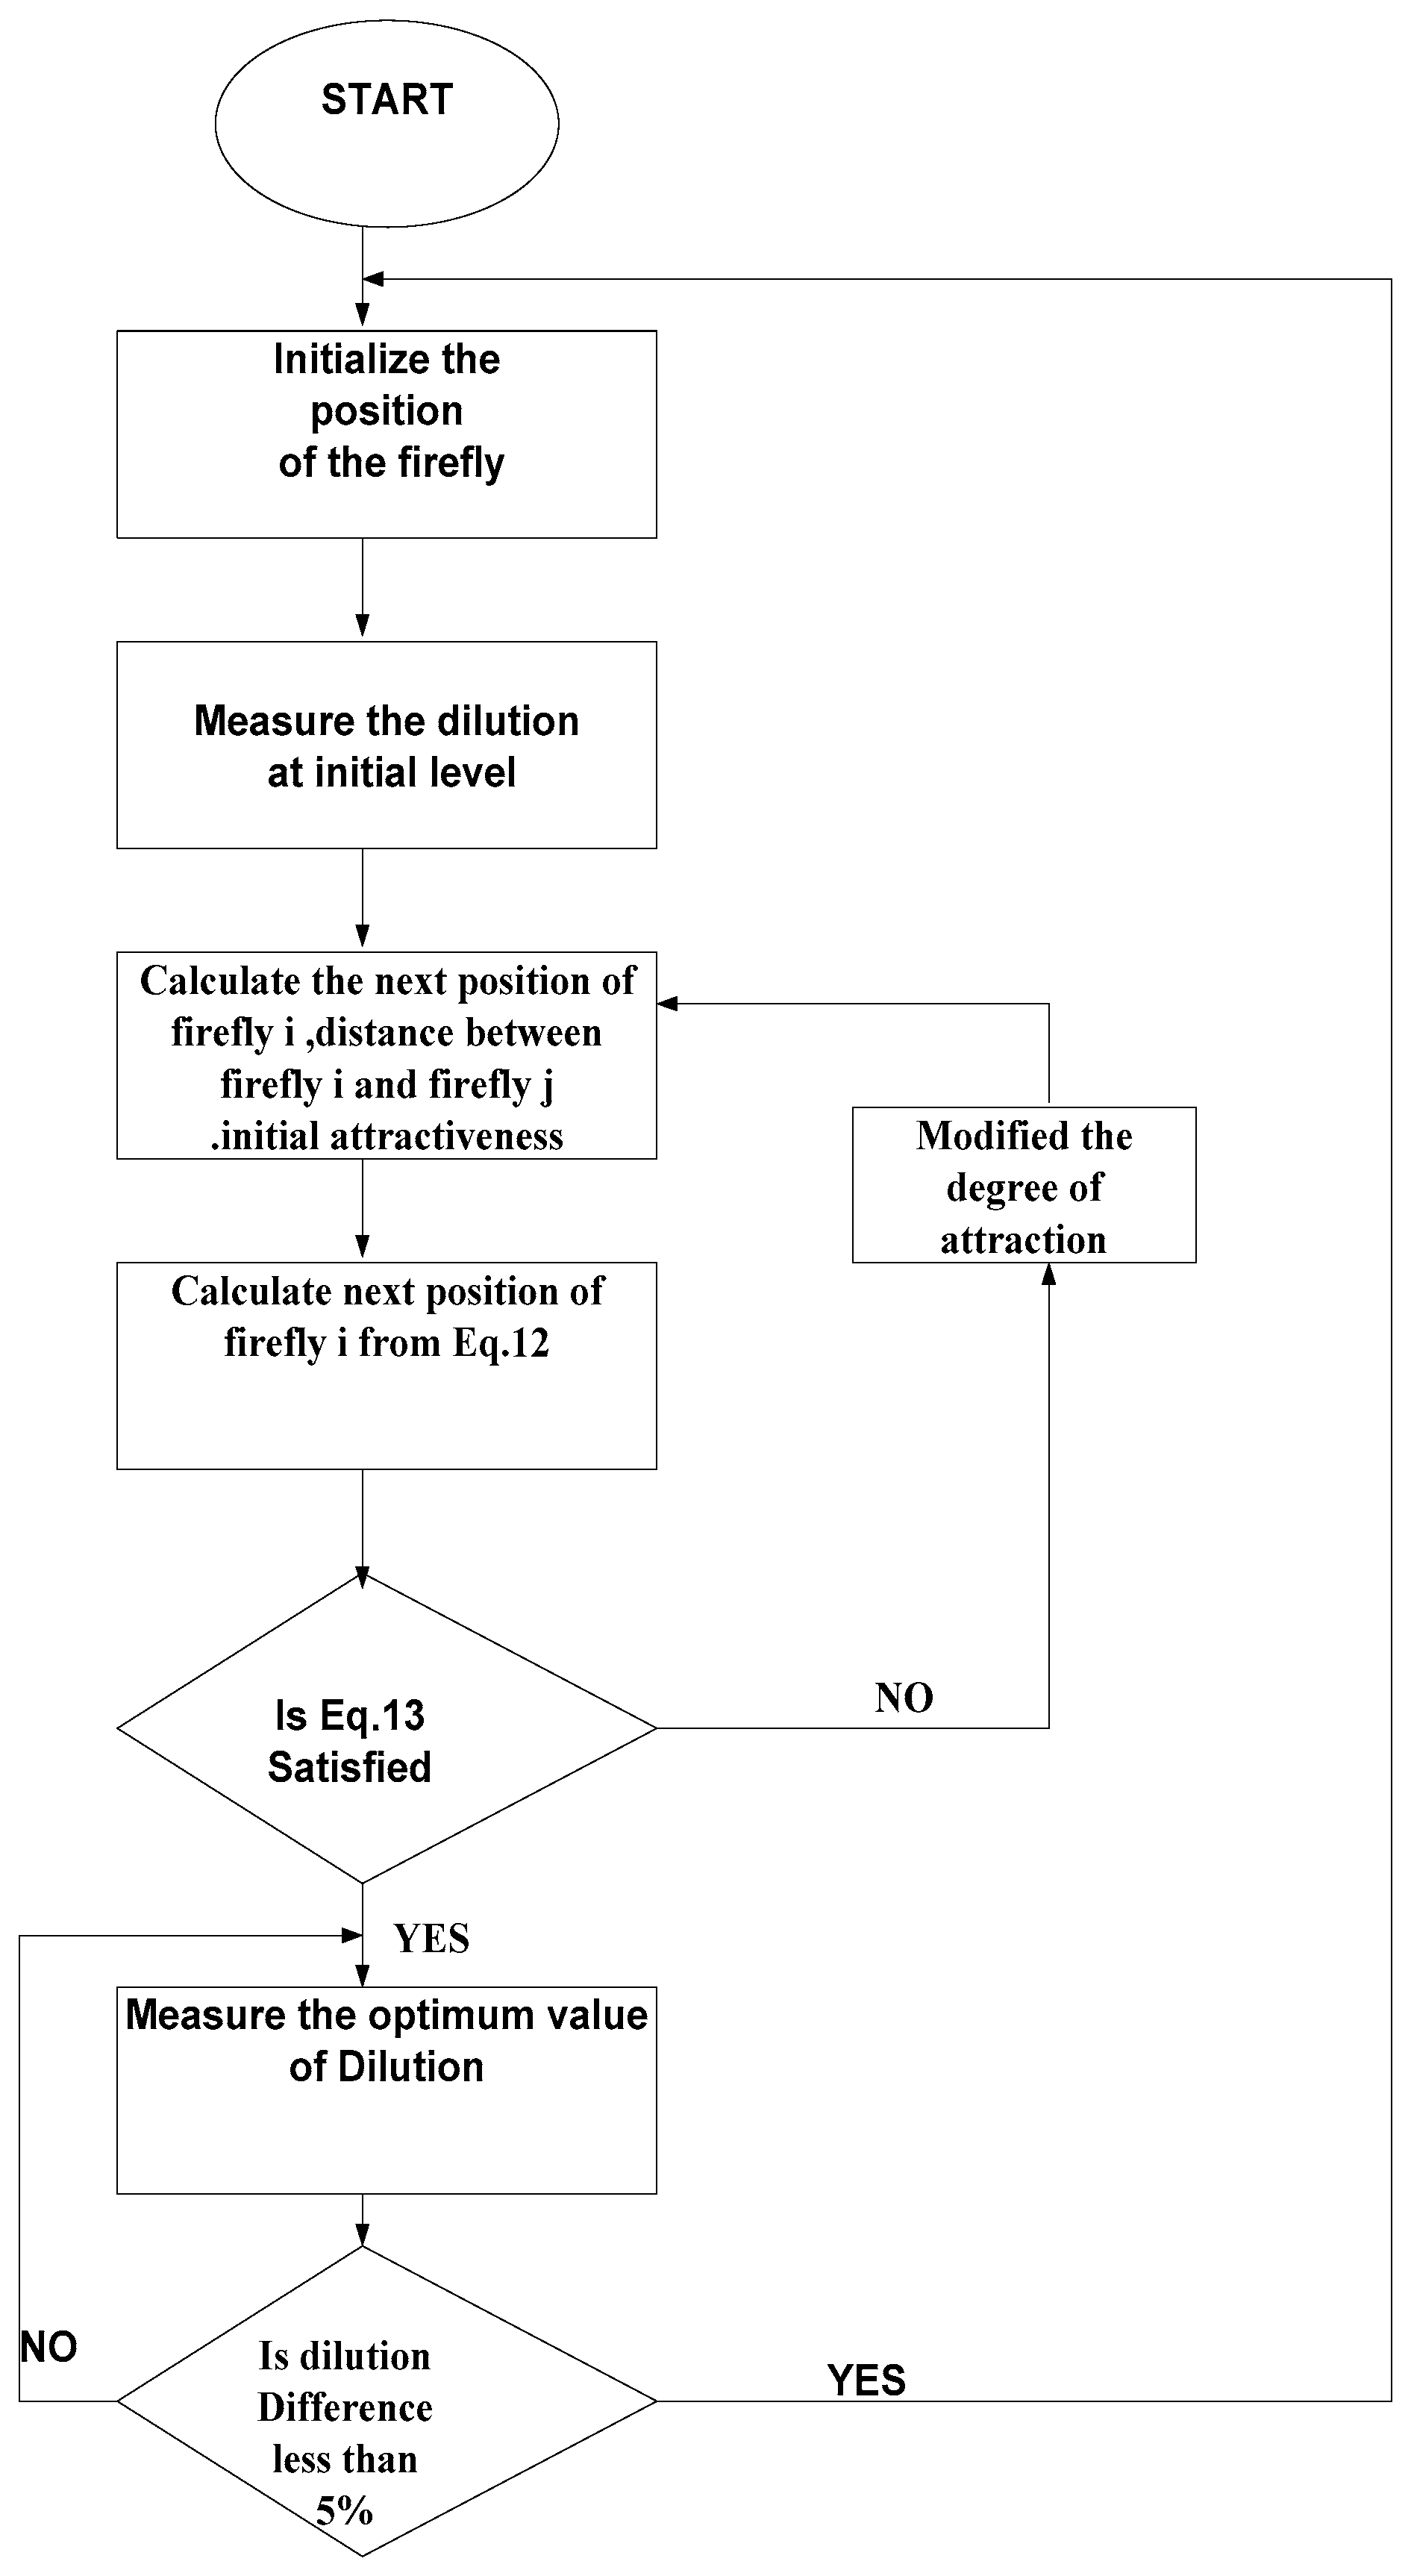
The process of the firefly algorithm [21] has been explained through a flowchart, as shown in Figure 13. In the beginning, fireflies are distributed uniformly from Y1 to Yn. Then, each firefly’s matching power at its various positions is gauged and noted. It is observed that fireflies are attracted to the nearby neighborhood of the best firefly. The general expression of the propagation of firefly i towards the brighter firefly j is given as the following Equations (10) and (11).
Y i t + 1 = Y i t + β Y ij + α ( ran - 0.5 )
β = β o e ( γ D ij ) 2
where Y i t and Y i t + 1 are the present and next position of firefly i. Y ij is the distance between firefly i and firefly j. α and ran denotes the coefficient and a random number of adjusting movements. β is the degree of attraction, and β o is the initial attractiveness. γ is the light absorption coefficient.
β o can also be expressed as follows:
β o = 2 1 + e ( 5 ( 1 Y i Y j ) ) 1 ,
where Yi and Yj show the power output of firefly i and firefly j. The movement of firefly i is attracted by brighter firefly j, which is given by Equation (12).
Y i t + 1 = Y i t + β Y ij
β is set to 0.25, which increases unity after every iteration to enhance the searching speed. The following convergence must be satisfied for the given algorithm, as shown in Equation (13).
Y i , max t Y i , min t < 5 %
The operating point with Yi, max is regarded as the algorithm’s estimated maximum practical precision as soon as convergence is verified, or the maximum number of iterations is reached.
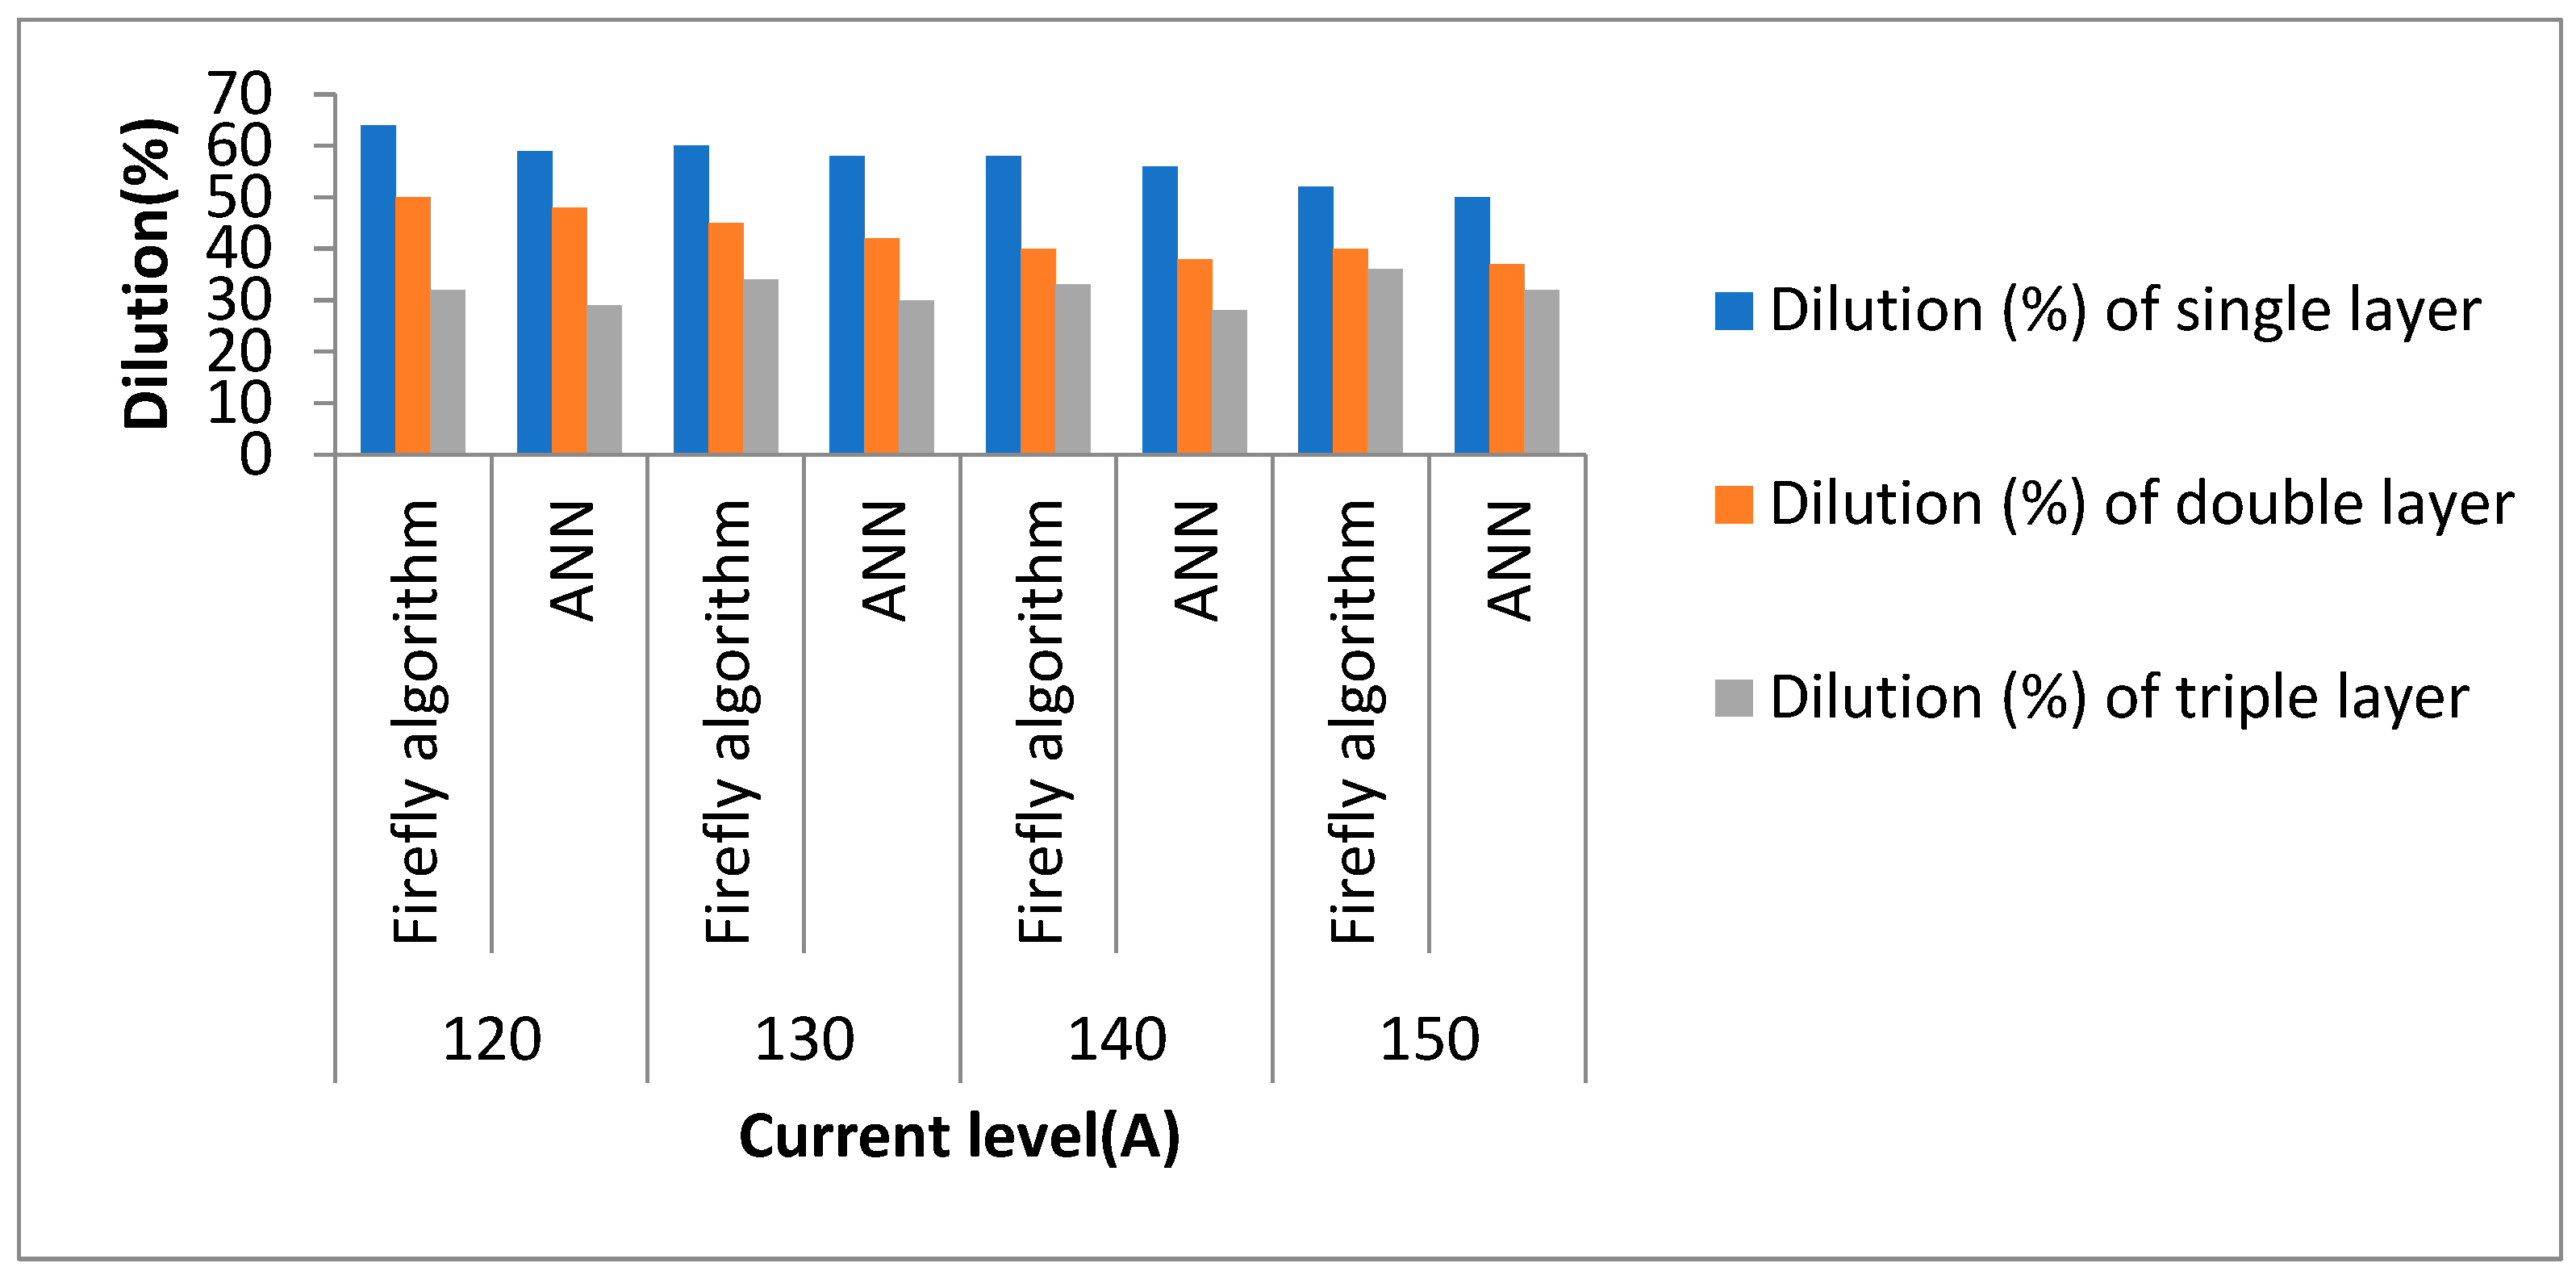
The comparison of dilution of various current levels for the firefly algorithm and ANN for the first, double, and third layers is shown in Figure 14.
In Figure 14, the best dilution level is achieved for the third layer in comparison to the first and second layers. It is observed that dilution (%) for single layer, double layers, and triple layers is found to be best with the firefly algorithm in comparison to ANN for various current levels.

5. Advanced Study and Analysis of Multivariable System

The three different studies are analyzed in the section which is explained in the following subsection.

5.1. Multivariable System Approach for Dilution Estimation

Let us discuss the four variables system which are represented in terms of voltage (V), current (I in Ampere), welding speed ( ω welding in mm/s), and thermal efficiency ( η thermal , efficiency ).
Basically, dilution is dependent on the heat input (J/mm).
Dilution (D) is also directly proportional to heat input (H), and its representation in the form of proportionality constant (K) is mentioned in Equation (14) as follows:
D = KH.
The heat input can be represented as Equation (15).
H = η thermal , efficiency VI ω welding
Input the value of H from Equation (15) into Equation (14), then Equation (16) is obtained as follows:
D = K η thermal , efficiency VI ω welding .
As can be seen, dilution depends on four parameters.
Let us analyze dilution with the firefly algorithm and ANN.
The process and design of the firefly algorithm are already explained in Section 4.8.
The design of ANN is also explained in Section 4.7. However, for the four variables, the design is a little bit different as follows:
Take the log on both sides in Equation (16), then Equation (17) is attained.
logD = logK + log η thermal , efficiency + log V + log I log ω welding
Equation (17) can be written as the general equation of ANN, mentioned in Equation (18) as follows:
Y = W 1 X 1 + W 2 X 2 + W 3 X 3 + W 4 X 4 + c ,
whereas
Y = logD , W 1 = log η thermal , efficiency , W 2 = logV , W 3 = logI , W 4 = log ω welding , c = logK
This output will be checked with its reference value, which gives an error given in Equation (19) as follows:
E = ( Y Y ref ) 2 2 .
The error will update the new weight, as shown in Equation (20).
W new = W old η E W old
The old and modified values of weights are given in Table 8.
After upgrading the weights, the dilution level has been improved considerably for the various current levels.
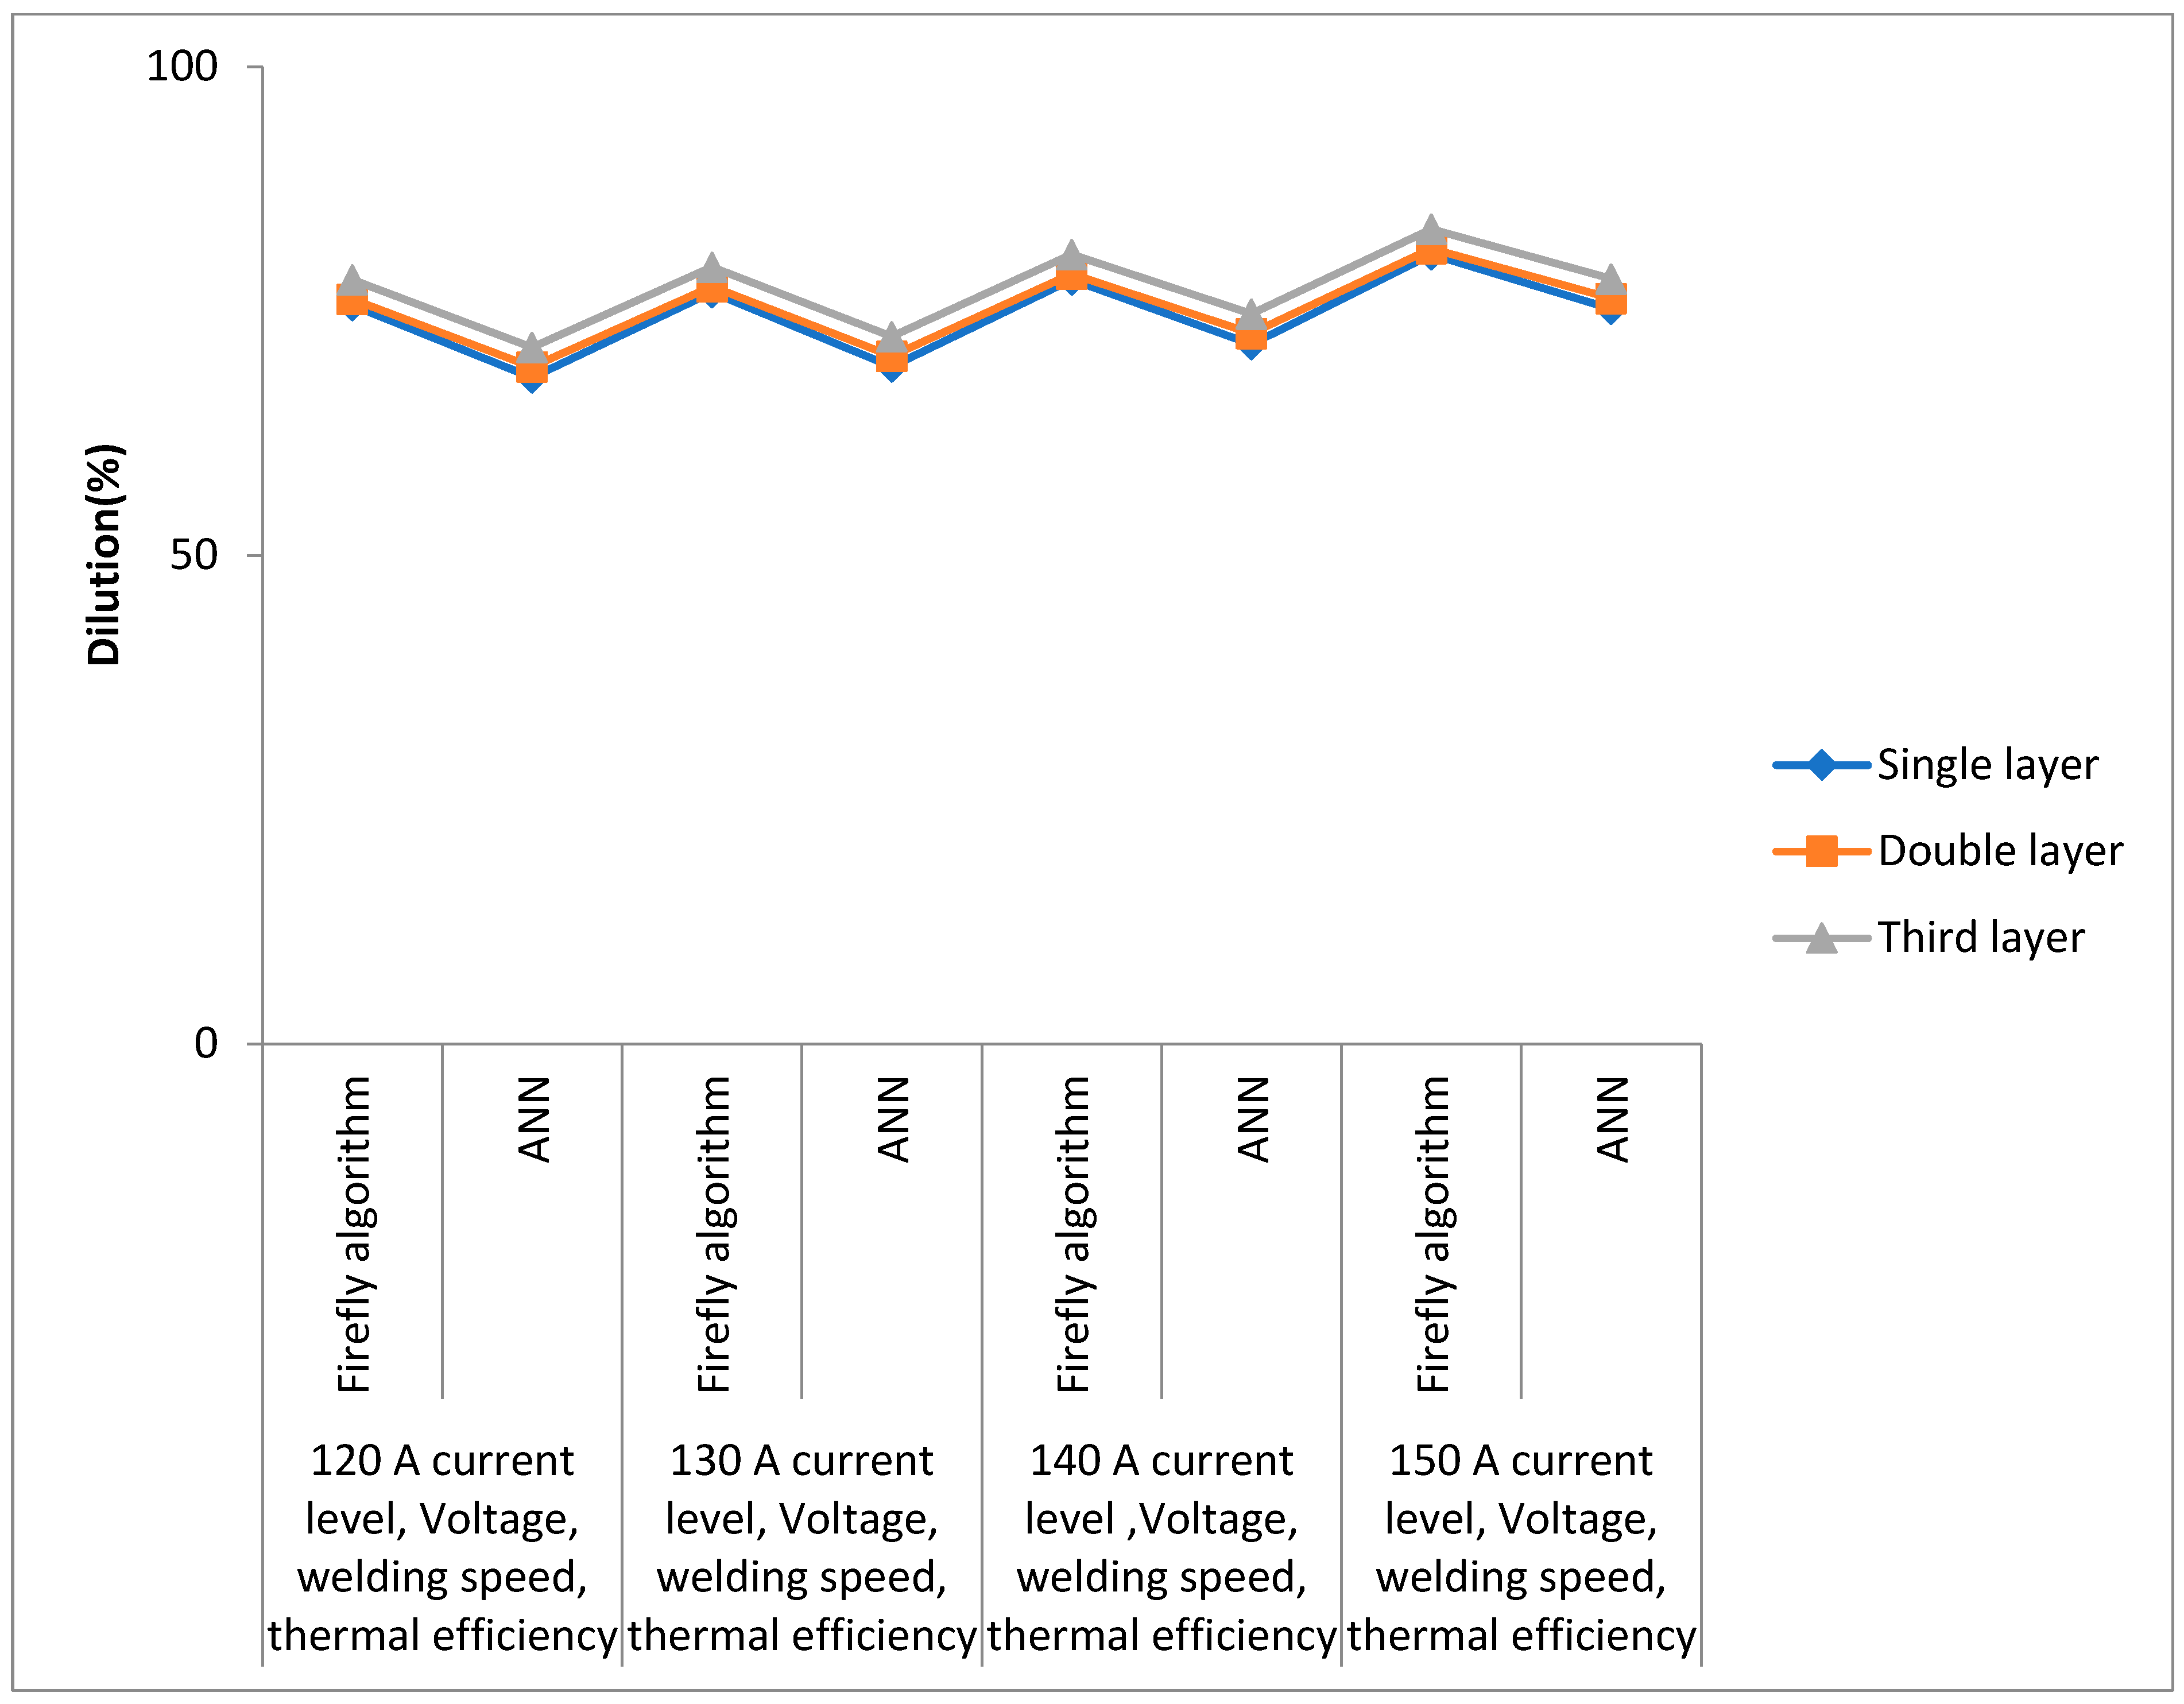
The performance level of dilution under various current levels, voltage, thermal efficiency, and welding speed with the firefly algorithm and ANN is shown in Table 9, and its graphical analysis is shown in Figure 15.
It is observed that dilution level has been improved a lot with the firefly algorithm in comparison to ANN for various current levels, voltage, welding speed, and thermal efficiency.
The experimental set consists of the following data:
Heat input = 0.9 J/mm with a deviation of 5%;
Thermal efficiency = 0.6 with a deviation of 3%;
Welding speed = 10 mm/s with a deviation of 2%.

5.2. Three Principles of Experimental Setup

Let us understand the three basic principles of the experimental design: randomization, replication, and blocking. It is required to analyze and elaborate on these principles in our experimental setup one by one.

5.2.1. Randomization

It is a random process of assigning the task to various units of the experimental setup. Every potential treatment allocation has an equal probability under the stochastic process, i.e., it is implied. There were 12 samples taken for experimental setup, as shown in Figure 10 of the manuscript.
Twelve samples are distinguished and independent of each other; furthermore, their names are given in Table 10.
It is observed from Table 10 that all the events or samples occur independently, but all 12 samples are tested 3 times in different possible ways, as shown in Table 11.
It can be seen from Table 11 that each sample is occurring thrice in various tests as follows: Sample 1 is occurring in Events 1, 5, and 4; Sample 2 is occurring in Events 2, 6, and 5; Sample 3 is occurring in Events 3, 11, and 6; Sample 4 is occurring in Events 4, 1, and 7; Sample 5 is occurring in Events 5, 2, and 12; Sample 6 is occurring in Events 6, 3, and 10; Sample 7 is occurring in Events 7, 4, and 11; Sample 8 is occurring in Events 8, 12, and 8; Sample 9 is occurring in Events 9, 10, and 3; Sample 10 is occurring in Events 10, 9, and 1; Sample 11 is occurring in Events 11, 7, 2; Sample 12 is occurring in Events 12, 8, 9.
The total number of elements is 12 × 3 = 36.
The probability of occurrence of each sample is 3/36.

5.2.2. Replication

It is the number of repetitions applied to each experimental sample unit and further comparison occurred among various sample values. It increases the precision value by reducing the standard error, Se.
The mathematical expression of standard error, Se, is given as s / r , where ‘r’ is the no. of replication (=3), and ‘s’ is the standard deviation.
The value of standard error is already calculated for 12 samples, which are shown in Table 6 and further shown separately in Table 12.

5.2.3. Blocking

It is used to restrict or block the unavoidable source of variation from the sample units. The blocking is carried out with the primary goal of improving the experimental design efficiency by lowering the experimental error.

5.3. Estimation of Variance

Let us perform the diagnostic and adequacy checking by estimating the variance of samples.
It is seen from the previous section that standard deviation (s) is given by multiplication of standard error ( S e ) and no. of replications (r), as shown in Equation (21).
s = S e r
The distribution of all the data points in an information set is taken into consideration by the variance, which is a measure of distribution. Along with the standard deviation, which is just the square root of the variance, it is the measure of spread that is most frequently employed. The relationship between variance (Var) and standard deviation (s) is given in Equation (22).
Var = s 2
Input the value of Equation (21) in Equation (22), then the final expression of variance is shown in Equation (23).
Var = ( S e r ) 2
The value of variance for various samples is shown in Table 13, and its graphical analysis is shown in Figure 16.

6. Conclusions

The GTA cladding of super duplex stainless steel over AISI 1020 steel was successfully completed. The study portrays the effect of the current level and clad layers on the microstructure, dilution, ferrite content, microhardness, and pitting corrosion/localized corrosion. Based on the results of this present work, the following conclusions were drawn:
The cladding of the super duplex stainless steel over mild steel improves the corrosive properties. The Ir/Ia% improves from 29% (mild steel) to 4.1% at the top and 11.9% at the intermediate layers;
The microhardness of the clad decreases with an increase in both the current level and the number of layers;
Microhardness varies between 191–248 at the clad, 170–189 at the HAZ, and 143–153 at the substrate for a 1 kgf load;
For a single-layered clad, on increasing the current level, the deposition rate of filler wire increases, resulting in an increase in the clad reinforcement compared to the penetration level, so the value of dilution decreases;
In the case of double layers of a clad, on increasing current level, dilution decreases due to the increment in clad width as well as reinforcement (simultaneous re-melting of the previously laid clad layer takes place in addition to the new layer deposit);
All triple layers possess almost the same dilution at different levels of current, but compared to a single layer and double layers, it was found to be minimum. Dilution reduces due to the re-melting of two successive layers in addition to the new layer deposit, which further reduces dilution;
Parametric optimization yields that a triple layer made at ~140 A shows minimum dilution (33.6%), optimum ferrite content (50.9%), optimum microhardness (195) maximum pitting corrosion/localized corrosion resistance, i.e., Ir/Ia% (4.1%).
Using the firefly algorithm (FA) and an artificial neural network, the dilution impact is also examined on three layers of different current levels (ANN). For different current levels, it is seen that dilution levels are more suitable to the experimental setup reading with FA than ANN.

Author Contributions

Conceptualization, M.M. and L.G.; methodology, A.S. and L.G.; software, A.K.S.; validation, A.S. and G.K.S.; formal analysis, M.M.; investigation, M.M. and L.G.; writing—original draft preparation, M.M. and L.G.; writing—review and editing, A.S., A.K.S. and H.S.H.; supervision, G.K.S. and J.K.B.; funding acquisition, R.V.; project administration, R.V. All authors have read and agreed to the published version of the manuscript.

Funding

The authors extend their appreciation to the Deanship of Scientific Research at King Khalid University for funding this work through a Large Group Research Project under grant number: RGP 2/177/44.

Institutional Review Board Statement

Not applicable.

Informed Consent Statement

Not applicable.

Data Availability Statement

Not applicable.

Conflicts of Interest

The authors declare no conflict of interest.

References

  1. Kahar, S.D. Review on electro-slag strip cladded weld overlays. Int. J. Adv. Eng. Res. Dev. 2016, 3, 1–8. [Google Scholar]
  2. Paschold, R.; Karlsson, L.; Gittos, M.F. Disbonding of austenitic weld overlays in hydroprocessing applications. ESAB Svetsaren 2007, 62, 10–15. [Google Scholar]
  3. Bhatt, R.B.; Kamat, H.S.; Ghosal, S.K.; De, P.K. Influence of nitrogen in the shielding gas on corrosion resistance of duplex stainless steel welds. ASM J. Mater. Eng. Perform. 1999, 8, 591–597. [Google Scholar] [CrossRef]
  4. Murugan, N.; Parmar, R.S. Mathematical models for bead geometry prediction in automatic stainless steel surfacing by MIG welding. Int. J. Join. Mater. 1995, 7, 71–80. [Google Scholar]
  5. de Lima-Neto, P.; Farias, J.P.; Herculano, L.F.G.; de Miranda, H.C.; Araújo, W.S.; Jorcin, J.B.; Pébère, N. Determination of the sensitized zone extension in welded AISI 304 stainless steel using non-destructive electrochemical techniques. Corros. Sci. 2008, 50, 1149–1155. [Google Scholar] [CrossRef]
  6. Paschold, R.; Karlsson, L. Electroslag strip cladding for corrosion resistance. ESAB Svetsaren 2001, 56, 62–67. [Google Scholar]
  7. Koch, G.H.; Brongers, M.P.; Thompson, N.G.; Virmani, Y.P.; Payer, J.H. Corrosion Cost and Preventive Strategies in the United States; National Academy of Sciences, USA (No. FHWA-RD-01-156); Federal Highway Administration: Washington, DC, USA, 2002.
  8. Singh, B.; Basak, M.; West, M.; Guha, I. Estimating the cost of corrosion in Indian industry. In Proceedings of the PETROTECH-2010, New Delhi, India, 31 October–3 November 2010; Available online: http://hdl.handle.net/20.500.11937/18048 (accessed on 4 January 2023).
  9. Parmar, R.S. Welding Process and Technology; Khanna Publisher: New Delhi, India, 2003. [Google Scholar]
  10. Srinath, K. Investigation on 410 L Stainless Steel Cladding of Mild Steel Valve Seat Rings by Plasma Transferred Arc Welding. Ph.D. Thesis, Anna University Chennai, Chennai, India, 2012. [Google Scholar]
  11. Liu, Y.; Ding, Y.; Yang, L.; Sun, R.; Zhang, T.B.; Yang, X. Research and progress of laser cladding on engineering alloys: A review. J. Manuf. Process. 2021, 66, 341–363. [Google Scholar] [CrossRef]
  12. Lucas, W. Arc surfacing and cladding processes to enhance performance in service and to repair worn components. Weld. Metal Fabr. 1994, 62, 55–61. [Google Scholar]
  13. Keskitalo, M.; Mäntyjärvi, K.; Sundqvist, J.; Powell, J.; Kaplan, A.F.H. Laser welding of duplex stainless steel with nitrogen as shielding gas. J. Mater. Process. Technol. 2015, 216, 381–384. [Google Scholar] [CrossRef]
  14. Aval, H.J.; Farzadi, A.; Serajzadeh, S.; Kokabi, A.H. Theoretical and experimental study of microstructures and weld pool geometry during GTAW of 304 stainless steel. Int. J. Adv. Manuf. Technol. 2009, 42, 1043–1051. [Google Scholar] [CrossRef]
  15. Arivazhagan, B.; Srinivasan, G.; Albert, S.; Bhaduri, A. A study on influence of heat input variation on microstructure of reduced activation ferritic martensitic steel weld metal produced by GTAW process. Fusion Eng. Des. 2011, 86, 192–197. [Google Scholar] [CrossRef]
  16. Elsawy, A.H. Characterization of the GTAW fusion line phases for super ferritic stainless steel weldments. J. Mater. Process. Technol. 2001, 118, 127–131. [Google Scholar] [CrossRef]
  17. Ghanty, P.; Paul, S.; Mukherjee, D.P.; Vasudevan, M.; Pal, N.R.; Bhaduri, A.K. Modelling weld bead geometry using neural networks for GTAW of austenitic stainless steel. Sci. Technol. Weld. Join. 2007, 12, 649–658. [Google Scholar] [CrossRef]
  18. Ogawa, T.; Aoki, S.; Sakamoto, T.; Zaizen, T. Weldability of Nitrogen-Containing Austenitic Stainless Steel: Part I. Chloride Pitting Corrosion Resistance. WELDING J. 1982, 61, 139–148. [Google Scholar]
  19. Baeslack, W.A., III; Duquette, D.J.; Savage, W.F. The effect of ferrite content on stress corrosion cracking in duplex stainless steel weld metals at room temperature. Corrosion 1979, 35, 45–54. [Google Scholar] [CrossRef]
  20. Saxena, A.; Kumar, R.; Singh, J.; Singh, G.K.; Kumar, V.S.; Pandey, J.P. An Invasive Weed Optimization for Sensor Less Control of Grid Integrated Wind Driven Doubly Fed Induction Generator. IEEE Access 2022, 10, 109082–109096. [Google Scholar] [CrossRef]
  21. Huang, Y.P.; Huang, M.Y.; Ye, C.E. A Fusion Firefly Algorithm with Simplified Propagation for Photovoltaic MPPT Under Partial Shading Conditions. IEEE Trans. Sustain. Energy 2020, 11, 2641–2652. [Google Scholar] [CrossRef]
  22. Torres, A.F.; Rocha, F.B.; Almeida, F.A.; Gomes, J.H.; Paiva, A.P.; Balestrassi, P.P. Multivariate Stochastic Optimization Approach Applied in a Flux-Cored Arc Welding Process. IEEE Access 2020, 8, 61267–61276. [Google Scholar] [CrossRef]
Figure 1. Cladded plate.
Coatings 13 00841 g001
Figure 2. Cladded plate view.
Coatings 13 00841 g002
Figure 3. The DLEPR curve of clad layer.
Coatings 13 00841 g003
Figure 4. The DLEPR curve of intermediate clad layer.
Coatings 13 00841 g004
Figure 5. The DLEPR curve of base metal.
Coatings 13 00841 g005
Figure 6. Hardness in different zones.
Coatings 13 00841 g006
Figure 7. Microhardness test results at the clad, heat-affected zone, and base metal.
Coatings 13 00841 g007
Figure 8. Microstructure of samples: (a) at 120 A, single layer; (b) at 120 A, double layers; (c) at 120 A, triple layers; (d) at 130 A, single layer; (e) at 130 A, double layers; (f) at 130 A, triple layers; (g) at 140 A, single layer; (h) at 140 A, double layers; (i) at 140 A, triple layers; (j) at 150 A, single layer; (k) at 150 A, double layers; (l) at 150 A, triple layers.
Coatings 13 00841 g008aCoatings 13 00841 g008b
Figure 9. Ferrite content analysis for 12 samples of various current levels.
Coatings 13 00841 g009
Figure 10. Macrographs of typical transverse clad sections.
Coatings 13 00841 g010
Figure 11. Variation in dilution with current for a single layer, double layers, and triple layers.
Coatings 13 00841 g011
Figure 12. Structure of ANN view.
Coatings 13 00841 g012
Figure 13. Flowchart illustrating the firefly algorithm.
Coatings 13 00841 g013
Figure 14. Comparison of the variation of dilution of single layer, double layers, and triple layers of various current levels via firefly algorithm and ANN.
Coatings 13 00841 g014
Figure 15. Comparison of dilution at various current levels, voltage, welding speed, and thermal efficiency with firefly algorithm and ANN.
Coatings 13 00841 g015
Figure 16. Pattern of variance for various samples.
Coatings 13 00841 g016
Table 1. Parameters with their level and units.
SymbolNameUnitTypeLevelsL1L2L3L4
A
(Numeric)
CurrentADiscrete4120130140150
B
(Categoric)
Layer Nominal3SingleDoubleTriple
Table 2. Design matrix table.
S. NoCurrentLayer
1120Single
2120Double
3120Triple
4130Single
5130Double
6130Triple
7140Single
8140Double
9140Triple
10150Single
11150Double
12150Triple
Table 3. Chemical composition (wt.%) of base material.
MaterialElement (% wt)
C
(%)
Si
(%)
Mn
(%)
P
(%)
S
(%)
Cr
(%)
Ni
(%)
Mo
(%)
Cu
(%)
Substrate
(AISI 1020)
0.1960.2931.120.00410.0110.1280.0340.027
Filler Wire
(S32950)
0.0260.460.740.0210.01023.168.402.740.36
Table 4. GTA cladding parameters.
Shielding GasPure (99.99%) Argon
Shielding gas flow rate10 L·min−1
Filler rod diameter2.4 mm
Non-consumable tungsten electrodeAWS EWTH-2 (98% W + 2% Th)
Filler wire diameter2.4 mm
PolarityElectrode negative (EN)
Arc voltage (V)15 V
Heat input0.94 kJ·mm−1
Material thickness12 mm
Table 5. Ir/Ia values of DLEPR pitting corrosion test.
S.No.Testing ZoneIaIrIr/Ia (%)
1Top clad layer1.56 × 10−2 (A/cm2)6.44 × 10−4 (A/cm2)4.1
2Intermediate clad layer1.89 × 10−2 (A/cm2)2.25 × 10−3 (A/cm2)11.9
3Base metal
(AISI 1020 steel)
0.54 mA0.16 mA29.6
Table 6. The estimated coefficient.
TermCoefficient EstimateDFStandard Error95% CI Low95% CI HighVIF
Intercept 44.6511.1839.5849.71
A
Current
−5.6013.51−20.729.5212.67
B [1]11.3111.674.1518.48
B [2]−2.2911.67−9.464.87
AB [1]−3.9711.40−9.982.03
AB [2]−0.242511.40−6.255.76
A20.489411.66−6.637.611.0000
A2B [1]−2.2912.34−12.367.78
A2B [2]2.2612.34−7.8212.33
A32.1513.70−13.7718.0812.67
Table 7. Optimized results.
NumberCurrentLayerDilutionDesirability
1140.830Triple35.2890.941Selected
2140.935Triple35.2890.941
3140.456Triple35.2910.941
4120.000Triple35.3760.938
5144.246Double40.3020.765
6144.061Double40.3030.765
7150.000Single46.7430.540
Table 8. Old and modified values of weights.
S.NoWoldValueWnewValue
1W17.8W18.5
2W28.2W29.4
3W39.1W39.6
4W48.9W49.7
Table 9. Dilution at various current levels, voltage, welding speed, and thermal efficiency with firefly algorithm and ANN.
Dilution (%)120 A Current Level, Voltage, Welding Speed, Thermal Efficiency130 A Current Level, Voltage, Welding Speed, Thermal Efficiency140 A Current Level, Voltage, Welding Speed, Thermal Efficiency150 A Current Level, Voltage, Welding Speed, Thermal Efficiency
Firefly AlgorithmANNFirefly AlgorithmANNFirefly AlgorithmANNFirefly AlgorithmANN
Single layer75.668.276.969.378.271.680.875.2
Double layer76.269.377.570.478.872.781.476.3
Third layer78.271.379.572.480.874.783.478.3
Table 10. Naming and labeling of 12 samples.
SamplesLabeling
Sample 1A
Sample 2B [1]
Sample 3B [2]
Sample 4AB [1]
Sample 5AB [2]
Sample 6A2
Sample 7A2B [1]
Sample 8A2B [2]
Sample 9A3
Sample 10A
Sample 11B [1]
Sample 12B [2]
Table 11. A total of 36 possible combinations of occurrence of 12 samples.
EventsTest 1Test 2Test 3
1Sample 1Sample 4Sample 10
2Sample 2Sample 5Sample 11
3Sample 3Sample 6Sample 9
4Sample 4Sample 7Sample 1
5Sample 5Sample 1Sample 2
6Sample 6Sample 2Sample 3
7Sample 7Sample 11Sample 4
8Sample 8Sample 12Sample 8
9Sample 9Sample 10Sample 12
10Sample 10Sample 9Sample 6
11Sample 11Sample 3Sample 7
12Sample 12Sample 8Sample 5
Table 12. Value of standard error of 12 samples.
Samples Standard   Error   ( S e )
Sample 11.18
Sample 23.51
Sample 31.67
Sample 41.67
Sample 51.40
Sample 61.40
Sample 71.66
Sample 82.34
Sample 92.34
Sample 103.70
Sample 111.67
Sample 121.67
Table 13. Value of standard error of 12 samples.
SamplesVariance (Var)
Sample 14.18
Sample 236.96
Sample 38.37
Sample 48.37
Sample 55.88
Sample 65.88
Sample 78.27
Sample 816.43
Sample 916.43
Sample 1041.07
Sample 118.37
Sample 128.37
Disclaimer/Publisher’s Note: The statements, opinions and data contained in all publications are solely those of the individual author(s) and contributor(s) and not of MDPI and/or the editor(s). MDPI and/or the editor(s) disclaim responsibility for any injury to people or property resulting from any ideas, methods, instructions or products referred to in the content.