Article

Time-Dependent Passivation Performance of Plasma Sprayed FeCrMoCBY Amorphous Coating

1
Faculty of Mechanical and Material Engineering, Huaiyin Institute of Technology, Huai’an 223003, China
2
College of Mechanics and Materials, Hohai University, Nanjing 211100, China
*
Author to whom correspondence should be addressed.
Coatings 2023, 13(5), 894; https://doi.org/10.3390/coatings13050894
Submission received: 16 April 2023 / Revised: 2 May 2023 / Accepted: 5 May 2023 / Published: 9 May 2023

Abstract

:
The relationship between passive film growth behavior and passivation time for plasma-sprayed Fe48Cr15Mo14C15B6Y2 amorphous coating in borate buffer solution has been thoroughly studied. The morphological characteristic and structural feature of as-spayed amorphous coating were estimated by scanning electron spectroscopy (SEM), X-ray diffraction (XRD) and transmission electron spectroscopy (TEM). The influence of passivation time on the film evolution properties was measured by electrochemical impedance spectra (EIS), Mott–Schottky curves, atomic force microscope (AFM) and X-ray photoelectron spectroscopy (XPS). The results revealed that both corrosion resistance and self-repairing capacity of passive film greatly increased with time based on high electric field assumption. Reductions in donor density and flat band potential were accountable for a lower conductivity of passive film. An increment in Cr2O3 oxide as the inner barrier layer derived from the dehydration reaction of Cr(OH)3 contributed to the gradually densified structure of passive film. The extracted passive film thickness d increment with passivation time t conformed to the logarithm law on the basis of effective capacitance hypothesis: d = 0.43 l n t + 52.06 2.18 (nm). Passivation mechanism within 600 s was ascribed to the adsorption of mechanical mixtures between metal ions and electrolytes, possibly leading to mechanical stress and rupture of passive film in the later growth procedure. The cation vacancy condensation process at the interface of coating/film was propitious in stabilizing the growth rate of passive film.

1. Introduction

Fe-based amorphous coatings developed by the thermal spraying technique, as one kind of engineering- or military-used component, have been extensively explored. These outstanding properties derive from amorphous instincts, including lack of grain boundaries, dislocations and twins [1,2], which inherits from amorphous raw powders. A range of Fe-based amorphous coatings have been designed to be highly radiation-resistant using high oxygen fuel spraying (HVOF) by Defense Advanced Research Projects Agency (DARPA) [3]. The companies A&A Coatings and Nanosteel have prepared a series of FeCrBSi-based powder core wires for arc spraying to be applied in cars, spacecraft, aircraft, etc. [4]. Additionally, it is feasible to spray FeCrMoWBCSiMn amorphous coating on the surface of boiler tubes specially designed by Nanosteel [5]. Recently, progress has been demonstrated in the prospective application domains of nonskid Fe-based amorphous coatings with a texture feature for aircraft carrier decks [4] as more promising materials for more supply chains. Among thermal spraying techniques, plasma spraying with an extremely high solidification rate of over 106 K·s−1 can inherit the amorphous nature of feedstock and it is highly efficient and cost-effective to produce Fe-based amorphous coatings with processing simplicity and flexibility [6,7,8].
Resistance to different sorts of corrosive mediums of Fe-based amorphous coatings is perceptibly impacted by several factors. It is noted that these coatings are thermodynamically unstable and thus can possibly generate comprehensive crystal corrosion products, such as α-Fe, Fe2B and FeCr2O4 [9,10,11], during corrosion immersion tests, along with a galvanic effect between amorphous coatings and corroded products. Generally, Cr, P and Mo as strong corrosion-resistant elements [12,13] are required to be added in view of the principles of amorphous alloy design. Additionally, enrichments of Co, Ni, Pt and Pd as noble metal elements can diminish the rapid dissolution rate of the anode and boost the cathodic reaction. Porosity is another vital structural factor that impacts the corrosion capacities of Fe-based amorphous coatings. It is a well-known fact that coating porosity is positively proportional to pores, oxide stringers and intersplats [14]. By facilitating electrolyte penetration, these flaws can eventually lead to corrosion failure of metal substrates due to corrosion. Moreover, localized corrosion triggered around the periphery of microstructural defects is closely associated with Cr- or Mo-depleted zones [15]. Consequently, the passive film of the coatings is inclined to be susceptible to high dissolution and becoming volatile.
Passive film growth relies on passivation time heavily based on studies regarding the passivation behavior of Fe-Cr based alloys [15,16,17,18,19,20]. As time goes on, passive film can grow constantly in corrosive mediums and ultimately reach a stable state. In comparison with chloride-containing medium, pH-adjusted borate buffer solution has been the preferential growth environment for a better estimation of the film traits of conventional Fe-Cr-based alloys. In general, with the addition of chloride, an active dissolved state of passive film with pitting initiation is usually observed and passive film undergoes more instability. Moreover, more FeOOH is released as the corrosion products are possibly dissolved into the chloride-containing solution, leading to a distinct increase in pH [18]. In contrast, borate buffer solution favors the stabilization of the pH of the growth environment and more accurate measured EIS data enable an unfluctuating growth tendency of passive film [20].
However, little is reported about the time-dependent passivation characteristics of Fe-based amorphous coatings, including passive film thickness, compositional analysis and semiconducting property changes. This work intends to contribute to fundamental research on the passivation trait of Fe-based amorphous coatings. Fe48Cr15Mo14C15B6Y2 amorphous coating was intensively manufactured by plasma spraying, and the time-dependent passivation peculiarity of the coating, which emerged in borate buffer solution, was detected within 7200 s. In particular, a thorough grasp of the passivation mechanism pertinent to the passivation time was covered comprehensively. This work can provide theoretical guidance for investigation of self-repairing performance, growth model and passivation mechanism involving the vacancies transportation process of passive films generated on the surface of Fe-based amorphous coatings.

2. Experimental

2.1. Raw Materials and Coating Production

A master ingot with a nominal composition of Fe48Cr15Mo14C15B6Y2 (at.%) was prepared from a mixture of pure Fe (99.9 wt.%), Cr (99.9 wt.%), Mo (99.9 wt.%), C (99.9 wt.%), Y (99.9 wt.%) and pre-alloyed Fe-B (B: 20.6 wt.%) ingots through the vacuum arc melting method. Then gas atomization was conducted by vacuum induction melting under a flow of high-purity argon (99.9%) at high pressure to obtain high spherical Fe48Cr15Mo14C15B6Y2 (at.%) amorphous powder (produced by Beijing ZJLG Amorphous Technology CO., Ltd., Beijing, China). A powder with the same composition, exhibiting a homogeneous particle distribution ranging from 40–130 μm with an average particle diameter of 73.2 ± 15.7 μm as illustrated in Figure 1, was sieved for plasma spraying due to its strong glass formation ability (GFA) and excellent corrosion resilience [21]. These data imply that the amorphous powder possesses a good fluidity for plasma spraying. Q235 stainless steel (60 × 20 × 8 mm3) was applied to be the metal substrate and ultrasonically cleaned with acetone for rust removal and degreasing. Subsequently, the substrate surface was sandblasted with corundum (46#) to achieve a certain roughness. All the amorphous coatings were deposited with PARAIRX 3710-type plasma spraying machinery. Table 1 summarizes the details of the spraying parameters.

2.2. Microstructure Analysis

Scanning electron microscopy (SEM, S-3400 N, Hitachi, Tokyo, Japan) equipped with energy-dispersive spectroscopy (EDS) was employed to characterize cross sectional microstructure and surface morphologies of coated samples. Transmission electron microscopy (TEM, JEM-2100, JEOL, Tokyo, Japan) was applied to analyze the fine microstructure corresponding to as-sprayed coating samples. For the preparation of TEM specimens, the as-sprayed amorphous coating was peeled off from Q235 substrate in the shape of a slice, then burnished to 50 μm by 1500# SiC abrasive paper and ultimately ion-milled at 4 keV beam energy under the Gatan 695 precision ion thinning system. The phase structure of the polished coating surface was detected by X-ray diffraction (XRD, D8 Advance, Bruker, Karlsruhe, Germany) from 20° to 80°with a scanning velocity of 6°·min−1 with Cu Kα radiation. The average coating porosity was determined by Image J software by adjusting the threshold of at least five fields of view for the SEM image. An atomic force microscope (AFM, NT-MDT Prima, NT-MDT, Moscow, Russia) was utilized to observe the topography of the passive film. X-ray photoelectron spectroscopy (XPS, ESCALAB 250 XI, ThermoFisher Scientific, Waltham, MA, USA) excited by an Al Kα source (hv = 1486.6 eV) was implemented to interpret the chemical constituents of the passive film. XPS spectra were simulated by XPS PEAK software and referred from the NIST binding energies database.

2.3. Electrochemical Measurements

The coated specimens were wet-ground using 150, 400, 600, 800, 1000, 1500 and 2000# SiC abrasive paper in succession prior to electrochemical experiments. The coated surface was then polished with 1.5 μm diamond paste to attain a mirror-like surface. Then all the specimens were washed with acetone and dried in air for the following electrochemical tests. The electrolyte accords with the following compositions: 0.05 M boric acid (H3BO3) and 0.075 M borax (Na2B4O7·10H2O) with pH adjusted to 7.0. Prior to being submerged in the borate buffer solution, all specimens were machined into 10 × 10 × 8 mm3 by wire-electrode cutting with a 1 cm2 exposure area and were meticulously sealed with a curing agent. Electrochemical measurements were conducted by a CHI 660E electrochemical working station (Shanghai Chenhua Instrument Co., Ltd., Shanghai, China) linked with a standard three-electrode electrolytic cell, which is composed of a coated specimen as the working electrode, a reference-saturated calomel electrode (SCE) and a counter platinum plate.
Firstly, the cyclic polarization curve was documented by sweeping potential values between −1.4 VSCE and 1.5 VSCE at a sweeping rate of 1 mV·s−1 and subsequently backed to form a hysteresis loop to decide the polarization potential. Oxides generated in air were removed from coated specimens by cathodic polarization at −1.6 VSCE for 300 s. For the sake of studying the time-dependent characteristics of passive film, the coated sample was potentiostatically passivated at 0.8 VSCE for 600, 1200, 1800, 3600, 5400 and 7200 s, respectively. Electrochemical impedance spectra (EIS) were recorded ranging from 0.01 Hz to10 kHz with an amplitude of 5 mV when a stable open circuit potential (OCP) state was attained. Mott–Schottky curves were drawn at a scanning rate of 50 mV·s−1 between −0.5 and 1.0 VSCE with a constant frequency of 1000 Hz. For the purpose of ensuring data accuracy and repeatability, each of the aforementioned tests had to be carried out a minimum of three times. The impedance spectra were fitted by Zsimpwin 3.21 software (Version 3.21).

3. Results and Discussion

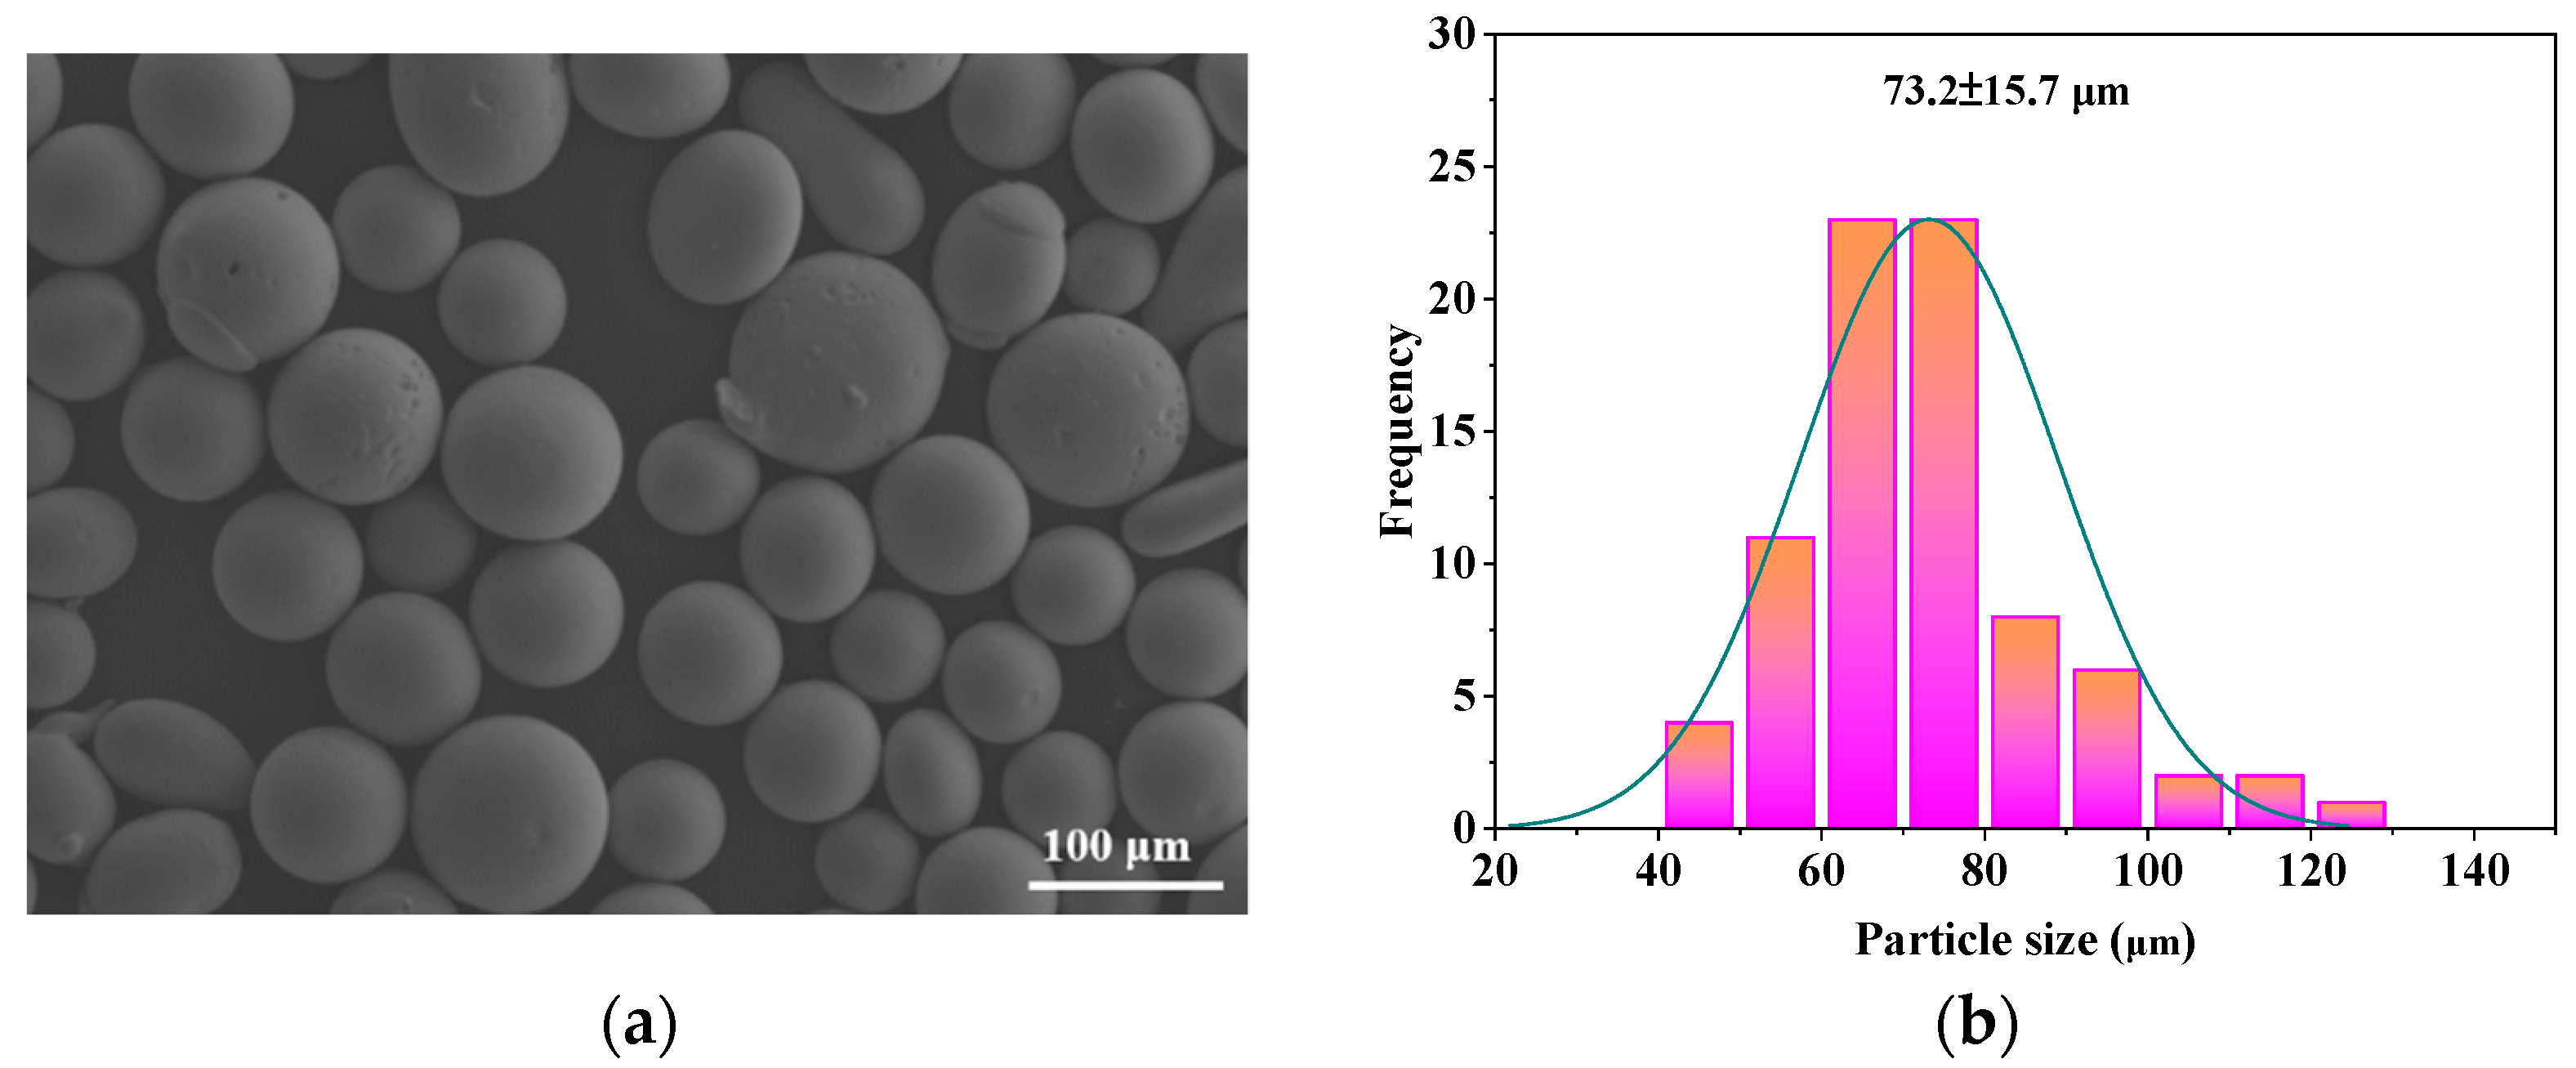
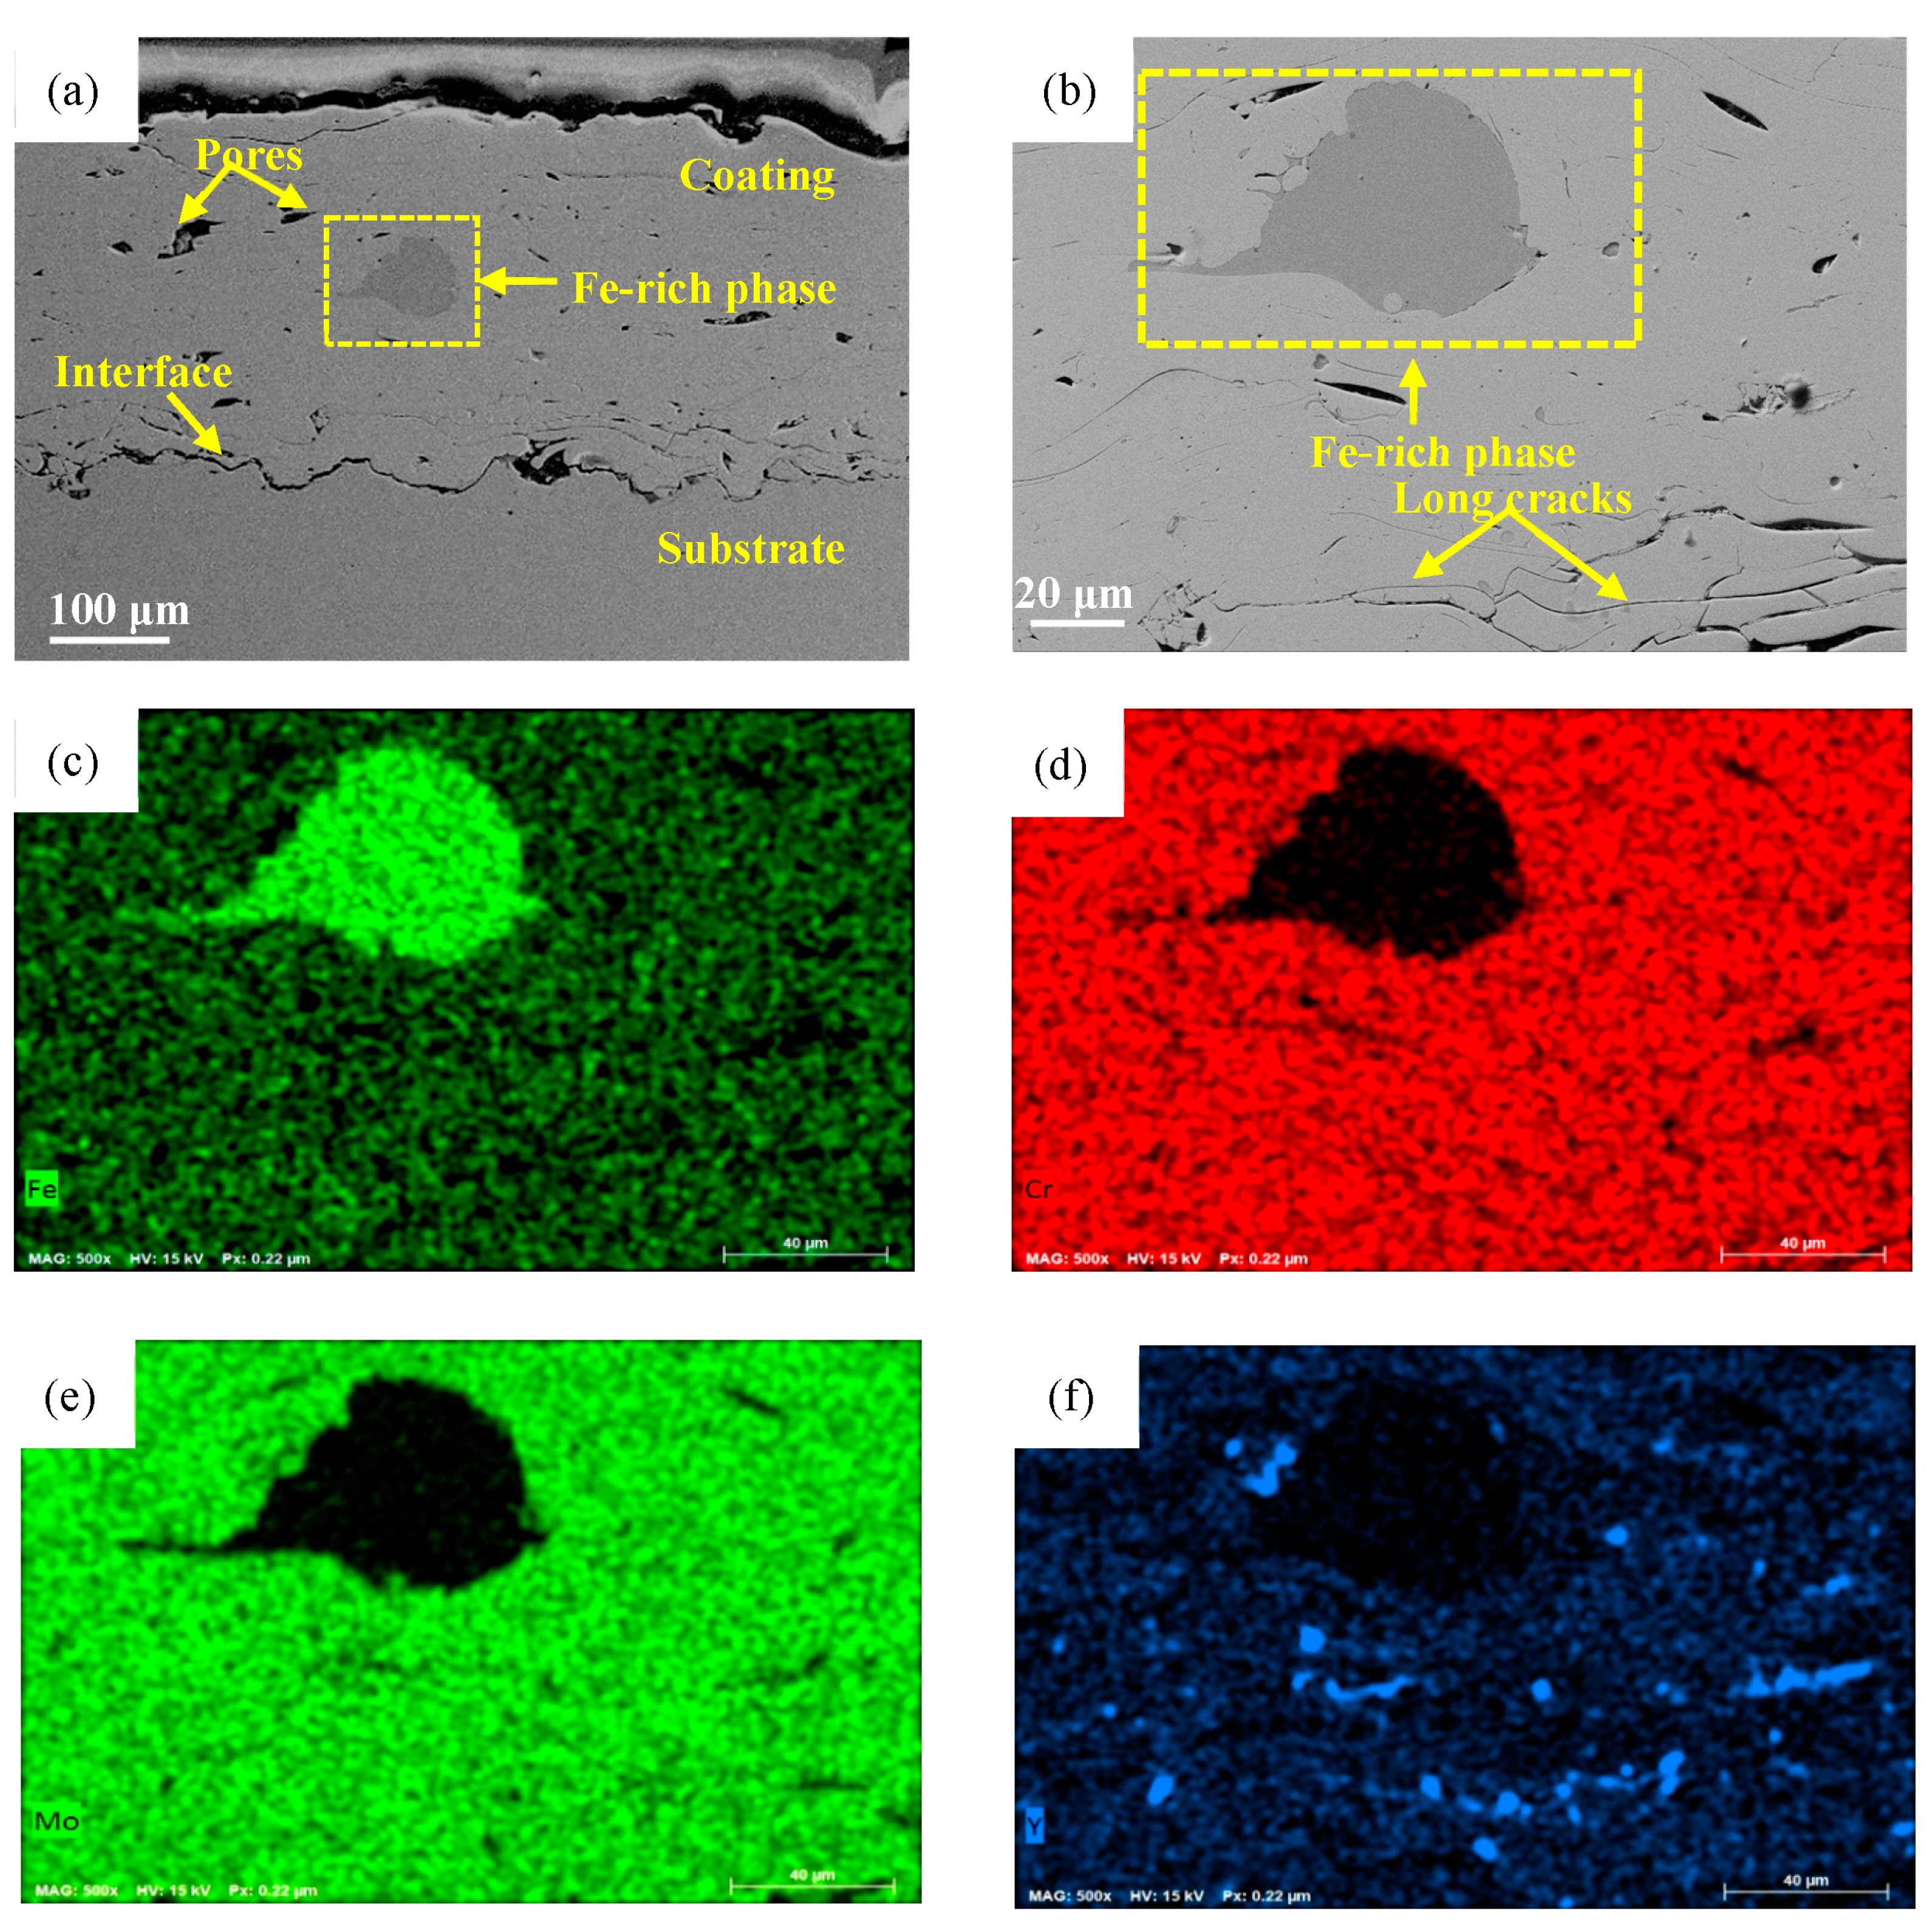
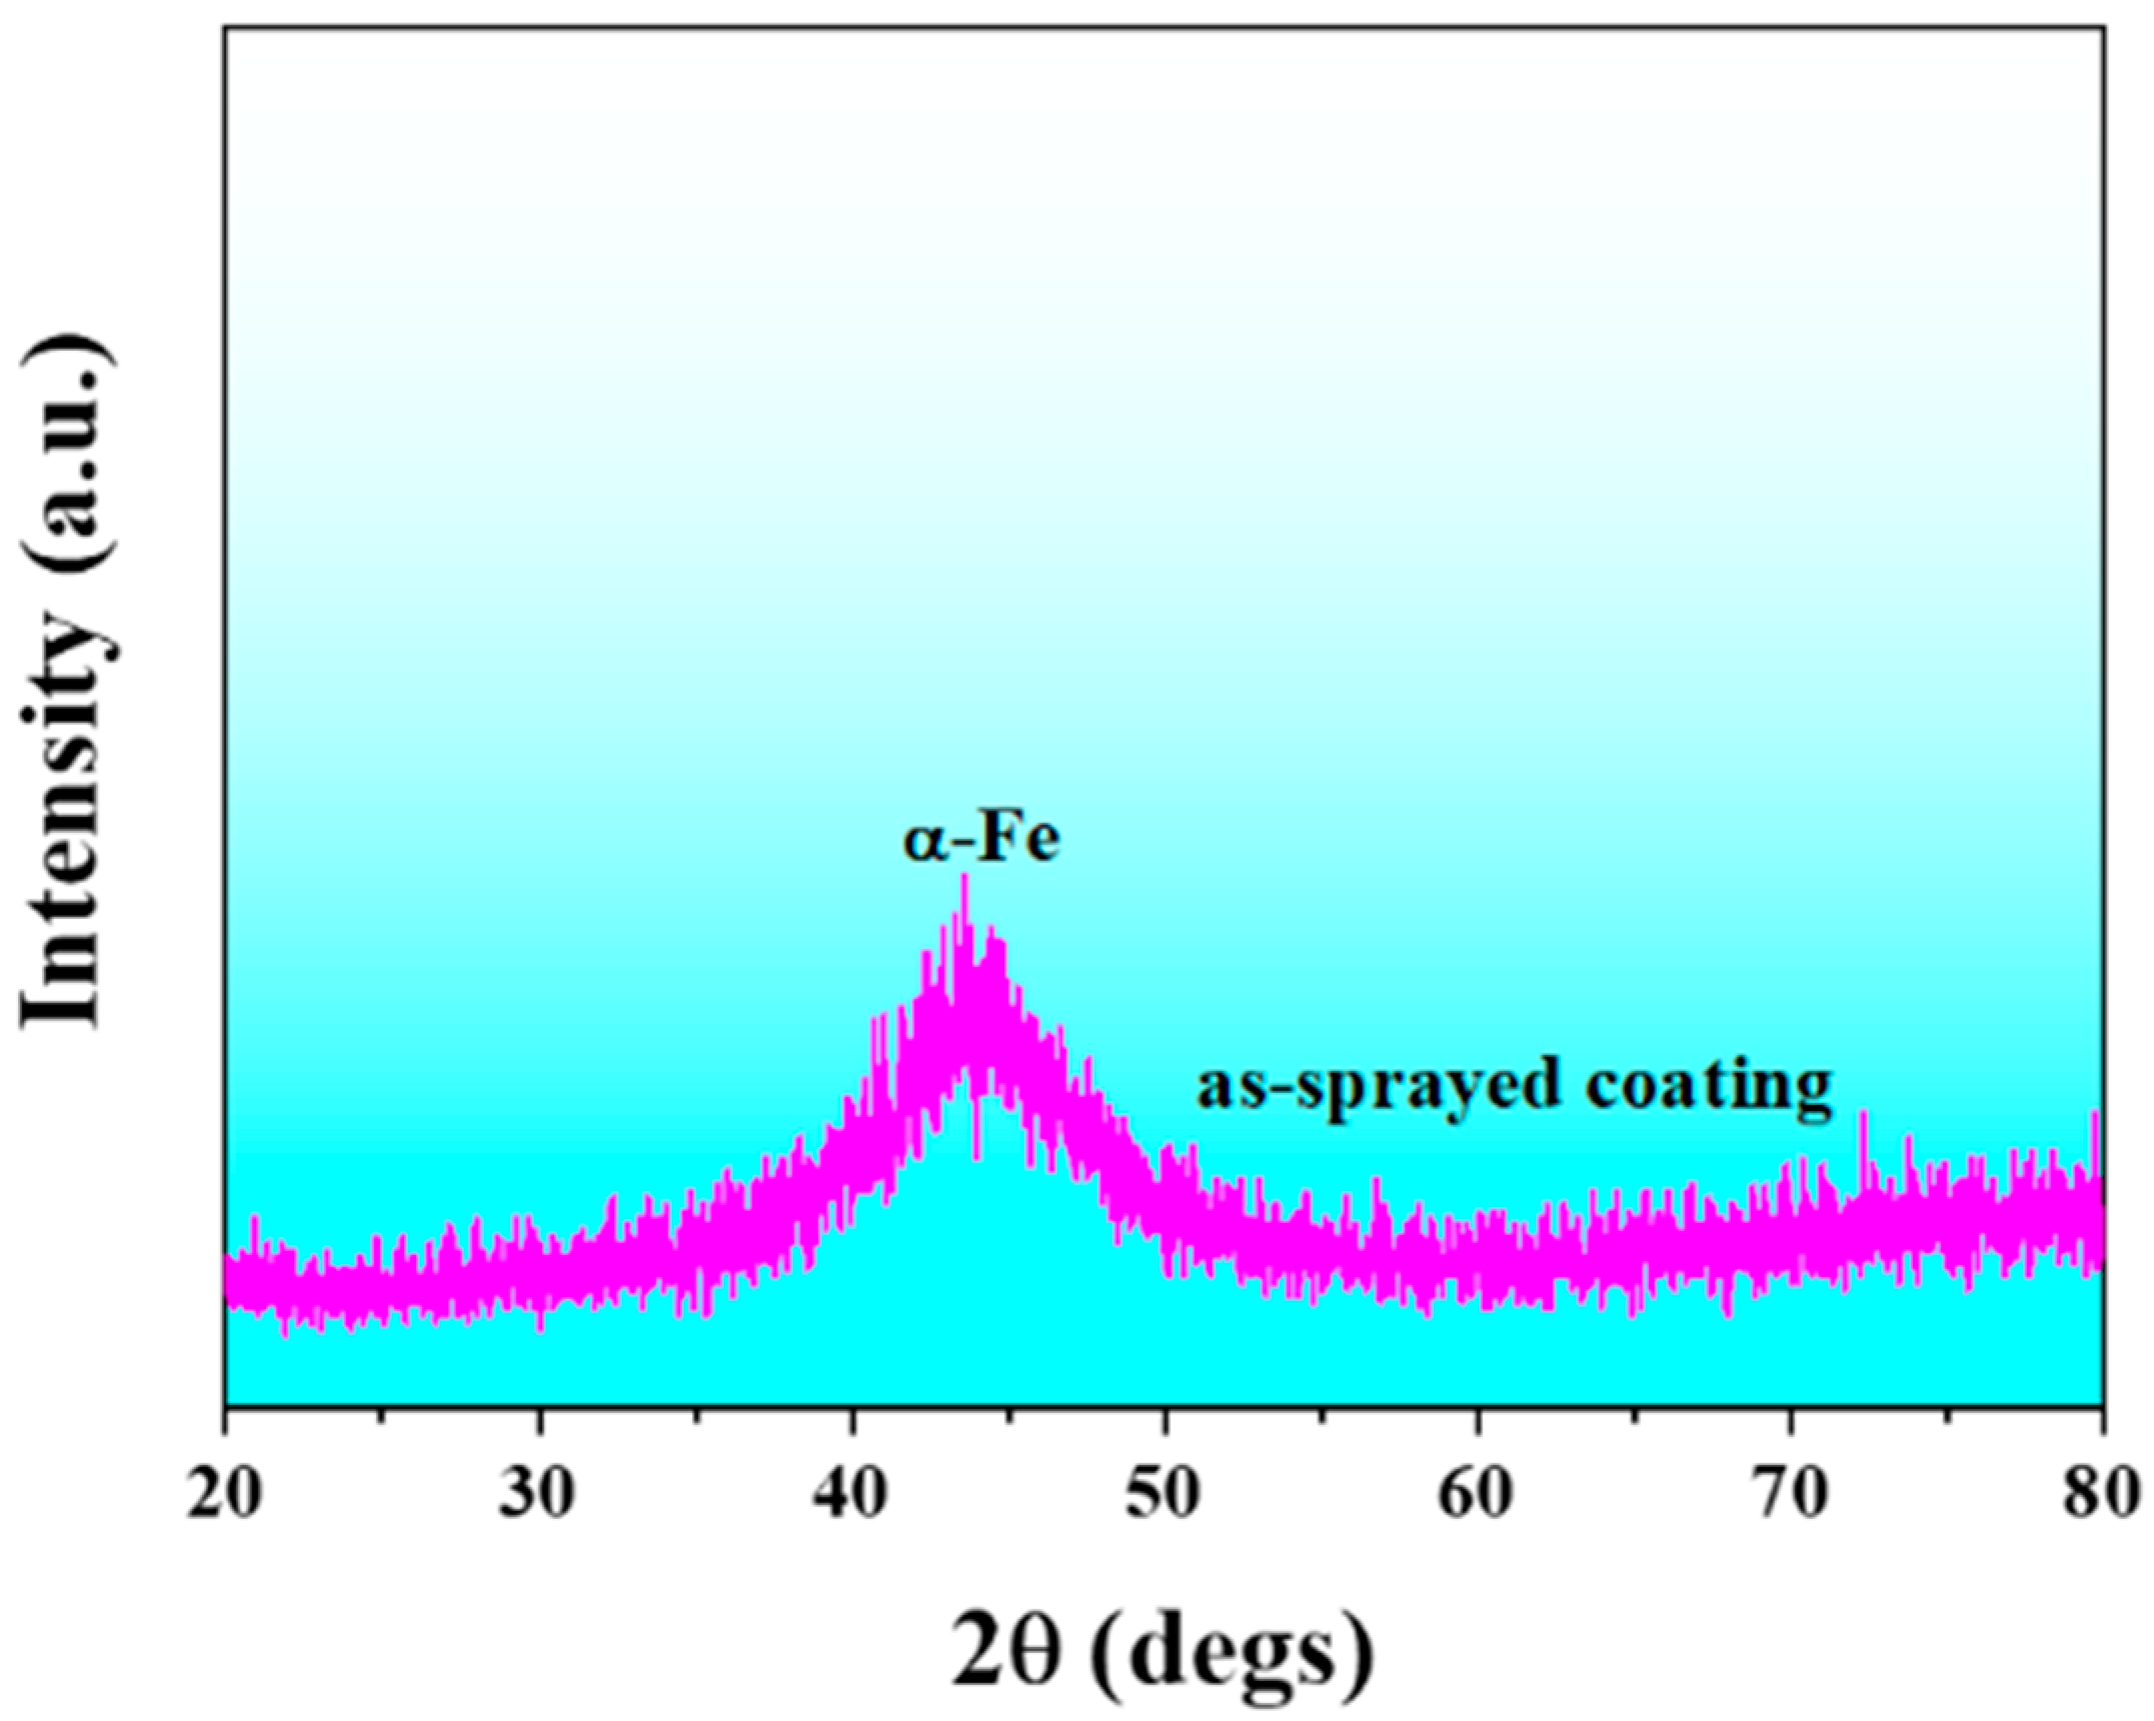
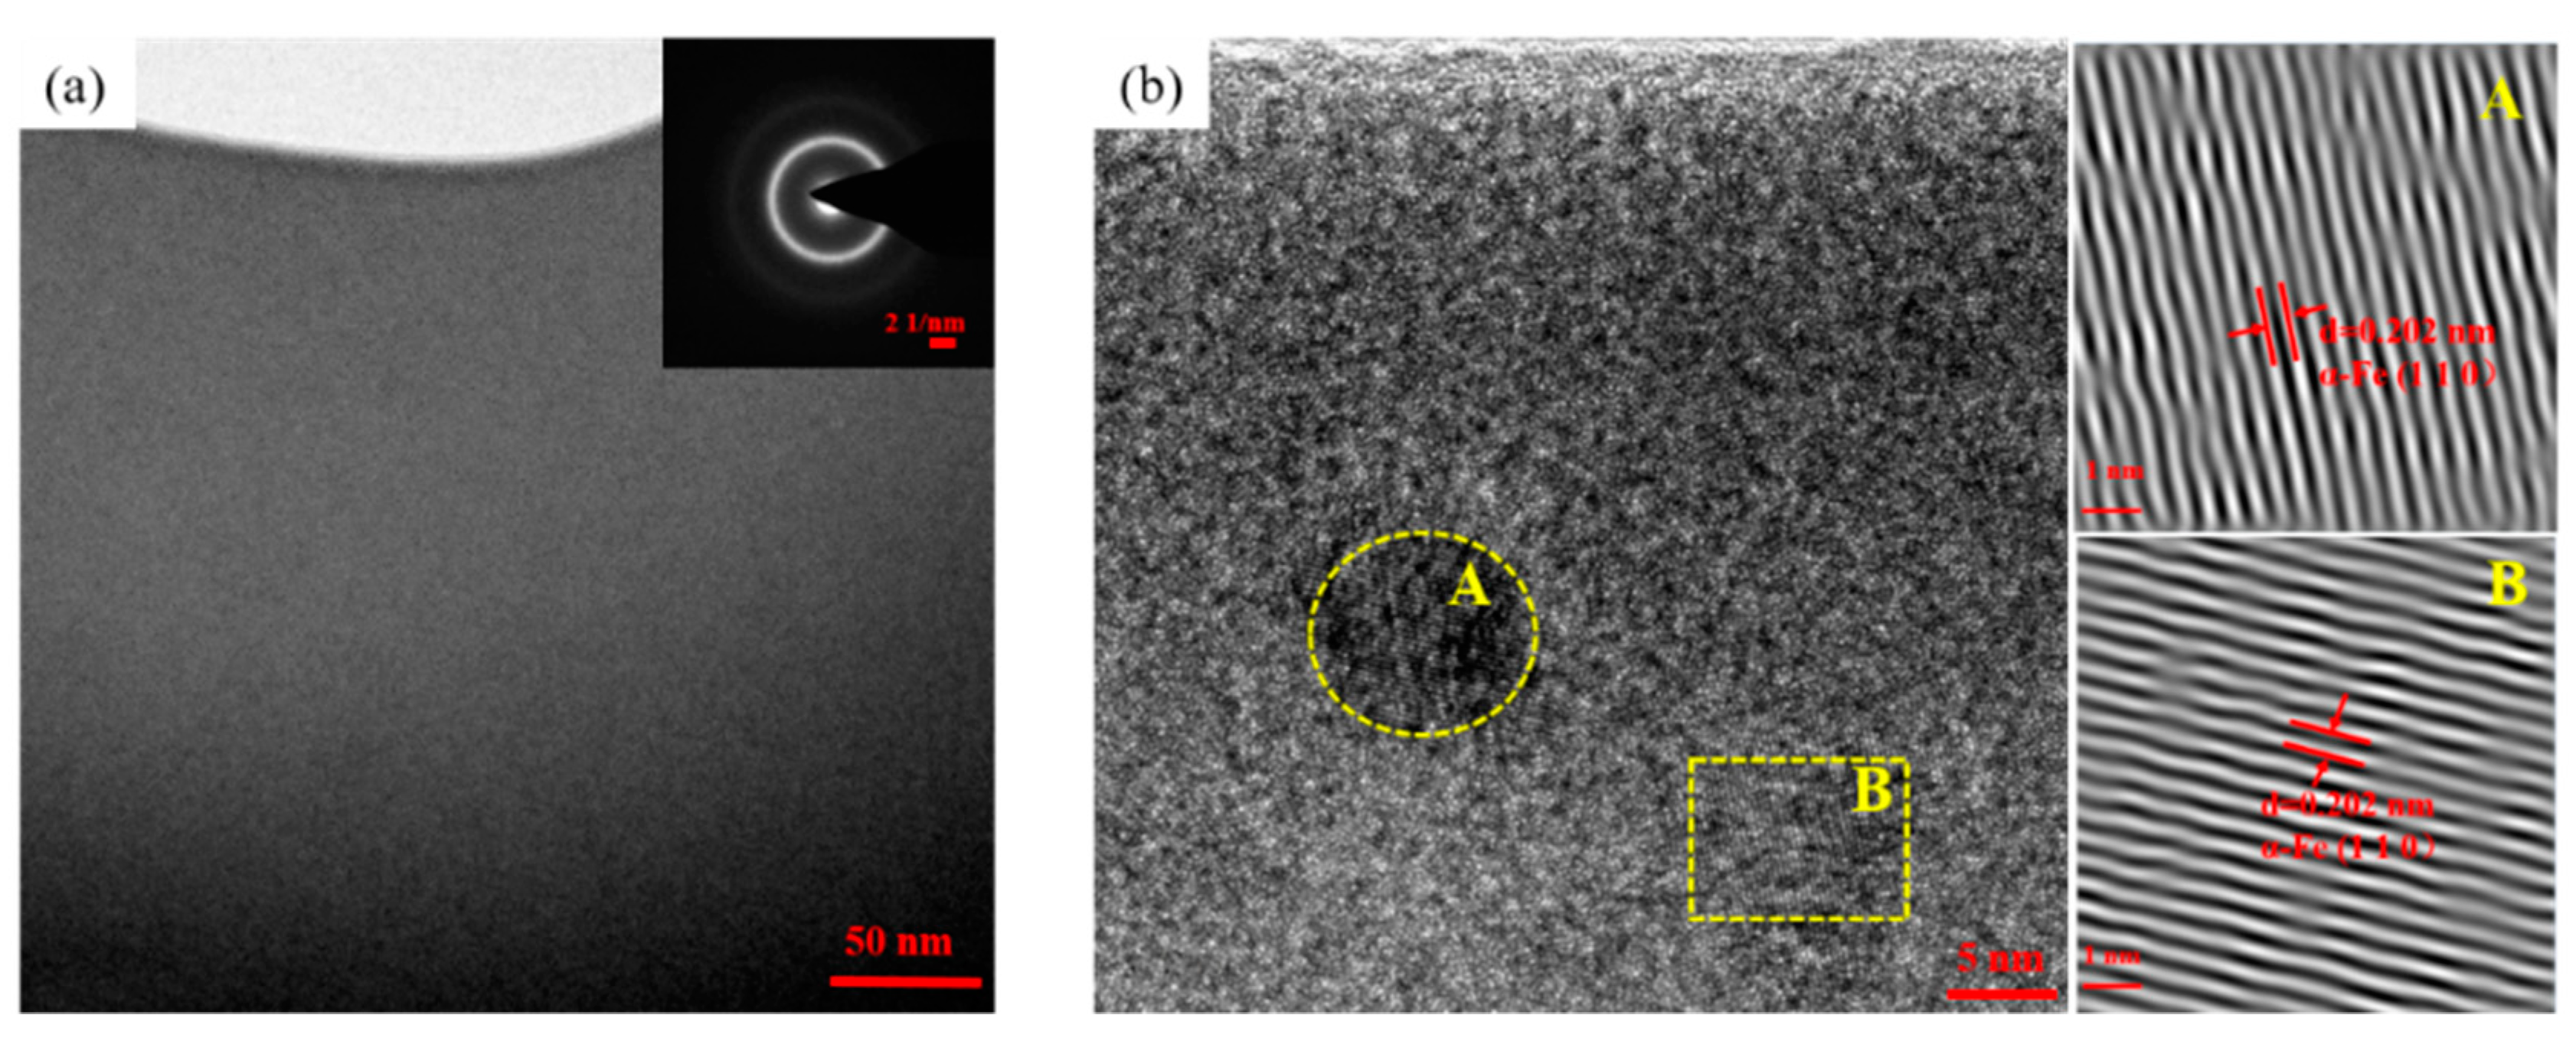
3.1. Microstructural Observations of FeCrMoCBY Amorphous Coating

The cross-sectional microstructure of as-sprayed Fe48Cr15Mo14C15B6Y2 amorphous coating is presented in Figure 2a. Evidently, the coating appears as a fairly compact structure with a thickness of approximately 300 μm, and the defective flaws account for 4.91% of the coating. However, a poor interfacial bonding with Q235 with visible long cracks is also detected, which can be primarily attributed to a mismatch in thermal coefficients between the coating and the substrate [22]. Furthermore, a few pores are visible in the coating. Some large pores mainly result from the local detached packed structure or gas entanglement circumstance, while pores with a smaller size are caused by volume shrinkage between flattened particles [23]. A small number of heterogeneities are also detected occasionally. The grey phase corresponds to an Fe-rich phase with depletion in Cr and Mo based on EDS mapping results, as shown in Figure 2 with higher magnification. In addition, the distribution of yttrium-containing precipitates is inhomogeneous in the coating as indicated by Figure 2f, which means that these elements are not entirely dissolved in the molten Fe-based amorphous matrix during plasma spraying. The surface morphology of as-sprayed Fe48Cr15Mo14C15B6Y2 amorphous coating is presented in Figure 3. It can be observed that several well-molten splats overlap with each other and form visible pores. The formation of disc-shaped splats can be attributed to the sufficient cooling provided by properly optimized plasma spraying parameters [24]. Meanwhile, some unmelted particles without complete melting are embedded in the surface, which can be ascribed to a slower diffusion of molten counterparts during the flight process [25].
Theoretically, amorphous phase preservation is greatly aided by plasma spraying technology with an extremely fast cooling rate higher than 106 K·s−1 [26]. However, during the actual deposition process, insufficient cooling dispersed unevenly in the plasma arc may result in elemental segregation in local regions [27]. After the droplets impact the metal substrate surface and the first layer is quickly deposited, droplets from the second layer continue to solidify onto the first layer while heat is released, causing elemental segregation of the first layer [28]. It is speculated that these defects are inclined to interconnect with each other and transform into a highly destructive network, resulting in reduced corrosion resistance. Additionally, an inhomogeneous chemical composition may lead to a galvanic impact, thus delaying the growth progress of passive film [29].
Figure 4 depicts the XRD profile of as-sprayed Fe48Cr15Mo14C15B6Y2 amorphous coating. The XRD pattern is composed of a sharp diffraction peak associated with the (1 1 0) plane of an α-Fe phase superimposed on a diffuse halo in the range of 40–50°. Precipitation of α-Fe in an amorphous matrix can be attributed to the phase separation during the solidification process [30]. The TEM image and HRTEM micrographs are shown in Figure 5. Figure 5a indicates that the bright field image contains diffuse halo rings, corresponding to the remaining amorphous matrix after deposition. However, a small amount of crystalline-ordered arrangements (denoted as A and B) can also be observed in the HRTEM and FFT patterns in Figure 5b. The plane spacing of nanocrystalline precipitates with regard to obviously atomic arrangement regions approaches 0.202 nm, which is consistent with an α-Fe (1 1 0) plane. The evolution of atomic arrangements is distributed in a disorderly fashion, which is induced by the rapid cooling state allowing the ordered atomic arrangement to solidify with nucleation and crystallization [31]. It is reported that the atoms in the metallic glasses can migrate and accumulate swiftly, simultaneously forming a trace amount of ordered configuration of the atoms [32]. As a consequence, α-Fe crystals are generated through nucleation nuclei agglomeration and grain growth initiated by local heat accumulation inside the coating [33].

3.2. Electrochemical Properties of FeCrMoCBY Amorphous Coating

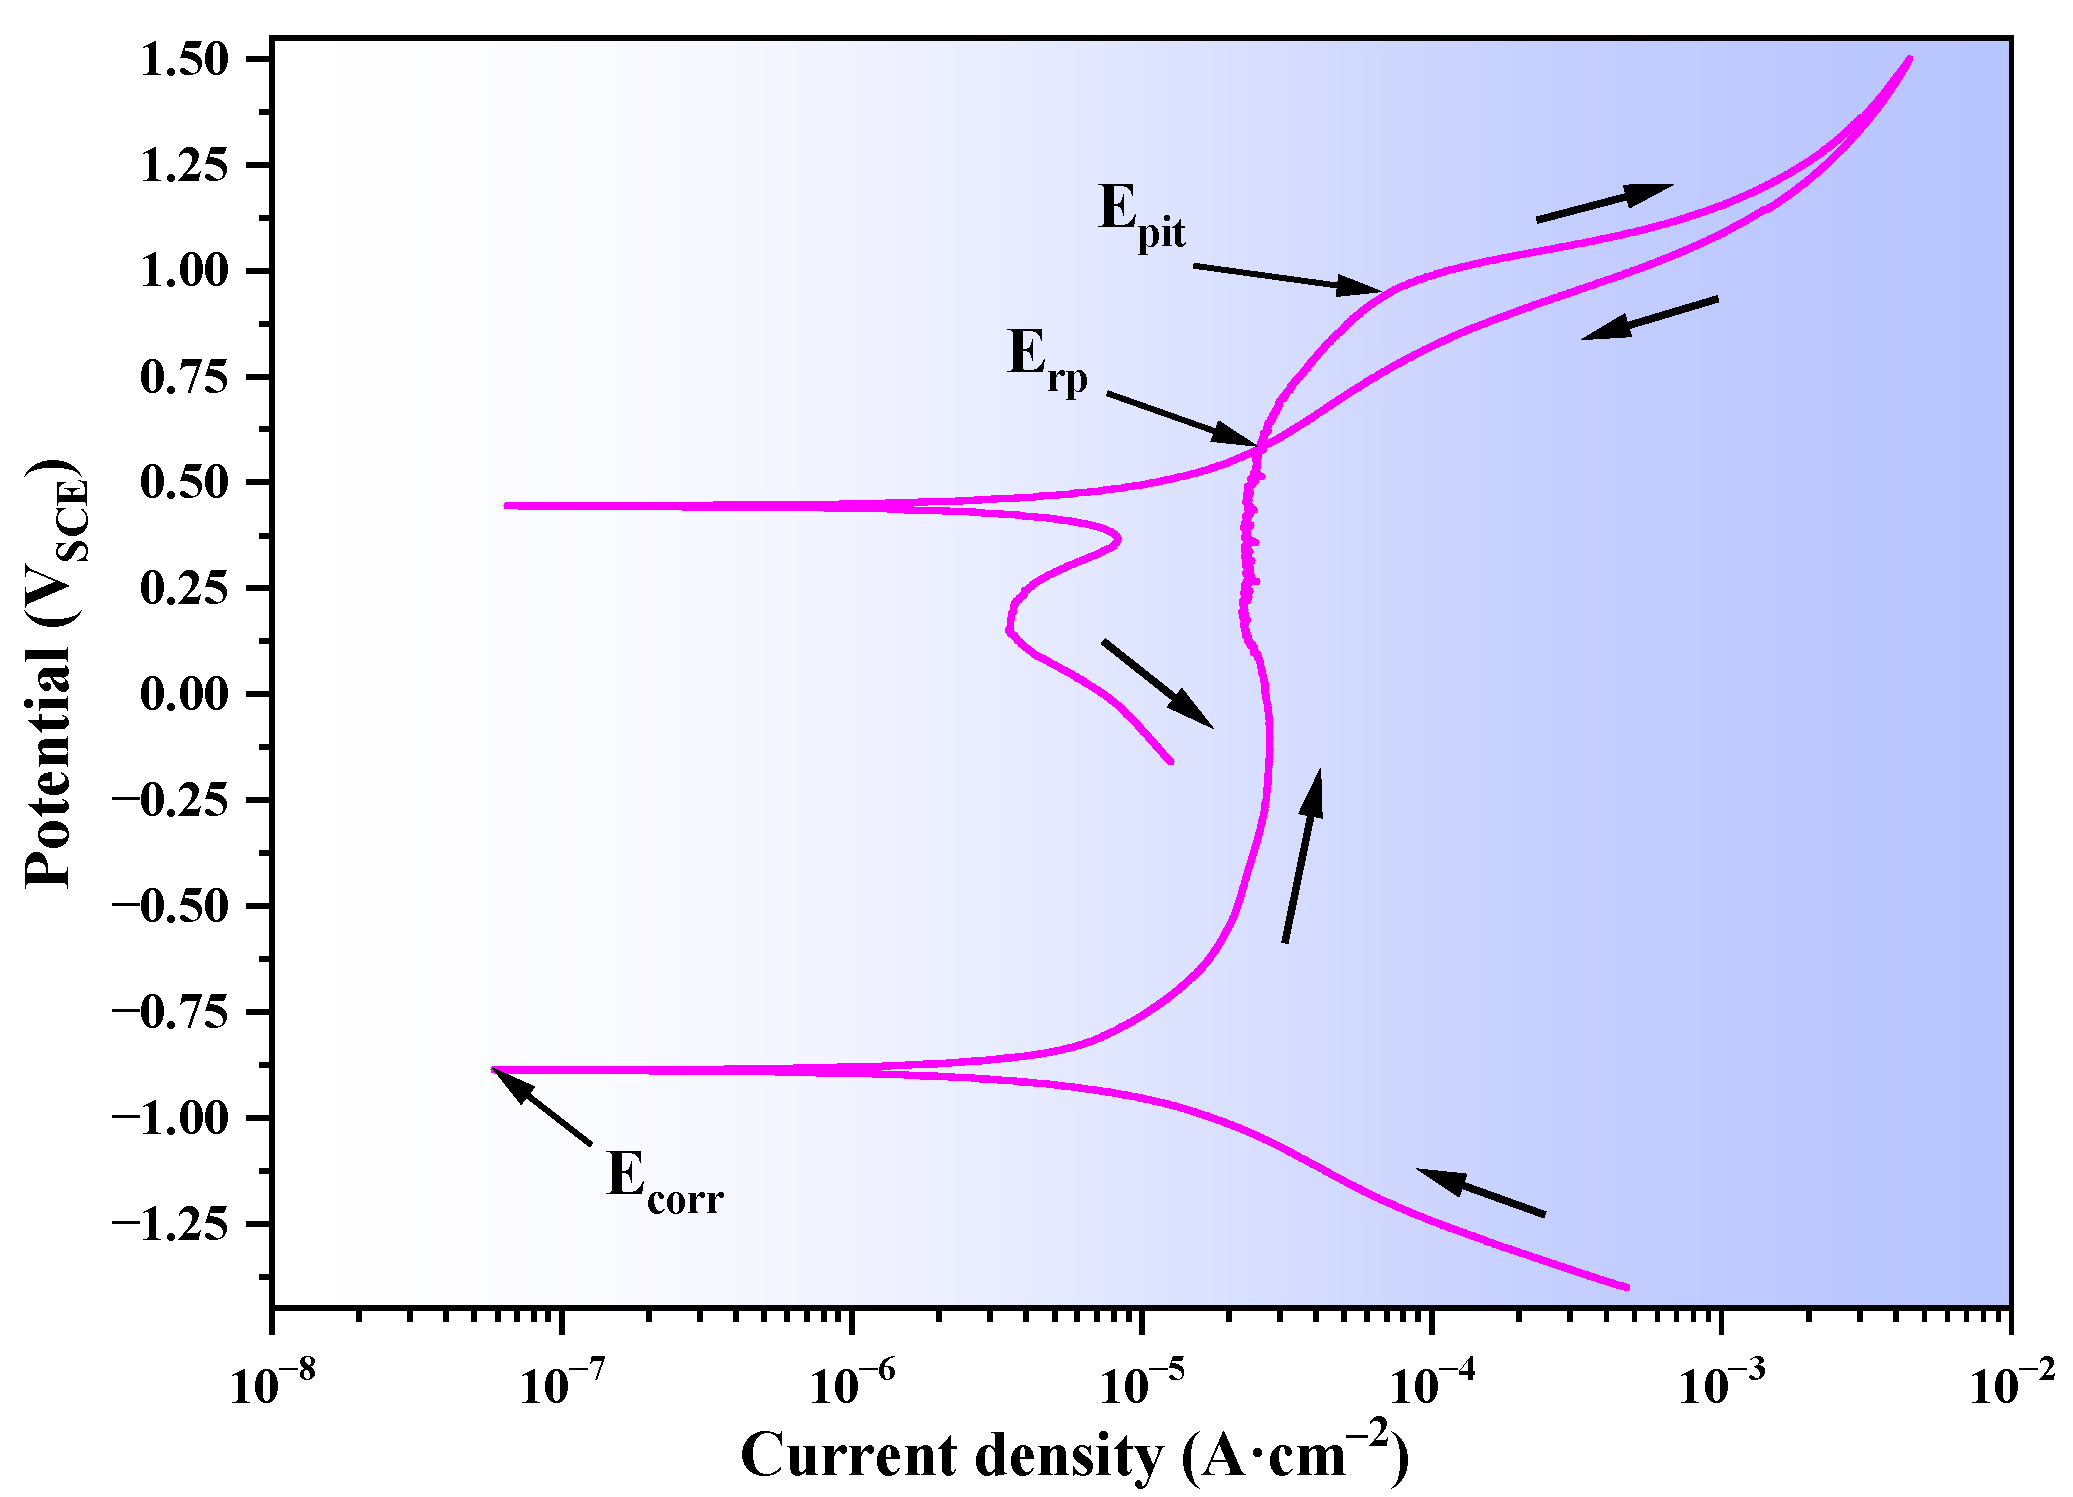
3.2.1. Cyclic Polarization Curve

Figure 6 displays the cyclic polarization curve of Fe48Cr15Mo14C15B6Y2 amorphous coating in borate buffer solution with pH = 7.0. The as-sprayed amorphous coating exhibits a typical response behavior featured by a large range of passivation (−0.5–1.0 VSCE) and a small hysteresis loop extending from approximately 0.58 VSCE (repassivation potential Erp) to 1.50 VSCE. The small area of hysteresis loop for the amorphous coating shows that the pitting resistance is relatively high [34]. Moreover, the transformation of current density in the reversed direction existent in the cyclic polarization curve is thoroughly associated with the steadiness of passive film [35]. In the anodic direction from −0.5 VSCE to 1.0 VSCE, the amorphous coating exhibits a passive state. Therefore, 0.8 VSCE was selected as the formation potential for potentiostatic polarization measurement in this passivation zone. It is shown that the current density across the passive zone is on the order of 10−4 A·cm−2 magnitude with no noticeable transient current peak owing to redox reactions [36]. In this regard, the passivated coating surface can retain an unchanged state allowing for the indefinite growth of passive film in a short period. Additionally, it is possible to keep up the prevention of capacitance reduction for Mott–Schottky curve measurement. The current density is boosted dramatically once the potential exceeds the breakdown potential (about 1.0 VSCE), which can be intimately affiliated with a slow dissolution of Cr-containing species at a transpassive region or rupture of passive film and the oxygen-involved redox reaction on the coating surface [37].

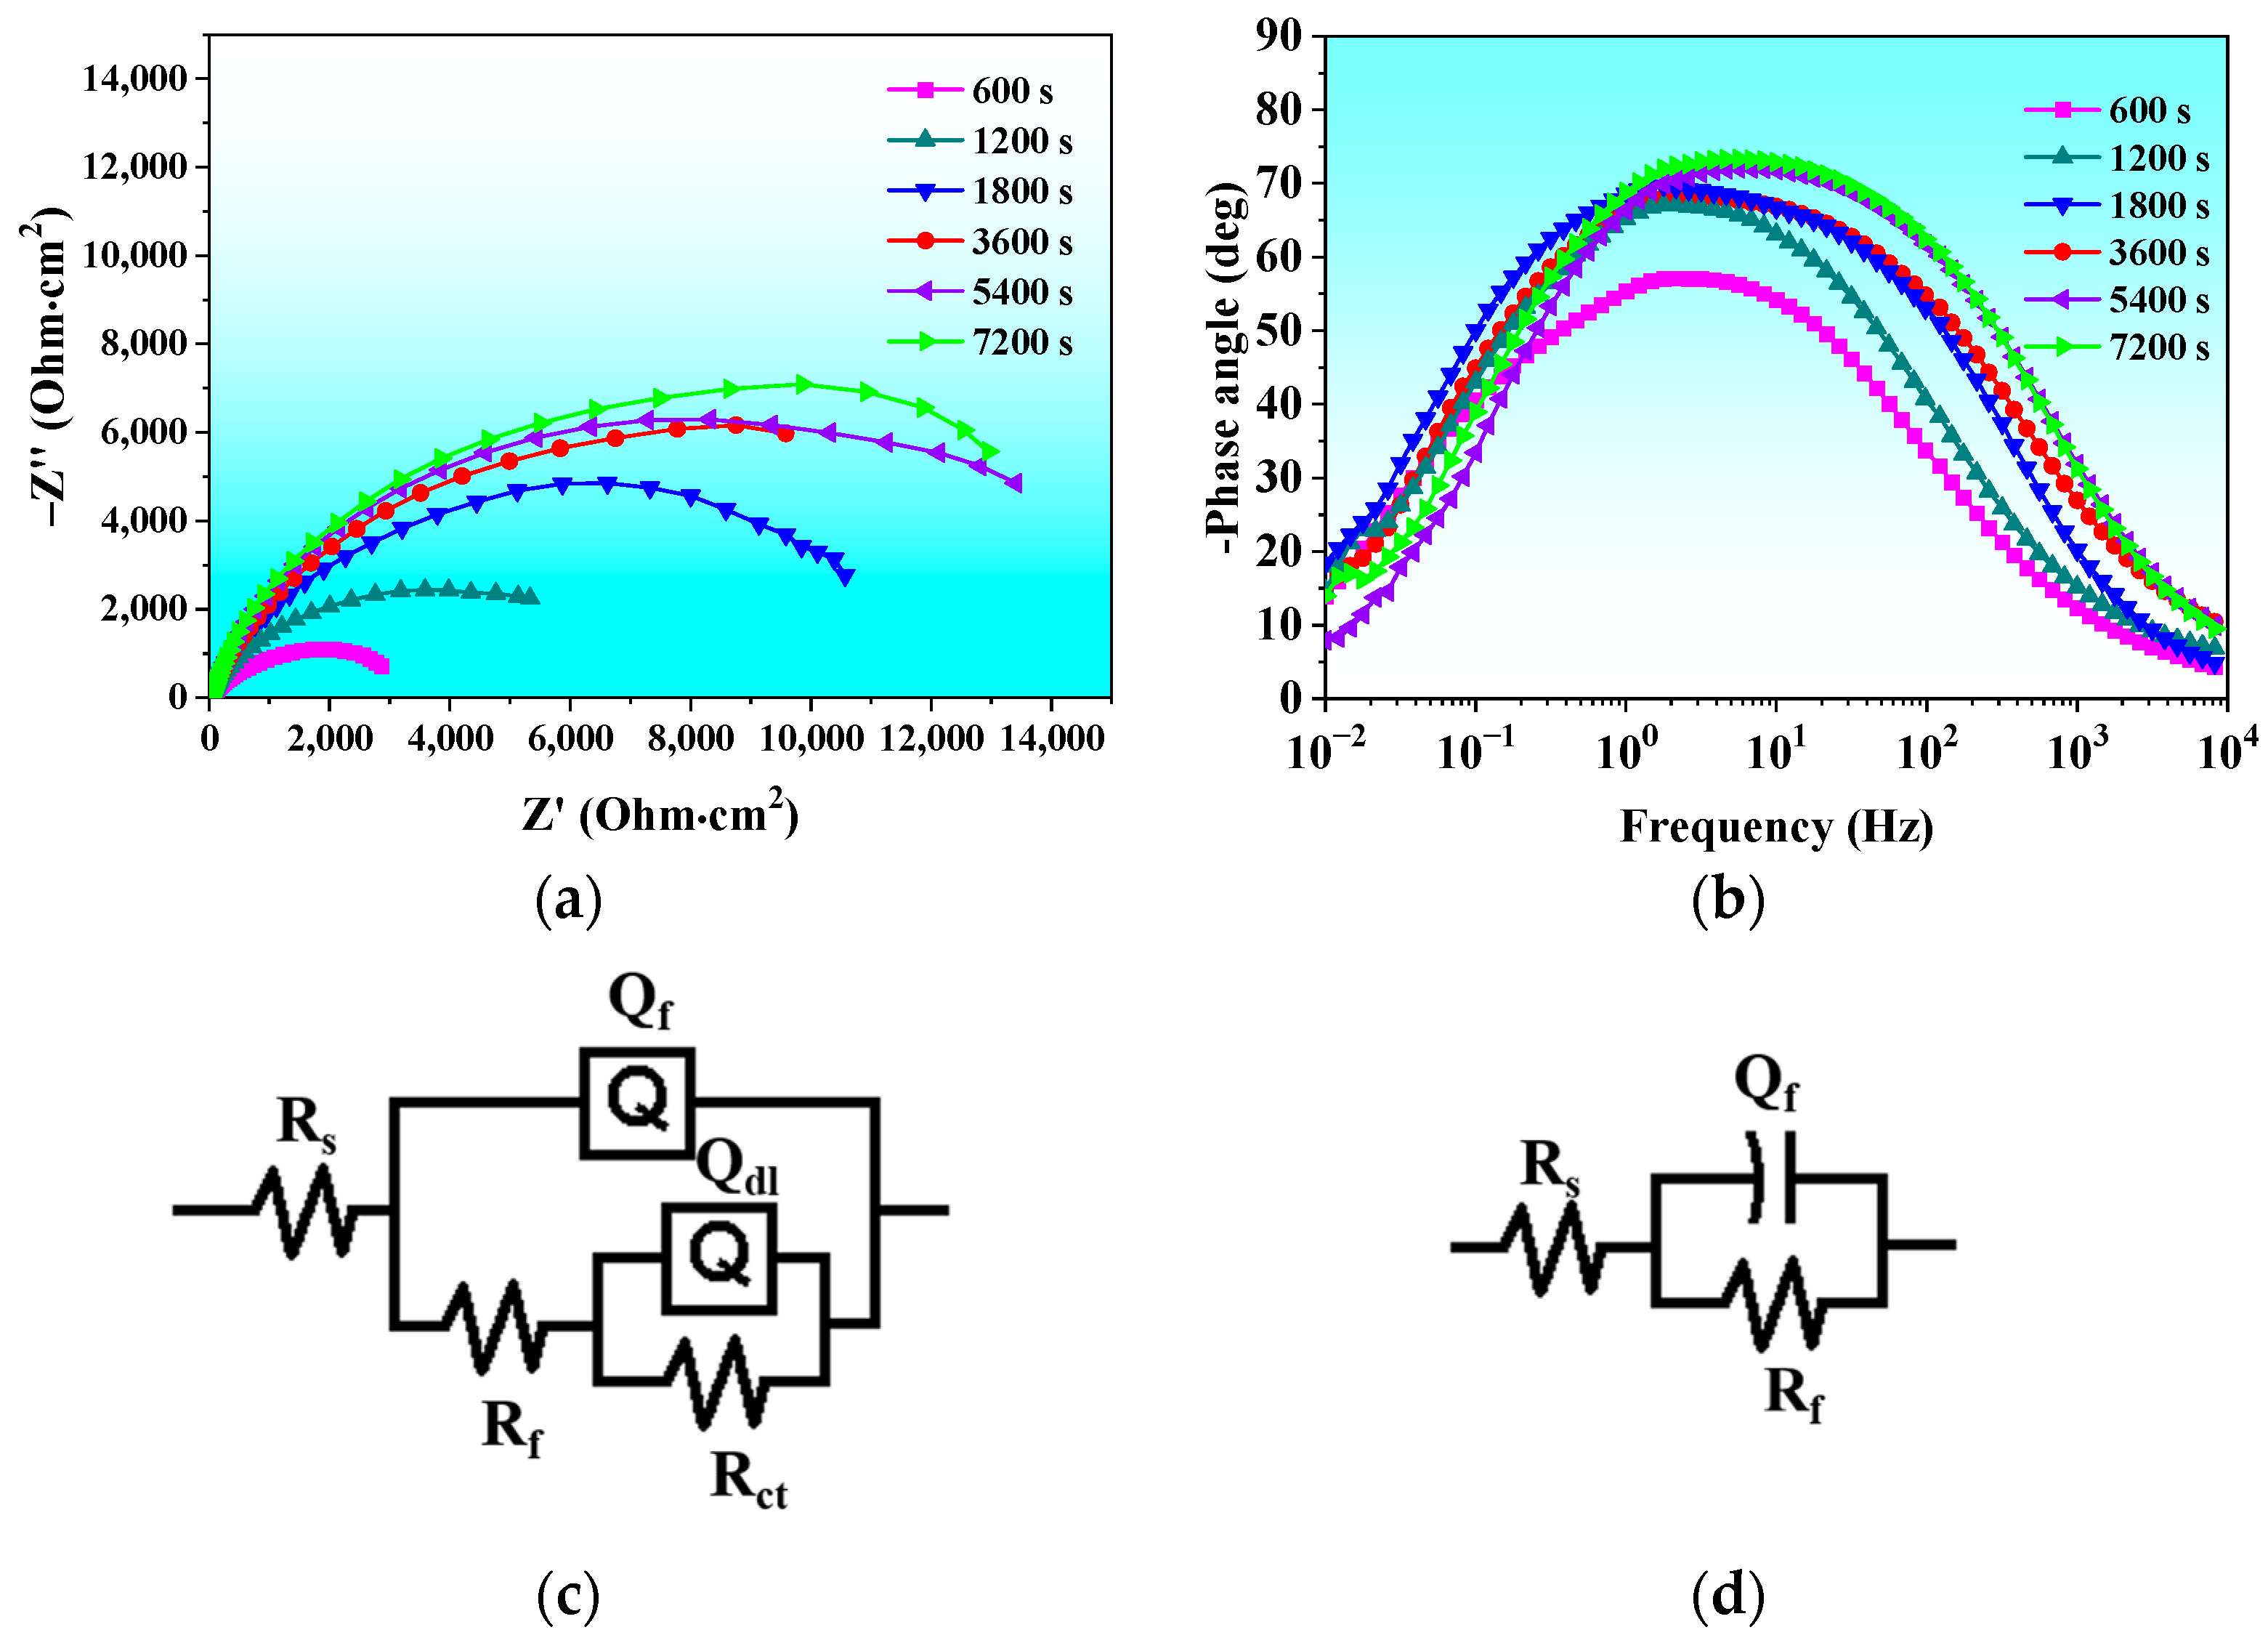
3.2.2. Electrochemical Impedance Spectra

EIS measurements were conducted at various passivation times up to 7200 to for the sake of estimating electrochemical corrosion behavior dependent on passivation time. The electrochemical impedance spectra of Fe48Cr15Mo14C15B6Y2 amorphous coating passivated for various times at room temperature (298 K) under 0.8 VSCE in borate buffer solution are depicted in Figure 7a,b. Similar shapes with depressed capacitive resistance loops can be observed in Nyquist plots for the coating under various passivation times. The radius of the capacitive loop gradually expands with passivation time, as illustrated in Figure 7a, suggesting that the responsive film stability is increased.
Two capacitance peaks can be ascertained according to the phase angle graph in Figure 7b for the coating after passivation for 600 s, implying that the electrode system at the initial passivation stage consists of two reactive interfaces, specifically the passive film/electrolyte interface and the coating/substrate interface. Moreover, the narrow and deep cracks and pores can accelerate the migration of anions, thereby inducing crevice corrosion [38], which accounts for the appearance of two time constants. An additional reaction probably occurs at the boundaries around Fe-rich and Y-containing precipitates, and the dissolution of these precipitates in the coating can supply diffusion pathways to trigger internal corrosion between the coating and substrate. Conversely, the coating after passivation for 1200, 1800, 3600, 5400 and 7200 s possesses a single time constant. The dissipation of one-time constant is a result of the complete blockage of the coating surface by a denser passive film. In particular, the vacancies in the passive film are decreased remarkably, meaning fewer pathways between the film and coating for corrosive medium to infiltrate the coating. According to the phase angle transformation diagram in Figure 7b, the maximum phase angles for the coating after passivation for 600, 1200, 1800, 3600, 5400 and 7200 s are 57.2°, 66.6°, 68.9°, 68.6°, 71.7°and 73.2°, respectively, indicating a general enhancement of corrosion endurance in the amorphous coating. The signals from the low-frequency region are not severely impacted by the passivation time. In contrast, the response signals from the intermediate and high-frequency regions are positively associated with time, proving that the protectiveness of the film is greatly increased with time, while the redox reaction involving film dissolution is conspicuously reduced in response.
The equivalent electric circuit Rs(Qf(Rf(QdlRct))) in Figure 7c is deployed to fit the impedance results for the coating passivated for 600s. Rs, Qf and Rf in this simulation model denote electrolyte resistance, film capacitance and film resistance, separately. Qdl and Rct indicate the double-layer capacitance and the charge transfer resistance between the coating and substrate, respectively. Comparatively, the equivalent electric circuit Rs(QfRf) in Figure 7d is executed to simulate the impedance spectra data for the coating passivated for 1200, 1800, 3600, 5400 and 7200 s.
Table 2 summarizes the simulated results of the impedance data for the amorphous coating after passivation with Chi-squared errors in the range of 10−3–10−4. It is clear that the film resistance Rf rises noticeably from 6.56 kΩ·cm2 at 600 s to 17.73 kΩ·cm2 at 7200 s, showing that a steadier passive film is being produced on the surface of the amorphous coating. It should also be noted that the fitting parameter n1 is also undergoing an increase due to the elevation of film compactness. Meanwhile, the capacitance value Qf at 600 s is roughly an order of magnitude higher than the fitted value at 7200 s, indicating a stable increment of passive film thickness with time prolongation. In borate buffer solution, it is noted that anions will unavoidably influence the production and dissolution of passive film, thus possibly leading to two time constants regarding film growth reaction and the anion corrosion rate. Additionally, the defects, including elemental segregation, pores and cracks, existent in the coating are disposed to induce galvanic corrosion [39], resulting in the phenomenon of two time constants at the initial passivation period. However, the corrosion resistance dominated by enhanced passivity during the later passivation period will be remarkably promoted owing to the unceasing growth of a denser and less faulty passive film with the prolongation of passivation time. The film with a specified thickness can effectively prevent the intrusions of corrosive anions, thus greatly protecting the coating from corrosion.

3.2.3. Semiconducting Properties

To further estimate the electrochemical properties between passive film and electrolyte during passivation, Mott–Schottky curves were recorded in Figure 8a. It is presumed that the double-layer capacitance C is functional to the external potential E of n-type semiconductors as revealed in the following equation [40,41,42]:
C 2 = 2 ε ε 0 e N d ( E U f b k T e )
where ε denotes the relative dielectric constant of passive film (15.6 for Fe-Cr based alloys [42]); ε 0 means the vacuum permittivity (8.857 × 10⁻¹⁴ F·cm−1); Nd is the donor densities; k represents the Boltzmann constant (1.38 × 10⁻²³ J·K−1); T is the absolute temperature (298 K in this work); e is the charge of an electron (1.602 × 10⁻¹⁹ C); and Ufb symbolizes the flat band potential.
Mott–Schottky diagrams of passive films generated over various passivation periods shown in Figure 8a are highly homologous with identical patterns extending from −0.5 VSCE to 1.0 VSCE. N-type semiconducting features of the film can be distinctly distinguished from the plots due to the obvious positive slope in the linear domain of −0.25–0.4 VSCE. Moreover, the donor densities Nd, computed from the fitted positive linear slopes in Figure 8b, are outlined in Table 3. The donor density Nd value dramatically decreases from 5.04 × 1021 cm−3 at 600 s to 8.07 × 1020 cm−3 at 7200 s, indicating that the oxides and hydroxides that make up the passive film gradually transform from a loose structure into a more compact structure. Particularly, Fe-containing oxides as n-type semiconductors are dissolved preferentially near the film/electrolyte interface, and the corresponding remaining vacancy positions in the film will then be replaced by Cr or Mo, leading to the formation of more anti-corrosion barrier oxides such as Cr2O3 and MoO3 in the film.
Variation of the flat band potentials Ufb derived using Equation (1) is also summarized in Table 3. It can be seen that the flat band potential transfers to a positive trend over time, implying that the Fermi level of passive film specifically decreases [43,44]. Hence, the possibility of ions conquering the energy barrier with mass transportation during electrochemical process is lowered, which can lead to a loss of conductivity of passive film [45]. For this reason, the stability of passive film is improved with a longer passivation period.

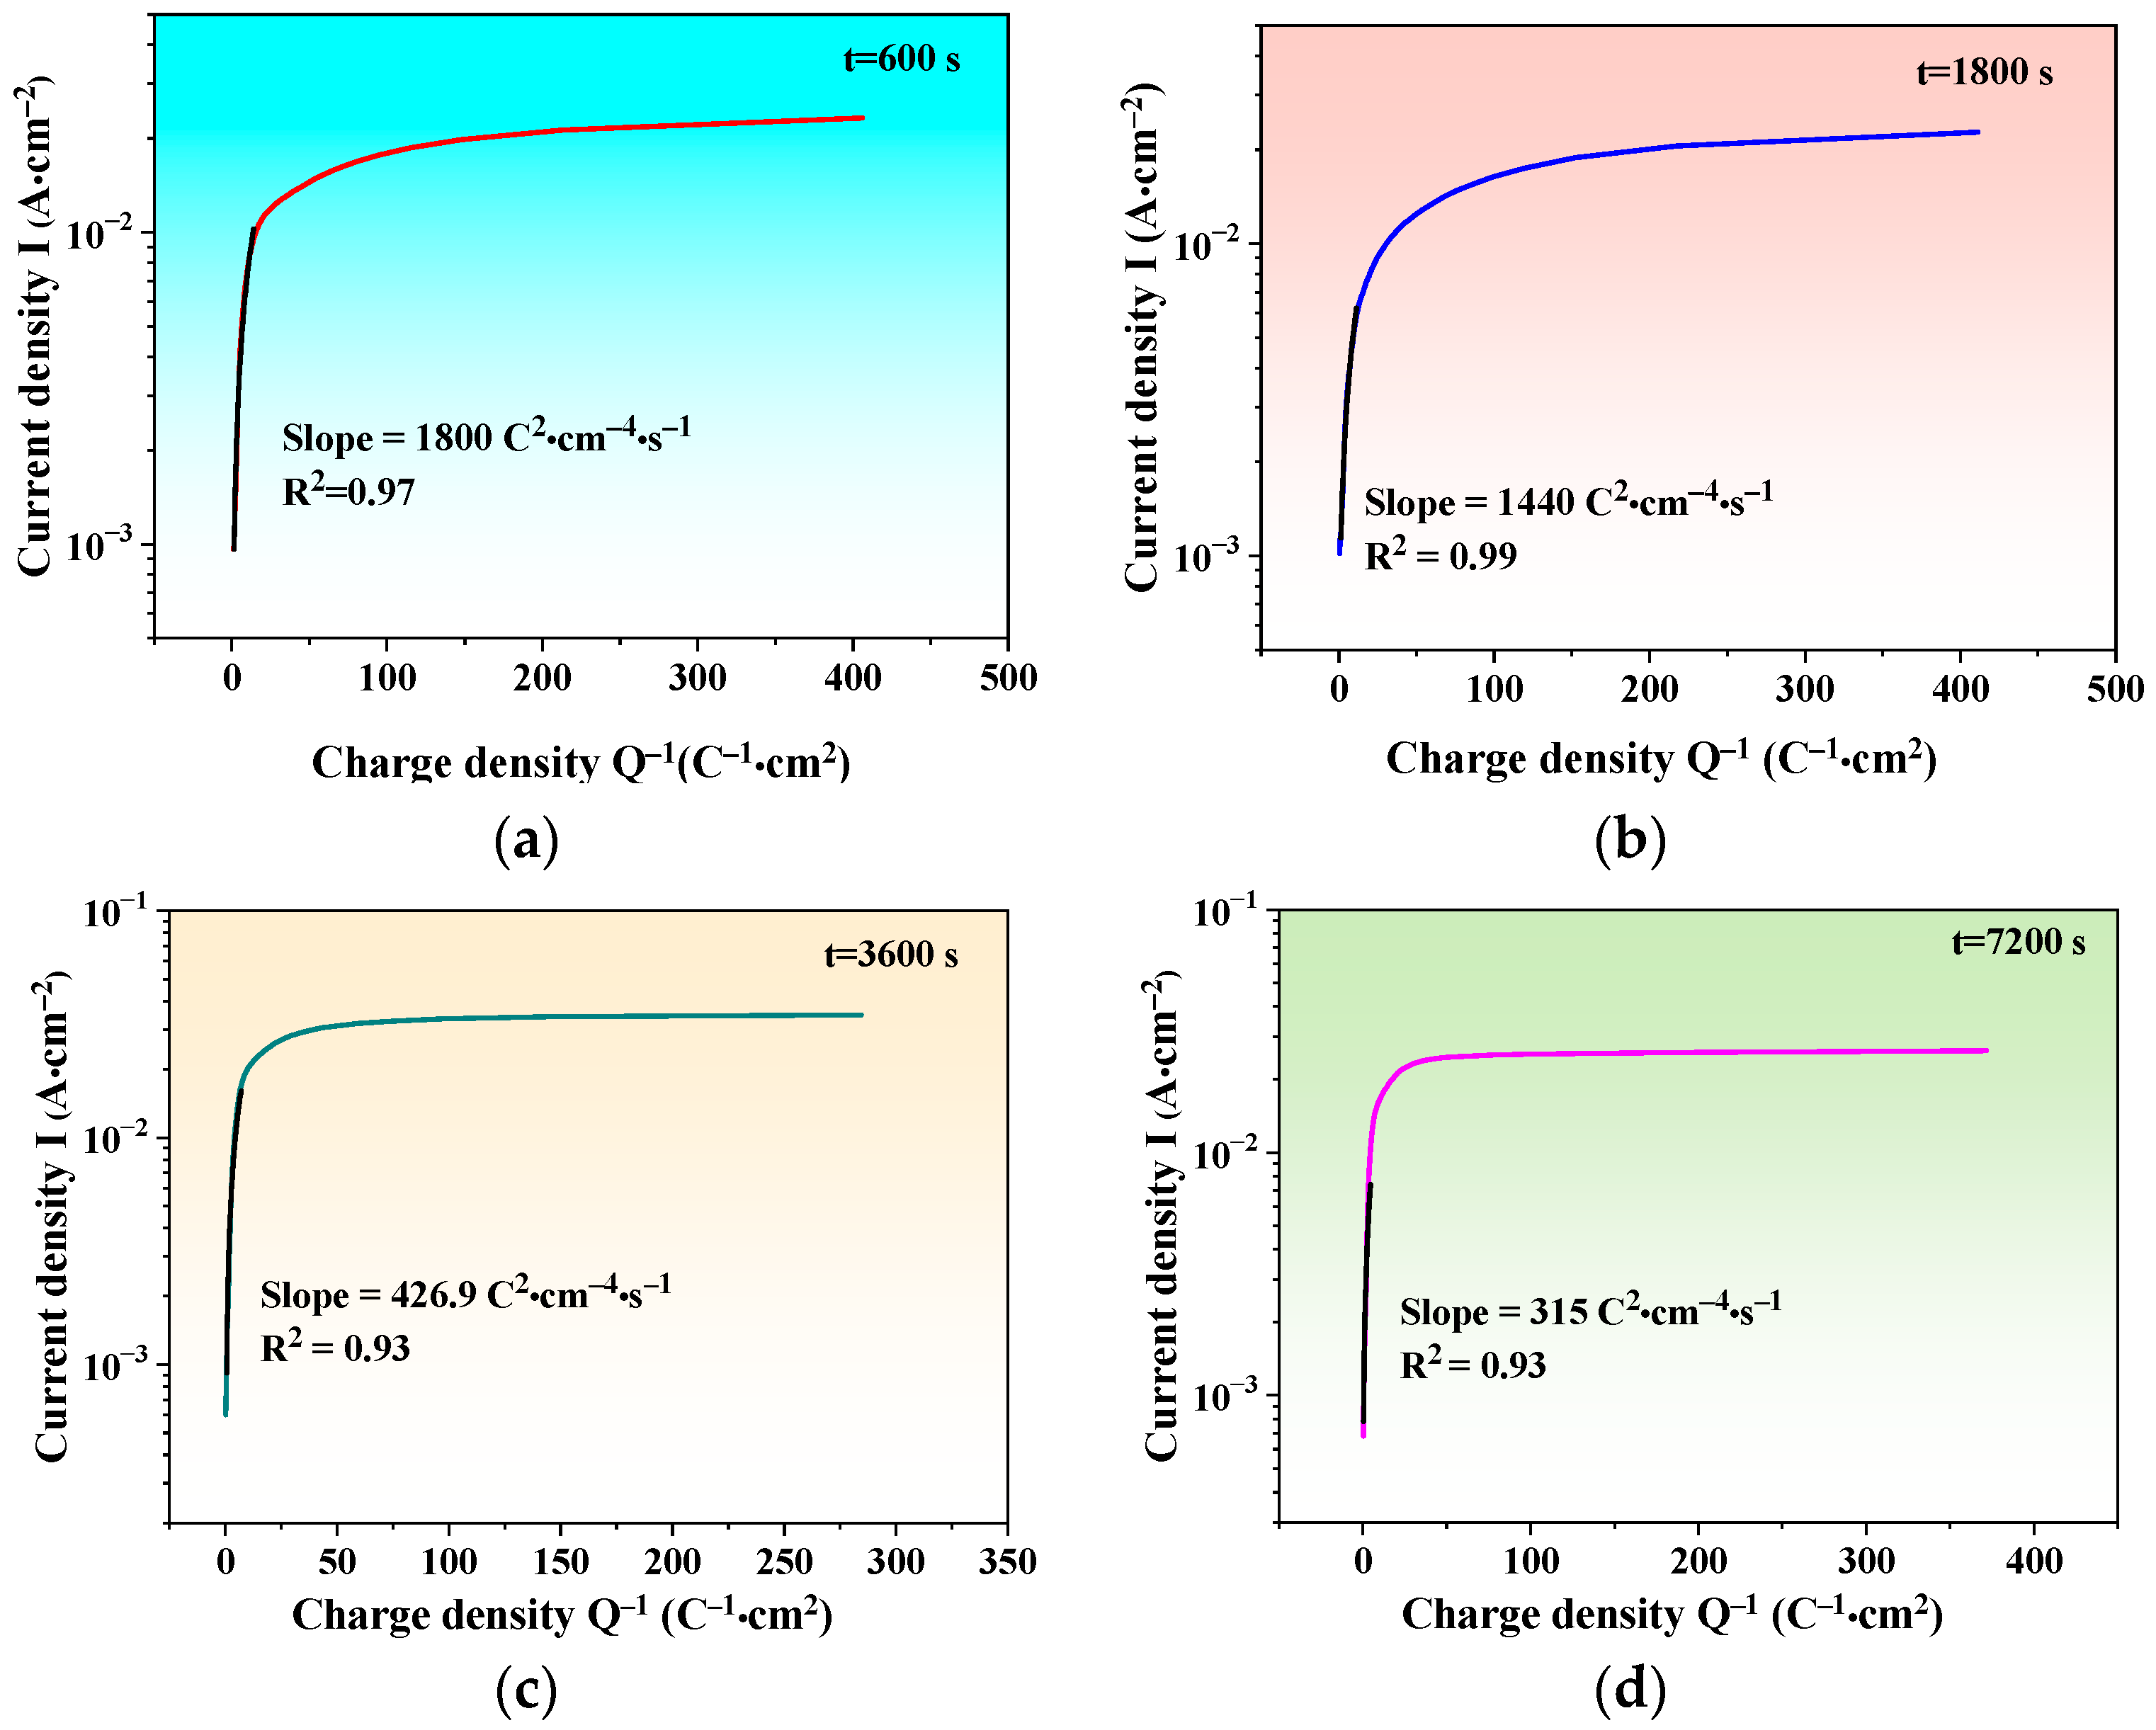
3.2.4. Self-Repairing Ability of Passive Film

The generation process of passive film at diverse times t is accompanied by charge transfer and accumulation process at the interface of film/electrolyte. It is considered that the total amount of charge transferring in the film is approximately equal to the amount of external charge flowing through the electric circuit. Therefore, the total surface charge density Q of the film produced on the coating surface is attained via the next expression [46]:
Q = 1 S 0 t I t d t
where S represents the electrode exposure area (1 cm2 in this work) and I(t) stands for the current density.
The high electric field growth model assumes that the current flowing through the coating surface is completely used for film production [46], then:
l o g   I = l o g   n + c B V Q
where n and B are constants concerning the activation energy of ion transmission in the passive film. c is a constant relevant to the intrinsic properties of the given Fe-based amorphous coating. V is the voltage drop in the film.
Based on Equation (3), the current density log is consequently positively correlated with Q−1, and Figure 9 shows the simulated results of log I plotted against Q−1 of passive films passivated across a range of durations. It is obvious that log I and Q−1 conform to a linear relationship, which is compatible with the high electric field model hypothesis [45]. It is reported that the slope value cBV can reflect the self-repairing of the film and the smaller the slope is, the stronger ability of self-repairing is [47]. In the linear region, the slope values are determined as follows: 1800 (t = 600 s) − 1440 (t = 1800 s) − 426.9 (t = 3600 s) − 315 (t = 7200 s) C2·cm − 4·s−1. Thus, a longer passivation time is shown to improve the self-repairing progression of passive film.

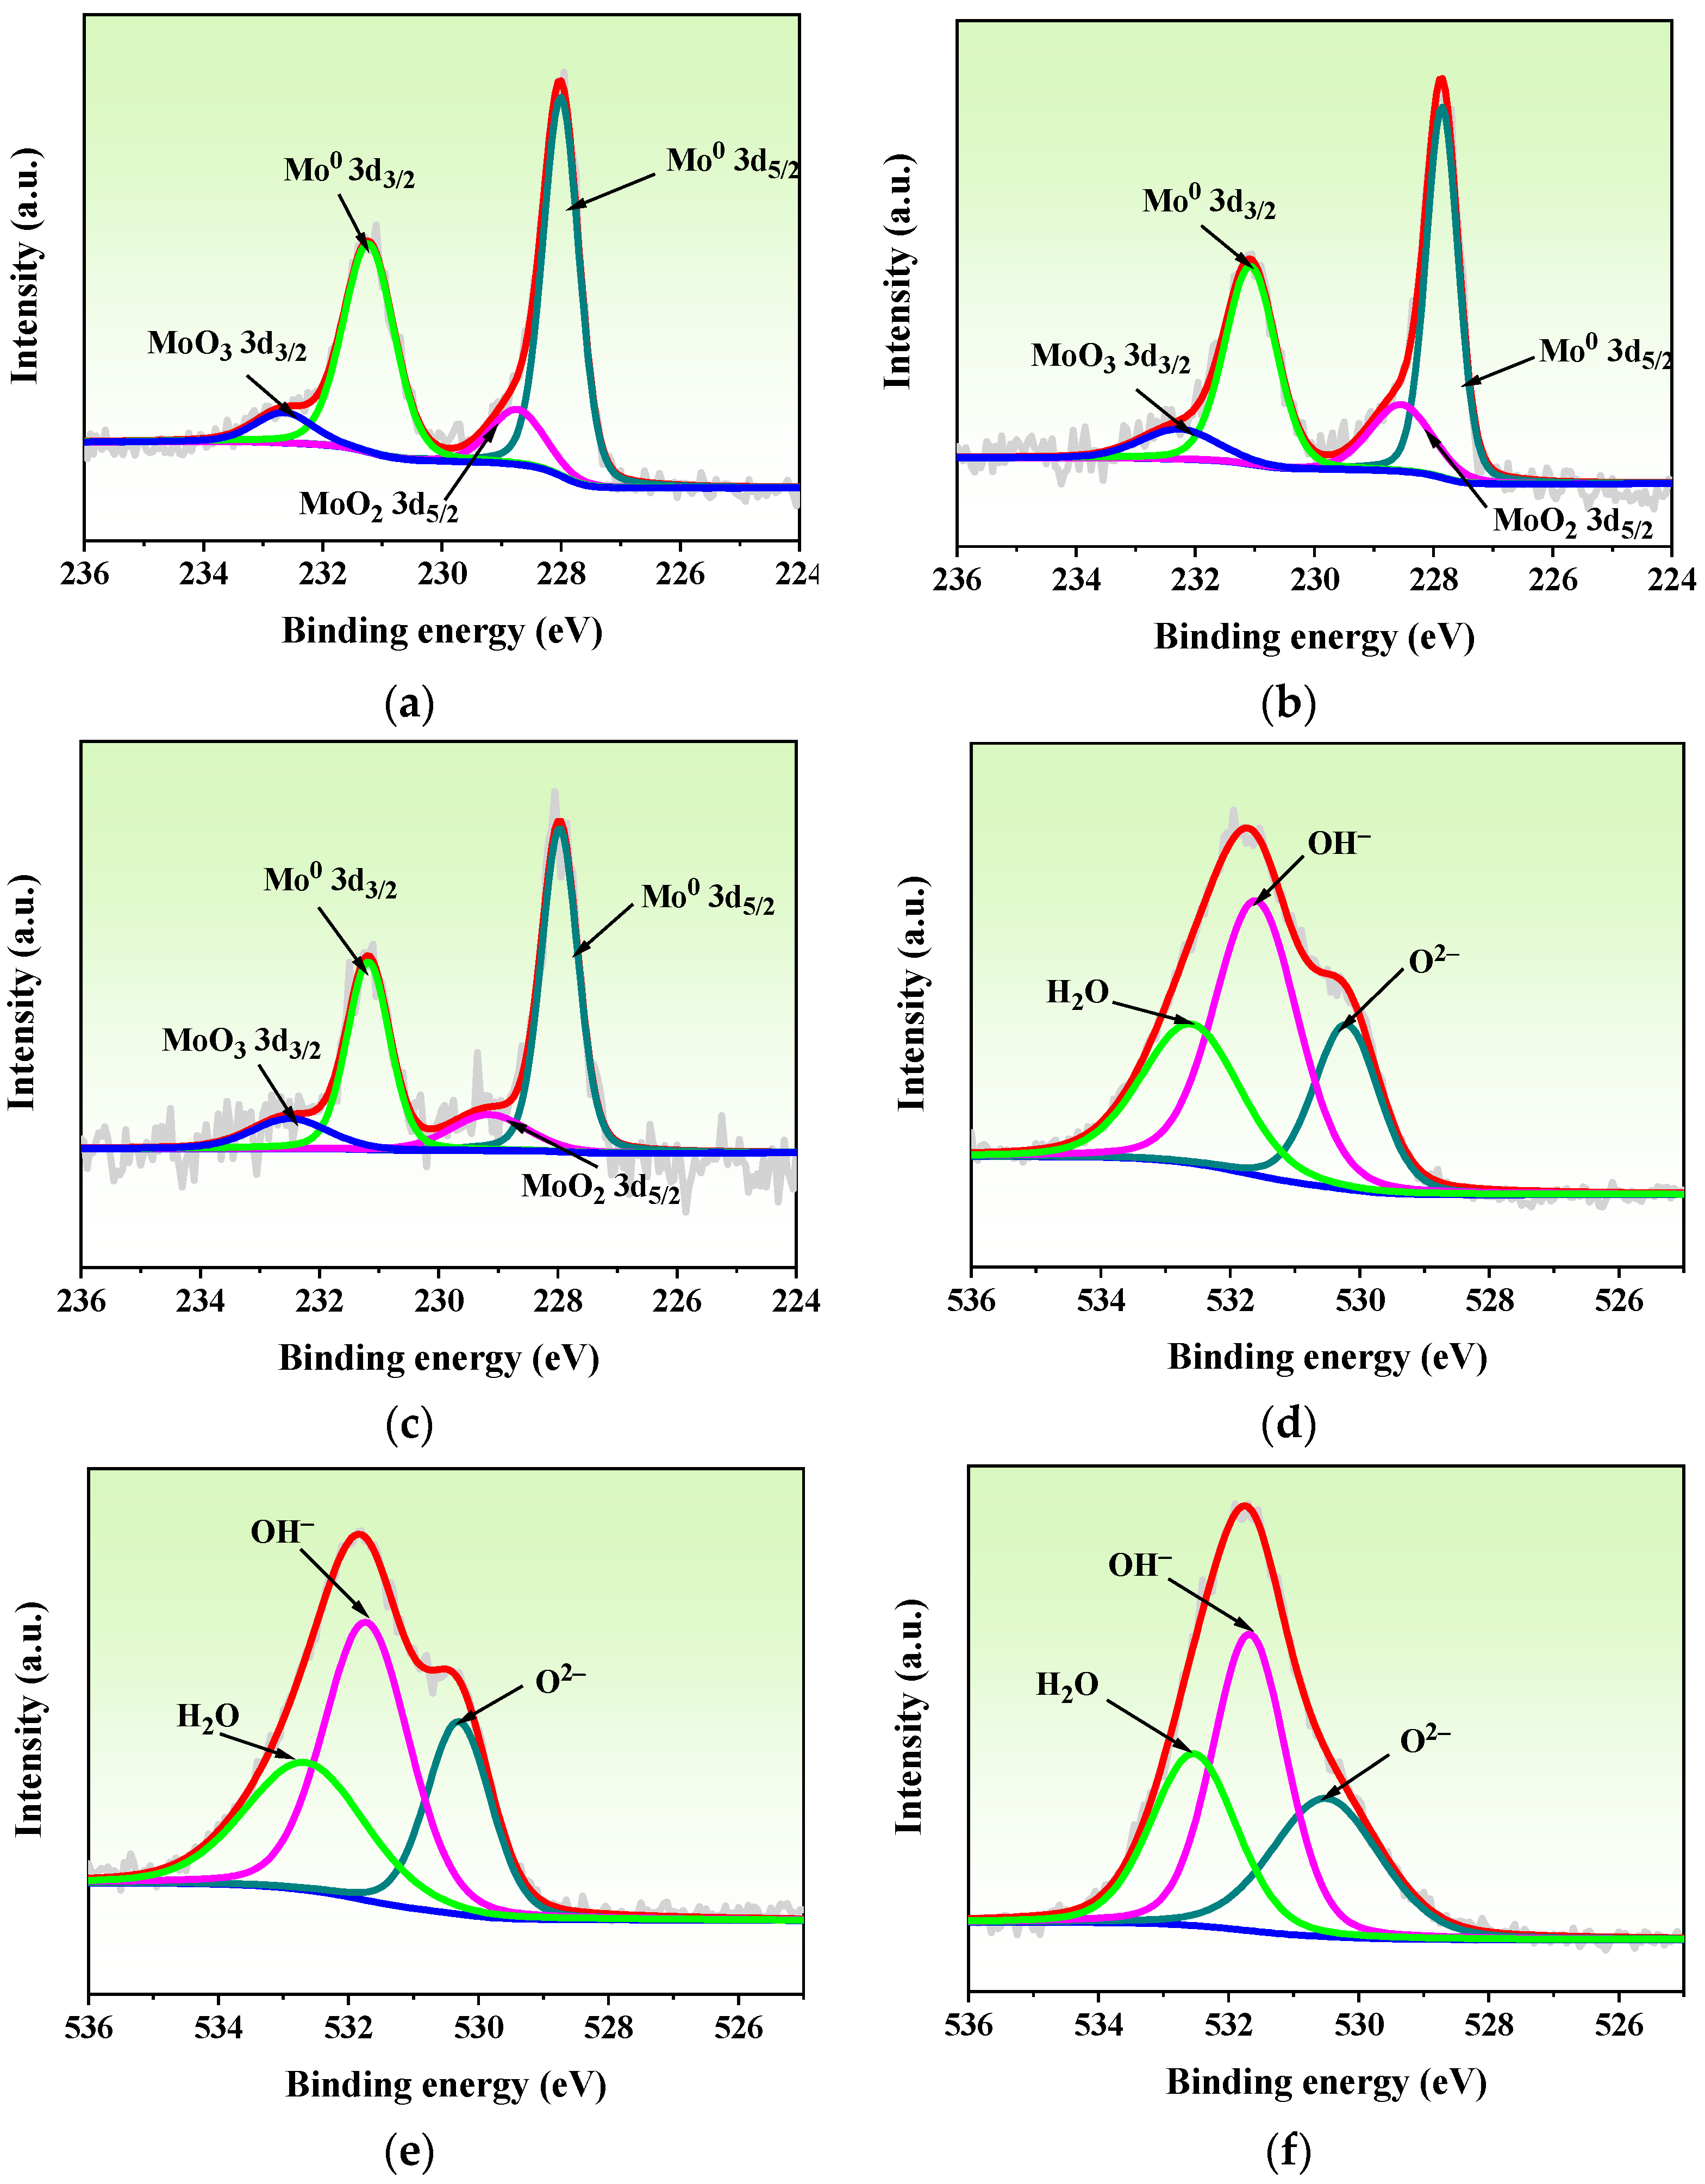
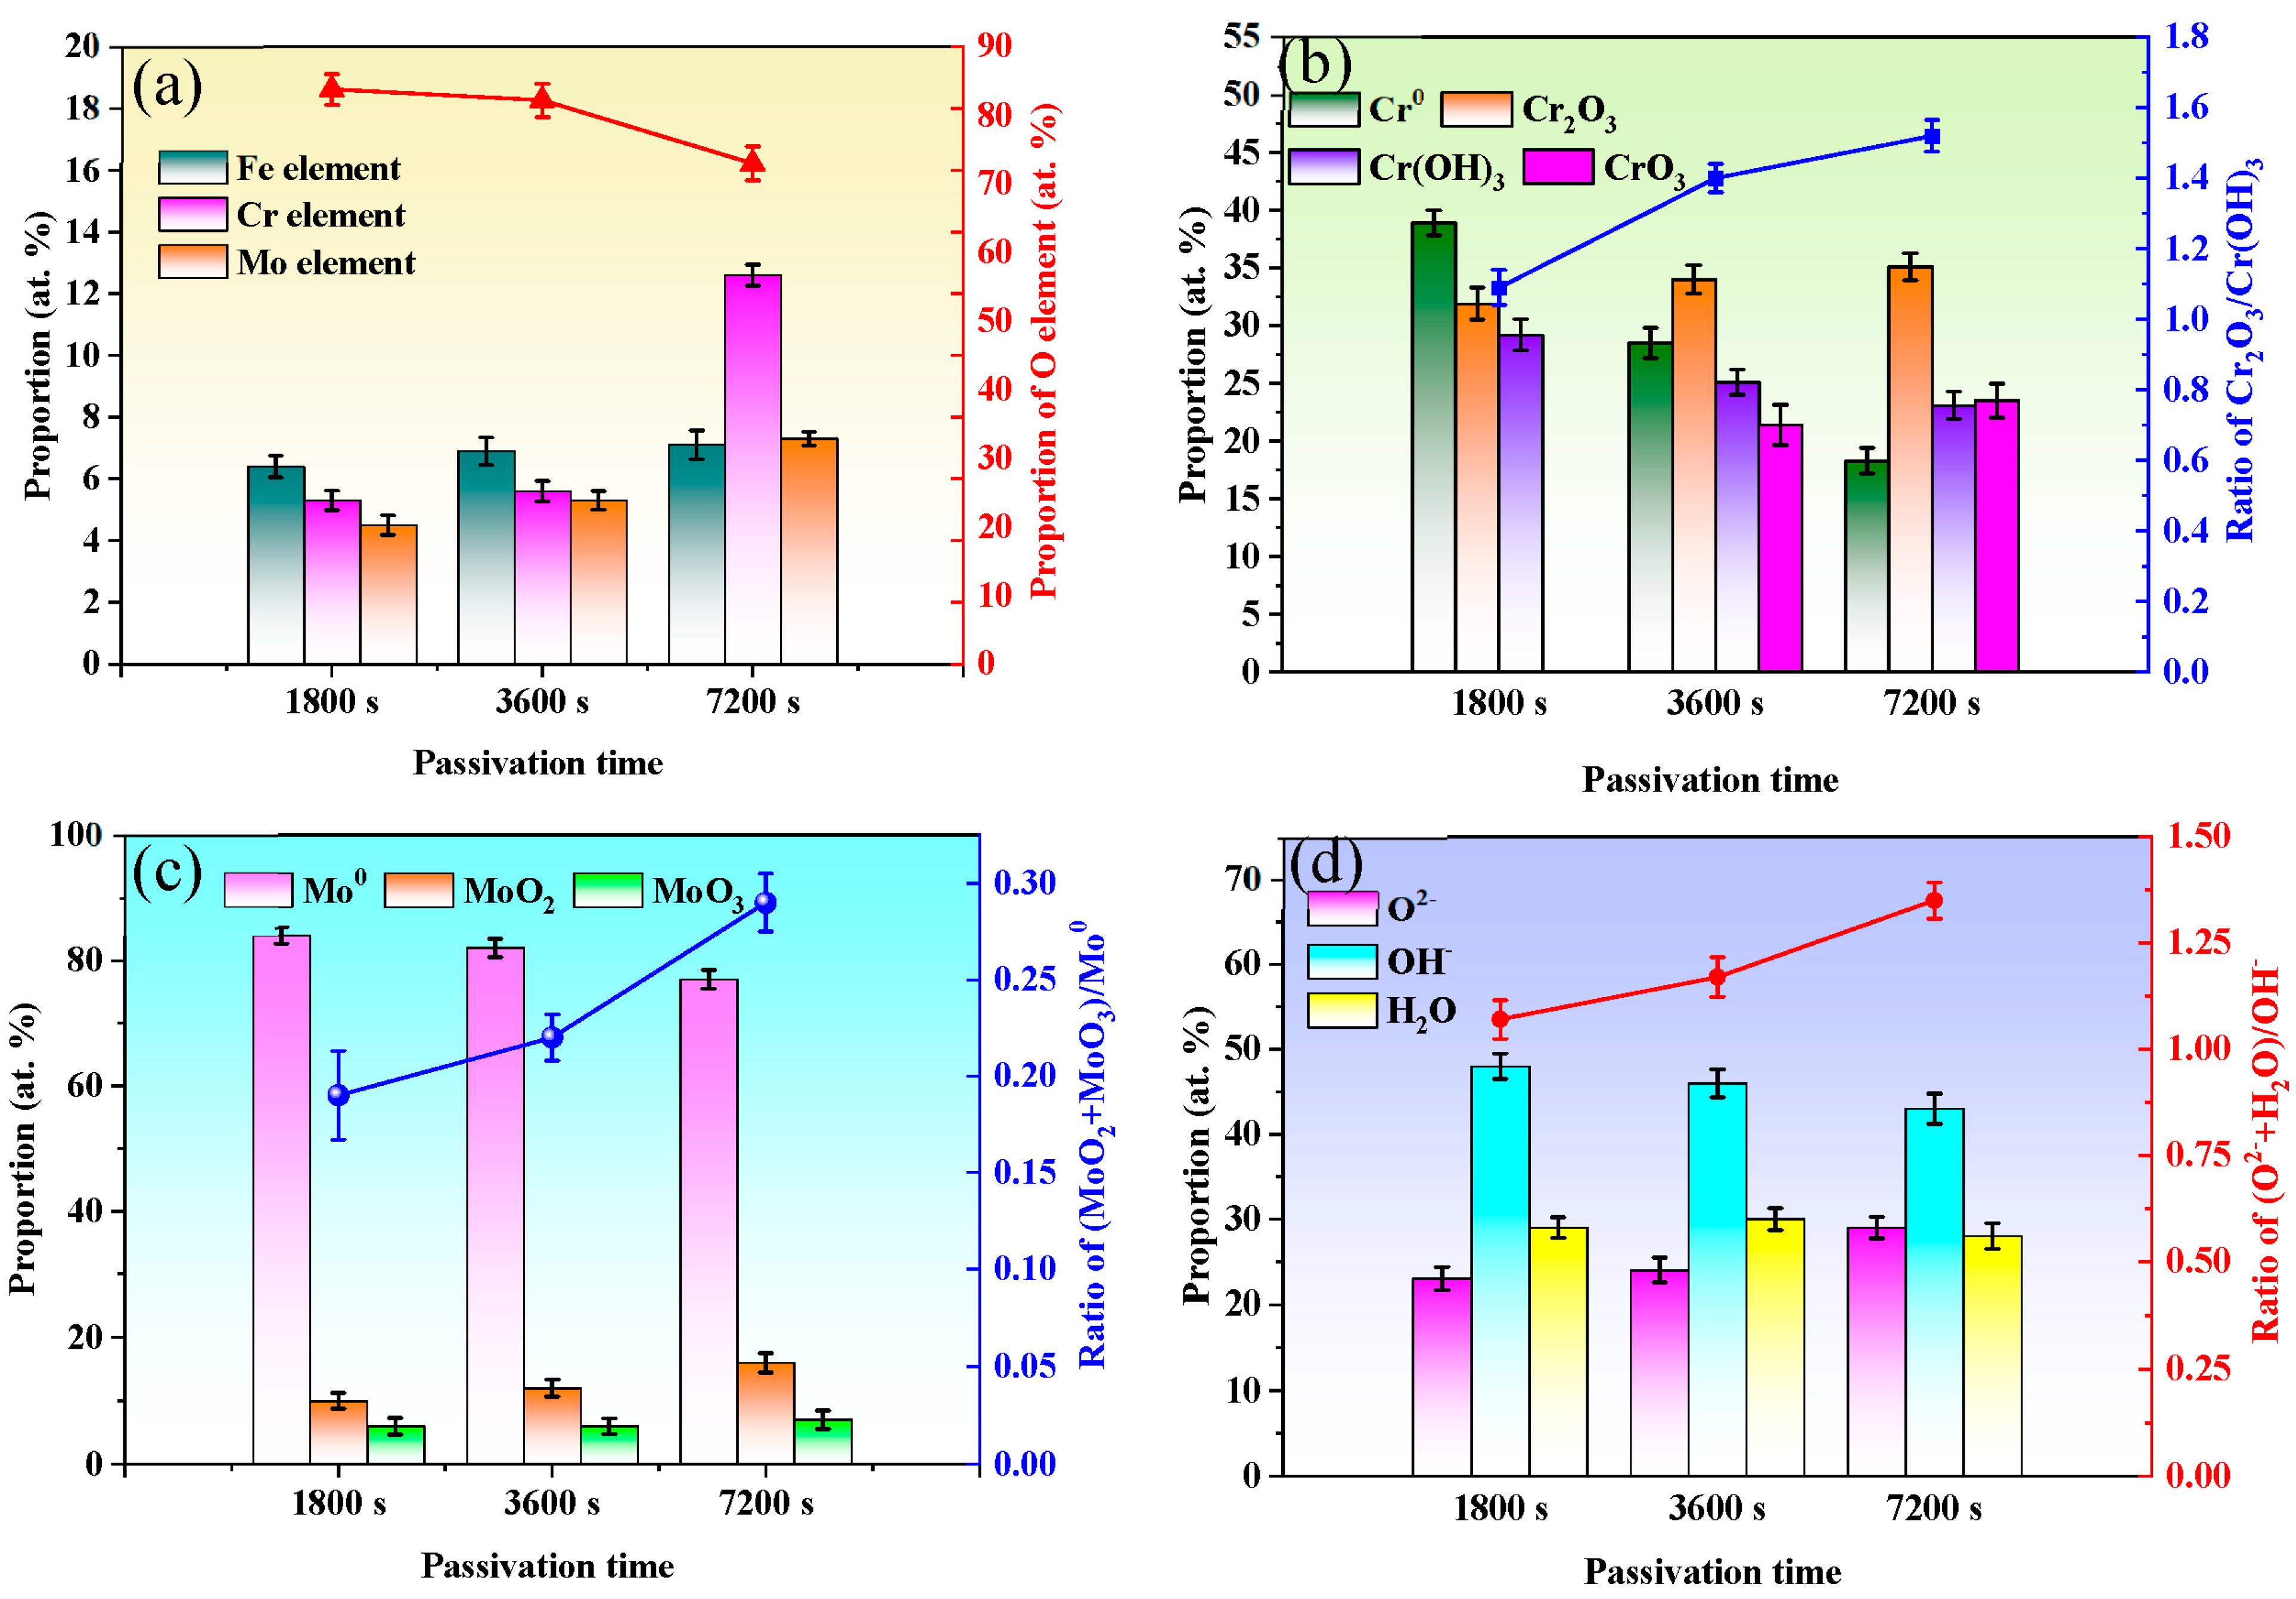
3.3. XPS Compositional Analysis

To deeply comprehend the impact of passivation time on the composition changes of passive film, high-resolution XPS simulation findings concerning Fe 2p3/2, Cr 2p3/2, Mo 3d and O 1s of Fe48Cr15Mo14C15B6Y2 amorphous coating surface after passivation for 1800, 3600 and 7200 s are illustrated in Figure 10 and Figure 11. As shown in Figure 10a,b, Fe 2p3/2 peaks at 1800 s and 3600 s are predominantly made up of the oxidation state species Fe2O3 (710.5 eV), FeOOH (711.2 eV) and satellite peak Fe2+ (713.0 eV). Extra FeO (709.1 eV) is apparent at 7200 s as indicated in Figure 10c. The primary elements of the Cr 2p3/2 spectra at 1800 s include metallic state Cr0 (574.3 eV), oxide Cr2O3 (576.3 eV), and hydroxide Cr(OH)3 (577.5 eV), as indicated in Figure 10d. Comparatively, the fourth valence state CrO3 (578.4 eV) susceptible to Cr is further detected after passivation for 3600 s and 7200 s as exhibited in Figure 10e,f. According to the peak separation outcomes for Mo 3d in the passive film at 1800, 3600 and 7200 s in Figure 11a–c, the metallic state Mo0 (Mo0 3d5/2–228.0 eV and Mo0 3d3/2 231.3 eV), oxidation states MoO2 (MoO2 3d5/2–228.8 eV), and MoO3 (MoO3 3d3/2–232.7 eV) are ascertained. Three valence states, namely O2-(530.4 eV), OH- (531.5 eV) and bounded water H2O (532.5 eV) can be determined from the signals of O 1s in Figure 9d–f at 1800, 3600, and 7200 s.
According to the sensitivity factor of each element and deconvoluted fitting peak area, the atomic proportion of the substances can be determined and illustrated in Figure 12. As demonstrated in Figure 12a, the elemental fractions of Fe, Cr, and Mo progressively grow whereas the element O decreases as time goes on. The Cr of passive film specifically approaches over 8 at.% at 7200 s and resembles pure Cr to achieve exceptional corrosion resistance. As revealed by EIS data and Mott–Schottky plots, film stability is effectively increased at 7200 s. This improvement can be attributed to a reduced proportion of Cr(OH)3 as time progresses, as shown in Figure 12b. It is supposed that hydroxides, which comprise the loose outer layer of passive film, are generally hydrophilic [34] with more penetrative diffusion holes that speed up the passage of additional electrolyte. On the other side, the associated Cr2O3 decreases as the inner barrier layer stays proportional to time as shown in Figure 12b. The ongoing thickening of the inner barrier oxides of bilayer passive film can ascribed to the dehydration reaction from Cr(OH)3 [48], which results in the sustained growth of insoluble Cr2O3:
2 Cr ( OH ) 3 Cr 2 O 3 + 3 H 2 O
Coexistent amorphous molecules xCr2O3·yCrO3 typically form thermodynamically due to their close values of standard free energy. Further, oxides such as Cr2O3 and CrO3 in the inner barrier oxides of the bilayer passive film contribute to the establishment of a space charge layer with a specific thickness [49,50].
As illustrated in Figure 12c, oxides of Mo increase steadily with time, and the appearance of Mo6+ in the film can upgrade the fabrication of inner barrier oxide Cr2O3, which is favorable in making the passive film sufficiently impenetrable due to the insoluble protective property of Cr2O3 [51]. The amount of OH- on the coated surface in Figure 12d decreases marginally, indicating that the outer oxides of passive film containing hydroxides with subpar performance have been reduced. On the other hand, the amount of bounded water stays steady, and as time passes, the oxidation valence of O2− shows a slow increase. The ability of bounded water to remove dissolved metal ions from metallic amorphous coatings and create fresh passive film has been demonstrated [42], thus facilitating the self-repairing capability of the film. OH will transform into H+ and H2O by a deportation reaction in the space charge layer, and thus H+ will migrate into the outer layer corresponding to the protective film [52,53]. As more metal ions and oxygen continue to infiltrate into the inner layer, more barrier oxides will be produced. Thus it is concluded that the film resistance to electrolytes is more stable as time passes.

3.4. Growth Model of Passive Film

The true passive film thickness d retrieved from the fitted capacitance value Qf in Table 2 can be calibrated by effective capacitance Qeff based on the power-law model proposed by Hirschorn [54]. To remove the temporal dispersion effect observed in EIS testing and documented in multiple investigations, effective capacitance Qeff should be introduced [39]. As a result, Equation (5) is used to determine Qeffv in order to validate the validity and correctness of EIS data [55]:
Q e f f = g Q f ( ρ δ ε ε 0 ) 1 n
where n is the fitting parameter in Table 3; g is a constant related to n, and the expression is g = 1 + 2.88 ( 1 n ) 2.375 [42]; ρ δ represents the resistivity; ε denotes the relative dielectric constant (15.6 for Fe-Cr based alloys [42]); and ε 0 stands for the vacuum dielectric constant (8.857 × 10⁻¹⁴ F·cm−1). Equation (5) provides the resistivity value at its maximum:
ρ δ , m = 1 2 π f m ε ε 0
where fm is the upper bound frequency of EIS measurement (10 kHz in this work). Therefore, the highest limit of Qeff,m can be represented as:
Q e f f , m = Q f g ( 2 π f m ) n 1
Consequently, the expression of passive film thickness d is calculated by the next equation [56]:
d = ε ε 0 A Q e f f , m
where A denotes the exposure area of the working electrode (1 cm2 in this work).
Figure 13 depicts the relationship between passive film resistance Rf and passive film thickness d as a function of passivation time t. It was discovered that film resistance is positively correlated with film thickness as time goes on. The simulated equations of growth trends of film resistance and thickness are determined as:
R f = 5.35 l n t + 235.65 29.55   ( k Ω · cm 2 )
d = 0.43 l n t + 52.06 2.1   ( nm )
It is obvious that the film grows in accordance with the law of logarithms between 0 and 7200 s, but the growth rate of film tends to remain constant over time. The passive film grows rapidly to 0.58 nm within the initial 600 s, and subsequently the formation rate slows down and film thickness gradually increases to 1.67 nm after passivation for 7200 s. The generated oxide species can fill the vacancy defects in the passive film, consequently blocking the charge diffusion channels. The dissolving process at the passive film/electrolyte interface slows down the growth procedure of passive film once the coated surface was fully covered by passive film in the later stage [49]. In order to better elucidate the growth law of passive film, it is essential to validate the passivation mechanism of the passive oxides.
Corrosion evolution behavior in relation to passive film is closely associated with several factors. Firstly, the continuous thickening and compositional evolution of passive film with passivation time can enhance the corrosion resistance. For this sort of coating, the outward diffusion of Y approaching the coating surface is promoted by the diffusion channels resulting from the dissolution of Fe, which may finally lead to the abundance of Y2O3 oxide on the passive film surface [57]. Furthermore, the additions of Cr, Mo and Y can reduce the corrosion activity of Fe and thus enhance resistance to pitting corrosion. Additionally, the dissolvable MoO24− in the passive film can ameliorate the selectivity of Fe transportation through the film and confront attacks from anions [58]. However, the initiation and penetration of corrosive medium through structural heterogeneities can gradually reduce the anti-corrosion capacity of the coating. Notably, the synergy of Cr- and Mo-depleted zones as indicated in Figure 2 will induce an occlusive effect near the narrow and deep pores, and the accumulation of anions in the defective pores can trigger the local failure of passive film [59]. Moreover, the destruction impact of anions can also accelerate the appearance and extension of small pores related to corrosion degradation [60].

3.5. Passivation Mechanisms of Passive Film

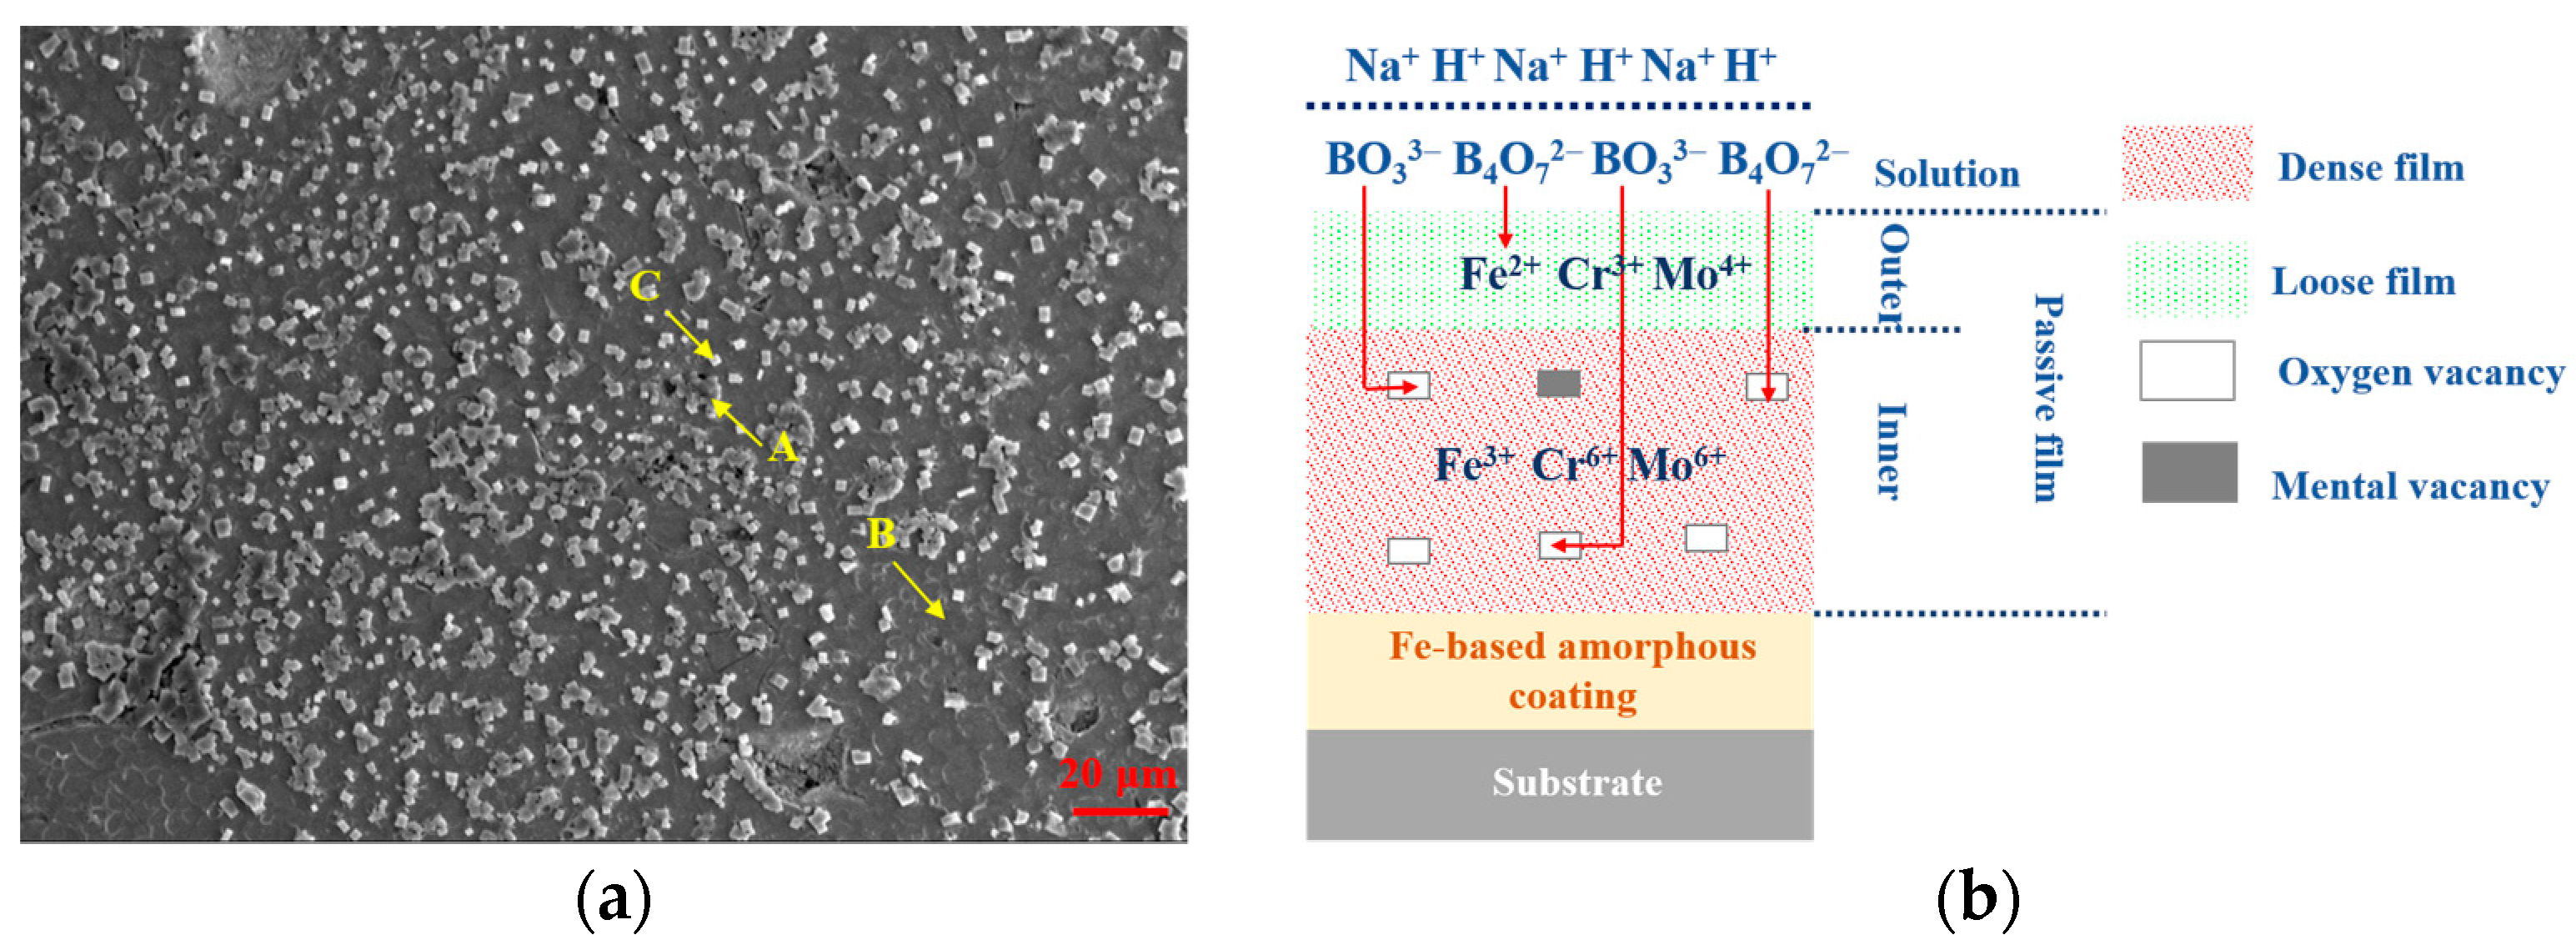
3.5.1. Mechanical Mixtures Adsorption process

Figure 14a presents the surface morphology of Fe48Cr15Mo14C15B6Y2 amorphous coating after 600 s of passivation, and Table 4 lists the relevant EDS analysis results for various positions. Massive granular solid products were discovered to be adsorbed on the coated surface. O accounts for a high fraction of the EDS results at 47.67 at.% at point A, with Na making up the second highest portion with a percentage of 26.76 at.% and Fe coming in third with 16.64 at.%. Meanwhile, the concentrations of Cr and Mo are both below 10 at.% at the same time. It is indicative that the adsorbate at point A may be made up of sodium borate crystals, trace metal oxides and oxygenated mechanical mixtures of iron.
According to the compositional EDS analysis of passive film in Table 4, the elemental contents of the grey film at point B are O-17.27 at.%, Cr-17.88 at.%, and Mo-12.14 at.%. The discrepancy in oxygen content from the nominal composition of the coating may cause corrosion attacks. The white particle at point C is predominantly composed of O—76.16 at.%—and Na—23.84 at.%—which can be confirmed as sodium borate crystals adsorbed on the coating surface since the atomic ratio of O/Na is approximately 7:2.
The schematic mechanism of the synthesis of mechanical mixtures during the initial passivation step is depicted in Figure 14b. Note that the passivation rate of the amorphous coating is significantly quick, causing a rapid growth of an extremely thin but protective layer. However, due to a strong interaction between metal atoms and anions such as BO33− and B4O72−, a large number of brittle mechanical mixtures are readily adsorbed on the film surface. Metal and oxygen vacancies will be filled by the anions from the corrosive medium [61]. It has been reported that mechanical mixtures have a tendency to expand to some extent, which can contribute to mechanical stress in the passive film, potential deformation and film rupture [62]. In addition, the microcracks in the film will encourage direct contact between the coated surface and the electrolyte, which will speed up the pace at which metal ions dissolve and lead to the creation of additional mechanical mixtures. It is predicted that numerous mechanical mixtures will quickly prevent the coating from self-repairing and may even start pitting corrosion. Moreover, the rate at which mechanical mixtures diffuse into the electrolyte is much higher than the rate at which metal cations form passive films without mechanical binding [63]. Hence, the mechanical mixtures on the adsorbed surface will continuously dissolve into the corrosive medium and lead to local exposure of the coating to electrolytes in the later passivation process.

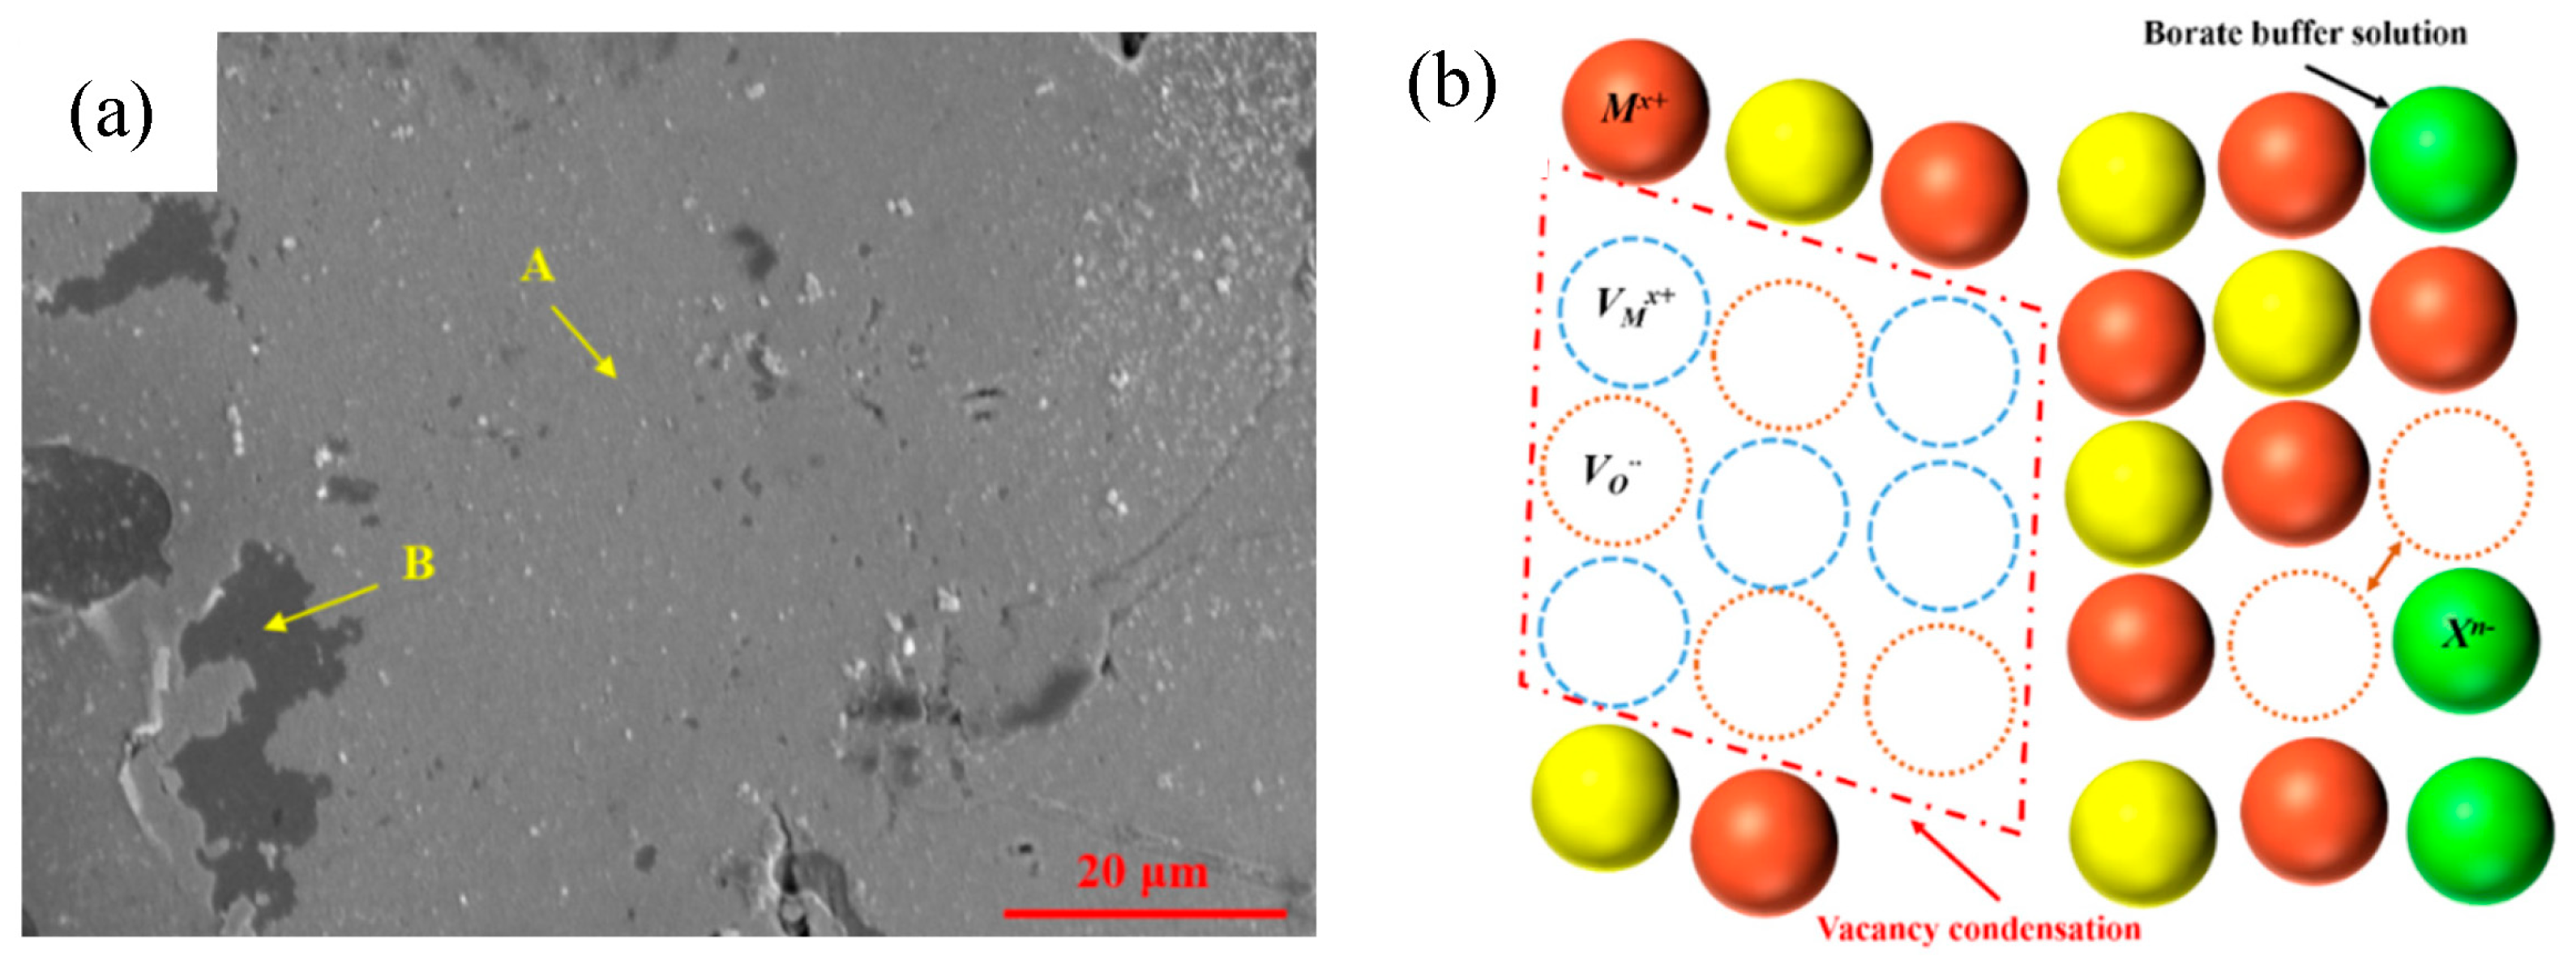
3.5.2. Cation Vacancy Condensation Process

The morphological observation of Fe48Cr15Mo14C15B6Y2 amorphous coating after passivation for 7200 s is illustrated in Figure 15a, with associated EDS results for various positions presented in Table 5. It is evident that the surface of the coated specimen is extensively shielded by grey passive film, leaving several areas exposed to electrolytes. Galvanic corrosion between the passive oxides and the amorphous coating matrix is prevented, since the chemical composition of passive film at point A in Table 5 approaches the nominal design of amorphous powder. As a consequence, the film’s resistance to corrosive medium is significantly increased as compared to the film passivated for 600 s. Due to a significant portion of 27.87 at.% oxygen at point B, the exposed coating surface is oxidized by corrosive media, and as a result, corrosion between the film and exposed coating surface may occur [64]. The mechanical mixtures initially adsorbed are completely dissolved into the electrolyte, and it is inferred that the exposed coated surface is associated with the local thinning of the oxidation film.
The vacancy condensation mechanism of passive film at 7200 s is depicted in Figure 15b. The vacancy accumulation mechanism is generally consistent with the film thickness stabilization trend shown in Figure 13. According to Equations (11a)–(12b), the cation vacancies are often forced to diffuse through the passive film due to a high electric field intensity and vacancy concentration gradient in the film [65]:
m M M + x 2 V Ö + x e
V Ö + H 2 O O O + 2 H +
m + V M x M M + V m + x e
M M M δ + a q + V M x + ( δ x ) e
where m represents the amorphous coating; M M denotes metal cation; V Ö symbolizes oxygen vacancy; O O means oxygen ion; V M x stands for metal cation vacancy; and Vm is metal vacancy. Note that oxygen vacancies are initiated at the coating/film interface but annihilated at the film/electrolyte interface, whereas metal cation vacancies are produced at the interface of film/electrolyte but consumed at the interface of coating/film [44].
In a potentiostatic testing scenario, the metal cation diffusion process, which triggers the dynamic growth process of the passive oxides, requires the incessant migration of structural flaws such as dislocations and vacancies in the metal oxides to counteract the condensation of cation vacancies [66]. However, an excessive number of cation vacancies will gather at the interface of coating/film as the electric field intensity is lowered by a thicker film. Additionally, it is commonly accepted that the severely flawed structure of oxides with discontinuous positions will prevent cation vacancies from moving through the passive oxides [67]. When the cation vacancies accumulate to a specific amount with a prolongation of time, these cation vacancies will evolve into exposed holes in the passive film [68] as shown in Figure 15b. In addition, the growth rate of passive oxides is also stabilized due to the cation vacancy accumulation effect, as confirmed in Figure 11.

3.5.3. AFM Topography of Film Surface

AFM topographies of passive films generated at 600 and 7200 s are shown in Figure 16. The film is seen to be clearly porous and severely faulty at 600 s, with apparent grain boundaries and the presence of a ball-shaped mechanical mixture normal to the coating surface. In contrast, the surface topography of passive film created at 7200 s contains several agglomerated mechanical mixtures and exposed holes. In particular, it is challenging to predict the grain size of passive oxides at 7200 s. However, the overall structure of the film passivated for 7200 s is more compact and denser. These results are highly consistent with SEM micrographs in Figure 14a and Figure 15a.

4. Conclusions

The time-dependent evolution behavior of passive film and the passivation mechanism for Fe48Cr15Mo14C15B6Y2 amorphous coating in borate buffer solution was investigated by electrochemical measurements, SEM, TEM, XRD, and AFM in combination with XPS testing. The conclusions are outlined as follows:
(1)
The resistance of Fe48Cr15Mo14C15B6Y2 amorphous coating in borate buffer solution to corrosive medium is significantly promoted with passivation time prolongation when verified by potentiostatic polarization testing.
(2)
Enhancement of self-repairing ability of passive film is attributed to a lower concentration of vacancies, more insoluble inner barrier oxides Cr2O3 and stable bounded water.
(3)
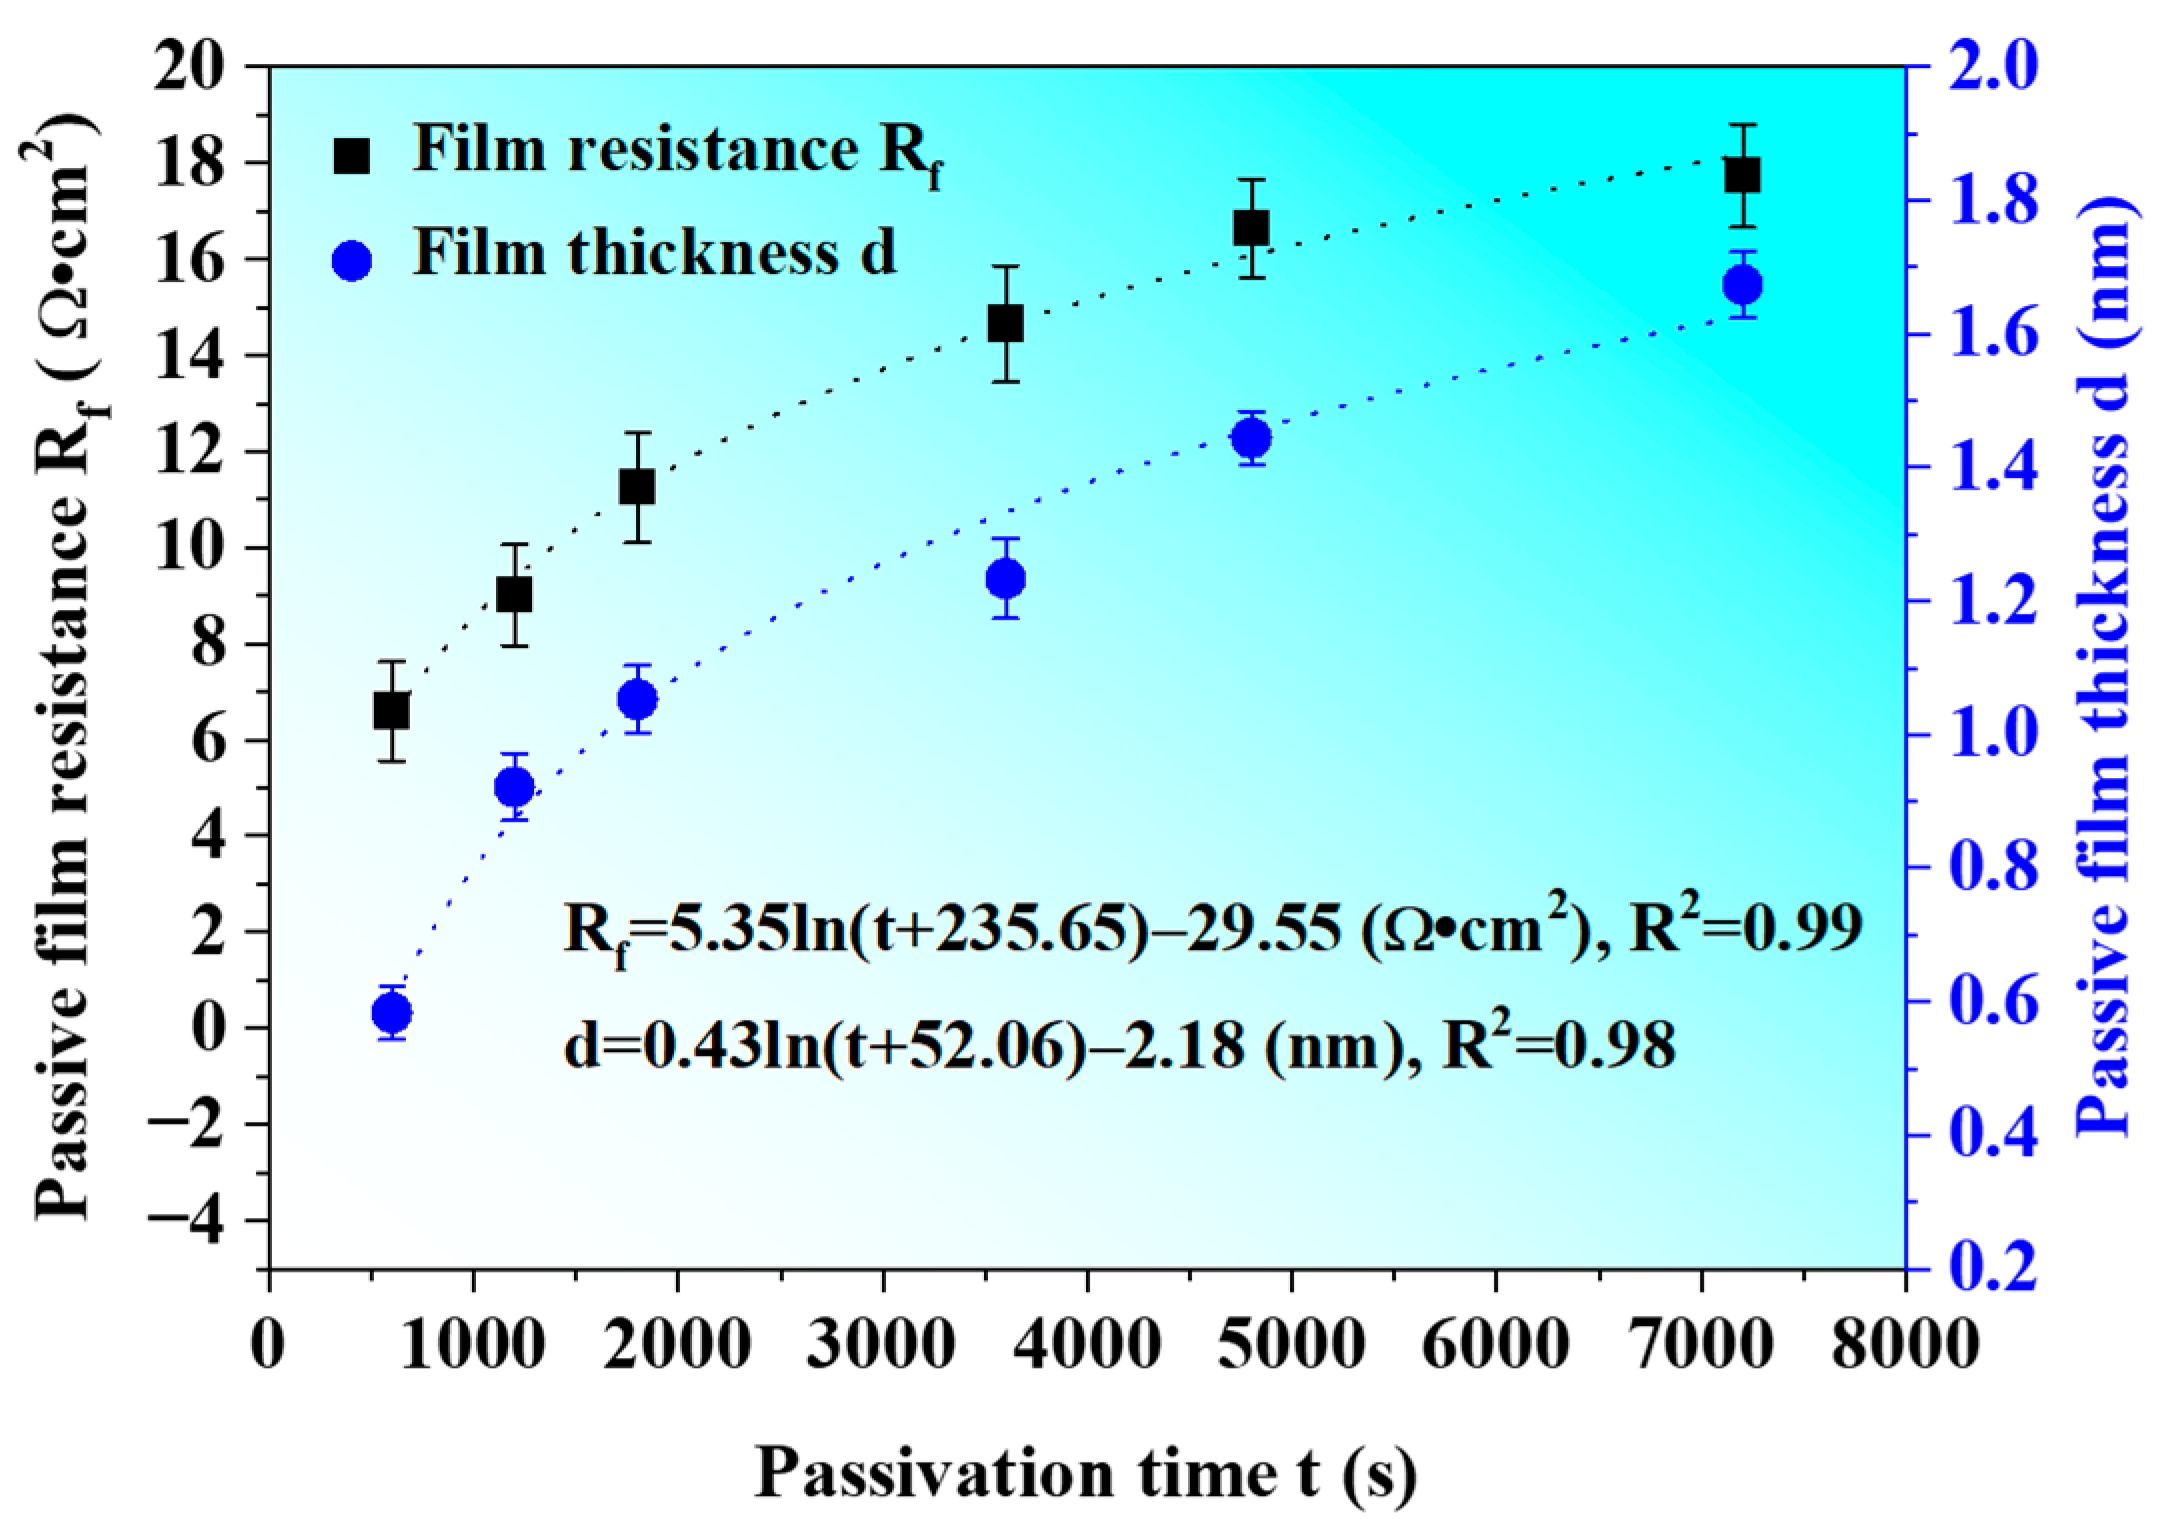
Based on the effective capacitance assumption, the association between the thickness of the passive film d and the passivation time t is as follows: d = 0.43 l n t + 52.06 2.18 (nm).
(4)
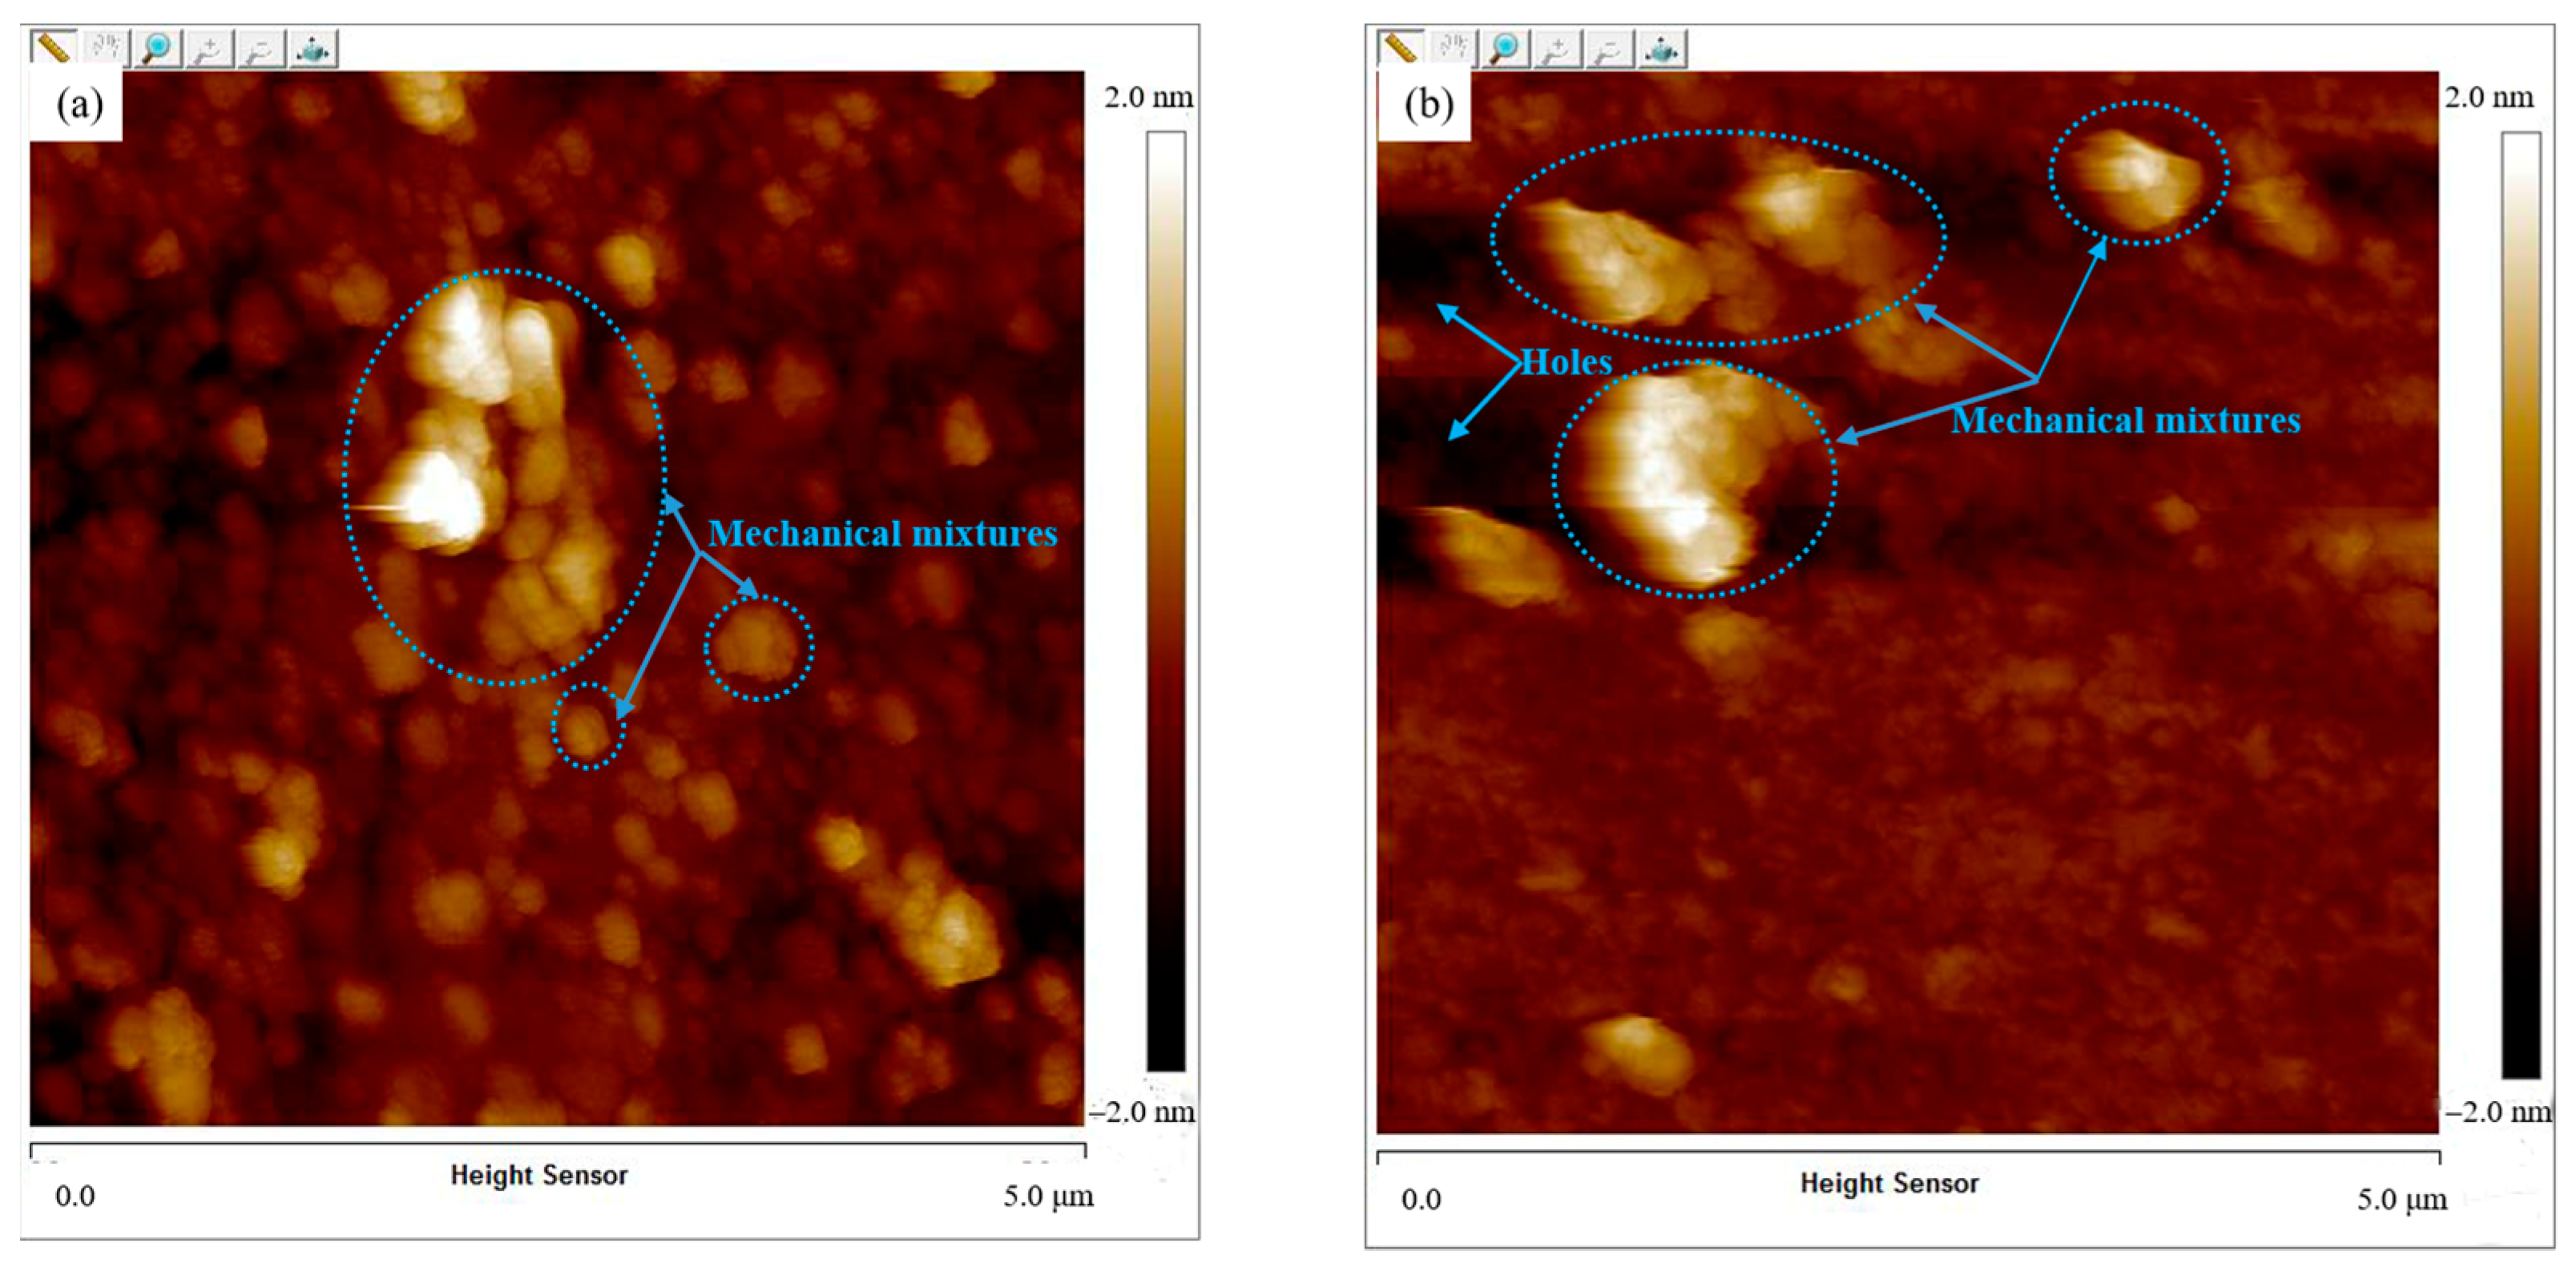
Mechanical mixtures are initially adsorbed on the coating surface along with volume expansion, stress initiation and passive film rupture. The cation vacancy condensation process will stabilize the growth trend of the passive oxides during the subsequent passivation process.

Author Contributions

Conceptualization, M.W. and Z.Z.; methodology, Y.Y.; software, X.Z.; validation, M.W., Y.Y. and X.Z.; formal analysis, M.W.; investigation, X.Z.; resources, Z.Z.; data curation, M.W.; writing—original draft preparation, M.W.; writing—review and editing, Z.Z.; visualization, M.W.; supervision, Y.Y.; project administration, M.W.; funding acquisition, Z.Z. All authors have read and agreed to the published version of the manuscript.

Funding

This research was funded by the National Natural Science Foundation of China grant number [No. 51379070].

Institutional Review Board Statement

Not applicable.

Informed Consent Statement

Not applicable.

Data Availability Statement

Not applicable.

Acknowledgments

Thanks are due to Zehua Wang (Hohai University, China) for his assistance with plasma spraying equipment.

Conflicts of Interest

The authors declare no conflict of interest.

References

  1. Zhang, H.R.; Wang, S.L.; Yang, X.L.; Hao, S.L.; Chen, Y.H.; Li, H.X.; Pan, D. Interfacial characteristic and microstructure of Fe-based amorphous coating on magnesium alloy. Surf. Coat. Technol. 2021, 425, 127659. [Google Scholar] [CrossRef]
  2. Li, G.; Gan, Y.Y.; Liu, C.H.; Shi, Y.; Zhao, Y.C.; Kou, S.Z. Corrosion and Wear Resistance of Fe-Based Amorphous Coatings. Coatings 2020, 10, 73. [Google Scholar] [CrossRef]
  3. Farmer, J.C.; Choi, J.S.; Saw, C.K.; Rebak, R.H.; Day, S.D.; Lian, T.; Hailey, P.D.; Payer, J.H.; Branagan, D.J.; Aprigliano, L.F. Corrosion Resistance of Amorphous Fe49.7Cr17.7Mn1.9Mo7.4W1.6B15.2C3.8Si2.4 Coating: A New Criticality Control Material. Nucl. Technol. 2008, 161, 169–189. [Google Scholar] [CrossRef]
  4. Askandarani, A.; Hashmi, M.S.J.; Yilbas, B.S. Arc Spraying of Nanostructured Wires on Steel Surfaces: Influence of Coating Thickness on Microstructure and Fracture Toughness. Adv. Mater. Res. 2012, 445, 803–808. [Google Scholar] [CrossRef]
  5. Branagan, D.J.; Breitsameter, M.; Meacham, B.E.; Belashchenko, V. High-Performance Nanoscale Composite Coatings for Boiler Applications. J. Therm. Spray Technol. 2005, 14, 196–204. [Google Scholar] [CrossRef]
  6. Daroonparvar, M.; Yajid, M.A.M.; Yusof, N.M.; Bakhsheshi-Rad, H.R.; Hamzah, E. Microstructural characterisation of air plasma sprayed nanostructure ceramic coatings on Mg-1%Ca alloys (bonded by NiCoCrAlYTa alloy). Ceram. Int. 2016, 42, 357–371. [Google Scholar] [CrossRef]
  7. Heimann, R.B. The Nature of Plasma Spraying. Coatings 2023, 13, 622. [Google Scholar] [CrossRef]
  8. Sampath, S.; Herman, H. Rapid solidification and microstructure development during plasma spray deposition. J. Therm. Spray Technol. 1996, 5, 445–456. [Google Scholar] [CrossRef]
  9. Guo, R.Q.; Zhang, C.; Yang, Y.; Peng, Y.; Liu, L. Corrosion and wear resistance of a Fe-based amorphous coating in underground environment. Intermetallics 2012, 30, 94–99. [Google Scholar] [CrossRef]
  10. Koga, G.Y.; Junior, A.M.J.; Roche, V.; Nogueira, R.P.; Schulz, R.; Savoie, S.; Melle, A.K.; Loable, C.; Bolfarini, C.; Kiminami, C.S.; et al. Production and Corrosion Resistance of Thermally Sprayed Fe-Based Amorphous Coatings from Mechanically Milled Feedstock Powders. Metall. Mater. Trans. A 2018, 49, 4860–4870. [Google Scholar] [CrossRef]
  11. Baron, A.; Szewieczek, D.; Nawrat, G. Corrosion of amorphous and nanocrystalline Fe-based alloys and its influence on their magnetic behavior. Electrochim. Acta 2007, 52, 5690–5695. [Google Scholar] [CrossRef]
  12. Zhang, C.; Cha, K.C.; Wu, Y.; Liu, L. Pitting initiation in Fe-based amorphous coatings. Acta Mater. 2012, 60, 4152–4159. [Google Scholar] [CrossRef]
  13. Li, B.S.; Lin, A.; Wu, X.; Zhang, Y.M.; Gan, F.X. Electrodeposition and characterization of Fe-Cr-P amorphous alloys from trivalent chromium sulfate electrolyte. J. Alloys Compd. 2008, 453, 93–101. [Google Scholar] [CrossRef]
  14. Franco, V.; Conde, C.F.; Conde, A.; Kiss, L.F. Enhanced magnetocaloric response in Cr/Mo containing Nanoperm-type amorphous alloys. Appl. Phys. Lett. 2007, 90, 395–524. [Google Scholar] [CrossRef]
  15. Zhang, S.D.; Zhang, W.L.; Wang, S.G.; Gu, X.J.; Wang, J.Q. Characterisation of three-dimensional porosity in an Fe-based amorphous coating and its correlation with corrosion behavior. Corros. Sci. 2019, 93, 211–221. [Google Scholar] [CrossRef]
  16. Sadeghi, E.; Joshi, S. Chlorine-induced high-temperature corrosion and erosion-corrosion of HVAF and HVOF-sprayed amorphous Fe-based coatings. Surf. Coat. Technol. 2019, 371, 20–35. [Google Scholar] [CrossRef]
  17. Tsuchiya, H.; Fujimoto, S.; Shibata, T. Semiconductive behavior of passive films formed on Fe-Cr alloy. J. Electrochem. Soc. 2006, 16, 49–54. [Google Scholar] [CrossRef]
  18. Toledo-Matos, L.A.; Pech-Canul, M.A. Evolution of an iron passive film in a borate buffer solution (pH 8.4). J. Solid State Electrochem. 2011, 15, 1927–1934. [Google Scholar] [CrossRef]
  19. Kouisni, L.; Azzi, M.; Dalard, F.; Maximovitch, S. Phosphate coatings on magnesium alloy AM60: Part 2: Electrochemical behaviour in borate buffer solution. Surf. Coat. Technol. 2005, 192, 239–246. [Google Scholar]
  20. Hamadou, L.; Kadri, A.; Benbrahim, N. Characterisation of passive films formed on low carbon steel in borate buffer solution (pH 9.2) by electrochemical impedance spectroscopy. Appl. Surf. Sci. 2005, 252, 1510–1519. [Google Scholar] [CrossRef]
  21. Zhou, Z.; Wang, L.; Wang, F.C.; Zhang, H.F.; Liu, Y.B.; Xu, S.H. Formation and corrosion behavior of Fe-based amorphous metallic coatings by HVOF thermal spraying. Surf. Coat. Technol. 2009, 204, 563–570. [Google Scholar] [CrossRef]
  22. Guo, H.; Wu, N.C.; Zhang, Y.L.; Zhang, S.D.; Sun, W.H.; Wang, J.Q. Influence of coating thickness on the impact damage mode in Fe-based amorphous coatings. Surf. Coat. Technol. 2020, 390, 125650. [Google Scholar] [CrossRef]
  23. Movahedi, B.; Enayati, M.H.; Wong, C.C. Structural and Thermal Behavior of Fe-Cr-Mo-P-B-C-Si Amorphous and Nanocrystalline HVOF Coatings. J. Therm. Spray Technol. 2010, 19, 1093–1099. [Google Scholar] [CrossRef]
  24. Tillmann, W.; Khalil, O.; Baumann, I. Influence of Direct Splat-Affecting Parameters on the Splat-Type Distribution, Porosity, and Density of Segmentation Cracks in Plasma-Sprayed YSZ Coatings. J. Therm. Spray Technol. 2021, 30, 1015–1027. [Google Scholar] [CrossRef]
  25. Anupam, A.; Kottada, R.S.; Kashyap, S.; Meghwal, A.; Murty, B.S.; Berndt, C.C.; Ang, A.S.M. Understanding the Microstructural Evolution of High Entropy Alloy Coatings Manufactured by Atmospheric Plasma Spray Processing. Appl. Surf. Sci. 2020, 505, 144117. [Google Scholar] [CrossRef]
  26. Hoshiyama, Y.; Miyazaki, T.; Miyake, H. Zirconium carbide dispersed high Cr-Ni cast iron produced by plasma spraying. Surf. Coat. Technol. 2017, 228, S7–S10. [Google Scholar] [CrossRef]
  27. Vardelle, M.; Vardelle, A.; Leger, A.C.; Fauchais, P.; Gobin, D. Influence of particle parameters at impact on splat formation and solidification in plasma spraying processes. J. Therm. Spray Technol. 1995, 4, 50–58. [Google Scholar] [CrossRef]
  28. Shinoda, K.; Koseki, T.; Yoshida, T. Influence of impact parameters of zirconia droplets on splat formation and morphology in plasma spraying. J. Appl. Phys. 2006, 100, 074903. [Google Scholar] [CrossRef]
  29. Lin, T.J.; Sheu, H.H.; Lee, C.Y.; Lee, H.B. The study of mechanical properties and corrosion behavior of the Fe-based amorphous alloy coatings using high velocity oxygen fuel spraying. J. Alloys Compd. 2021, 867, 159132. [Google Scholar] [CrossRef]
  30. Zhou, S.F.; Yang, J.J.; Deng, C.; Jin, J.B.; Hu, L.X.; Lu, Y. Amorphous alloy reinforced Cu-based immiscible coatings by laser melting deposition: Separation mechanism and corrosion behavior. Mater. Des. 2023, 229, 111898. [Google Scholar] [CrossRef]
  31. Huang, B.; Zhang, C.; Zhang, G.; Liao, H.L. Wear and corrosion resistant performance of thermal-sprayed Fe-based amorphous coatings: A review. Surf. Coat. Technol. 2019, 377, 124896. [Google Scholar] [CrossRef]
  32. Inoue, A.; Kong, F.L.; Han, Y.; Zhu, S.L.; Churyumov, A.; Shalaan, E.; Al-Marzouki, F. Development and application of Fe-based soft magnetic bulk metallic glassy inductors. J. Alloys Compd. 2018, 731, 1303–1309. [Google Scholar] [CrossRef]
  33. Zhou, Z.; Wang, L.; He, D.Y.; Wang, F.C.; Liu, Y.B. Microstructure and Electrochemical Behavior of Fe-Based Amorphous Metallic Coatings Fabricated by Atmospheric Plasma Spraying. J. Therm. Spray Technol. 2011, 20, 344–350. [Google Scholar] [CrossRef]
  34. Wang, L.; Jiang, S.L.; Zheng, Y.G.; Ke, W.; Sun, W.H.; Wang, J.Q. Effect of porosity sealing treatments on the corrosion resistance of high-velocity oxy-fuel (HVOF)-sprayed Fe-based amorphous metallic coatings. Surf. Coat. Technol. 2011, 206, 1307–1318. [Google Scholar] [CrossRef]
  35. Li, Y.C.; Zhang, W.W.; Wang, Y.; Zhang, X.Y.; Sun, L.L. Effect of spray powder particle size on the bionic hydrophobic structures and corrosion performance of Fe-based amorphous metallic coatings. Surf. Coat. Technol. 2022, 437, 128377. [Google Scholar] [CrossRef]
  36. Gao, M.H.; Lu, W.Y.; Yang, B.J.; Zhang, S.D.; Wang, J.Q. High corrosion and wear resistance of Al-based amorphous metallic coating synthesized by HVAF spraying. J. Alloys Compd. 2018, 735, 1363–1373. [Google Scholar] [CrossRef]
  37. Kang, Y.H.; Chen, Y.M.; Wen, Y.X.; Wu, B.; Song, M.B. Effects of structural relaxation and crystallization on the corrosion resistance of an Fe-based amorphous coating. J. Non-Cryst. Solids. 2020, 550, 120378. [Google Scholar] [CrossRef]
  38. Wang, H.Z.; Cheng, Y.H.; Yang, J.Y.; Wang, Q.Q. Influence of laser remelting on organization, mechanical properties and corrosion resistance of Fe-based amorphous composite coating. Surf. Coat. Technol. 2021, 414, 127081. [Google Scholar] [CrossRef]
  39. Zhai, H.M.; Yuan, H.Y.; Li, W.S.; Zhang, X.J.; Li, X.S.; Cai, A.H. Corrosion resistance mechanisms of detonation sprayed Fe-based amorphous coating on AZ31B magnesium alloy. J. Non-Cryst. Solids 2022, 576, 121276. [Google Scholar] [CrossRef]
  40. Zhu, M.; Zhang, Q.; Yuan, Y.F.; Guo, S.Y.; Chen, Y.B. Study on the Microstructure and Alternating Current Corrosion Behavior of SAF2507 Super-Duplex Stainless Steel in 3.5% NaCl Solution. J. Mater. Eng. Perform. 2020, 29, 1366–1374. [Google Scholar] [CrossRef]
  41. Wang, M.Q.; Zhou, Z.H.; Wang, Q.J.; Wang, Z.H.; Zhang, X.; Liu, Y.Y. Role of passive film in dominating the electrochemical corrosion behavior of FeCrMoCBY amorphous coating. J. Alloys Compd. 2019, 811, 151962. [Google Scholar] [CrossRef]
  42. Wang, M.Q.; Zhou, Z.H.; Wang, Q.J.; Wu, L.T.; Zhang, X.; Wang, Z.H. Long term semiconducting and passive film properties of a novel dense FeCrMoCBY amorphous coating by atmospheric plasma spraying. Appl. Surf. Sci. 2019, 495, 143600. [Google Scholar] [CrossRef]
  43. Cheng, Y.F.; Luo, J.L. A comparison of the pitting susceptibility and semiconducting properties of the passive films on carbon steel in chromate and bicarbonate solutions. Appl. Surf. Sci. 2000, 167, 113–121. [Google Scholar] [CrossRef]
  44. Cheng, Y.F.; Luo, J.L. Electronic structure and pitting susceptibility of passive film on carbon steel. Electrochim. Acta 1999, 44, 2947–2957. [Google Scholar] [CrossRef]
  45. Lavigne, O.; Alemany-Dumont, C.; Normand, B.; Delichère, P.; Descamps, A. Cerium insertion in 316L passive film: Effect on conductivity and corrosion resistance performances of metallic bipolar plates for PEM fuel cell application. Surf. Coat. Technol. 2010, 205, 1870–1877. [Google Scholar] [CrossRef]
  46. Yamamoto, T.; Fushimi, K.; Seo, M.; Tsuri, S.; Adachi, T.; Habazaki, H. Depassivation-repassivation behavior of type-312L stainless steel in NaCl solution investigated by the micro-indentation. Corros. Sci. 2009, 51, 1545–1553. [Google Scholar] [CrossRef]
  47. Mao, F.X.; Yao, J.Z.; Zhou, Y.T.; Dong, C.F.; Kursten, B.; Macdonald, D.D. Determining the electric-field strength in a passive film via photo-induced electric fields. Corros. Sci. 2019, 154, 239–245. [Google Scholar] [CrossRef]
  48. Fukugaichi, S.; Tomosugi, Y.; Aono, H. Facile synthesis of hydrophilic layered double hydroxide film on aluminum plate. Inorg. Chem. Commun. 2022, 142, 109647. [Google Scholar] [CrossRef]
  49. Ju, P.F.; Zuo, Y.; Tang, T.M.; Zhao, X.H. The enhanced passivation of 316L stainless steel in a simulated fuel cell environment by surface plating with palladium. Corros. Sci. 2013, 66, 330–336. [Google Scholar] [CrossRef]
  50. König, U.; Schultze, J.W. The examination of the influence of a space-charge layer on the formation kinetics of thin passive films by Schottky-Mott analysis. Solid State Ionics 1992, 53, 255–264. [Google Scholar] [CrossRef]
  51. Zamani, P.; Valefi, Z.; Jafarzadeh, K. Comprehensive study on corrosion protection properties of Al2O3, Cr2O3 and Al2O3-Cr2O3 ceramic coatings deposited by plasma spraying on carbon steel. Ceram. Int. 2022, 48, 1574–1588. [Google Scholar] [CrossRef]
  52. Fernandez-Domene, R.M.; Blasco-Tamarit, E.; Garcia-Garcia, D.M.; Garcia-Anton, J. Passive and transpassive behaviour of Alloy 31 in a heavy brine LiBr solution. Electrochim. Acta 2013, 95, 1–11. [Google Scholar] [CrossRef]
  53. BenSalah, M.; Sabot, R.; Triki, E.; Dhouibi, L.; Refait, P.; Jeannin, M. Passivity of Sanicro28 (UNS N-08028) stainless steel in polluted phosphoric acid at different temperatures studied by electrochemical impedance spectroscopy and Mott-Schottky analysis. Corros. Sci. 2014, 86, 61–70. [Google Scholar] [CrossRef]
  54. Hirschorn, B.; Orazem, M.E.; Tribollet, B.; Vivier, V.; Frateur, I.; Musiani, M. Constant-Phase-Element Behavior Caused by Resistivity Distributions in Films I. Theory. J. Electrochem. Soc. 2010, 157, C452. [Google Scholar] [CrossRef]
  55. Benoit, M.; Bataillon, C.; Gwinner, B.; Miserque, F.; Orazem, M.E.; Sánchez-Sánchez, C.M.; Tribollet, B.; Vivier, V. Comparison of different methods for measuring the passive film thickness on metals. Electrochim. Acta 2016, 201, 340–347. [Google Scholar] [CrossRef]
  56. Fujimoto, S.; Kawachi, S.; Nishio, T.; Shibata, T. Impedance and photoelectrochemical properties of porous oxide film on Type304 stainless steel formed by square wave potential pulse polarization. J. Electroanal. Chem. 1999, 473, 265–271. [Google Scholar] [CrossRef]
  57. Liu, L.; Zhang, C. Fe-based amorphous coatings: Structures and properties. Thin Solid Films 2014, 561, 70–86. [Google Scholar] [CrossRef]
  58. Tian, W.P.; Yang, H.W.; Zhang, S.D. Synergistic Effect of Mo, W, Mn and Cr on the Passivation Behavior of a Fe-Based Amorphous Alloy Coating. Acta Metall. Sin. Engl. Lett. 2018, 31, 308–320. [Google Scholar] [CrossRef]
  59. Zhang, S.D.; Wu, J.; Qi, W.B.; Wang, J.Q. Effect of porosity defects on the long-term corrosion behaviour of Fe-based amorphous alloy coated mild steel. Corros. Sci. 2016, 110, 57–70. [Google Scholar] [CrossRef]
  60. Zhang, J.F.; Deng, C.M.; Song, J.B.; Deng, C.G.; Liu, M.; Dai, M.J. Electrochemical Corrosive Behaviors of Fe-Based Amorphous/ Nanocrystalline Coating on Stainless Steel Prepared by HVOF-Sprayed. Coatings 2019, 9, 226. [Google Scholar] [CrossRef]
  61. Narayanan, R.; Seshadri, S.K. Point defect model and corrosion of anodic oxide coatings on Ti-6Al-4V. Corros. Sci. 2008, 50, 1521–1529. [Google Scholar] [CrossRef]
  62. Zheng, S.J.; Cai, Z.B.; Pu, J.P.; Zeng, C.; Wang, L.P. Passivation behavior of VAlTiCrSi amorphous high-entropy alloy film with a high corrosion-resistance in artificial sea water. Appl. Surf. Sci. 2021, 542, 148520. [Google Scholar] [CrossRef]
  63. Park, K.J.; Ahn, S.J.; Kwon, H.S. Effects of solution temperature on the kinetic nature of passive film on Ni. Electrochim. Acta 2012, 56, 1662–1669. [Google Scholar] [CrossRef]
  64. Yang, H.; Wang, Y.Q.; Wang, H.; Jia, Q.X. Oxygen concentration and its effect on the leakage current in BiFeO3 thin films. Appl. Phys. Lett. 2010, 96, 1719. [Google Scholar] [CrossRef]
  65. Macdonald, D.D. The history of the point defect model for the passive state: A brief review of film growth aspects. Electrochim. Acta 2011, 56, 1761–1772. [Google Scholar] [CrossRef]
  66. Cao, D.; Ma, Y.F.; Shi, Z.N.; Xu, J.L.; Hu, X.W.; Wang, Z.W. Performance of protective oxide films on Fe-Ni alloy anodes in molten KF-AlF3-Al2O3 salts at 700 °C. Electrochim. Acta 2020, 347, 136275. [Google Scholar] [CrossRef]
  67. Ter-Ovanessian, B.; Alemany-Dumont, C.; Alemany-Dumont, C.; Normand, B. Electronic and transport properties of passive films grown on different Ni-Cr binary alloys in relation to the pitting susceptibility. Electrochim. Acta 2014, 133, 373–381. [Google Scholar] [CrossRef]
  68. Li, T.S.; Wu, J.; Frankel, G.S. Localized corrosion: Passive film breakdown vs. Pit growth stability, Part VI: Pit dissolution kinetics of different alloys and a model for pitting and repassivation potentials. Corros. Sci. 2021, 182, 109277. [Google Scholar] [CrossRef]
Figure 1. Original morphology of Fe48Cr15Mo14C15B6Y2 amorphous powder (a) and size distribution (b).
Coatings 13 00894 g001
Figure 2. Cross-sectional microstructure of as-sprayed Fe48Cr15Mo14C15B6Y2 amorphous coating (a) overview; (b) higher magnification; (cf) EDS mapping results for Fe, Cr, Mo and Y.
Coatings 13 00894 g002
Figure 3. Surface morphology of as-sprayed Fe48Cr15Mo14C15B6Y2 amorphous coating.
Coatings 13 00894 g003
Figure 4. XRD profile of as-sprayed Fe48Cr15Mo14C15B6Y2 amorphous coating.
Coatings 13 00894 g004
Figure 5. TEM images of as-sprayed Fe48Cr15Mo14C15B6Y2 amorphous coating: (a) bright field image and electron diffraction pattern; (b) HRTEM image and FFT patterns. Yellow A and yellow B in (b) denote α-Fe (1 1 0) plane with ordered arrangements.
Coatings 13 00894 g005
Figure 6. Cyclic polarization curve of Fe48Cr15Mo14C15B6Y2 amorphous coating in borate buffer solution with pH = 7.0.
Coatings 13 00894 g006
Figure 7. Electrochemical impedance spectra of Fe48Cr15Mo14C15B6Y2 amorphous coating under various passivation times: (a) Nyquist plots; (b) phase angle transformation; (c) equivalent electric circuit of coating passivated for 600 s; (d) equivalent electric circuit of coating passivated for 1200, 1800, 3600, 5400 and 7200 s.
Coatings 13 00894 g007
Figure 8. Semiconducting properties of Fe48Cr15Mo14C15B6Y2 amorphous coating under various passivation times: (a) Mott–Schottky curves; (b) donor densities.
Coatings 13 00894 g008
Figure 9. Current density I versus charge density Q−1 of passive film corresponding to Fe48Cr15Mo14C15B6Y2 amorphous coating under different passivation time: (a) t = 600 s; (b) t = 1800 s; (c) t = 3600 s; (d) t = 7200 s.
Coatings 13 00894 g009
Figure 10. Fitting results about XPS spectra of passive films corresponding to Fe48Cr15Mo14C15B6Y2 amorphous coating under different passivation times: (a) Fe 2p3/2, 1800 s; (b) Fe 2p3/2, 3600 s; (c) Fe 2p3/2, 7200 s; (d) Cr2p3/2, 1800 s; (e) Cr2p3/2, 3600 s; (f) Cr2p3/2, 7200 s.
Coatings 13 00894 g010
Figure 11. Fitting results about XPS spectra of passive films corresponding to Fe48Cr15Mo14C15B6Y2 amorphous coating under different passivation times: (a) Mo 3d, 1800 s; (b) Mo 3d, 3600 s; (c) Mo 3d, 7200 s; (d) O 1s, 1800 s; (e) O 1s, 3600 s; (f) O 1s, 7200 s.
Coatings 13 00894 g011
Figure 12. Elemental and chemical composition distributions of passive film corresponding to Fe48Cr15Mo14C15B6Y2 amorphous coating passivated under various times: (a) proportions of Fe, Cr, Mo and O; (b) proportions of Cr species and ratio of Cr2O3/Cr(OH)3; (c) proportions of Mo species and ratio of (MoO2 + MoO3)/Mo0; (d) proportions of O species and ratio of (O2− + H2O)/OH.
Coatings 13 00894 g012
Figure 13. Correlation between passive film thickness d, resistance Rf and passivation time t of Fe48Cr15Mo14C15B6Y2 amorphous coating.
Coatings 13 00894 g013
Figure 14. Surface morphology of Fe48Cr15Mo14C15B6Y2 amorphous coating after passivation for 600 s in borate buffer solution and corresponding passivation mechanism model: (a) surface morphology; (b) schematic mechanism of metal mechanical mixtures formation process at the initial passivation stage. A, B, and C points in (a) represent the selective EDS points.
Coatings 13 00894 g014
Figure 15. Surface morphology of Fe48Cr15Mo14C15B6Y2 amorphous coating after passivation for 7200 s in borate buffer solution and corresponding passivation mechanism model: (a) surface morphology; (b) illustration of vacancy condensation mechanism in passive film ( M x + is metal cation, V M x is metal cation vacancy, V Ö is oxygen vacancy and X n is anion in this figure).
Coatings 13 00894 g015
Figure 16. AFM topographies of passive films formed on Fe48Cr15Mo14C15B6Y2 amorphous coating surface after passivated for various time: (a) 600 s; (b) 7200 s.
Coatings 13 00894 g016
Table 1. Detailed spraying parameters of plasma spraying process.
ParametersInput Values
Input power45.5 kW
Stand-off distance120 mm
Primary gas flow velocity49.6 L·min−1
Secondary gas flow velocity24.6 L·min−1
Carrier gas flow velocity7.5 L·min−1
Powder delivery rate28 g·min−1
Traversing speed140 mm·s−1
Number of passes3
Table 2. Fitting results of electrochemical impedance data of Fe48Cr15Mo14C15B6Y2 amorphous coating under different passivation time.
Time
(s)
Rs
(Ω·cm2)
Qf
−1·cm−2·sn)
n1Rf
(kΩ·cm2)
Rct
(kΩ·cm2)
Qdl
−1 cm−2·sn)
n2
60011.20.0004690.776.561.2750.00071570.71
12009.980.0002310.799.01
180010.70.0001570.8111.25///
360012.80.00009140.8414.66///
540012.60.00004660.8816.64///
72009.200.00003530.8917.73///
Table 3. Calculating results of Mott–Schottky curves of Fe48Cr15Mo14C15B6Y2 amorphous coating under different passivation time.
Time (s)60012001800360054007200
Nd (cm−3)5.04 × 10212.34 × 10211.86 × 10211.16 × 10219.36 × 10208.07 × 1020
Ufb (VSCE)−0.38−0.35−0.29−0.28−0.27−0.19
Table 4. Chemical compositions of different positions of passivated surface corresponding to Fe48Cr15Mo14C15B6Y2 amorphous coating after passivated for 600 s (at.%).
PointOFeCrMoNa
A47.6716.645.803.1326.76
B17.2752.7117.8812.14/
C76.16///23.84
Table 5. Chemical compositions of different positions of passivated surface corresponding to Fe48Cr15Mo14C15B6Y2 amorphous coating after passivated for 7200 s (at. %).
PointOFeCrMo
A5.6757.7821.8614.70
B27.8745.2815.5711.27
Disclaimer/Publisher’s Note: The statements, opinions and data contained in all publications are solely those of the individual author(s) and contributor(s) and not of MDPI and/or the editor(s). MDPI and/or the editor(s) disclaim responsibility for any injury to people or property resulting from any ideas, methods, instructions or products referred to in the content.

