Abstract
Rare-earth zirconates are proven to be very effective in restricting the CMAS attack against thermal barrier coatings (TBCs) by forming quick crystalline reaction products that seal the porosity against infiltration. The microstructural effects on the efficacy of Electron Beam-Physical Vapor Deposition gadolinium zirconate (EB-PVD GZO) against CMAS attack are explored in this study. Four distinct GZO microstructures were manufactured and the response of two selected GZO variants to different CMAS and volcanic ash melts was studied for annealing times between 10 min and 50 h at 1250 °C. A significant variation in the microstructural characteristics was achieved by altering substrate temperature and rotation speed. A refined microstructure with smaller intercolumnar gaps and long feather arms lowered the CMAS infiltration by 56%–72%. Garnet phase, which formed as a continuous layer on top of apatite and fluorite, is identified as a beneficial reaction product that improves the CMAS resistance.
1. Introduction
In modern airplanes and gas turbines, the efficiency of turbine engines is improved by enhancing the operation temperature. To withstand these enormous thermal loads, components within the high temperature section made of nickel-based alloys, such as vanes, combustion liners or turbine blades, are covered with ceramic thermal barrier coatings (TBCs) [1]. In commercial turbines, 7 wt.% Y2O3 stabilized ZrO2 (7YSZ) is widely used, and is the state-of-the-art TBC material. It is typically deposited by atmospheric plasma spraying (APS) or by electron beam physical vapor deposition (EB-PVD). These methods create porous coatings with low thermal conductivity and offer compliance against thermal stresses, which are caused by the high temperature variations in operation.
The degradation of TBCs in aero-engines by calcium-magnesium-aluminum-silicates (CMAS) and other siliceous melts that are found in sand-laden environments or volcanic ashes (VA), is a major challenge in aviation industry. This damage can be erosive or corrosive, depending on whether the particles remain in a solid state or melt [2,3,4,5]. The deposits melt in the hotter sections of the turbine (temperatures above 1050 °C), stick to the components’ surfaces and infiltrate the porous thermal barrier coatings which lowers the strain tolerance and leads to premature spallation [2] or reduces the lifetime of components. Additionally, the CMAS melt interacts chemically with the TBC material which changes phase composition and properties by means of dissolution and reprecipitation mechanisms [2,6].
Due to the ever-increasing turbine inlet temperatures and the drawbacks of 7YSZ over 1250 °C with respect to phase stability, sintering and CMAS resistance, intense research has been performed on novel TBC materials with low thermal conductivities and high resistance against CMAS. Among many new compositions, rare earth (RE-) zirconates (RE = gadolinium [7,8], lanthanum [8], yttrium [9,10], etc.) or Al2O3 [11,12] have shown high reactivity with the siliceous deposits and proven to be effective in restricting the CMAS attack. These TBCs dissolve into the CMAS melt and form, once the maximum solubility of a specific element is reached, crystalline reaction products, such as apatite, garnet or spinel. With their increased melting points, these phases trap on the one hand the deposit elements in a crystalline product. On the other hand, they seal potential melt flow channels which reach deeper into the TBC material to prevent stiffening and to hinder or to slow down the dissolution of large quantities of the TBC or subjacent layers and materials.
Another strategy to improve the CMAS resistance of TBCs is the optimization of the microstructure. Various studies showed that the CMAS resistance of non-reactive state-of-the-art 7YSZ TBCs could be influenced by different morphologies in coatings produced via APS [13,14], PS-PVD [15] and EB-PVD [16,17]. In the latter, variation of rotation speed and of substrate temperature created different columnar microstructures with different intercolumnar gap width, column width and feather arm lengths. Smaller intercolumnar gaps and longer feather arms significantly slowed down the infiltration of molten CMAS into the 7YSZ TBC. A numerical study [18] simulating the flow of molten CMAS in a non-reactive EB-PVD TBC supported these experimental findings. However, studies about microstructural refinement through EB-PVD process variation using a reactive rare-earth TBC material combined with the examination of its influence on the CMAS resistance have not yet been published.
This approach of microstructural refinement has opened up a new window for the CMAS related research and has been applied on reactive TBCs in this study. EB-PVD process parameters were carefully varied in order to create gadolinium zirconate (GZO) thermal barrier coatings with different columnar microstructures. Their typical microstructural features were analyzed in the as-coated state. Infiltration experiments using CMAS/VA deposits with different chemical compositions at 1250 °C were performed and the infiltration as well as the reaction kinetics were analyzed.
The main aim of this study was to determine the effect of different EB-PVD GZO microstructures on the CMAS infiltration behavior and the reaction kinetics in order to identify factors improving the CMAS resistance of reactive thermal barrier coatings. Besides the microstructure, different deposits were applied to consider the influence of the chemical composition on the reaction kinetics.
2. Materials and Methods
2.1. EB-PVD GZO Thermal Barrier Coatings
Gadolinium zirconate (GZO) thermal barrier coatings were deposited at Germany Aerospace Center (DLR) in Cologne, Germany, using a 150 kW EB-PVD coater (ESPRI, von Ardenne GmbH, Dresden, Germany) with separate loading, pre-heating and coating chambers and single-source evaporation of a GZO ingot of commercial quality (Phoenix coating Resources Inc., Mulberry, FL, USA, now a subsidiary of Saint-Gobain Coating Solutions, Avignon, France) with a diameter of 62.5 mm. As metallic substrates and bondcoats would have been severely oxidized during isothermal infiltration experiments at 1250 °C, the TBCs were instead directly deposited on flat, 1-mm-thick, 100 mm × 40 mm large, densified and sintered Al2O3 sheets (Quick-Ohm Küpper, Wuppertal, Germany—99.6% purity) without a bond coat.
All samples were pre-heated for 15 min in a connected, separate chamber prior to deposition. In order to produce different microstructures, the substrate temperature and the rotation speed during the coating process were varied. The main process parameters and layer thicknesses are shown in Table 1.

Table 1.
Process parameters of the GZO layers deposited by EB-PVD on sintered Al2O3 substrates.
The coating variants presented in this study were chosen from a larger number of variants and represented the largest changes with respect to the microstructural characteristics and CMAS infiltration kinetics. The applicability as parameters in an industrial coating set up was kept in mind. The temperature steps of 40–60 °C were large enough to withstand the slight temperature fluctuations occurring typically in the course of the coating process in industrial-scale EB-PVD coaters. The rotation speed of 12 rpm is considered a standard parameter widely used in research and industry, whereas 20 rpm implies a perceptible increase that was still bearable from a wear and mechanical load perspective for the coater.
With a surface temperature of 970 °C and a rotation speed of 12 rpm, the coating parameters of GZO1 were close to standard values that were commonly used for various columnar EB-PVD TBCs also produced in other studies at DLR for 7YSZ and GZO [19,20,21]. This variant was considered as a base case. As a first variation, for GZO2, the surface temperature was increased by 60 to 1030 °C while maintaining the rotation speed at 12 rpm. For the second variant GZO3, the surface temperature was kept similar to that of GZO1 at 970 °C and the rotation speed was increased from 12 to 20 rpm. For GZO4, the rotation speed was increased from 12 to 20 rpm and the beam power was decreased in order to achieve a lower substrate temperature of around 930 °C, as preliminary experiments indicated a better CMAS resistance for lower substrate temperatures.
The deposition speed was in the range between 4.7 and 5.3 µm/min and the thickness of the TBC was between 190 and 200 µm for GZO2-4 and 330 µm for GZO1. The higher TBC thickness of GZO1 was intentionally chosen to have more space for investigations and to better find differences between the versions. All specimens of one variant, i.e., GZO1, GZO2 etc., were coated in the same respective deposition run.
2.2. CMAS Deposits and Infiltration Experiments
CMAS deposits with different chemical compositions were used in this study: One natural volcanic ash sample collected in 2010 from site of the volcano Eyjafjallojökull located in Iceland (63°40′42.10″ N; 19°37′31.75″ W) named IVA, and two artificial CMAS powders, named CMAS1 and CMAS2. Their compositions match those found in aero-engines operating in desert regions. The CMAS1 and CMAS2 powders were synthesized, as described in previous studies [22,23] in an in-house laboratory facility, via co-decomposition of Me-nitrates (Me: Al, Ca, Fe, Mg), SiO2 and TiO2 powders (Merck KGaA, Darmstadt, Germany) and a heat treatment for 1 h at 1250 °C. CMAS2, with its higher CaO content, was fabricated by mixing CMAS2 with 20 wt.% anhydrite CaSO4 powder at room temperature.
The chemical compositions, viscosities and melting ranges of the CMAS used are given in Table 2. These three different deposits were already used in previous studies conducted at DLR [12,17,22,23].
Table 2.
Chemical composition in mol.% and properties of Iceland volcanic ash (IVA), and two synthetized CMAS powders (CMAS1, CMAS2), as used and described in previous studies [12,17,22,23].
For the infiltration experiments, CMAS/VA powder with a concentration of 20 mg/cm2 was applied on top of the GZO coating (samples sized approximately 15 mm × 15 mm) by mixing the powder with deionized water, putting it in a circular template with a diameter of 6 mm and letting it dry at ambient air. To enable the infiltration, the samples were annealed in an isothermal cyclic furnace at 1250 °C on a pre-heated sample holder with a heating rate of 360 K/min and rapid cooling (quenching) of ~550 K/min to room temperature via ventilated ambient air.
After preliminary experiments of short-term infiltration (10 min at 1250 °C with CMAS2) for all four coatings GZO1-4, the two coating variants with significant differences in their microstructural characteristics (as described in Section 3.1) and infiltration depth after 10 min (see Section 3.2), namely GZO1 and GZO4, were selected for extensive infiltration experiments and analysis with all three deposits and annealing times between 10 min and 50 h in the above-mentioned furnace.
For XRD analysis of the reaction phases, spalled GZO particles from the EB-PVD coating chamber were milled, mixed with CMAS/VA deposits in proportions of 40/60 wt.% (GZO/CMAS) and annealed on a platinum foil for 5 h at 1250 °C in the above-mentioned cyclic furnace. The reacted mixtures were then crushed and milled for subsequent XRD analysis.
2.3. Characterization Methods
The samples were prepared with metallurgical standard preparation methods. The as-coated and infiltrated samples were analyzed by scanning electron microscopy (SEM—DSM ultra 55, Carl Zeiss, Jena, Germany). Energy-dispersive spectroscopy (EDS—Inca, Oxford Instruments, Abingdon, United Kingdom) was used to identify the CMAS reaction products within the coating and to determine the infiltration depth (EDS mapping).
The porosity of the as-coated GZO layers was determined both by image analysis of SEM micrographs using ImageJ software and by gas displacement pycnometry with Helium (AccuPyc II 1340, Micromeritics, Norcross, GA, USA). In the latter, rectangular pieces of GZO on Al2O3 substrate with a coating volume of approximately 35 mm3 were used. Additional pycnometry measurements of uncoated Al2O3 substrates allowed the subtraction of the substrate porosity, which increased the accuracy of the measurement of the coating porosity.
XRD analysis of the reacted GZO-CMAS/VA powder mixtures was performed with a D8 Advance diffractometer with Cu-Kα-radiation (Bruker AXS, Karlsruhe, Germany). Powder mixtures of coating material and CMAS/VA deposit were used due to their higher specific contact surface area during the reaction time, forming a higher quantity of reaction products and thus leading to a stronger signal of the relevant peaks.
3. Results
3.1. Microstructure of the as-Coated EB-PVD Gadolinium Zirconate Coating
The SEM micrographs of the unpolished and polished top-view, as well as the cross-sections in different magnifications of the as-coated layers are shown in Figure 1. The polished top views were obtained in the upper few µm of the TBCs by carefully polishing away the column tops.
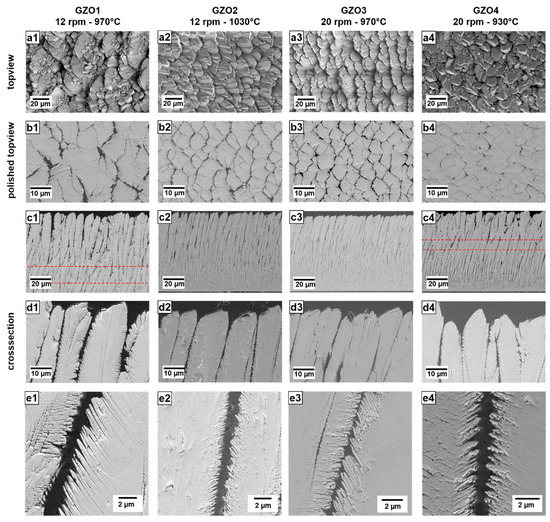
Figure 1.
SEM micrographs of the as-coated EB-PVD GZO layers GZO1 to GZO4 as unpolished top-view (a1–a4), polished top-view (b1–b4), cross-section overview (c1–c4) and detail (d1–d4,e1–e4). Dashed lines: change of dominant columnar growth direction.
Table 3 summarizes the microstructural characteristics such as columnar width, intercolumnar gap width and feather arm length, as well as porosity values determined with different methods (image analysis and helium pycnometry). The intercolumnar gaps are divided into two categories (as seen in Figure 2, left) with bigger ones at the intersection of three or more columns and smaller ones along the sides between two adjacent columns.
Table 3.
Microstructural characteristics of the GZO layers, determined with cross-sectional and polished top-view SEM images as well as He-pycnometry.
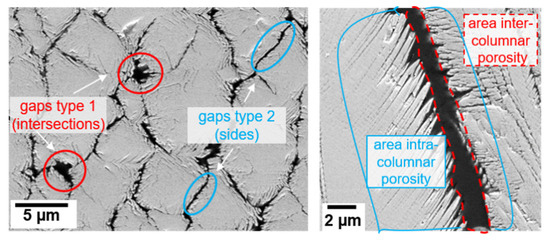
Figure 2.
Microstructural characteristics calculated in Table 3 shown in exemplary SEM images. Left: Two categories of inter columnar gap width (type 1: intersections between three or more columns, type 2: sides between two adjacent columns) in polished top-views. Right: areas considered for the calculation of the geometry factor (g) (ratio of intra- to intercolumnar porosity) in a cross-section.
As the EB-PVD coatings experienced a strong variation in porosity across the coating thickness, porosity was measured using different methods at different sections of the coating e.g., the intercolumnar porosity was measured by means of ImageJ in cross sectional and polished top-view SEM images in the upper section of the TBC. In addition to that, helium pycnometry was used to measure the overall porosity of the coating. Another important measurement, namely the geometry factor (g), which is the ratio of intra- to intercolumnar porosity, was estimated by dividing the areas of pores between the feather arm by the area of the intercolumnar gaps (as shown in Figure 2, right). Similar measurements have been used in previous studies [17] to calculate the tortuosity τ.
Note that the difference between the porosity values underlines the difference between the used methodologies and the sections considered for their calculation. While the ImageJ analysis considered only the intercolumnar porosity of the upper part of the coating with its wider gaps, the pycnometry calculation was based on the entire coating, including also the lower TBC section with small columns, narrower gaps and less porosity.
The lowest geometry factor (g) of GZO1 for all four samples indicates that the porosity contributed by the gaps prevailed, compared to the one within the feather arms.
The GZO2 coating had smaller column widths, shorter feather arms and smaller intercolumnar gaps than GZO1. The top-view SEM images (Figure 1(a2,b2)) show that columns grew in a more regular and ordered way compared to GZO1. Little to no re-nucleation of smaller columnar nuclei on the surface of large columns (as it is the case for GZO1) could be observed. Its overall porosity of 14.6 vol.% was found to be significantly higher than that of GZO1, whereas the intercolumnar porosity at the top section was slightly smaller. On average, (g) was calculated as 0.98 to 1, which indicates that the feather arm porosity and intercolumnar porosity were in the same order.
For GZO3, coated at a higher rotation speed of 20 rpm at 970 °C, the microstructure exhibited thinner columns, smaller intercolumnar gap widths and shorter feather arm lengths (Figure 1(a3–e3))—all of which are, within the standard deviation, comparable to those values of GZO2. The unpolished surface was also similar to that of GZO2, whereas the intercolumnar porosity of the top section was larger than for GZO2, with the highest value of all four variants. It experienced a higher feather arm porosity compared to that of intercolumnar porosity (highest (g)-value of 1.62 to 1) and a medium overall porosity of 9.6 vol.%.
The last variant GZO4, deposited with lower substrate temperature (930 °C) and higher rotation speed (20 rpm), exhibited the thinnest columns, the narrowest intercolumnar gaps as well as the longest feather arms of all four microstructures. Its columns, as seen in the top-view SEM micrographs (Figure 1(a4,b4)), were less ordered than GZO2 and GZO3 but did not exhibit the fan-like structure observed in GZO1. Due to its narrower gaps, the intercolumnar porosity of GZO4 was the lowest for all four coating variants. At the same time, it possessed the highest overall porosity and (g) value—both indicating that a large quantity of open, intracolumnar pores prevailed in this microstructure.
A distinct columnar bending (against the rotation axis) was observed in all the microstructures (Figure 1(c1–c4)).
The slope of this curvature was found to increase with decreasing substrate temperature and increasing rotation speed. GZO2 (1030 °C, 12 rpm) has exhibited least bending compared to the other coatings deposited at lower temperature (GZO1, GZO3 and GZO4). For the coatings manufactured at the same substrate temperature (i.e., 970 °C for GZO1 and GZO3), the higher rotation speed (GZO3) caused a stronger bending. The strongest curvature was observed for the high-rotation/low-temperature microstructure GZO4. The reason for the curvature, that was observed in previous investigations and in literature as well [20,24,25], is still under current investigation.
For weakly bended GZO2 and GZO3, the columns were curved throughout the entire height of the coating. Contrarily, for the two other microstructures, GZO1 and GZO4, respectively, the dominant columnar growth direction changed after a specific thickness as nuclei orientated perpendicularly to the surface prevailed. The stronger bent GZO4 exhibits this change already after a thickness of 105–140 µm, whereas in the less curved GZO1, differently orientated nuclei prevailed after 165–200 µm.
XRD analysis of the GZO (respective diffractograms are not presented here) showed that the coatings and powder all consisted of cubic GZO phase (PDF-file 01-080-0471). Deviating from the relative peak intensities for a powder with statistical grain orientation that was provided by the PDF file, the dominant (311) peak indicated a stronger (311) texture for the EB-PVD layers. For higher substrate temperatures (GZO2 versus GZO1 and GZO3 versus GZO4), the peak intensities of (111) and (200/400) decreased with respect to the highest peak (311). With more available energy due to the higher substrate temperature, the surface diffusion might have occurred more extensively and allowed the atoms to settle into more thermodynamically favorable positions, which seems to be, in this case, in the (311) orientation. The similar change in the peak intensities (lower (111) and (200/400) with respect to (311)) could be observed when increasing the rotation speed (GZO3 versus GZO1). This might be explained by the smaller radiation losses that occurred during the shorter rotation cycles at higher speed, resulting in longer times at higher temperature and hence more energy that was available for the above-mentioned enhanced surface diffusion. For the GZO powder, the (111)-peak as strongest reflex correlated to the statistical distribution.
3.2. CMAS Infiltration Experiments
3.2.1. Reaction Products from the GZO-CMAS Interactions Using Powder Mixtures
Reaction products of GZO and CMAS/VA were determined by combining XRD analysis (Figure 3) with EDS spot measurements in the SEM (Figure 4) on 40 wt.% coating −60 wt.% CMAS powder mixtures after 5 h annealing at 1250 °C. The average chemical compositions of the reaction products measured from EDS are presented in Table 4. Among the patterns in Figure 3, dominant peaks from the fluorite phase (Gd,Zr,Ca)O1.x and apatite phase (Gd,Ca)4(Gd,Zr)6(SiO4)6O2 were found in all powder mixtures. For the GZO + IVA mixture, besides fluorite and apatite, additional peaks corresponding to a zirconolite-type phase (Ca,Gd,Zr)2(Fe,Ti,Al,Mg)2O7 were identified. For GZO + CMAS2, apart from fluorite and apatite, other noticeable peaks of Andradite (a species of the garnet group) with the general formula (Gd,Zr,Ca)3(Mg,Al,Fe,Ti,Zr)2(Si,Al,Fe)O12 were found. In GZO + CMAS1, the weak signals corresponding to the garnet phase were also identified along with spinel (MgAl2−xFex)O4.
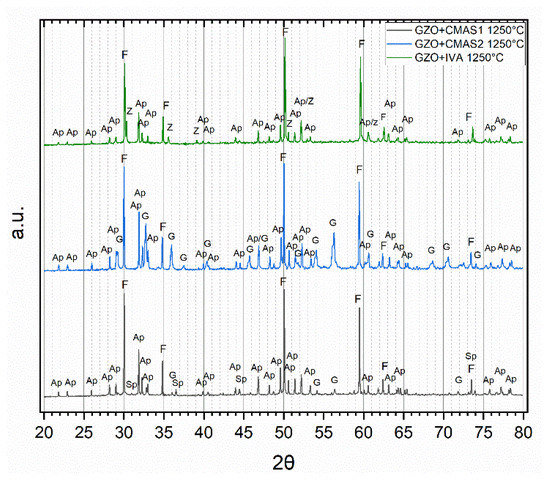
Figure 3.
Normalized XRD patterns of the 40/60 wt.% powder mixtures of GZO with CMAS1 (black), CMAS2 (blue) and IVA (green) after 5 h at 1250 °C with peaks attributed to apatite (Ap), fluorite (F), garnet (G) and zirconolite (Z).
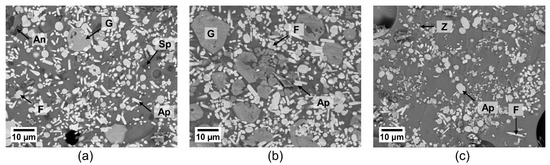
Figure 4.
SEM micrographs of the powder mixtures of GZO with (a) CMAS1, (b) CMAS2, (c) IVA after annealing for 5 h at 1250 °C; with An: anorthite, Ap: apatite, F: fluorite, G: garnet, Sp: spinel, Z: zirconolite.
Table 4.
Chemical composition of the reaction products in the GZO-CMAS/VA powder mixtures after 5 h at 1250 °C measured via EDS spot measurement. Several spots were measured at different locations and the average was calculated.
Figure 4 depicts a clear difference in the reaction product formation and the sizes of the formed crystalline products for different powder mixtures. Globular fluorite and elongated, prismatic apatite crystals could be seen in all reacted powder mixtures. Larger garnet crystals appeared for both GZO + CMAS1 and GZO + CMAS2 mixtures and their respective quantitative occurrence in the images is in good agreement with the different signal strength of the corresponding XRD peaks in Figure 3, i.e., for CMAS1, the garnet crystals were sporadically present and the garnet diffraction peaks were weak, whereas for CMAS2, the higher peak intensity in the XRD pattern aligns with the higher presence of garnet in the SEM image. Spinel and zirconolite are visible as small grains in GZO + CMAS1 and GZO + IVA, respectively (marked as SP and Z in Figure 4a,c), and the intensities of their XRD peaks are low with respect to the apatite and fluorite peaks.
The EDS spot measurements of the reacted powders (Table 4) show that the chemical composition of the various reaction phases varied slightly with respect to the composition of the CMAS/VA deposit.
The fluorite, apatite and garnet phases of the powder mixtures with calcia-rich CMAS2 all showed higher calcia contents in their compositions compared to the GZO + CMAS1 phases with 6.2 mol.% instead of 3.4 mol.% (fluorite), 18.4 mol.% instead of 14.3 mol.% (apatite) and 25.0 mol.% instead of 18.4 mol.% (garnet), respectively. On the other hand, the silica content in the apatite phase is similar, within the error range of EDS measurements, for all the powder mixtures at 34.4–35.8 mol.%. Similarly to the apatites, chemical compositions of the residues orient towards the original compositions of the deposits as well. However, the higher original titania content (4.3 mol.%) of the unreacted IVA deposit compared to CMAS1 and CMAS2 (1.6 and 1.4 mol.%) was reduced in the IVA residue to 1.7 mol.% due to the reprecipitation of titania-rich zirconolite crystals. The zirconia content was found to be similar in all three residues, whereas the gadolinia content was lowest (3.9 mol.%) in the CMAS2 residue. This might be attributed to the fact that garnet as an additional Gadolinia bearing phase formed extensively in CMAS2 compared to the other two powder mixtures.
3.2.2. Effect of Different Microstructures on the Infiltration and Reaction Kinetics
In order to compare the CMAS resistance of the different GZO microstructures, the infiltration depth of the deposits within the coating was determined by tracing the main elements of the CMAS via EDS area mapping. The depth differed significantly between all four coatings. Figure 5 shows exemplarily the cross-sectional SEM images of these variants after 10 min infiltration with CMAS2 and the EDS maps of silicon signals. The molten deposit infiltrated to a depth of 185 ± 10 µm for GZO1, 114 ± 22 µm for GZO2, 92 ± 25 µm for GZO3 and 52 ± 12 µm for GZO4, respectively. The two coatings with the largest difference in microstructure (Table 3) and infiltration depth (Figure 5), namely, GZO1 and GZO4, were selected for further analysis in the course of this study.
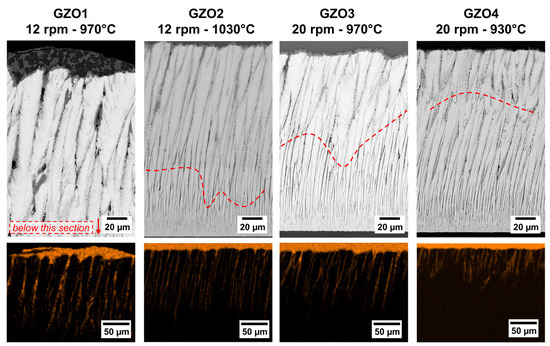
Figure 5.
Different GZO microstructures infiltrated with CMAS2 for 10 min at 1250 °C (dashed line: infiltration depth) and EDS mapping of the Si element in the cross section of the same sample.
Figure 6 shows the infiltration depth of CMAS1, CMAS2 and IVA in GZO1 and GZO4 as a function of annealing time at 1250 °C. The different infiltration kinetics for the two microstructures can be clearly seen: GZO1, with wider intercolumnar gaps, was infiltrated between 185 ± 31 µm deep after 10 min and 211 ± 29 µm after 50 h for CMAS1 and slightly less for CMAS2, namely, 185 ± 10 µm up to 180 ± 25 µm, and the least for IVA with 141 ± 14 µm up to 129 ± 28 µm, respectively. GZO4, possessing a feathery microstructure with smaller intercolumnar gaps and longer feather arms, was infiltrated less: When CMAS1 was being used for the infiltration, the infiltration depth increased from 54 ± 6 µm (10 min) to 63 ± 10 µm (50 h). For CMAS2, the molten deposit has reached a depth of 52 ± 12 µm (10 min) up to 78 ± 10 µm (50 h). For IVA, the infiltration depth was between 52 ± 11 µm and 56 ± 18 µm. Thus, the reduction of infiltration depth due to the optimized microstructure for GZO4 in comparison to GZO1 is between 56% to 72%, depending on the parameter set of CMAS deposit and annealing time.
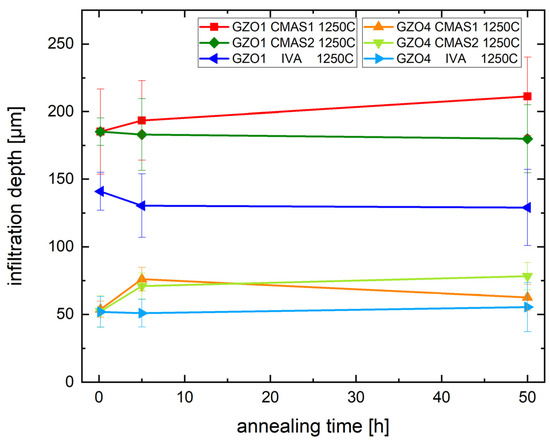
Figure 6.
Infiltration depth of the CMAS deposit into the TBC at different annealing times with CMAS1, CMAS2 and IVA at 1250 °C.
Another important observation about the variation in the reaction layer depth versus annealing time with respect to the microstructure is presented in Figure 7. Contrarily to the infiltration depth, the reaction layer thickness did not diverge consistently for all deposits when comparing the two microstructures for the same CMAS deposits and annealing time.
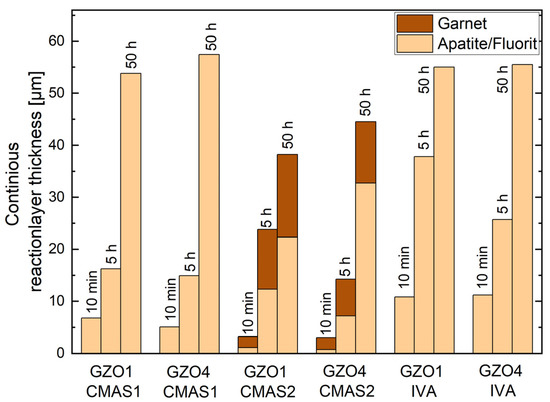
Figure 7.
Thickness of the continuous reaction layer on top of the different microstructures formed after interaction with CMAS1, CMAS2 and IVA at 1250 °C.
Another important observation about the variation in the reaction layer depth versus annealing time with respect to the microstructure is presented in Figure 7. Contrarily to the infiltration depth, the reaction layer thickness did not diverge consistently for all deposits when comparing the two microstructures for the same CMAS deposits and annealing time.
Another important observation about the variation in the reaction layer depth versus annealing time with respect to the microstructure is presented in Figure 7. Contrarily to the infiltration depth, the reaction layer thickness did not diverge consistently for all deposits when comparing the two microstructures for the same CMAS deposits and annealing time.
For CMAS1 infiltrated samples, this reaction layer was defined by the apatite and fluorite crystals that entirely transformed the GZO at the specific location. It has an average thickness (GZO1/GZO4) of 6.7 ± 0.7 µm/5.1 ± 1.0 µm, 16.2 ± 3.3 µm/14.9 ± 2.1 µm and 53.8 ± 1.6 µm/57.5 ± 4.0 µm after 10 min, 5 h and 50 h annealing time, respectively. The garnet was not considered as it has formed only sporadically and discontinuously on top of the apatite.
In case of CMAS2, both the apatite–fluorite network and the garnet (continuous layers) were considered. The apatite–fluorite network was thinner than its counterpart formed by CMAS1. The average overall reaction layer thickness consisting of apatite, fluorite and garnet is (GZO1/GZO4) 2.8 ± 0.9 µm/3.0 ± 0.7 µm, 23.8 ± 2.6 µm/14.3 ± 2.6 µm and 38.2 ± 10.0 µm/45.5 ± 4.2 µm after 10 min, 5 h and 50 h annealing time, respectively. Due to the larger intercolumnar gaps for GZO1, a stronger garnet formation could be observed after 5 h compared to GZO4 with its smaller gaps. The thicker garnet layer slowed down the formation of additional apatite after additional, longer annealing times, which can be seen in the comparison of Figure 7 after 50 h, where the apatite layer on GZO1 was thinner than the one on GZO4 with less garnet between the TBC and residue.
With IVA being used as deposit, the apatite–fluorite network has formed, as shown in Figure 7. The average overall reaction layer thickness was (GZO1/GZO4) 10.8 ± 3.7 µm/ 11.2 ± 2.9 µm, 37.8 ± 6.1 µm/25.7 ± 4.5 µm and 55.0 ± 7.4 µm/55.5 ± 6.3 µm after 10 min, 5 h and 50 h annealing time, respectively. The zirconolite layer was not considered in the total reaction layer thickness, as it mainly formed in the CMAS residue on top of the reaction interface.
In GZO1, the combination of differences in microstructure and CMAS composition also influenced the infiltration depth by causing a divergent reaction behavior. Due to the larger intercolumnar gaps, a more extensive garnet formation occurred with CMAS2 compared to CMAS1. This garnet incorporated more CMAS, provided additional sealing of wide gaps and thus restricted the infiltration depth of CMAS2. In contrast for GZO4, the influence of the additional CMAS2 garnet formation was limited, as the smaller intercolumnar gaps of the GZO4 microstructure were sufficiently sealed by the faster forming apatite. As a consequence, the difference in the infiltration depth for GZO4 was smaller.
3.2.3. Effect of Chemical Composition of CMAS and Time on the Reaction Kinetics of EB-PVD GZO at 1250 °C
Both GZO1 and GZO4 reacted quickly (within 10 min) with all CMAS/VA compositions and formed crystalline products within the intercolumnar gaps as well as at the columnar tips, as shown in Figure 8. No profound effect of microstructure was observed on the reaction phases; however, a clear difference in the reaction products was observed with respect to the different CMAS compositions. Hence, only the chemical compositions of reaction products for one microstructure, namely GZO4, that formed with the different deposits, are presented and discussed hereinafter. The average chemical compositions of the reaction products measured with GZO4 are summarized in Table 5.
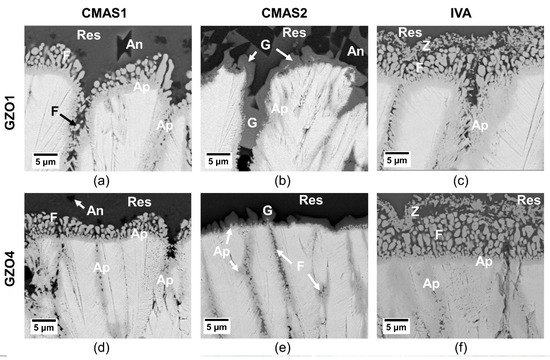
Figure 8.
Initial reaction layer of GZO1 (a–c) and GZO4 (d–f) after 10 min infiltration at 1250 °C with CMAS1 (a,d), CMAS2 (b,e) and IVA (c,f). Ap: apatite, F: fluorite, res: residue, G: garnet, Z: zirconolite, An: anorthite.
Table 5.
Chemical composition of the reaction products of infiltrated GZO4 samples after 10 min at 1250 °C measured via EDS spot measurement. Several spots were measured at different locations and the average was calculated.
In the case of CMAS1 (Figure 8a,d), the molten deposit infiltrated the intercolumnar gaps as well as parts of the feather arms and partially dissolved the column tips. A thin, continuous apatite layer (Gd,Ca)4(Gd,Zr)6(SiO4)6O2 surrounding the GZO columns was formed. At the TBC/CMAS interface, globularly shaped fluorite (Gd,Zr,Ca)O1.x was precipitated. While smaller intercolumnar gaps contained solely apatite, larger gaps could not be sealed completely by the apatite. Instead, CMAS residue and small globular fluorite crystals were visible in these gaps.
With CaO-enriched, less viscous CMAS2 (Figure 8b,e), a similar infiltration scenario could be observed where the intercolumnar gaps and feather arms were infiltrated along with a slight dissolution of the column tips and the formation of apatite at the interface. Additionally, crystalline garnet ((Gd,Zr,Ca)3(Mg,Al,Fe,Ti,Zr)2(Si,Al,Fe)O12) already started to form after 10 min at the TBC column/CMAS residue interface and within the larger intercolumnar gaps. As the dissolution of smaller parts of GZO and apatite within garnet crystals can be seen in Figure 8b,e, it appears that the garnet grew at the expense of both the original coating and the apatite. In medium and larger gaps, additional globular fluorite particles were found.
Iceland volcanic ash (IVA) (Figure 8c,f) experienced similar infiltration and reaction behavior to that of CMAS1. The column tips dissolved and formed both globular fluorite particles and an apatite layer surrounding the columns. In larger gaps, the apatite grew in an elongated prismatic form accompanied by small, globular fluorite. Additionally, small particles of Fe-Ti-rich zirconolite were continuously precipitated in the residue above the globular fluorite.
After the longer annealing time of 50 h, a clear distinction between different phases was established, as shown in Figure 9. For CMAS1, the column tips were transformed into a two-phase layer of apatite and fluorite. While these were finely dispersed at the interface of the unreacted GZO columns, they were clearly distinguishable as elongated, prismatic apatite and globular fluorite at the CMAS–residue interface. Large garnet crystals of several tens of µm were discretely present on top of the apatite/fluorite reaction layer, covering approximately 20%–25% of the surface. Small spinel crystals ((MgAl2−xFex)O4) were found in the residue as well as in the intercolumnar gaps.
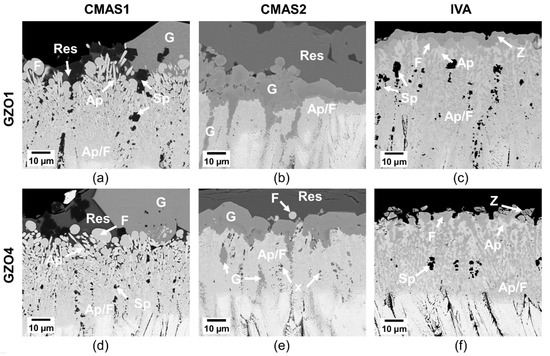
Figure 9.
Reaction layer of GZO1 (a–c) and GZO4 (d–f) after 50 h infiltration at 1250 °C with CMAS1 (a,d), CMAS2 (b,e) and IVA (c,f). Ap: apatite, F: fluorite, Sp: spinel, res: residue, G: garnet, Z: zirconolite, Ap/F: apatite–fluorite mixed phase, x: unknown phase.
A clear difference in the reaction layer sequence was found in CMAS2 where a finely dispersed apatite–fluorite bilayer was formed at the location of the former columns. Contrarily to the CMAS1 sample, the two phases were not separated by residue and thus did not exhibit their characteristic elongated or globular shape. Instead, they formed a finely dispersed, continuous network with a varying image contrast, indicating the compositional differences. The thickness of this bilayer was smaller compared to that of the CMAS1 case. The garnet crystals continued to grow at the column–residue interface forming a continuous dense layer on top of the apatite–fluorite as well as in the larger intercolumnar gaps and pockets. Additionally, smaller, dark particles in the lower reaction zone accumulated those elements that were locally not incorporated in apatite and fluorite, being mainly magnesia, alumina and iron oxide. EDX spot measurements also detected Gd, Zr, Si and Ca. No distinct phase class could be attributed to these particles in this study without further TEM analysis.
Finally, in the case of IVA, GZO has formed mainly a thick apatite and fluorite layer. The two phases formed a marbled and veined network, were larger in size and more clearly distinguishable than for CMAS2. Larger fluorite particles were visible at the very top of the reaction layer, whereas a finer apatite and fluorite network was found in the lower part of the layer. Contrarily to the CMAS1 sample, the two phases were not separated by significant amounts of residue. Additionally, Fe-Ti-rich zirconolite was found on top of this layer and spinel crystals were dispersed in the bilayer network at the lower part of the reaction layer. No residue was left on top of the reaction layer after 50 h, since IVA vigorously reacted with the GZO.
The chemical compositions of the reaction products after 50 h for GZO1 were published in a recent study [26]. The only minor differences to those after 10 min will be reviewed briefly in the discussion Section 4.3.
4. Discussion
The investigation and improvement of CMAS resistance of thermal barrier coatings has undergone intense research in the past decade [27]. However, most studies focused on the examination and comparison of different compositions of the coating material, especially on those forming reactive phases with the molten deposit. The effect of microstructural optimization was studied mainly on thermal conductivity or cyclic lifetime. However, the potential of microstructural modifications to improve the CMAS resistance was very little explored, especially within the EB-PVD process. Although its positive effect on the infiltration resistance has been shown for non-reactive 7YSZ EB-PVD coatings [16,18], similar examinations have not yet been performed for quick reactive coating materials with rare-earth zirconates such as GZO.
4.1. Effect of the Process Parameters on the EB-PVD Microstructure
The modification of microstructure is an important leverage to change and improve the properties of thermal barrier coatings that significantly influence the performance, efficiency and durability of turbines, such as thermal conductivity [28,29,30] or lifetime [31,32,33]. However, the CMAS resistance can also be improved by varying and optimizing the microstructure, as is shown in this study.
Substrate temperature and rotation speed have already proven to be decisive parameters for modifying the microstructures of EB-PVD TBCs [31,34,35,36,37]. Jesuraj et al. studied the effect of the substrate temperature on GZO [34] and Lanthanum zirconate [35] TBCs in a non-rotational EB-PVD coating process on nanomechanical properties and could observe an improved coating adhesion, higher hardness and Young’s modulus for coatings deposited at 700 °C compared to lower substrate temperatures of 500 °C and 600 °C. However, due to the stationary positioning and the lower substrate temperatures, a significantly different microstructure was achieved compared to the present TBCs.
Table 3 summarizes the microstructural characteristics of the studied coatings. With the variation of process parameters, the microstructural characteristics such as column width and intercolumnar gap width could be significantly altered between 50% and 86% and the porosity changed, depending on the method of measurement, between 62% and 68% (with reference to the respective maximum value).
The substrate temperature, which was varied in this study between 930 and 1030 °C, is linked to the energy available during the coating process. The condensation of a vapor particle on a solid substrate and the morphology of the coating depend mainly on the energy. The activation energy for surface and volume diffusion during condensation is proportional to the homologue substrate temperature. By decreasing the substrate temperature, less energy was available for the surface diffusion of the condensing GZO particles, which hindered the formation of larger columns via diffusion and instead caused a higher imperfection of the columns, a more pronounced feather arm structure and higher porosity.
With a higher rotation speed (GZO1 to GZO3), the porosity and quantity of nanopores was increased, as it has similarly been observed in various studies for EB-PVD 7YSZ coatings [30,38]. At faster rotation speeds, the vapor incident angle (VIA) between the ingot and the substrate changed at a higher frequency, causing a larger variation in the condensation process by a more competitive growth of different growth directions and thus higher porosity. Additionally, the time interval out-of-sight of the ingot, when no vapor reaches the substrate, was shorter for higher rotation speeds. During that interval, less time was available for relaxation and surface diffusion processes of the condensed particles towards free lattice positions which could reduce disturbances in the columns.
By decreasing the substrate temperature and increasing the rotation speed at the same time, the intercolumnar gap width and the column diameter were reduced, while the feather arms were extended and the over-all porosity was increased. The higher tortuosity and geometry factor (g) indicate that the porosity was increased more by the longer feather arms than it was decreased by the smaller intercolumnar gaps. Thus, the microstructure can be referred to as ’feathery’. In this way, the modification of the GZO thermal barrier coatings in this study aligns with similar variations performed in the framework of past studies on 7YSZ [16], where increasing the rotation speed from 12 rpm to 20 rpm and decreasing the substrate temperature from 1000 °C to 840 °C during the coating process reduced the column diameter by approximately 50%, from 15–30 µm to 8–15 µm, and the gap width from 2 µm to 1.2 µm while increasing the feather arm length.
However, the material properties, such as melting point, vapor pressure, condensation enthalpies, theoretical density or emissivity, influence the columnar structure and have to be considered when determining the specific process parameter windows for new compositions.
This indicates why 7YSZ columns grow straightly, whereas the GZO counterparts exhibited a clear curvature against the rotation direction. Moreover, re-nucleation occurred once a thickness of 165–200 µm for GZO1 and 105–140 µm for GZO4 was achieved and different dominant growth direction prevailed, as shown in Figure 1(c1,c4)
The explanation for this bending behavior is still under investigation. However, first observations indicate that it is both coater-specific and material-specific. While in some studies [20,24,25] the EB-PVD GZO TBCs were also bent, other studies [39,40,41] report straight GZO columns without a comparable behavior at similar deposition parameters (substrate temperature: 800–1030 °C, rotation speed: 7–25 rpm). At the same time, other TBC layers such as 7YSZ [16], Al2O3 [11], DySZ [8] or 65YZ [9] produced by the same EB-PVD coater did not exhibit a comparable curvature.
Further variations of the EB-PVD process parameters for GZO conducted by the authors (not shown here) indicate that the bending of the columns was more pronounced when lowering the substrate temperature, whereas straight columns can be created with substrate temperatures above 1030 °C. At an increased substrate temperature, more thermal energy is provided that could facilitate the diffusion of the newly condensing particles on the surface into energetically favorable positions, meaning a growth perpendicular to the surface might be naturally favorable. At lower temperatures, the samples are thermally less activated and the diffusion, that reduces the curvature, might be less pronounced for GZO.
The large discrepancy of porosity values with respect to the different measurement procedure indicates the inhomogeneous character of the porosity in EB-PVD coatings (intercolumnar versus intracolumnar, upper section versus entire coating) and the attention that needs to be taken when choosing the method for further interpretation of the derived porosity values. He-pycnometry, which covers the entity of the open pores at a large scale and takes the three-dimensional character of the pores into account, gives a good idea about the overall porosity of the coating. However, as can be seen in Figure 1(c1–c4), the porosity varies with respect to the coating height. The limited incline of the infiltration depth shows that with reactive TBCs, such as GZO, only the porosity of the upper coating is decisive for the infiltration behavior. Hence, He-pycnometry is less suitable for this aspect than an ImageJ picture analysis of the upper TBC section.
4.2. Effect of the Microstructure on the Infiltration and Reaction Kinetics
‘Feathery’ 7YSZ microstructures with higher porosities compared to standard microstructures with less porosity have been proven to slow down the CMAS infiltration kinetics due to narrower intercolumnar gaps and longer feather arms that reduce the capillary forces. These studies [16,17,18] have led to a conclusion that the pore network is more influential than the actual total porosity on the CMAS infiltration resistance. By careful processing, this pore network can be tailored. However, the state-of-the-art material 7YSZ exhibits a reduced reactivity with CMAS, which is needed to seal the porosity with reaction products.
The microstructural effect was clearly observed in yttria-rich zirconia coatings within two studies by the same research group where different microstructures of the same TBC material were created due to different ingot systems used in the EB-PVD coating process. Exposing those two microstructures (dual ingots 7YSZ and yttria [10] and single ingot 65YZ [26]), to molten CMAS resulted in different infiltration behavior and reaction kinetics, with infiltration depths being 9%–12% higher after only 40% of the annealing time (20 h versus 50 h at 1250 °C).
GZO is known for its CMAS resistance and it was shown that microstructure sometimes can greatly influence its protective nature [42]. In a recent comparative study [26] with EB-PVD GZO and yttria rich zirconia (65YZ), the microstructure of the GZO coating (same as GZO1 in this study) was proven to be a defining factor for the poor CMAS resistance (by a factor of 2.6–3.2 less protective compared to the 65YZ). Based on that study, microstructural refinement of GZO was executed in this work. In this study, it is now clearly demonstrated that the modification of the pore network of EB-PVD GZO enhanced the CMAS infiltration resistance.
The presence of smaller intercolumnar gaps and longer feather arms (GZO4) is beneficial to reduce the infiltration depth. The narrower gaps were sealed faster and more effectively by the primary reaction product apatite slowing down the flow of the molten residue into the coating even after 10 min, as shown in Figure 8d–f. Larger gaps (GZO1), however, could not always be sealed immediately by the apatite, as it can be seen in Figure 8a–c. Instead, CMAS residue could be found in pockets under those larger gaps after 10 min at 1250 °C, consequently allowing deeper infiltration. The reprecipitation of a reactive phase is reached at local oversaturation of the melt with zirconia or gadolina, which is reached faster at a high solute–solvent ratio. As in large intercolumnar gaps, the more solvent was available for the same amount of solute, the more time was needed to reach the point of local oversaturation compared to smaller gaps.
The slight increase in the infiltration depth between 10 min and 50 h in both microstructures indicates that the major part of the sealing process was achieved during the initial few minutes. A similar non-linear infiltration behavior with respect to time was also observed [43] for APS 7YSZ TBCs infiltrated with volcanic ashes. This corroborates the importance of the intercolumnar gap width as a defining microstructural feature with respect to the CMAS resistance.
In contrast, the reaction layer thickness was partially influenced by the microstructures. For CMAS1, it was approximately the same for GZO1 and GZO4, as can be seen in Figure 7. Once the intercolumnar gaps were sealed by the crystalline reaction product, the diffusion of the elements needed for the formation of additional reaction products was performed through the residue–reaction-product interface via the reaction phases (presumably the grain boundaries between the crystalline reaction products). The intercolumnar gaps and feather arms no longer play a relevant role for the transport of the necessary elements for the reaction layer growth at the interface.
In contrast, with the formation of more than one reaction phase, the microstructure could indirectly influence the reaction layer formation, when one phase (garnet in this case) grew stronger due to microstructural effects and could affect the formation of the other phase after additional annealing time. In the case of CMAS2, a stronger garnet formation in the initial stages (after 5 h) due to larger intercolumnar gaps could slow down the formation of apatite in the further reaction process (as seen after 50 h in Figure 7).
The results derived from this study indicate that a microstructure advantageous for extended CMAS resistance consists of a coating with small column diameters (creating a larger density of intercolumnar gaps), narrow intercolumnar gaps (able to be sealed quickly), long feather arms (reducing the capillary forces), and increased porosity, which consists mainly of intracolumnar porosity (meaning a ratio of intra to intercolumnar porosity larger than one). Those desirable tendencies are marked with the yellow arrows in Figure 10, which graphically summarizes the main finding of the current work for all investigated versions GZO1 to GZO4. From this graph it is obvious that GZO4 is the most CMAS-resistant microstructure of the current version, and as measured, GZO1 is the worst. GZO2 and GZO3 are situated in-between but were not investigated in the current work and are a topic of ongoing research.
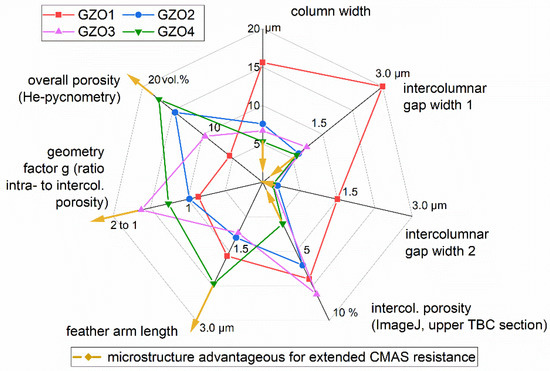
Figure 10.
Comparison of the microstructural characteristics of GZO1-4 and the changes in those characteristics advantageous for extended CMAS resistance indicated by the directions of the yellow arrows.
4.3. Influence of the Chemical Composition of the CMAS on the Reaction Kinetics
The chemical composition of the CMAS or the volcanic ash and the properties derived from its composition, such as the viscosity, play a major role in the types of reaction products that form, their kinetics and hence on the overall CMAS infiltration depth.
While apatite and fluorite formed within all the studied CMAS compositions, zirconolite was exclusively present in the case of IVA. Spinel formed only in the case of CMAS1 and IVA, while garnet was present for CMAS1, CMAS2. As can be seen from Table 4, the major difference in between Ca-rich and Ca-lean CMAS compositions was the presence of garnet as discrete crystals or continuous layer and the absence of spinel for the Ca-rich deposits. For the Si-rich volcanic ash (IVA), zirconolite was present as an outermost reaction product.
The viscosity is one of the factors that governs the infiltration kinetics. The viscosities of the deposits at 1250 °C (see Table 2) were experimentally determined in the previous studies [12,17]. In this study, their influence on the infiltration kinetics within GZO can be seen more effectively in the case of high-viscous IVA compared to the less viscous CMAS1 and CMAS2. Similar behavior was observed for non-reactive TBC material such as 7YSZ [16,17], where low-viscosity deposits infiltrated faster into the TBC. However, once a reactive component (in the case of GZO) is added, this effect becomes only evident with larger differences in the viscosity: e.g., viscosity difference between CMAS and IVA is rather higher than between CMAS1 and CMAS2, as can be seen in Figure 6. Hence, the viscosity effect is negligible between CMAS1 and CMAS2.
The reaction of IVA with GZO shows a vigorous initial apatite reaction layer compared to its CMAS counterparts. The reason can be explained on the bases of the higher viscosity of IVA: i.e., the higher viscosity allows a longer time for the reaction and hence more reaction layer thickness.
The identification/classification of the reaction phases was achieved by combining EDS and XRD analysis in this study with reference to the results of TEM analysis of the similar phases published in various studies [7,26,41]. As the occurring reaction phases can exist in a certain range of compositions [44,45], those results can be transferred to studies with slightly varying CMAS compositions.
Additionally, the changes in the individual phases will be discussed more in detail in the following section:
Apatite and Fluorite: The formation of apatite (Ca2Gd8(SiO4)6O2) as an initial reaction product due to its high reaction kinetics was observed for various rare-earth zirconates with a large variety of CMAS and VA compositions and has been described intensively in the literature [7,39,41,44,45,46]. In this study, it formed with all three deposits, both at an initial state (10 min) and at long annealing times (up to 50 h).
The ratio of the three main components (calcia, silica and gadolinia) varied with respect to the used deposit. The apatite formed with IVA contains 50% less calcia than the apatite formed with CMAS1 and CMAS2. On the contrary, despite a higher silica in IVA, the apatites formed with all three deposits have approximately the same silica content.
Fluorite (Gd,Zr,Ca)O1.x formed next to the apatite for all deposits and annealing times. As the apatite consumes more gadolina than zirconia and more silica than calcia, the melt was enriched in zirconia and calcia, which consequently resulted in the formation of fluorite close to the apatite. While for CMAS1 and IVA the spherical-shaped fluorites formed both in the intercolumnar gaps and at the coating–residue interface at a size of several µm (even after 10 min), for CMAS2 they exist sporadically in the intercolumnar gaps with a sub-µm size. The chemical composition of the fluorite phase is similar for all deposits within a range of a few mol.%, mainly consisting of 70–75 mol.% zirconia, 15–20 mol.% gadolinia, 1–6 mol.% calcia and 1–5 mol.% iron oxide. Only the CMAS1 10 min infiltration experiments with GZO4 contained higher traces of magnesia, alumina, silica and titania.
A comparison of the initial apatite and fluorite (after 10 min) with the reaction products after 50 h annealing [26] shows a slight difference in the chemical composition with a higher zirconia content for initial apatite and low percentages of magnesia, alumina, silica and titania for initial fluorite. This might be linked to the different local availability of deposit elements in the initial stage of the annealing process, the transitory, non-equilibria nature of the short-term reaction products and the higher error for EDS spot measurements of smaller particles.
The morphologies of the apatite–fluorite bilayers after longer annealing times have varied with respect to CMAS type, i.e., they were found to be finely dispersed for CMAS2, marbled and veined for IVA and in a distinct elongated-prismatic or round shape for CMAS1 (see Figure 9). This appearance mainly depends on the additional reaction phases specific to the respective CMAS chemistry e.g., garnet and zirconolite. In the case of CMAS2 and IVA, garnet and zirconolite formed extensively and integrated several elements that were barely or not dissolved in apatite and fluorite, eventually reducing the quantity of residue between apatite and fluorite. In contrast, with CMAS1, the garnet formed sporadically, i.e., more residue remains between the apatite and fluorite. For CMAS1 and IVA, the two phases grew in size and became more distinguishable with longer annealing times (Figure 9). While the finely dispersed bilayer at the interface of the unreacted coating just formed recently, the phases at the former column tips formed initially and could grow more extensively in the course of the longer annealing time. The findings described above were nearly independent of the GZO microstructure.
Spinel and Zirconolite: Due to the formation of apatite and fluorite, the CMAS/VA melts were primarily depleted in silica and calcia and thus enriched in magnesia, alumina, iron oxide and titania. This composition of the melt then promoted the formation of spinel ((MgAl2−xFex)O4), garnet ((Gd,Zr,Ca)3(Mg,Al,Fe,Ti,Zr)2(Si,Al,Fe)3O12) or zirconolite ((Ca,Gd,Zr)2 (Fe,Ti,Al,Mg)2O7), depending on the chemical composition of the applied CMAS/VA deposit.
While it was not yet visible after the short annealing experiments, spinel formed as a secondary reaction product after longer annealing times in the intercolumnar gaps for CMAS1 and IVA and close to the surface for CMAS1. In CMAS2, no spinel was detected. Instead, these elements of the deposit were incorporated into garnet and the smaller, dark particles in the lower reaction zone. For IVA, instead of garnet or spinel, zirconolite formed on the surface due to the higher titania content in the melt that accumulated at 19–20 mol.% in the reaction phase. This behavior was also observed in previous studies [10]. As between 16 and 20 mol.% iron oxide was bonded in the zirconolite, the melt was depleted in this element, which hindered the formation of spinel and garnet. The same formation of those reaction products was observed by Mechnich and Braue [7], when infiltrating EB-PVD GZO with artificial volcanic ash having a bulk composition close to that of IVA [47]. Although the zirconolite precipitated within the CMAS residue over the entire length of the coating on top of the apatite, it did not offer any protection against infiltration. The larger (for 10 min and 5 h) or similar (for 50 h) apatite thickness of IVA compared to CMAS1 (as seen in Figure 7) indicates that the zirconolite did not exhibit a sealing or protective behavior that positively influenced the reaction kinetics of subjacent layers, as did the garnet in case of CMAS2.
Garnet: Garnet has a complex crystal structure with the general formula A3B2C3O12 and can accommodate a multitude of different cations in the three different positions A, B and C. The dodecahedral site A (coordination number, CN = 8) can be occupied by Ca, Zr or Gd, the octahedral B position (CN = 6) by Al, Mg, Fe, Ti and Zr and the tetrahedral site C (CN = 4) by Si, Al and Fe. With the elements used in this study the garnet formula can be generalized as (Gd,Zr,Ca)3(Mg,Al,Fe,Ti,Zr)2(Si,Al,Fe)O12.
Iron has proved to be a key element in the formation of the garnet phase for GZO. Various studies using FeO-free CMAS, such as the widely used 33CaO-9MgO-13AlO1.5-45SiO2 [6], did not detect any garnet formation during the interaction of GZO with CMAS [39,41,45,48]. When Fe-containing 33CaO-13AlO1.5-10FeOx-44SiO2 was used in the infiltration experiments [39], dendritic garnets were found within the residual melt and thought to be formed during cooling. The CMAS used in this study contained 7.8 and 8.7 mol.% FeO, respectively. Early and quick formation of garnet crystals, even after 10 min at the TBC/CMAS interface, and the increasing garnet quantity and reaction layer thickness with respect to time, prove that it formed as a reaction product. In the case of IVA, despite its high FeO content, garnet formation did not take place, as the majority of FeO was preferentially incorporated into zirconolite due to the higher TiO2 content in IVA. As a result, no sufficient quantities of free FeO remained in the residue to form additional garnet.
Besides iron oxide, calcia is another key component promoting the formation of the garnet phase in the case of GZO. With the larger calcia content of 27.0 mol.% in CMAS2 compared to 24.7 mol.% in CMAS1, garnet formed a continuous layer instead of sporadic garnet crystals. The fact that the garnet containing more Zr4+ and Ca2+ formed more extensively than one with more Gd3+ under identical annealing conditions, indicates that the dodecahedral site A preferentially accommodates those first two cations.
The extensive formation of a continuous garnet phase as a part of the reaction layer was beneficial to the CMAS resistance. Comparing the chemical composition of the various reaction phases shows that garnet contained less GdO1.5 and ZrO2 and bound more CMAS constituents than apatite; i.e., garnet consumes less coating material GZO and more CMAS deposit. While apatite contained approximately 50 mol.% of the oxides GdO1.5 and ZrO2, the garnet phase only contained around 10–20 mol.% GdO1.5 and ZrO2 (Table 4 and Table 5 and [26]). In this way, a higher quantity of CMAS was bonded in crystalline products with high melting point and increased chemical stability which left less glassy residue for further infiltration.
Furthermore, as can be seen in Figure 7, in the presence of a continuous garnet layer (formed with CMAS2), the reaction layer thickness was reduced significantly compared to the reaction layer without continuous garnet (formed with CMAS1), between 24% and 85% considering only the apatite–fluorite layer, and up to 52% when the entire continuous layer including the garnet is taken into account.
Additionally, a continuous garnet layer structurally stabilizes the subjacent apatite and fluorite network (see Figure 9b,e). In the case of CMAS2, the apatite and fluorite were existent as a marbled, veined biphase network with no visible residue in between, which was however the case for the CMAS1 samples with only discontinuous garnet. This behavior was exhibited for all time intervals once the garnet layer forms as a continuous manner (5 h: not shown here, 50 h: Figure 9).
No distinct variation of the chemical composition of reaction products with respect to the microstructures was observed within the scope of this study.
5. Conclusions
Gadolinium zirconate thermal barrier coatings with various microstructures were deposited by the EB-PVD technique. After being exposed to three CMAS/VA deposits for time intervals between 10 min and 50 h, different infiltration and reaction kinetics could be observed, as well as various reaction products. The intercolumnar gaps could be effectively sealed by quick formation of the reaction products apatite and garnet. Depending on the chemical composition of the CMAS, phases such as zirconolite, spinel and garnet, were reprecipitated in different proportions.
A high rotation speed of 20 rpm combined with a low substrate temperature of 930 °C created a microstructure that reduced the infiltration depth by 56%–72% in comparison to the less favorable GZO1 microstructure. By this, the infiltration depth could be reduced from around 180–210 µm for GZO1 to only 52–78 µm for the optimized GZO4. The following conclusions can be drawn from this study:
- EB-PVD GZO microstructure can be significantly modified by altering the substrate temperature and rotation speed during the coating process. Its microstructural characteristics (such as column diameters, intercolumnar gap width or feather arm length) varied within the range between 50% and 86% and its porosity between 62% and 68% among all the produced microstructures (with reference to the respective maximum value).
- Microstructures that are advantageous for extended CMAS resistance consist of thin columns, narrow intercolumnar gaps, long feather arms, high porosity and a high geometry factor (g), i.e. ratio of intra- to intercolumnar porosity.
- The infiltration kinetics is strongly dependent on the EB-PVD microstructure. For suitable EB-PVD microstructures, the majority of the gap sealing process is achieved within the initial few minutes. Subsequently, the infiltration is stopped or continues only non-linearly.
- The reaction characteristics are partially influenced by the microstructure. Growth of the reaction layer is rather determined by the phase stability, the interchange of ions between reaction phases and the CMAS residue and the morphology of the reaction products. In the case of multi-reaction layers, the microstructure can significantly change the reaction dynamics and phase formations.
- The melt composition plays a major role for the reaction product and kinetics. Different reaction products form as a function of the chemical composition of the CMAS and the residual melt. While apatite and fluorite are formed for all deposits used in the study, the emergence of garnet, spinel and zirconolite is chemistry-dependent.
- The garnet phase is beneficial to the CMAS resistance of TBCs as it incorporates more deposit constituents in a crystalline product and consumes less coating material than the apatite phase. Iron and calcium are key elements in forming garnet and promote its development as a continuous sealing layer. Garnet formation occurs as early as after 10 min at 1250 °C.
Author Contributions
Conceptualization, C.M., L.S. and R.N.; methodology, C.M. and R.N.; validation, C.M.; formal analysis, C.M. and P.N.; investigation, C.M. and P.N.; data curation, C.M.; writing—original draft preparation, C.M.; writing—review and editing, R.N., U.S. and L.S.; visualization, C.M.; supervision U.S. and R.N.; project administration R.N. and C.M.; funding acquisition: R.N., L.S, U.S. and C.M. All authors have read and agreed to the published version of the manuscript.
Funding
The work was performed in the framework of the Research Project DFG SCHU 1372/5 and LE 1373/34 funded by the Deutsche Forschungsgemeinschaft (DFG, Germany Research Foundation). The authors acknowledge the financial support.
Institutional Review Board Statement
Not applicable.
Informed Consent Statement
Not applicable.
Data Availability Statement
The data present in this study are available from the corresponding author upon reasonable request. The data are not publicly available as at this time as the data also forms part of an ongoing study.
Acknowledgments
The authors would like to express their gratitude to J. Brien, A. Handwerk and D. Peters from DLR Cologne for manufacturing the EB-PVD GZO layers, as well as for technical support and advice. Additionally, the authors would like to thank P. Mechnich for technical assistance and scientific discussions.
Conflicts of Interest
The authors declare no conflict of interest. The funders had no role in the design, execution, interpretation, or writing of the study.
References
- Padture, N.P.; Gell, M.; Jordan, E.H. Thermal Barrier Coatings for Gas-Turbine Engine Applications. Science 2002, 296, 280. [Google Scholar] [CrossRef]
- Levi, C.G.; Hutchinson, J.W.; Vidal-Setif, M.H.; Johnson, C.A. Environmental degradation of thermal-barrier coatings by molten deposits. MRS Bull. 2012, 37, 932–941. [Google Scholar] [CrossRef]
- Naraparaju, R.; Lau, H.; Lange, M.; Fischer, C.; Kramer, D.; Schulz, U.; Weber, K. Integrated testing approach using a customized micro turbine for a volcanic ash and CMAS related degradation study of thermal barrier coatings. Surf. Coat. Technol. 2018, 337, 198–208. [Google Scholar] [CrossRef]
- Wellman, R.G.; Nicholls, J.R. Erosion, corrosion and erosion–corrosion of EB PVD thermal barrier coatings. Tribol. Int. 2008, 41, 657–662. [Google Scholar] [CrossRef]
- Steinberg, L.; Naraparaju, R.; Heckert, M.; Mikulla, C.; Schulz, U.; Leyens, C. Erosion behavior of EB-PVD 7YSZ coatings under corrosion/erosion regime: Effect of TBC microstructure and the CMAS chemistry. J. Eur. Ceram. Soc. 2018, 38, 5101–5112. [Google Scholar] [CrossRef]
- Krämer, S.; Yang, J.; Levi, C.G.; Johnson, C.A. Thermochemical Interaction of Thermal Barrier Coatings with Molten CaO–MgO–Al2O3–SiO2 (CMAS) Deposits. J. Am. Ceram. Soc. 2006, 89, 3167–3175. [Google Scholar] [CrossRef]
- Mechnich, P.; Braue, W. Volcanic Ash-Induced Decomposition of EB-PVD Gd2Zr2O7 Thermal Barrier Coatings to Gd-Oxyapatite, Zircon, and Gd, Fe-Zirconolite. J. Am. Ceram. Soc. 2013, 96, 1958–1965. [Google Scholar] [CrossRef]
- Schulz, U.; Braue, W. Degradation of La2Zr2O7 and other novel EB-PVD thermal barrier coatings by CMAS (CaO-MgO-Al2O3-SiO2) and volcanic ash deposits. Surf. Coat. Technol. 2013, 235, 165–173. [Google Scholar] [CrossRef]
- Gomez Chavez, J.J.; Naraparaju, R.; Mechnich, P.; Kelm, K.; Schulz, U.; Ramana, C.V. Effects of yttria content on the CMAS infiltration resistance of yttria stabilized thermal barrier coatings system. J. Mater. Sci. Technol. 2020, 43, 74–83. [Google Scholar] [CrossRef]
- Naraparaju, R.; Chavez, J.J.G.; Schulz, U.; Ramana, C.V. Interaction and infiltration behavior of Eyjafjallajokull, Sakurajima volcanic ashes and a synthetic CMAS containing FeO with/in EB-PVD ZrO2-65 wt% Y-2 O-3 coating at high temperature. Acta Mater. 2017, 136, 164–180. [Google Scholar] [CrossRef]
- Naraparaju, R.; Pubbysetty, R.P.; Mechnich, P.; Schulz, U. EB-PVD alumina (Al2O3) as a top coat on 7YSZ TBCs against CMAS/VA infiltration: Deposition and reaction mechanisms. J. Eur. Ceram. Soc. 2018, 38, 3333–3346. [Google Scholar] [CrossRef]
- Mikulla, C.; Naraparaju, R.; Schulz, U.; Toma, F.-L.; Barbosa, M.; Steinberg, L.; Leyens, C. Investigation of CMAS Resistance of Sacrificial Suspension Sprayed Alumina Topcoats on EB-PVD 7YSZ Layers. J. Therm. Spray Technol. 2020, 29, 90–104. [Google Scholar] [CrossRef]
- Shan, X.; Luo, L.; Chen, W.; Zou, Z.; Guo, F.; He, L.; Zhang, A.; Zhao, X.; Xiao, P. Pore filling behavior of YSZ under CMAS attack: Implications for designing corrosion-resistant thermal barrier coatings. J. Am. Ceram. Soc. 2018, 101, 5756–5770. [Google Scholar] [CrossRef]
- Gildersleeve, E.; Viswanathan, V.; Sampath, S. Molten silicate interactions with plasma sprayed thermal barrier coatings: Role of materials and microstructure. J. Eur. Ceram. Soc. 2019, 39, 2122–2131. [Google Scholar] [CrossRef]
- Rezanka, S.; Mack, D.E.; Mauer, G.; Sebold, D.; Guillon, O.; Vaßen, R. Investigation of the resistance of open-column-structured PS-PVD TBCs to erosive and high-temperature corrosive attack. Surf. Coat. Technol. 2017, 324, 222–235. [Google Scholar] [CrossRef]
- Naraparaju, R.; Huttermann, M.; Schulz, U.; Mechnich, P. Tailoring the EB-PVD columnar microstructure to mitigate the infiltration of CMAS in 7YSZ thermal barrier coatings. J. Eur. Ceram. Soc. 2017, 37, 261–270. [Google Scholar] [CrossRef]
- Naraparaju, R.; Chavez, J.J.G.; Niemeyer, P.; Hess, K.U.; Song, W.J.; Dingwell, D.B.; Lokachari, S.; Ramana, C.V.; Schulz, U. Estimation of CMAS infiltration depth in EB-PVD TBCs: A new constraint model supported with experimental approach. J. Eur. Ceram. Soc. 2019, 39, 2936–2945. [Google Scholar] [CrossRef]
- Kabir, M.R.; Sirigiri, A.K.; Naraparaju, R.; Schulz, U. Flow Kinetics of Molten Silicates through Thermal Barrier Coating: A Numerical Study. Coatings 2019, 9, 332. [Google Scholar] [CrossRef]
- Munawar, A.U.; Schulz, U.; Cerri, G.; Lau, H. Microstructure and cyclic lifetime of Gd and Dy-containing EB-PVD TBCs deposited as single and double-layer on various bond coats (vol 245C, pg 92, 2014). Surf. Coat. Technol. 2015, 279, 53. [Google Scholar] [CrossRef]
- Schulz, U.; Nowotnik, A.; Kunkel, S.; Reiter, G. Effect of processing and interface on the durability of single and bilayer 7YSZ/gadolinium zirconate EB-PVD thermal barrier coatings. Surf. Coat. Technol. 2020, 381, 125107. [Google Scholar] [CrossRef]
- Schulz, U.; Terry, S.G.; Levi, C.G. Microstructure and texture of EB-PVD TBCs grown under different rotation modes. Mater. Sci. Eng. A 2003, 360, 319–329. [Google Scholar] [CrossRef]
- Naraparaju, R.; Schulz, U.; Mechnich, P.; Döbber, P.; Seidel, F. Degradation study of 7wt.% yttria stabilised zirconia (7YSZ) thermal barrier coatings on aero-engine combustion chamber parts due to infiltration by different CaO–MgO–Al2O3–SiO2 variants. Surf. Coat. Technol. 2014, 260, 73–81. [Google Scholar] [CrossRef]
- Naraparaju, R.; Mechnich, P.; Schulz, U.; Rodriguez, G.C.M. The Accelerating Effect of CaSO4 Within CMAS (CaO-MgO-Al2O3-SiO2) and Its Effect on the Infiltration Behavior in EB-PVD 7YSZ. J. Am. Ceram. Soc. 2016, 99, 1398–1403. [Google Scholar] [CrossRef]
- Schmitt, M.P.; Rai, A.K.; Bhattacharya, R.; Zhu, D.; Wolfe, D.E. Multilayer thermal barrier coating (TBC) architectures utilizing rare earth doped YSZ and rare earth pyrochlores. Surf. Coat. Technol. 2014, 251, 56–63. [Google Scholar] [CrossRef]
- Munawar, A.U.; Schulz, U.; Cerri, G. Microstructural Evolution of GdZ and DySZ Based EB-PVD TBC Systems After Thermal Cycling at High Temperature. J. Eng. Gas Turbines Power 2013, 135, 6. [Google Scholar] [CrossRef]
- Gomez Chavez, J.J.; Naraparaju, R.; Mikulla, C.; Mechnich, P.; Kelm, K.; Ramana, C.V.; Schulz, U. Comparative Study of EB-PVD Gadolinium-Zirconate and Yttria-rich Zirconia Coatings Performance against Fe-containing Calcium-Magnesium-Aluminosilicate (CMAS) Infiltration. Corros. Sci. 2021, 190, 109660. [Google Scholar] [CrossRef]
- Nieto, A.; Agrawal, R.; Bravo, L.; Hofmeister-Mock, C.; Pepi, M.; Ghoshal, A. Calcia–magnesia–alumina–silicate (CMAS) attack mechanisms and roadmap towards Sandphobic thermal and environmental barrier coatings. Int. Mater. Rev. 2021, 66, 451–492. [Google Scholar] [CrossRef]
- Renteria, A.F.; Saruhan, B.; Schulz, U.; Raetzer-Scheibe, H.J.; Haug, J.; Wiedenmann, A. Effect of morphology on thermal conductivity of EB-PVD PYSZ TBCs. Surf. Coat. Technol. 2006, 201, 2611–2620. [Google Scholar] [CrossRef]
- Wolfe, D.E.; Singh, J.; Miller, R.A.; Eldridge, J.I.; Zhu, D.-M. Tailored microstructure of EB-PVD 8YSZ thermal barrier coatings with low thermal conductivity and high thermal reflectivity for turbine applications. Surf. Coat. Technol. 2005, 190, 132–149. [Google Scholar] [CrossRef]
- Jang, B.K.; Matsubara, H. Influence of rotation speed on microstructure and thermal conductivity of nano-porous zirconia layers fabricated by EB-PVD. Scr. Mater. 2005, 52, 553–558. [Google Scholar] [CrossRef]
- Schulz, U.; Fritscher, K.; Leyens, C.; Peters, M.; Kaysser, W.A. Thermocyclic Behavior of Differently Stabilized and structured EB-PVD thermal barrier coatings. Mater. Werkst. 1997, 28, 370–376. [Google Scholar] [CrossRef]
- Matsumoto, M.; Wada, K.; Yamaguchi, N.; Kato, T.; Matsubara, H. Effects of substrate rotation speed during deposition on the thermal cycle life of thermal barrier coatings fabricated by electron beam physical vapor deposition. Surf. Coat. Technol. 2008, 202, 3507–3512. [Google Scholar] [CrossRef]
- Ganvir, A.; Joshi, S.; Markocsan, N.; Vassen, R. Tailoring columnar microstructure of axial suspension plasma sprayed TBCs for superior thermal shock performance. Mater. Des. 2018, 144, 192–208. [Google Scholar] [CrossRef]
- Jesuraj, S.A.; Kuppusami, P.; Dharini, T.; Panda, P.; Devapal, D. Effect of substrate temperature on microstructure and nanomechanical properties of Gd2Zr2O7 coatings prepared by EB-PVD technique. Ceram. Int. 2018, 44, 18164–18172. [Google Scholar] [CrossRef]
- Jesuraj, S.A.; Kuppusami, P.; Ajith Kumar, S.; Panda, P.; Udaiyappan, S. Investigation on the effect of deposition temperature on structural and nanomechanical properties of electron beam evaporated lanthanum zirconate coatings. Mater. Chem. Phys. 2019, 236, 121789. [Google Scholar] [CrossRef]
- Park, C.; Choi, S.; Chae, J.; Kim, S.; Kim, H.; Oh, Y.-S. Effect of Substrate Rotation on the Phase Evolution and Microstructure of 8YSZ Coatings Fabricated by EB-PVD. J. Korean Ceram. Soc. 2016, 53, 81–86. [Google Scholar] [CrossRef]
- Renteria, A.F. A Small-Angle Scattering Analysis of the Influence of Manufacture and Thermal Induced Morphological Changes on the Thermal Conductivity of EBPVD PYSZ Thermal Barrier Coatings. Ph.D. Dissertation, RWTH Aachen, Aachen, Germany, 2007. [Google Scholar]
- Yamaguchi, N.; Wada, K.; Kimura, K.; Matsubara, H. Microstructure modification of yttria-stabilized zirconia layers prepared by EB-PVD. J. Ceram. Soc. Jpn. 2003, 111, 883–889. [Google Scholar] [CrossRef]
- Jackson, R.W.; Zaleski, E.M.; Hazel, B.T.; Begley, M.R.; Levi, C.G. Response of molten silicate infiltrated Gd2Zr2O7 thermal barrier coatings to temperature gradients. Acta Mater. 2017, 132, 538–549. [Google Scholar] [CrossRef]
- Karaoglanli, A.C.; Doleker, K.M.; Ozgurluk, Y. Interface failure behavior of yttria stabilized zirconia (YSZ), La2Zr2O7, Gd2Zr2O7, YSZ/La2Zr2O7 and YSZ/Gd2Zr2O7 thermal barrier coatings (TBCs) in thermal cyclic exposure. Mater. Charact. 2020, 159, 110072. [Google Scholar] [CrossRef]
- Kramer, S.; Yang, J.; Levi, C.G. Infiltration-inhibiting reaction of gadolinium zirconate thermal barrier coatings with CMAS melts. J. Am. Ceram. Soc. 2008, 91, 576–583. [Google Scholar] [CrossRef]
- Lavigne, O.; Rio, C.; Vidal-Setif, M.H.; Jaquet, V.; Joulia, A.; Tillard, L. Influence of morphology on thermal properties and CMAS resistance of gadolinium zirconate EB-PVD coatings. In Proceedings of the HELSMAC Symposium, Cambridge, UK, 7–8 April 2016. [Google Scholar]
- Rivera-Gil, M.A.; Gomez-Chavez, J.; Ramana, C.V.; Naraparaju, R.; Schulz, U.; Munoz Saldana, J. High Temperature Interaction of Volcanic Ashes with 7YSZ TBC´s produced by APS: Infiltration behavior and phase stability. Surf. Coat. Technol. 2019, 378, 124915. [Google Scholar] [CrossRef]
- Poerschke, D.L.; Levi, C.G. Phase equilibria in the calcia-gadolinia-silica system. J. Alloys Compd. 2017, 695, 1397–1404. [Google Scholar] [CrossRef]
- Perrudin, F.; Rio, C.; Vidal-Setif, M.H.; Petitjean, C.; Panteix, P.J.; Vilasi, M. Gadolinium oxide solubility in molten silicate: Dissolution mechanism and stability of Ca2Gd8(SiO4)6O2 and Ca3Gd2(Si3O9)2 silicate phases. J. Eur. Ceram. Soc. 2017, 37, 2657–2665. [Google Scholar] [CrossRef]
- Guijosa-Garcia, C.Y.; Rivera-Gil, M.A.; Ramana, C.V.; Naraparaju, R.; Schulz, U.; Muñoz-Saldaña, J. Reaction Products from High Temperature Treatments of (LaxGd1−x)2Zr2O7 System and Volcanic Ash Powder Mixtures. JOM 2022, 74, 2791–2808. [Google Scholar] [CrossRef]
- Mechnich, P.; Braue, W.; Schulz, U. High-Temperature Corrosion of EB-PVD Yttria Partially Stabilized Zirconia Thermal Barrier Coatings with an Artificial Volcanic Ash Overlay. J. Am. Ceram. Soc. 2011, 94, 925–931. [Google Scholar] [CrossRef]
- Poerschke, D.L.; Levi, C.G. Effects of cation substitution and temperature on the interaction between thermal barrier oxides and molten CMAS. J. Eur. Ceram. Soc. 2015, 35, 681–691. [Google Scholar] [CrossRef]


Disclaimer/Publisher’s Note: The statements, opinions and data contained in all publications are solely those of the individual author(s) and contributor(s) and not of MDPI and/or the editor(s). MDPI and/or the editor(s) disclaim responsibility for any injury to people or property resulting from any ideas, methods, instructions or products referred to in the content. |
© 2023 by the authors. Licensee MDPI, Basel, Switzerland. This article is an open access article distributed under the terms and conditions of the Creative Commons Attribution (CC BY) license (https://creativecommons.org/licenses/by/4.0/).