
Performance-Based Expressway Asphalt Pavement Structural Surface Layer Modulus Matching Mode Research


Abstract
:1. Introduction
2. Establishment of Asphalt Pavement Simulation Model
2.1. Principles of Numerical Simulation
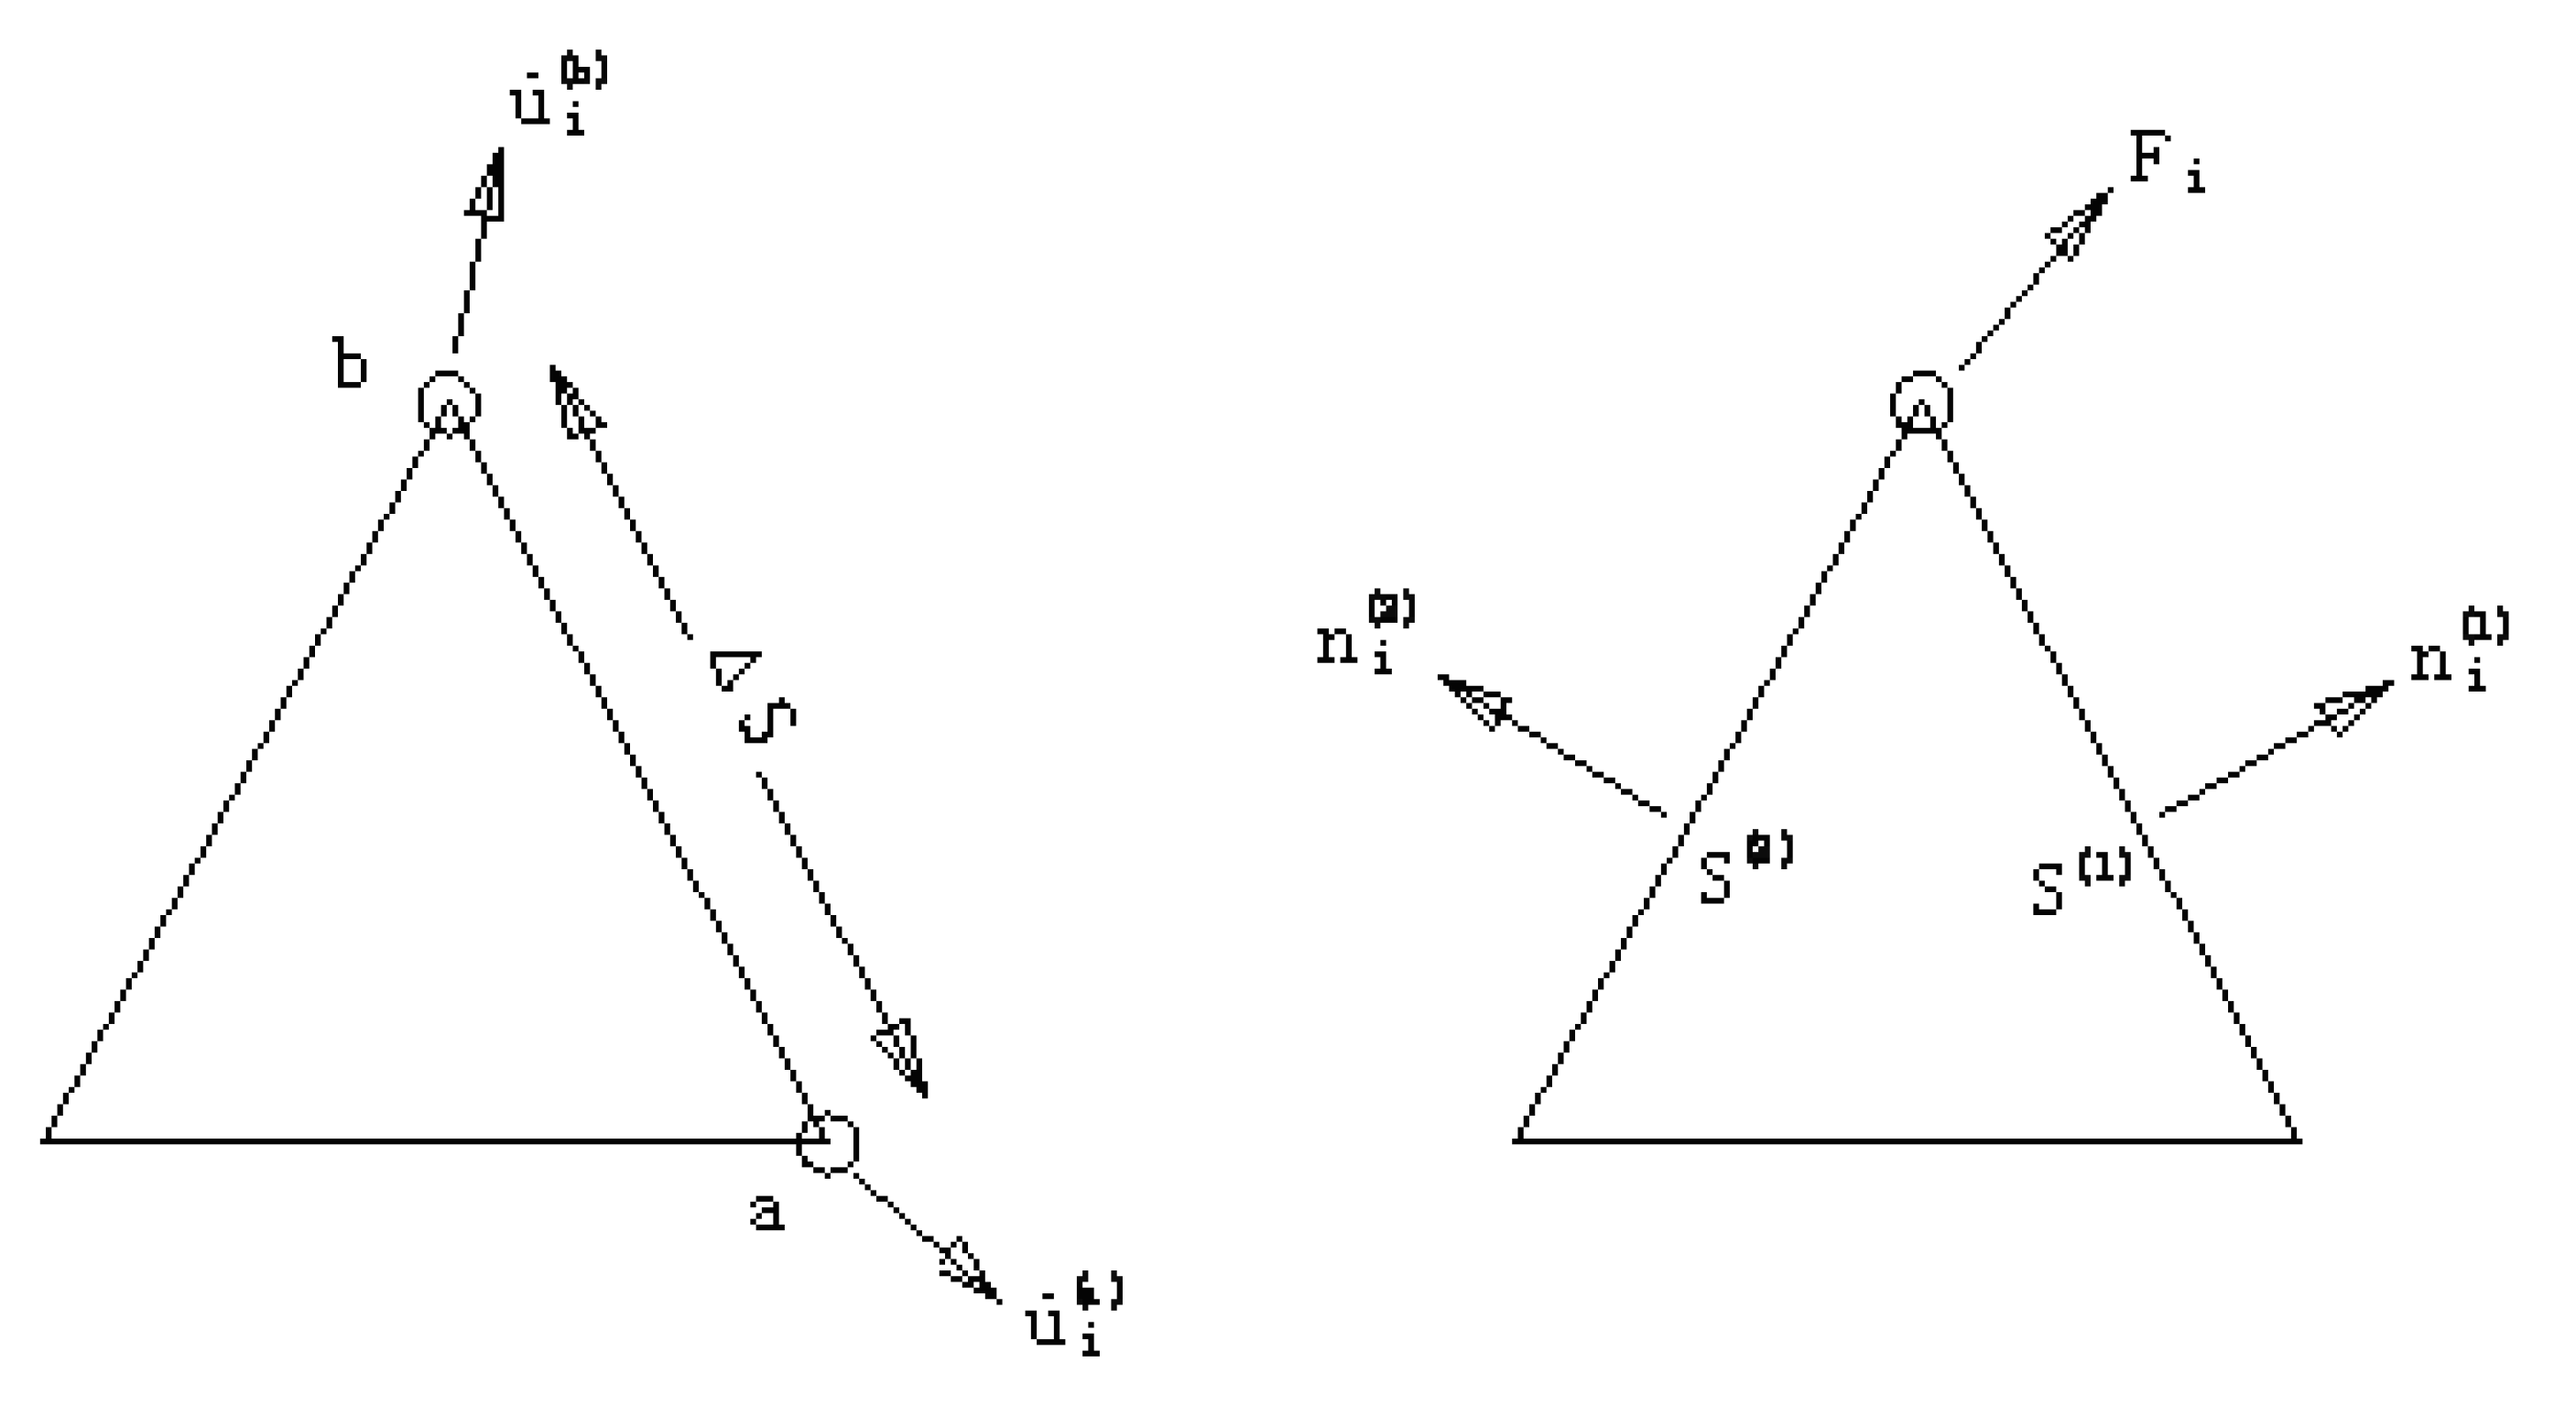
2.1.1. Finite Difference Equation
2.1.2. Equation of Motion and Displacement Calculation
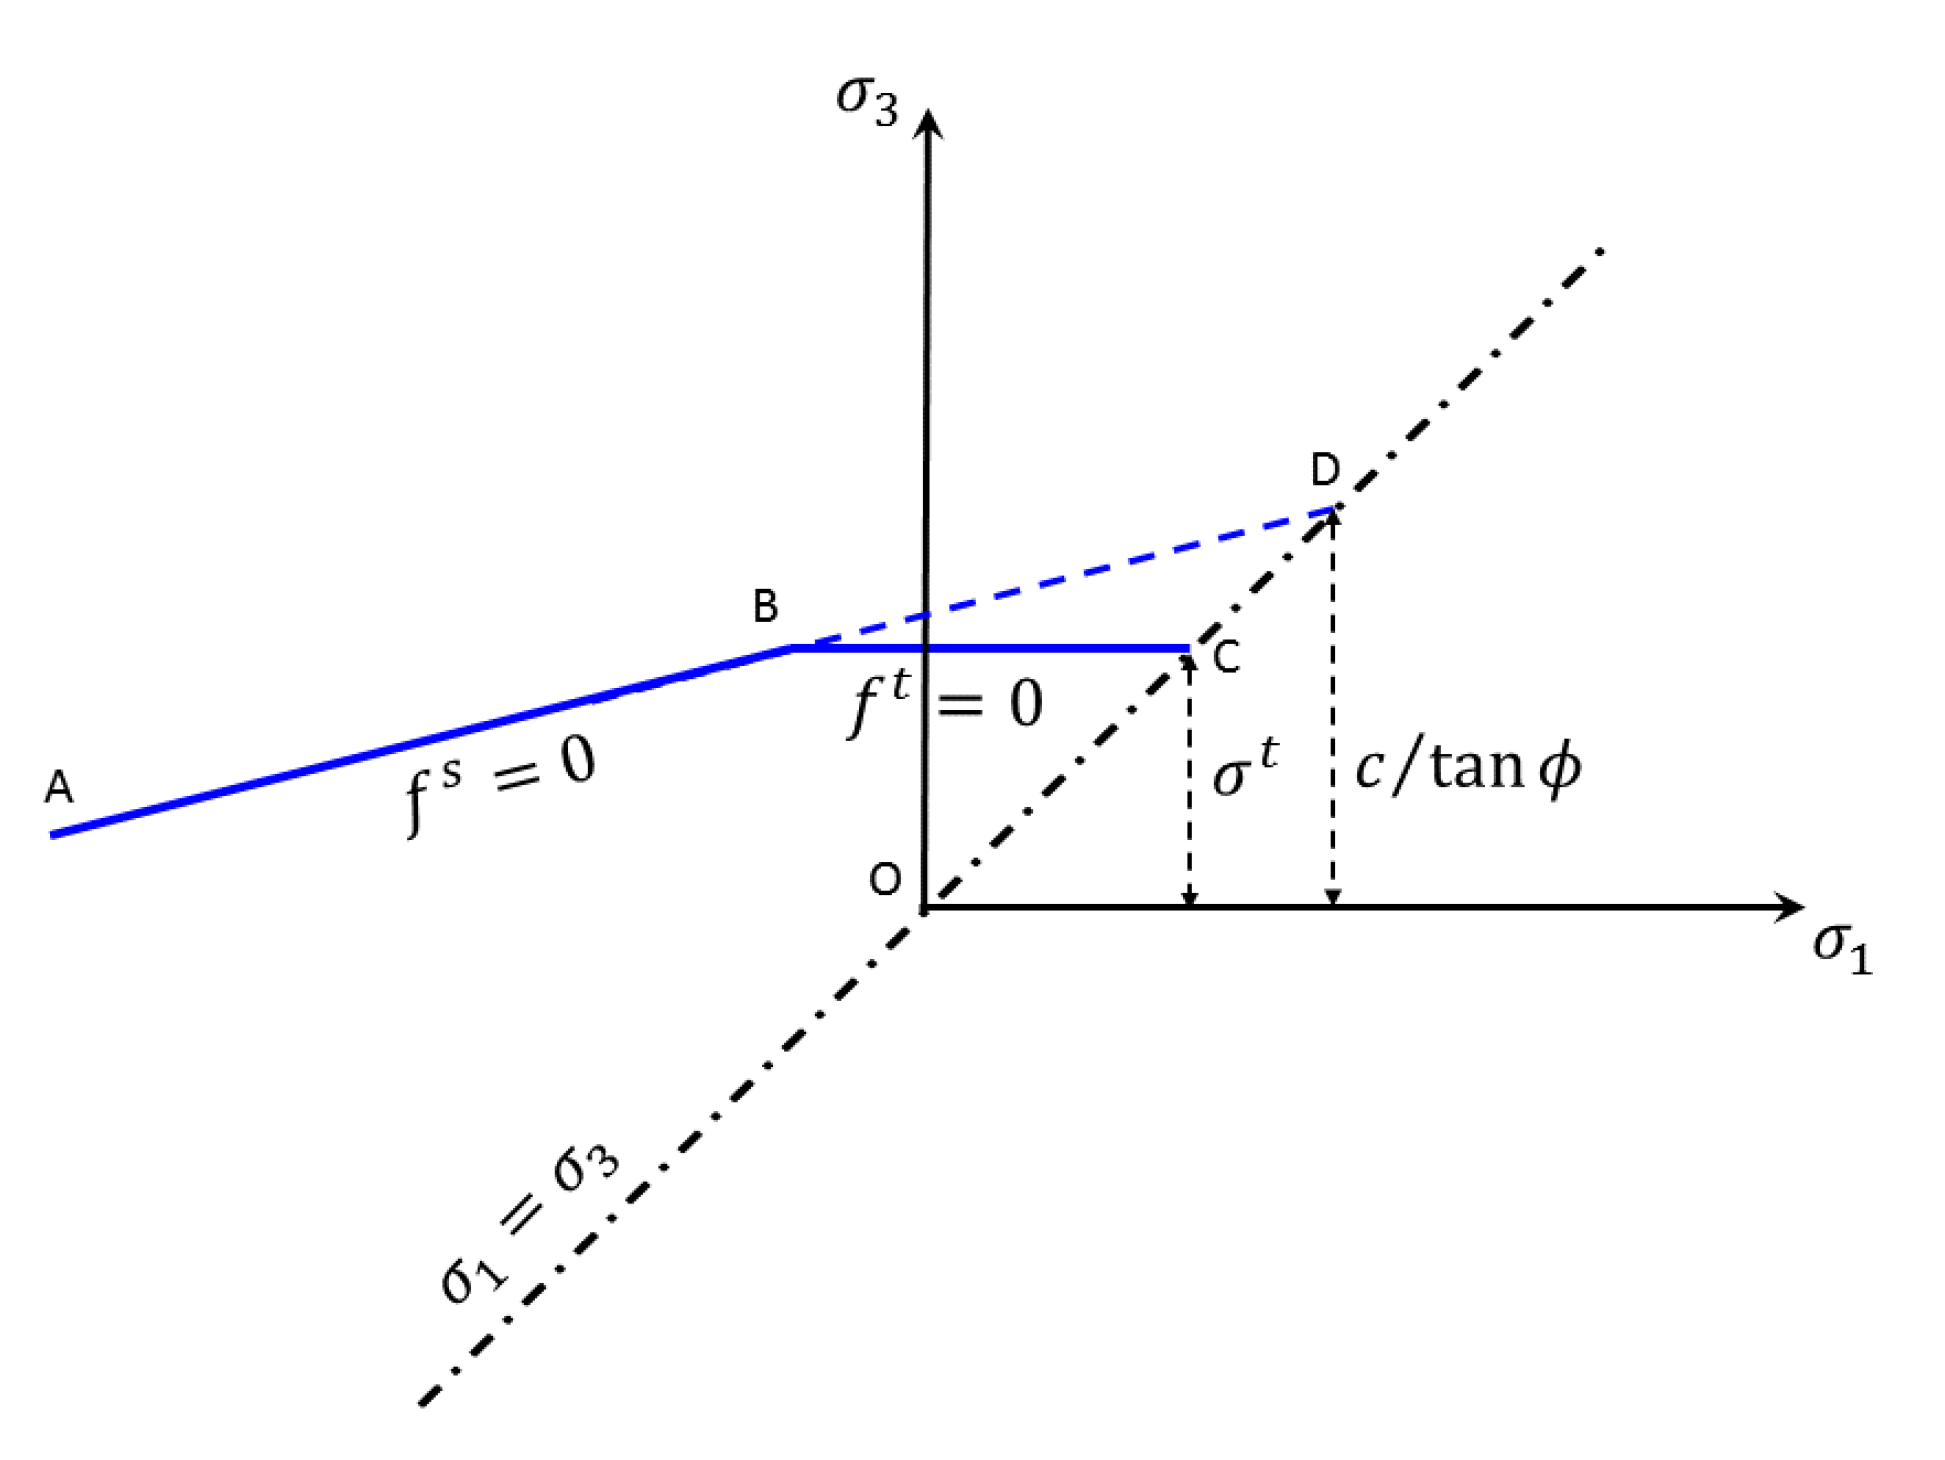
2.1.3. Constitutive Relation
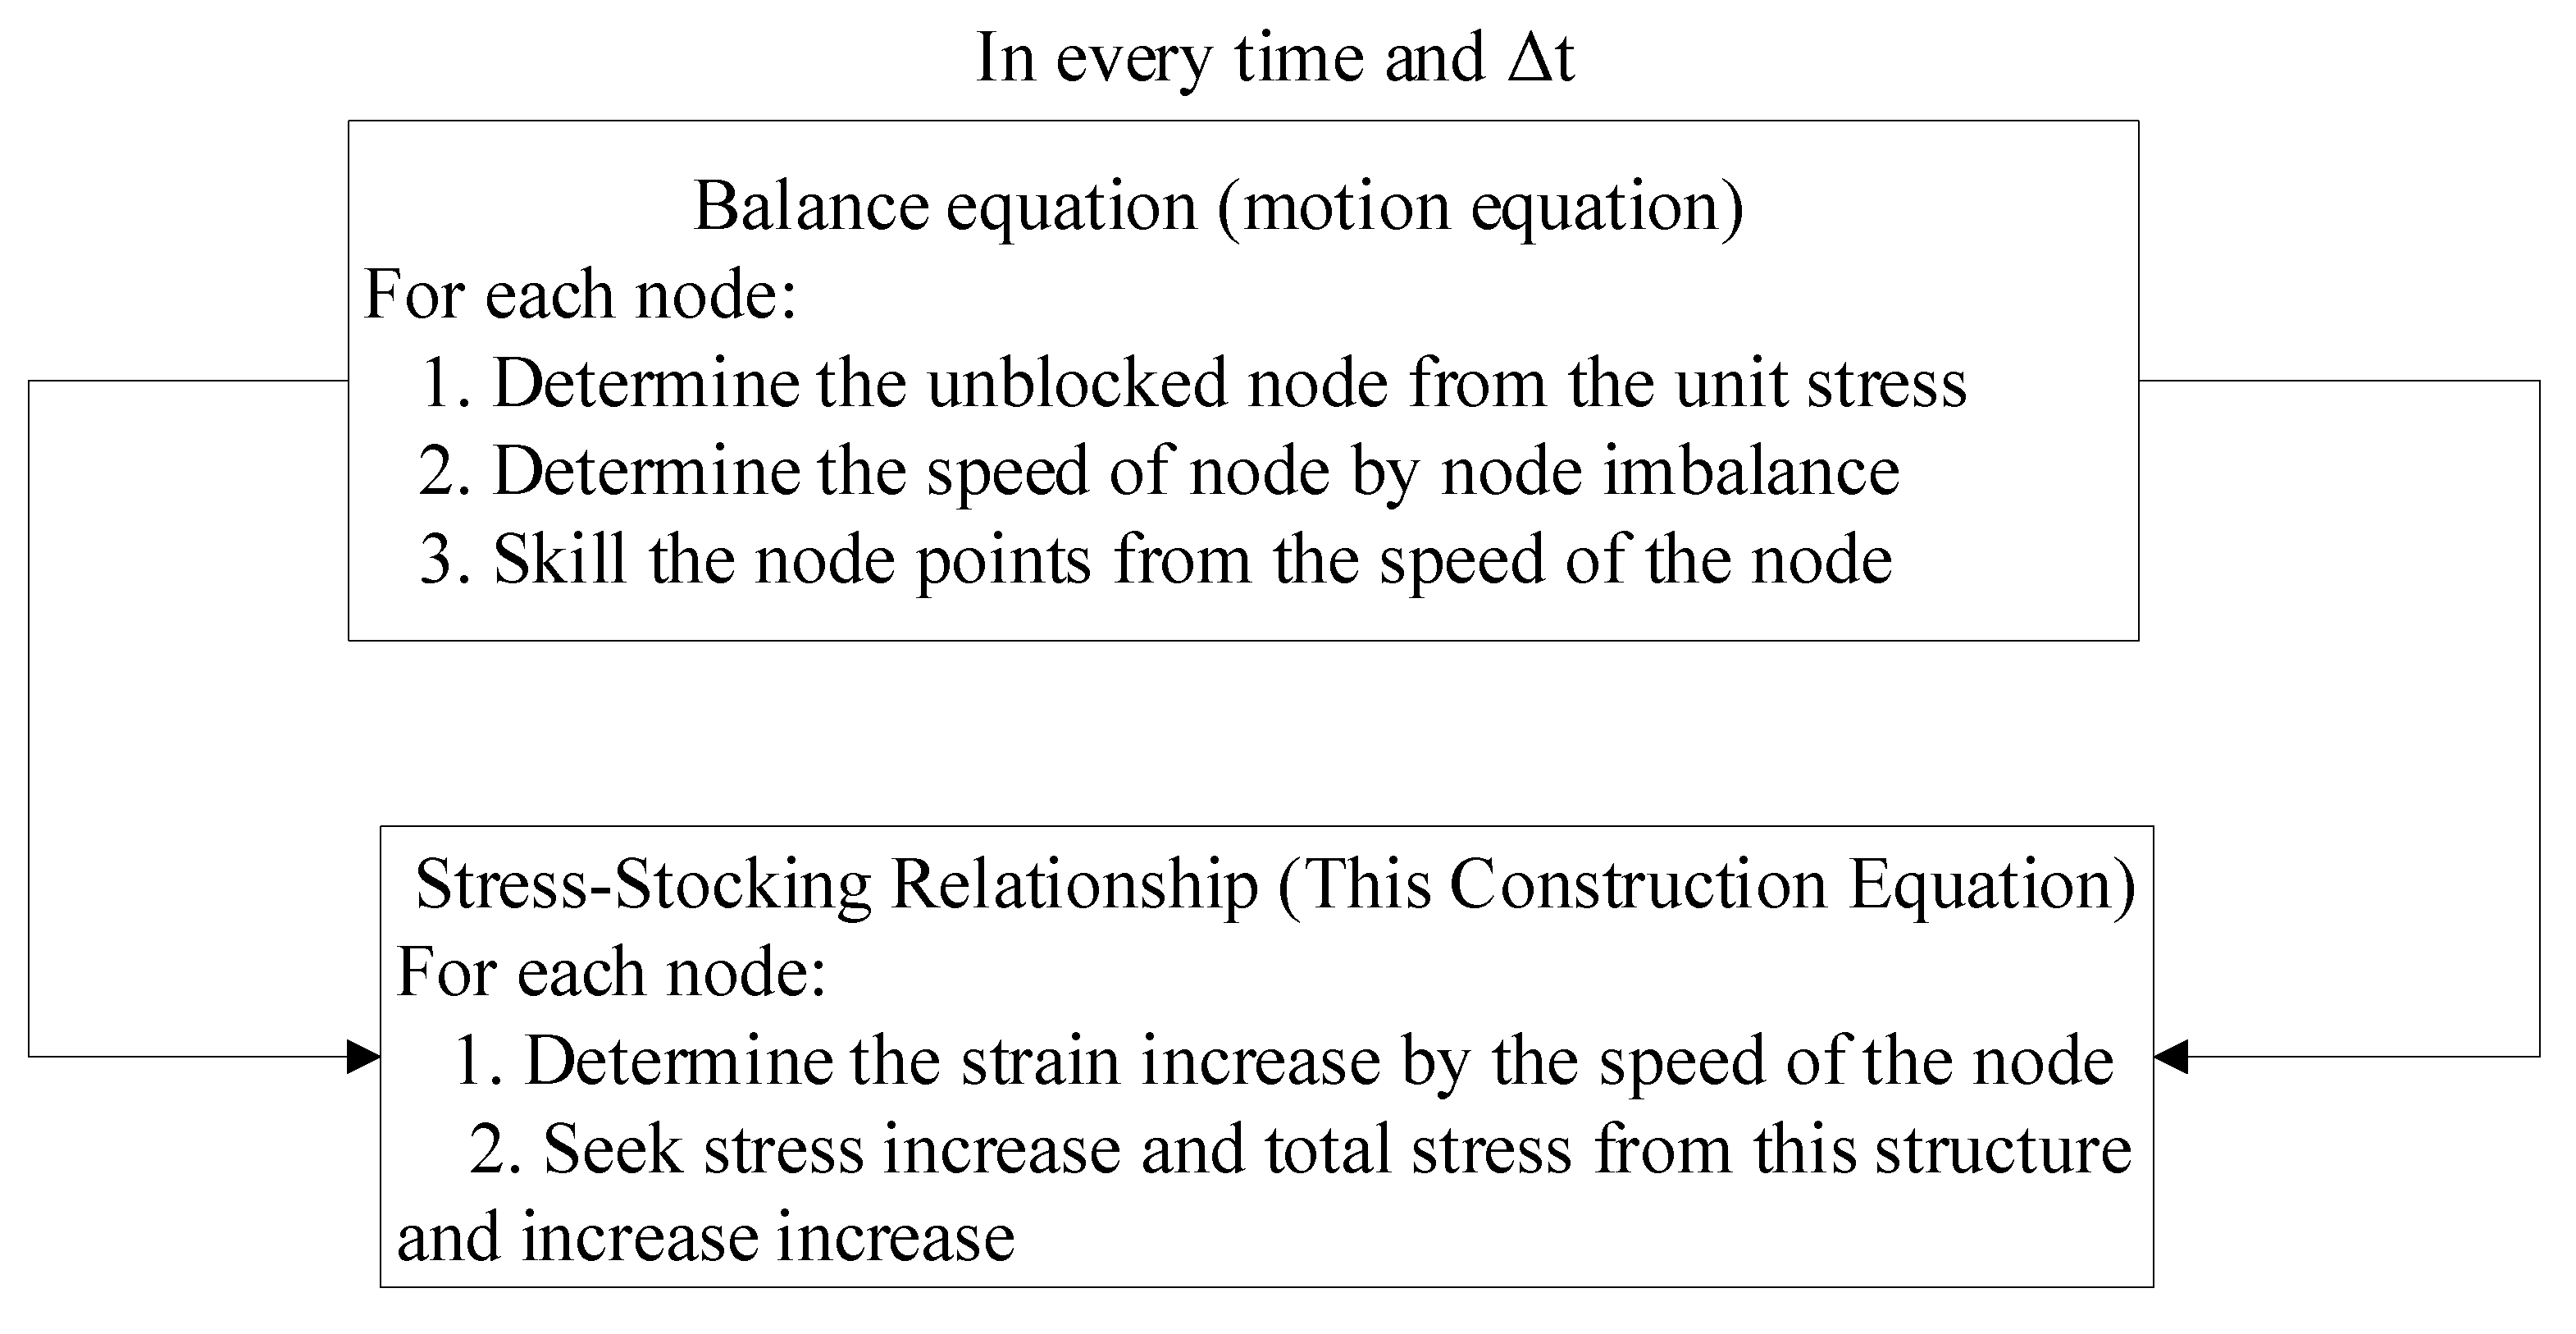
2.1.4. Solution Process
2.2. Asphalt Pavement Simulation Model
2.2.1. Basic Assumption
- 1.
- Each layer of asphalt pavement is assumed to be a continuous material. Elastoplastic materials are characterized by elastic modulus, Poisson’s ratio, and shear strength;
- 2.
- The crack is perpendicular to the principal tensile stress σ3;
- 3.
- Due to instantaneous softening, the tensile strength perpendicular to the crack is 0;
- 4.
- Based on the rule of flow and tensile failure envelope update calculation stress, λt determine the parameters, and the plastic tensile strain increments ;
- 5.
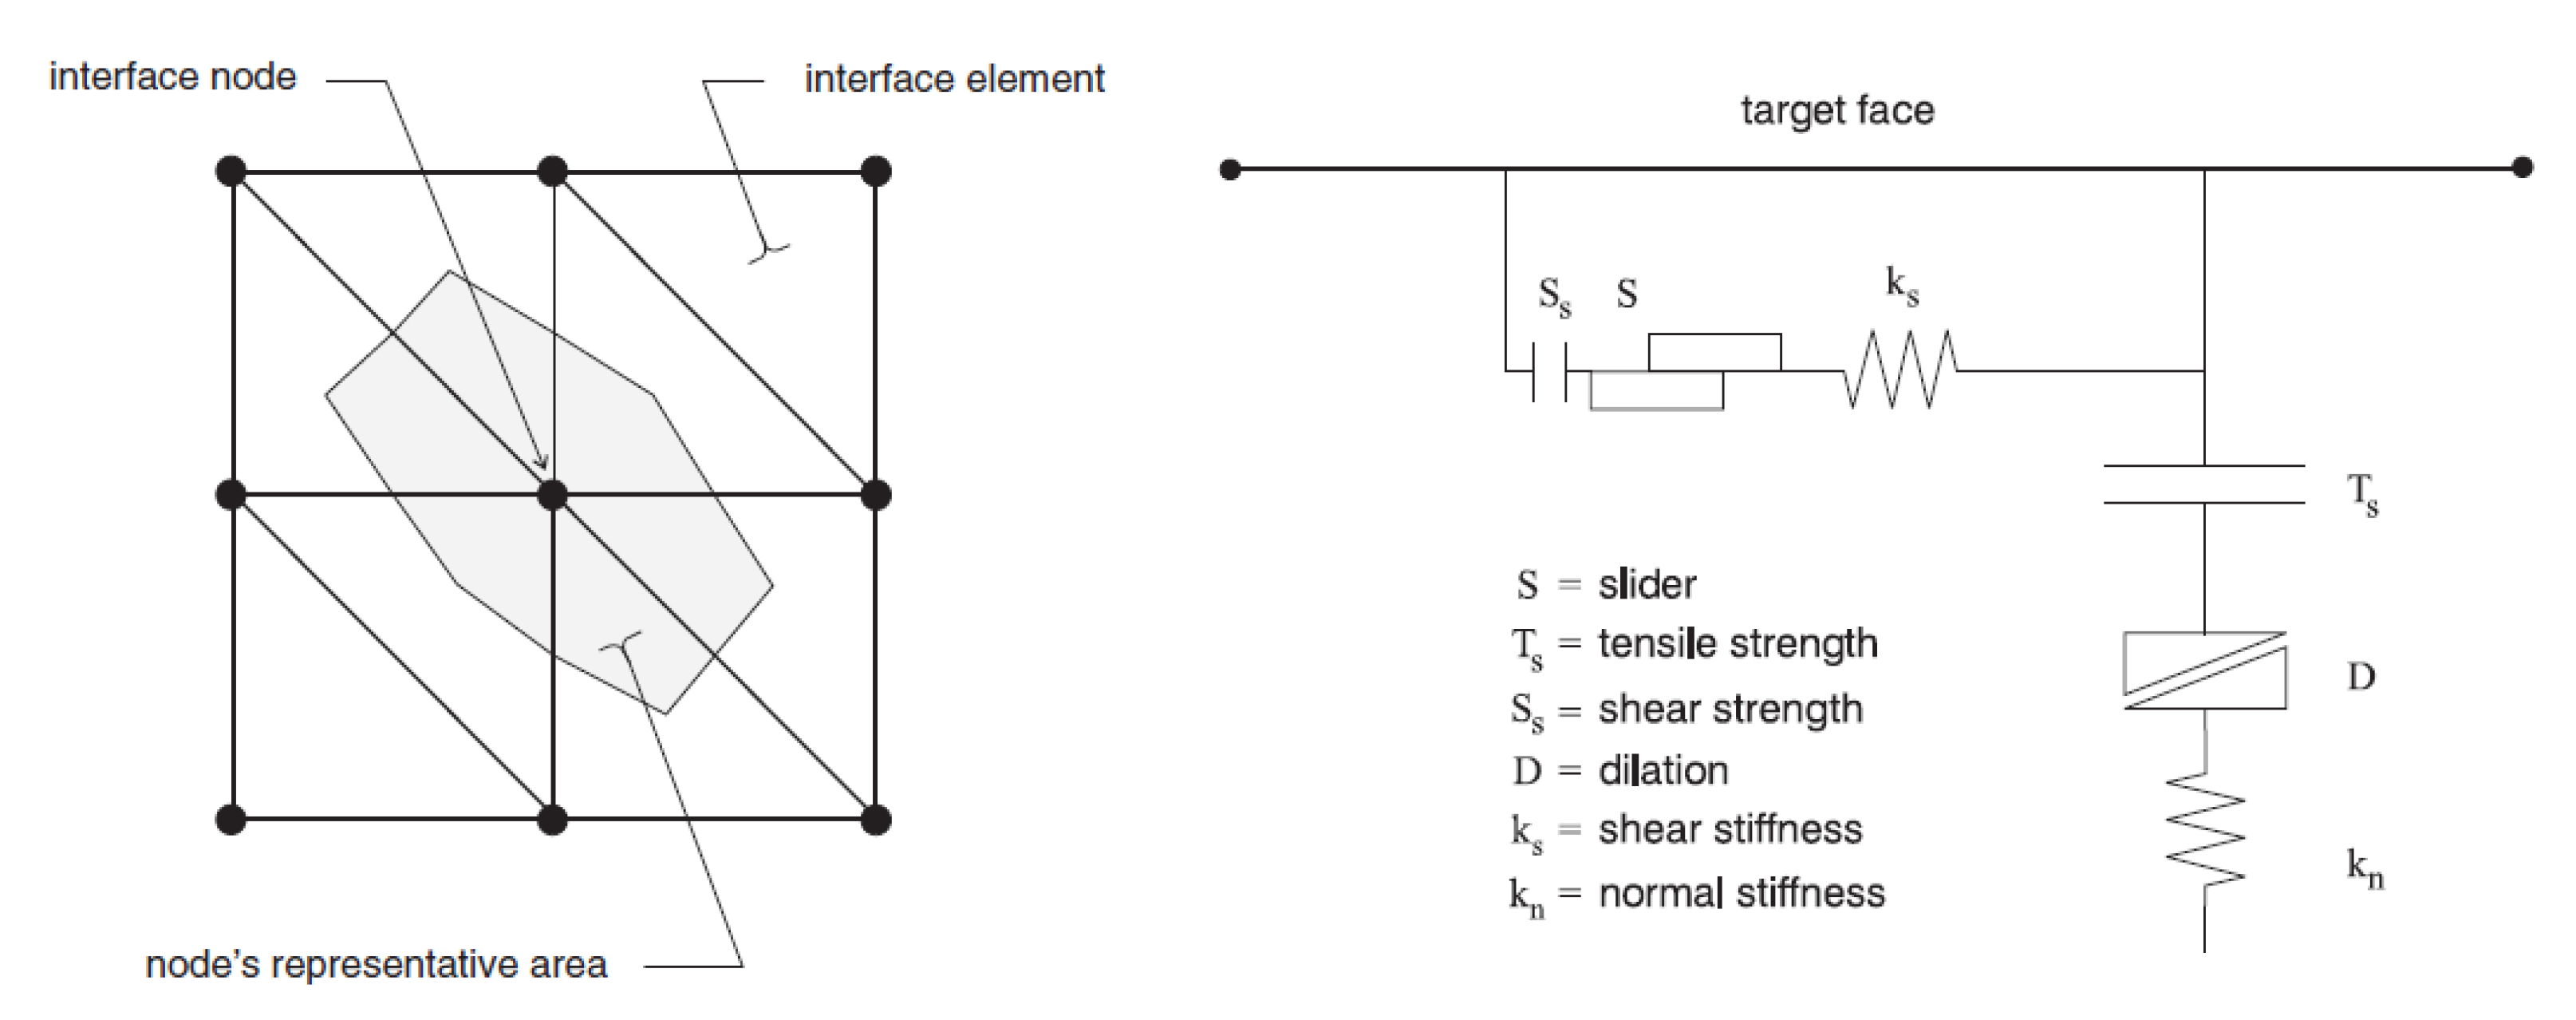
- There is no void between each layer of pavement structure, and the interlayer state is simulated by Interface model.
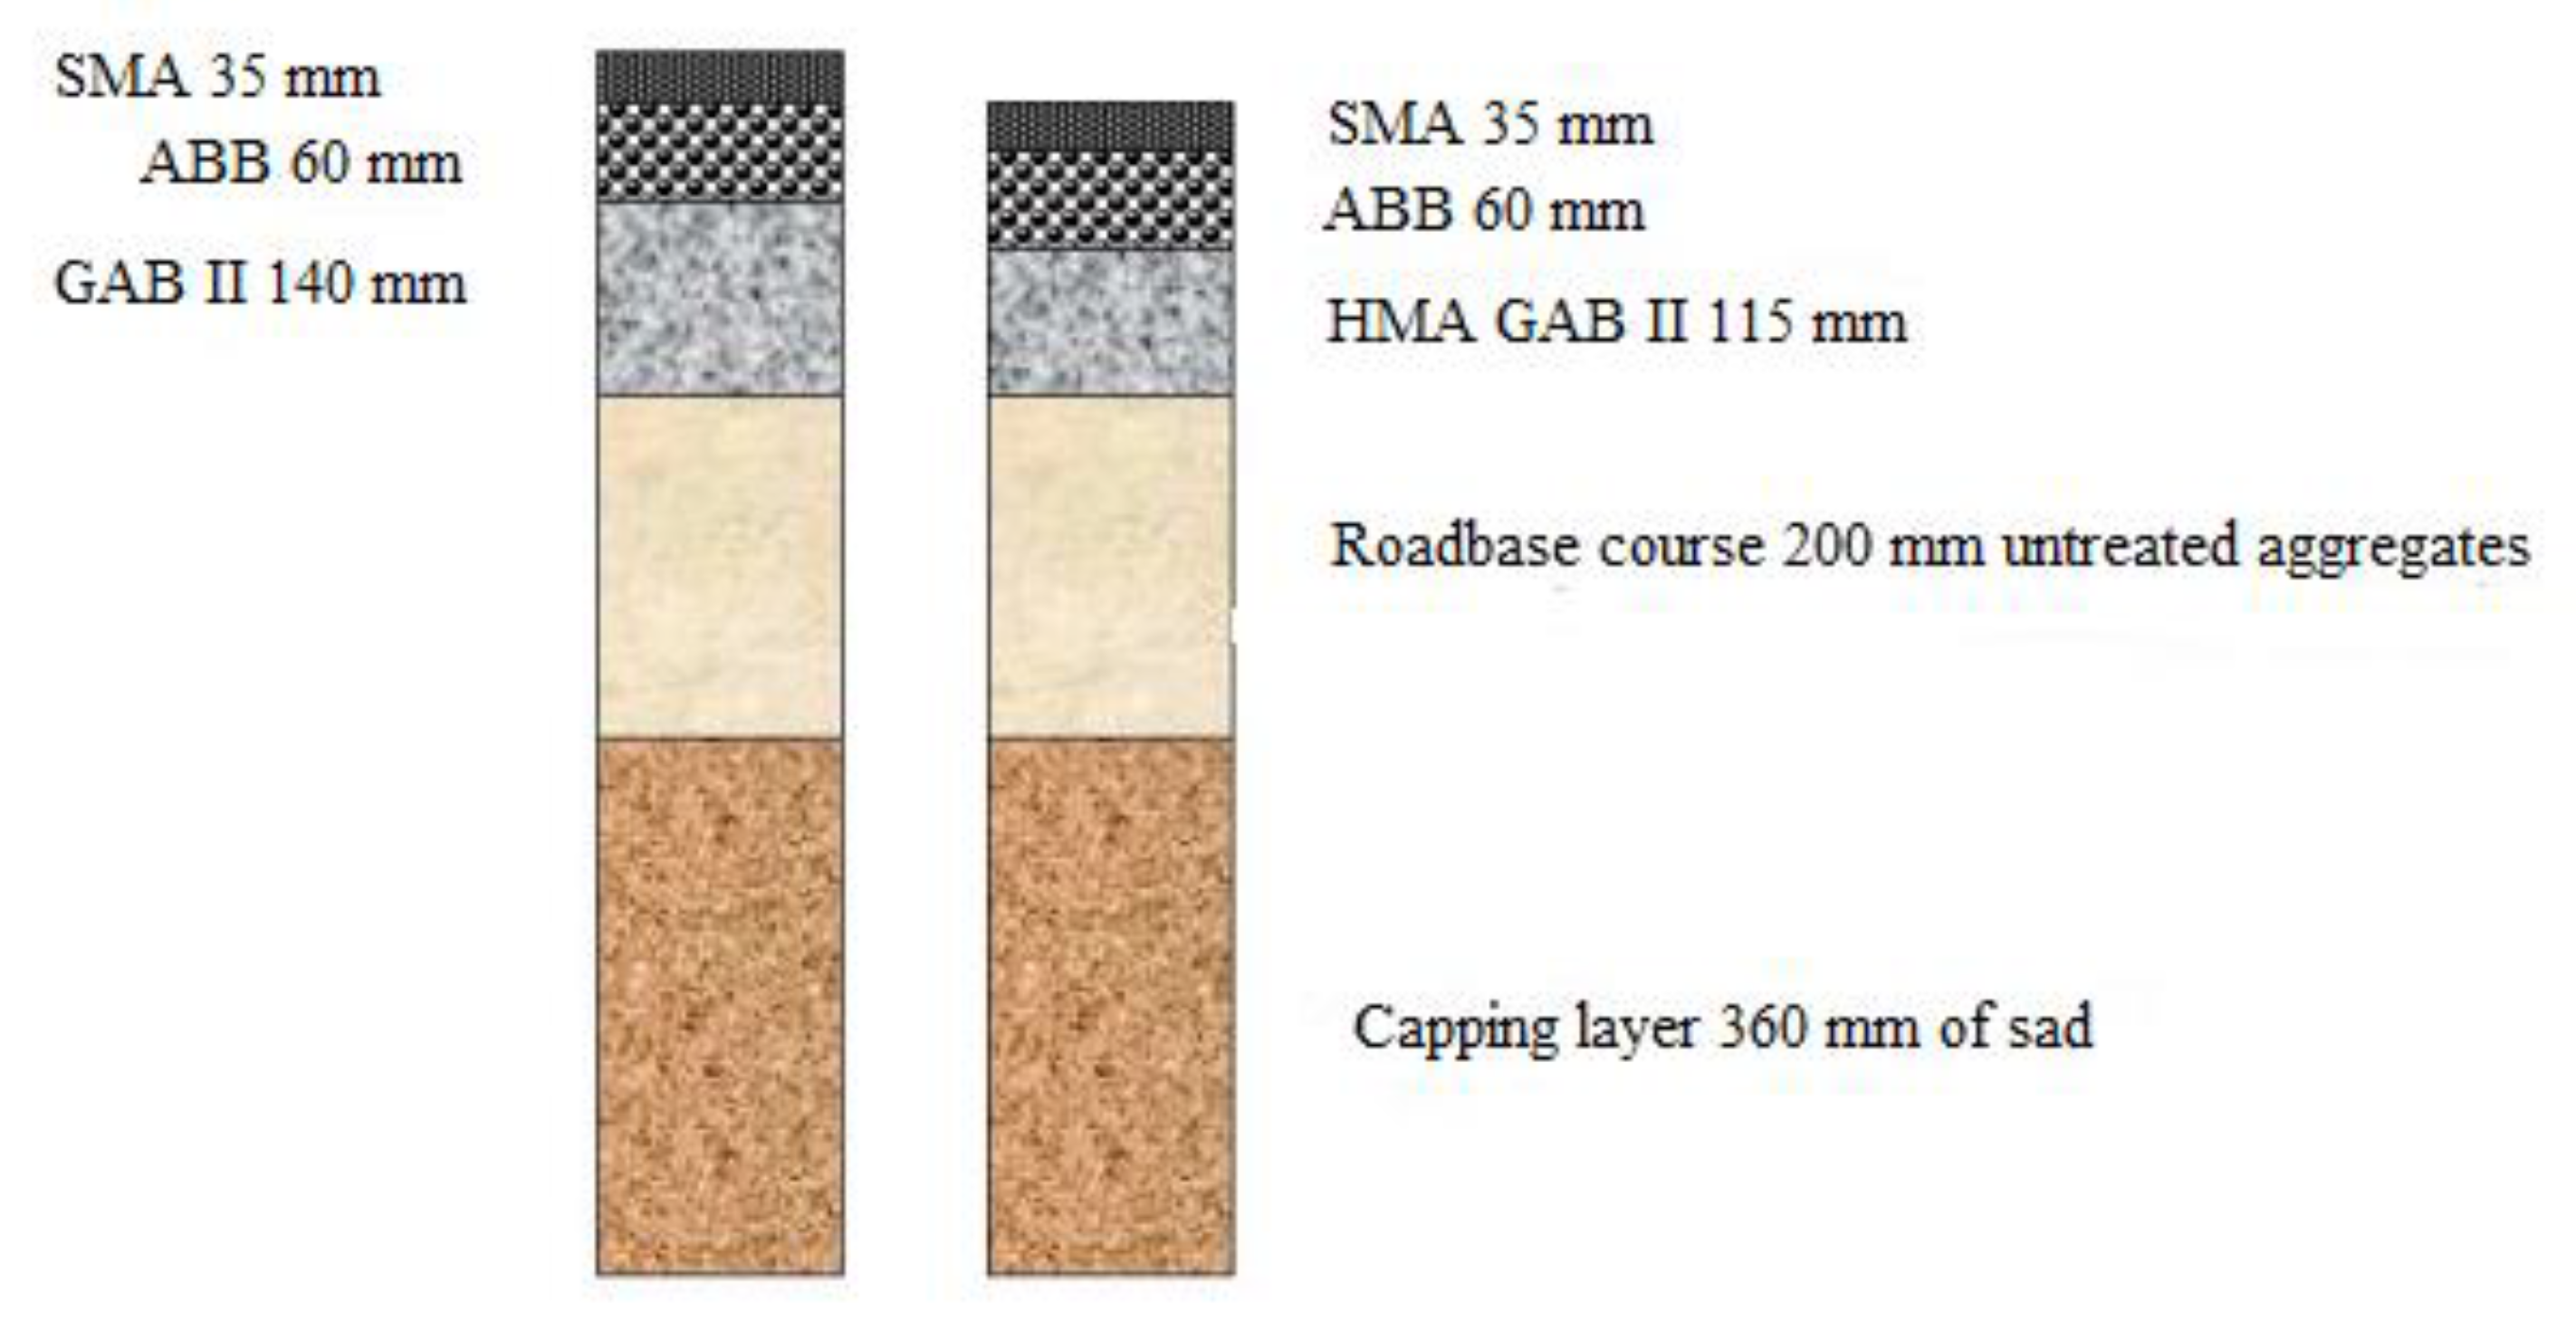
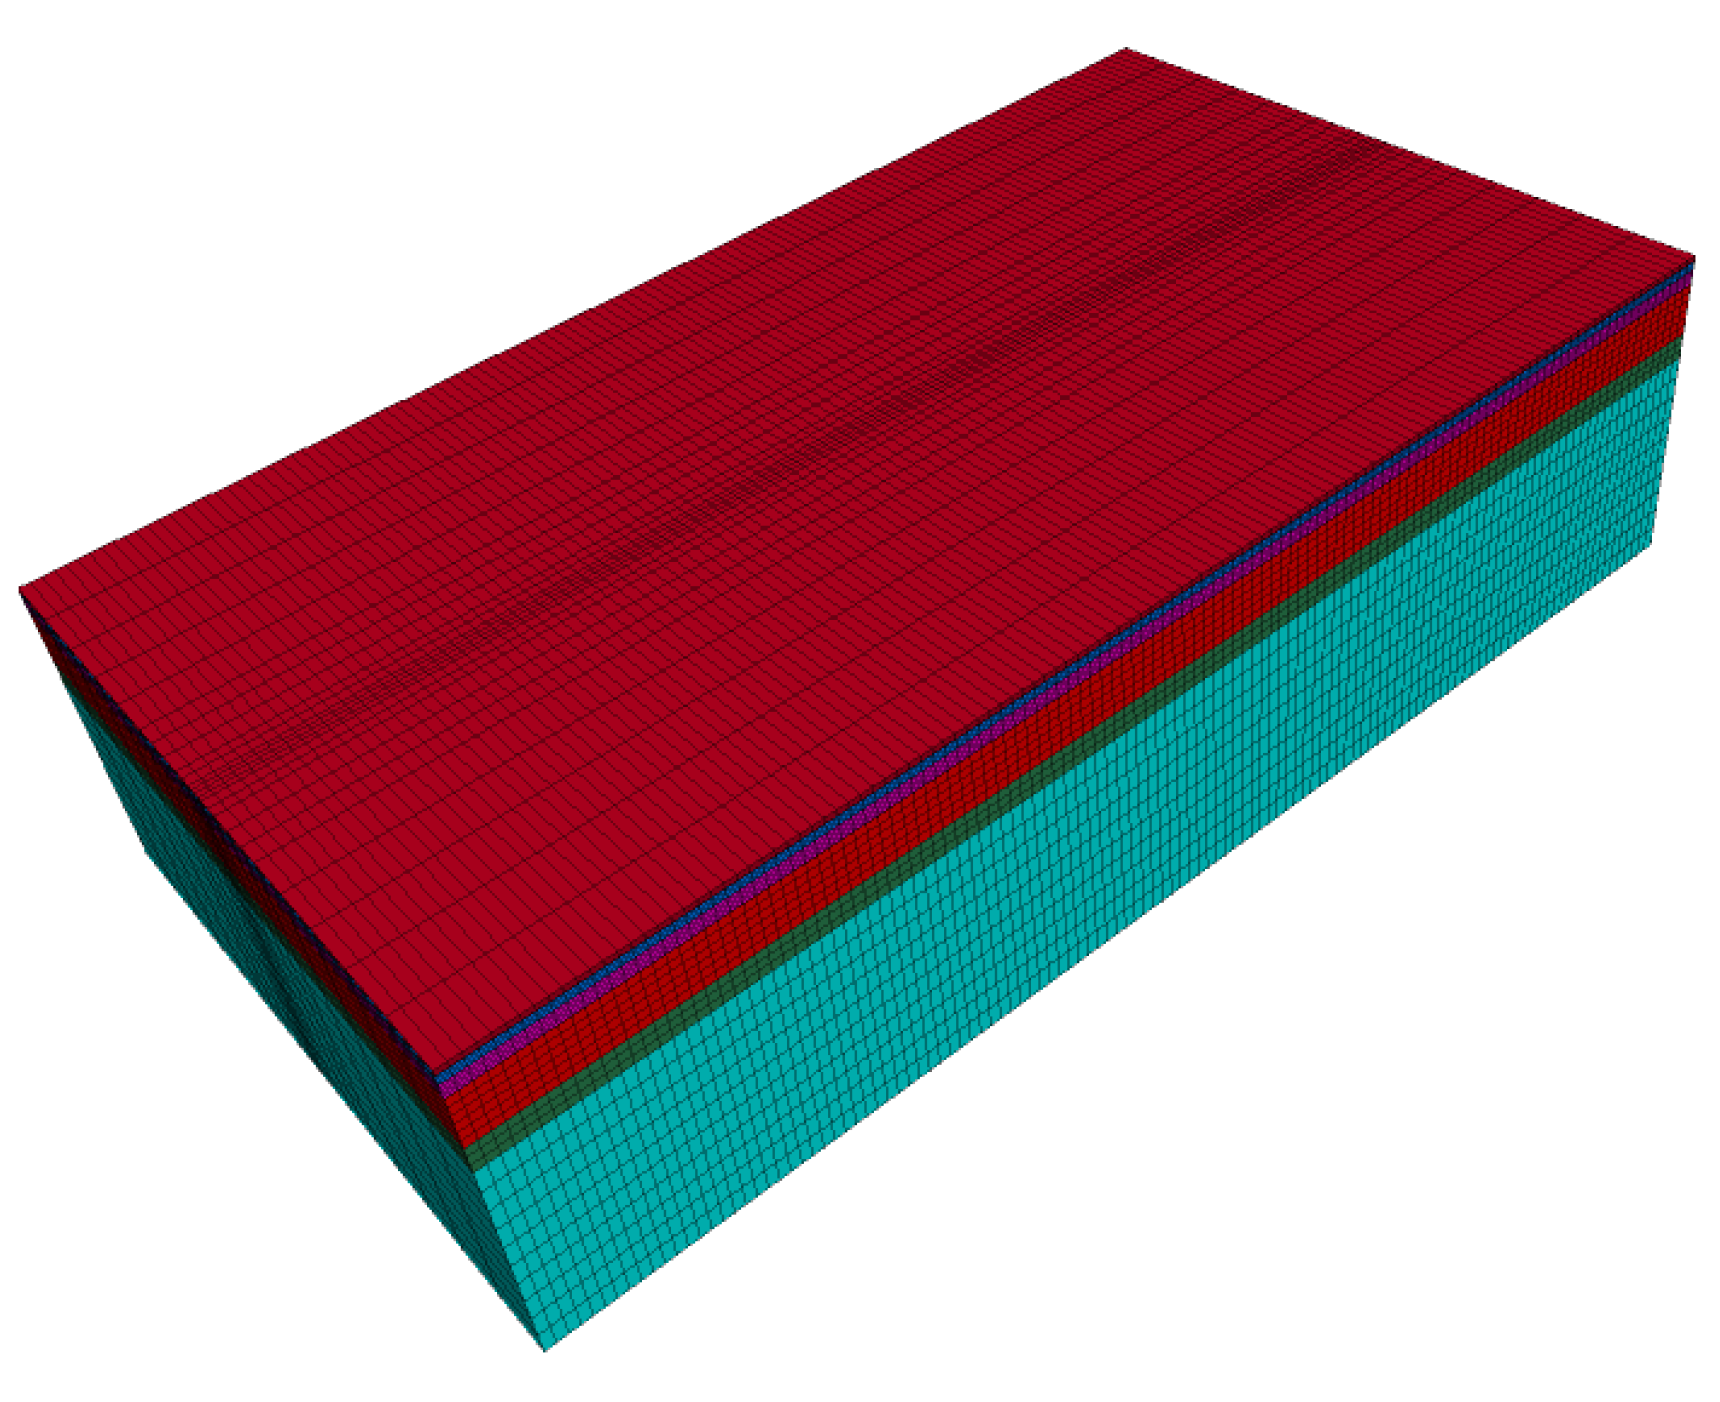
2.2.2. Reference Model
2.3. Check Asphalt Pavement Simulation Model
3. Study on the Modulus Matching Mode of Asphalt Pavement Considering the Reflection Ability of Flexural and Tensile Fatigue Cracks
3.1. Reflection Crack Simulation Based on MohrT and Interface Model
3.2. Semi-Analytical Solution of the Stress Intensity Factor Based on Finite Element Simulation
3.3. Verification of Semi-Analytical Solution of Stress Intensity Factor
4. Study on the Influence of Surface Modulus on the Deformation of Pavement Structure Layer and the Compressive Strain of Subgrade Top Surface
4.1. Vertical Pavement Deformation
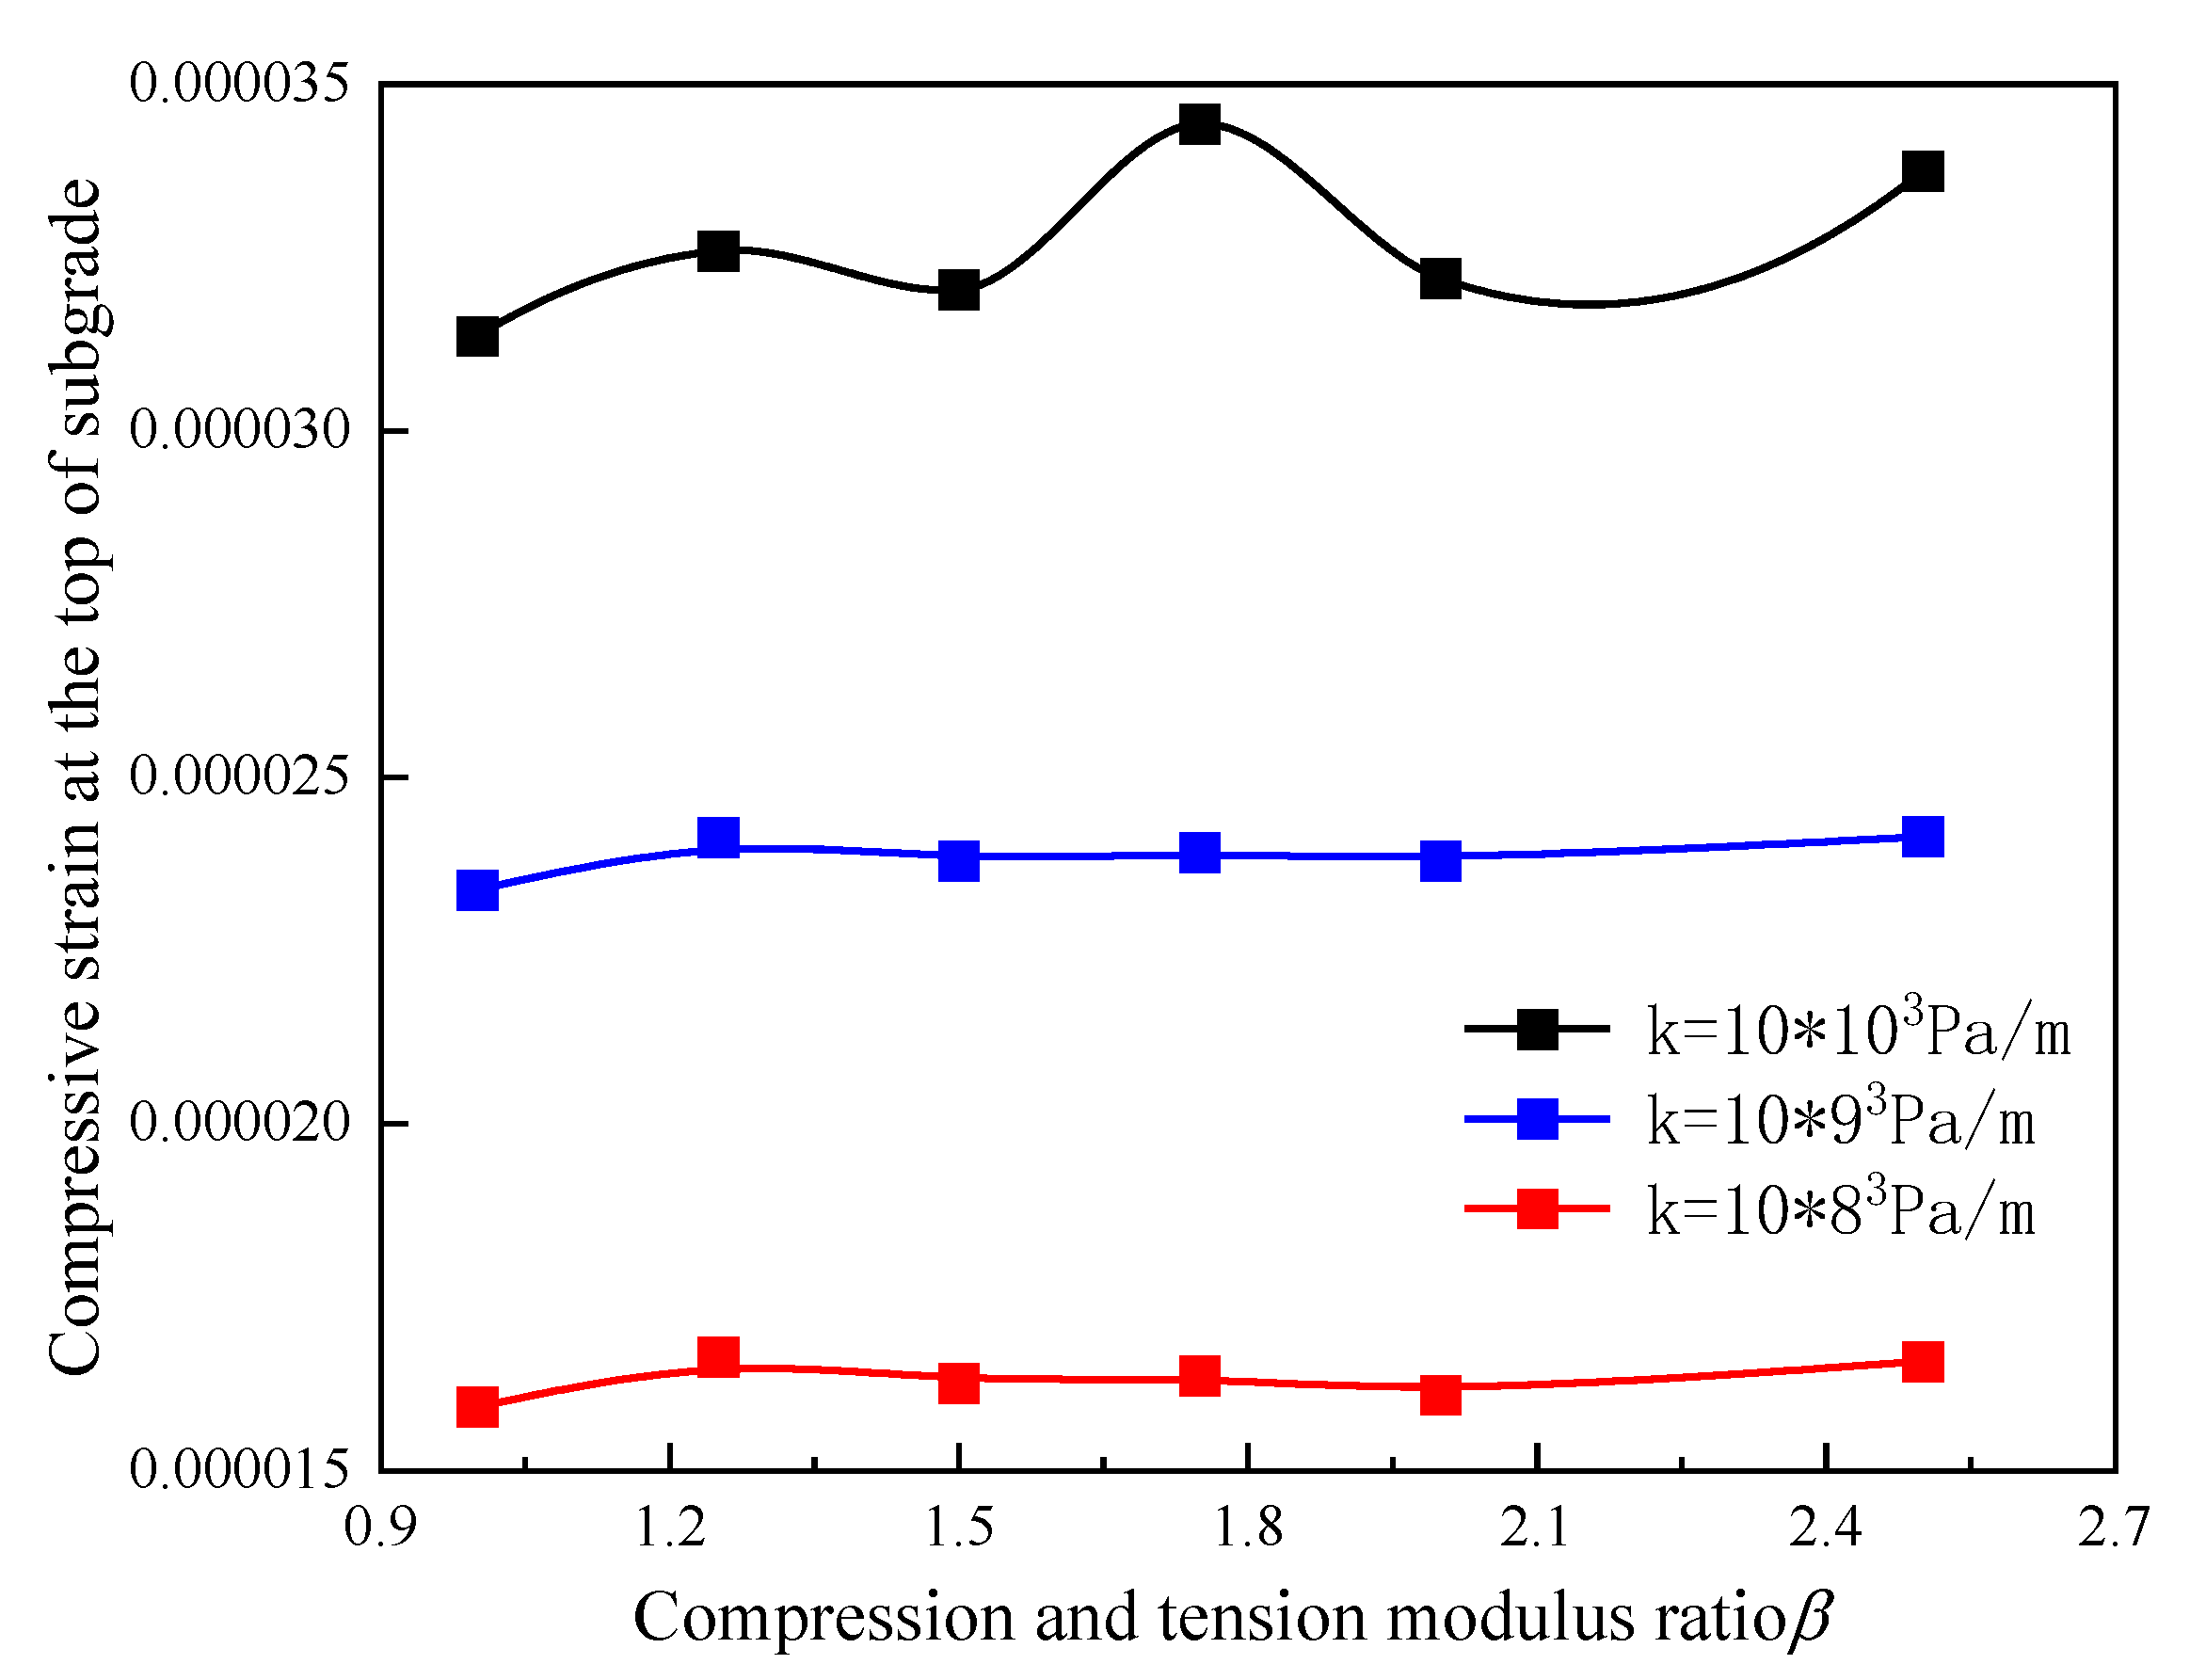
4.2. Subgrade Top Pressure Strain
Different Lamination Tensile Modulus Ratios
5. Conclusions
- (1)
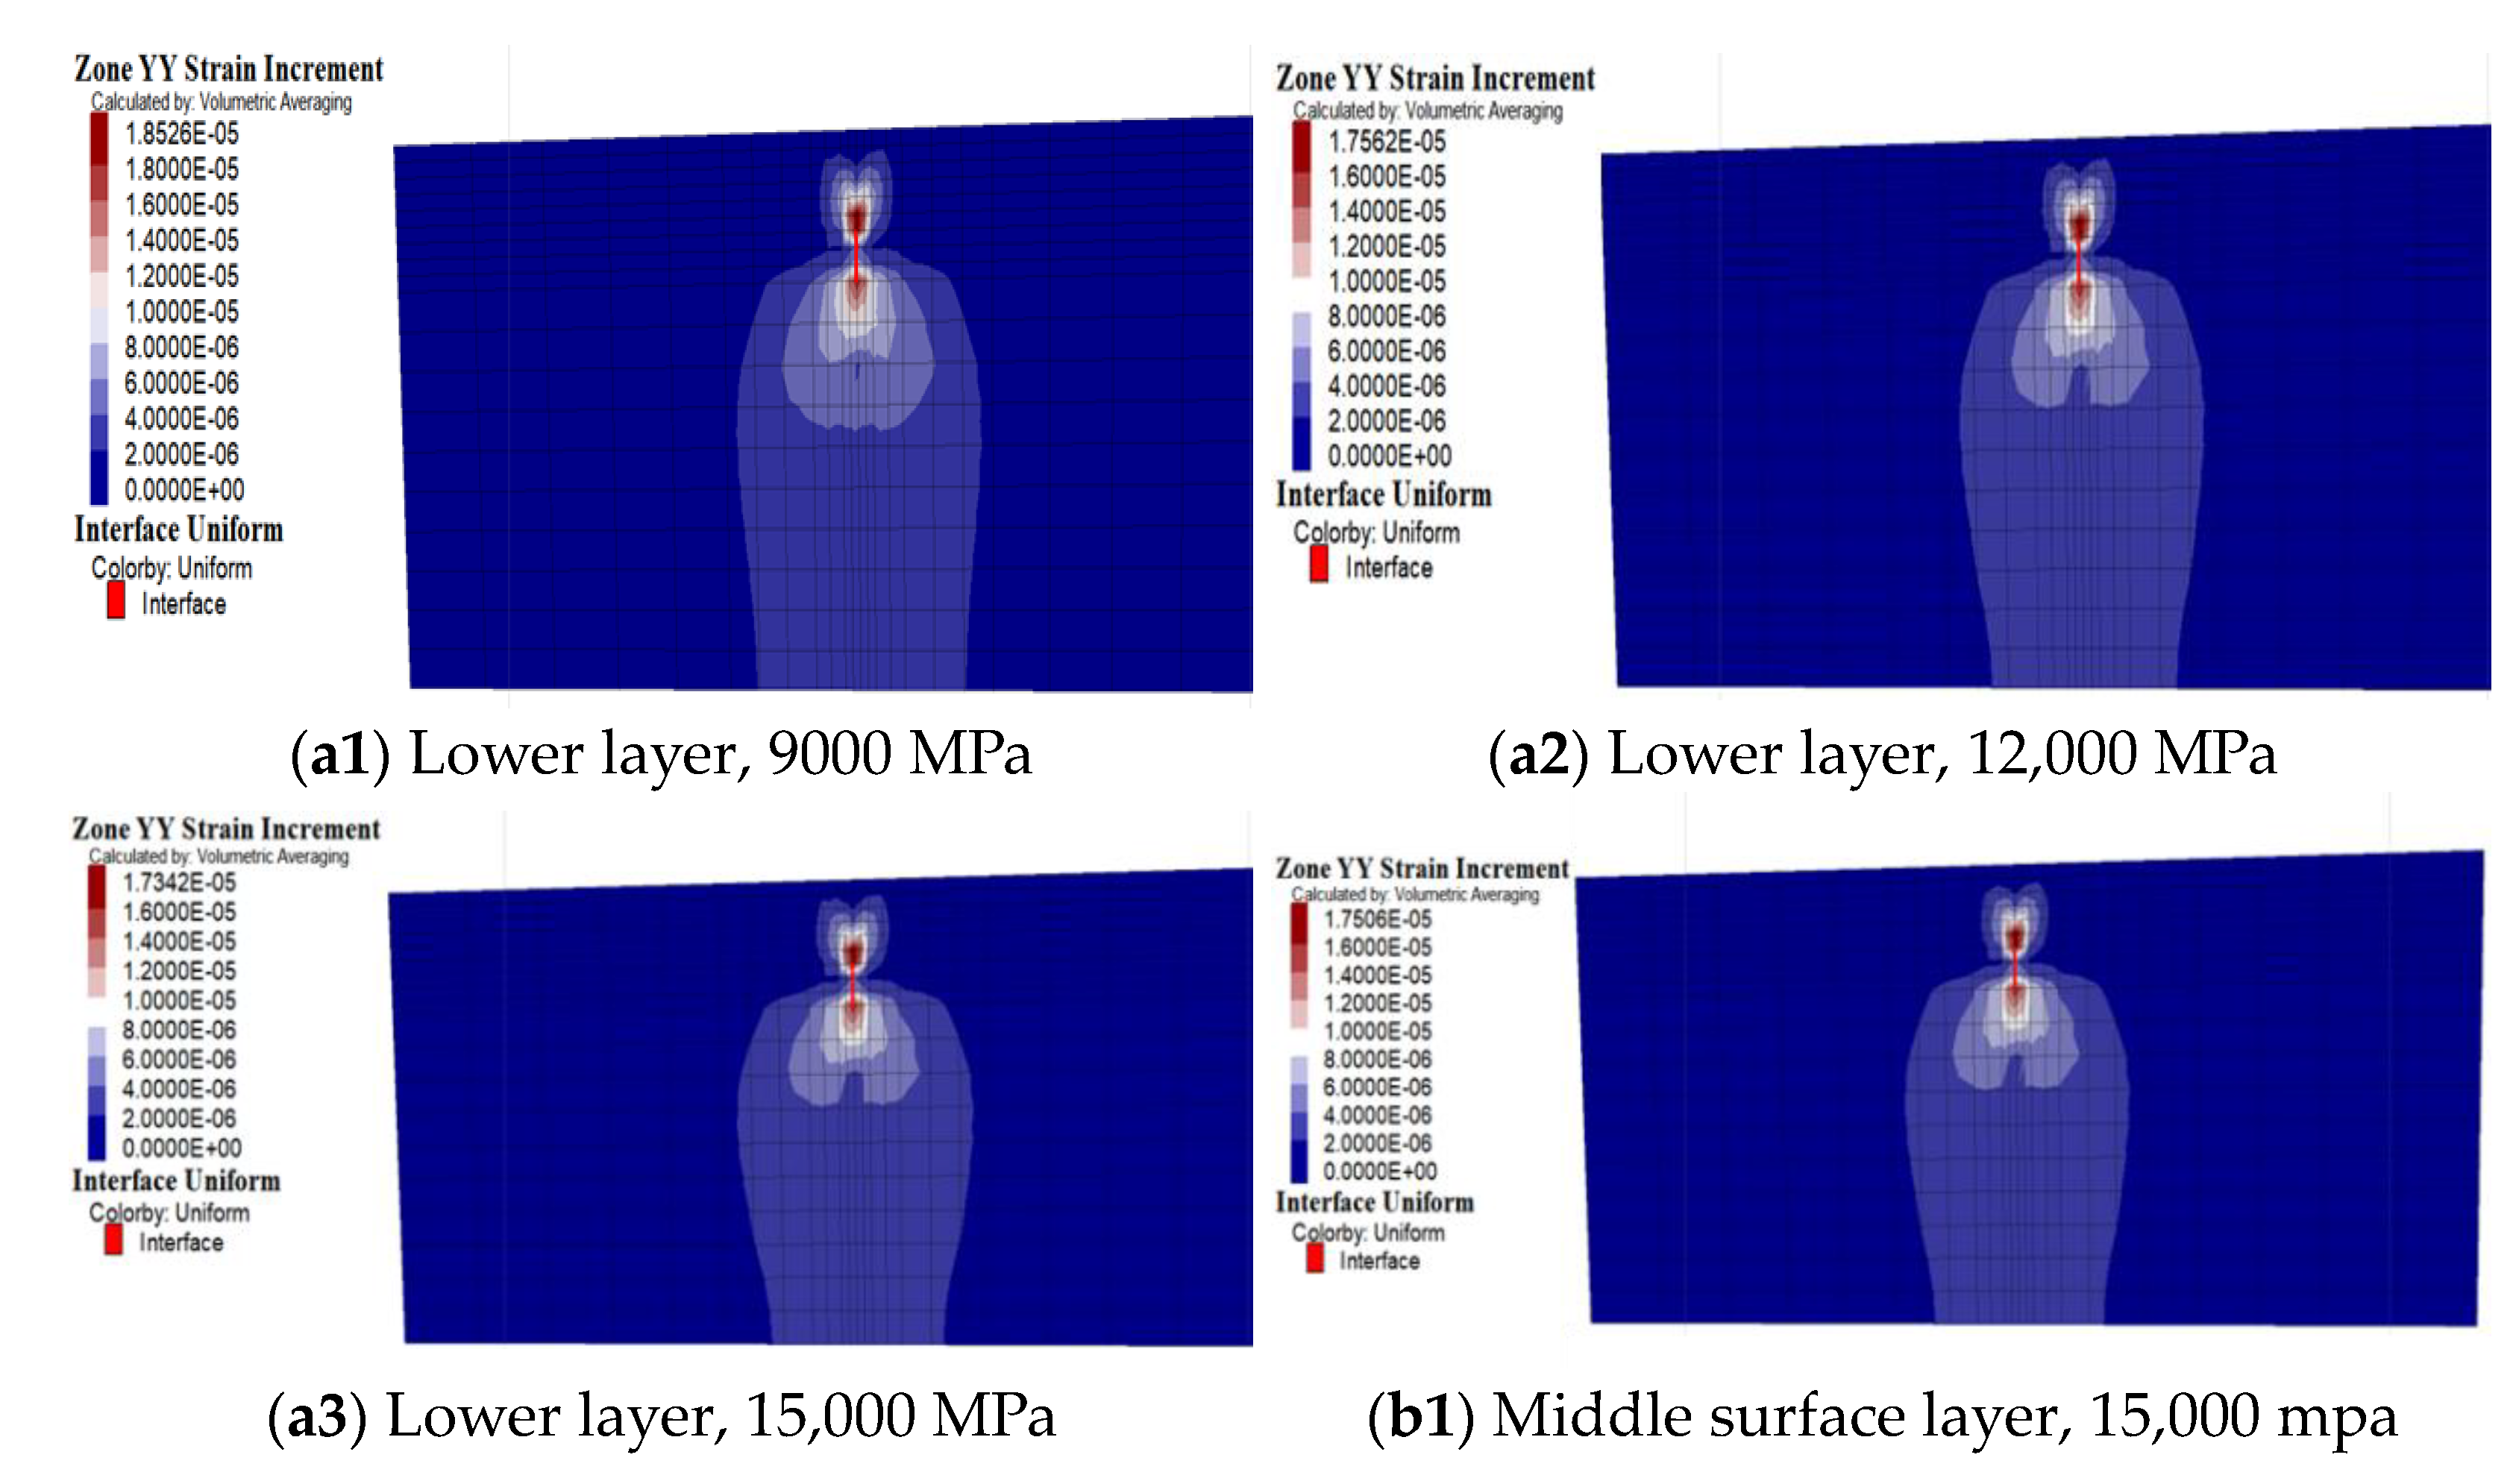
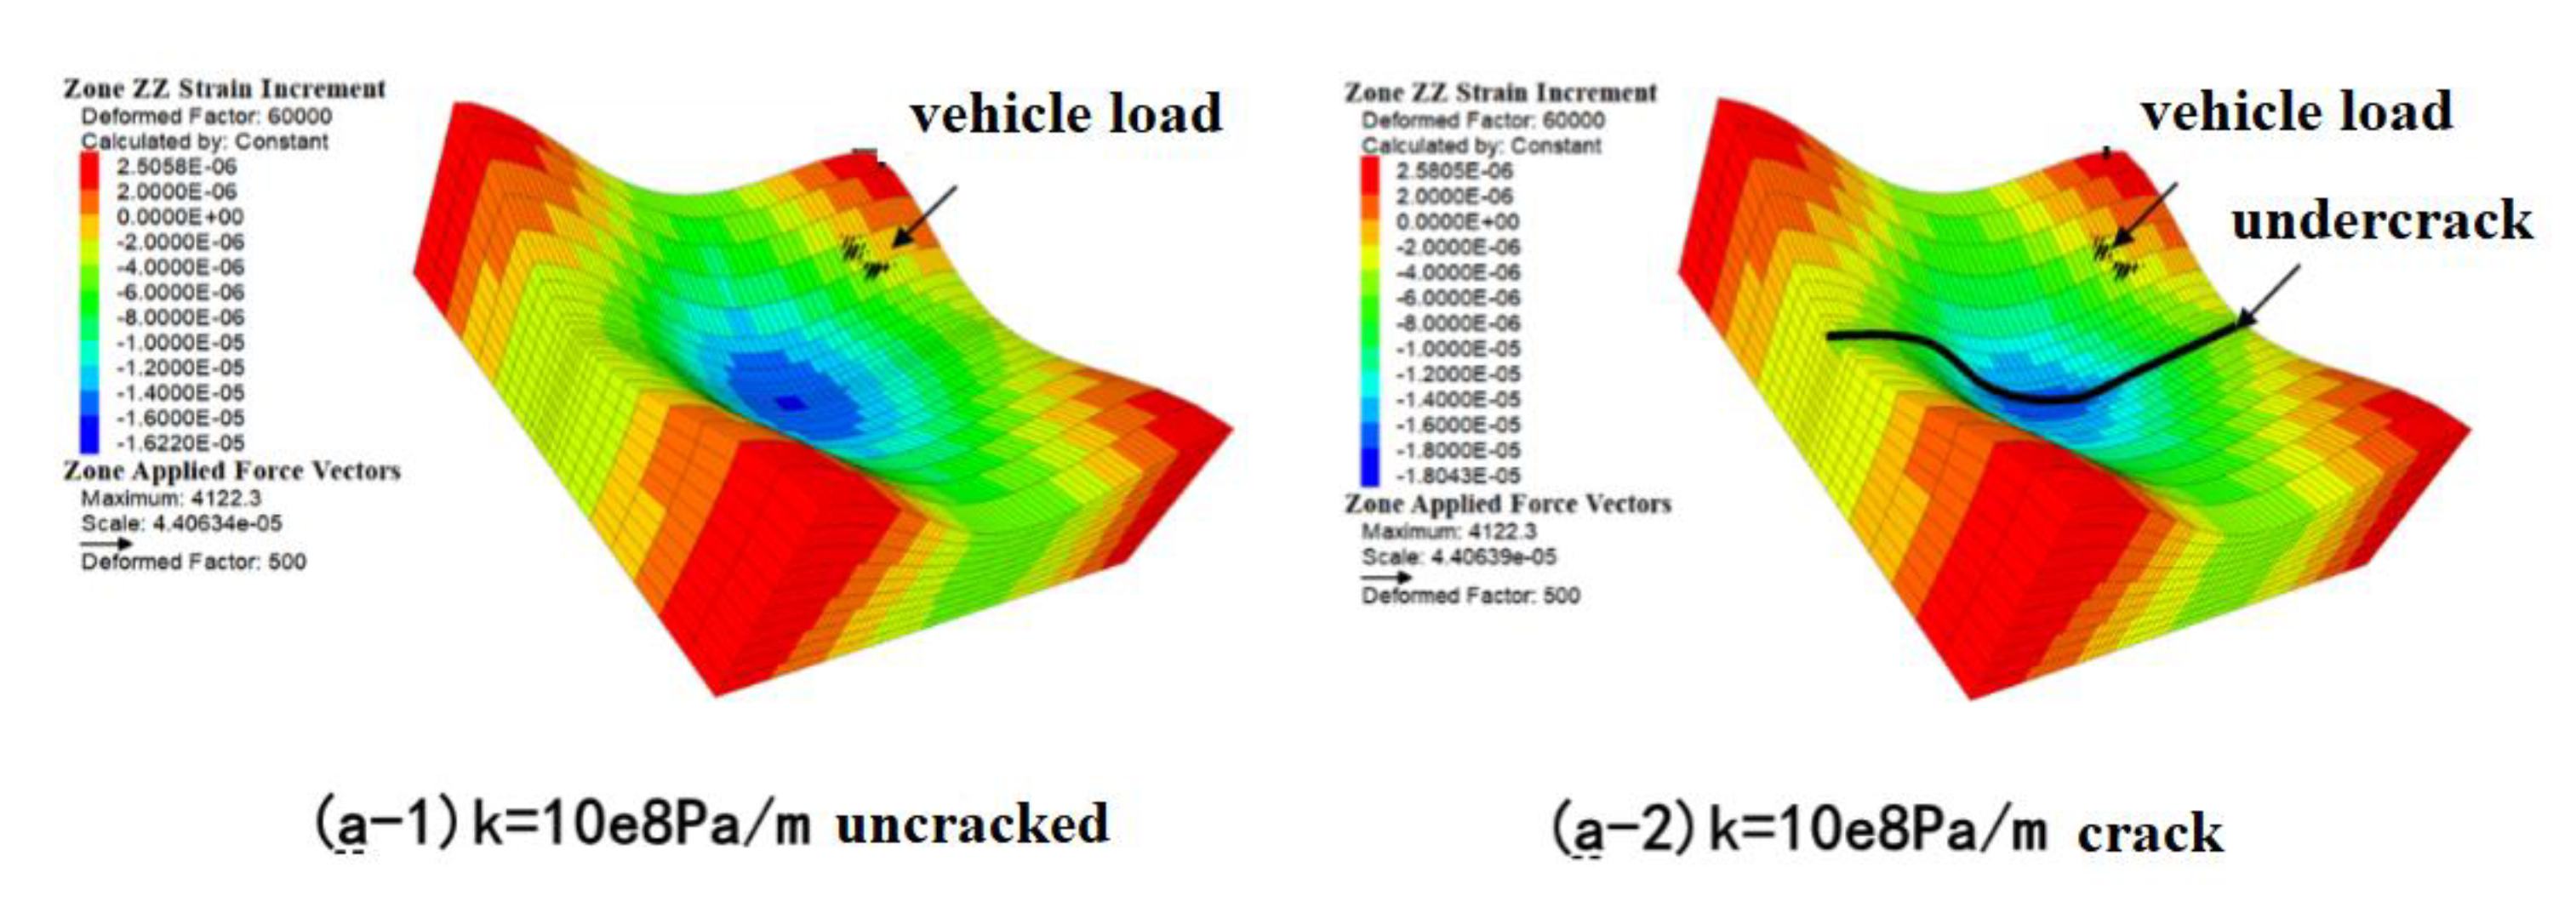
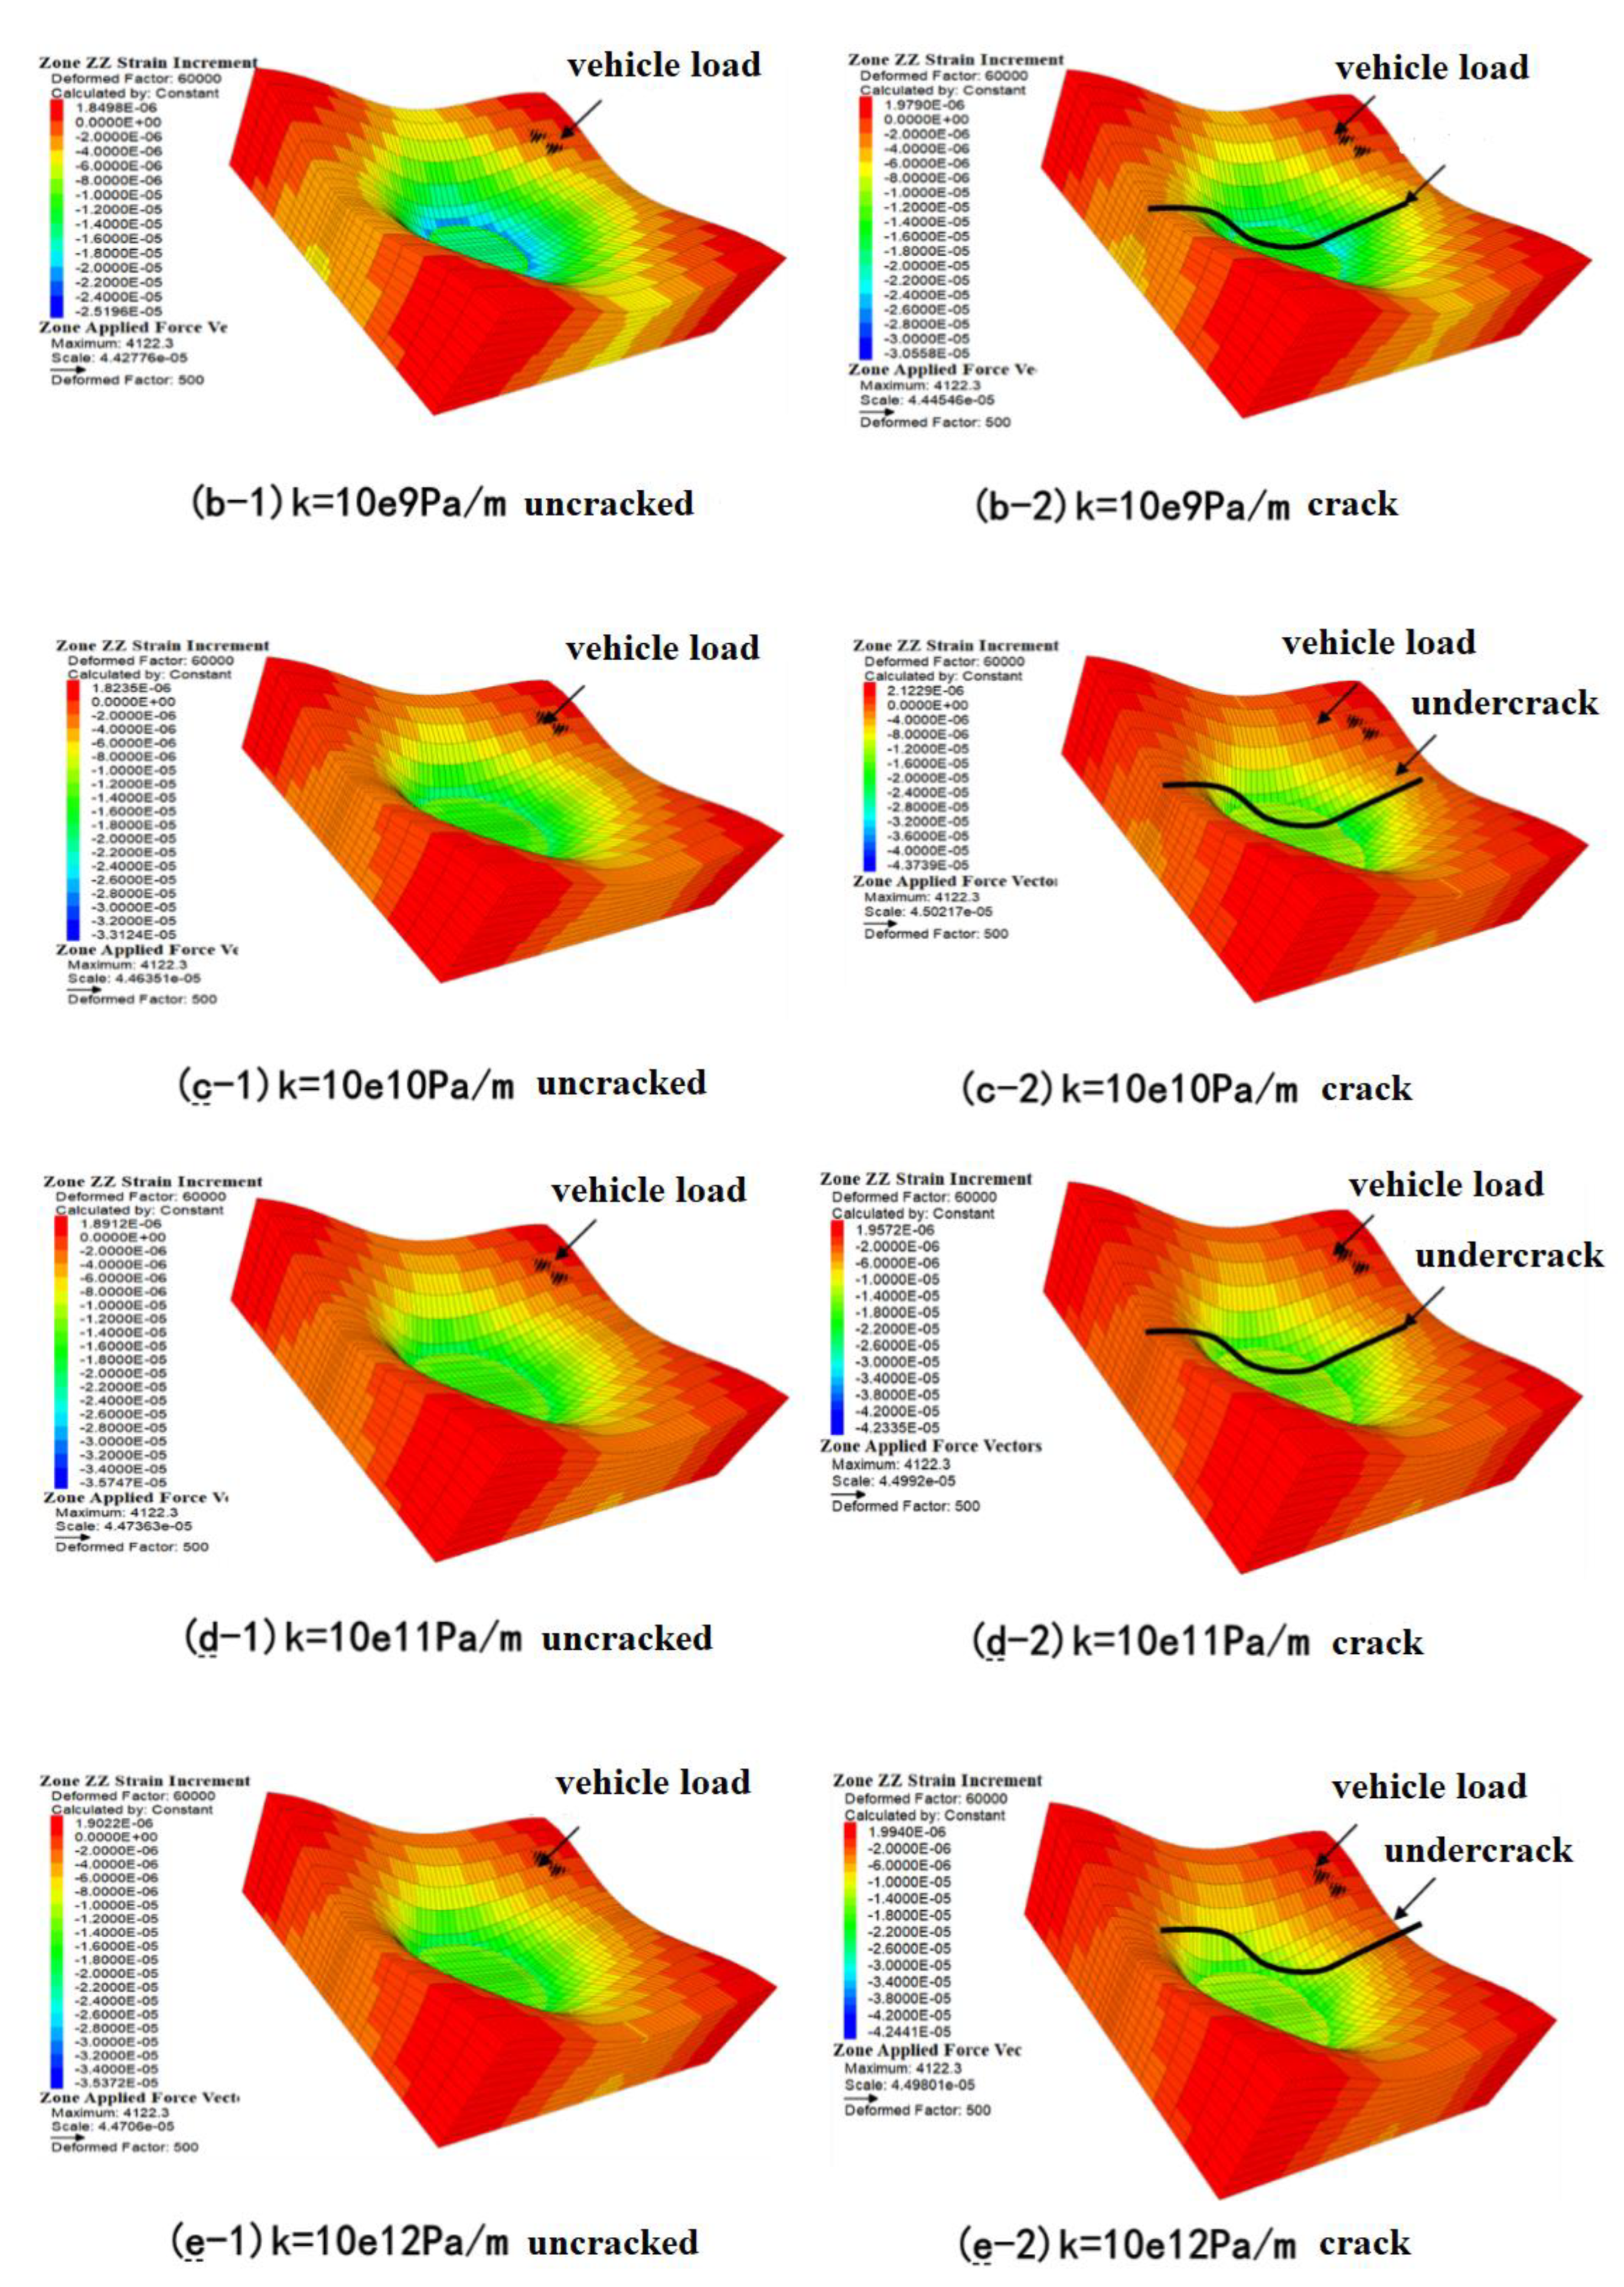
- The appearance of cracks in the base will lead to obvious stress concentration at the crack tip, and the tension area in the base will increase. Considering that the interlayer constraint of the pavement structure is not an ideal continuous condition during the service period, it leads to greater tensile stress or strain at the bottom of the upper layer. Therefore, in order to avoid cracking of pavement structure, high-modulus asphalt mixture can easily be used in the lower layer, and the tensile strength of the bottom of the surface layer should be enhanced or the upper layer should have a small compression modulus ratio;
- (2)
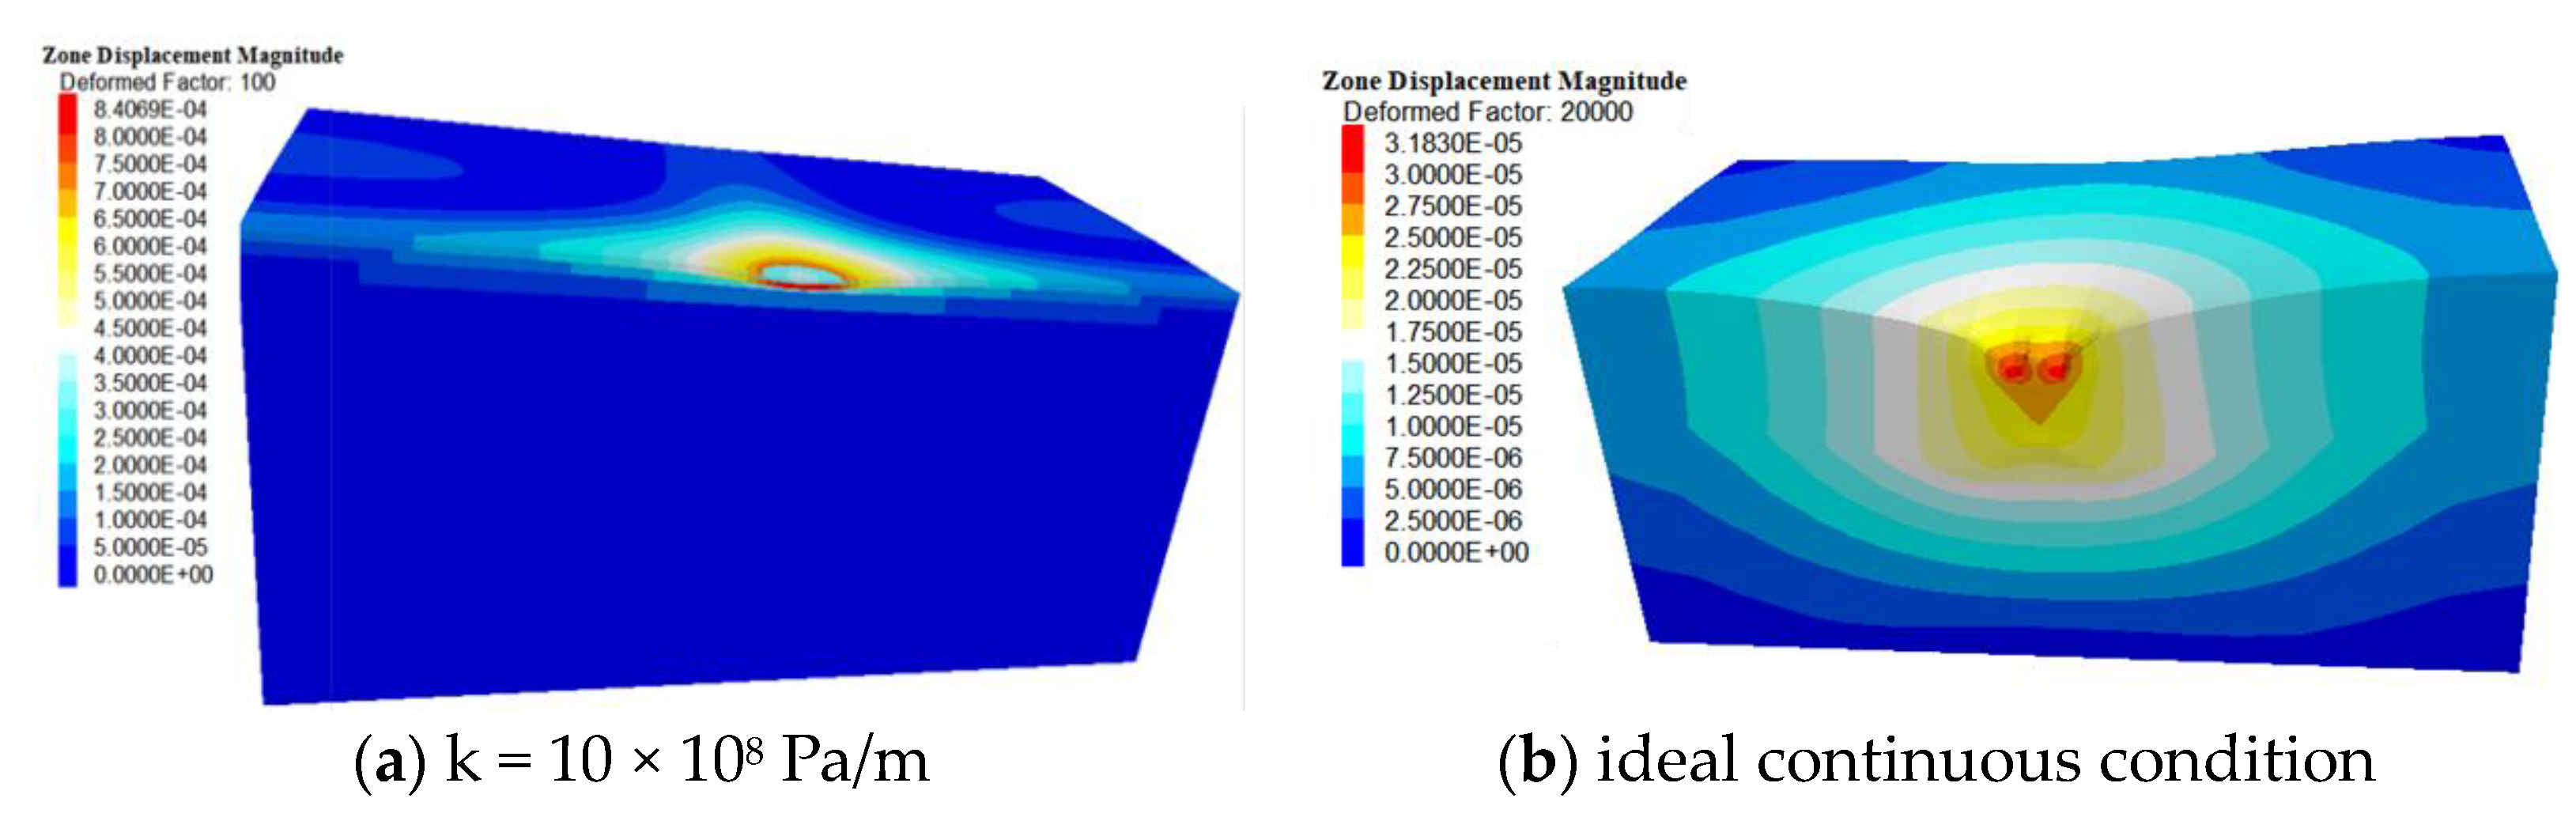
- When the contact state between layers of pavement is good, the lower layer with a high modulus can be used to reduce the deformation of the path surface; When the contact state between layers is poor and the modulus of the asphalt mixture is large, it can be placed on the middle surface layer to control the vertical deformation of the road surface;
- (3)
- With the decrease of the modulus of the bottom layer and the increase of the tensile modulus ratio of the surface laminating, the influence of the base crack on the tensile stress and strain is more obvious. With the increase of the surface modulus, the stress intensity factor determined by the semi-analytical method shows a nonlinear decrease trend, and the change in stress intensity factor is not obvious when the modulus is greater than 10,000;
- (4)
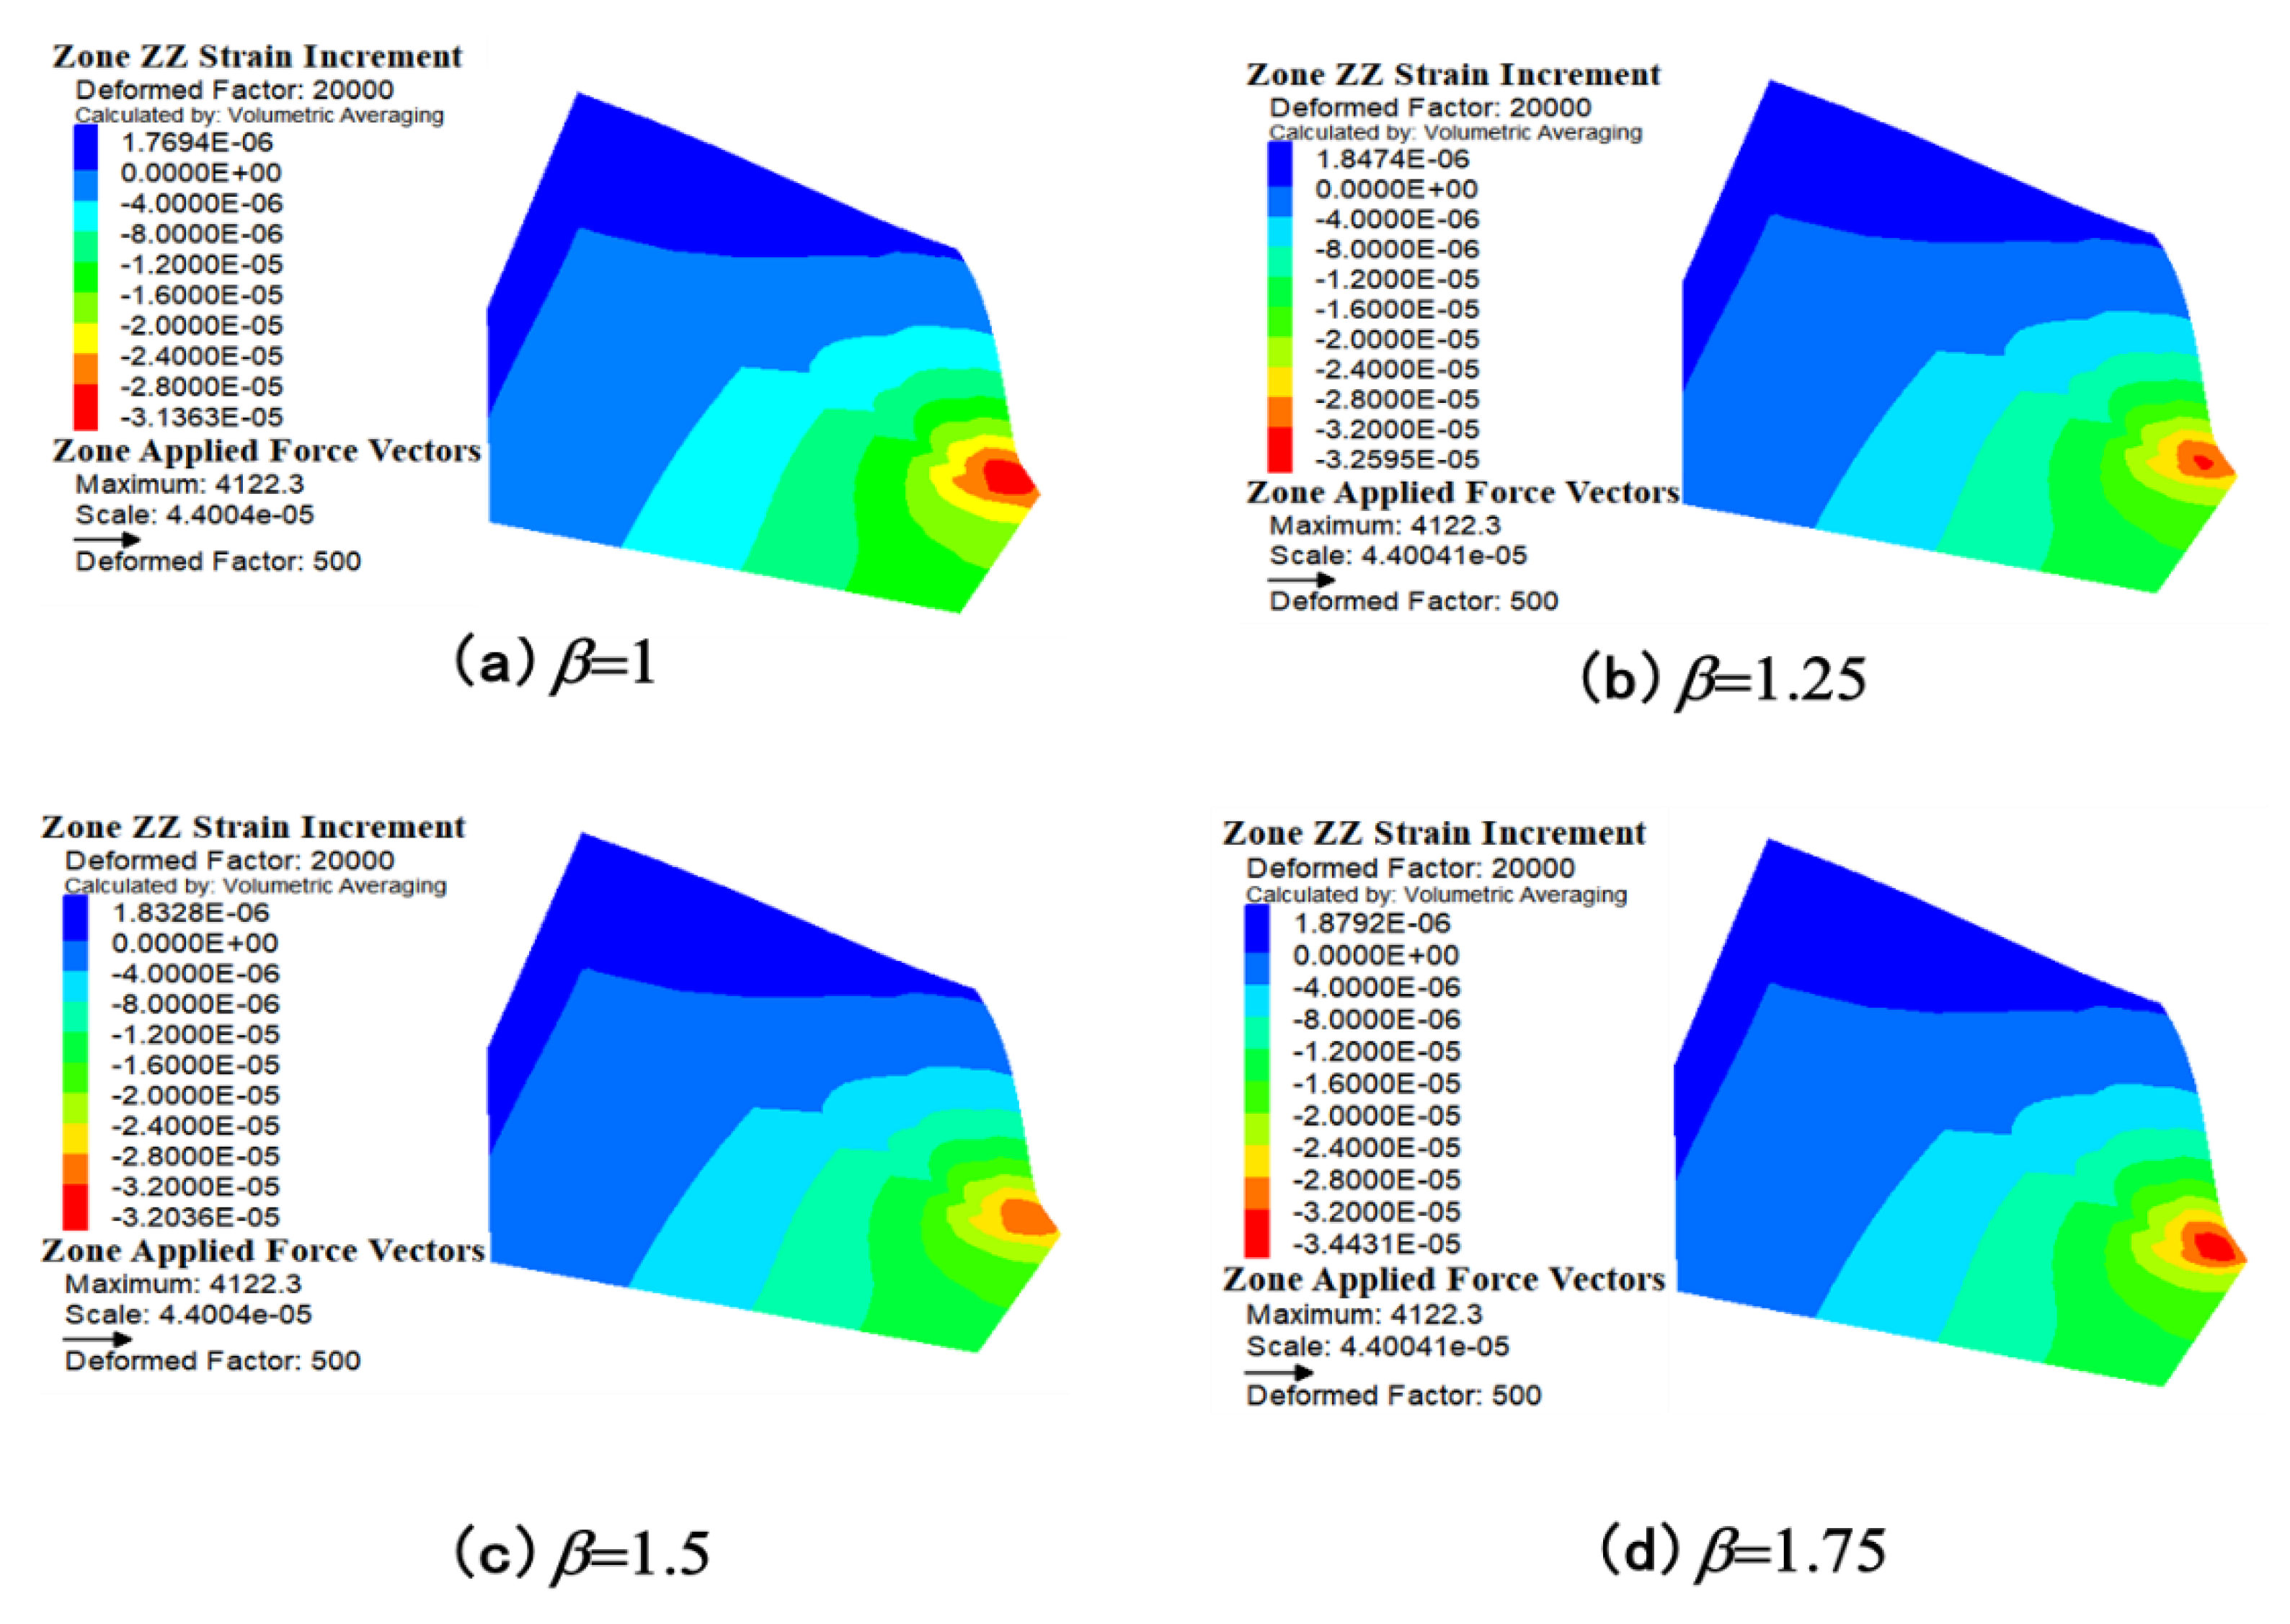
- Under the action of vehicle load, the compressive strain of the top surface of the subgrade presents a “pot bottom” type distribution, and the maximum compressive strain is relatively larger when cracks occur at the base. The vertical deformation of the road surface and the compressive strain of the subgrade top surface gradually increase with the increase of the tensile modulus ratio of surface laminate, especially when the compressive tensile modulus ratio is greater than 1.5. In addition, the effect of the constraint between layers on the vertical deformation of the path surface decreases with the decrease of the bending and tensile modulus of the surface;
- (5)
- Considering that the interlayer constraint of pavement structure during the service period is not an ideal continuous condition, which leads to greater tensile stress or strain at the bottom of the upper layer. Therefore, in order to avoid cracking of pavement structure, a high-modulus asphalt mixture can easily be used in the lower layer, and the tensile strength of the bottom of the surface layer should be enhanced or the upper layer should have a small compression modulus ratio.
Author Contributions
Funding
Institutional Review Board Statement
Informed Consent Statement
Data Availability Statement
Conflicts of Interest
References
- Chen, S.; Yu, J.; Li, H.; Liu, Y.; Zhang, X. Comparative analysis of Different Test Methods for Asphalt Mixture Modulus. J. Highw. Transp. Sci. Technol. 2008, 8, 6–9. [Google Scholar]
- Wang, X. Fatigue Damage Characteristics of Asphalt Mixture Considering the Difference of Tensile and Compressive Modulus. Master’s Thesis, Changsha University of Science and Technology, Changsha, China, 2017. [Google Scholar]
- Pan, Q.; Zheng, J. Mechanical Calculation Method and Analysis of Asphalt Pavement considering different tensile and compressive Modulus. Chin. J. Civ. Eng. 2020, 5301, 110–117. [Google Scholar]
- Cheng, H.; Sun, L.; Zheng, J.; Qian, G.; Liu, L.; Yang, R. Dynamic Compression-tension dual modulus of Asphalt Mixture and its Application in Pavement Response Analysis. Chin. J. Civ. Eng. 2022, 5503, 116–128. [Google Scholar]
- Xue, Y.; Huang, X. Application and evaluation of hot reclaimed asphalt mixture in Pavement structure containing LSPM. J. Hunan Univ. (Nat. Sci. Ed.) 2011, 3810, 26–33. [Google Scholar]
- Ren, Y.; Yan, E.; Hao, W.; Zhou, Z. Study on Correlation of performance indexes of Medium and Normal standard Asphalt Mixture. J. Highw. Transp. Sci. Technol. 2020, 3709, 15–33. [Google Scholar]
- Huang, M. Study on Dynamic Modulus of Asphalt Mixture under Complex Stress. Master’s Thesis, Changsha University of Science and Technology, Changsha, China, 2021. [Google Scholar]
- Wang, Y. Fatigue Properties of Asphalt Mixture Based on Mechanical Response of Asphalt Pavement. Master’s Thesis, South China University of Technology, Guangzhou, China, 2015. [Google Scholar]
- Yan, X.; Lv, S.; Tao, J. Experimental Study on Internal Parameters of Asphalt Mixture. J. Xi’an Highw. Jiaotong Univ. 1997, 3, 9–13. [Google Scholar]
- Lv, S.; Li, Y.; Liu, C.; Zheng, J. Synchronous Test Method for tensile Modulus of Asphalt Mixture Based on Splitting Test. China J. Highw. Transp. 2017, 3010, 13–21. [Google Scholar]
- Guo, T.; Yang, Y.; Xia, C.; Yang, N. Fatigue damage characteristics of rock asphalt modified asphalt mixture based on simultaneous tensile and compressive modulus testing. J. Highw. Transp. Sci. Technol. 2018, 3506, 14–21. [Google Scholar]
- Guyot, X. Use of high modulus asphalt-“EME”: Case studies in the Indian Ocean area. In Proceedings of the 15th AAPA International Flexible Pavements Conference, Brisbane, QLD, Australia, 22–25 September 2013. [Google Scholar]
- Leiva-Villacorta, F.; Taylor, A.; Willis, R. High-modulus asphalt concrete (HMAC) mixtures for use as base course. Natl. Cent. Asph. Technol. Rep. 2017, 17, 4. [Google Scholar]
- Lu, Q.; Sun, Y. Research on the Applicability of High Modulus Material Structure Layer Based on Fatigue Life. Shanghai Highw. 2017, 1, 16–19. [Google Scholar]
- Kun, W.; Hao, P. Study on pavement performance of high modulus asphalt and its mixture. Highw. Eng. 2015, 40, 5–8. [Google Scholar]
- Guang, Y.; Wang, X. Study on Rationality of Application of high modulus asphalt Concrete in Semi-rigid base Long life Asphalt Pavement. J. Highw. Transp. Sci. Technol. 2019, 36, 20–26. [Google Scholar]
- Liu, L. Research on Asphalt Pavement Interlayer Treatment Technology. Master’s Thesis, Chang’an University, Xi’an, China, 2008. [Google Scholar]
- Zheng, Z. Study on Mechanical Behavior of Asphalt Pavement under Heavy Duty Vehicles. Master’s Thesis, Chang’an University, Xi’an, China, 2010. [Google Scholar]
- Bueckner, H.F. Novel principle for the computation of stress intensity factors. Z. Angew. Math. Mech. 1970, 50, 9. [Google Scholar]
- Petroski, H.J.; Achenbach, J.D. Computation of the weight function from a stress intensity factor. Eng. Fract. Mech. 1978, 10, 257–266. [Google Scholar] [CrossRef]
- Wu, X.R. Analytical wide-range weight functions for various finite cracked bodies. Eng. Anal. Bound. Elem. 1992, 9, 307–322. [Google Scholar] [CrossRef]


| AC-25/20 | AC-13 | SBS Modified Asphalt |
|---|---|---|
| Chen Shaoxing et al. [1] Compression and tension modulus ratio 1.5 | Pan Qinxue et al. [3] Compression and tension modulus ratio 1.5–2 | Wang Xiaoyang [2] Tension and compression modulus ratio 3:5 |
| Xue Yanqing et al. [5] Tension and compression modulus ratio 0.59–0.69 | Cheng Huailei et al. [4] Compression and tension modulus ratio 1.6–4.0 | Yan Xili [9] Compression and tension modulus ratio 3.9–7.8 |
| Ren Yufang et al. [6] Compression and tension modulus ratio 1.31 | Huang Mouying [7] Compression and tension modulus ratio 1.2–1.6 | Lu Songtao et al. [10] Compression and tension modulus ratio 1.2 |
| Huang Mouying [7] Compression and tension modulus ratio 1.3–1.8 | Wang Yangyang [8] Tension and compression modulus ratio 1:2 | Guo Tong et al. [11] Compression and tension modulus ratio 1.6–2 |
| Structure Layer | Thickness (cm) | Elasticity Modulus (MPa) |
|---|---|---|
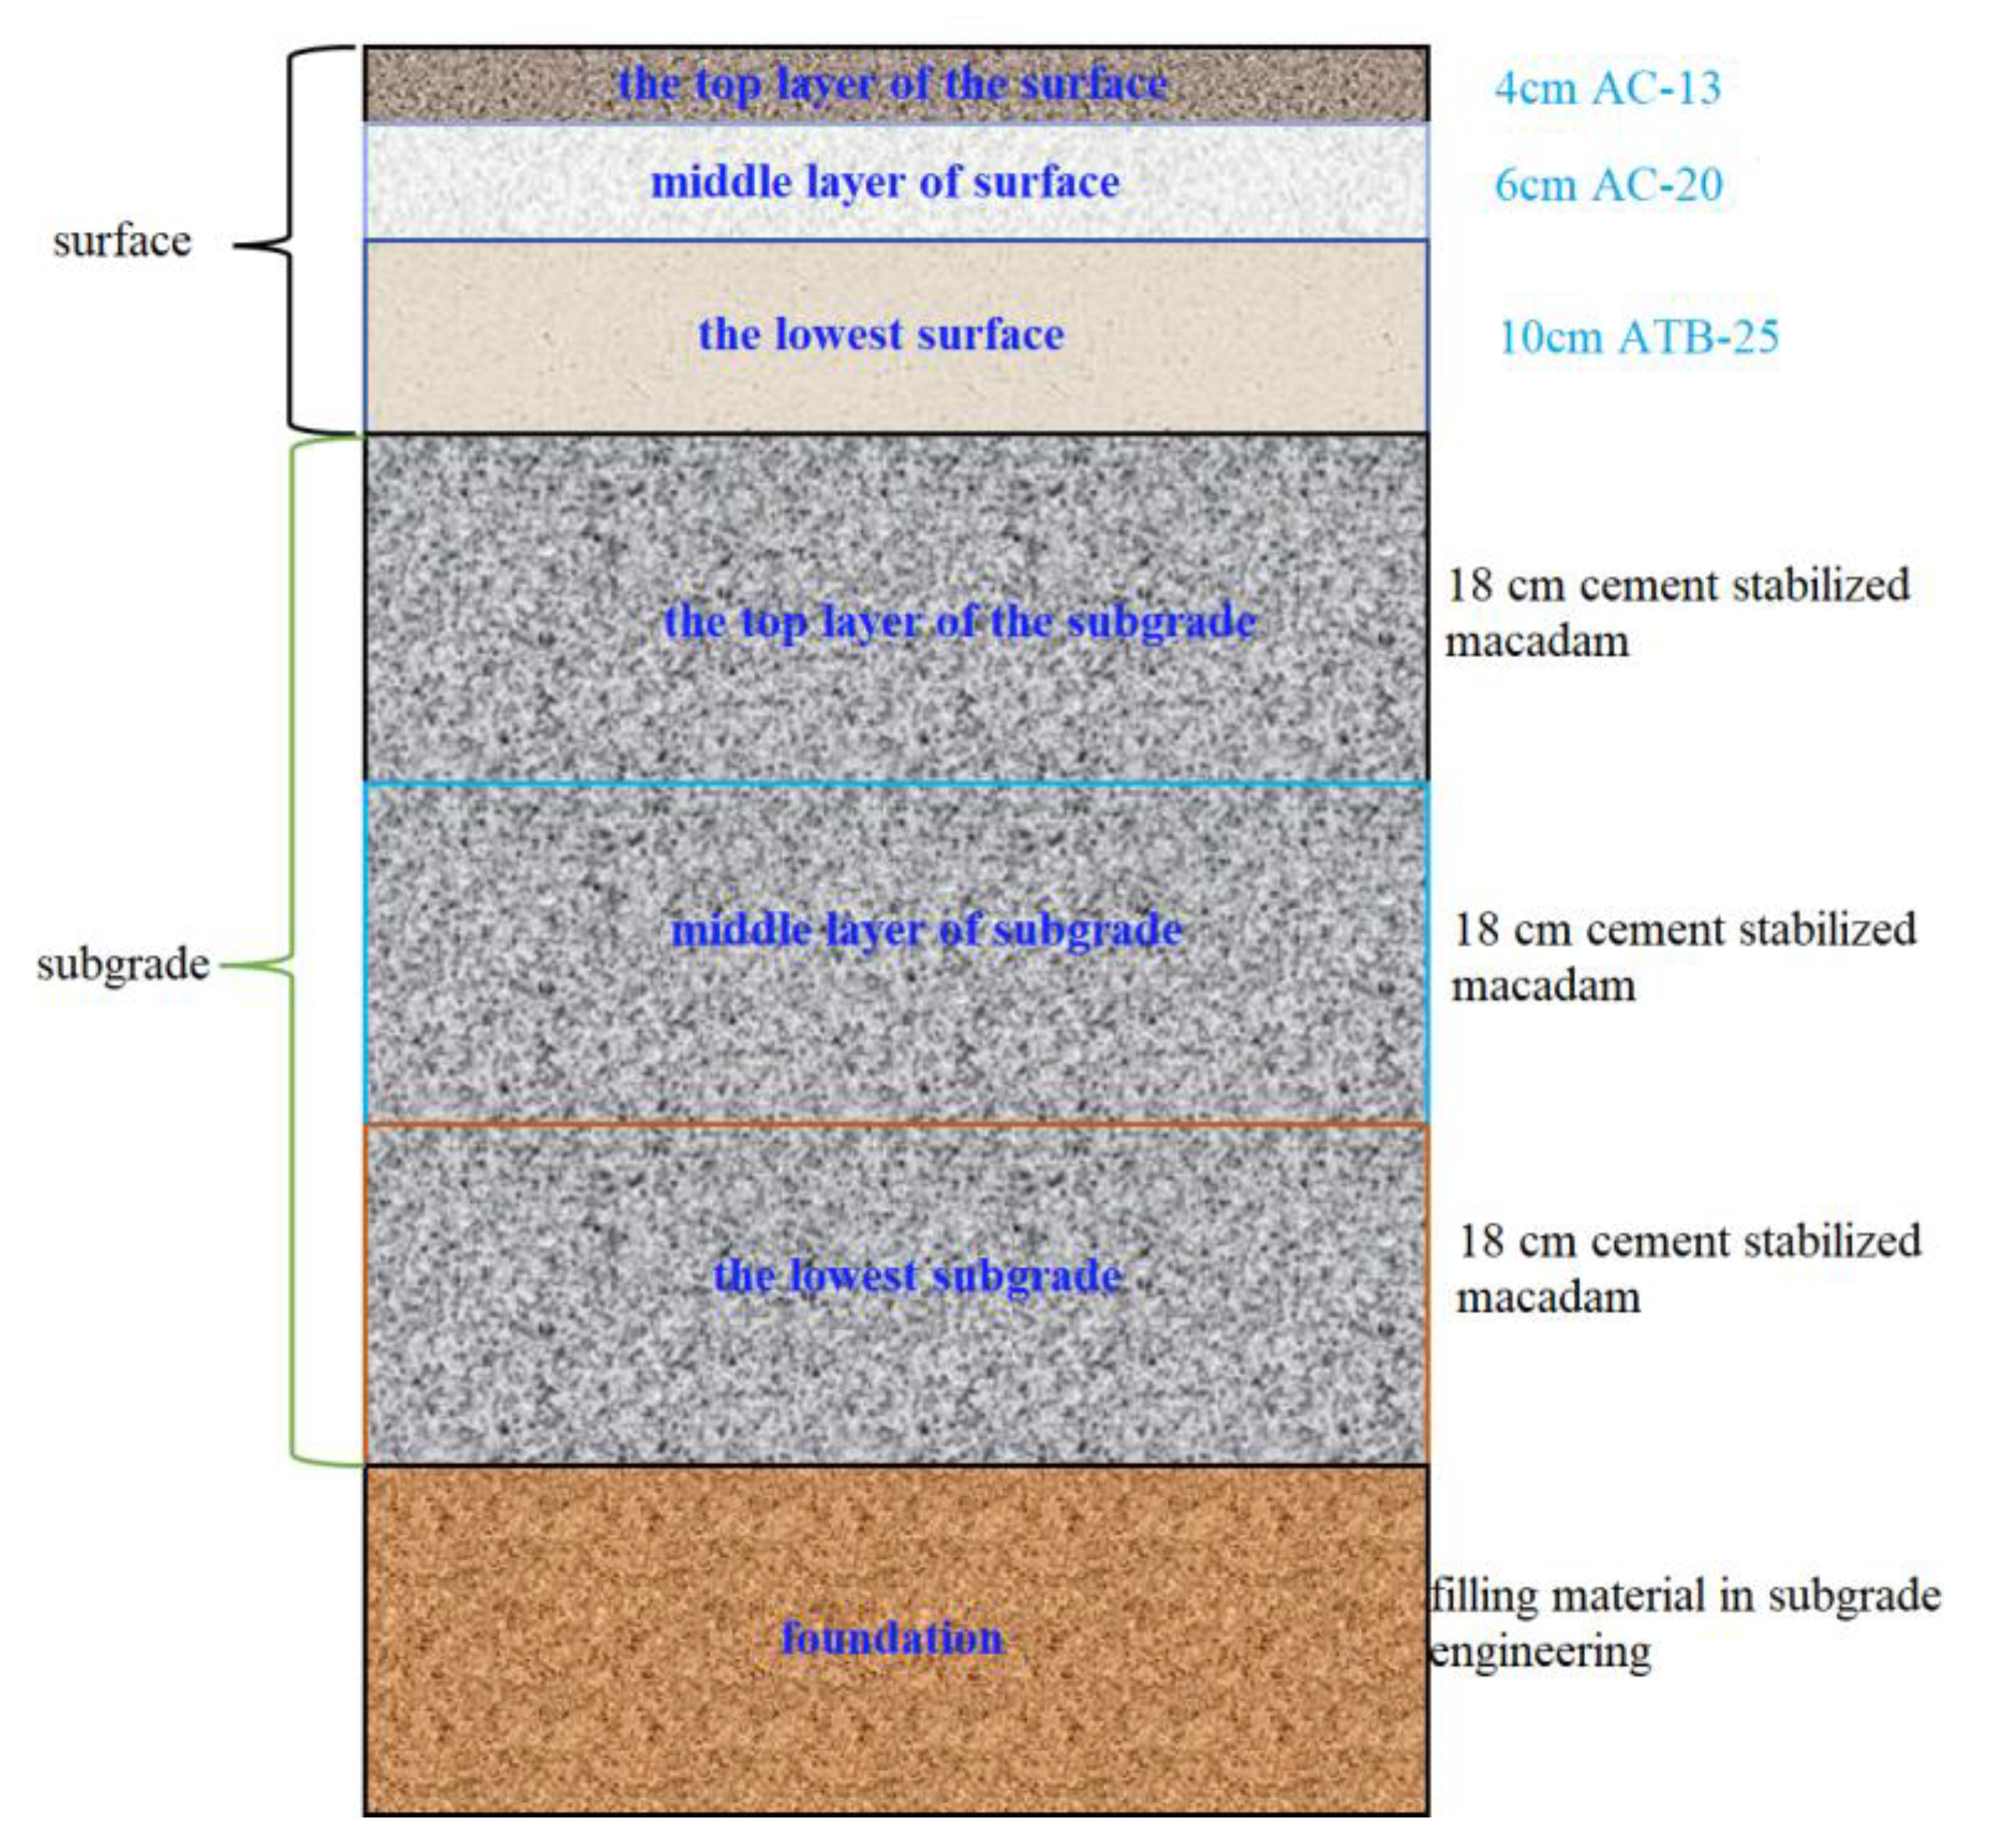
| Upper layer | 4 | 9500 |
| Middle surface | 6 | 11,000 |
| base course | 10 | 9000 |
| The top layer of the subgrade | 18 | 11,500 |
| The middle layer of the subgrade | 18 | 11,500 |
| The lowest subgrade | 18 | 8500 |
| foundation | 200 | 187 |
Disclaimer/Publisher’s Note: The statements, opinions and data contained in all publications are solely those of the individual author(s) and contributor(s) and not of MDPI and/or the editor(s). MDPI and/or the editor(s) disclaim responsibility for any injury to people or property resulting from any ideas, methods, instructions or products referred to in the content. |
© 2023 by the authors. Licensee MDPI, Basel, Switzerland. This article is an open access article distributed under the terms and conditions of the Creative Commons Attribution (CC BY) license (https://creativecommons.org/licenses/by/4.0/).
Share and Cite
He, Y.; Pu, C.; Xu, P.; Li, X.; Yang, G.; Meng, H. Performance-Based Expressway Asphalt Pavement Structural Surface Layer Modulus Matching Mode Research. Coatings 2023, 13, 986. https://doi.org/10.3390/coatings13060986
He Y, Pu C, Xu P, Li X, Yang G, Meng H. Performance-Based Expressway Asphalt Pavement Structural Surface Layer Modulus Matching Mode Research. Coatings. 2023; 13(6):986. https://doi.org/10.3390/coatings13060986
Chicago/Turabian StyleHe, Yonghai, Changyu Pu, Peng Xu, Xujia Li, Guangqing Yang, and Huilin Meng. 2023. "Performance-Based Expressway Asphalt Pavement Structural Surface Layer Modulus Matching Mode Research" Coatings 13, no. 6: 986. https://doi.org/10.3390/coatings13060986