Article

Relationship between Osteoblast Proliferation and the Surface Properties of Polymer-like Carbon Films Deposited at Different Ar/CH4 Mixed-Gas Ratios in the Radio-Frequency Plasma CVD Process

1
Applied Medical Sciences College, King Saud University, Riyadh 11451, Saudi Arabia
2
Department of Electrical and Electronic Engineering, Faculty of Engineering, Tokyo Denki University, 5 Senju Asahi-cho, Adachi-ku, Tokyo 120-8551, Japan
3
Core Research Facilities, Jikei University School of Medicine, 3-25-8, Nishi-shinbashi, Minato-ku, Tokyo 105-8461, Japan
4
Division of Electronic Engineering, Faculty of Science and Engineering, Tokyo Denki University, Ishizaka Hatoyama, Saitama 350-0394, Japan
*
Author to whom correspondence should be addressed.
Coatings 2023, 13(6), 983; https://doi.org/10.3390/coatings13060983
Submission received: 26 April 2023 / Revised: 13 May 2023 / Accepted: 17 May 2023 / Published: 25 May 2023
(This article belongs to the Special Issue Application of Coatings on Implants Surfaces)

Abstract

:
In the deposition of polymer-like carbon (PLC) films on Si substrates via radio-frequency plasma CVD (RF-PCVD), the effect of the Ar/CH4 gas mixture ratio on the bio-interface of the PLC films remains unclear and the effectiveness of introducing Ar gas must be proven. In this study, five types of PLC films are prepared on Si substrates via RF-PCVD with an Ar/CH4 gas mixture. The effects of the Ar/CH4 gas ratio on the structure, surface properties, and osteoblast proliferation of the PLC films are investigated. The PLC film structure is graphitized as the hydrogen content in the PLC film decreases with the increasing Ar gas ratio. Based on in vitro cell culture tests, a PLC film with a higher Ar gas ratio promotes the osteoblast proliferative potential after 72 h compared with a PLC film with a relatively low Ar gas ratio. Moreover, the surface roughness and hydrophilicity of the PLC film increase with the Ar gas ratio. Accordingly, we demonstrate the effectiveness of Ar gas incorporation into the RF-PCVD process to promote the biological responsiveness of PLC films. PLC coatings are expected to be widely applied for surface modification to improve the mechanical characteristics and biological responses of orthopedic implant devices.

1. Introduction

The demand for orthopedic implant devices such as joint prostheses, spinal fusion systems, and bone-jointing devices is increasing annually owing to the increasing global population [1]. Although metals, ceramics, and polymers are used in different implant materials according to the functions required for the specific applications, meeting the increasingly diverse patient requirements with only a single material is challenging. Therefore, surface modifications such as dry/wet coatings and plasma surface treatments to improve surface function while maintaining the bulk function of the implant materials have been widely investigated [1,2,3].
Amorphous carbon films, including diamond-like carbon (DLC), a dry coating film, have attracted considerable attention as a means of surface modification of implant materials, owing to their high affinity for in vivo tissues and excellent medical properties, such as their mechanical properties, corrosion resistance, and antibacterial properties [4,5]. “Amorphous carbon film” is a generic term for disordered carbon films containing sp2 and sp3 hybrid orbital and hydrogen bonds. It is subdivided into six film types (amorphous carbon (a-C), hydrogenated amorphous carbon (a-C:H), tetrahedral amorphous carbon (ta-C), hydrogenated tetrahedral amorphous carbon (ta-C:H), polymer-like carbon (PLC), and graphite-like carbon) with different characteristics according to their film structure [6,7]. Among them, PLC films exhibit a relatively high hydrogen content (40 ≤ H ≤ 70) and high flexibility [6]. Therefore, PLC films can maintain a stable surface functionality without cracking or peeling, even in implantable devices subjected to material deformation [8]. In addition, radio-frequency plasma chemical vapor deposition (RF-PCVD), a typical deposition method for PLC films, is a low-temperature process (~100 °C) and can be used to deposit films on three-dimensional structures [6,9]. Therefore, it has long been utilized to form thin films for complexly shaped polymeric medical devices, such as synthetic vascular grafts and artificial heart blood pumps [10,11].
We previously investigated the relationship between surface properties and biological responsiveness to the thickness of PLC films deposited on Si substrates via RF-PCVD. Relatively thick PLC films (>300 nm) exhibit greater surface roughness and hydrophilicity compared with thinner PLC films and promote osteoblast and fibroblast proliferation [12]. However, because the characteristics of PLC films obtained with RF-PCVD depend on various deposition conditions, including the source gas, parameters other than the film thickness must be investigated as well [13,14,15]. In the RF-PCVD process using an Ar/CH4 gas mixture as the source gas, increasing the Ar gas ratio decreases the hydrogen content in the amorphous carbon film and increases the film’s hardness [16]. According to Samadi et al., the water contact angle of an amorphous carbon surface has a minimum value for an Ar/CH4 mixed-gas ratio [17]. Furthermore, Toro et al. reported that the impact of Ar ions increases depending on the Ar gas ratio, and the surface roughness intensifies at the nano-order level [18]. Therefore, adjusting the Ar/CH4 gas ratio during RF-PCVD may promote the biological responsiveness of PLC films in addition to improving their mechanical properties, as reported previously. However, the effect of the Ar/CH4 gas mixture ratio on the bio-interface of the PLC films remains unclear, and the effectiveness of introducing Ar gas must be proven.
In this study, five PLC samples with various Ar/CH4 mixed-gas ratios are fabricated on Si substrates via RF-PCVD. The relationships between the structure, surface properties, and osteoblast proliferation of the PLC films are investigated. Clarifying the effectiveness of the aforementioned Ar gas will increase opportunities for the application of PLC coatings to improve the functionality of bio-implant devices.

2. Experimental Procedure

2.1. Deposition Conditions of the PLC Film

In this experiment, a PLC film was deposited on a Si{100} substrate (10 × 10 mm) placed on the cathode side using a parallel-plate electrode 13.56 MHz radio-frequency plasma CVD system (RF-PCVD; PED-401, ANELVA, Ltd., Kanagawa, Japan). This Si substrate is not toxic to osteoblasts and has been used to evaluate the biological responses of various dry-coated films [12,19,20,21,22]. PLC film samples were prepared for surface and film structure analyses and cell culture tests, respectively. Before the deposition, the Si substrate surface was ultrasonically cleaned with acetone and ethanol for 10 min to remove contaminants. After the vacuum chamber was evacuated to 1 Pa, the PLC films were coated onto the Si substrates under controlled deposition conditions. During this process, the deposition time was varied such that the thickness of each PLC film was approximately 200 nm. The ratio of Ar to CH4, the source gas, was adjusted using a mass-flow controller (MODEL8500; KOFLOC, Ltd., Kyoto, Japan) to achieve a total gas flow rate of 100 sccm. The purity of each gas was 99.9999% (v/v). Table 1 lists the deposition conditions for the PLC film.

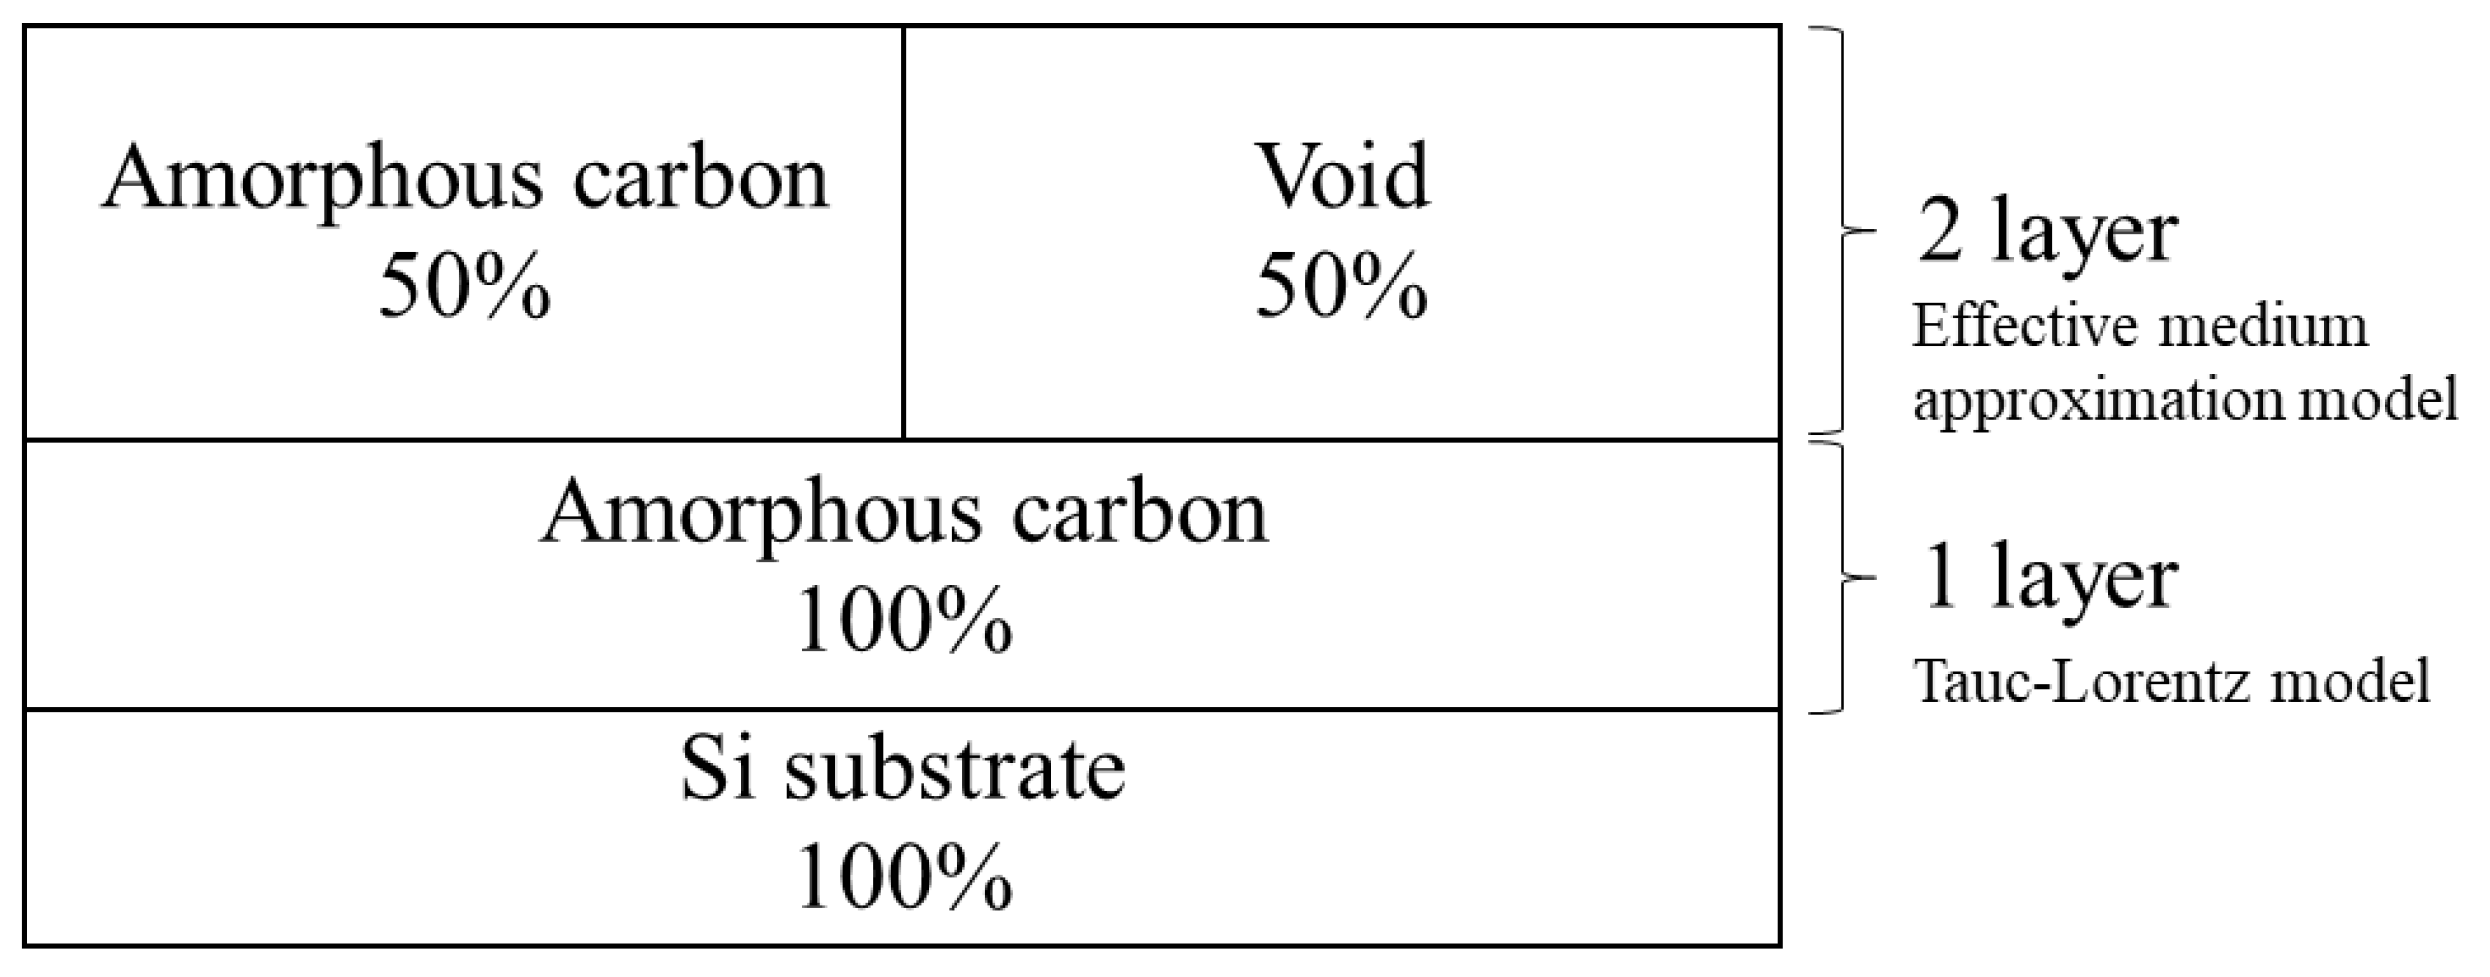
2.2. Spectroscopic Ellipsometer Analysis

An optical classification method was employed to prove that the amorphous carbon produced in this experiment was of the PLC type. This classification method was based on an n-k plot at a wavelength of 550 nm, as defined in ISO 23216:2021(E), which allowed classification into six amorphous carbon types [7]. The n-k plot denotes that n is the refractive index and k is the extinction coefficient. Recently, we conducted investigations to standardize the biological responses of these amorphous carbon films [12,22,23].
The thickness, optical constants (refractive index (n) and extinction coefficient (k)), and optical surface roughness of each PLC film were analyzed using a spectroscopic ellipsometer (SE; UVISEL PIUS, HORIBA, Ltd., Kyoto, Japan). The resolution of the SE analysis was 0.001 for the optical constant and 1 Å for the film thickness. In the SE analysis, the reflection amplitude ratio angle (ψ) and phase difference (Δ) of s-polarized and p-polarized light with wavelengths ranging from 191 to 2066 nm (photon energy 0.6 to 6.5 eV) were measured with the incident angle fixed at 70°. Subsequently, based on the SE spectra, a regression analysis was performed with a hypothetical thin-film multilayer model assuming a surface roughness layer/amorphous carbon film layer/substrate, such that the chi-square (χ2) was small [7]. The virtual thin-film multilayer model is shown in Figure 1. In this basic model, the amorphous carbon film layer is described with the Tauc–Lorentz model and the surface roughness layer is the effective medium approximation of the amorphous carbon film layer (50%) and the air layer (50%). The amorphous carbon types in this experiment were subsequently classified based on the derived n-k plots at 550 nm wavelength.

2.3. Structural Analysis

The structures of the five PLC film samples with different Ar/CH4 gas mixture ratios were analyzed using Raman spectroscopy (SpectraPro 2750, Princeton Instruments, Acton, MA, USA). The Raman analysis conditions were as follows: laser power, 1 mW; laser wavelength, 532 nm; exposure time, 30 s; and the number of integrations, two cycles. The obtained Raman spectrum of the PLC film was waveform-separated with Gaussian fitting into the D peak (approximately 1350 cm−1) attributed to the disordered structure and the G peak (approximately 1550 cm−1) attributed to the graphitic structure [24]. The ID/IG intensity ratio and G peak positions were subsequently determined.

2.4. Cell Culture Test

The osteoblast proliferation on the PLC film was evaluated with an in vitro cell culture test using mouse-derived osteoblasts (MC-3T3). As a control, Si substrates were used. A Si substrate is nontoxic to osteoblasts and has a high affinity with osteoblasts; thus, its cell affinity can be considered good provided it is equal to or higher than that of the control. Notably, only one line of osteoblasts was used in this experiment; it is positioned as a preliminary experiment.
MC-3T3 cells from the calvariae of C57BL/6 mice were obtained from the American Type Culture Collection (ATCC, Manassas, VA, USA). The cells were cultured in minimum essential medium (MEM)-α medium supplemented with 10% v/v fetal bovine serum and penicillin/streptomycin (100 IU/mL and 100 µg/mL; Sigma-Aldrich, St. Louis, MO, USA) and maintained until the day of the experiment [20].
Prior to cell culture, all PLC samples were subjected to UV sterilization (GL-15, Panasonic Corporation, Osaka, Japan) at 253.7 nm for 1 h on a clean bench (air atmosphere, temperature ~25 °C, humidity ~64%). The UV irradiation of the PLC surface was adjusted to 6 μW/cm2. This UV treatment was sufficient for UV irradiation (21,600 μW × s/cm2) to kill 99% of bacteria [25]. The UV treatment conditions used in this experiment did not significantly influence the surface properties of the PLC films [22]. After UV sterilization, each sample (n = 5) was cut into 10 × 10 mm pieces and placed in a 12-well cell culture plate. MC-3T3 cells were cultured on the PLC films under the conditions listed in Table 2. The cell culture was incubated for 24 h and 72 h to validate the initial cell adhesion and cell proliferation.
After cell culture, viable cells adhering to the PLC surface were removed using trypsin (0.25 w/v% Trypsin-1 mmol/L EDTA-4Na solution with phenol red, Wako Ltd., Tokyo, Japan). Subsequently, after adding CellTiter-Blue® Viability Assay (Promega, Madison, WI, USA), the fluorescence emission intensity (wavelength 580 nm) from the viable cells was measured using a plate reader (2300 En Spire, Waltham, MA, USA) (n = 5).

2.5. Statistical Analysis

The significance of the osteoblast proliferation in each sample was validated using a multiple comparison test based on Tukey’s method (25 samples: n = 5 × 5 cycles). In this test, the differences associated with a p-value < 0.05 were considered significant; that is, cell proliferation between the samples differed significantly when p < 0.05. This calculation was performed using statistical analysis software (Igor Pro 9, Wave Metrics. Inc., Portland, OR, USA).

2.6. Cell Morphology

The cell morphology of the PLC films and control surfaces after 72 h was observed using a field emission scanning electron microscope (SEM; Regulus 8100, HITACHI Ltd., Kyoto, Japan). Regarding the SEM observation, freeze-drying was used to fix the cells on each sample surface, and cell morphology was imaged at an acceleration voltage of 2 KV and magnification in the 700–1000× range.

2.7. Surface Analysis

Regarding surface analysis, the wettability, surface roughness, and surface composition of each PLC sample were evaluated. The wettability of the PLC film was evaluated based on the respective droplet contact angles of pure water and methylene iodide at room temperature (20 °C). In this contact angle evaluation, the drop position of the liquid was changed and the evaluation was repeated ten times. The contact angles were determined using the θ/2 method. Furthermore, the surface free energy was calculated based on the Young–Dupré and Owens–Wendt equations for the average value of each contact angle obtained [26]. In general, the surface free energy of a solid can be calculated by measuring the contact angle between two liquids with different polar or dispersion components, such as pure water and methylene iodide [27].
The surface roughness of the PLC films was evaluated using an atomic force microscope (AFM; SPM-9700HT, SHIMADZU, Ltd., Kyoto, Japan). For the AFM analysis, the root-mean-square roughness in the 10 × 10 µm range was determined in the contact mode.
The chemical composition of the PLC surface was analyzed via X-ray photoelectron spectroscopy (XPS: ESCA3400, Shimadzu Ltd., Kyoto, Japan). In the XPS, a conical X-ray source (MgKα source, 10 mA, 10 kV) was used to analyze carbon 1s (C1s) spectra. The obtained C1s spectrum was normalized to the maximum peak value of 1. Subsequently, a shift correction was performed, such that the C1s maximum peak was located at 284.5 eV. Furthermore, the C1s peak was separated into C-C sp2, C-C sp3, C-O, C=O, and O=C-O bonds and the ratio of each bond area was calculated accordingly [28].

3. Results and Discussion

3.1. Confirmation of Amorphous Carbon-Type Based on n-k Plots

The film thickness, optical constants (refractive index and extinction coefficient), and optical surface roughness of the five PLC film samples with different Ar/CH4 gas ratios were evaluated using SE analysis. The results of the SE analysis are listed in Table 3, and the n-k plots are shown in Figure 2. The relatively smaller χ2 value in the SE regression analysis suggests that the fitting was performed with high accuracy and the PLC film thickness (mean χ-fitting error) was approximately 200 nm. The refractive index and extinction coefficient of the PLC film increased with the Ar gas ratio, with the refractive index and extinction coefficient distributions in the ranges of 1.796–2.018 and 0.019–0.135, respectively. Applying these n-k plots to the optical classification method of amorphous carbon films, they are all categorized as PLC-type [7]. As mentioned, the PLC film has a relatively high hydrogen content among amorphous carbons, rendering it highly flexible [6]. Furthermore, the optical constants of amorphous carbon films are as follows: the refractive index increases as the hydrogen content (C-H bonds) in the film decreases, and the extinction coefficient increases as the number of π electrons (the graphite component) increases [17,23,29]. Furthermore, Hiratsuka et al. reported that the film density and film hardness increased in proportion to the refractive index of an amorphous carbon film [30]. Therefore, the hydrogen content in the PLC film decreases with an increasing Ar gas ratio, resulting in enhanced graphitization and increased film density and hardness. The optical surface roughness of the PLC film increased by a few nanometers as the Ar gas ratio increased.

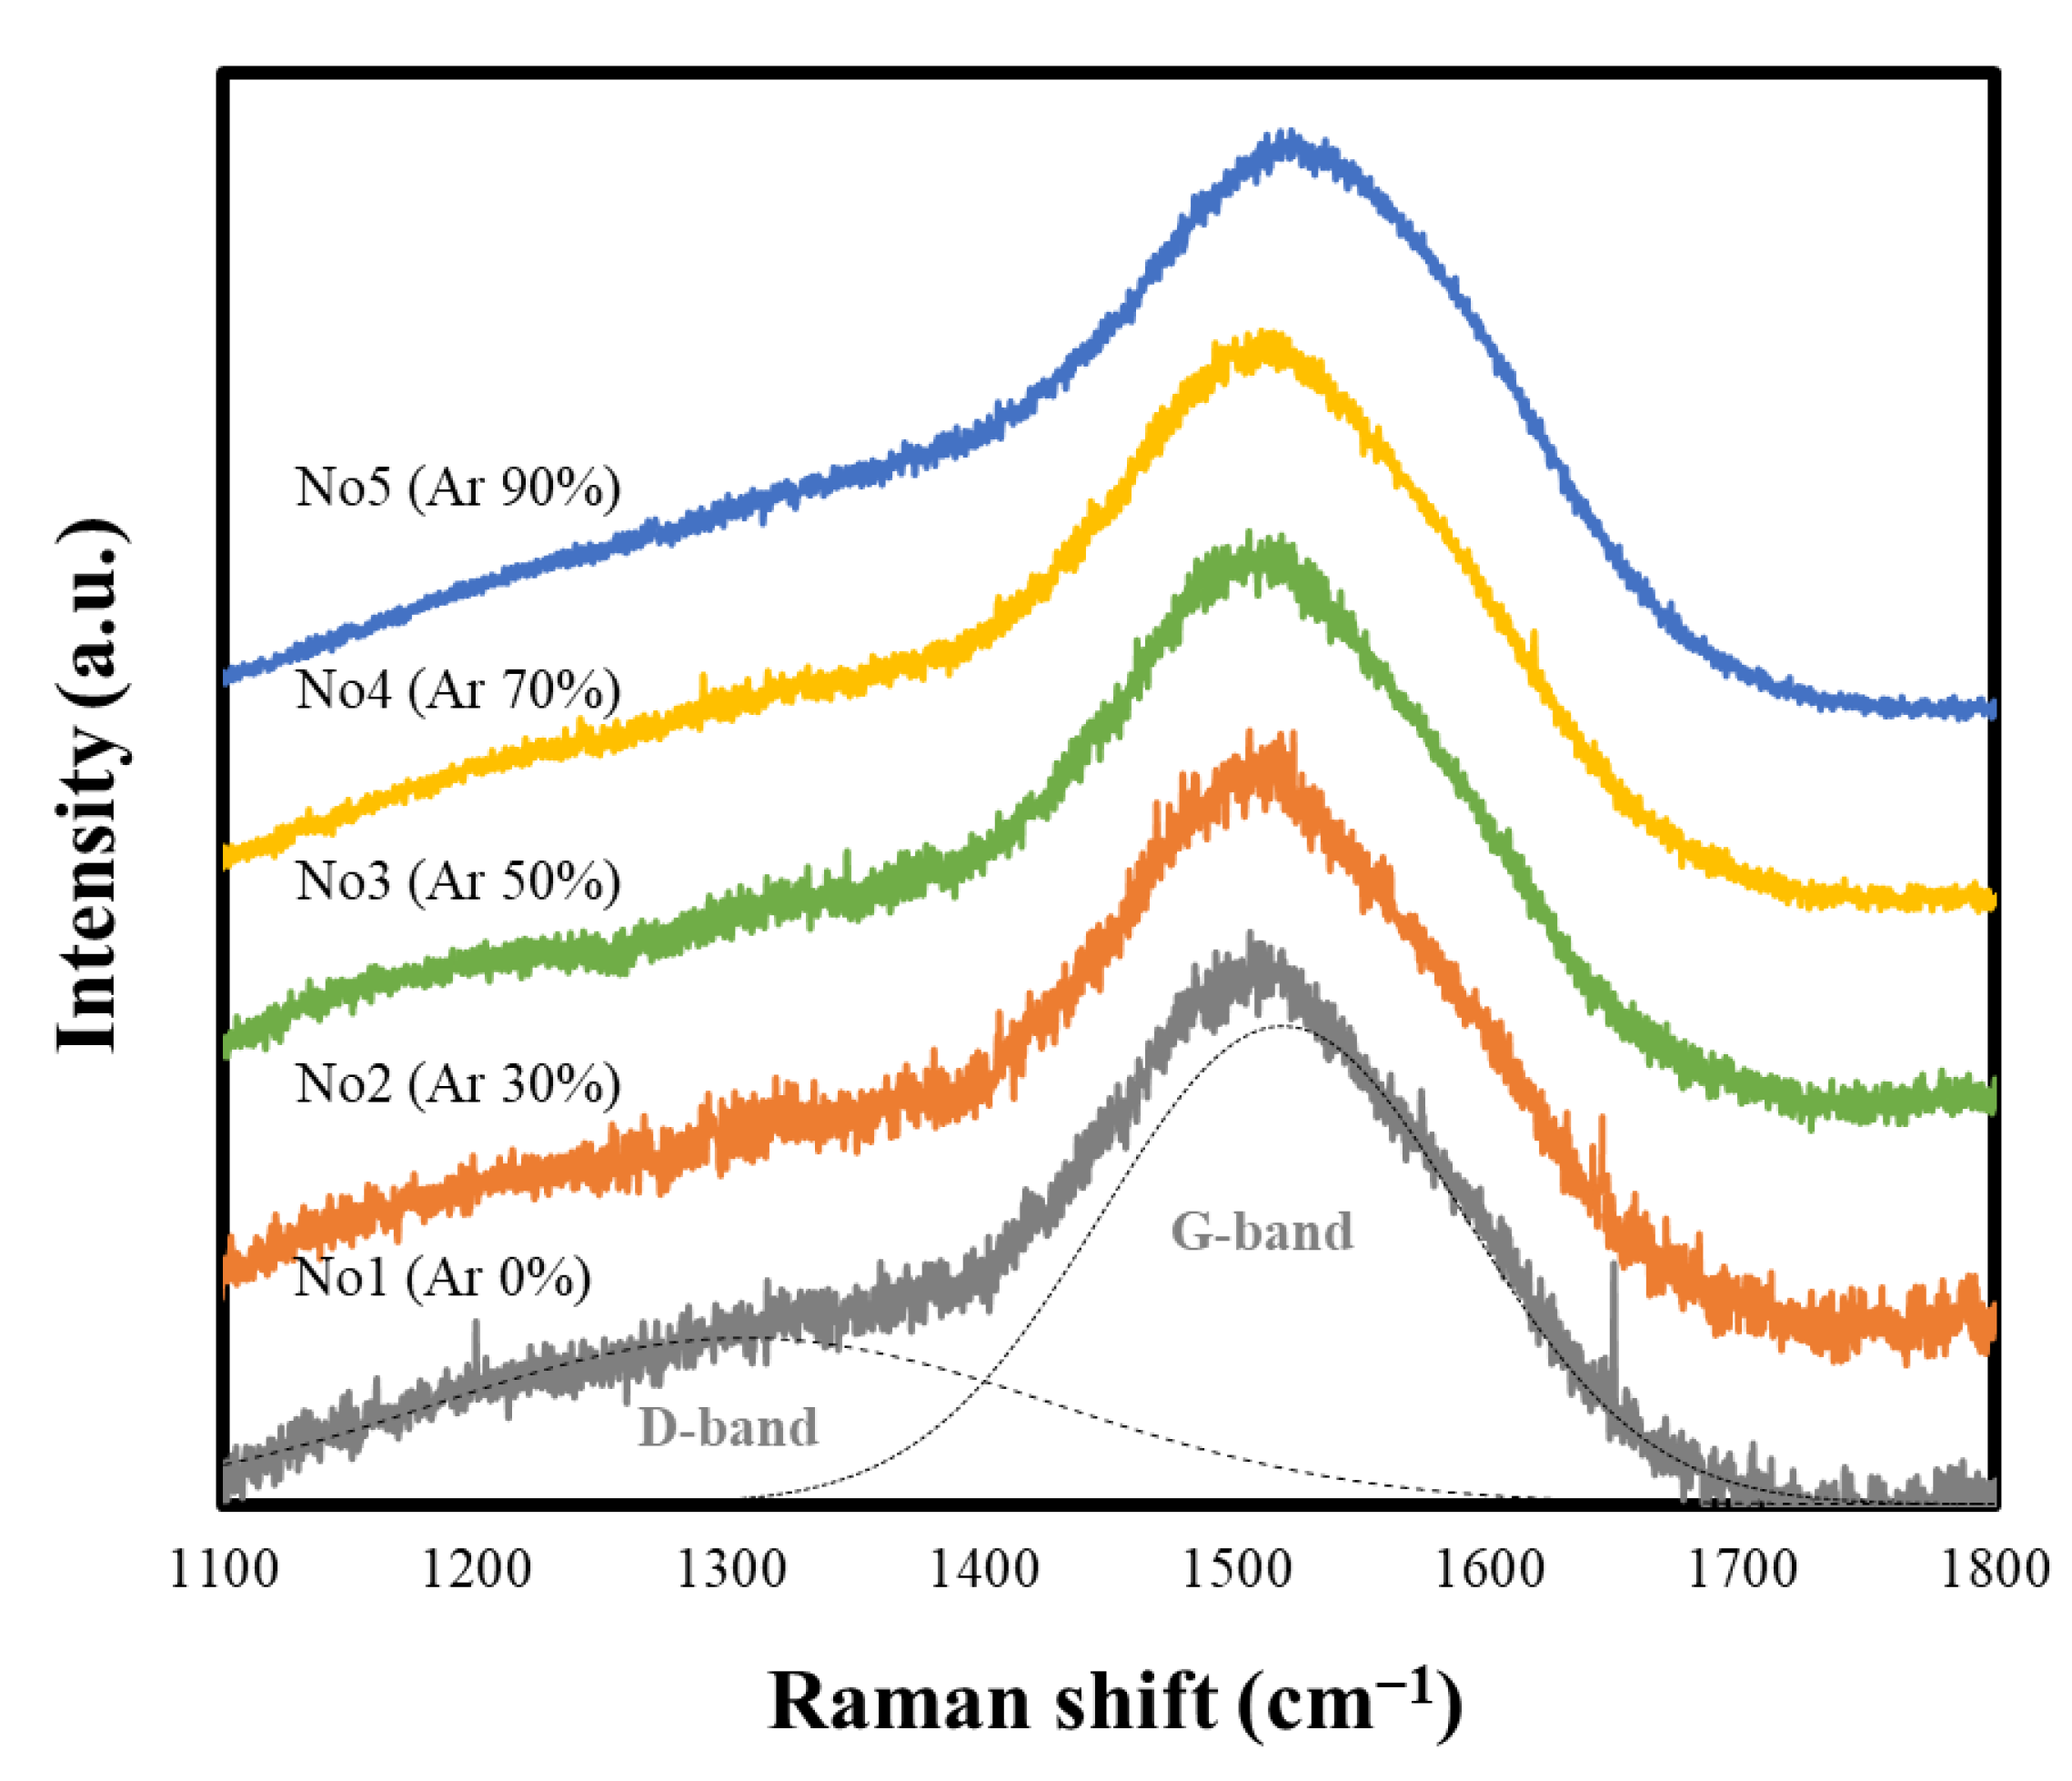
3.2. Structural Changes of the PLC Film with Ar/CH4 Gas Mixture Ratios

The structures of the PLC films were validated via Raman spectroscopy. The Raman spectra of each sample are shown in Figure 3, and Table 4 lists the Gaussian fitting results. All PLC samples exhibited Raman spectra with G and D peaks, which are characteristic of amorphous carbon films. As the Ar gas ratio increased, the ID/IG intensity ratio of the PLC film increased and the positions of the G and D peaks shifted toward higher frequencies. The ID/IG intensity ratio increased with the increasing size and number of the sp2 clusters in the film. In contrast, the positions of the D and G peaks shifted toward the high-frequency side as the residual compressive stress of the PLC film increased [24,31]. Moreover, the introduction of sp3 sites shifted the G peak to the lower wavenumber side [6,22,24]. Therefore, the ion impact on the PLC film increased as the Ar gas ratio increased; the destruction of the sp3 sites was considered to be the cause of graphitization in the film. The results of the Raman analysis agreed with those of the SE analysis and were validated.

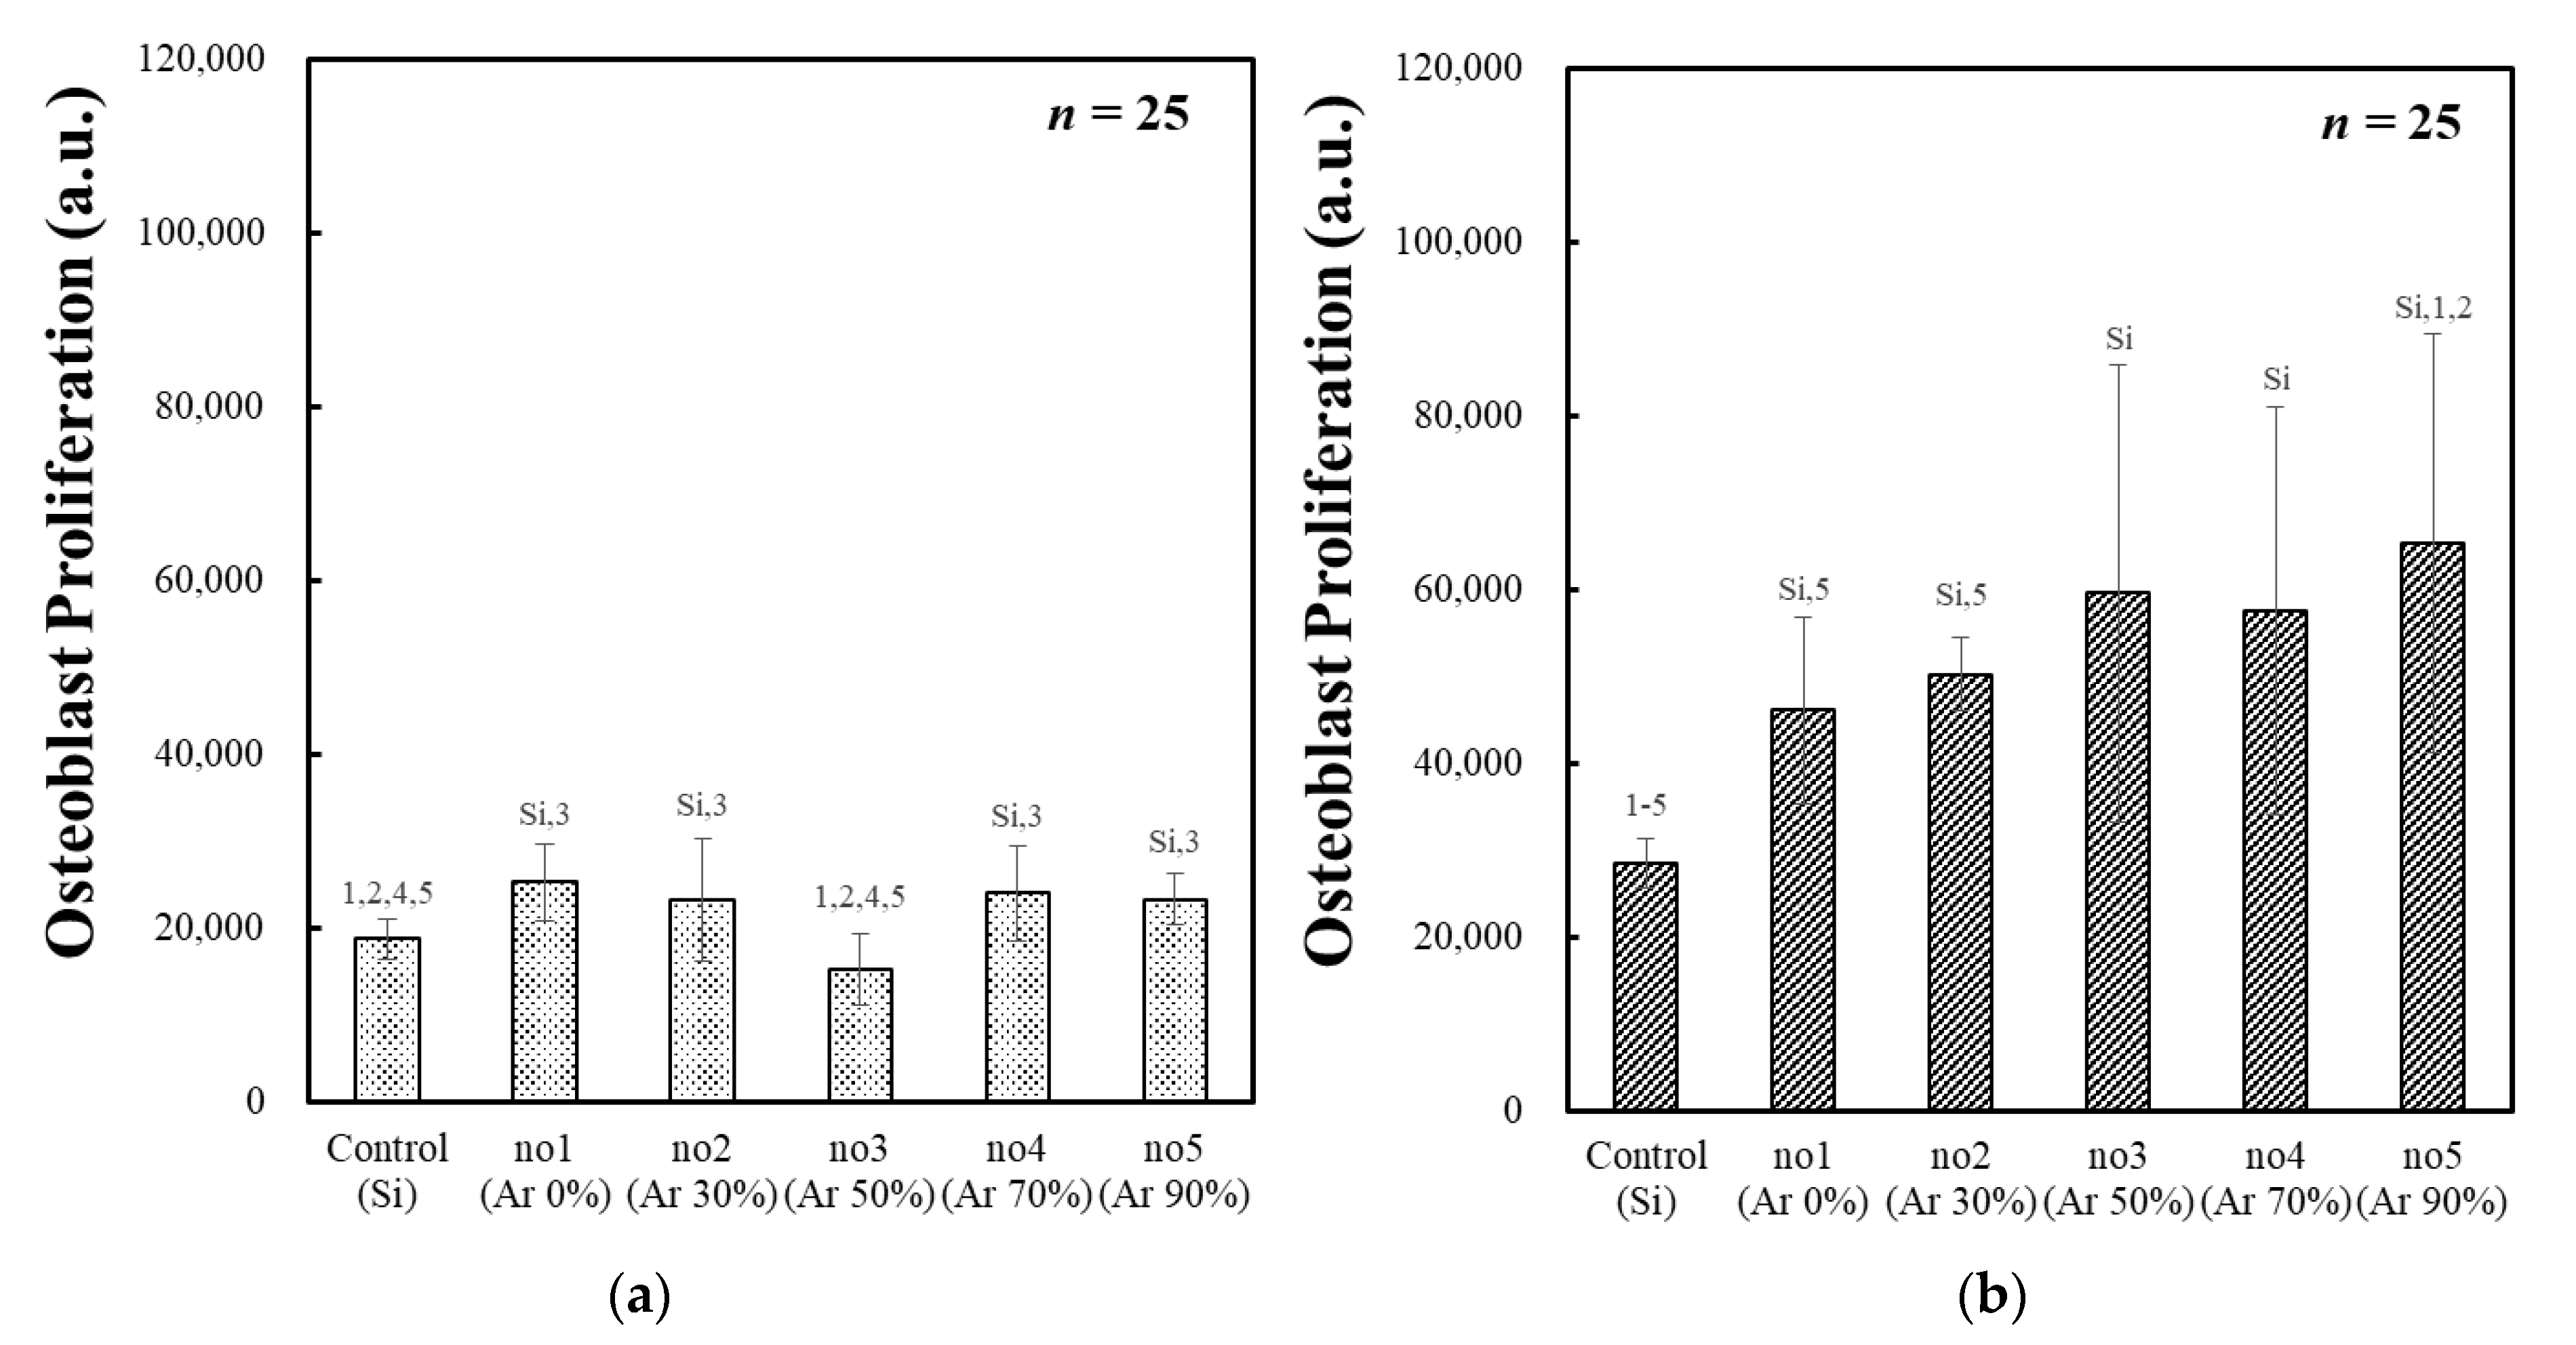
3.3. Osteoblast Proliferation of the PLC Film with Ar/CH4 Gas Mixture Ratio

The osteoblast proliferation of each PLC sample and the Si substrate (control) on which no PLC film was deposited was evaluated in an in vitro cell culture test. The results of the initial osteoblast adhesion after 24 h and osteoblast proliferation after 72 h are shown in Table 5 and Figure 4, respectively. Cell adhesion and proliferation are shown in Table 5 as the mean ± standard deviation. Moreover, the results of multiple comparison tests between each sample are shown in Figure 5, with a significance level of 5% or less (p < 0.05) considered a significant difference. The Si shown in that table denotes the control and the numbers denote the sample number.
The initial osteoblast adhesion of each PLC sample was higher than that of the control; however, no clear trend in the change in the Ar gas ratio was observed. However, a statistically significant difference in the osteoblast proliferation of the PLC samples after 72 h was observed between the samples with relatively low Ar gas ratios (Ar 0% and Ar 30%) and those with relatively high Ar gas ratios (Ar 90%). This indicates that osteoblast proliferation was promoted as the Ar gas ratio increased. In summary, the effectiveness of Ar gas incorporation in the RF-PCVD process to promote the biological responsiveness of PLC films was demonstrated. Based on our previous study, Ar plasma post-treatment of PLC films promotes surface free energy and fibroblast proliferation through the disruption and surface oxidation of the PLC surface; the increase in the Ar gas ratio during the deposition process may have a similar effect to that of Ar plasma post-treatment [26].
An example of a cell morphology image of an SEM cultured on a PLC sample for 72 h is shown in Figure 5. These SEM images were obtained in the 700–1000× range. The cell morphology after 72 h showed lamellipodia and filopodia in all samples. These pseudopodia appeared to be more developed in the PLC samples than in the control samples. However, no obvious differences in cell morphology were observed between the PLC samples.

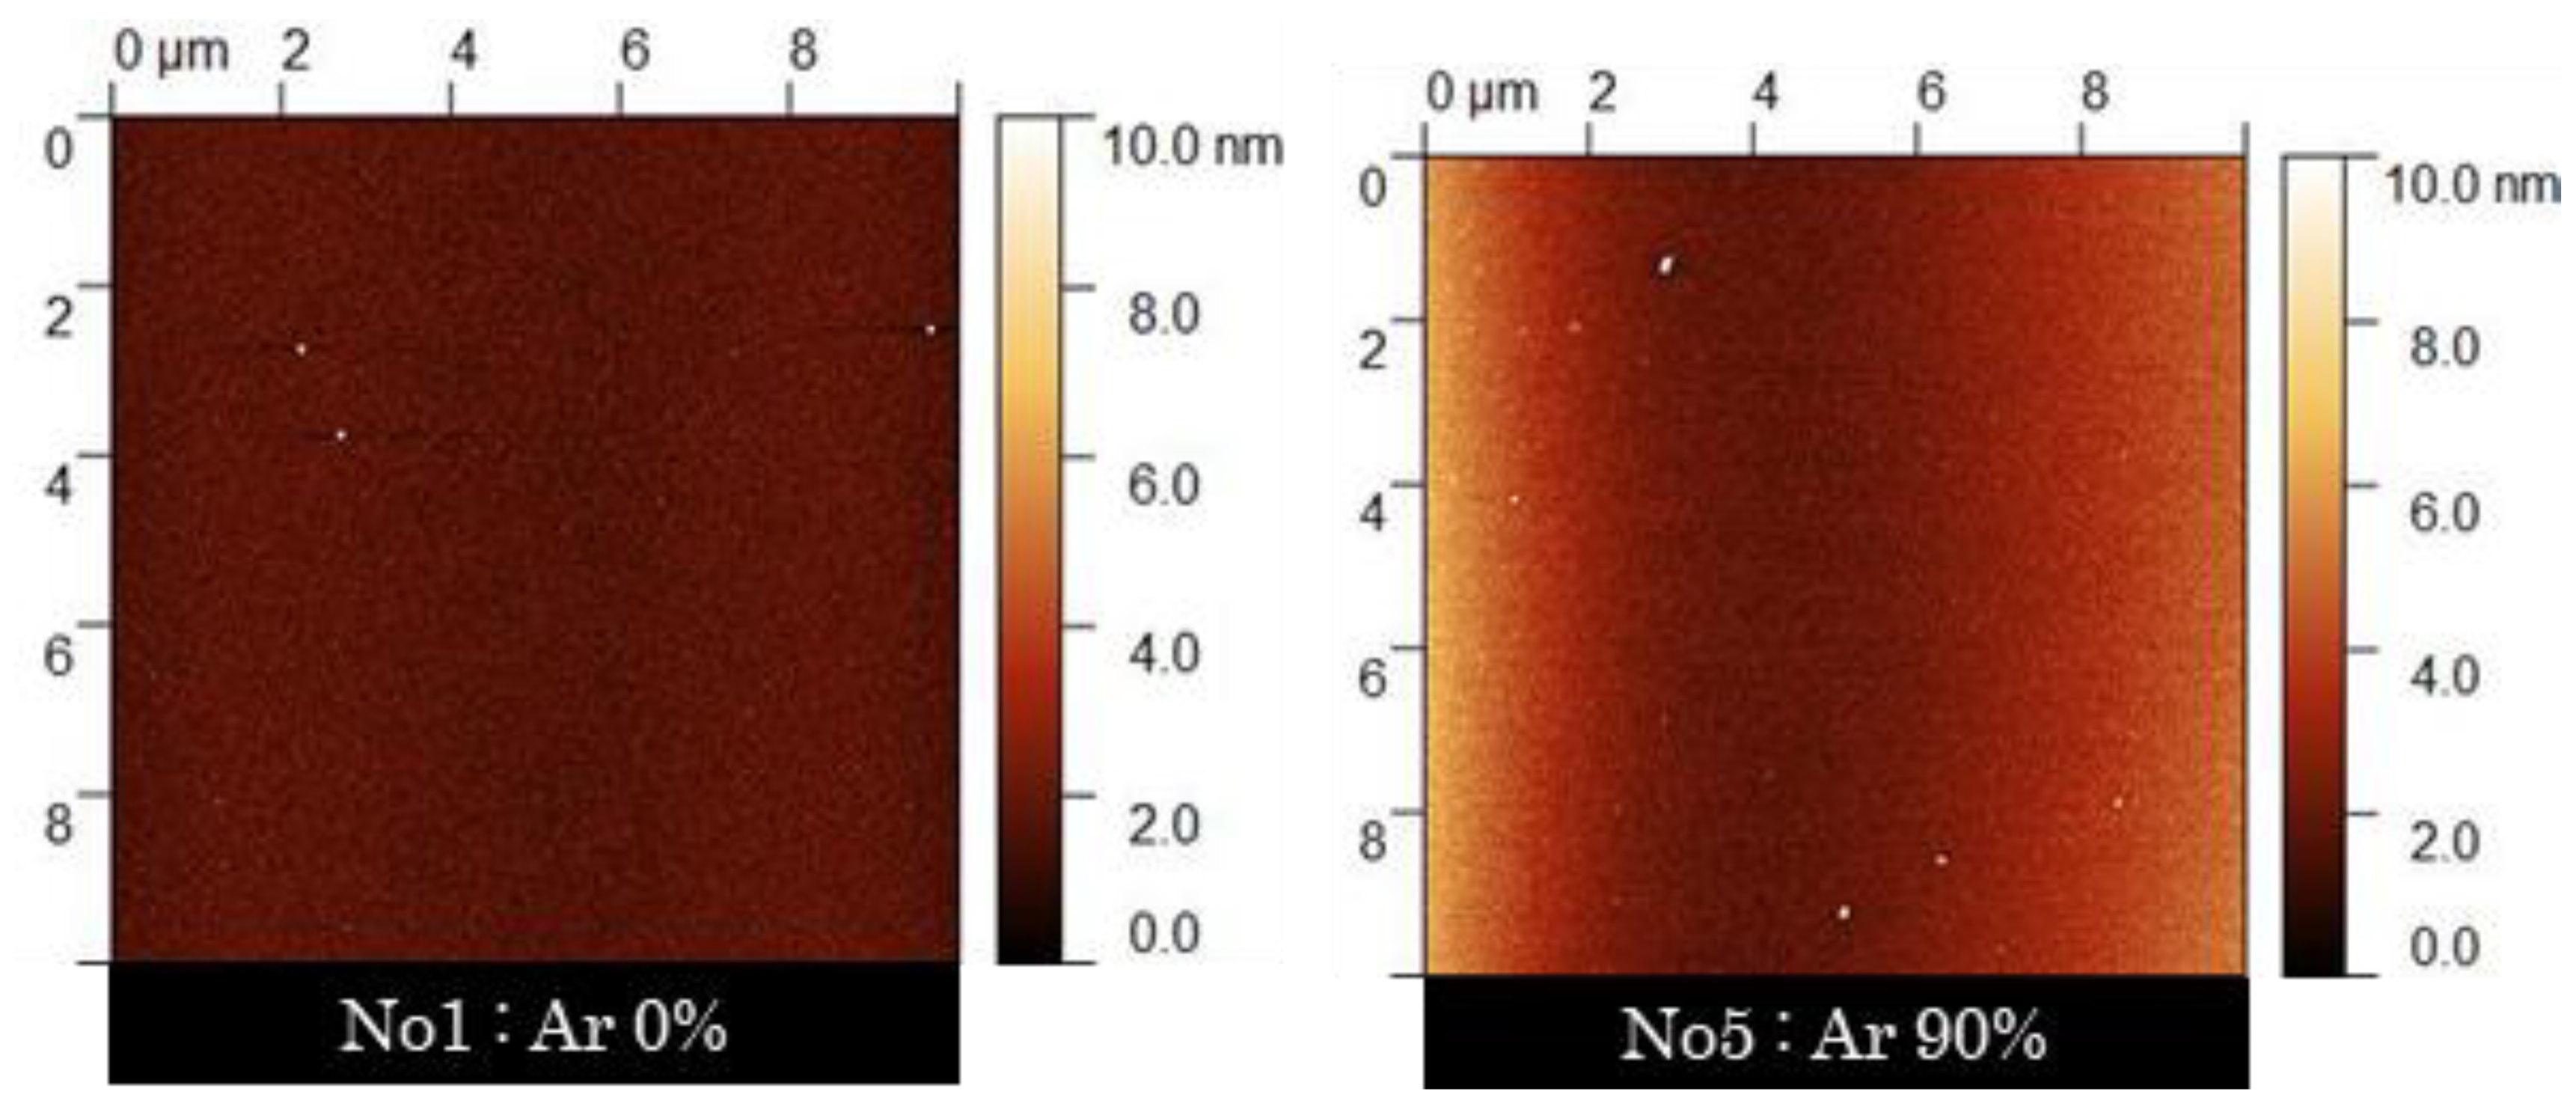
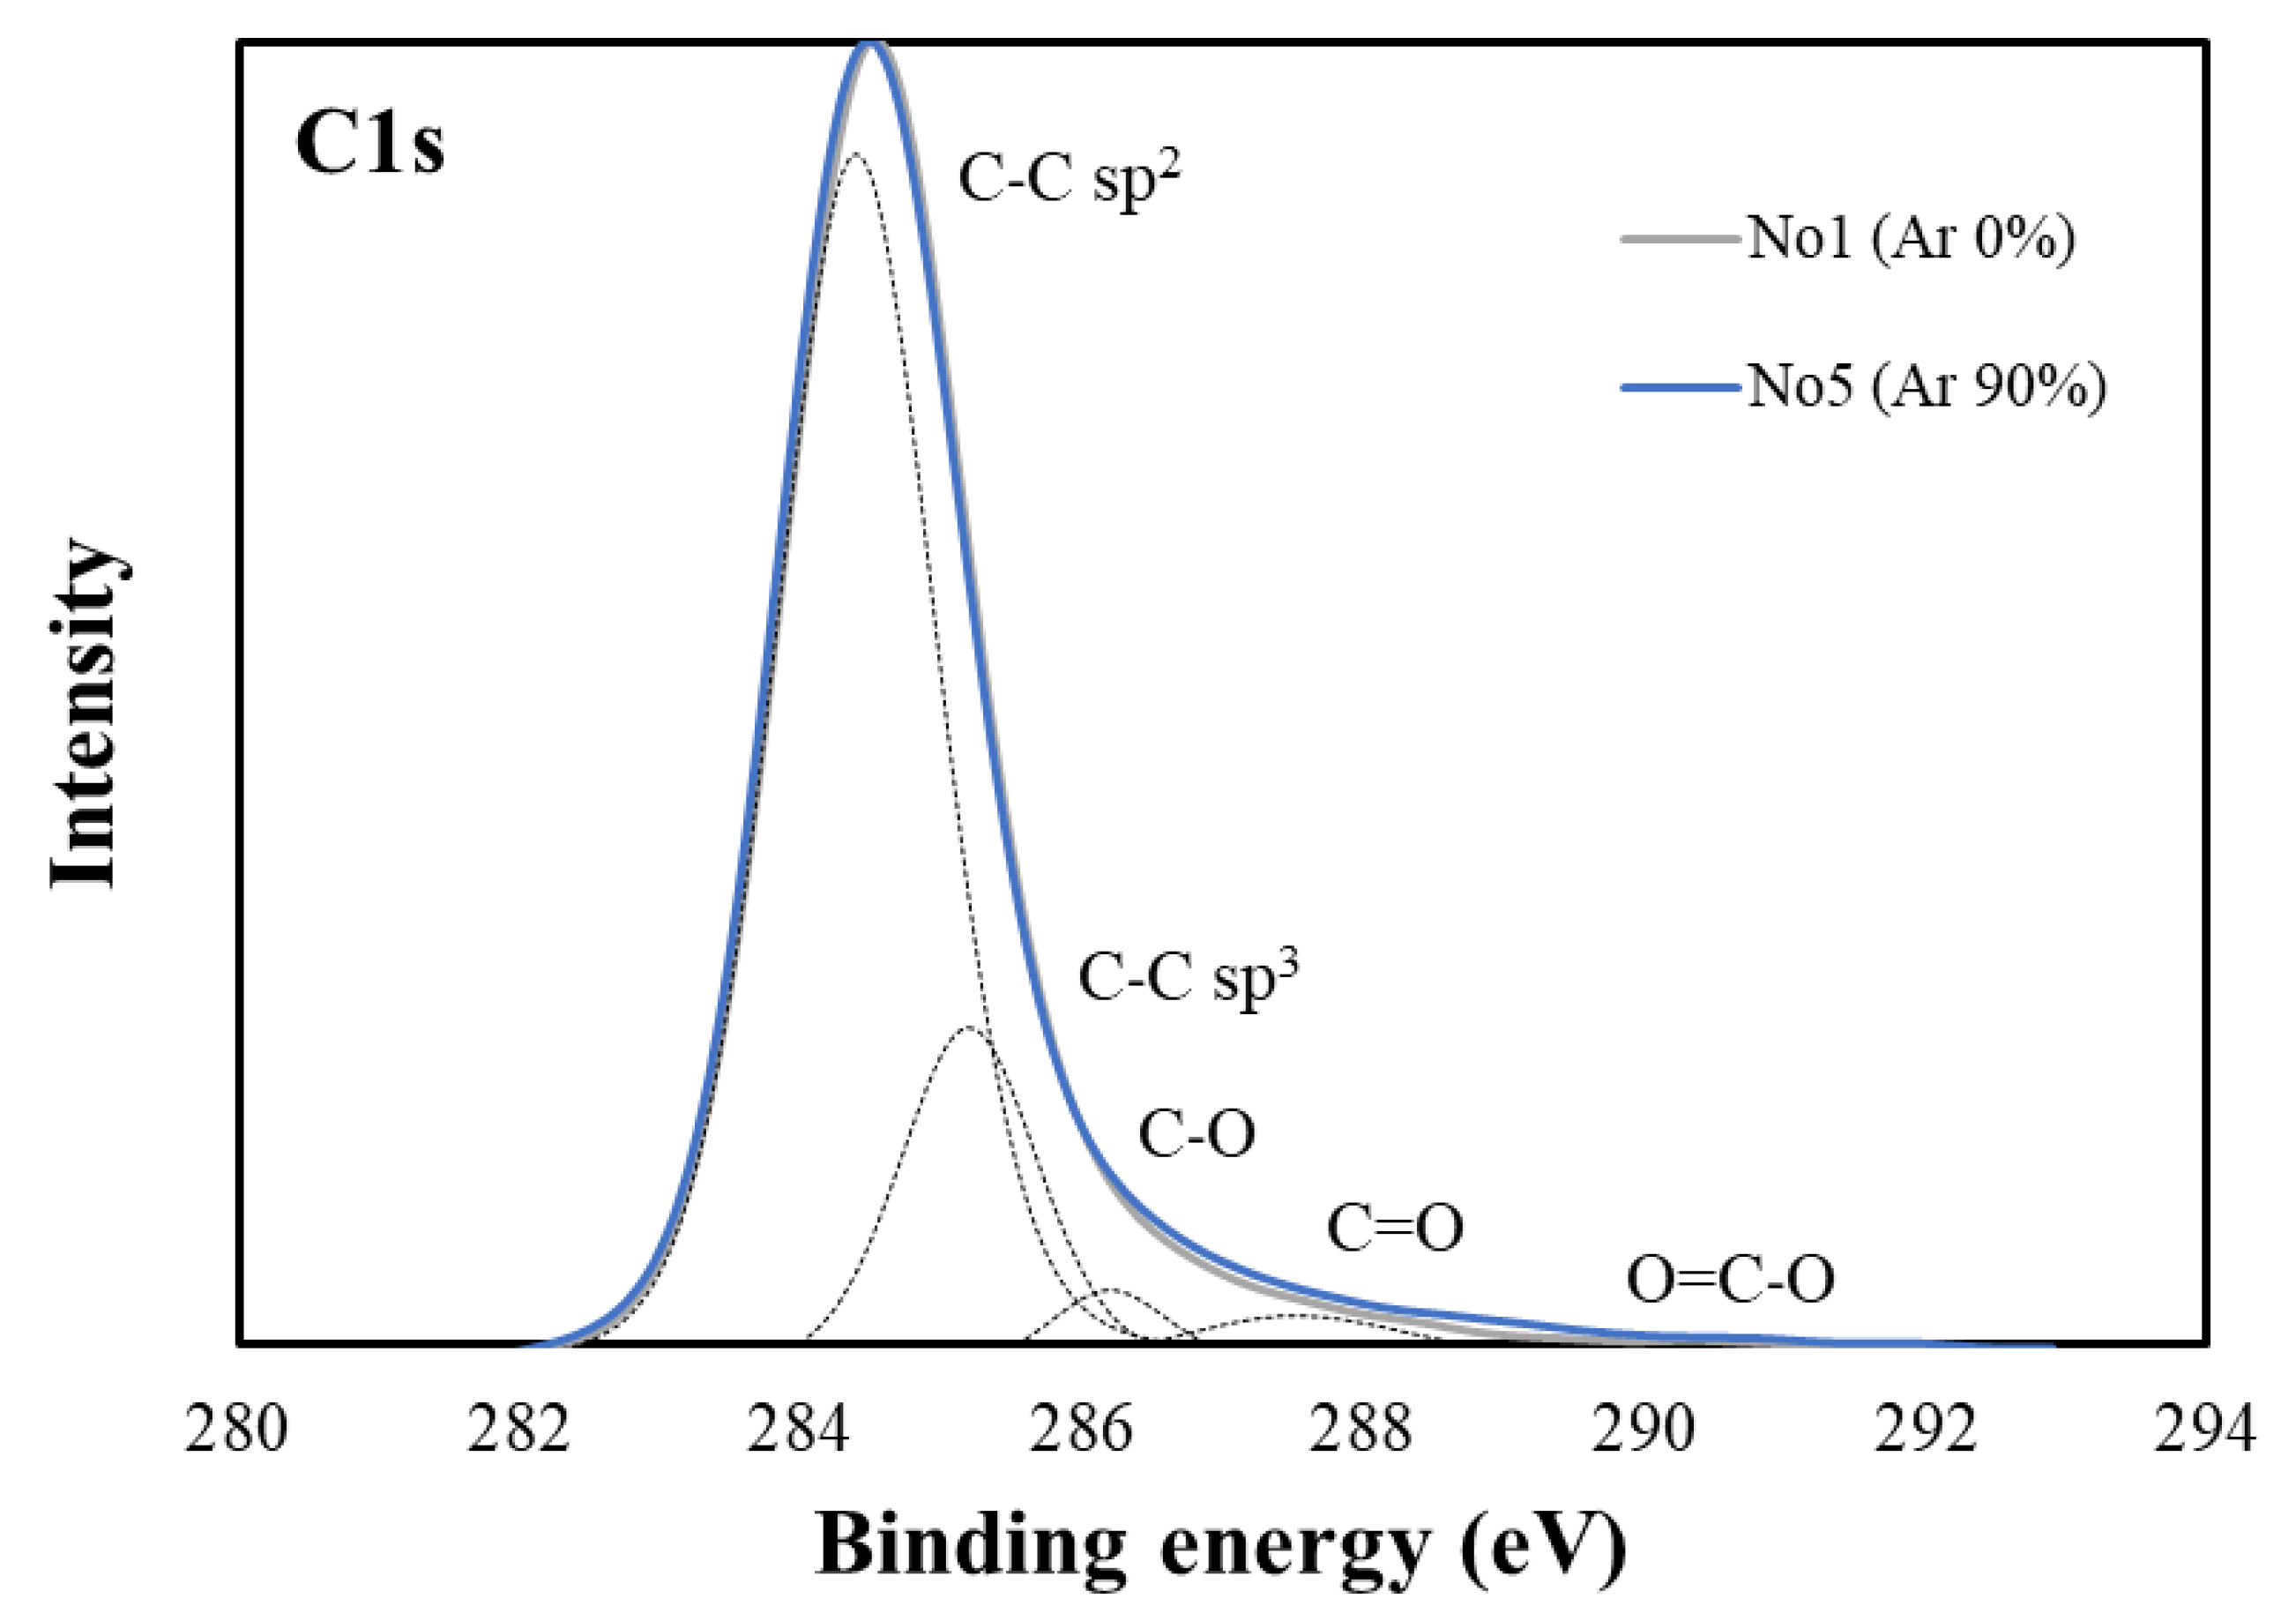
3.4. Change in Surface Properties of the PLC Film with Ar/CH4 Mixed-Gas Ratio

The wettability, surface roughness, and surface composition were evaluated as surface characteristics of each PLC sample. Table 6 lists the wettability, surface free energies, and surface roughness of the PLC films. In Table 6, surface roughness and wettability are shown as the mean ± standard deviation. An example of an AFM image is shown in Figure 6.
The contact angles of the water and methylene iodide for each PLC sample decreased with increasing Ar gas ratio, and the surface free energy increased. This hydrophilicity, associated with an increase in surface free energy, influenced the biological response of the amorphous carbon films [26]. Therefore, the change in wettability with increasing Ar gas ratio may promote osteoblast proliferation in PLC films. The polar component of the surface free energy increases with the introduction of oxygen functional groups on the amorphous carbon surface [27]. Therefore, the higher the ratio of polar/dispersed components, the higher the percentage of oxygen functional groups on the surface of the PLC. However, in this experiment, the increase in the dispersed and polar components with respect to the Ar gas ratio was small and no significant change in their ratio was observed.
The surface roughness of each PLC sample was in the range of a few nanometers as the Ar gas ratio increased. This result is generally consistent with the optical surface roughness and is considered valid. This roughening of the PLC film is assumed to result from the increased ion impact on the PLC surface owing to the increased proportion of Ar gas, as described in previous studies [18]. Furthermore, the increase in the surface area caused by the roughening of the PLC film increased the surface free energy [27,32].
The representative C1s spectra (0% and 90% Ar) and surface composition analysis results for the PLC samples are shown in Figure 7 and Table 7. Consequently, a few oxygen functional groups derived from ether (C-O), ketone (C=O), and carboxyl (O-C=O) groups were found on the surface of the PLC films. The increase in these oxygen functional groups increases the surface free energy and causes hydrophilicity [31,33]. Our previous studies have shown a trend toward surface oxidation in amorphous carbon types with lower hydrogen content and more reactive sp2 bonds [22]. According to Nitta et al., the surface oxidation of amorphous carbon films improved their electrochemical properties and influenced their wettability and biological response [26,28]. However, in the present experiments, no significant change in the C1s spectra of the PLC films with different Ar/CH4 gas mixture ratios was observed, and the respective binding ratios were similar. This result supports the aforementioned polar/dispersive component ratio of the surface free energy. Harigai et al. suggested that amorphous carbon films deposited by RF-PCVD have a surface layer with a different film structure on top of the bulk layers [34]. They mentioned the deposition of active species floating in the vacuum chamber after deposition as a hypothetical factor for the film deposition [34]. Therefore, the insignificant difference in the surface composition between each PLC sample in this experiment may be attributed to the adsorption/accumulation of suspended active species on the PLC surface after deposition in the absence of ion impact. The secondary reaction of the reactive species after deposition is considered to be related to various factors, such as vacuum, substrate temperature, type of source gas, and differences between the single-wafer and consecutive processes. Therefore, further investigations are required.
Based on the results of the aforementioned surface analysis, the hydrophilicity of the PLC film with an increasing Ar/CH4 mixed-gas ratio is inferred to be strongly influenced by the increase in the surface area associated with roughening. In addition, the surface roughness of the nanoscale substrate, which serves as a scaffold for the cells, influences the secretion of adsorbed proteins and the proliferation of osteoblasts [12,35]. Therefore, the enhancement of osteoblast proliferation in the PLC film is considered to be caused by the interaction between hydrophilicity and nanoscale surface roughness. In the surface design of biomaterials at the bio-interface, a combination of submicro-, micro-, and nanostructures is considered an effective method of promoting biological responsiveness [36,37]. However, the surface roughness of PLC films is significantly influenced by the base substrate [38,39]. Therefore, constructing optimal PLC conditions for bio-interfaces by considering the surface roughness and structure of the substrate on which the film is to be deposited is necessary.

4. Conclusions

In this study, five PLC samples with various Ar/CH4 gas mixture ratios were fabricated on Si substrates via RF-PCVD. The relationships between the structure, surface properties, and osteoblast proliferation of these PLC films were investigated. The structure of the PLC films graphitized as the hydrogen content decreased with an increasing Ar gas ratio. The PLC samples with a relatively high Ar gas ratio exhibited greater surface roughness and hydrophilicity than those with a low Ar gas ratio, which promoted osteoblast proliferation.
PLC coatings are expected to be widely applied as a method of surface modification to improve the mechanical properties and biological responses of orthopedic implant devices. However, the influence of the surface structure of the actual biomaterial used in a particular application on the biological characteristics of the PLC films is crucial.

Author Contributions

Conceptualization, K.K.; methodology, K.K. and Y.M.; validation, H.E., Y.M. and K.K.; formal analysis, K.K., H.E. and Y.M.; investigation, K.K. and H.E.; writing—original draft preparation, K.K.; writing—review and editing, A.A., K.K., H.E., Y.M., Y.O. and K.H.; supervision, A.A. and K.H.; project administration, K.H.; funding acquisition, K.H. All authors have read and agreed to the published version of the manuscript.

Funding

This study was partially supported by the Japan Society for the Promotion of Science, Grant-in-Aid for Scientific Research (C), Grant Number 21K04667.

Institutional Review Board Statement

Not applicable.

Informed Consent Statement

Not applicable.

Data Availability Statement

Not applicable.

Acknowledgments

The authors are grateful to HORIBA Ltd. for the measurements of the PLC film optical characteristics using a spectroscopic ellipsometer. The authors would also like to thank Yoko Wasai for his technical assistance with the SE measurements. The authors acknowledge the assistance provided by the National Institute for Materials Science in measuring the surface roughness of the PLC films via atomic force microscopy. Finally, the authors express their gratitude to Takuya Iwasaki for providing technical assistance with the AFM measurements.

Conflicts of Interest

The authors declare no conflict of interest.

References

  1. Vishwakarma, V.; Kaliaraj, G.S.; Amirtharaj Mosas, K.K.A. Multifunctional Coatings on Implant Materials—A Systematic Review of the Current Scenario. Coatings 2022, 13, 69. [Google Scholar] [CrossRef]
  2. Filip, N.; Radu, I.; Veliceasa, B.; Filip, C.; Pertea, M.; Clim, A.; Pinzariu, A.C.; Drochioi, I.C.; Hilitanu, R.L.; Serban, I.L. Biomaterials in Orthopedic Devices: Current Issues and Future Perspectives. Coatings 2022, 12, 1544. [Google Scholar] [CrossRef]
  3. Abdudeen, A.; Abu Qudeiri, J.E.; Kareem, A.; Valappil, A.K. Latest Developments and Insights of Orthopedic Implants in Biomaterials Using Additive Manufacturing Technologies. J. Manuf. Mater. Process. 2022, 6, 162. [Google Scholar] [CrossRef]
  4. Peng, Y.; Peng, J.; Wang, Z.; Xiao, Y.; Qiu, X. Diamond-like Carbon Coatings in the Biomedical Field: Properties, Applications and Future Development. Coatings 2022, 12, 1088. [Google Scholar] [CrossRef]
  5. Roy, R.K.; Lee, K.-R. Biomedical applications of diamond-like carbon coatings: A review. J. Biomed. Mater. Res. Part B Appl. Biomater. 2007, 83, 72–84. [Google Scholar] [CrossRef]
  6. Ohtake, N.; Hiratsuka, M.; Kanda, K.; Akasaka, H.; Tsujioka, M.; Hirakuri, K.; Hirata, A.; Ohana, T.; Inaba, H.; Kano, M.; et al. Properties and Classification of Diamond-Like Carbon Films. Materials 2021, 14, 315. [Google Scholar] [CrossRef]
  7. ISO 23216:2021; Carbon-Based Films—Determination of Optical Properties of Amorphous Carbon Films by Spectroscopic Ellipsometry. ISO: Geneva, Switzerland, 2021. Available online: https://www.iso.org/standard/74875.html (accessed on 22 August 2022).
  8. Tsubone, D.; Hasebe, T.; Kamijo, A.; Hotta, A. Fracture mechanics of diamond-like carbon (DLC) films coated on flexible polymer substrates. Surf. Coat. Technol. 2007, 201, 6423–6430. [Google Scholar] [CrossRef]
  9. Shirakura, A.; Nakaya, M.; Koga, Y.; Kodama, H.; Hasebe, T.; Suzuki, T. Diamond-like carbon films for PET bottles and medical applications. Thin Solid Films 2006, 494, 84–91. [Google Scholar] [CrossRef]
  10. Matsuo, H.; Kanasugi, K.; Ohgoe, Y.; Hirakuri, K.K.; Fukui, Y. Biocompatibility of a-C:H film coating for synthetic vascular graft. Diam. Relat. Mater. 2009, 18, 1031–1034. [Google Scholar] [CrossRef]
  11. As, A. Medical Application of Diamond-Like Carbon (DLC) Coating-A Review. J. Clin. Med Images 2021, 05. [Google Scholar] [CrossRef]
  12. Kanasugi, K.; Eguchi, H.; Ohgoe, Y.; Manome, Y.; Alanazi, A.; Hirakuri, K. Correlation of Cell Proliferation with Surface Properties of Polymer-like Carbon Films of Different Thicknesses Prepared by a Radio-Frequency Plasma CVD Process. Materials 2022, 15, 4466. [Google Scholar] [CrossRef] [PubMed]
  13. Kim, Y.T.; Cho, S.M.; Choi, W.S.; Hong, B.; Yoon, D.H. Dependence of the bonding structure of DLC thin films on the deposition conditions of PECVD method. Surf. Coat. Technol. 2003, 169-170, 291–294. [Google Scholar] [CrossRef]
  14. Caschera, D.; Cossari, P.; Federici, F.; Kaciulis, S.; Mezzi, A.; Padeletti, G.; Trucchi, D.M. Influence of PECVD parameters on the properties of diamond-like carbon films. Thin Solid Films 2011, 519, 4087–4091. [Google Scholar] [CrossRef]
  15. Varade, A.; Reddy, K.N.; Sasen, D.; Krishna, A.; Chellamalai, M.; Shashikumar, P. Detailed Raman Study of DLC Coating on Si (100) Made by RF-PECVD. Procedia Eng. 2014, 97, 1452–1456. [Google Scholar] [CrossRef]
  16. Kim, J.S.; Lee, D.Y.; Bae, I.H.; Kim, G.-H.; Kang, S.-K.; Ban, S.I.; Lee, J.I.; Kim, J.S.; Lee, S.-H.; Choi, H.K.; et al. Growth of Room-Temperature 1.32-mum-Emitting InAs Quantum Dots Using GaAs/InAs Quasi-Monolayers. J. Korean Phys. Soc. 2003, 42, 237. [Google Scholar] [CrossRef]
  17. Samadi, M.; Eshaghi, A.; Bakhshi, S.R.; Aghaei, A.A. The influence of gas flow rate on the structural, mechanical, optical and wettability of diamond-like carbon thin films. Opt. Quantum Electron. 2018, 50, 193. [Google Scholar] [CrossRef]
  18. Toro, R.; Calandra, P.; Cortese, B.; de Caro, T.; Brucale, M.; Mezzi, A.; Federici, F.; Caschera, D. Argon and hydrogen plasma influence on the protective properties of diamond-like carbon films as barrier coating. Surf. Interfaces 2017, 6, 60–71. [Google Scholar] [CrossRef]
  19. Liao, T.T.; Zhang, T.F.; Li, S.S.; Deng, Q.Y.; Wu, B.J.; Zhang, Y.Z.; Zhou, Y.J.; Guo, Y.B.; Leng, Y.X.; Huang, N. Biological responses of diamond-like carbon (DLC) films with different structures in biomedical application. Mater. Sci. Eng. C Mater. Biol. Appl. 2016, 69, 751–759. [Google Scholar] [CrossRef]
  20. Manome, Y.; Tachibana, T.; Hiratsuka, M.; Sato, K.; Ohgoe, Y.; Hirakuri, K. Osteoblastic MC3T3-E1 cells on diamond-like carbon-coated silicon plates: Field emission scanning electron microscopy data. Data Brief 2021, 38, 107385. [Google Scholar] [CrossRef]
  21. Fernández-Lizárraga, M.; García-López, J.; Rodil, S.E.; Ribas-Aparicio, R.M.; Silva-Bermudez, P. Evaluation of the Biocompatibility and Osteogenic Properties of Metal Oxide Coatings Applied by Magnetron Sputtering as Potential Biofunctional Surface Modifications for Orthopedic Implants. Materials 2022, 15, 5240. [Google Scholar] [CrossRef]
  22. Kanasugi, K.; Arimura, K.; Alanazi, A.; Ohgoe, Y.; Manome, Y.; Hiratsuka, M.; Hirakuri, K. UV Sterilization Effects and Osteoblast Proliferation on Amorphous Carbon Films Classified Based on Optical Constants. Bioengineering 2022, 9, 505. [Google Scholar] [CrossRef] [PubMed]
  23. Kanasugi, K.; Ohgoe, Y.; Hiratsuka, M.; Nakamori, H.; Homma, A.; Hirakuri, K. Classification of DLC films for cell proliferation based on optical constants. Diam. Relat. Mater. 2021, 113, 108266. [Google Scholar] [CrossRef]
  24. Robertson, J. Diamond-like amorphous carbon. Mater. Sci. Eng. R Rep. 2002, 37, 129–281. [Google Scholar] [CrossRef]
  25. Hardjawinata, K.; Setiawati, R.; Dewi, W. Bactericidal Efficacy of Ultraviolet Irradiation on Staphylococcus aureus. Asian J. Oral Maxillofac. Surg. 2005, 17, 157–161. [Google Scholar] [CrossRef]
  26. Kanasugi, K.; Ohgoe, Y.; Hirakuri, K.K.; Fukui, Y. Cytocompatibility of modified a-C:H film deposited on complicated polymeric medical apparatus. J. Appl. Phys. 2009, 105, 094702. [Google Scholar] [CrossRef]
  27. Marciano, F.R.; Marcuzzo, J.S.; Bonetti, L.F.; Corat, E.J.; Trava-Airoldi, V.J. Use of near atmospheric pressure and low pressure techniques to modification DLC film surface. Surf. Coat. Technol. 2009, 204, 64–68. [Google Scholar] [CrossRef]
  28. Nitta, Y.; Okamoto, K.; Nakatani, T.; Hoshi, H.; Homma, A.; Tatsumi, E.; Taenaka, Y. Diamond-like carbon thin film with controlled zeta potential for medical material application. Diam. Relat. Mater. 2008, 17, 1972–1976. [Google Scholar] [CrossRef]
  29. Lu, Y.; Wang, S.; Huang, G.; Xi, L.; Qin, G.; Zhu, M.; Chu, H. Fabrication and applications of the optical diamond-like carbon films: A review. J. Mater. Sci. 2022, 57, 3971–3992. [Google Scholar] [CrossRef]
  30. Hiratsuka, M.; Nakamori, H.; Kogo, Y.; Sakurai, M.; Ohtake, N.; Saitoh, H. Correlation between Optical Properties and Hardness of Diamond-Like Carbon Films. J. Solid Mech. Mater. Eng. 2013, 7, 187–198. [Google Scholar] [CrossRef]
  31. Safaie, P.; Eshaghi, A.; Bakhshi, S.R. Oxygen doping effect on the wettability of diamond-like carbon thin films. J. Non-Cryst. Solids 2017, 471, 410–414. [Google Scholar] [CrossRef]
  32. Ohgoe, Y.; Hirakuri, K.K.; Saitoh, H.; Nakahigashi, T.; Ohtake, N.; Hirata, A.; Kanda, K.; Hiratsuka, M.; Fukui, Y. Classification of DLC films in terms of biological response. Surf. Coat. Technol. 2012, 207, 350–354. [Google Scholar] [CrossRef]
  33. Bachmann, S.; Schulze, M.; Morasch, J.; Hesse, S.; Hussein, L.; Krell, L.; Schnagl, J.; Stark, R.W.; Narayan, S. Aging of oxygen and hydrogen plasma discharge treated a-C:H and ta-C coatings. Appl. Surf. Sci. 2016, 371, 613–623. [Google Scholar] [CrossRef]
  34. Harigai, T.; Yasuoka, Y.; Nitta, N.; Furuta, H.; Hatta, A. X-ray reflectivity analysis on initial stage of diamond-like carbon film deposition on Si substrate by RF plasma CVD and on removal of the sub-surface layer by oxygen plasma etching. Diam. Relat. Mater. 2013, 38, 36–40. [Google Scholar] [CrossRef]
  35. Washburn, N.R.; Yamada, K.M.; Simon, C.G., Jr.; Kennedy, S.B.; Amis, E.J. High-throughput investigation of osteoblast response to polymer crystallinity: Influence of nanometer-scale roughness on proliferation. Biomaterials 2004, 25, 1215–1224. [Google Scholar] [CrossRef] [PubMed]
  36. Wang, G.; Wan, Y.; Ren, B.; Liu, Z. Fabrication of an orderly micro/nanostructure on titanium surface and its effect on cell proliferation. Mater. Lett. 2018, 212, 247–250. [Google Scholar] [CrossRef]
  37. Gittens, R.A.; McLachlan, T.; Olivares-Navarrete, R.; Cai, Y.; Berner, S.; Tannenbaum, R.; Schwartz, Z.; Sandhage, K.H.; Boyan, B.D. The effects of combined micron-/submicron-scale surface roughness and nanoscale features on cell proliferation and differentiation. Biomaterials 2011, 32, 3395–3403. [Google Scholar] [CrossRef]
  38. Zhong, M.; Zhang, C.; Luo, J. Effect of substrate morphology on the roughness evolution of ultra thin DLC films. Appl. Surf. Sci. 2008, 254, 6742–6748. [Google Scholar] [CrossRef]
  39. Al-Azizi, A.A.; Eryilmaz, O.; Erdemir, A.; Kim, S.H. Nano-texture for a wear-resistant and near-frictionless diamond-like carbon. Carbon 2014, 73, 403–412. [Google Scholar] [CrossRef]
Figure 1. Virtual thin-film multilayer model in SE analysis.
Coatings 13 00983 g001
Figure 2. n-k plots of the PLC films prepared with different Ar/CH4 gas ratios.
Coatings 13 00983 g002
Figure 3. Raman spectra of the PLC films prepared with different Ar/CH4 gas mixture ratios. (The G-band and D-band in the figure are the results of No. 1.).
Coatings 13 00983 g003
Figure 4. Osteoblast proliferation of the PLC film with Ar/CH4 mixed-gas ratios. The letters on the bars in the figure (Si and sample no.) are statistically significant (p < 0.05). (a) After 24 h; (b) After 72 h.
Coatings 13 00983 g004
Figure 5. Example of cell morphology image after 72 h; imaged using SEM. ‘control (Si substrate’ represents the image of an Si substrate with no PLC film deposition, ‘No. 1: Ar 0%’ represents the image of a PLC sample without Ar gas (Ar 0%), and ‘No. 5: Ar 90%’ represents the image of a PLC sample with Ar gas (Ar 90%).
Coatings 13 00983 g005
Figure 6. Example of an AFM image of the PLC sample. ‘No. 1: Ar 0%’ represents the image of a PLC sample without Ar gas (Ar 0%), and ‘No. 5: Ar 90%’ represents the image of a PLC sample with Ar gas (Ar 90%).
Coatings 13 00983 g006
Figure 7. Example of a C1s spectrum of the PLC sample.
Coatings 13 00983 g007
Table 1. Deposition conditions for the PLC film.
Sample No.Deposition MethodPower (W)Source GasGas Pressure (Pa)
CH4 (sccm)Ar (sccm)Ar Gas Ratio (%)
113.56 MHz
RF-PCVD
2001000050
2703030
3505050
4307070
5109090
Table 2. Cell culture conditions.
CellOsteoblast (MC-3T3)
Seeding density1.0 × 104 cells/cm2
MediumMEM-α
CO2 concentration5.0%
Temperature37.0 °C
Incubation time24 h, 72 h
pH6.8–7.2
Table 3. Optical constants, thickness, and optical surface roughness of the PLC films obtained using SE analysis.
Sample No.Ar Gas Ratio (%)χ21 Layer2 Layer
Film Thickness (nm)nkOptical Surface Roughness (nm)
λ = 550 nm
102.47192.5 ± 0.21.7960.0200.7 ± 0.3
2302.17190.0 ± 0.21.7960.0190.8 ± 0.3
3501.98259.6 ± 0.31.8850.0541.3 ± 0.3
4701.81251.2 ± 0.31.9410.0792.1 ± 0.3
5901.85238.8 ± 0.42.0180.1352.2 ± 0.3
Table 4. Structural change in the PLC film with the Ar/CH4 mixed-gas ratio.
Sample No.Ar Gas Ratio (%)D-Peak Position (cm−1)G-Peak Position (cm−1)ID/IG Intensity Ratio
101306 ± 2.31519 ± 0.40.35
2301322 ± 5.31520 ± 0.30.37
3501331 ± 2.81520 ± 0.20.45
4701323 ± 1.41524 ± 0.20.41
5901355 ± 1.81538 ± 0.10.49
Table 5. Osteoblast proliferation of the PLC film with Ar/CH4 mixed-gas ratios.
Sample No.Ar Gas Ratio (%)24 h Cell Culture72 h Cell Culture
Initial Cell Adhesionp < 0.05Osteoblast Proliferationp < 0.05
1025,351 ± 4399Si,346,075 ± 10,781Si,5
23023,274 ± 7091Si,350,266 ± 4236Si,5
35015,317 ± 41631,2,4,559,585 ± 26,347Si
47024,081 ± 5454Si,357,486 ± 23,450Si
59023,370 ± 3012Si,365,307 ± 24,052Si,1,2
Si substrate (Control)-18,750 ± 22411,2,4,528,546 ± 28631–5
Table 6. Surface properties of the PLC film with Ar/CH4 mixed-gas ratios.
Sample No.Ar Gas Ratio (%)Contact Angle (°)Surface Free Energy (mJ/m2)Surface Roughness (nm) (n = 3)
Pure Water
(n = 10)
Methylene Iodide (n = 10)DispersivePolarTotal
1079.5 ± 2.237.3 ± 2.1384420.95 ± 0.36
23077.7 ± 1.537.8 ± 1.2375421.19 ± 0.15
35076.0 ± 0.837.3 ± 1.6376431.38 ± 0.10
47074.9 ± 1.134.4 ± 3.2397441.43 ± 0.09
59070.2 ± 1.531.6 ± 1.0398461.61 ± 0.63
Table 7. Surface composition of the PLC films with the Ar/CH4 mixed-gas ratios.
Sample No.Ar Gas Ratio (%)Compositional Bond Ratio of C1s Peaks
C-Csp2C-Csp3C-OC=OO=C-O
100.740.180.030.040.01
2300.760.200.020.030.00
3500.780.140.040.030.01
4700.810.110.050.030.01
5900.810.120.040.030.00
Disclaimer/Publisher’s Note: The statements, opinions and data contained in all publications are solely those of the individual author(s) and contributor(s) and not of MDPI and/or the editor(s). MDPI and/or the editor(s) disclaim responsibility for any injury to people or property resulting from any ideas, methods, instructions or products referred to in the content.

