Article

Laser–Direct Current arc Hybrid Additive Manufacturing of Cu-Cr-Zr Alloy: Microstructure Evaluation and Mechanical Properties

1
State Key Laboratory of High-Performance Precision Manufacturing, Dalian University of Technology, Dalian 116024, China
2
Qiqihar Heping Heavy Industries Group Co., Ltd., Qiqihar 161002, China
*
Author to whom correspondence should be addressed.
These authors contributed equally to this work.
Coatings 2023, 13(7), 1228; https://doi.org/10.3390/coatings13071228
Submission received: 24 May 2023 / Revised: 7 July 2023 / Accepted: 7 July 2023 / Published: 9 July 2023

Abstract

:
Recently, there has been a growing requirement for rapid and cost-effective additive manufacturing solutions for copper alloys with favorable mechanical properties. In this research, laser–direct current arc hybrid additive manufacturing (LAHAM) was employed to fabricate Cu-Cr-Zr alloy. By way of multi-scale characterization including SEM, EBSD and TEM, the effect of scanning speed on the microstructure was systematically investigated in detail. Moreover, an evaluation of mechanical properties was carried out. The results indicated that columnar grains grew across layers with the growth direction tending to the center of the molten pool. When the scanning speed increased from 250 mm/min to 350 mm/min, the proportion of high-angle grain boundaries exceeded 69% and reached a maximum of 79% at 300 mm/min. A large amount of Cr phase was precipitated from the Cu matrix. Both submicron and nanoscale Cr precipitates were observed. Statistically, the area proportion of Cr precipitates was up to 26.3% at 300 mm/min. The changes of heat input and remelting effects were the main reasons for the change in the precipitate level. As a result, the mechanical properties of the Cu-Cr-Zr alloy were enhanced via precipitation strengthening. When the scanning speed was 250 mm/min, the Cu-Cr-Zr alloy sample exhibited an ultimate tensile strength of 311.3 ± 7.8 MPa with an elongation of 38.6 ± 5.6%.

1. Introduction

As a typical precipitation-strengthened alloy, Cu-Cr-Zr alloy has excellent electrical conductivity and high strength, and it is widely used in integrated circuit lead frames, high-speed rail contact wires, nuclear reactor components and aerospace heat transfer components [1,2,3,4]. The traditional manufacturing processes of Cu-Cr-Zr alloy are mainly casting and plastic deformation [5]. However, traditional processes have long machining cycles and it is difficult to form complex structural parts. As an emerging technology, additive manufacturing (AM) technology can fabricate components layer by layer. Compared with traditional methods, it has a number of advantages, such as high design freedom, simple work procedure and high production flexibility [6,7,8,9].
At present, the research on AM of the Cu-Cr-Zr alloy mainly focuses on laser powder bed fusion (L-PBF), a method that allows the convenient preparation of complex structure parts by presetting the laser path. Popovich et al. [10] prepared Cu-Cr-Zr-Ti samples that had a density of 97.9%. Unfortunately, the ultimate tensile strength was in the range of 195–211 MPa. The Cu-Cr-Zr alloy has low laser absorption and high thermal conductivity in the L-PBF process, making it difficult to obtain samples with high density and excellent properties, as suggested by Kuai et al. [11]. And there are defects relating to, for example, balling phenomena, spatter particles and pores [12,13]. Many scholars have made an attempt to suppress these defects. Zhang et al. [14] used a laser with power of up to 2000 W for the additive manufacturing of Cu-Cr components. But the laser device is expensive and has a short running life. Some scholars tried to improve the laser absorption of Cu alloy powders through surface modification [15,16,17]. But the complex process limits the development of this method. Therefore, increasing the laser power and modifying the powder surface are not good ideas to solve the problem of low laser absorption and fast heat dissipation in the additive manufacturing of Cu-Cr-Zr alloy.
Wire + arc additive manufacturing (WAAM) is attractive for manufacturing large near net shape structures because of its high deposition rate, high raw material utilization and low cost. Baby et al. [18] applied a pulsed arc to prepare copper alloy, but obtained unfavorable samples with columnar grains. Deshmukh et al. [19] reported the feasibility of depositing pure copper via the WAAM process. However, the ultimate tensile strength was merely 227 MPa. It can be summarized that the high heat input of the arc source easily causes coarse grain and leads to poorer mechanical properties than expected. Hence, a more reliable AM process is required to build copper alloy components with superior performance.
Laser–arc hybrid additive manufacturing (LAHAM) is an efficient method combining a high-energy laser and a strongly adaptable arc [20,21,22,23]. With the help of plasma interaction, the laser–arc hybrid can stabilize the arc and increase the laser energy absorption. Moreover, deep keyholes formed by the laser can refine the grains. Miao et al. [20] fabricated 4043 Al-Si alloy samples by LAHAM and WAAM. They found that there were laser zones with finer grains and reduced Si segregation after the input of laser energy. Liu et al. [21] manufactured Al-Cu alloy specimens by LAHAM and discovered that Cu was distributed homogenously, making a positive contribution to the strength of the specimens. Gong et al. [24] fabricated 316 L stainless steel by LAHAM and revealed the effect of laser power on the molten pool mode. It can be concluded that the LAHAM process has the potential to manufacture excellent components, which can reduce defects and refine grains. However, few studies have explored using LAHAM for Cu-Cr-Zr alloy. Furthermore, studies of the process parameters for good forming Cu-Cr-Zr alloy are still lacking.
In this paper, Cu-Cr-Zr alloy with a high strength was successfully fabricated via a laser–direct current arc hybrid. The influence of scanning speed was studied to reveal the correlations between the microstructure and mechanical properties of the Cu-Cr-Zr alloy samples. The microstructural evolution is investigated in terms of grain morphology, texture, element distribution and nano-precipitates by a multi-scale characterization method. This work is expected to propose a novel approach for improving the mechanical properties of Cu-Cr-Zr alloys.

2. Material and Methods

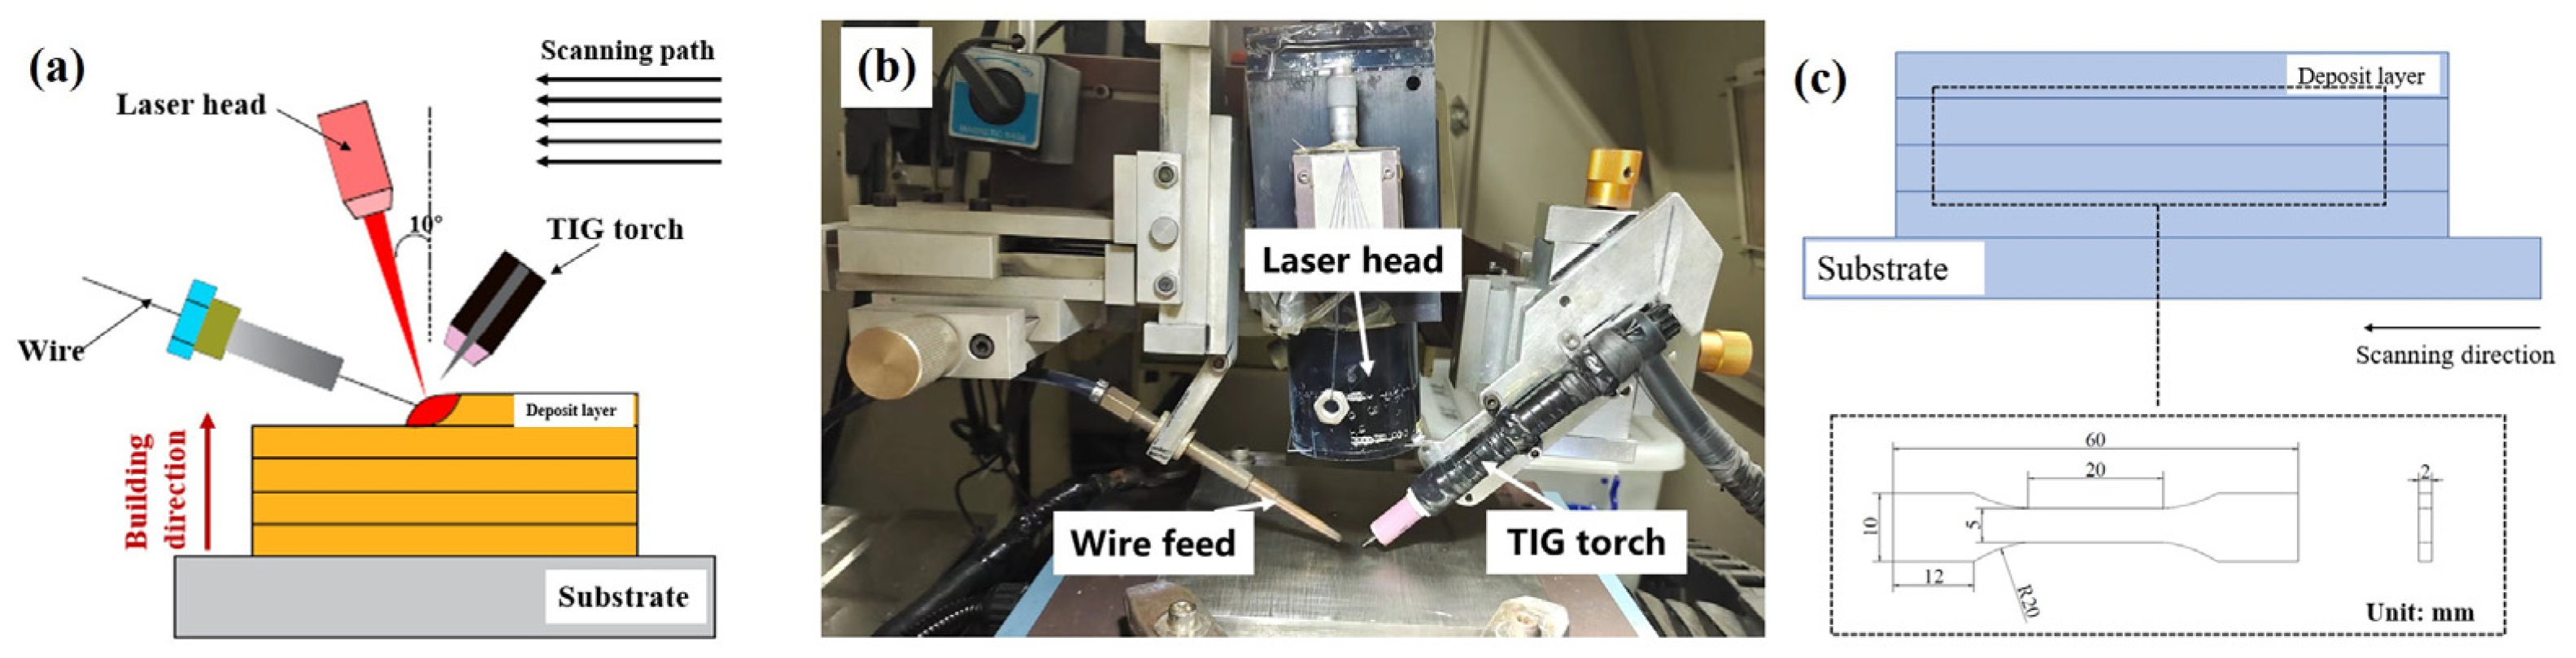
2.1. Experimental Materials and Equipment

The diameter of the Cu-Cr-Zr alloy wire was 1.0 mm in this experiment. The specific chemical composition of the welding wire was Cu-0.95Cr-0.08Zr. The 316 L stainless steel substrate was used as the deposition substrate with dimensions of 200 mm × 200 mm × 17 mm. Before deposition, the oxide layer and impurities on the substrate surface were removed via anhydrous ethanol. Figure 1a shows the schematic diagram of the experimental system and Figure 1b shows the real image of the experimental setup. The LAHAM system was mainly composed of a Nd: YAG pulsed laser source (GSI LUMONICS), a tungsten inert gas (TIG) welding power supply (Miller) and an automatic wire feeder. The unidirectional scanning path was adopted with the TIG torch following the laser head. To prevent laser reflection damaging the optics, the laser head was tilted at an angle of 10°.
An intelligent metallographic microscope (Zeiss, Axioscope 5, Jena, Germany) was used to observe the macrostructure. Microstructure analyses were observed via a scanning electron microscope (SEM, SU5000, Tokyo, Japan). The sample with a size of 7 mm × 5 mm × 3 mm was tested by an electronic backscattering diffraction analyzer (EBSD, Oxford Instrument, Oxford, UK). The main phase composition of the Cu-Cr-Zr alloy samples was characterized by an Empyrean X-ray diffractometer (XRD, Brkr, Beijing, China). The scanning diffraction angle was 10–100° and the scanning step interval was 0.02°. The transmission electron microscope (TEM, Tokyo, Japan) samples were prepared by a double focused ion beam (FIB, Helios G4 UX, Fisher Scientific, Waltham, MA, USA). For the TEM observations, a microscope (JEOL JEM-200, Tokyo, Japan) was used for bright-filed (BF-TEM), high resolution transmission electron microscope (HRTEM, Tokyo, Japan) and scanning transmission electron microscope (STEM, Tokyo, Japan) at an accelerating voltage of 200 kV.
Figure 1c shows the dimensions of the tensile specimen according to ISO standard 6892-1. Tensile tests were performed on an electronic universal testing machine (WDW-20E, Jinan, China) with a loading rate of 2 mm/min at room temperature. The final tensile strength was the average of three tensile tests. The value of the elastic module was determined by the slope of the elastic deformation stage of the tensile curves. The fracture morphology was observed by SEM.

2.2. Experimental Procedure

According to our previous research [20,21,22,23,25,26], the laser power was selected to be 150 W, the pulse frequency was 20 Hz and the pulse width was 3 ms. Considering the heat dissipation performance of copper alloys, the heat input was increased layer by layer. The arc current was 120 A at the first layer and was then increased 10 A every two layers until it reached 140 A [25]. When the scanning speed is 250~350 mm/min, the specimen has better surface quality. In order to ensure the stability of the process, the preheating temperature was fixed at 200 °C. The direct current arc was used to avoid melting the tungsten pins and increasing the temperature of the deposited layers. The heat input equation for the laser–arc hybrid additive manufacturing can be expressed as follows [27]:
Q = U I η T + P L η L ν
where U and I are the arc voltage and current, respectively, PL is the average power of the pulsed laser, ηT = 0.80, ηL = 0.50 is the efficiency of the arc and laser, and ν is the scanning speed. In this experiment, the heat input was varied by adjusting the scanning speed. The arc voltage, arc current and laser power were kept constant. The specific process parameters of the single factor experiment are shown in Table 1.

3. Results

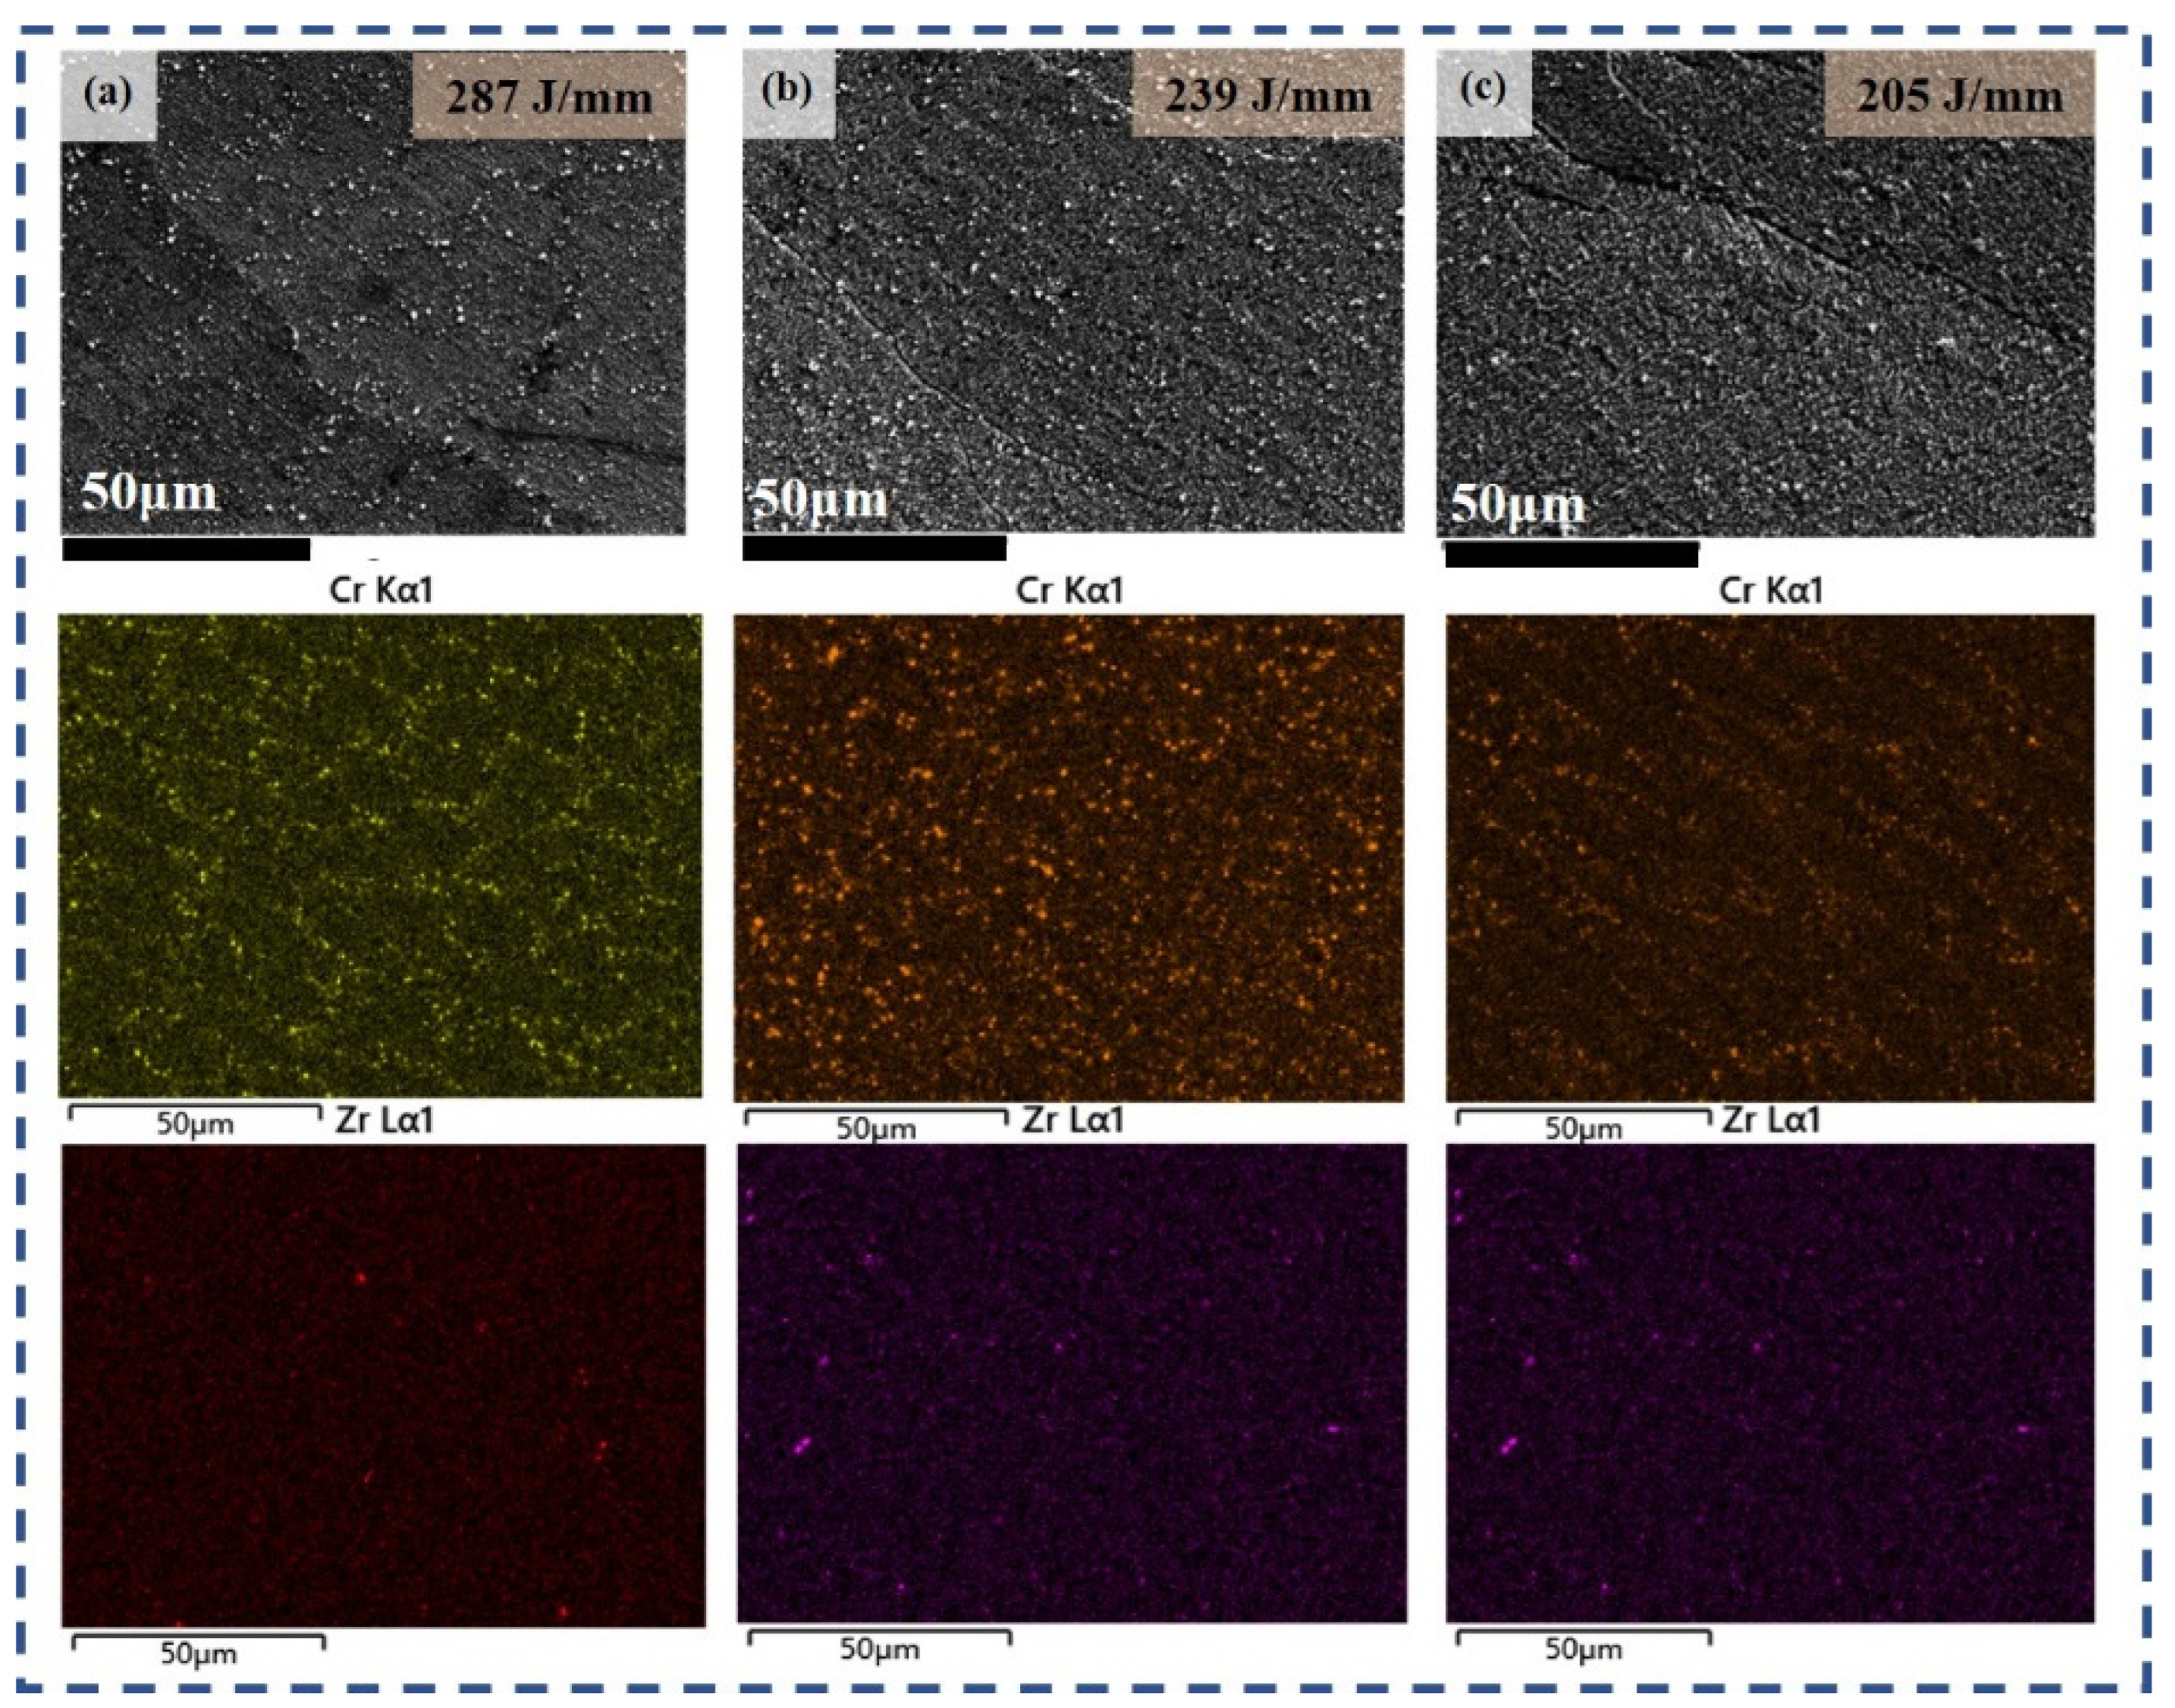
3.1. Microstructure Morphology

Figure 2 shows the microstructure of the Cu-Cr-Zr alloy thin-walled samples at the different heat inputs. No defects, such as pores and cracks, are observed. The microstructure of the samples has columnar grains with the growth direction tending to the center of the molten pool. At the same time, it is noticed that the grains grow across the layers, resulting in a longer columnar crystal length [28], in agreement with the finding of Baby et al. [18]. In the first few layers connected to the substrate, we observe a laser deep melting feature. This feature disappears afterwards due to the difference in the thermophysical properties of Cu-Cr-Zr alloy and stainless steel. In the LAHAM process, solidified grains of the previous layer are partially melted in the forming of the next layer. These melted grains contribute to the growth in the original direction, resulting in extended columnar grains. Since a unidirectional scanning path is employed in this experiment, the Cu-Cr-Zr alloy samples show regular columnar grains.
The samples possess different grain sizes and morphology at different heat inputs. The grain size and morphology mainly depend on the temperature gradient G and the solidification rate R. G × R represents the cooling rate of the solidification process and affects the grain size. The larger the value of G × R, the smaller the grain size. The solidification rate R decreases when the scanning speed increases. In general, the grain size decreases with increases in the scanning speed. However, the single-layer height of the sample decreases gradually with increases in the scanning speed because the wire feeding speed keeps constant in the experiment. Compared to Figure 2a, Figure 2c requires more layers to reach the equivalent height, which will increase and affect the microstructure of the samples. In this experiment, the grain size is affected by both the variation of the solidification rate and the number of thermal cycles. In Figure 2, the grain length–width ratio increases and the grain size tends to increase with decreases in the heat input. Detailed grain size analysis will be provided in Section 3.2.

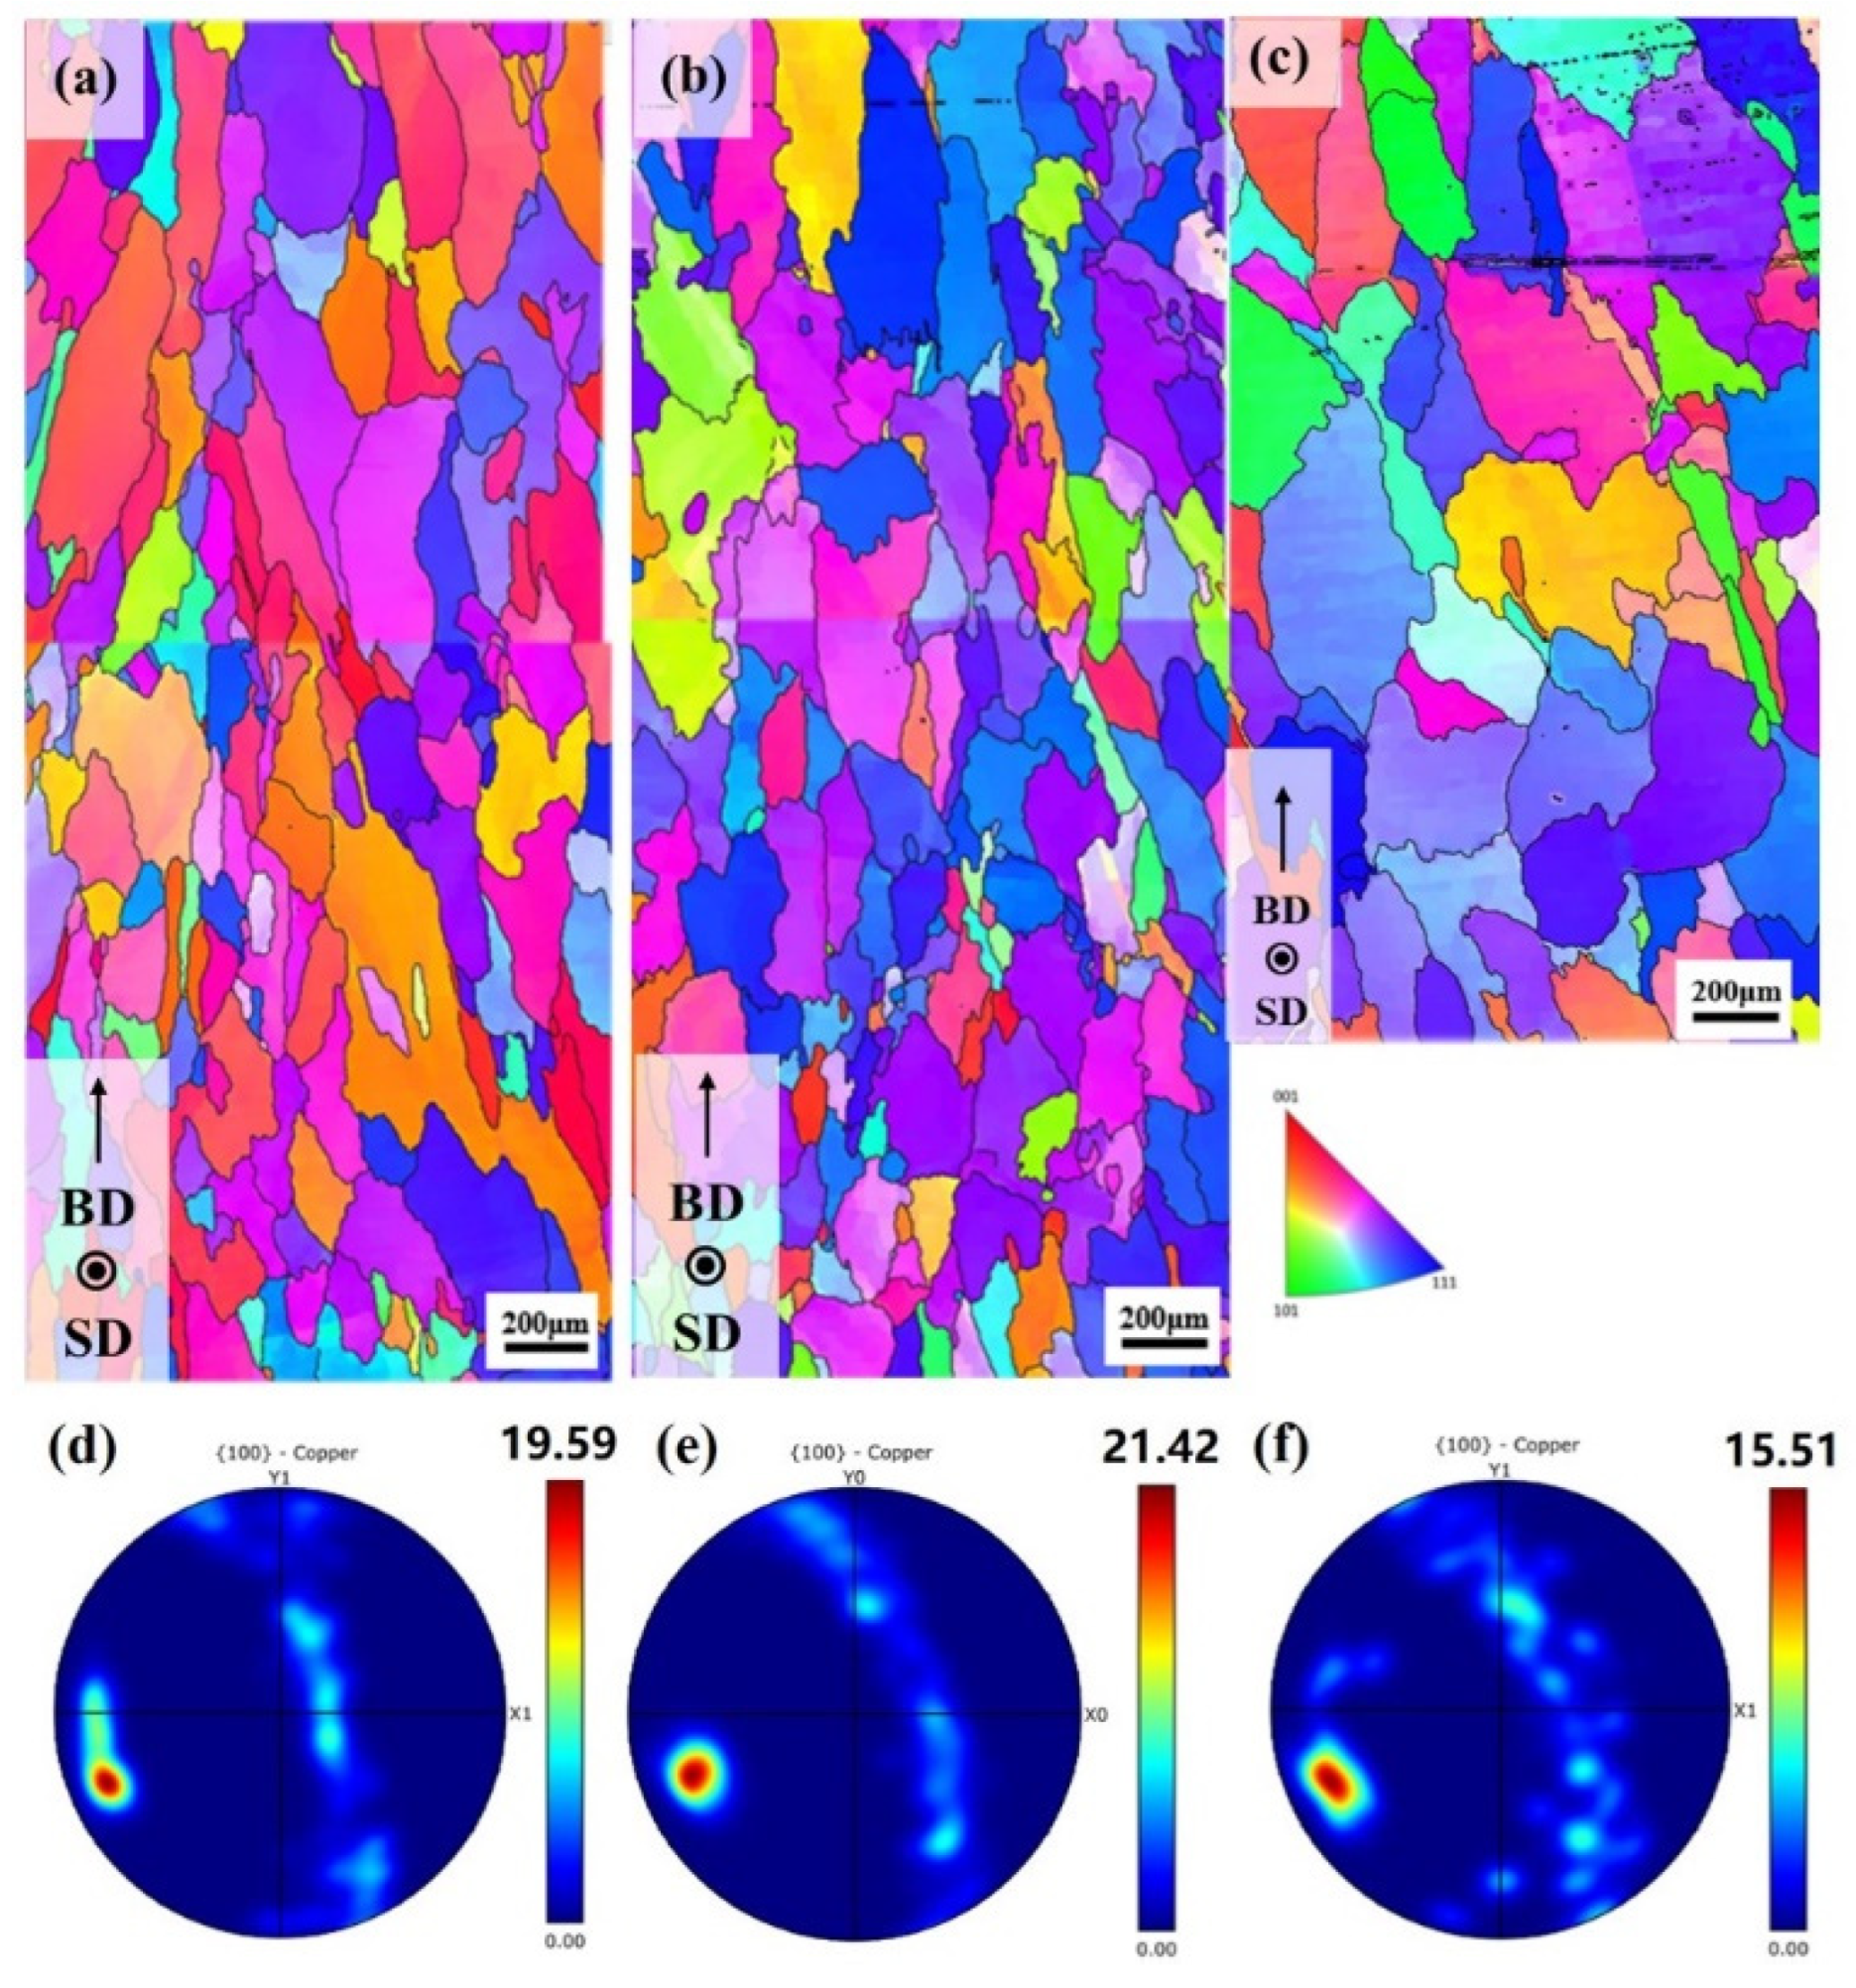
3.2. Grain Morphology and Texture

The grain morphology and texture of the Cu-Cr-Zr alloy samples were characterized by EBSD. Figure 3a–c shows the color inverse pole figures (IPF) (parallel to the building direction) at different scanning speeds. Figure 3d–f displays the polar diagram of the Cu-Cr-Zr alloy samples at different scanning speeds. The peak densities are 19.59, 21.42 and 15.51, respectively. The existence of texture can cause the anisotropy of the materials, which has a great influence on the mechanical properties [29]. As shown in Figure 3a–c, red and blue are the dominant colors, so texture exists in the samples. In addition, the peak density of the polar diagram reflects the intensity of the texture. The distribution of the grain size is statistically analyzed, as shown in Figure 4a. The average grain sizes are 111.9 ± 91.6 μm, 106.3 ± 86.8 μm and 147.2 ± 104.3 μm, respectively. Compared to Figure 3c, the grain size in Figure 3b is refined by 27.8%. When the heat input decreases from 239 J/mm to 205 J/mm, the number of thermal cycles increases significantly. More thermal cycles provide more time for grain growth. As depicted in Figure 4b, the proportions of the high-angle grain boundaries (misorientation greater than 15°) are significantly superior in the samples. The proportion exceeds 69% for all the samples and reaches a maximum of 79% when the heat input is 239 J/mm. Compared with the results reported by Ma et al. [25], the proportions of the high-angle grain boundaries increase obviously. Heat treatment can shift the boundary misorientation distribution from a low-angle grain boundary to a high angle [30].
Under the laser–direct current arc hybrid additive manufacturing process, repeated thermal cycling plays a similar role to heat treatment in the solidified layer. The direct current arc can keep the melted material (connected to the positive pole) at a high temperature and can increase the melting depth compared to the alternate current arc. It leads to the recrystallization process occurring in the solidified layer and the sub-grain boundaries are transformed into new grain boundaries. Thus, there are grain refinements and the addition of a high-angle grain boundary. When the proportion of the high-angle grain boundary is 79%, the samples have the finest grain. The melting depth of the molten pool gradually decreases with the reduction of the heat input. Although the heat input of the time per unit remains unchanged when the scanning speed increases, the energy of the area per unit decreases. As a result, the deposited material obtains less thermal energy and the remelting depth is reduced. Therefore, when the heat input is decreased from 239 J/mm to 205 J/mm, some sub-grain boundaries cannot convert into new grain boundaries, resulting in larger grains and fewer high-angle grain boundaries.

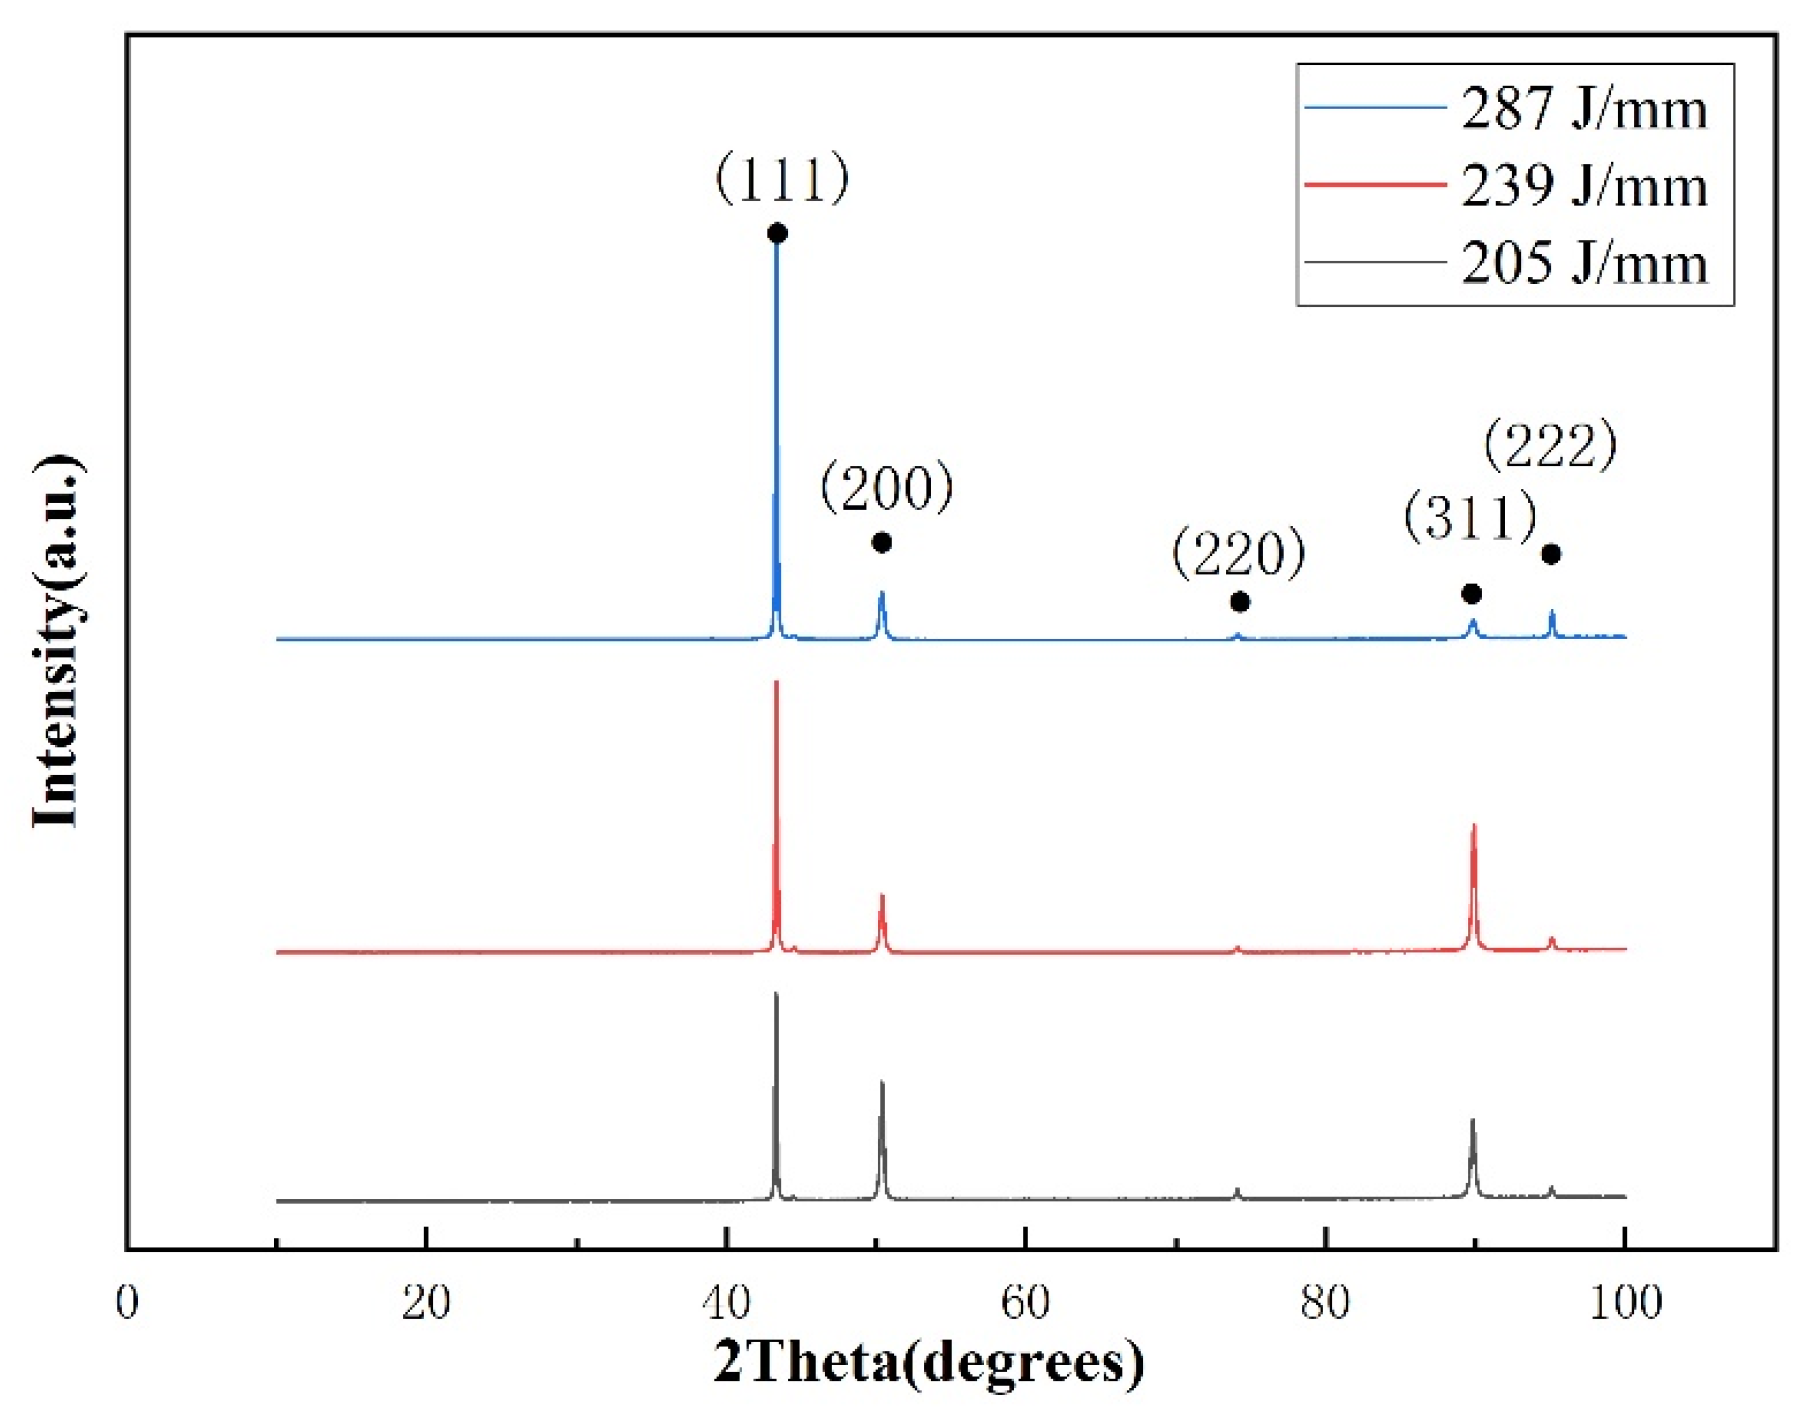
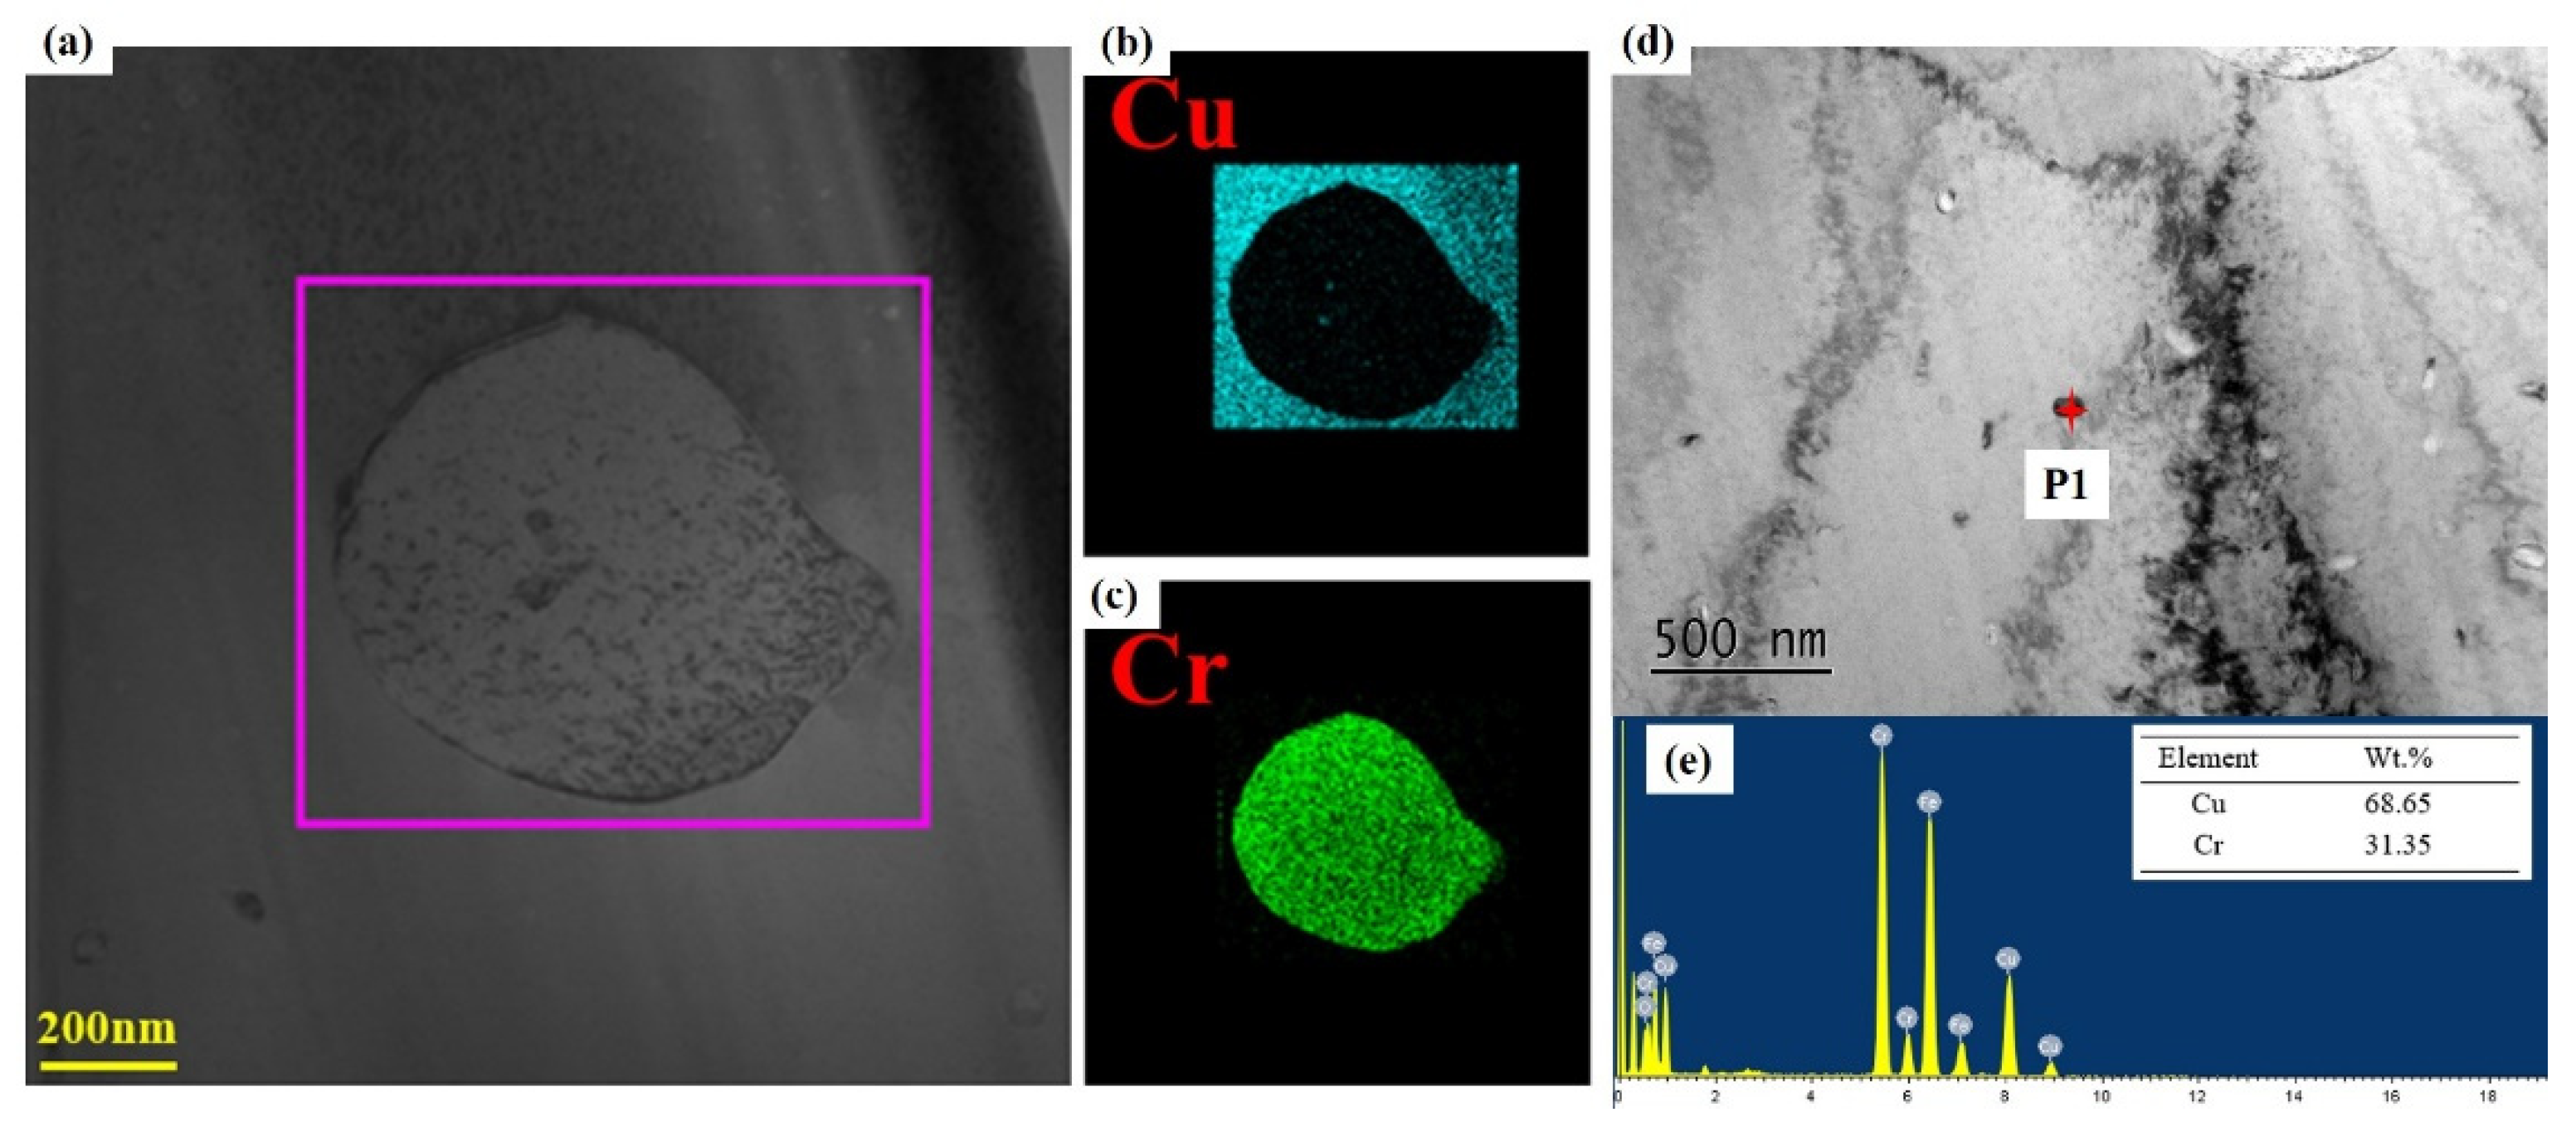
3.3. Phase Composition

Figure 5 shows the XRD spectra of the Cu-Cr-Zr alloy samples. Only the α-Cu phase is recognized in the samples, which may be due to the low Cr and Zr content in the experimental wire. The preferred orientation is a plane (111)Cu, which is consistent with the LAHAM sample of Ma et al. [23]. α-Cu is a face-centered cubic crystal (fcc) structure and the (111) plane is close-packed plane, which has less surface energy than other planes. Increases in heat input promote the growth of α-Cu on the (111) crystal plane with low surface energy. Meanwhile, with decreases in heat input, the peak intensity of the plane (200)Cu reduces, and the peak intensity of the plane (311)Cu firstly increases and then decreases.
The high strength of Cu-Cr alloy is mainly caused by nano-precipitation phases. The addition of the trace element Zr not only improves the strength of the Cu-Cr alloy, but also optimizes the precipitation and growth of the Cr phase, which makes the precipitation process more complicated [31,32]. Meanwhile, Zr has little influence on the conductivity of Cu alloy [33]. Figure 6 displays the distribution of Cr precipitates at different heat inputs. The white spherical particles are Cr precipitates. The energy dispersive spectrometer (EDS) line scanning and point scanning results of the Cr precipitate is shown in Figure 7a,c,d. Zr precipitates are also observed in Figure 7b, but they are few and mainly around the Cr precipitates. Hatakeyama et al. [31] found that Zr was easy to enrich on the surface of Cr precipitates, forming a core–shell structure with Cr as the core and Zr as the shell, which inhibited the coarsening of the Cr precipitates. The EDS results of the Zr precipitates are shown in Figure 7e,f. The Zr precipitate contains only Cu and Zr elements. The atomic ratio of Cu to Zr is close to 8:1. Zeng et al. [32] studied the phase diagram of Cu-Cr-Zr, and pointed out that the Zr-rich region in the system is mainly the Cu5Zr phase. The Zr precipitates in our research are also likely to exist in this form; this requires further research.
The area percentage of the Cr precipitates in Figure 6 is counted by Image-Pro Plus software. It is found that the area proportions of the Cr precipitates are 23.2%, 26.3% and 19.9% for the different heat inputs, respectively. There are two reasons for the variation in the amount of Cr precipitates when the heat input changes. Firstly, the heat input decreases as the scanning speed increases. As a result, the Cr does not precipitate sufficiently and the quantity of Cr precipitates decreases. The other reason is that the number of remelts increases as the scanning speed increases. Due to the different melting points between the Cr precipitates and the Cu matrix, the remelting only melts the Cu matrix, so the Cr precipitates are retained. At the same time, new Cr elements are precipitated during the remelting process, increasing the amount of Cr precipitates. Combining the two reasons, the area proportion of Cr precipitates is largest at the heat input of 239 J/mm. Figure 8 shows the distribution of elements in the Cu-Cr-Zr alloy at the different heat inputs. It can be observed that there is no significant change in the distribution of the Cr and Zr. The Cr phase is uniformly distributed in the Cu matrix, and the Zr element precipitates in only a few positions.
It is generally believed that the stable structure of the Cr phase in the Cu-Cr system is the body center cubic (bcc) structure. Chbihi et al. [34] proposed the following precipitation sequence of Cr in the Cu matrix: Supersaturated solid solution → Cr phase of face center cubic (fcc) structure coherent with the matrix, maintaining cube-on-cube orientation with the matrix → Cr phase of bcc structure maintains K-S or N-W relationship with the matrix → gradually grown bcc structure of Cr phase, the K-S relationship gradually replaces the N-W relationship → coarse bcc structure of Cr phase. They provided a formula for the calculation of the nucleation barrier of Cr, as follows [33]:
Δ G * = 16 π 3 γ 3 ( Δ g n + Δ g e l ) 2
where γ is the coherent interfacial energy, Δgn is the driving force for nucleation and Δgel is the elastic energy. It can be calculated that ΔG* for a bcc nucleus is 4 × 10⁻²⁰ J, which is two orders of magnitude bigger than for an fcc nucleus, ΔG* ~ 3 × 10⁻²² J. Therefore, at the beginning, the C r f c c is predominant. As the C r f c c grows, the mismatch increases and the effect of the interfacial energy on the precipitates is weakened, which prompts the conversion of C r f c c to C r b c c .
In order to further clarify the crystal structure of the Cr precipitates, the sample at a heat input of 287 J/mm was selected for TEM analysis. Due to the low content of Zr in the material system and the small amount of Zr precipitates, only the Cr precipitates were tested by TEM. Figure 9a shows the element mappings of the Cr precipitate, which presents an irregular ellipsoidal shape. The size of this Cr precipitate is submicron, which was also observed by Zhou et al. [1]. At the same time, it is found that nanoscale precipitates are also distributed in the samples. After element analysis, it is confirmed that Cr is the dominant element. As shown in Figure 9b, the Cr precipitates show circular and oval shapes, which is consistent with the discovery by Chbihi et al. [34]. Ma et al. [35] concluded that there were concentration gradients among different sizes of Cr precipitates in the Cu matrix. The diffusion of Cr atoms promotes the formation of large-sized Cr phases and the dissolution of small-sized Cr phases. The diffusion rate of the Cr atoms is dependent on the temperature. The degree of the Cr phases growth correlates with the holding time. LAHAM is a rapid cooling process and the Cr atoms cannot diffuse sufficiently. As a result, both submicron and nanoscale Cr precipitates can be observed. In addition, the diffusion rate of the Cr atoms varies with the heat input. This leads to the difference in the area proportion of the Cr precipitates.
Figure 10a–c illustrates the TEM image and SAED pattern of the Cr precipitates and Cu matrix. After calibration, Figure 10b shows the zone axis [0 1 1]Cu of the SAED pattern. The SAED pattern is consistent with the Cu matrix of an fcc structure. Figure 10c shows the zone axis [111]Cr of the SAED pattern. The SAED pattern is consistent with the Cr precipitate of a bcc structure. Figure 10d is a high-resolution image of the interface between the Cr precipitate and Cu matrix. The crystal plane spacing of (200)Cu is 0.1872 nm and the crystal plane spacing of (111)Cr is 0.2075 nm. According to the mismatch calculation formula [36]:
δ = | 2 ( d 1 d 2 ) | d 1 + d 2
the calculated mismatch is 0.10, which is less than 0.25 (the threshold of incoherent and semi-coherent interfaces). Hence, the Cr precipitate exhibits a semi-coherent interface with the Cu matrix, which is consistent with the HRTEM in Figure 10d,e. It can be confirmed that Cr precipitates have huge potential to enhance the mechanical properties.

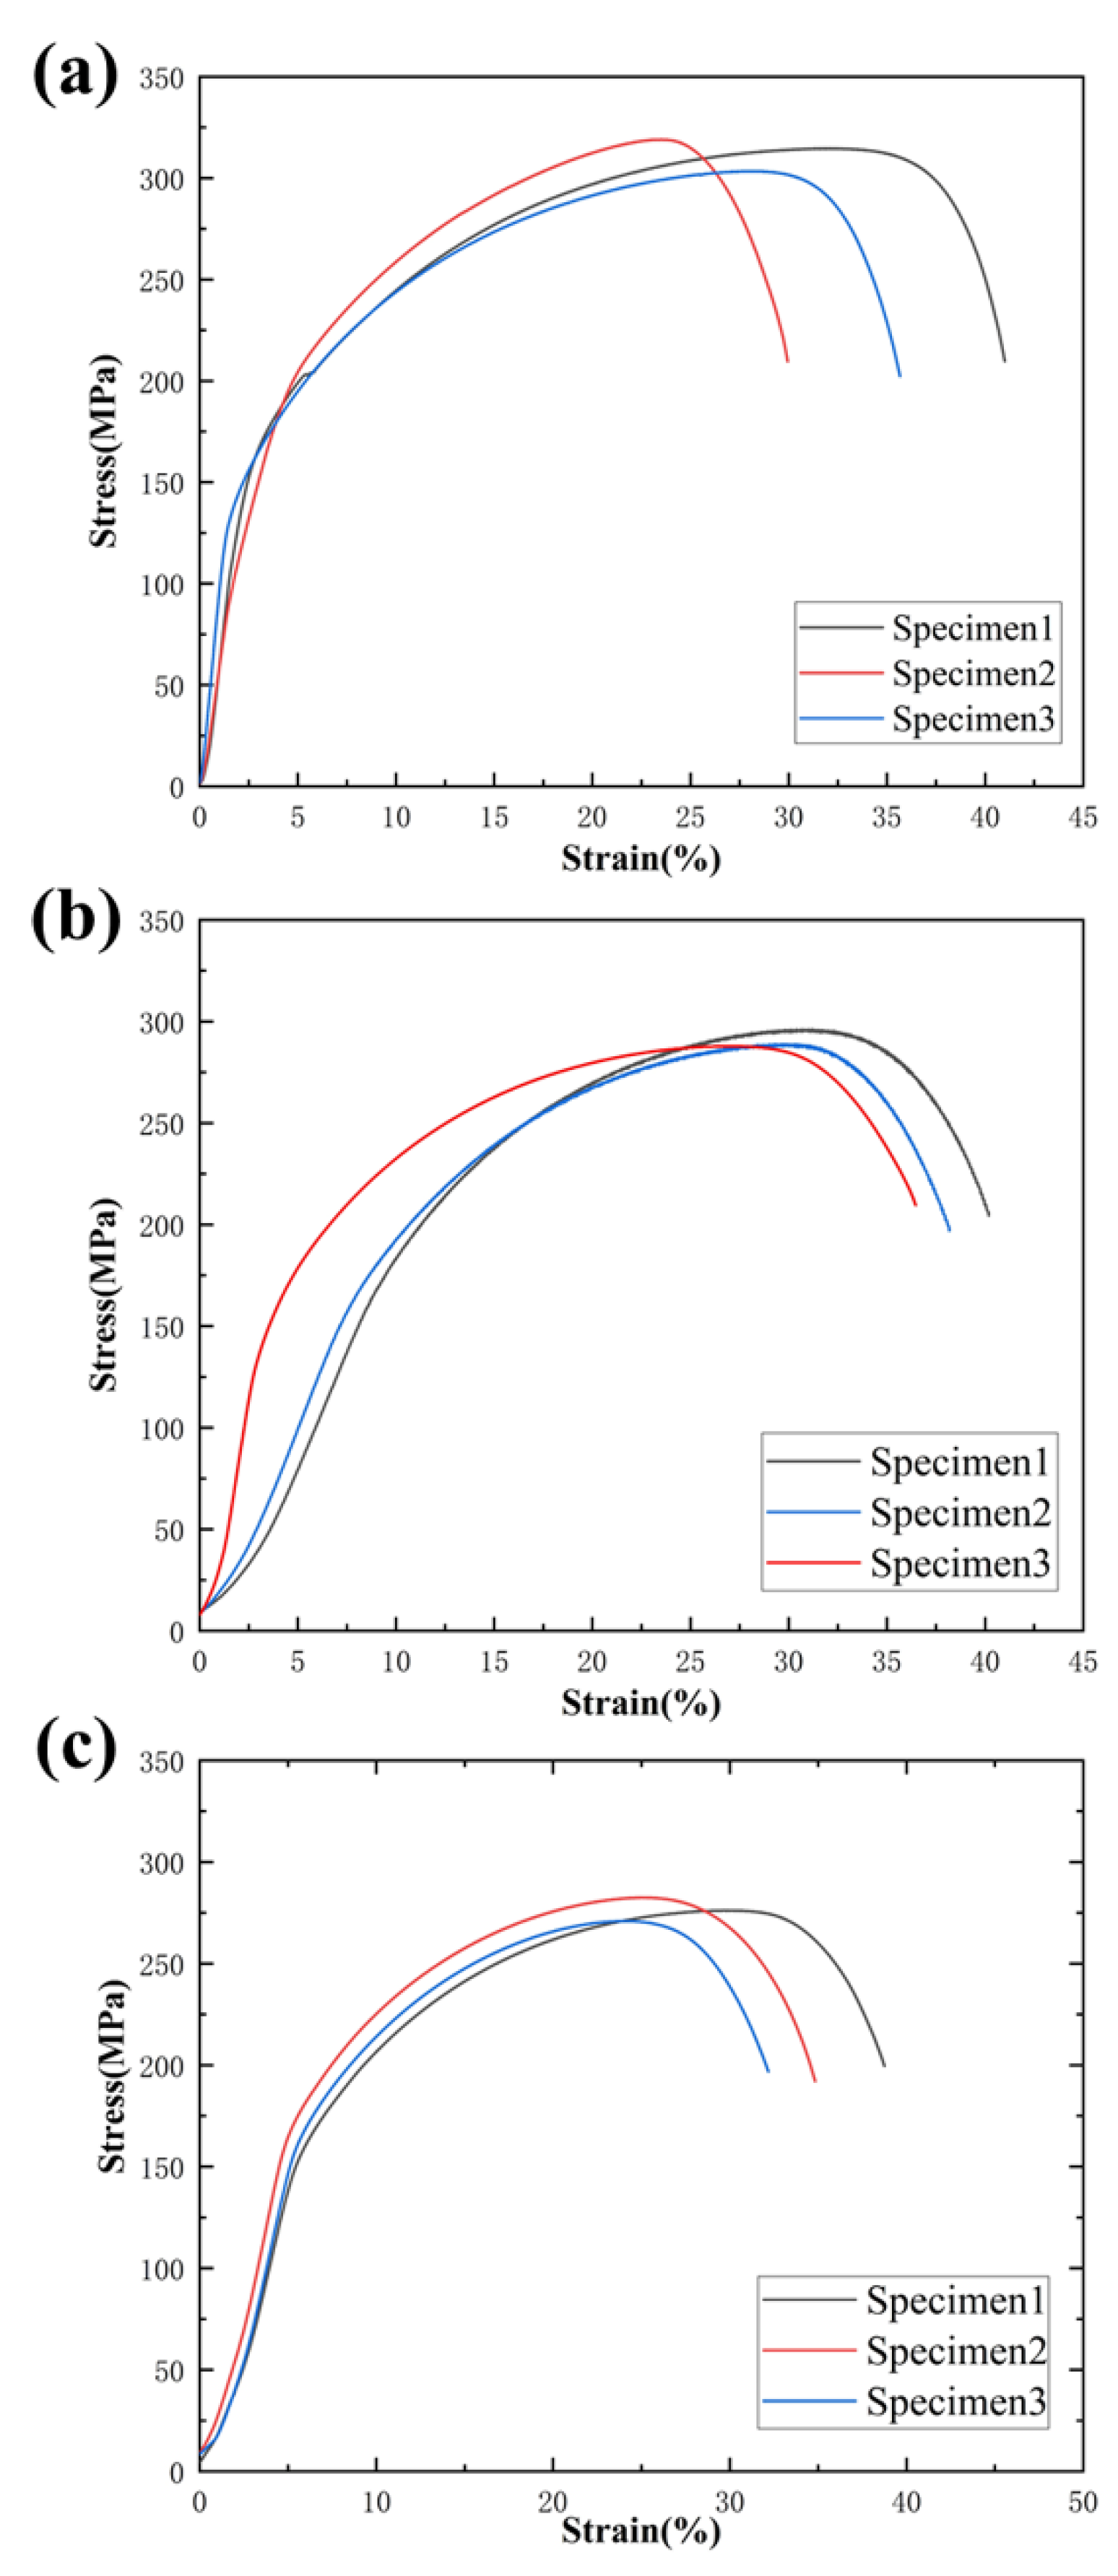
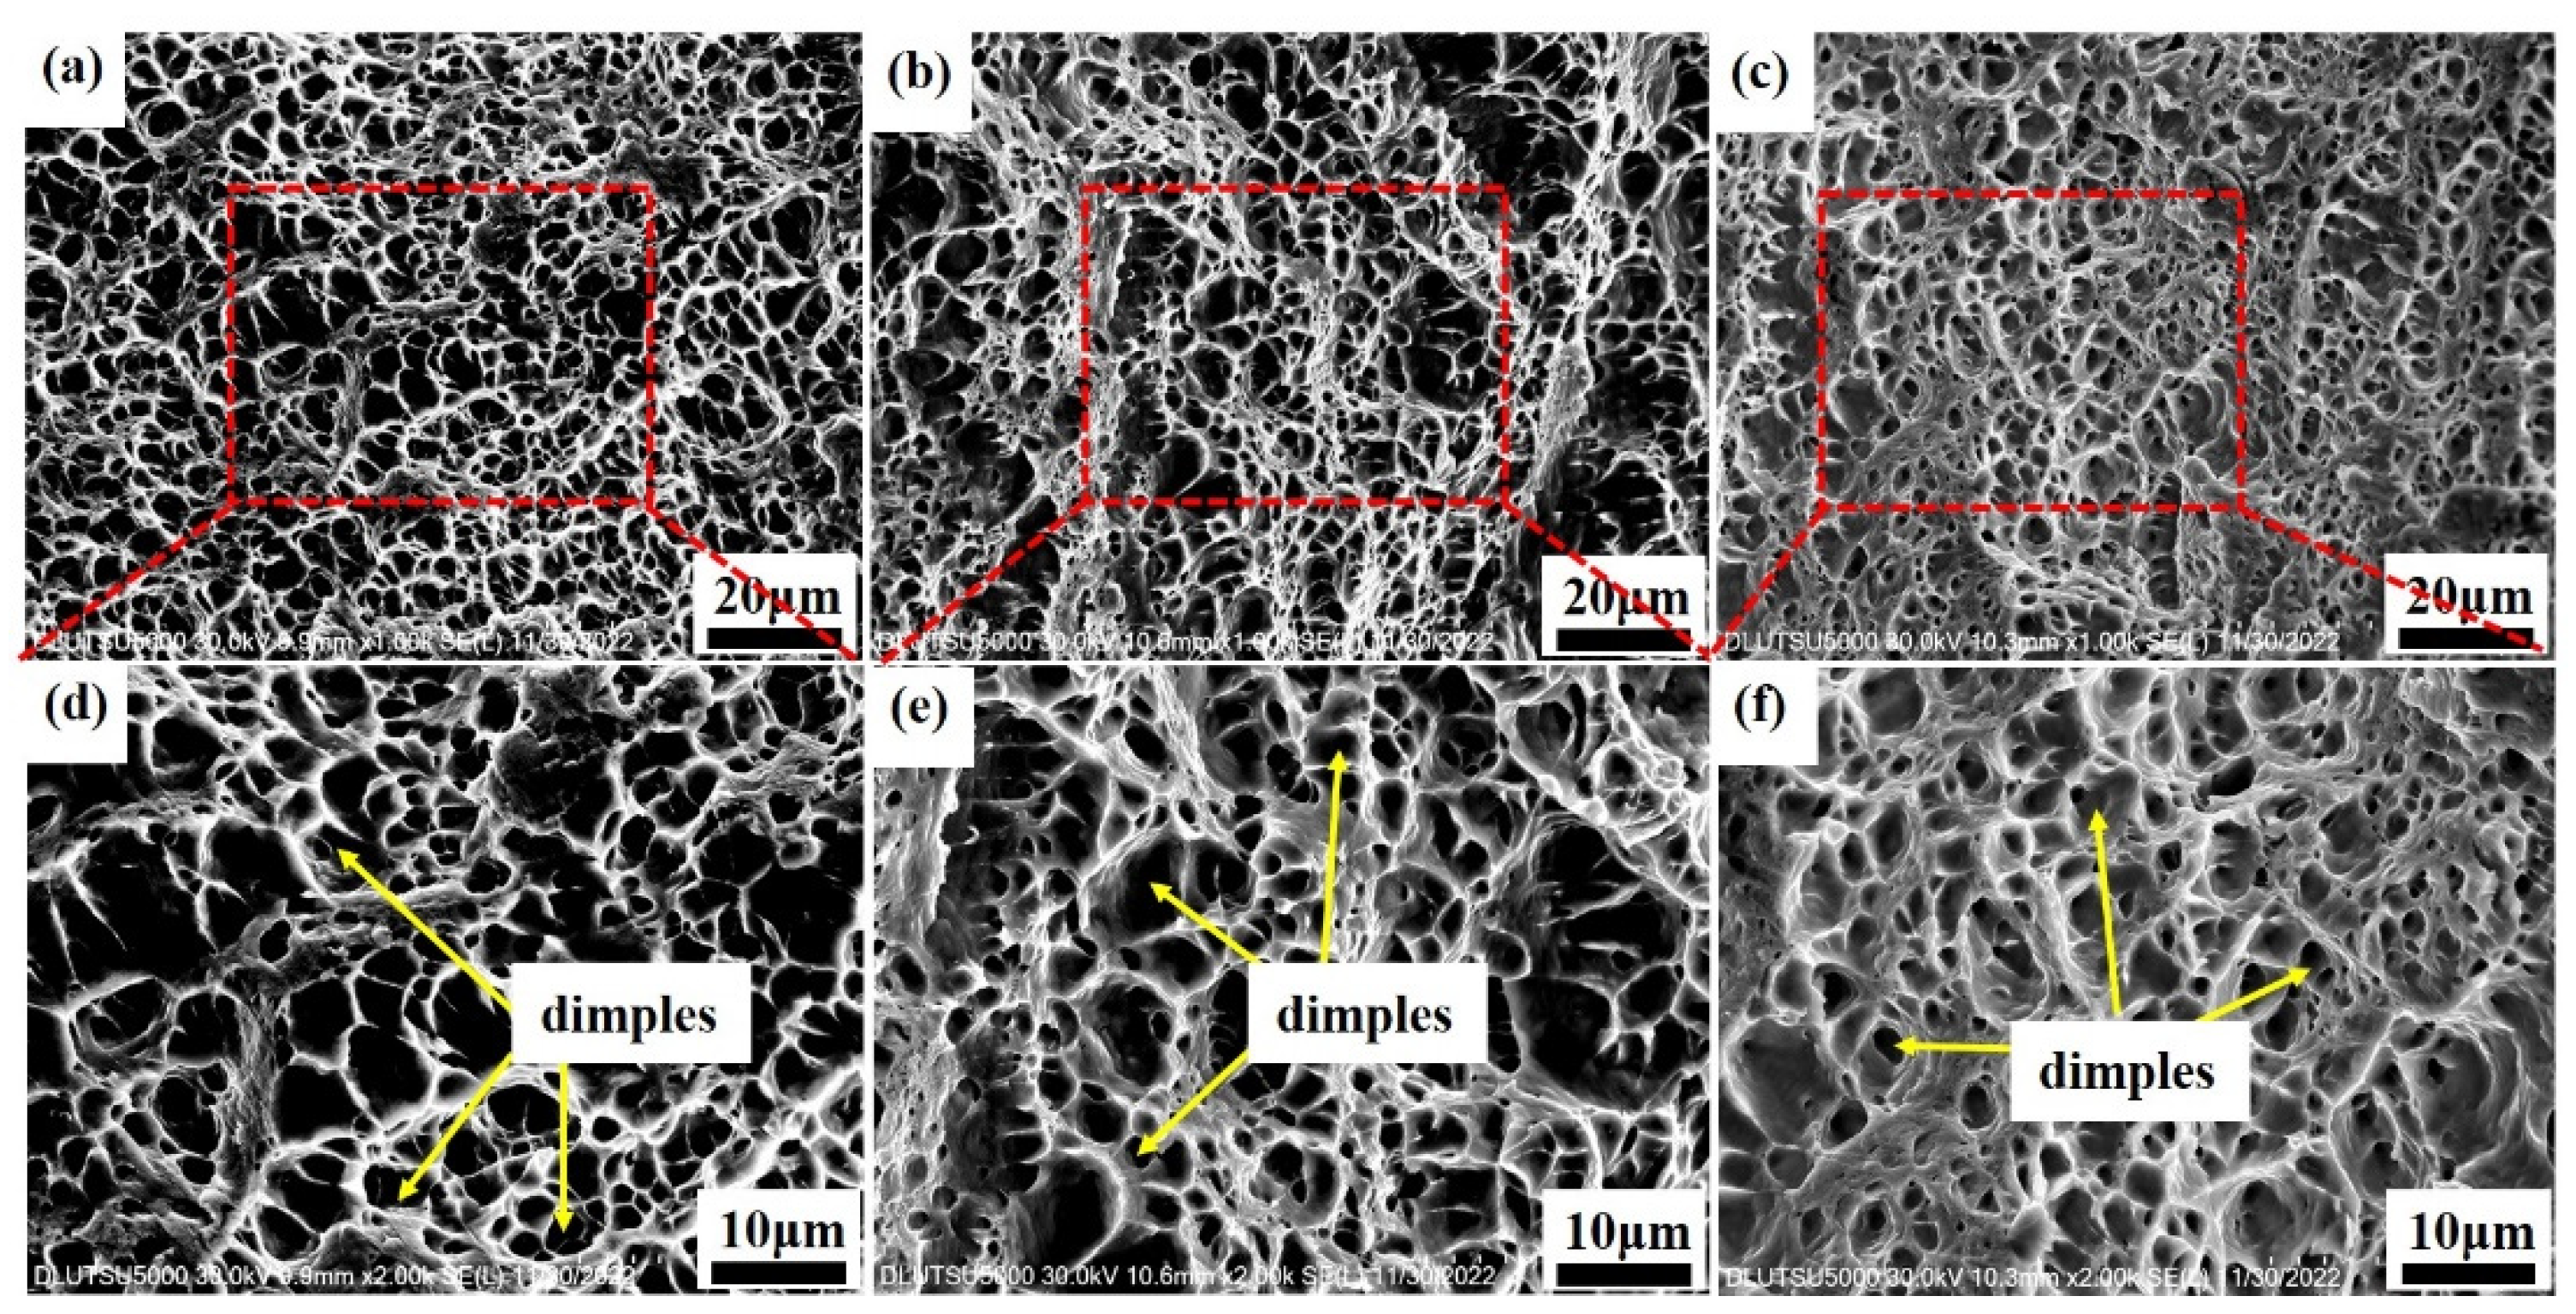
3.4. Mechanical Properties

The tensile curves of the Cu-Cr-Zr alloy samples are shown in Figure 11a–c. Specific values of the tensile results are shown in Table 2. Table 3 shows a comparison of the tensile properties among the different methods. The tensile strength and elastic module gradually reduce with decreases in the scanning speed. The ultimate tensile strength of the sample is up to 311.3 ± 7.8 MPa, which is higher than most Cu-Cr-Zr samples prepared by L-PBF or casting. Therefore, it can be concluded that the LAHAM-manufactured Cu-Cr-Zr alloy has favorable strength. The laser–direct current arc hybrid method might be expected to provide a fresh route for the additive manufacturing of copper alloys, which enables it to be widely used in the transportation and aerospace field. Furthermore, the ultimate tensile strength of the specimen is reduced by 11.11% when the scanning speed is increased from 250 mm/min to 350 mm/min.
The tensile properties of the specimens are mainly influenced by fine grain strengthening and precipitation strengthening. Grain refinement can increase the number and area of grain boundaries, increasing resistance to dislocation movement, so the strength is increased. The effect of the fine grain strengthening can be calculated by the Hall–Petch equation [25,38], as follows:
σ s = σ 0 + k d 1 / 2
where d is the grain size, σ 0 is 20 MPa for copper alloy and k is 0.18 MPa/m1/2. It can be calculated by Equation (4) that the strength decreased by approximately 3 MPa when the scanning speed was increased from 300 to 350 mm/min, accounting for 18% of the total strength decrease.
The Cu-Cr-Zr alloy is a typical precipitation-reinforced copper alloy. According to the above statistics, the grain type of Hall-Petch equation samples does not change significantly. Thus, precipitation strengthening is the main factor for enhancing the mechanical properties of Cu-Cr-Zr alloy. Precipitation strengthening follows the Orowan bypass mechanism [39,40,41], and its intensity contribution is calculated as follows:
σ p = 0.81 M G b 2 π ( 1 v ) 0.5 ln ( d p b ) λ d p
λ = 0.5 d p 3 π 2 f v
where M is the Taylor factor (3.06 for face-centered cubic metals), G is the shear modulus, the value is 45.5 GPa, b is the Burgers vector with a value of 0.255 nm, v is Poisson’s ratio with a value of 0.34, λ is the spacing between precipitated phases, and d p and f v are the mean diameters and volume fractions of the precipitates, respectively. Here, the volume fraction f v of the precipitates is replaced by the area fraction in Section 3.3. According to Equations (5) and (6), the strength decrease caused by precipitation strengthening was more than 11 MPa, accounting for 81% of the total strength decrease when the scanning speed increased from 300 mm/min to 350 mm/min.
The fracture surfaces of the samples are shown in Figure 12. There are numerous dimples in the Cu-Cr-Zr alloy samples, which proved that the fracture mechanism is ductile fracture. Moreover, many large and deep dimples are observed, and some large dimples have small dimples nested within them. The number, size and depth of the dimples reflect the plasticity of the material. The sample at the heat input of 300 mm/min has finer and denser dimples than other samples, so it has the best plasticity of 43.4%.

4. Conclusions

In this research, the influence of different scanning speeds on the microstructure evaluation and mechanical properties for Cu-Cr-Zr alloy fabricated via laser–direct current arc hybrid additive manufacturing were firstly investigated. The main conclusions are summarized below:
(1)
The LAHAMed Cu-Cr-Zr alloy samples presented no cracks or porosity defects. Columnar grains with a growth direction tending to the center of the molten pool were observed. The columnar grain size increased by 38.16% when the scanning speed was extended from 300 mm/min to 350 mm/min.
(2)
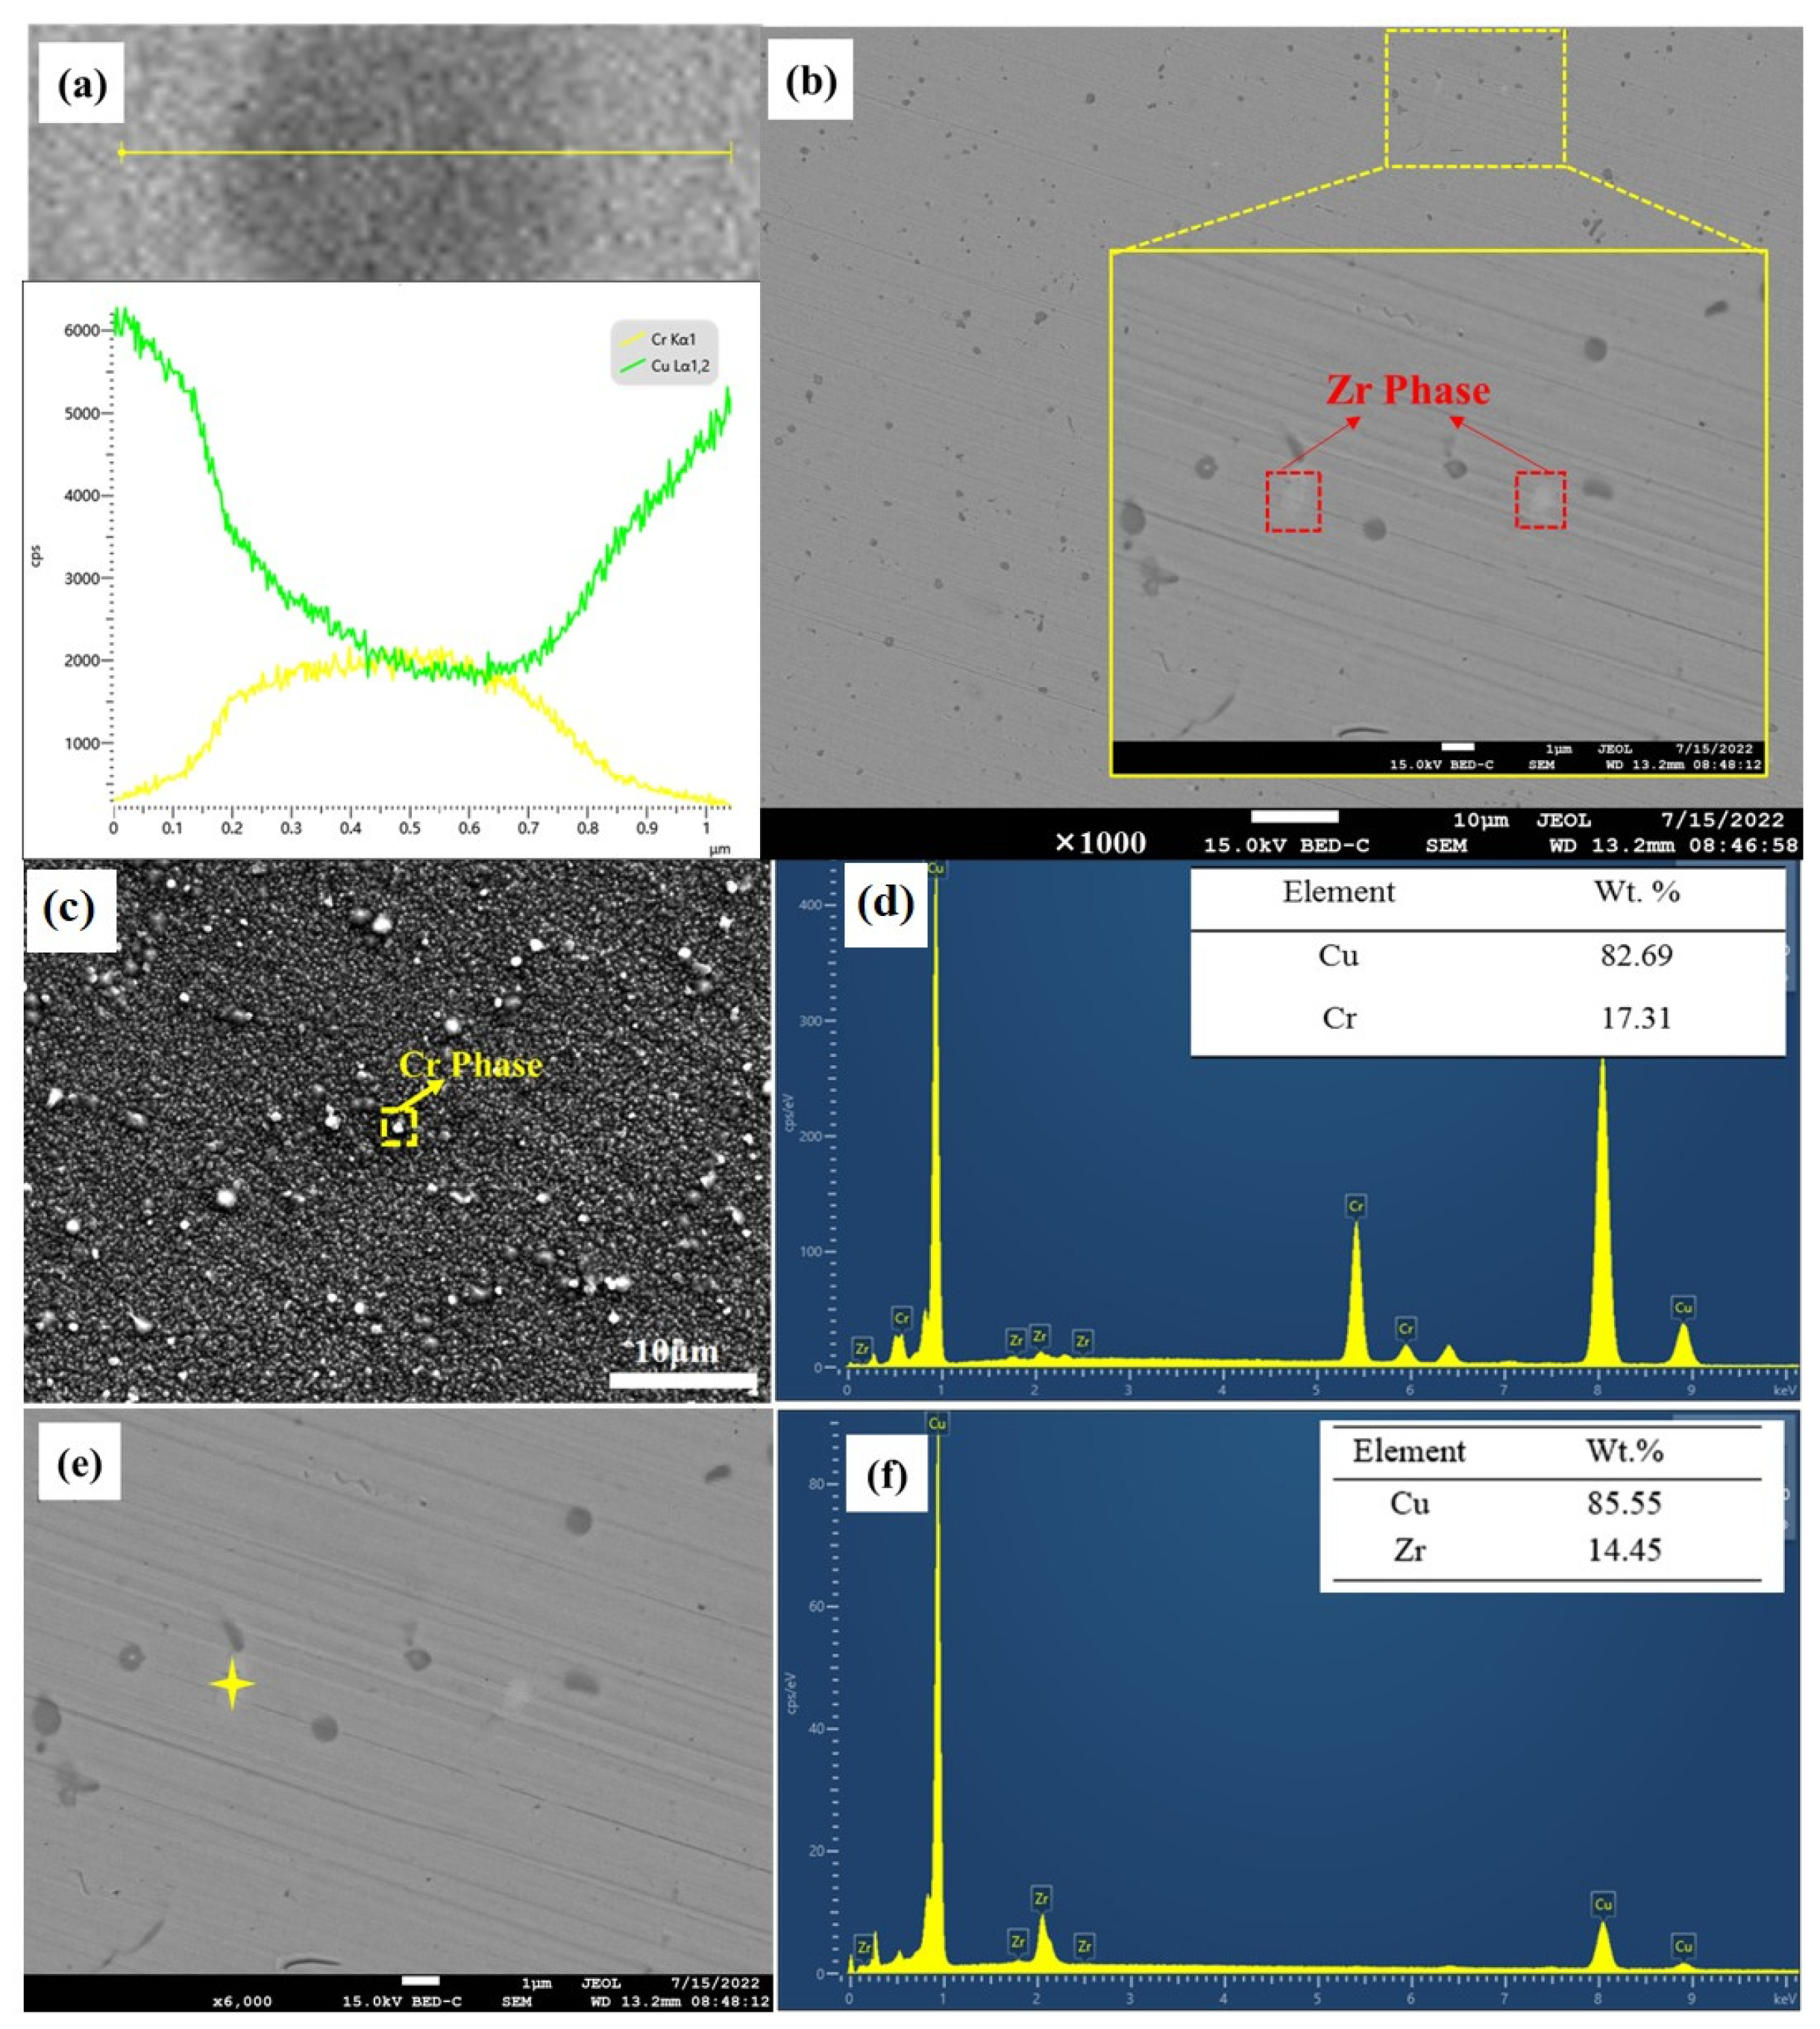
The Cr precipitate was uniformly distributed in the Cu matrix, whereas the Zr phase was dispersed in only a few positions. The spherical Cr precipitate exhibited a semi-coherent interface with the Cu matrix, playing an important role in the improvement of the mechanical properties.
(3)
At a scanning speed of 250 mm/min, the ultimate tensile strength had a maximum of 311.3 ± 7.8 MPa with an elongation of 38.6 ± 5.6%, which was greater than that of Cu-Cr-Zr alloy prepared by L-PBF or casting. The fracture mode was a ductile fracture with typical dimple characteristics.

Author Contributions

J.S.: Conceptualization, Methodology, Software, Formal analysis, Investigation, Writing—original draft. L.L.: Resources, Methodology, Writing—review & editing. D.L.: Conceptualization, Writing—review & editing. G.M.: Resources, Writing—review & editing, Supervision. Z.C.: Software, Writing—review & editing. F.N.: Writing-review & editing, Supervision. S.Y.: Writing—review & editing, Supervision. D.W.: Writing—review & editing, Supervision. All authors have read and agreed to the published version of the manuscript.

Funding

The authors are grateful for the financial support from the National Natural Science Foundation of China (No. 52175291), the Fundamental Research Funds for the Central Universities (No. DUT21YG116).

Institutional Review Board Statement

Not applicable.

Informed Consent Statement

Not applicable.

Data Availability Statement

Not applicable.

Conflicts of Interest

The authors declare that they have no known competing financial interest or personal relationship that could have appeared to influence the work reported in this paper.

References

  1. Zhou, K.; Chen, W.G.; Feng, P.; Yan, F.L.; Fu, Y.Q. Arc ablation behavior and micro-structure evolution of plastically deformed and micro-alloyed Cu-Cr-Zr alloys. J. Alloy. Compd. 2020, 820, 153123. [Google Scholar] [CrossRef]
  2. Sousa, T.G.; Moura, I.; Da Garcia, F.C.; Monteiro, S.N.; Brandao, L.P. Combining severe plastic deformation and precipitation to enhance mechanical strength and electrical conductivity of Cu-0.65Cr-0.08Zr alloy. J. Mater. Res. Technol 2020, 9, 5953–5961. [Google Scholar] [CrossRef]
  3. Auwal, S.T.; Ramesh, S.; Yusof, F.; Manladan, S.M. A review on laser beam welding of copper alloys. Int. J. Adv. Manuf. Technol. 2018, 96, 475–490. [Google Scholar] [CrossRef]
  4. Sun, F.; Liu, P.; Chen, X.; Zhou, H.; Guan, P.; Zhu, B. Mechanical Properties of High-Strength Cu–Cr–Zr Alloy Fabricated by Selective Laser Melting. Materials 2020, 13, 5028. [Google Scholar] [CrossRef] [PubMed]
  5. Mishnev, R.; Shakhova, I.; Belyakov, A.; Kaibyshev, R. Deformation microstructures, strengthening mechanisms, and electrical conductivity in a Cu-Cr-Zr alloy. Mater. Sci. Eng. A 2015, 629, 29–40. [Google Scholar] [CrossRef]
  6. Derekar, K.S. A review of wire arc additive manufacturing and advances in wire arc additive manufacturing of aluminium. Mater. Sci. Technol. 2018, 34, 895–916. [Google Scholar] [CrossRef]
  7. Casuso, M.; Veiga, F.; Suárez, A.; Bhujangrao, T.; Aldalur, E.; Artaza, T.; Amondarain, J.; Lamikiz, A. Model for the Prediction of Deformations in the Manufacture of Thin-Walled Parts by Wire Arc Additive Manufacturing Technology. Metals 2021, 11, 678. [Google Scholar] [CrossRef]
  8. Veiga, F.; Suárez, A.; Aldalur, E.; Bhujangrao, T. Effect of the Metal Transfer Mode on the Symmetry of Bead Geometry in WAAM Aluminum. Symmetry 2021, 13, 1245. [Google Scholar] [CrossRef]
  9. Ding, J.; Colegrove, P.; Mehnen, J.; Ganguly, S.; Almeida, P.S.; Wang, F.; Williams, S. Thermo-mechanical analysis of Wire and Arc Additive Layer Manufacturing process on large multi-layer parts. Comput. Mater. Sci. 2011, 50, 3315–3322. [Google Scholar] [CrossRef] [Green Version]
  10. Popovich, A.; Sufiiarov, V.; Polozov, I.; Borisov, E.; Masaylo, D.; Orlov, A. Microstructure and mechanical properties of additive manufactured copper alloy. Mater. Lett. 2016, 179, 38–41. [Google Scholar] [CrossRef]
  11. Kuai, Z.; Li, Z.; Liu, B.; Chen, Y.; Lu, S.; Tang, X.; Liu, T. Selective laser melting of CuCrZr alloy: Processing optimisation, microstructure and mechanical properties. J. Mater. Res. Technol. 2022, 19, 4915–4931. [Google Scholar] [CrossRef]
  12. Ma, Z.B.; Zhang, K.F.; Ren, Z.H.; Zhang, D.Z.; Tao, G.B.; Xu, H.S. Selective laser melting of Cu–Cr–Zr copper alloy: Parameter optimization, microstructure and mechanical properties. J. Alloy. Compd. 2020, 828, 154350. [Google Scholar] [CrossRef]
  13. Hu, Z.P.; Du, Z.F.; Yang, Z.W. Preparation of Cu-Cr-Zr alloy by selective laser melting: Role of scanning parameters on densification, microstructure and mechanical properties. Mater. Sci. Eng. A-Struct. Mater. Prop. Microstruct. Process. 2022, 836, 142740. [Google Scholar] [CrossRef]
  14. Zhang, S.; Zhu, H.; Zhang, L.; Zhang, W.; Yang, H.; Zeng, X. Microstructure and properties of high strength and high conductivity Cu-Cr alloy components fabricated by high power selective laser melting. Mater. Lett. 2019, 237, 306–309. [Google Scholar] [CrossRef]
  15. Lassègue, P.; Salvan, C.; De Vito, E.; Soulas, R.; Herbin, M.; Hemberg, A.; Godfroid, T.; Baffie, T.; Roux, G. Laser powder bed fusion (L-PBF) of Cu and CuCrZr parts: Influence of an absorptive physical vapor deposition (PVD) coating on the printing process. Addit. Manuf. 2021, 39, 101888. [Google Scholar] [CrossRef]
  16. Lindström, V.; Liashenko, O.; Zweiacker, K.; Derevianko, S.; Morozovych, V.; Lyashenko, Y.; Leinenbach, C. Laser Powder Bed Fusion of Metal Coated Copper Powders. Materials 2020, 13, 3493. [Google Scholar] [CrossRef]
  17. Jadhav, S.D.; Dhekne, P.P.; Brodu, E.; Van Hooreweder, B.; Dadbakhsh, S.; Kruth, J.-P.; Van Humbeeck, J.; Vanmeensel, K. Laser powder bed fusion additive manufacturing of highly conductive parts made of optically absorptive carburized CuCr1 powder. Mater. Des. 2021, 198, 109369. [Google Scholar] [CrossRef]
  18. Baby, J.; Amirthalingam, M. Microstructural development during wire arc additive manufacturing of copper-based components. Weld. World 2020, 64, 395–405. [Google Scholar] [CrossRef]
  19. Deshmukh, P.S.; Tomar, K.; Sathiaraj, G.D.; Palani, I. Optimum strength and ductility of pure copper fabricated by Wire Arc Additive Manufacturing. Manuf. Lett. 2022, 33, 24–28. [Google Scholar] [CrossRef]
  20. Miao, Q.Y.; Wu, D.J.; Chai, D.S.; Zhan, Y.; Bi, G.J.; Niu, F.Y.; Ma, G.Y. Comparative study of microstructure evaluation and mechanical properties of 4043 aluminum alloy fabricated by wire-based additive manufacturing. Mater. Des. 2020, 186, 108205. [Google Scholar] [CrossRef]
  21. Liu, D.H.; Wu, D.J.; Niu, F.Y.; Miao, Q.Y.; Zhao, K.; Tang, B.K.; Bi, G.J.; Ma, G.Y. Al-Cu alloy fabricated by novel laser-tungsten inert gas hybrid additive manufacturing. Addit. Manuf. 2020, 32, 100954. [Google Scholar]
  22. Ma, G.; Wang, R.; Liu, D.; Wu, S.; Niu, F.; Wu, D. Laser-arc hybrid additive manufactured Al Cu alloy for T-shaped structure: Microstructure evaluation and molten pool behavior. J. Manuf. Process. 2022, 79, 442–459. [Google Scholar] [CrossRef]
  23. Liu, D.; Wu, D.; Ge, C.; Lu, H.; Chen, Z.; Liu, M.; Wang, Y.; Niu, F.; Ma, G.; Luo, K.; et al. Superior strength of laser-arc hybrid additive manufactured Al-Zn-Mg-Cu alloy enabled by a tunable microstructure. Addit. Manuf. 2023, 68, 103526. [Google Scholar] [CrossRef]
  24. Gong, M.C.; Zhang, S.; Lu, Y.; Wang, D.Z.M.; Gao, M. Effects of laser power on texture evolution and mechanical properties of laser-arc hybrid additive manufacturing. Addit. Manuf. 2021, 46, 102201. [Google Scholar]
  25. Ma, G.Y.; Wu, S.N.; Wang, R.Z.; Liu, D.H.; Niu, F.Y.; Bi, G.J.; Wu, D.J. Microstructure evaluation and resultant mechanical properties of laser- arc hybrid additive manufactured Cu-Cr-Zr alloy. J. Alloy. Compd. 2022, 912, 165044. [Google Scholar] [CrossRef]
  26. Liu, D.; Wu, D.; Wang, R.; Shi, J.; Niu, F.; Ma, G. Formation mechanism of Al-Zn-Mg-Cu alloy fabricated by laser-arc hybrid additive manufacturing: Microstructure evaluation and mechanical properties. Addit. Manuf. 2022, 50, 102554. [Google Scholar] [CrossRef]
  27. Wu, S.; Hu, Y.; Duan, H.; Yu, C.; Jiao, H. On the fatigue performance of laser hybrid welded high Zn 7000 alloys for next generation railway components. Int. J. Fatigue 2016, 91, 1–10. [Google Scholar] [CrossRef]
  28. Ramirez, D.A.; Murr, L.E.; Martinez, E.; Hernandez, D.H.; Martinez, J.L.; Machado, B.I.; Medina, F.; Frigola, P.; Wicker, R.B. Novel precipitate-microstructural architecture developed in the fabrication of solid copper components by additive manufacturing using electron beam melting. Acta Mater. 2011, 59, 4088–4099. [Google Scholar] [CrossRef]
  29. Laghi, V.; Tonelli, L.; Palermo, M.; Bruggi, M.; Sola, R.; Ceschini, L.; Trombetti, T. Experimentally-validated orthotropic elastic model for Wire-and-Arc Additively Manufactured stainless steel. Addit. Manuf. 2021, 42, 101999. [Google Scholar] [CrossRef]
  30. Liu, D.; Wu, D.; Ma, G.; Zhong, C.; Niu, F.; Gasser, A.; Schleifenbaum, J.H.; Bi, G. Effect of post-deposition heat treatment on laser-TIG hybrid additive manufactured Al-Cu alloy. Virtual Phys. Prototyp. 2020, 15, 445–459. [Google Scholar] [CrossRef]
  31. Hatakeyama, M.; Toyama, T.; Nagai, Y.; Hasegawa, M.; Eldrup, M.; Singh, B.N. Nanostructural Evolution of Cr-rich Precipitates in a Cu-Cr-Zr Alloy During Heat Treatment Studied by 3 Dimensional Atom Probe. Mater. Trans. 2008, 49, 518–521. [Google Scholar] [CrossRef] [Green Version]
  32. Zeng, K.; Hämäläinen, M.; Lilius, K. Phase relationships in Cu-rich corner of the Cu-Cr-Zr phase diagram. Scr. Met. Mater. 1995, 32, 2009–2014. [Google Scholar] [CrossRef]
  33. Li, Y.; Xiao, Z.; Li, Z.; Zhou, Z.; Yang, Z.; Lei, Q. Microstructure and properties of a novel Cu-Mg-Ca alloy with high strength and high electrical conductivity. J. Alloy. Compd. 2017, 723, 1162–1170. [Google Scholar] [CrossRef]
  34. Chbihi, A.; Sauvage, X.; Blavette, D. Atomic scale investigation of Cr precipitation in copper. Acta Mater. 2012, 60, 4575–4585. [Google Scholar] [CrossRef] [Green Version]
  35. Ma, Y.X.; Chen, H.Q.; Li, H.S. Dang. Influence mechanism of ageing parameters of Cu-Cr-Zr alloy on its structure and properties. Materials 2022, 15, 7605. [Google Scholar] [CrossRef]
  36. Hu, G.X.; Cai, X. Fundamentals of Materials Science; Shanghai Jiao Tong University Press: Shanghai, China, 2001. [Google Scholar]
  37. Li, J.L.; Cheng, L.L.; Li, S.L.; Zhu, X.D.; An, Z.X. Microstructure and properties of as- cast Cu-Cr-Zr alloys with lanthanum addition. J. Rare Earths. 2018, 36, 424–429. [Google Scholar] [CrossRef]
  38. Zhou, S.; Wang, K.S.; Wang, W.; Peng, P.; Zhang, S.Y.; Huang, L.Y. Microstructure and Mechanical Properties of Cu-Cr-Zr Alloy Friction Stir Welded Joints. Heat. Treat. Met. 2020, 3, 35–41. [Google Scholar]
  39. Li, J.; Ding, H.; Li, B. Study on the variation of properties of Cu–Cr–Zr alloy by different rolling and aging sequence. Mater. Sci. Eng. A 2021, 802, 140413. [Google Scholar] [CrossRef]
  40. Wang, W.; Li, R.G.; Zou, C.L.; Chen, Z.N.; Wen, W.; Wang, T.M.; Yin, G.M. Effect of direct current pulses on mechanical and electrical properties of aged Cu-Cr-Zr alloys. Mater. Des. 2016, 92, 135–142. [Google Scholar] [CrossRef]
  41. Hu, J.; Tian, Y.; Yu, H.; Ling, G.; Li, S.; Jiang, M.; Li, H.; Qin, G. Optimizing strength and electrical conductivity of Cu-Cr-Zr alloy by two-stage aging treatment. Mater. Lett. 2022, 315, 131937. [Google Scholar] [CrossRef]
Figure 1. (a) Schematic diagram of LAHAM system; (b) Real image of the experimental setup; (c) Position and dimensions of the tensile test specimen.
Coatings 13 01228 g001
Figure 2. Microstructure of Cu-Cr-Zr alloy at different heat inputs: (a) 287 J/mm; (b) 239 J/mm; (c) 205 J/mm.
Coatings 13 01228 g002
Figure 3. Inverse pole figure (IPF) and polar diagram of deposited Cu-Cr-Zr alloy at different scanning speeds: (a,d) 250 mm/min; (b,e) 300 mm/min; (c,f) 350 mm/min.
Coatings 13 01228 g003
Figure 4. (a) Distribution of grain size at different heat inputs; (b) Distribution grain misorientation at different heat inputs.
Coatings 13 01228 g004
Figure 5. XRD patterns of Cu-Cr-Zr alloy samples at different heat inputs.
Coatings 13 01228 g005
Figure 6. Cr precipitates at different heat inputs: (a) 287 J/mm; (b) 239 J/mm; (c) 205 J/mm; (d) High magnification diagram of Cr precipitates.
Coatings 13 01228 g006
Figure 7. (a) EDS line scanning results of Cr precipitate; (b) Zr precipitates; (c) EDS detection point of Cr precipitate; (d) Element content of Cr precipitate; (e) EDS detection point of Zr precipitate; (f) Element content of Zr precipitate.
Coatings 13 01228 g007
Figure 8. Distribution of elements in the Cu-Cr-Zr alloy at different heat inputs: (a) 287 J/mm; (b) 239 J/mm; (c) 205 J/mm.
Coatings 13 01228 g008
Figure 9. (a) Submicron Cr precipitate; (b) Cu element in submicron Cr precipitate; (c) Cr element in submicron Cr precipitate; (d) Nanoscale Cr precipitate; (e) Element content of nanoscale Cr precipitate at point P1.
Coatings 13 01228 g009
Figure 10. TEM image (a) Bright field image of Cr precipitate; (b) Selected electron diffraction pattern of Cu matrix; (c) Selected electron diffraction pattern of Cr precipitate; (d) HRTEM image of the interface between Cu matrix and Cr precipitate; (e) Inverse FFT of the interface.
Coatings 13 01228 g010
Figure 11. Tensile stress–strain curves of deposited specimens at different scanning speeds: (a) 250 mm/min; (b) 300 mm/min; (c) 350 mm/min.
Coatings 13 01228 g011
Figure 12. Fracture morphology of sample at different scanning speeds: (a,d) 250 mm/min; (b,e) 300 mm/min; (c,f) 350 mm/min.
Coatings 13 01228 g012
Table 1. Processing parameters used in single factor experiment.
NumberArc Current
(A)
Scanning Speed (mm/min)Average Laser Power (W)Heat Input
(J/mm)
1140250150287
2140300150239
3140350150205
Table 2. The results of ultimate tensile strength, elongation and corresponding elastic module for LAHAM-processed Cu-Cr-Zr alloy deposited at different scanning speeds.
Scanning Speed (mm/min)250300350
Ultimate tensile strength (MPa)311.3 ± 7.8291.3 ± 4.8276.7 ± 5.8
Elongation (%)38.6 ± 5.643.4 ± 1.539.2 ± 3.3
Elastic module (GPa)123 ± 5115 ± 7110 ± 4
Table 3. Comparison of the ultimate tensile properties with different methods.
MethodLaser–Direct Current Arc (This Work)Cast [37]L-PBF [17]
Ultimate tensile strength (MPa)311 ± 7.8222280
Disclaimer/Publisher’s Note: The statements, opinions and data contained in all publications are solely those of the individual author(s) and contributor(s) and not of MDPI and/or the editor(s). MDPI and/or the editor(s) disclaim responsibility for any injury to people or property resulting from any ideas, methods, instructions or products referred to in the content.

