
Surface Modifications of Superparamagnetic Iron Oxide Nanoparticles with Polyvinyl Alcohol, Chitosan, and Graphene Oxide as Methylene Blue Adsorbents


Abstract
:1. Introduction
2. Materials and Methods
2.1. Materials
2.2. Synthesis
2.2.1. Synthesis of SPIONs
2.2.2. Synthesis of GO
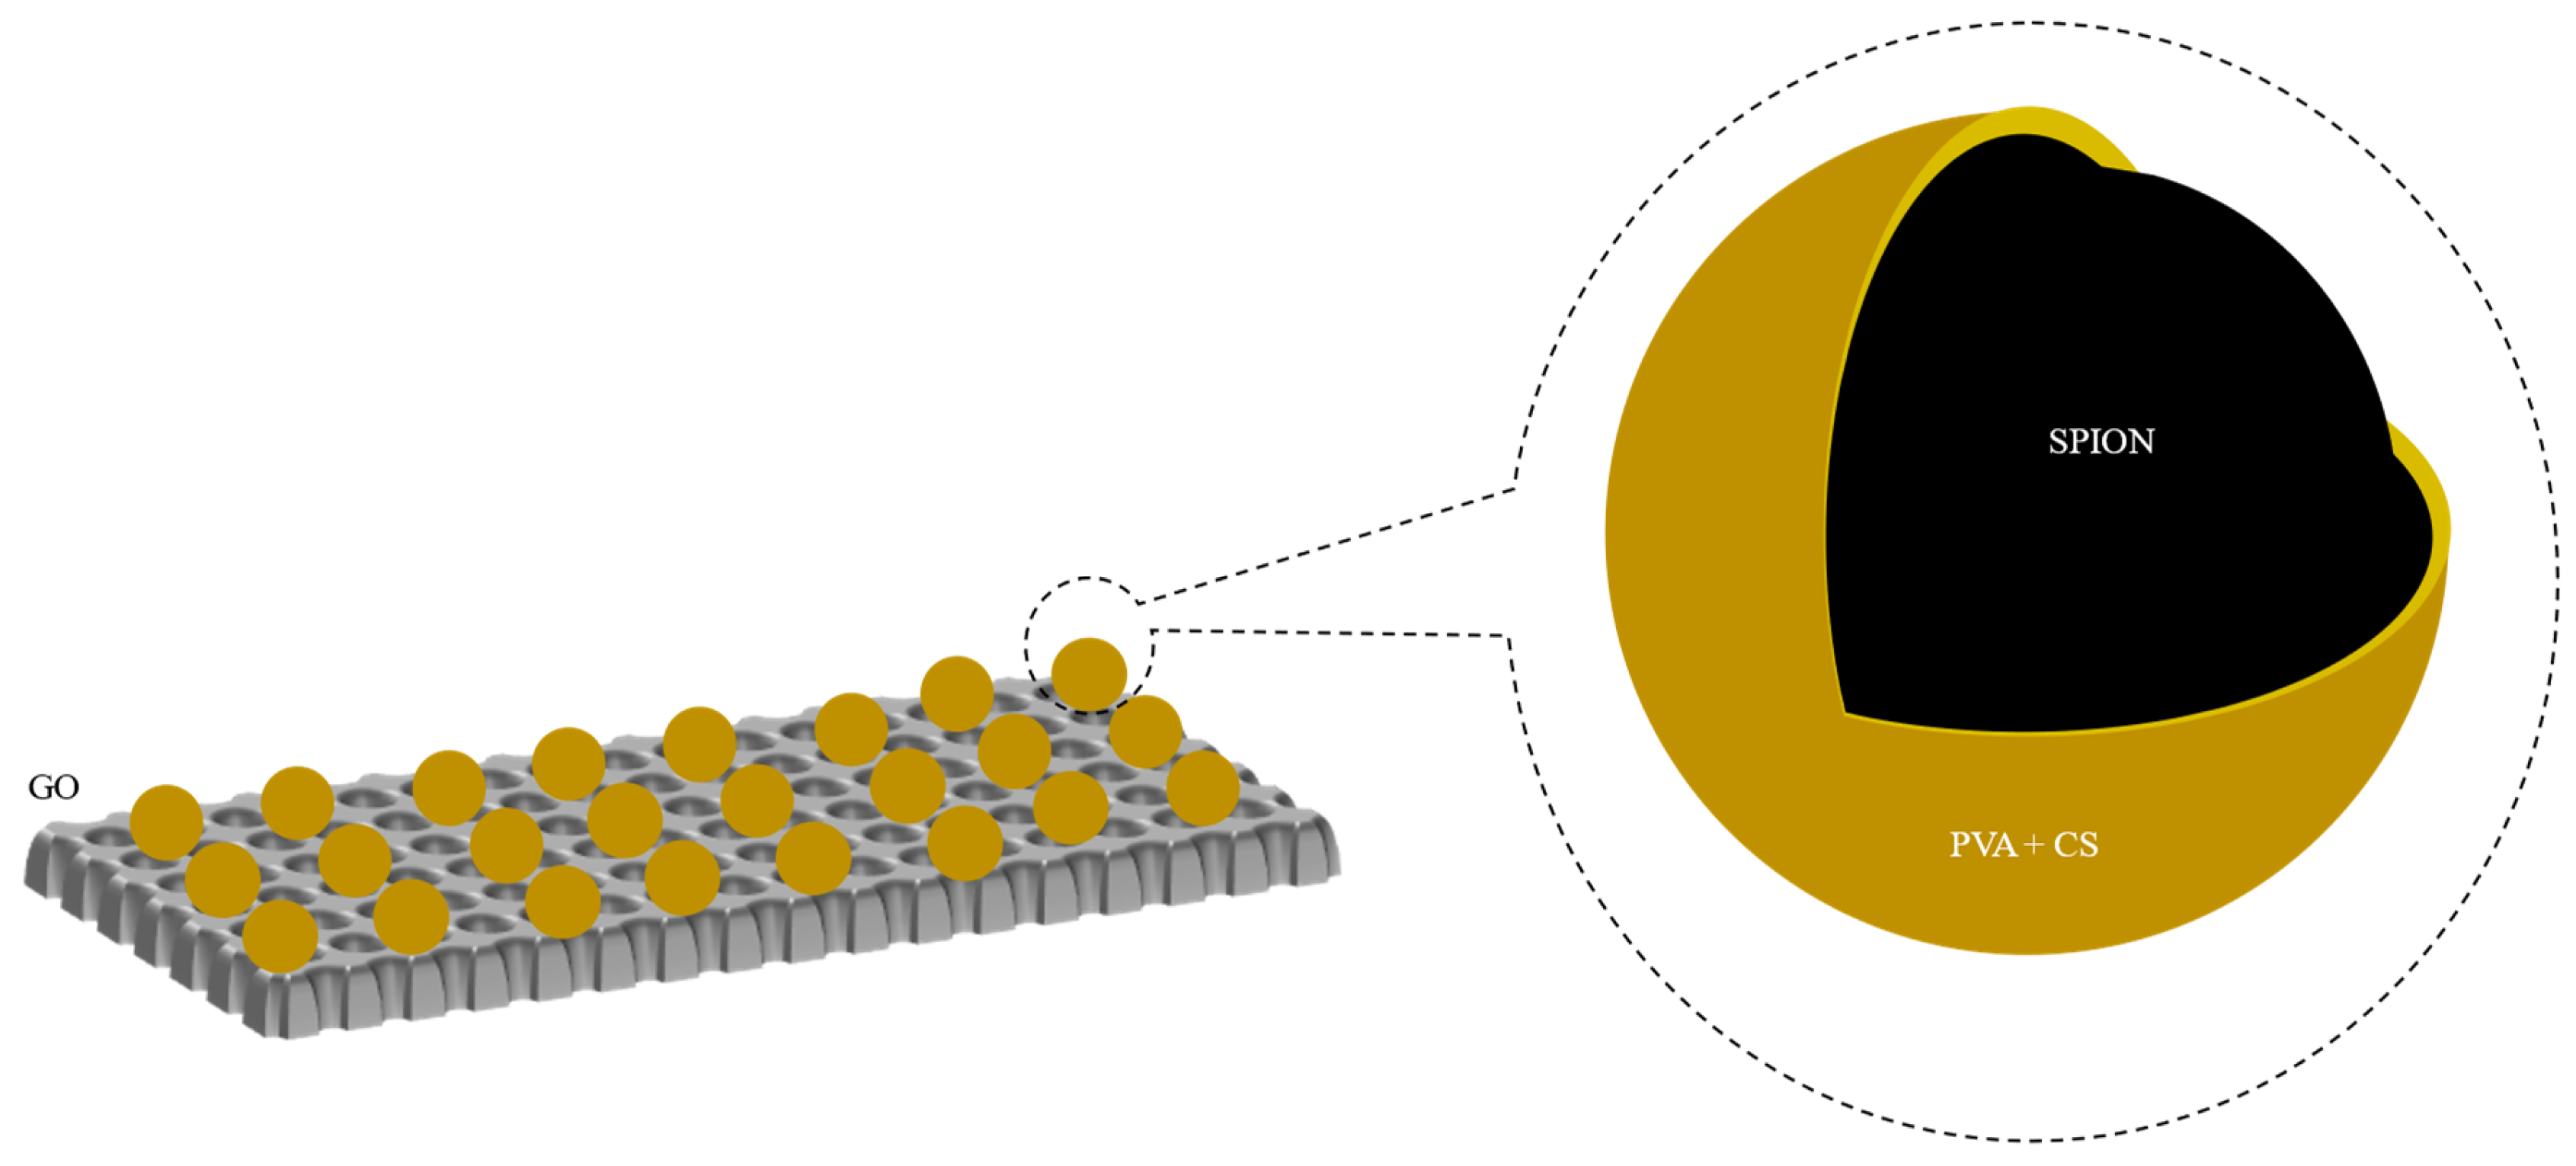
2.2.3. Synthesis of SPION/PVA/CS/GO
2.3. Characterization
2.4. Determining the Adsorption Capacity of Methylene Blue on SPION/PVA/CS/GO
2.5. Determining the Desorption Capability of the Methylene Blue on SPION/PVA/CS/GO
2.6. Theory
3. Results and Discussion
3.1. Characterization of SPION/PVA/GO
3.2. FE-SEM Analysis
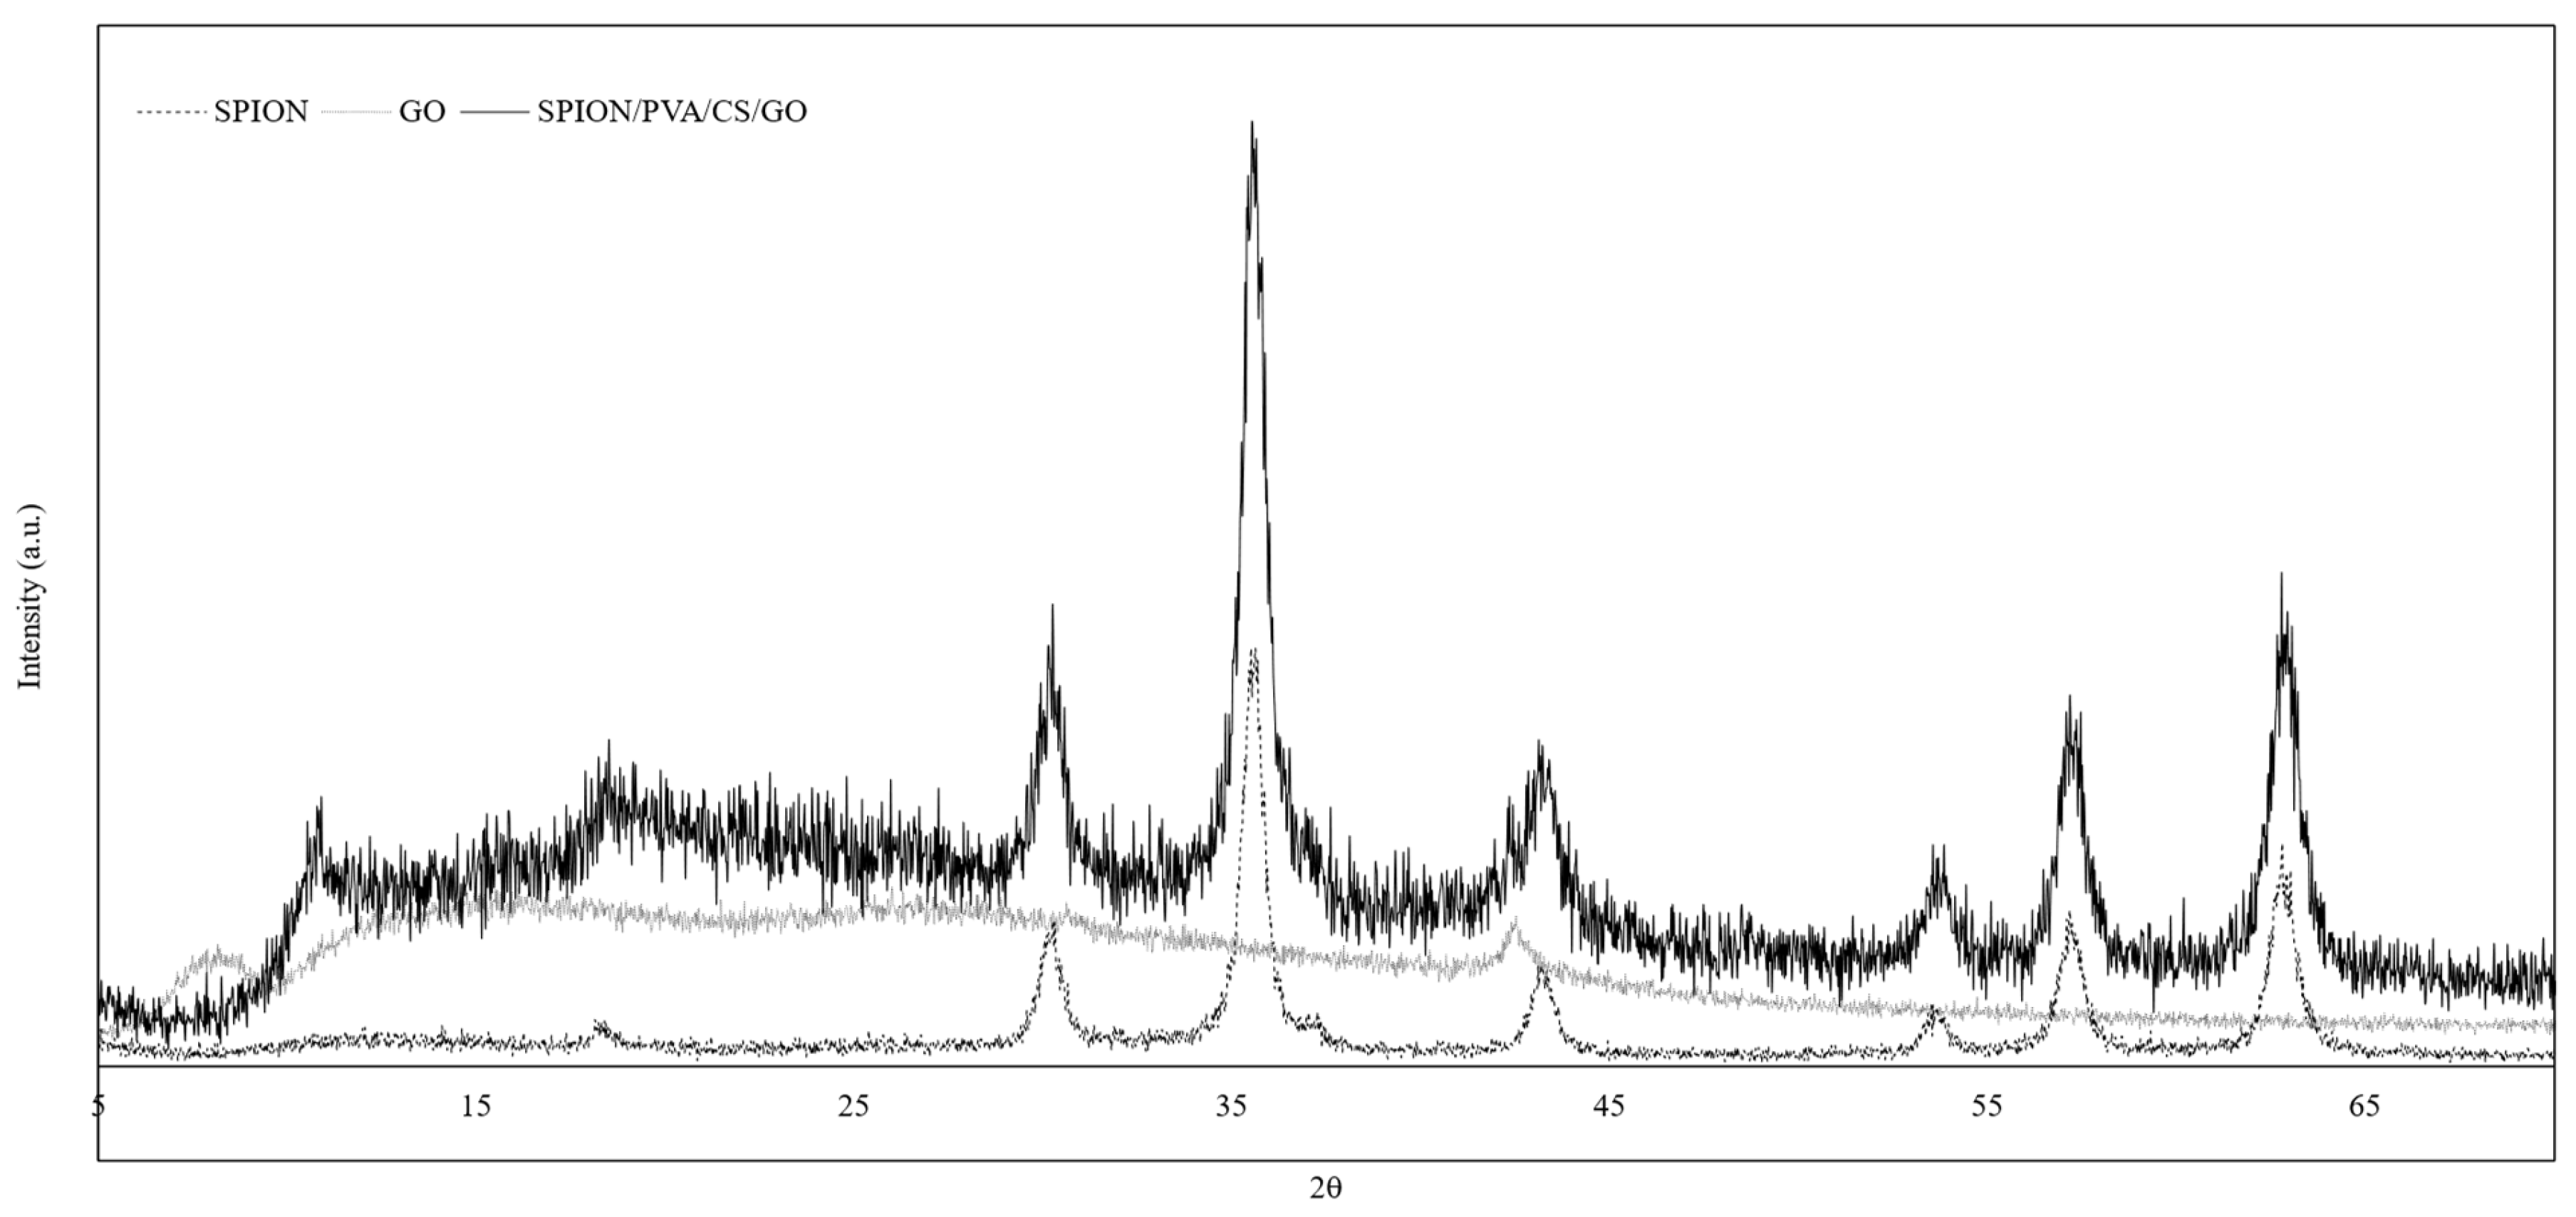
3.3. XRD Analysis
3.4. FTIR Analysis
3.5. VSM Analysis
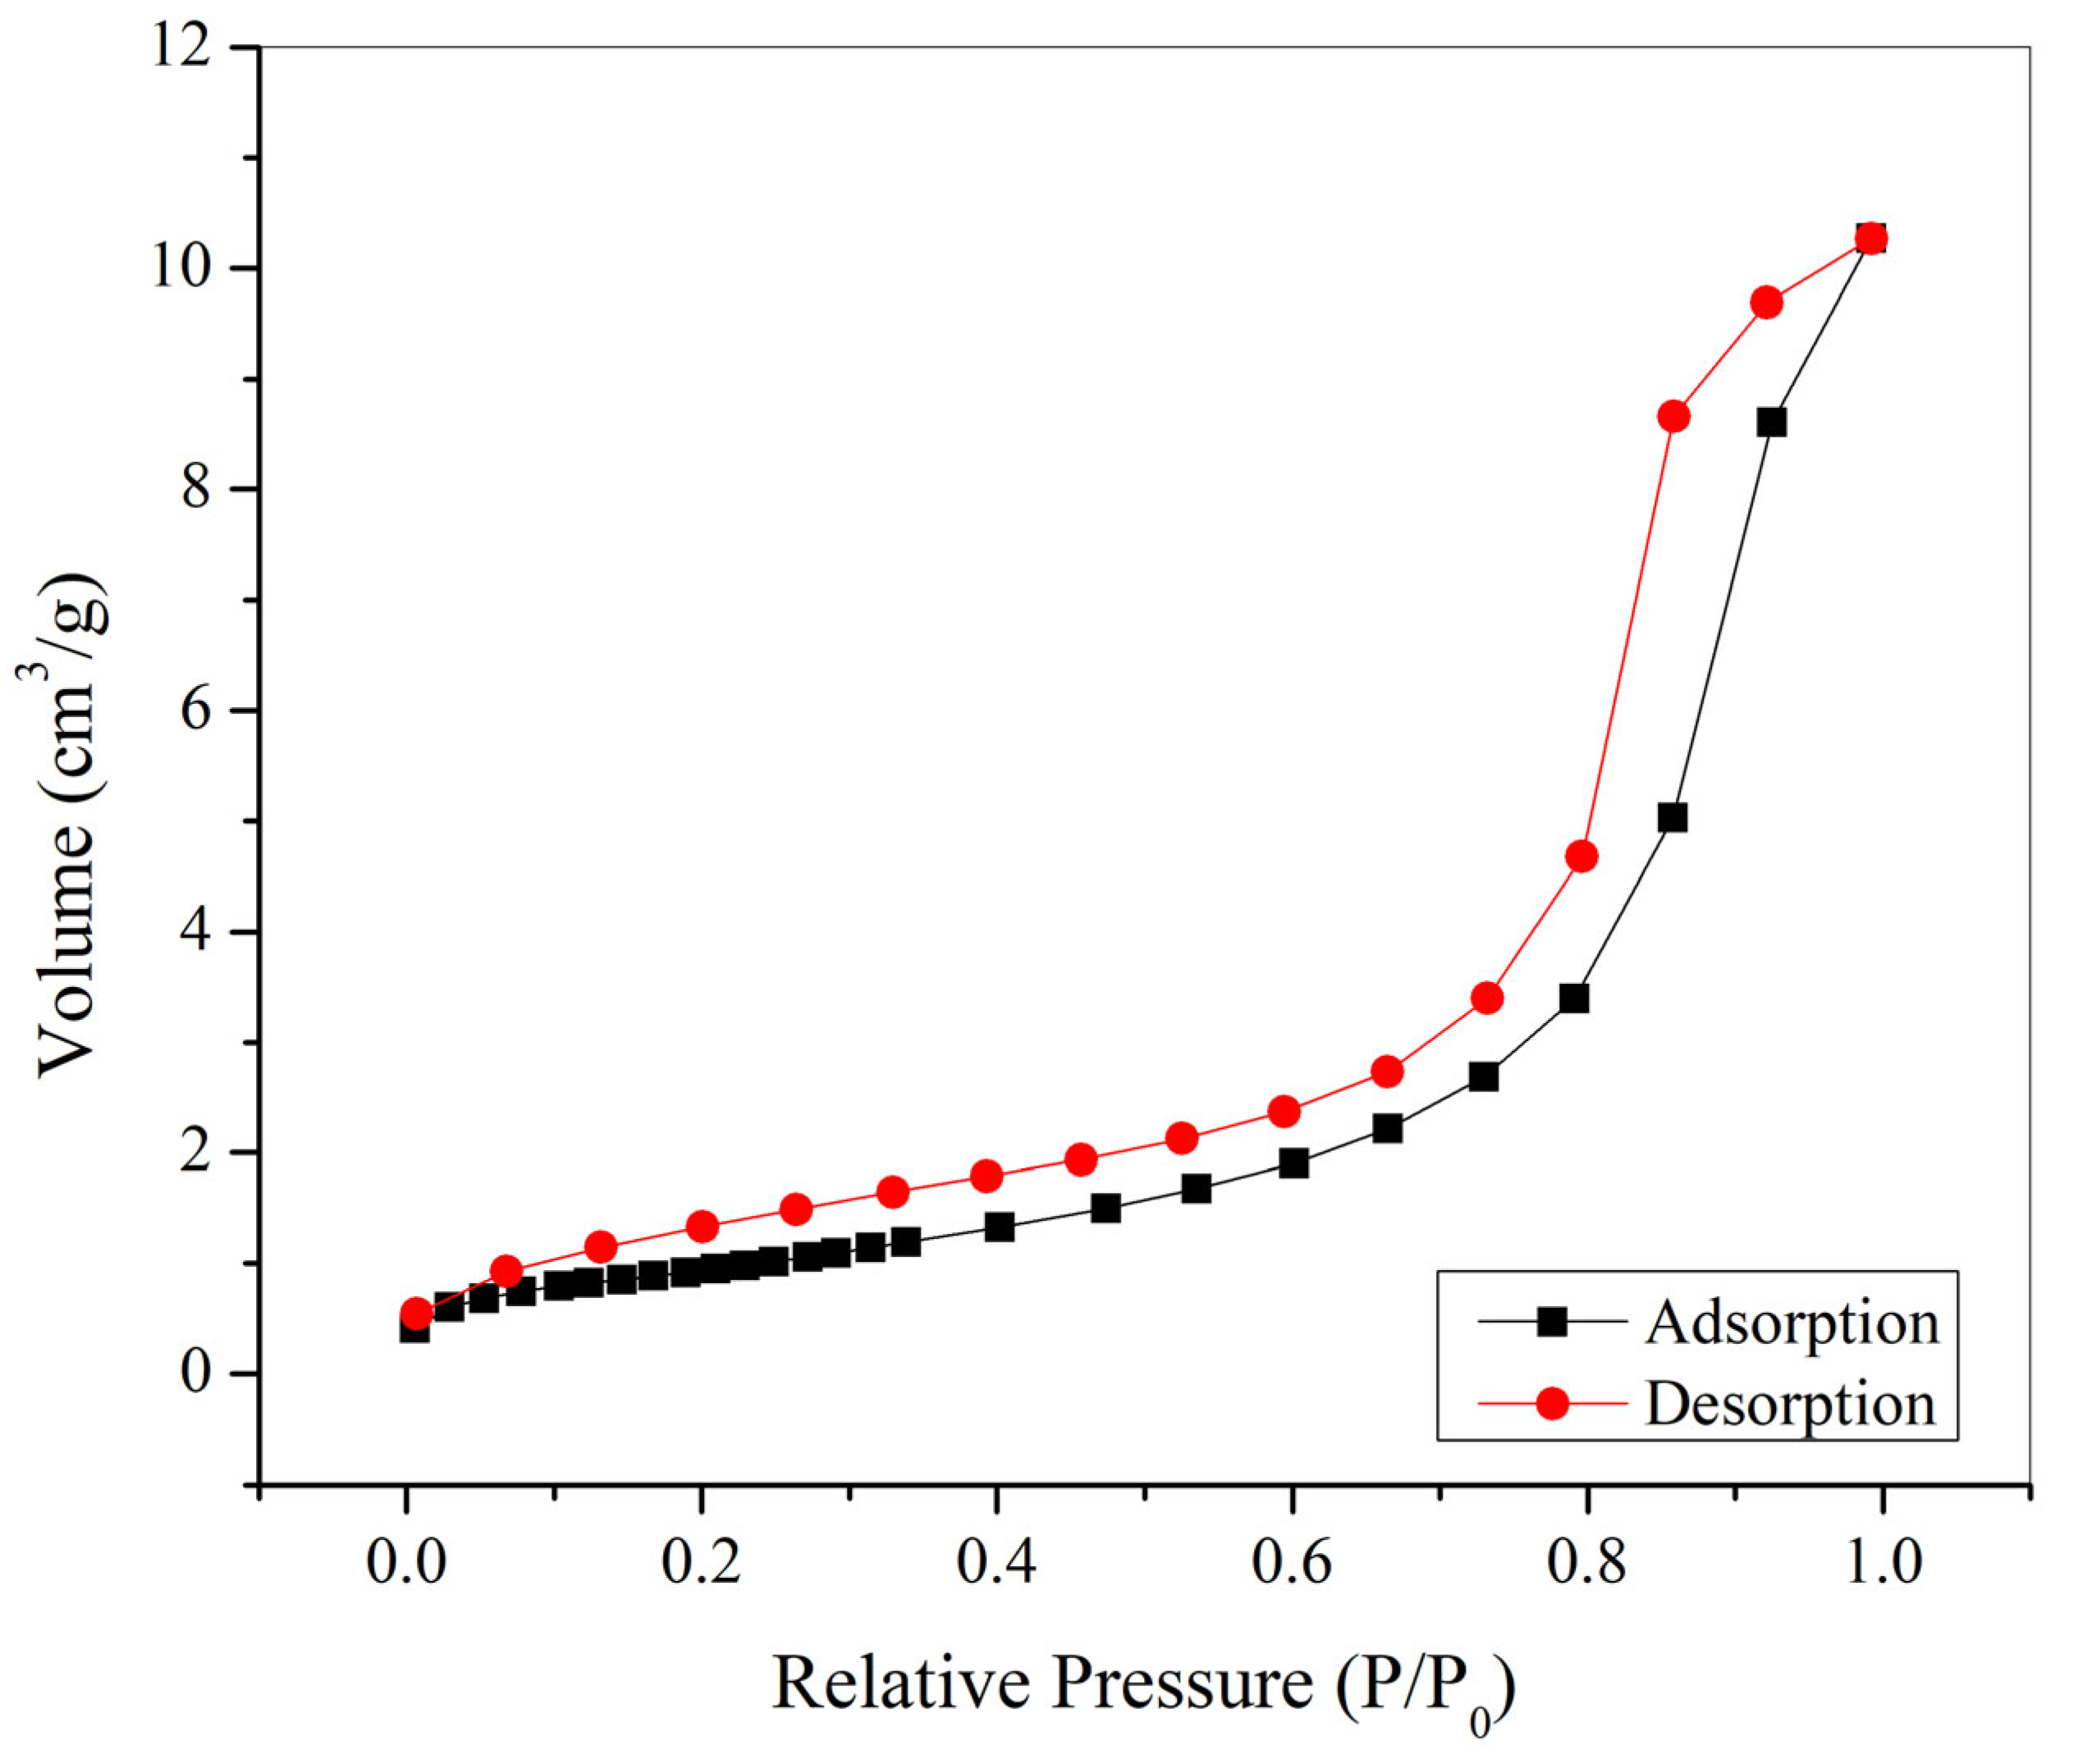
3.6. BJH Analysis
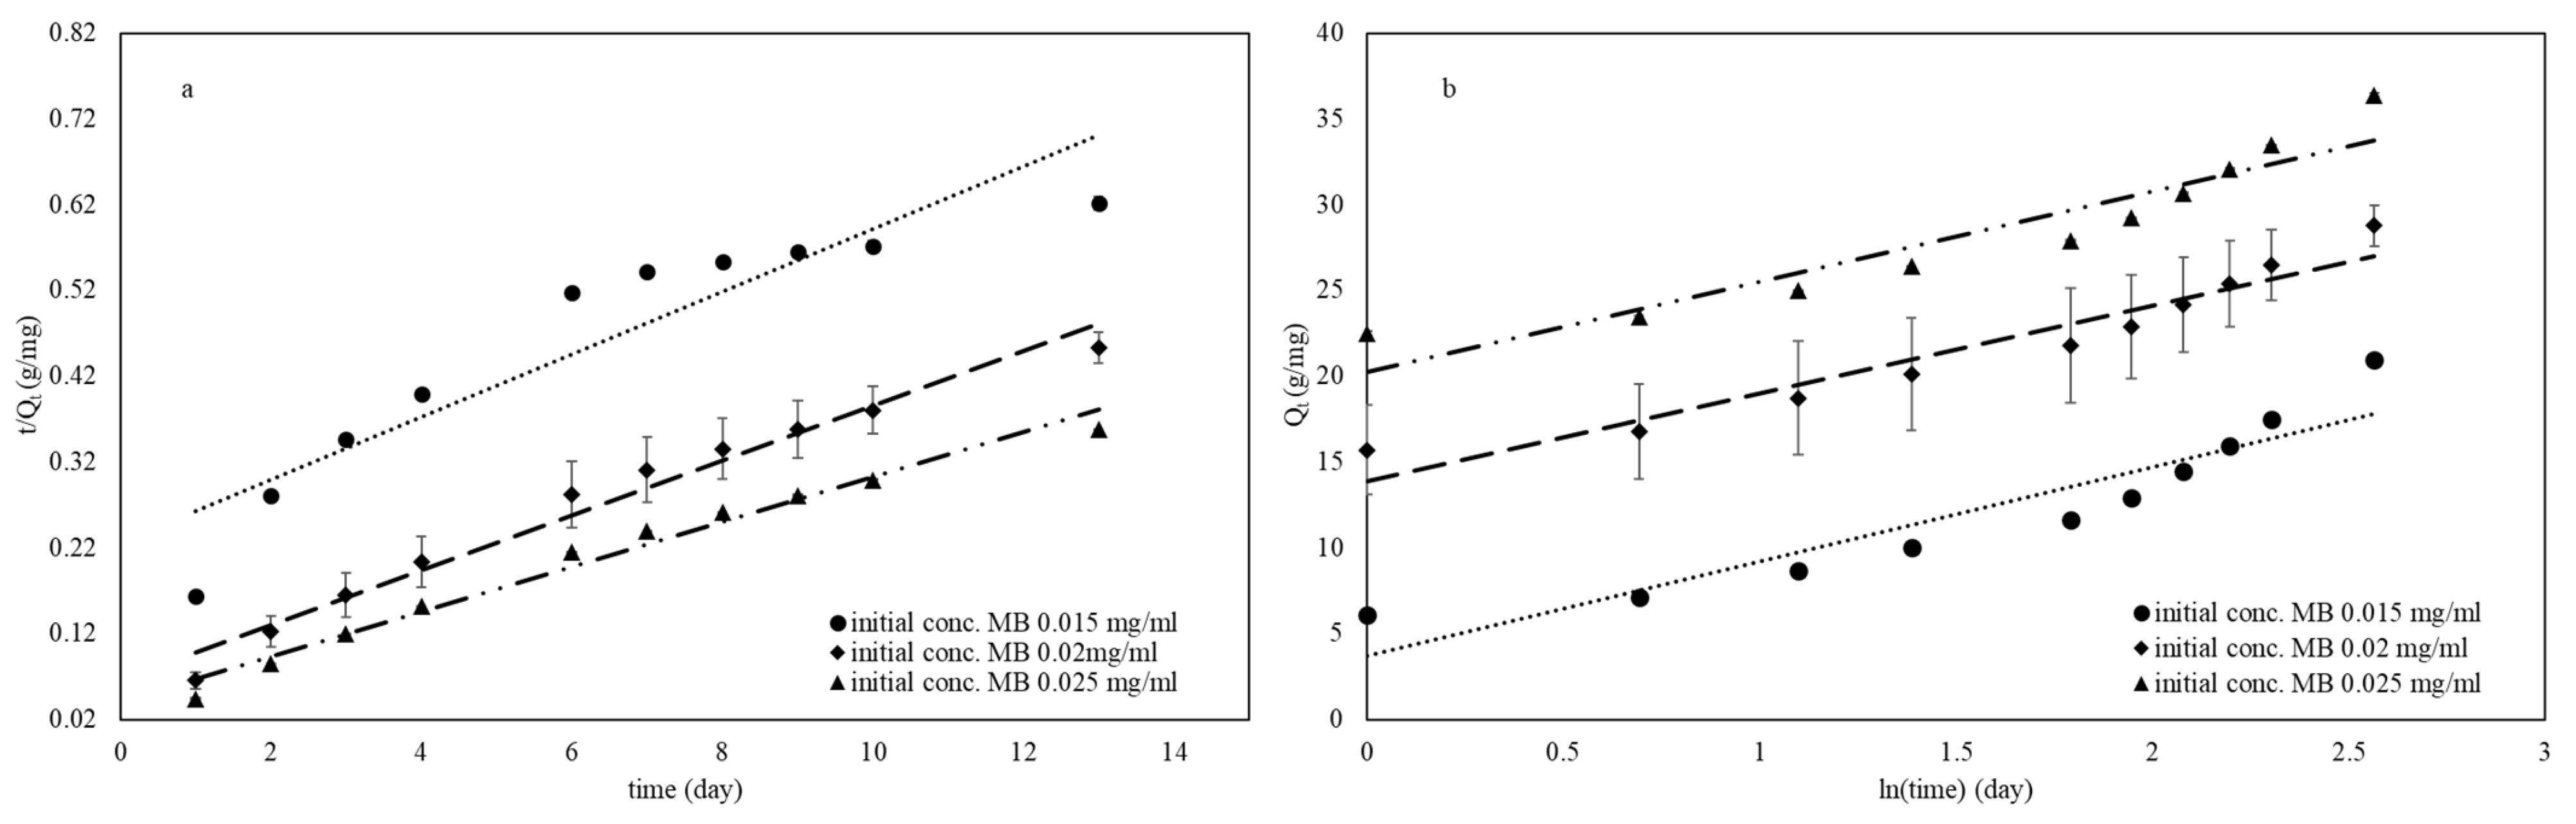
3.7. Adsorption
3.8. Desorption
4. Conclusions
Author Contributions
Funding
Institutional Review Board Statement
Informed Consent Statement
Data Availability Statement
Acknowledgments
Conflicts of Interest
Abbreviations
| initial concentration (mg/mL) | |
| concentration at time t (mg/mL) | |
| sample volume (mL) | |
| mass of the nanoparticles (g) | |
| amount of MB absorbed per unit mass of nanoparticle at the equilibrium (mg/g) | |
| amount of MB absorbed per unit mass of nanoparticle at time t (mg/g) | |
| theoretical initial adsorption rate | |
| theoretical desorption rate | |
| pseudo-first order rate constant (s−1) | |
| pseudo-second order rate constant (s−1) | |
| respective rate constant for adsorption | |
| respective rate constant for desorption | |
| constant related to the free adsorption energy and the reciprocal of the concentration at which half saturation of the adsorbent is reached | |
| theoretical adsorption capacity (mg/g) | |
| constant mass fraction at a time (t) release | |
| released mass fraction at a time (t) | |
| Korsmeyer–Peppas release rate constant | |
| Higuchi release rate constant | |
| Korsmeyer–Peppas release exponent factor | |
| chi-square value | |
| equilibrium aqueous-phase concentration adsorbate (mg/L) | |
| fractional surface coverage | |
| quantity of adsorbate adsorbed in a single monolayer (mg/g) | |
| the amount of MB at equilibrium state |
References
- Al-Tohamy, R.; Ali, S.S.; Li, F.; Okasha, K.M.; Mahmoud, Y.A.-G.; Elsamahy, T.; Jiao, H.; Fu, Y.; Sun, J. A Critical Review on the Treatment of Dye-Containing Wastewater: Ecotoxicological and Health Concerns of Textile Dyes and Possible Remediation Approaches for Environmental Safety. Ecotoxicol. Environ. Saf. 2022, 231, 113160. [Google Scholar] [CrossRef]
- Ali, H. Biodegradation of Synthetic Dyes—A Review. Water Air Soil Pollut. 2010, 213, 251–273. [Google Scholar] [CrossRef]
- Lellis, B.; Fávaro-Polonio, C.Z.; Pamphile, J.A.; Polonio, J.C. Effects of Textile Dyes on Health and the Environment and Bioremediation Potential of Living Organisms. Biotechnol. Res. Innov. 2019, 3, 275–290. [Google Scholar] [CrossRef]
- Saeed, M.; Pecho, R.D.C.; Panchal, S.; Alhag, S.K.; Al-Shuraym, L.A.; Al Syaad, K.M.; Bhutta, U.H. Synthesis of Ag-OMS Catalyst for Sunlight-Assisted Photodegradation of Crystal Violet Dye. Water 2023, 15, 2480. [Google Scholar] [CrossRef]
- Wang, Y.; Gu, X.; Quan, J.; Xing, G.; Yang, L.; Zhao, C.; Wu, P.; Zhao, F.; Hu, B.; Hu, Y. Application of Magnetic Fields to Wastewater Treatment and Its Mechanisms: A Review. Sci. Total Environ. 2021, 773, 145476. [Google Scholar] [CrossRef]
- Damasceno, B.S.; da Silva, A.F.V.; de Araújo, A.C.V. Dye Adsorption onto Magnetic and Superparamagnetic Fe3O4 Nanoparticles: A Detailed Comparative Study. J. Environ. Chem. Eng. 2020, 8, 103994. [Google Scholar] [CrossRef]
- Dada, A.O.; Olalekan, A.P.; Olatunya, A.M.; Dada, O. Langmuir, Freundlich, Temkin and Dubinin–Radushkevich Isotherms Studies of Equilibrium Sorption of Zn 2+ Unto Phosphoric Acid Modified Rice Husk. IOSRJAC J. Appl. Chem. 2012, 3, 38–45. [Google Scholar] [CrossRef]
- Chhetri, T.; Cunningham, G.; Suresh, D.; Shanks, B.; Kannan, R.; Upendran, A.; Afrasiabi, Z. Wastewater Treatment Using Novel Magnetic Nanosponges. Water 2022, 14, 505. [Google Scholar] [CrossRef]
- Santos, T.R.T.; Silva, M.F.; Nishi, L.; Vieira, A.M.S.; Klein, M.R.F.; Andrade, M.B.; Vieira, M.F.; Bergamasco, R. Development of a Magnetic Coagulant Based on Moringa Oleifera Seed Extract for Water Treatment. Environ. Sci. Pollut. Res. 2016, 23, 7692–7700. [Google Scholar] [CrossRef]
- Travlou, N.A.; Kyzas, G.Z.; Lazaridis, N.K.; Deliyanni, E.A. Graphite Oxide/Chitosan Composite for Reactive Dye Removal. Chem. Eng. J. 2013, 217, 256–265. [Google Scholar] [CrossRef]
- Dissanayake, N.S.L.; Pathirana, M.A.; Wanasekara, N.D.; Mahltig, B.; Nandasiri, G.K. Removal of Methylene Blue and Congo Red Using a Chitosan–Graphene Oxide-Electrosprayed Functionalized Polymeric Nanofiber Membrane. Nanomaterials 2023, 13, 1350. [Google Scholar] [CrossRef] [PubMed]
- Kamran, U.; Rhee, K.Y.; Lee, S.-Y.; Park, S.-J. Innovative Progress in Graphene Derivative-Based Composite Hybrid Membranes for the Removal of Contaminants in Wastewater: A Review. Chemosphere 2022, 306, 135590. [Google Scholar] [CrossRef] [PubMed]
- Serga, V.; Burve, R.; Maiorov, M.; Krumina, A.; Skaudžius, R.; Zarkov, A.; Kareiva, A.; Popov, A.I. Impact of Gadolinium on the Structure and Magnetic Properties of Nanocrystalline Powders of Iron Oxides Produced by the Extraction-Pyrolytic Method. Materials 2020, 13, 4147. [Google Scholar] [CrossRef]
- Seabra, A.B.; Pelegrino, M.T.; Haddad, P.S. Antimicrobial Applications of Superparamagnetic Iron Oxide Nanoparticles. In Nanostructures for Antimicrobial Therapy; Elsevier: Amsterdam, The Netherlands, 2017; pp. 531–550. ISBN 978-0-323-46152-8. [Google Scholar]
- Wahajuddin; Arora, S. Superparamagnetic Iron Oxide Nanoparticles: Magnetic Nanoplatforms as Drug Carriers. Int. J. Nanomed. 2012, 7, 3445. [Google Scholar] [CrossRef] [Green Version]
- Liu, M.; Ye, Y.; Ye, J.; Gao, T.; Wang, D.; Chen, G.; Song, Z. Recent Advances of Magnetite (Fe3O4)-Based Magnetic Materials in Catalytic Applications. Magnetochemistry 2023, 9, 110. [Google Scholar] [CrossRef]
- Li, Z.; Sun, Y.; Xing, J.; Meng, A. Fast Removal of Methylene Blue by Fe3O4 Magnetic Nanoparticles and Their Cycling Property. J. Nanosci. Nanotechnol. 2019, 19, 2116–2123. [Google Scholar] [CrossRef] [PubMed]
- Habila, M.A.; Moshab, M.S.; El-Toni, A.M.; ALOthman, Z.A.; Badjah Hadj Ahmed, A.Y. Thermal Fabrication of Magnetic Fe3O4 (Nanoparticle)@Carbon Sheets from Waste Resources for the Adsorption of Dyes: Kinetic, Equilibrium, and UV–Visible Spectroscopy Investigations. Nanomaterials 2023, 13, 1266. [Google Scholar] [CrossRef]
- Wu, K.-H.; Huang, W.-C.; Hung, W.-C.; Tsai, C.-W. Modified Expanded Graphite/Fe3O4 Composite as an Adsorbent of Methylene Blue: Adsorption Kinetics and Isotherms. Mater. Sci. Eng. B 2021, 266, 115068. [Google Scholar] [CrossRef]
- Tishbi, P.; Mosayebi, M.; Salehi, Z.; Fatemi, S.; Faegh, E. Synthesizing Magnetic Graphene Oxide Nanomaterial (GO-FE3O4) and Kinetic Modelling of Methylene Blue Adsorption from Water. Can. J. Chem. Eng. 2022, 100, 3321–3334. [Google Scholar] [CrossRef]
- Samrot, A.V.; Ali, H.H.; Selvarani, A.J.; Faradjeva Raji, P.; Prakash, P.; Kumar, S.S. Adsorption Efficiency of Chemically Synthesized Superparamagnetic Iron Oxide Nanoparticles (SPIONs) on Crystal Violet Dye. Curr. Res. Green Sustain. Chem. 2021, 4, 100066. [Google Scholar] [CrossRef]
- Li, L.; Duan, H.; Wang, X.; Luo, C. Fabrication of Novel Magnetic Nanocomposite with a Number of Adsorption Sites for the Removal of Dye. Int. J. Biol. Macromol. 2015, 78, 17–22. [Google Scholar] [CrossRef]
- Pandey, N.; Surana, S.; Shukla, S.K.; Singh, N.B. Methylene Blue Removal on Nano-Fe3O4 /Poly(Vinyl Alcohol)/Polyacrylamide Hydrogel. Emerg. Mater. Res. 2017, 6, 305–313. [Google Scholar] [CrossRef]
- Doan, L.; Lu, Y.; Karatela, M.; Phan, V.; Jeffryes, C.; Benson, T.; Wujcik, E.K. Surface Modifications of Superparamagnetic Iron Oxide Nanoparticles with Polylactic Acid-Polyethylene Glycol Diblock Copolymer and Graphene Oxide for a Protein Delivery Vehicle. Eng. Sci. 2019, 7, 10–16. [Google Scholar] [CrossRef] [Green Version]
- Zhang, X.; Li, Y.; He, Y.; Kong, D.; Klein, B.; Yin, S.; Zhao, H. Preparation of Magnetic Activated Carbon by Activation and Modification of Char Derived from Co-Pyrolysis of Lignite and Biomass and Its Adsorption of Heavy-Metal-Containing Wastewater. Minerals 2022, 12, 665. [Google Scholar] [CrossRef]
- Farhana, A.; Jenifer Selvarani, A.; Samrot, A.V.; Alsrhani, A.; Raji, P.; Sahithya, C.S.; Jane Cypriyana, P.J.; Senthilkumar, P.; Ling, M.P.; Yishak, S. Utilization of Superparamagnetic Iron Oxide Nanoparticles (SPIONs) Impregnated Activated Carbon for Removal of Hexavalent Chromium. J. Nanomater. 2022, 2022, 4326939. [Google Scholar] [CrossRef]
- Le, T.D.; Tran, L.T.; Dang, H.T.M.; Tran, T.T.H.; Tran, H.V. Graphene Oxide/Polyvinyl Alcohol/Fe3O4 Nanocomposite: An Efficient Adsorbent for Co(II) Ion Removal. J. Anal. Methods Chem. 2021, 2021, 1–10. [Google Scholar] [CrossRef]
- Doble, M.; Kumar, A. Degradation of Polymers. In Biotreatment of Industrial Effluents; Elsevier: Amsterdam, The Netherlands, 2005; pp. 101–110. ISBN 978-0-7506-7838-4. [Google Scholar]
- Nguyen, T.T.; Phung, T.K.; Bui, X.-T.; Doan, V.-D.; Tran, T.V.; Nguyen, D.V.; Lim, K.T.; Nguyen, T.D. Removal of Cationic Dye Using Polyvinyl Alcohol Membrane Functionalized by D-Glucose and Agar. J. Water Process Eng. 2021, 40, 101982. [Google Scholar] [CrossRef]
- Jun, L.Y.; Mubarak, N.M.; Yon, L.S.; Bing, C.H.; Khalid, M.; Jagadish, P.; Abdullah, E.C. Immobilization of Peroxidase on Functionalized MWCNTs-Buckypaper/Polyvinyl Alcohol Nanocomposite Membrane. Sci. Rep. 2019, 9, 2215. [Google Scholar] [CrossRef] [Green Version]
- Merdas, S.; Al-Graiti, W.; Al-Ameer, A. Using PVA@WNS Composite as Adsorbent for Methylene Blue Dye from Aqueous Solutions. J. Med. Chem. Sci. 2022, 5, 1289–1298. [Google Scholar]
- Al Naim, A.F.; El-Shamy, A.G. A New Reusable Adsorbent of Polyvinyl Alcohol/Magnesium Peroxide (PVA/MgO2) for Highly Selective Adsorption and Dye Removal. Mater. Chem. Phys. 2021, 270, 124820. [Google Scholar] [CrossRef]
- Yang, X.; Li, Y.; Du, Q.; Wang, X.; Hu, S.; Chen, L.; Wang, Z.; Xia, Y.; Xia, L. Adsorption of Methylene Blue from Aqueous Solutions by Polyvinyl Alcohol/Graphene Oxide Composites. J. Nanosci. Nanotechnol. 2016, 16, 1775–1782. [Google Scholar] [CrossRef] [PubMed]
- Sakkayawong, N.; Thiravetyan, P.; Nakbanpote, W. Adsorption Mechanism of Synthetic Reactive Dye Wastewater by Chitosan. J. Colloid Interface Sci. 2005, 286, 36–42. [Google Scholar] [CrossRef]
- Doondani, P.; Jugade, R.; Gomase, V.; Shekhawat, A.; Bambal, A.; Pandey, S. Chitosan/Graphite/Polyvinyl Alcohol Magnetic Hydrogel Microspheres for Decontamination of Reactive Orange 16 Dye. Water 2022, 14, 3411. [Google Scholar] [CrossRef]
- Sekhavat Pour, Z.; Ghaemy, M. Removal of Dyes and Heavy Metal Ions from Water by Magnetic Hydrogel Beads Based on Poly(Vinyl Alcohol)/Carboxymethyl Starch-g-Poly(Vinyl Imidazole). RSC Adv. 2015, 5, 64106–64118. [Google Scholar] [CrossRef]
- Bryan, M.Y.K.; Chai, P.V.; Law, J.Y.; Mahmoudi, E. Graphene Oxide-Chitosan Composite Material as Adsorbent in Removing Methylene Blue Dye from Synthetic Wastewater. Mater. Today Proc. 2022, 64, 1587–1596. [Google Scholar] [CrossRef]
- Dissanayake, N.S.L.; Pathirana, M.A.; Wanasekara, N.D.; Nandasiri, G.K. Chitosan-Graphene Oxide Composite Membrane for Methylene Blue Removal. In Proceedings of the 2022 Moratuwa Engineering Research Conference (MERCon), Moratuwa, Sri Lanka, 27–29 July 2022; IEEE: Moratuwa, Sri Lanka, 2022; pp. 1–6. [Google Scholar]
- Aranaz, I.; Alcántara, A.R.; Civera, M.C.; Arias, C.; Elorza, B.; Heras Caballero, A.; Acosta, N. Chitosan: An Overview of Its Properties and Applications. Polymers 2021, 13, 3256. [Google Scholar] [CrossRef] [PubMed]
- Yang, S.-T.; Luo, J.; Liu, J.-H.; Zhou, Q.; Wan, J.; Ma, C.; Liao, R.; Wang, H.; Liu, Y. Graphene Oxide/Chitosan Composite for Methylene Blue Adsorption. Nanosci. Nanotechnol. Lett. 2013, 5, 372–376. [Google Scholar] [CrossRef] [Green Version]
- Chiou, M.-S.; Ho, P.-Y.; Li, H.-Y. Adsorption of Anionic Dyes in Acid Solutions Using Chemically Cross-Linked Chitosan Beads. Dye. Pigment. 2004, 60, 69–84. [Google Scholar] [CrossRef]
- Zainal, Z.; Hui, L.K.; Hussein, M.Z.; Abdullah, A.H.; Hamadneh, I. (Moh’d K.R. Characterization of TiO2–Chitosan/Glass Photocatalyst for the Removal of a Monoazo Dye via Photodegradation–Adsorption Process. J. Hazard. Mater. 2009, 164, 138–145. [Google Scholar] [CrossRef]
- Sureshkumar, V.; Kiruba Daniel, S.C.G.; Ruckmani, K.; Sivakumar, M. Fabrication of Chitosan–Magnetite Nanocomposite Strip for Chromium Removal. Appl. Nanosci. 2016, 6, 277–285. [Google Scholar] [CrossRef] [Green Version]
- Thakre, D.; Jagtap, S.; Sakhare, N.; Labhsetwar, N.; Meshram, S.; Rayalu, S. Chitosan Based Mesoporous Ti–Al Binary Metal Oxide Supported Beads for Defluoridation of Water. Chem. Eng. J. 2010, 158, 315–324. [Google Scholar] [CrossRef]
- Moradi Dehaghi, S.; Rahmanifar, B.; Moradi, A.M.; Azar, P.A. Removal of Permethrin Pesticide from Water by Chitosan–Zinc Oxide Nanoparticles Composite as an Adsorbent. J. Saudi Chem. Soc. 2014, 18, 348–355. [Google Scholar] [CrossRef] [Green Version]
- Nechita, P. Applications of Chitosan in Wastewater Treatment. In Biological Activities and Application of Marine Polysaccharides; Shalaby, E.A., Ed.; InTech: Singapore, 2017; ISBN 978-953-51-2859-5. [Google Scholar]
- Saputra, E.; Saputra, R.; Nugraha, M.W.; Irianty, R.S.; Utama, P.S. Removal of Methylene Blue from Aqueous Solution Using Spent Bleaching Earth. IOP Conf. Ser. Mater. Sci. Eng. 2018, 345, 012008. [Google Scholar] [CrossRef]
- Kallel, F.; Chaari, F.; Bouaziz, F.; Bettaieb, F.; Ghorbel, R.; Chaabouni, S.E. Sorption and Desorption Characteristics for the Removal of a Toxic Dye, Methylene Blue from Aqueous Solution by a Low Cost Agricultural by-Product. J. Mol. Liq. 2016, 219, 279–288. [Google Scholar] [CrossRef]
- Assémian, A.S.; Kouassi, K.E.; Adouby, K.; Drogui, P.; Boa, D. Removal of Methylene Blue in Aqueous Solutions by Electrocoagulation Process: Adsorption, Kinetics, Studies. Eur. J. Chem. 2018, 9, 311–316. [Google Scholar] [CrossRef] [Green Version]
- Mak, S.-Y.; Chen, D.-H. Fast Adsorption of Methylene Blue on Polyacrylic Acid-Bound Iron Oxide Magnetic Nanoparticles. Dye. Pigment. 2004, 61, 93–98. [Google Scholar] [CrossRef]
- Yu, J.-X.; Chi, R.-A.; Guo, J.; Zhang, Y.-F.; Xu, Z.-G.; Xiao, C.-Q. Desorption and Photodegradation of Methylene Blue from Modified Sugarcane Bagasse Surface by Acid TiO2 Hydrosol. Appl. Surf. Sci. 2012, 258, 4085–4090. [Google Scholar] [CrossRef]
- Jin, H.; Zhang, Y.; Wang, Q.; Chang, Q.; Li, C. Rapid Removal of Methylene Blue and Nickel Ions and Adsorption/Desorption Mechanism Based on Geopolymer Adsorbent. Colloid Interface Sci. Commun. 2021, 45, 100551. [Google Scholar] [CrossRef]
- Alvarez-Torrellas, S.; Boutahala, M.; Boukhalfa, N.; Munoz, M. Effective Adsorption of Methylene Blue Dye onto Magnetic Nanocomposites. Modeling and Reuse Studies. Appl. Sci. 2019, 9, 4563. [Google Scholar] [CrossRef] [Green Version]
- Rathour, R.K.S.; Bhattacharya, J. A Green Approach for Single-Pot Synthesis of Graphene Oxide and Its Composite with Mn3O4. Appl. Surf. Sci. 2018, 437, 41–50. [Google Scholar] [CrossRef]
- Hummers, W.S.; Offeman, R.E. Preparation of Graphitic Oxide. J. Am. Chem. Soc. 1958, 80, 1339. [Google Scholar] [CrossRef]
- Papadimitriou, S.; Bikiaris, D. Novel Self-Assembled Core–Shell Nanoparticles Based on Crystalline Amorphous Moieties of Aliphatic Copolyesters for Efficient Controlled Drug Release. J. Control. Release 2009, 138, 177–184. [Google Scholar] [CrossRef] [PubMed]
- Sahoo, T.R.; Prelot, B. Adsorption Processes for the Removal of Contaminants from Wastewater. In Nanomaterials for the Detection and Removal of Wastewater Pollutants; Elsevier: Amsterdam, The Netherlands, 2020; pp. 161–222. ISBN 978-0-12-818489-9. [Google Scholar]
- Bayazit, Ş.S. Magnetic Multi-Wall Carbon Nanotubes for Methyl Orange Removal from Aqueous Solutions: Equilibrium, Kinetic and Thermodynamic Studies. Sep. Sci. Technol. 2014, 49, 1389–1400. [Google Scholar] [CrossRef]
- Yusuf, M.S.; Rahmasari, R. Synthesis Processing Condition Optimization of Citrate Stabilized Superparamagnetic Iron Oxide Nanoparticles Using Direct Co-Precipitation Method. Biomed. Pharmacol. J. 2021, 14, 1533–1542. [Google Scholar] [CrossRef]
- Mathematical Models of Drug Release. In Strategies to Modify the Drug Release from Pharmaceutical Systems; Elsevier: Amsterdam, The Netherlands, 2015; pp. 63–86. ISBN 978-0-08-100092-2.
- El-Araby, H.A.; Ibrahim, A.M.M.A.; Mangood, A.H.; Abdel-Rahman, A.A.-H. Sesame Husk as Adsorbent for Copper(II) Ions Removal from Aqueous Solution. J. Geosci. Environ. Prot. 2017, 5, 109–152. [Google Scholar] [CrossRef] [Green Version]
- Ai, L.; Zhang, C.; Liao, F.; Wang, Y.; Li, M.; Meng, L.; Jiang, J. Removal of Methylene Blue from Aqueous Solution with Magnetite Loaded Multi-Wall Carbon Nanotube: Kinetic, Isotherm and Mechanism Analysis. J. Hazard. Mater. 2011, 198, 282–290. [Google Scholar] [CrossRef]
- Semnani, D. Geometrical Characterization of Electrospun Nanofibers. In Electrospun Nanofibers; Elsevier: Amsterdam, The Netherlands, 2017; pp. 151–180. ISBN 978-0-08-100907-9. [Google Scholar]
- Zhao, Y.; Qiu, Z.; Huang, J. Preparation and Analysis of Fe3O4 Magnetic Nanoparticles Used as Targeted-Drug Carriers. Chin. J. Chem. Eng. 2008, 16, 451–455. [Google Scholar] [CrossRef]
- Saragi, T.; Depi, B.L.; Butarbutar, S.; Permana, B. Risdiana The Impact of Synthesis Temperature on Magnetite Nanoparticles Size Synthesized by Co-Precipitation Method. J. Phys. Conf. Ser. 2018, 1013, 012190. [Google Scholar] [CrossRef]
- Mohammadi, A.; Barikani, M. Synthesis and Characterization of Superparamagnetic Fe3O4 Nanoparticles Coated with Thiodiglycol. Mater. Charact. 2014, 90, 88–93. [Google Scholar] [CrossRef]
- Loh, K.-S.; Lee, Y.; Musa, A.; Salmah, A.; Zamri, I. Use of Fe3O4 Nanoparticles for Enhancement of Biosensor Response to the Herbicide 2,4-Dichlorophenoxyacetic Acid. Sensors 2008, 8, 5775–5791. [Google Scholar] [CrossRef] [Green Version]
- Gong, J.; Lin, X. Facilitated Electron Transfer of Hemoglobin Embedded in Nanosized Fe3O4 Matrix Based on Paraffin Impregnated Graphite Electrode and Electrochemical Catalysis for Trichloroacetic Acid. Microchem. J. 2003, 75, 51–57. [Google Scholar] [CrossRef]
- Liao, M.-H.; Chen, D.-H. Immobilization of Yeast Alcohol Dehydrogenase on Magnetic Nanoparticles for Improving Its Stability. Biotechnol. Lett. 2001, 23, 1723–1727. [Google Scholar] [CrossRef]
- Monshi, A.; Foroughi, M.R.; Monshi, M.R. Modified Scherrer Equation to Estimate More Accurately Nano-Crystallite Size Using XRD. World J. Nano Sci. Eng. 2012, 02, 154–160. [Google Scholar] [CrossRef] [Green Version]
- Khan, S.; Bibi, G.; Dilbar, S.; Iqbal, A.; Ahmad, M.; Ali, A.; Ullah, Z.; Jaremko, M.; Iqbal, J.; Ali, M.; et al. Biosynthesis and Characterization of Iron Oxide Nanoparticles from Mentha Spicata and Screening Its Combating Potential against Phytophthora Infestans. Front. Plant Sci. 2022, 13, 1001499. [Google Scholar] [CrossRef] [PubMed]
- Sodipo, B.K.; Aziz, A.A. A Sonochemical Approach to the Direct Surface Functionalization of Superparamagnetic Iron Oxide Nanoparticles with (3-Aminopropyl)Triethoxysilane. Beilstein J. Nanotechnol. 2014, 5, 1472–1476. [Google Scholar] [CrossRef] [Green Version]
- Jalilian, A.R.; Panahifar, A.; Mahmoudi, M.; Akhlaghi, M.; Simchi, A. Preparation and Biological Evaluation of [67Ga]-Labeled-Superparamagnetic Nanoparticles in Normal Rats. Radiochim. Acta 2009, 97, 51–56. [Google Scholar] [CrossRef]
- Rahimnia, R.; Salehi, Z.; Ardestani, M.S.; Doosthoseini, H. SPION Conjugated Curcumin Nano-Imaging Probe: Synthesis and Bio-Physical Evaluation. Iran J. Pharm. Res. 2019, 18, 183–197. [Google Scholar] [PubMed]
- Bhat, N.V.; Nate, M.M.; Kurup, M.B.; Bambole, V.A.; Sabharwal, S. Effect of γ-Radiation on the Structure and Morphology of Polyvinyl Alcohol Films. Nucl. Instrum. Methods Phys. Res. Sect. B Beam Interact. Mater. At. 2005, 237, 585–592. [Google Scholar] [CrossRef]
- Lee, J.; Isobe, T.; Senna, M. Preparation of Ultrafine Fe3O4Particles by Precipitation in the Presence of PVA at High PH. J. Colloid Interface Sci. 1996, 177, 490–494. [Google Scholar] [CrossRef]
- Kharazmi, A.; Faraji, N.; Mat Hussin, R.; Saion, E.; Yunus, W.M.M.; Behzad, K. Structural, Optical, Opto-Thermal and Thermal Properties of ZnS–PVA Nanofluids Synthesized through a Radiolytic Approach. Beilstein J. Nanotechnol. 2015, 6, 529–536. [Google Scholar] [CrossRef] [Green Version]
- Palpandi, C.; Shanmugam, V.; Shanmugam, A. Extraction of Chitin and Chitosan from Shell and Operculum of Mangrove Gastropod Nerita (Dostia) Crepidularia Lamarck. Int. J. Med. Med. Sci. 2009, 1, 198–205. [Google Scholar]
- Varma, R.; Vasudevan, S. Extraction, Characterization, and Antimicrobial Activity of Chitosan from Horse Mussel Modiolus modiolus. ACS Omega 2020, 5, 20224–20230. [Google Scholar] [CrossRef] [PubMed]
- Khalili, D. Graphene Oxide: A Promising Carbocatalyst for the Regioselective Thiocyanation of Aromatic Amines, Phenols, Anisols and Enolizable Ketones by Hydrogen Peroxide/KSCN in Water. New J. Chem. 2016, 40, 2547–2553. [Google Scholar] [CrossRef]
- Prodan, D.; Moldovan, M.; Furtos, G.; Saroși, C.; Filip, M.; Perhaița, I.; Carpa, R.; Popa, M.; Cuc, S.; Varvara, S.; et al. Synthesis and Characterization of Some Graphene Oxide Powders Used as Additives in Hydraulic Mortars. Appl. Sci. 2021, 11, 11330. [Google Scholar] [CrossRef]
- Çiplak, Z.; Yildiz, N.; Çalimli, A. Investigation of Graphene/Ag Nanocomposites Synthesis Parameters for Two Different Synthesis Methods. Fuller. Nanotub. Carbon Nanostruct. 2015, 23, 361–370. [Google Scholar] [CrossRef]
- Andrijanto, E.; Shoelarta, S.; Subiyanto, G.; Rifki, S. Facile Synthesis of Graphene from Graphite Using Ascorbic Acid as Reducing Agent. In Proceedings of the AIP Conference Proceedings, Semarang, Indonesia, 6–7 October 2016; p. 020003. [Google Scholar]
- Ali, H.; Ismail, A.M. Fabrication of Magnetic Fe3O4/Polypyrrole/Carbon Black Nanocomposite for Effective Uptake of Congo Red and Methylene Blue Dye: Adsorption Investigation and Mechanism. J. Polym. Environ. 2023, 31, 976–998. [Google Scholar] [CrossRef]
- Paramarta, V.; Kristianto, Y.; Taufik, A.; Saleh, R. Improve Sonocatalytic Performance Using Modified Semiconductor Catalyst SnO2 and ZrO2 by Magnetite Materials. IOP Conf. Ser. Mater. Sci. Eng. 2017, 188, 012042. [Google Scholar] [CrossRef]
- Esmaeili, H.; Tamjidi, S. Ultrasonic-Assisted Synthesis of Natural Clay/Fe3O4/Graphene Oxide for Enhance Removal of Cr (VI) from Aqueous Media. Environ. Sci. Pollut. Res. 2020, 27, 31652–31664. [Google Scholar] [CrossRef]
- DemiRel Topel, S.; Gürkan Polat, T. pH-responsive carboxymethyl cellulose conjugated superparamagnetic iron oxide nanocarriers. J. Sci. Perspect. 2019, 3, 99–110. [Google Scholar] [CrossRef] [Green Version]
- Munasir; Kusumawati, R.P. Synthesis and Characterization of Fe3O4@rGO Composite with Wet-Mixing (Ex-Situ) Process. J. Phys. Conf. Ser. 2019, 1171, 012048. [Google Scholar] [CrossRef]
- Norouzian Baghani, A.; Mahvi, A.H.; Gholami, M.; Rastkari, N.; Delikhoon, M. One-Pot Synthesis, Characterization and Adsorption Studies of Amine-Functionalized Magnetite Nanoparticles for Removal of Cr (VI) and Ni (II) Ions from Aqueous Solution: Kinetic, Isotherm and Thermodynamic Studies. J. Environ. Health Sci. Eng. 2016, 14, 11. [Google Scholar] [CrossRef] [Green Version]
- Adeyeye, A.O.; Shimon, G. Growth and Characterization of Magnetic Thin Film and Nanostructures. In Handbook of Surface Science; Elsevier: Amsterdam, The Netherlands, 2015; ISBN 978-0-444-62634-9. Volume 5, pp. 1–41. [Google Scholar]
- Mullens, S. Vibrating Sample Magnetometer. Rev. Sci. Instrum. 1956, 27, 548. [Google Scholar]
- Shalaby, T.I.; Fikrt, N.M.; Mohamed, M.M.; El Kady, M.F. Preparation and Characterization of Iron Oxide Nanoparticles Coated with Chitosan for Removal of Cd(II) and Cr(VI) from Aqueous Solution. Water Sci. Technol. 2014, 70, 1004–1010. [Google Scholar] [CrossRef]
- Sayahi, M.H.; Sepahdar, A.; Bazrafkan, F.; Dehghani, F.; Mahdavi, M.; Bahadorikhalili, S. Ionic Liquid Modified SPION@Chitosan as a Novel and Reusable Superparamagnetic Catalyst for Green One-Pot Synthesis of Pyrido [2,3-d]Pyrimidine-Dione Derivatives in Water. Catalysts 2023, 13, 290. [Google Scholar] [CrossRef]
- Maldonado-Camargo, L.; Unni, M.; Rinaldi, C. Magnetic Characterization of Iron Oxide Nanoparticles for Biomedical Applications. In Biomedical Nanotechnology; Petrosko, S.H., Day, E.S., Eds.; Methods in Molecular Biology; Springer: New York, NY, USA, 2017; ISBN 978-1-4939-6838-1. Volume 1570, pp. 47–71. [Google Scholar]
- Heydari Sheikh Hossein, H.; Jabbari, I.; Zarepour, A.; Zarrabi, A.; Ashrafizadeh, M.; Taherian, A.; Makvandi, P. Functionalization of Magnetic Nanoparticles by Folate as Potential MRI Contrast Agent for Breast Cancer Diagnostics. Molecules 2020, 25, 4053. [Google Scholar] [CrossRef] [PubMed]
- Thommes, M.; Kaneko, K.; Neimark, A.V.; Olivier, J.P.; Rodriguez-Reinoso, F.; Rouquerol, J.; Sing, K.S.W. Physisorption of Gases, with Special Reference to the Evaluation of Surface Area and Pore Size Distribution (IUPAC Technical Report). Pure Appl. Chem. 2015, 87, 1051–1069. [Google Scholar] [CrossRef] [Green Version]
- Sotomayor, F.J.; Cychosz, K.A.; Thommes, M. Characterization of Micro/Mesoporous Materials by Physisorption: Concepts and Case Studies. Acc. Mater. Surf. Res. 2018, 3, 34–50. [Google Scholar]
- Dai, H.; Huang, Y.; Huang, H. Eco-Friendly Polyvinyl Alcohol/Carboxymethyl Cellulose Hydrogels Reinforced with Graphene Oxide and Bentonite for Enhanced Adsorption of Methylene Blue. Carbohydr. Polym. 2018, 185, 1–11. [Google Scholar] [CrossRef]
- Yao, Y.; Xu, F.; Chen, M.; Xu, Z.; Zhu, Z. Adsorption Behavior of Methylene Blue on Carbon Nanotubes. Bioresour. Technol. 2010, 101, 3040–3046. [Google Scholar] [CrossRef]
- Sharma, G.; Kumar, A.; Naushad, M.; García-Peñas, A.; Al-Muhtaseb, A.H.; Ghfar, A.A.; Sharma, V.; Ahamad, T.; Stadler, F.J. Fabrication and Characterization of Gum Arabic-Cl-Poly(Acrylamide) Nanohydrogel for Effective Adsorption of Crystal Violet Dye. Carbohydr. Polym. 2018, 202, 444–453. [Google Scholar] [CrossRef]
- Sharma, G.; Kumar, A.; Devi, K.; Sharma, S.; Naushad, M.; Ghfar, A.A.; Ahamad, T.; Stadler, F.J. Guar Gum-Crosslinked-Soya Lecithin Nanohydrogel Sheets as Effective Adsorbent for the Removal of Thiophanate Methyl Fungicide. Int. J. Biol. Macromol. 2018, 114, 295–305. [Google Scholar] [CrossRef] [PubMed]
- Tan, K.L.; Hameed, B.H. Insight into the Adsorption Kinetics Models for the Removal of Contaminants from Aqueous Solutions. J. Taiwan Inst. Chem. Eng. 2017, 74, 25–48. [Google Scholar] [CrossRef]
- Srivastava, S.; Tyagi, R.; Pant, N. Adsorption of Heavy Metal Ions on Carbonaceous Material Developed from the Waste Slurry Generated in Local Fertilizer Plants. Water Res. 1989, 23, 1161–1165. [Google Scholar] [CrossRef]
- Demirbas, E.; Kobya, M.; Senturk, E.; Ozkan, T. Adsorption Kinetics for the Removal of Chromium (VI) from Aqueous Solutions on the Activated Carbons Prepared from Agricultural Wastes. Water Sa 2004, 30, 533–539. [Google Scholar] [CrossRef] [Green Version]
- Weber, W.J.; Morris, J.C. Kinetics of Adsorption on Carbon from Solution. J. Sanit. Eng. Div. 1963, 89, 31–59. [Google Scholar] [CrossRef]
- Jawad, A.H.; Mohd Firdaus Hum, N.N.; Abdulhameed, A.S.; Mohd Ishak, M.A. Mesoporous Activated Carbon from Grass Waste via H3PO4-Activation for Methylene Blue Dye Removal: Modelling, Optimisation, and Mechanism Study. Int. J. Environ. Anal. Chem. 2022, 102, 6061–6077. [Google Scholar] [CrossRef]
- Kannan, N.; Sundaram, M.M. Kinetics and Mechanism of Removal of Methylene Blue by Adsorption on Various Carbons—A Comparative Study. Dye. Pigment. 2001, 51, 25–40. [Google Scholar] [CrossRef]
- Özcan, A.; Öncü, E.M.; Özcan, A.S. Kinetics, Isotherm and Thermodynamic Studies of Adsorption of Acid Blue 193 from Aqueous Solutions onto Natural Sepiolite. Colloids Surf. A Physicochem. Eng. Asp. 2006, 277, 90–97. [Google Scholar] [CrossRef]
- Jawad, A.H.; Surip, S.N. Upgrading Low Rank Coal into Mesoporous Activated Carbon via Microwave Process for Methylene Blue Dye Adsorption: Box Behnken Design and Mechanism Study. Diam. Relat. Mater. 2022, 127, 109199. [Google Scholar] [CrossRef]


| Model | Equations | Plot |
|---|---|---|
| Pseudo-first order | ||
| Nonlinear | ||
| Linear | ||
| Pseudo-second order | ||
| Nonlinear | ||
| Linear Type I | ||
| Linear Type II | ||
| Linear Type III | ||
| Linear Type IV |
| Model | Linear | Nonlinear |
|---|---|---|
| Zeroth order | ||
| Korsmeyer–Peppas | ||
| Higuchi |
| Materials | Peaks (cm −1) | Functional Group | Ref. |
|---|---|---|---|
| SPION | 3412 | O-H stretching | [71,72] |
| 1622 | Carbonyl C=O stretching band | [71,72] | |
| 1402 | CH3 deformation | [71,73] | |
| 579 | Vibration Fe-O | [74] | |
| PVA | 3416 | O-H stretching | [75,76,77] |
| 2920 | CH2 asymmetric stretching | [75,76,77] | |
| 1738 | C=O carbonyl stretching | [75,76,77] | |
| 1267 | C-H wagging | [75,76,77] | |
| 1097 | C-O stretching | [75,76,77] | |
| CS | 3437 | O-H stretching | [78,79] |
| 1647 | C-O (amide) and N-H primary amine bends | [78,79] | |
| 1379 | C-O starch in the primary alcoholic group | [78,79] | |
| 1082 | Free amino group -NH2 at glucosamine C2 position | [78,79] | |
| GO | 3409 | O-H stretching | [51,80,81,82] |
| 1628 | Carboxyl C=O stretching band | [51,80,81,82] | |
| 1209 | C-O-C stretching | [51,80,81,82] | |
| 1055 | C-O stretching vibration | [51] | |
| SPION/PVA/CS/GO | 3420 | O-H stretching | [71,72,75,76,77] |
| 1626 | Carbonyl C=O stretching band | [70,71,74,75,76,79,80,81] | |
| 1128 | Free amino group -NH2 at glucosamine C2 position or C-O-C stretching | [78,79] | |
| 1066 | C-O stretching | [75,76,77,83] | |
| 577 | Vibration Fe-O | [74] | |
| 446 | Vibration Fe-O | [74] |
| Adsorption | Desorption | |
|---|---|---|
| Surface area (m2/g) | 5.8 | 7.5 |
| Pore diameter (Angstrom) | 10 | 126 |
| Pore volume (cm3/g) | 0.017 | 0.017 |
| Initial MB Concentration (mg/mL) | (mg/g) | %LC (%) | %EE (%) |
|---|---|---|---|
| 0.015 | 20.934 ± 0.268 | 2.093 ± 0.027 | 83.737 ± 1.072 |
| 0.02 | 28.768 ± 1.18 | 2.877 ± 0.118 | 86.304 ± 3.54 |
| 0.025 | 36.385 ± 0.095 | 3.638 ± 0.009 | 87.324 ± 0.227 |
| Relationship | R2 |
|---|---|
| %LC 0.015 mg/mL MB = 0.0052(time) + 0.4721 | 0.9956 |
| %LC 0.020 mg/mL MB = 0.0046(time) + 0.9893 | 0.9893 |
| %LC 0.025 mg/mL MB = 0.00049(time) + 2.129 | 0.9959 |
| Qt 0.015 mg/mL MB = 0.0049(time) + 21.29 | 0.9959 |
| Qt 0.020 mg/mL MB = 0.0462(time) + 15.079 | 0.9893 |
| Qt 0.025 mg/mL MB = 0.00516(time) + 4.7239 | 0.9956 |
| %EE 0.015 mg/mL MB = 0.2064(time) + 18.896 | 0.9956 |
| %EE 0.020 mg/mL MB = 0.1387(time) + 45.238 | 0.9893 |
| %EE 0.025 mg/mL MB = 0.1175(time) + 51.097 | 0.9959 |
| Initial MB Concentration (mg/mL) | ||||
|---|---|---|---|---|
| 0.015 | 0.020 | 0.025 | ||
| Pseudo-first order nonlinear | mg MB (g particles)−1 | 13.315 | 22.265 | 29.011 |
| k1 (g mg−1 day−1) | 1 | 1 | 1 | |
| 15.755 | 8.924 | 6.349 | ||
| Pseudo-second order nonlinear | mg MB (g particles)−1 | 13.321 | 22.265 | 29.011 |
| k2 (g mg−1 day−1) | 171.82 | 56.22 | 915.92 | |
| 15.756 | 8.924 | 6.349 | ||
| Pseudo-second order linear | Qe | 38.17 | 31.25 | 27.40 |
| k2 | 0.017 | 0.015 | 0.006 | |
| R2 | 0.980 | 0.976 | 0.864 | |
| Simplified Elovich | (mg/(g day)) | 10.752 | 76.904 | 245.24 |
(mg/g) | 0.182 | 0.196 | 0.190 | |
| R2 | 0.871 | 0.930 | 0.886 | |
| Initial MB Concentration (mg/mL) | kI | I | R2 |
|---|---|---|---|
| 0.015 | 5.629 | −0.892 | 0.9614 |
| 0.020 | 5.132 | 9.836 | 0.9896 |
| 0.025 | 5.364 | 15.908 | 0.9701 |
| Concentration MB mg/mL | Mass MB mg Initial Average | % Release Average | % Release Std |
|---|---|---|---|
| 0.015 | 0.63 | 4.88 | 0.35 |
| 0.02 | 0.83 | 8.94 | 0.66 |
| 0.025 | 1.09 | 5.25 | 1.04 |
| Korsmeyer–Peppas (KP) | 0th Order | Higuchi | Chi-Square | ||||
|---|---|---|---|---|---|---|---|
| k | n | k | k | KP | 0th Order | Higuchi | |
| 0.015 | 1 | 0.5 | 0.003 | 0.004 | 6.202236 | 0.173816 | 27.80007 |
| 0.02 | 1 | 0.5 | 0.003 | 0.004 | 25.4483 | 0.064261 | 21.1659 |
| 0.025 | 1 | 0.5 | 0.003 | 0.004 | 6.467235 | 0.047012 | 16.07614 |
Disclaimer/Publisher’s Note: The statements, opinions and data contained in all publications are solely those of the individual author(s) and contributor(s) and not of MDPI and/or the editor(s). MDPI and/or the editor(s) disclaim responsibility for any injury to people or property resulting from any ideas, methods, instructions or products referred to in the content. |
© 2023 by the authors. Licensee MDPI, Basel, Switzerland. This article is an open access article distributed under the terms and conditions of the Creative Commons Attribution (CC BY) license (https://creativecommons.org/licenses/by/4.0/).
Share and Cite
Quach, T.P.T.; Doan, L. Surface Modifications of Superparamagnetic Iron Oxide Nanoparticles with Polyvinyl Alcohol, Chitosan, and Graphene Oxide as Methylene Blue Adsorbents. Coatings 2023, 13, 1333. https://doi.org/10.3390/coatings13081333
Quach TPT, Doan L. Surface Modifications of Superparamagnetic Iron Oxide Nanoparticles with Polyvinyl Alcohol, Chitosan, and Graphene Oxide as Methylene Blue Adsorbents. Coatings. 2023; 13(8):1333. https://doi.org/10.3390/coatings13081333
Chicago/Turabian StyleQuach, Tran P. T., and Linh Doan. 2023. "Surface Modifications of Superparamagnetic Iron Oxide Nanoparticles with Polyvinyl Alcohol, Chitosan, and Graphene Oxide as Methylene Blue Adsorbents" Coatings 13, no. 8: 1333. https://doi.org/10.3390/coatings13081333
APA StyleQuach, T. P. T., & Doan, L. (2023). Surface Modifications of Superparamagnetic Iron Oxide Nanoparticles with Polyvinyl Alcohol, Chitosan, and Graphene Oxide as Methylene Blue Adsorbents. Coatings, 13(8), 1333. https://doi.org/10.3390/coatings13081333