Article

Possibilities of Duplex Plasma Electrolytic Treatment for Increasing the Hardness and Wear Resistance of a Commercially Pure Titanium Surface

1
Department of Mathematical and Natural Sciences, Kostroma State University, 156005 Kostroma, Russia
2
Department of High-Efficiency Machining Technologies, Moscow State University of Technology “STANKIN”, 127994 Moscow, Russia
3
Department of Management and Law, Kostroma State Agricultural Academy, Kostroma Region, 156530 Karavaevo, Russia
*
Author to whom correspondence should be addressed.
Coatings 2023, 13(8), 1363; https://doi.org/10.3390/coatings13081363
Submission received: 20 June 2023 / Revised: 30 July 2023 / Accepted: 1 August 2023 / Published: 3 August 2023
(This article belongs to the Collection Feature Paper Collection in Corrosion, Wear and Erosion)

Abstract

:
The technology for duplex treatment of a commercially pure titanium surface is expected to increase hardness and wear resistance. This technology consists of sequential nitrocarburizing and polishing of the product in plasma electrolysis. The mechanism of duplex processing is revealed; it consists of strengthening the surface layers under diffusion saturation and controlled formation of the surface relief. The possibility of controlling the characteristics of the modified surface by combining various plasma technologies is shown. The morphological features of the surface and the surface layer after treatment were studied. The microhardness of the modified layer and the tribological properties of the surface were measured. It has been established that the samples with the highest surface layer hardness and a small thickness of the oxide layer on the surface have the highest wear resistance. After nitrocarburizing at 750 °C for 5 min, wear resistance increases by 4.3 times compared to pure material. If subsequent polishing is carried out at a voltage of 275–300 V for 3–5 min in chloride and fluoride electrolytes and 5–10 min in a sulfate electrolyte, then wear resistance can be further increased. This is achieved by removing the porous outer oxide layer.

1. Introduction

Titanium alloys play an important role in the development of products for a variety of uses. In a number of cases, titanium-based materials are indispensable in shipbuilding and industry. They are used to produce parts that are used to work with aggressive liquids, in corrosive environments, and when anodizing various parts. Promising industries in which it is advisable to use materials based on titanium are nuclear power, oil and gas production, and non-ferrous metallurgy. Alloyed materials with high performance indicators are generally used for critical parts. At the same time, surface treatment of a finished product can be an alternative to increase its functional performance. Modifying product surfaces of low-grade alloys in areas of contact with the external environment allows the use of cheaper materials while increasing performance indicators. Plastic deformation technologies are used to harden metal surfaces. Examples might be ultrasonic strain engineering technology [1] and ultrasonic shot peening [2,3]. The disadvantage of deformation treatments is the significant increase in roughness and the need for subsequent finishing [1,2,3].
An alternative method of modifying metal and alloy surfaces to increase a variety of performance indicators is plasma electrolytic treatment [4,5,6,7]. There are a variety of processes aimed at obtaining ceramic-like coatings by plasma electrolytic oxidation [8,9,10,11,12,13,14] and surface polishing or removal of the surface layer by plasma electrolytic polishing (PEP) [15,16,17,18,19,20,21,22]. The most diverse is the surface modification through plasma electrolytic diffusion saturation: nitriding (PEN), boriding (PEB), and nitrocarburizing (PENC) [23,24], which have found a wide application for the processing of steel products.
PEN of medium carbon steel S0050A leads to an increase in the dry friction coefficient from 0.37 to 0.4, and also from 0.109 to 0.125 when using a lubricant [25]. A possible reason for this is the increase in the surface roughness. At the same time, an increase in hardness secures a three-fold decrease in volume wear resulting in dry friction. PEB of H13 steel improves wear resistance by a factor of 12 when the treated cylindrical sample is rubbed against a silicon carbide disk-counterbody [26]. PEB of medium carbon steel in a dry friction setting makes it possible to increase the wear resistance by a factor of 7.2 while decreasing the friction coefficient from 0.26 to 0.16 [27].
Plasma electrolytic diffusion saturation of titanium alloys also has known advantages. It has been established that with the help of PENC, it is possible to increase the hardness of commercially pure titanium (CP-Ti) up to 800 [28] and 1500 HV [29] depending on electrolyte composition. The hardness of the Ti6Al4V alloy after PENC reaches 2000 [30] and 2369 HV [31]. Such treatment makes it possible to reduce the weight wear of CP-Ti 17-fold [18] and Ti6Al4V 3248-fold [31]. In [32], the complex effect of surface roughness and hardness of the surface layer on the wear resistance of Ti6Al4V titanium alloy after PEN was established. It has been established that the largest decrease in weight wear of 2.7-fold is observed in specimens with the maximum microhardness of the surface layer, reaching 820 HV, and the lowest surface roughness. It has also been shown that pulse PENC of titanium leads to the formation of nanocrystalline carbonitrides [33] and an increase in the corrosion resistance of CP-Ti after PENC [29,34].
A noted disadvantage of the cathodic version of plasma electrolytic diffusion saturation is surface erosion resulting from electric discharges, leading to an increase in its roughness [35]. A disadvantage of the anodic saturation technology is the formation of porous oxide structures on the surface [36], which have low strength and are separated during external exposure. One of the solutions to these problems is the subsequent PEP after diffusion saturation, allowing the removal of a part of the surface oxide layer with the formed defects and a further reduction in the surface roughness. In this work, new information was obtained on the possibilities of increasing the wear resistance of the surface of materials based on CP-Ti using combined processing, which includes diffusion saturation and polishing. The surface wear mechanism was identified and tribological characteristics were determined. This makes it possible to further use the obtained results for the development of a new technology for modifying the surfaces of products based on titanium alloys. In this regard, the purpose of this work was to study the possibility of increasing the wear resistance of a titanium surface by combined PENC and PEP.

2. Materials and Methods

2.1. Sample Processing

Cylindrical samples (Ø 10 mm × 15 mm) of CP-Ti (0.25 wt.% Fe, 0.2 wt.% O, 0.1 wt.% Si, 0.07 wt.% C, 0.04 wt.% N, 0.01 wt.% H, and balanced Ti) were ground with SiC abrasive paper to a grit size of P120 to Ra~1.0 μm and ultrasonically cleaned with acetone. These samples were subjected to duplex surface treatment combining PENC in a solution of ammonia (5 wt.%), acetone (5 wt.%), and ammonium chloride (10 wt.%) and subsequent PEP.
Treatment was carried out in a cylindrical electrolyzer with an axially symmetric electrolyte flow supplied through a nozzle located at the bottom of the electrolyzer (Figure 1) [31,36].
To stabilize the thermophysical conditions of the treatment and uniform temperature distribution over the entire surface of the sample, the electrolyte was supplied from below along the sample due to the operation of the pump. The electrolyte was cooled after contact with the sample in a heat exchanger. The electrolyte circulation rate was 2.5 L/min. Under such conditions, it was possible to maintain a constant temperature of the electrolyte, which was 30 ± 2 °C. During treatment, the samples were connected to the positive output, and the working chamber itself was connected to the negative output of the 15 kW DC power supply. The PENC time was 5 min as the optimal time for anodic variants of plasma electrolytic treatment [37,38]. PENC was carried out at temperatures of 750, 800, 850, and 900 °C by changing the voltage according to the voltage–temperature characteristic of the process (Figure 2). After PENC, the samples were quenched in the electrolyte in which they were treated (hardening).
PENC samples were further polished PEP in different solutions: ammonium sulfate (3%) at a temperature of 80 °C, ammonium chloride (1%) at a temperature of 80 °C, and ammonium fluoride (4%) at a temperature of 90 °C, with varying voltage and time processing. The electrolyte circulation rate in PEP was lower than that in PENC and amounted to 1 L/min.

2.2. Study of the Surface Morphology and Microstructure

The surface morphology and cross-section of the treated samples were studied using a Phenom G2 pro scanning electron microscope (Phenom-World B.V., Eindhoven, The Netherlands) and Micromed MET optical metallographic microscope (Micromed, St. Petersburg, Russia).

2.3. Microhardness Measurement

A Vickers microhardness tester (Falcon 503, Innovatest Europe BV, Maastricht, The Netherlands) was used to measure microhardness of the cross-sections of the CP-Ti sample under a 0.1 N load.

2.4. Surface Roughness and Sample Weight Measurement

A TR-200 profilometer (Beijing TIME High Technology Ltd., Beijing, China) was used to measure surface roughness. A CitizonCY224C electronic analytical balance (ACZET (Citizen Scale), Mumbai, India) was used to measure the weight of the samples with an accuracy of ±0.0001 g.

2.5. Study of Tribological Properties

The “shaft-block” friction scheme was used in friction tests (Figure 3) [37,39].
The counterbody was made of tool alloy steel (wt.%: 0.9–1.2 Cr, 1.2–1.6 W, 0.8–1.1 Mn, and 0.9–1.05 C) in the form of a plate with a semicircular notch 10 mm in diameter enclosing the surface of the sample. The cylindrical sample was rotated, and a counterbody was pressed against it. The counterbody was a rectangular plate 2 mm thick with a semicircular cutout at one end. The diameter of the cutout was equal to the diameter of the sample. The counterbody was fixed on a movable base, which moved along the guides under the action of a pneumatic cylinder. The pneumatic cylinder and counterbody were mounted on a crank, which was fixed to the shaft coaxially to the cylindrical sample. The crank was in a stationary position due to the connection with a load cell. This system prevented misalignment of the sample and counterbody as the friction pair wore out, and the chosen geometric shape of the counterbody made the contact surface area of the sample and counterbody unchanged. The temperature was measured on the friction track at the exit point from the contact area of the bodies. Friction tests were carried out in dry friction mode under a load of 10 N. The sliding speed of the sample along the counterbody was 1.555 m/s. The sliding distance was 1000 m. The parameters of the microgeometry of the friction tracks’ surface and volume loss during friction were measured using a TR200 profilometer (Beijing TIME High Technology Ltd., Beijing, China). The temperature of the friction contact was measured on the friction track directly at the exit from the contact area using an MLX90614 digital infrared thermometer (Melexis Electronic Technology, Shanghai, China). Friction parameters of the worn surface after PENC and PEP were calculated using a model previously adapted for similar coatings [39].

3. Results

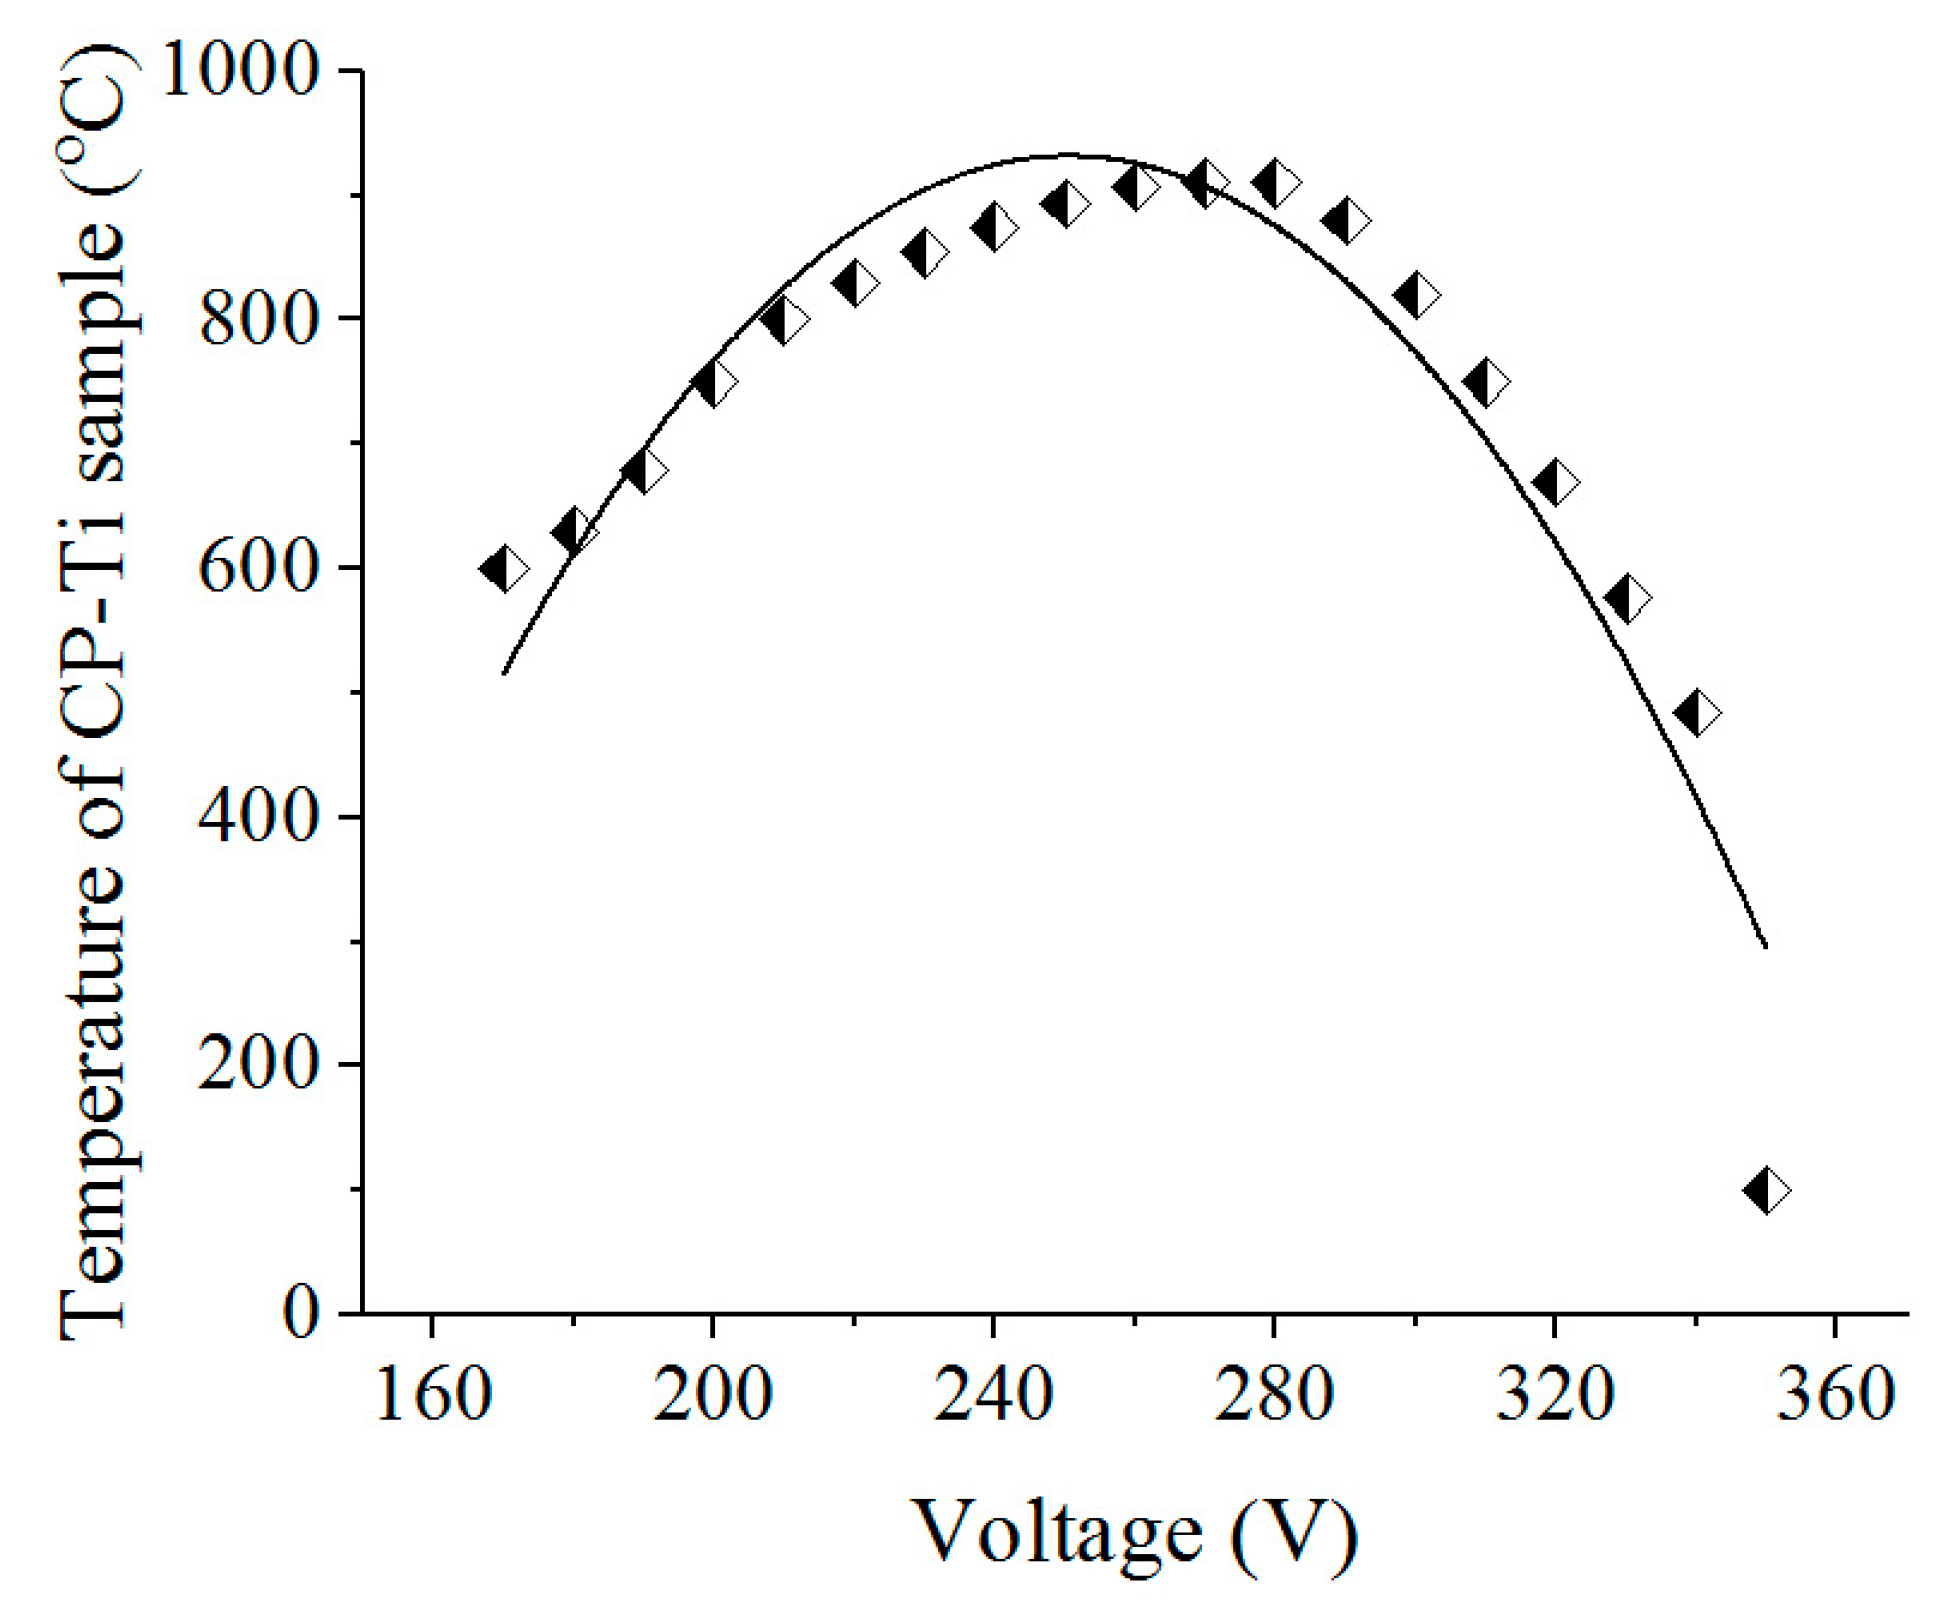
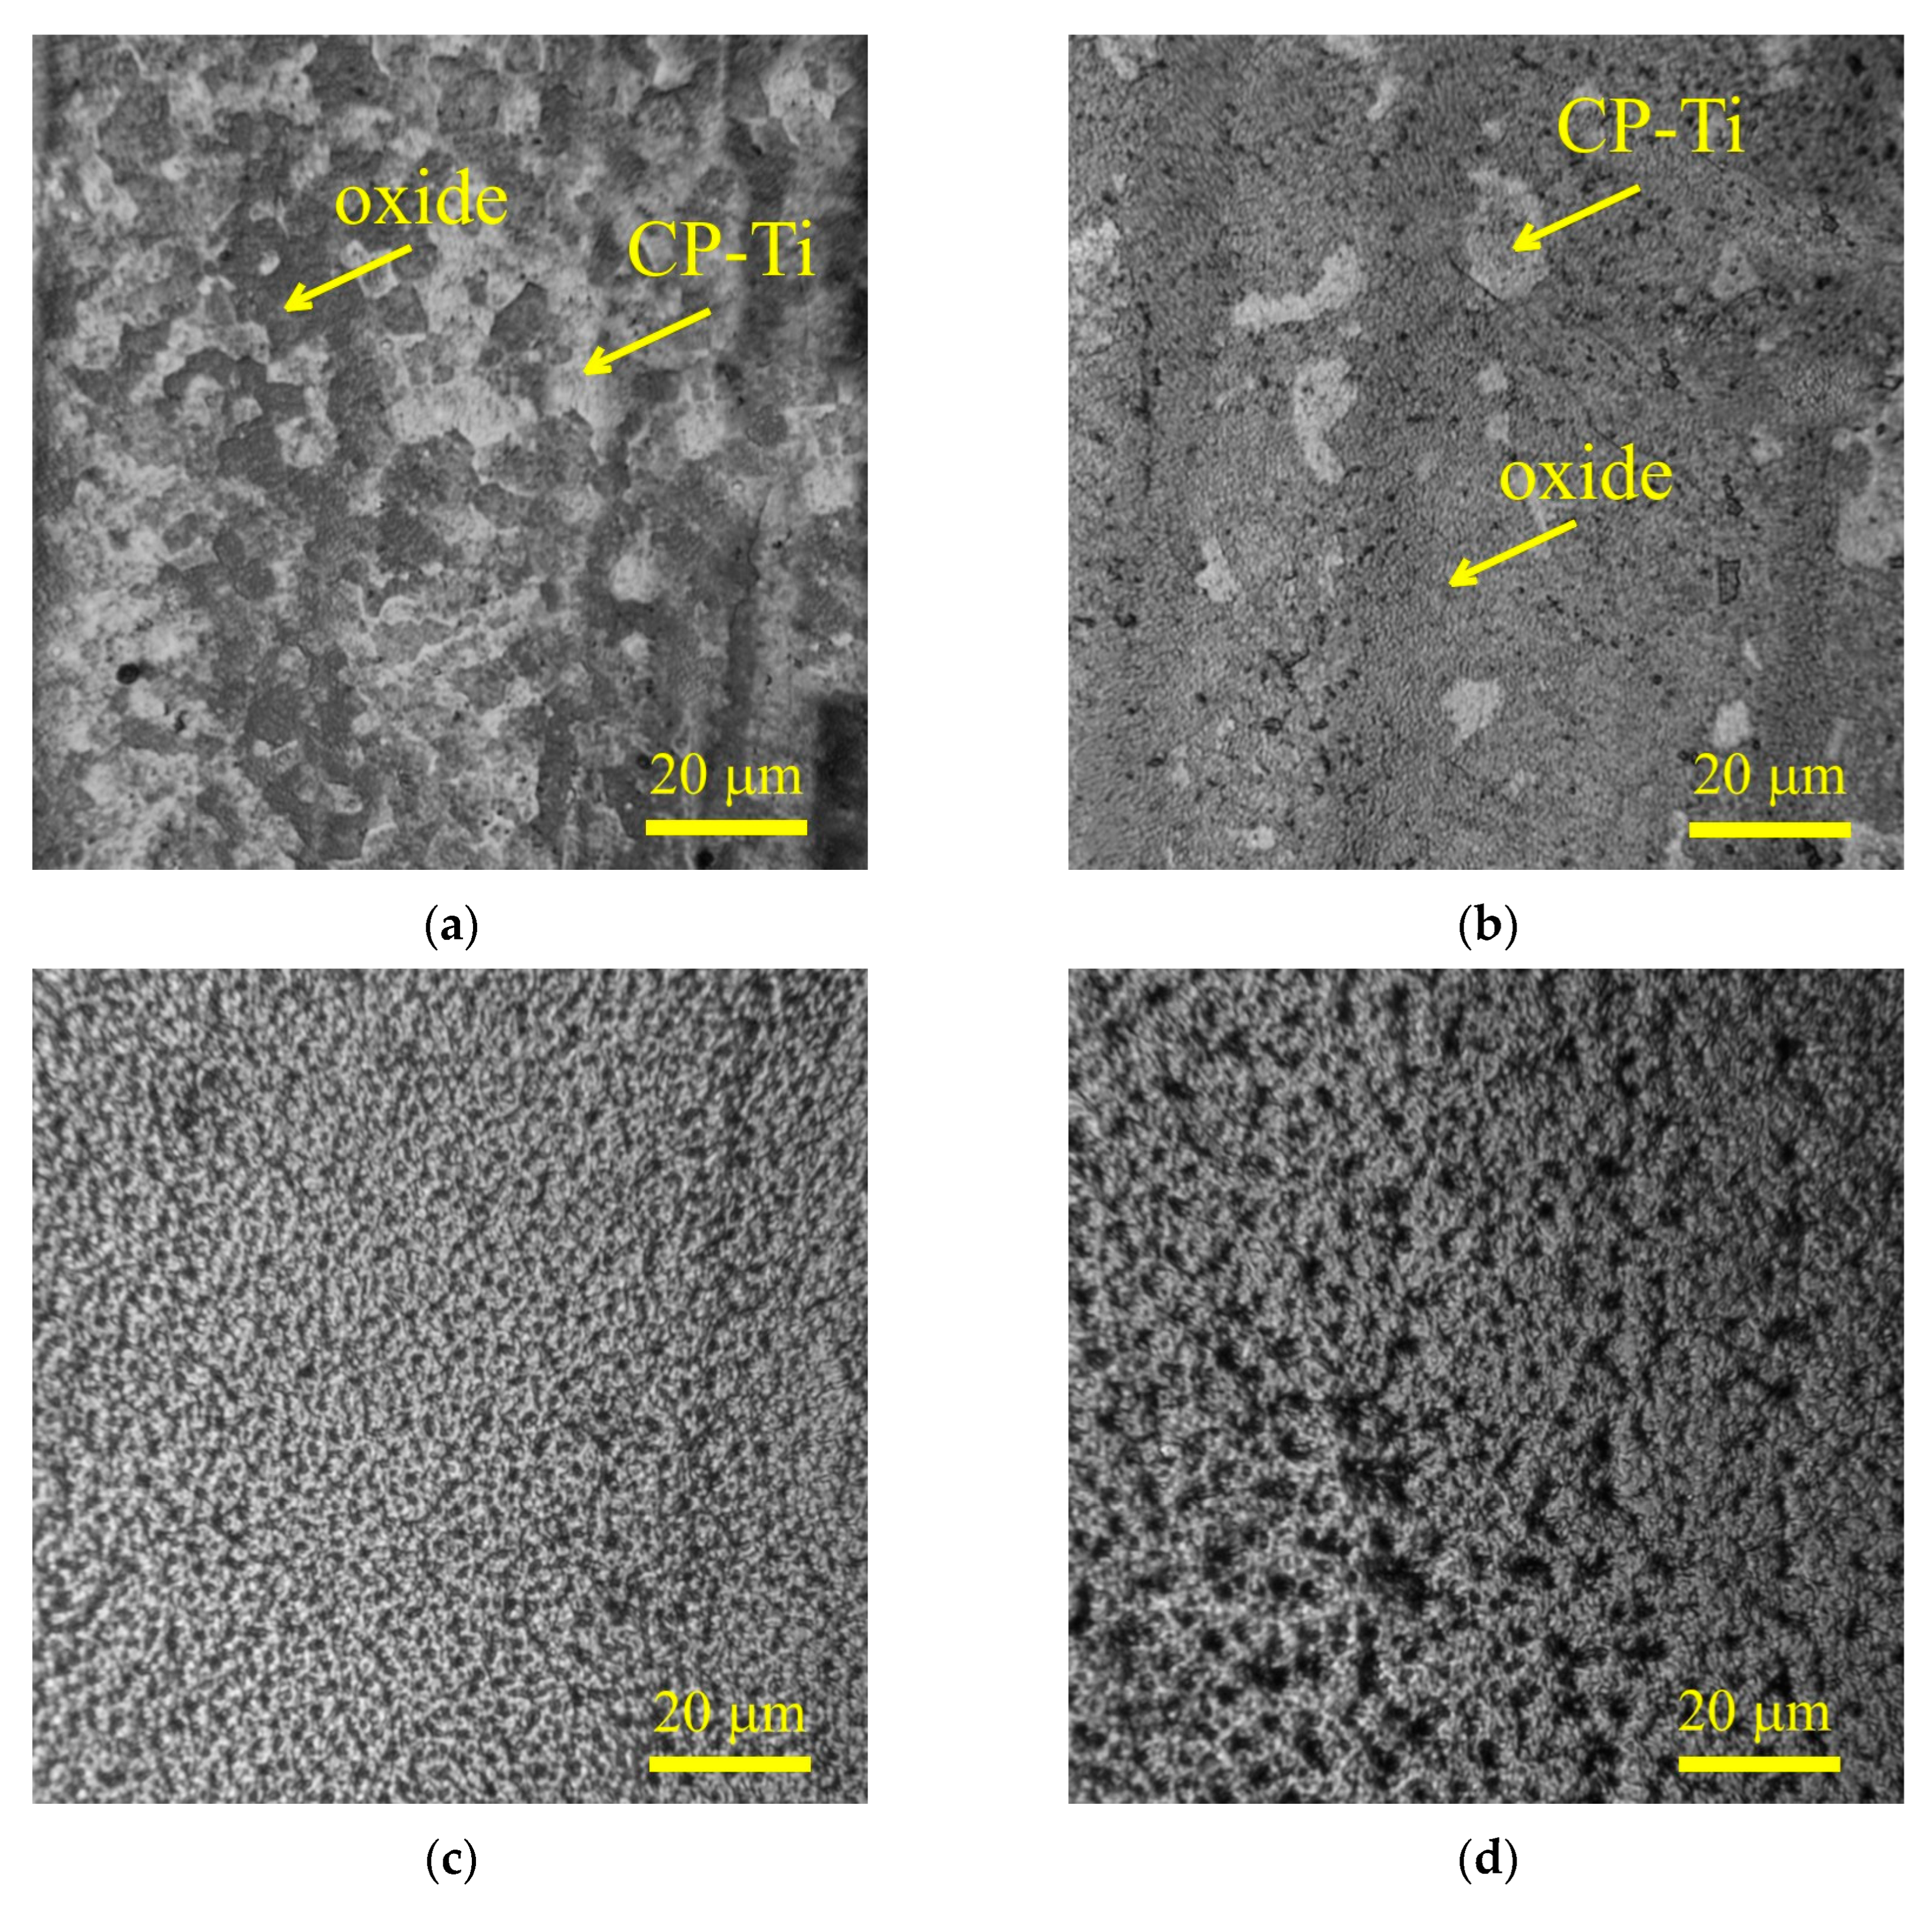
3.1. Morphology, Structure, and Tribological Properties of the Surface after PENC

Morphological analysis of the titanium alloy surface after PENC demonstrated the effect the treatment temperature has on the condition of the surface (Figure 4). At a low temperature of PENC, the formation of thin oxide films is observed, the area of which on the surface increases with an increase in temperature from 750 to 800 °C. After treatment at a temperature of 850 °C, the formation of a porous structure of the oxide layer is observed with a tendency for pore growth as the temperature increases to 900 °C.
The change in the surface morphology affected its roughness (Table 1). After PENC, a decrease in surface roughness Ra is observed due to the electrochemical dissolution of irregularities, which is characteristic of anodic processes [36,37,38]. The formation of a porous structure of the oxide layer at a treatment temperature of 900 °C is reflected in an increase in roughness, which does not exceed the initial value.
Metallographic analysis of the cross-section of the samples showed the formation of a diffusion layer under the oxide layer (Figure 5).
The above-described surface morphology correlates with the thickness of the oxide layer, which is visually determined at temperatures of 800, 850, and 900 °C and tends to increase as temperature rises. The diffusion layer, which is a solid solution of nitrogen and carbon, is determined by an increase in microhardness by 200–250 HV. At temperatures of 850 and 900 °C, a hardened layer is detected metallographically with a significant increase in microhardness (outer hardened layer) to 1280 HV achieved after 900 °C, which is 5 times higher than the microhardness of the initial structure.
Tribological tests have shown the possibility of reducing the friction coefficient of the surface of the CP-Ti after PENC, which is minimal after treatment at 750 °C (Table 1, Figure 6). Weight wear decreases after PENC at 750 and 800 °C. At the same time, a linear increase in weight wear has been observed when increasing the treatment temperature. A similar trend is observed for the temperature in the friction contact zone, which decreases only after PENC at 750 °C and rises as the treatment temperature rises.
To determine the stress–strain state of the contact, as well as the wear mechanism, the relative convergence of the rubbing surfaces was found, based on the profilograms of the friction tracks. According to the calculation of the relative penetration of the asperities of the compressed surfaces h/r (the ratio of the depth of the penetration of the asperity into the surface of the counterbody to the asperity tip), in the untreated and nitrocarburized samples, the friction bonds during friction are destroyed due to the plastic displacement of the material (0.01 < h/r < 0.1). The roughness on the friction tracks, evaluated after the complex criterion of Kragelsky–Kombalov, decreased for nitrocarburized samples. In this case, the correlation of the complex criterion with the surface roughness before tribological tests can be observed.

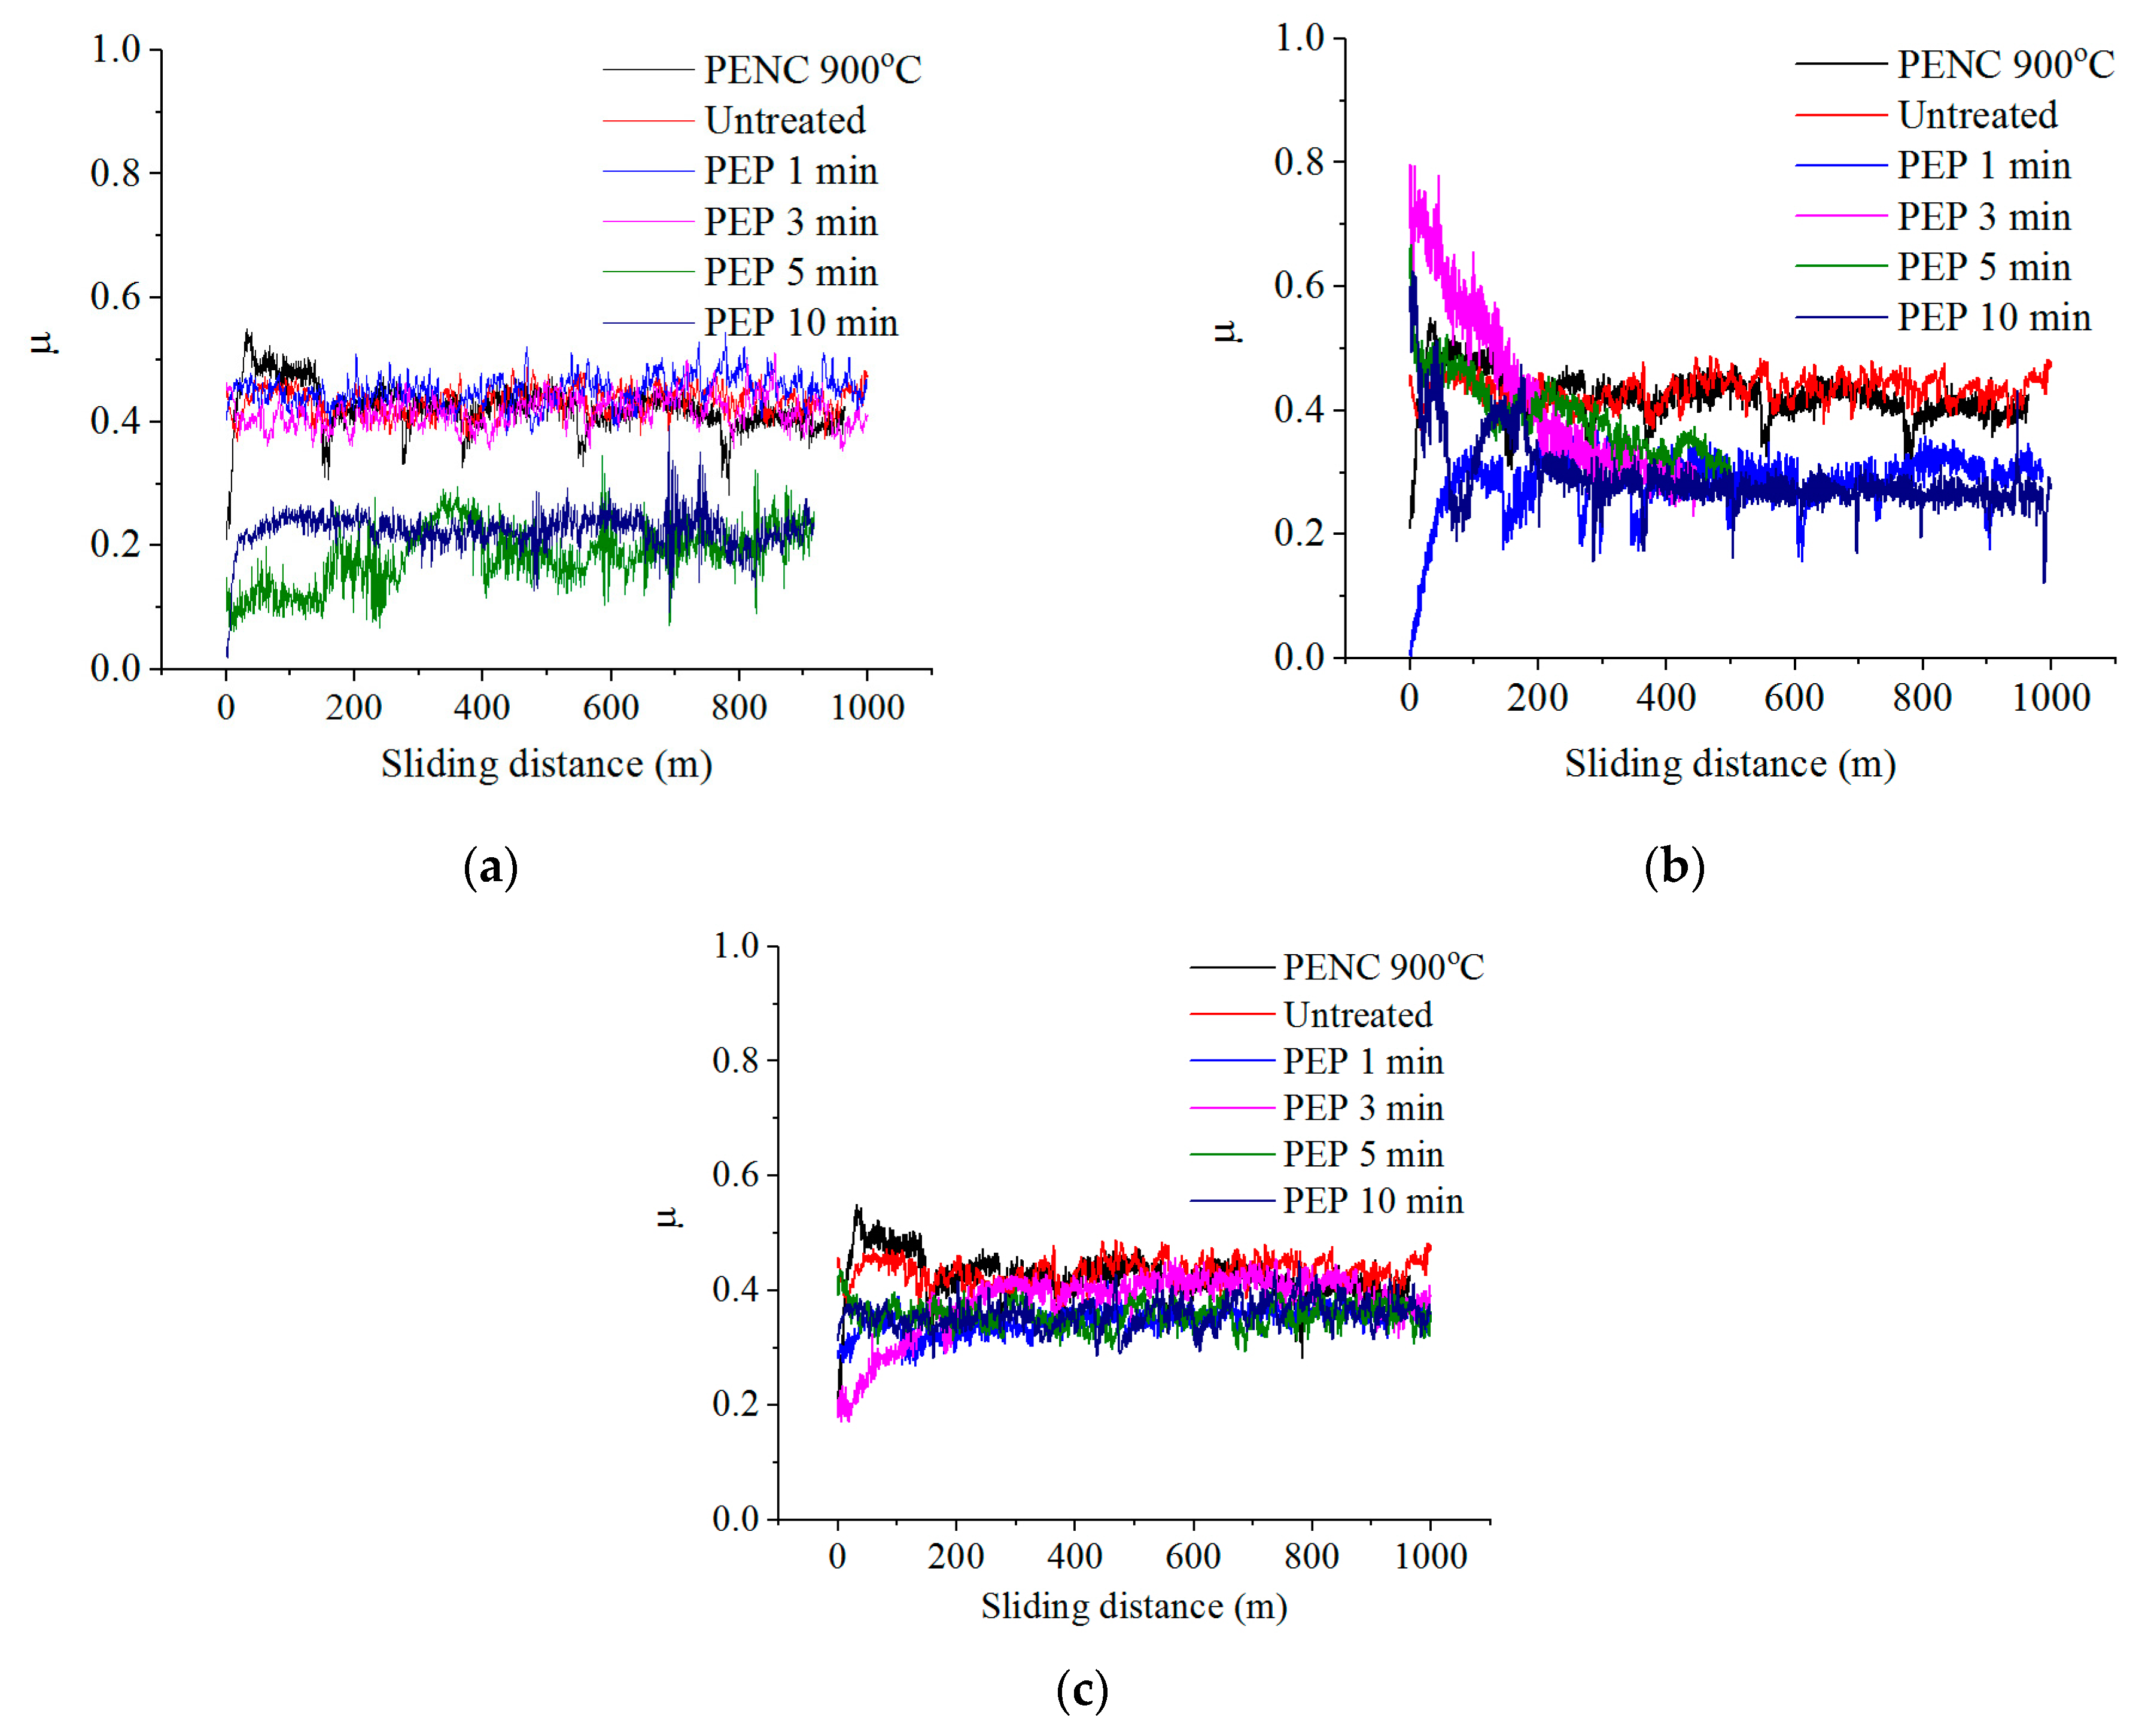
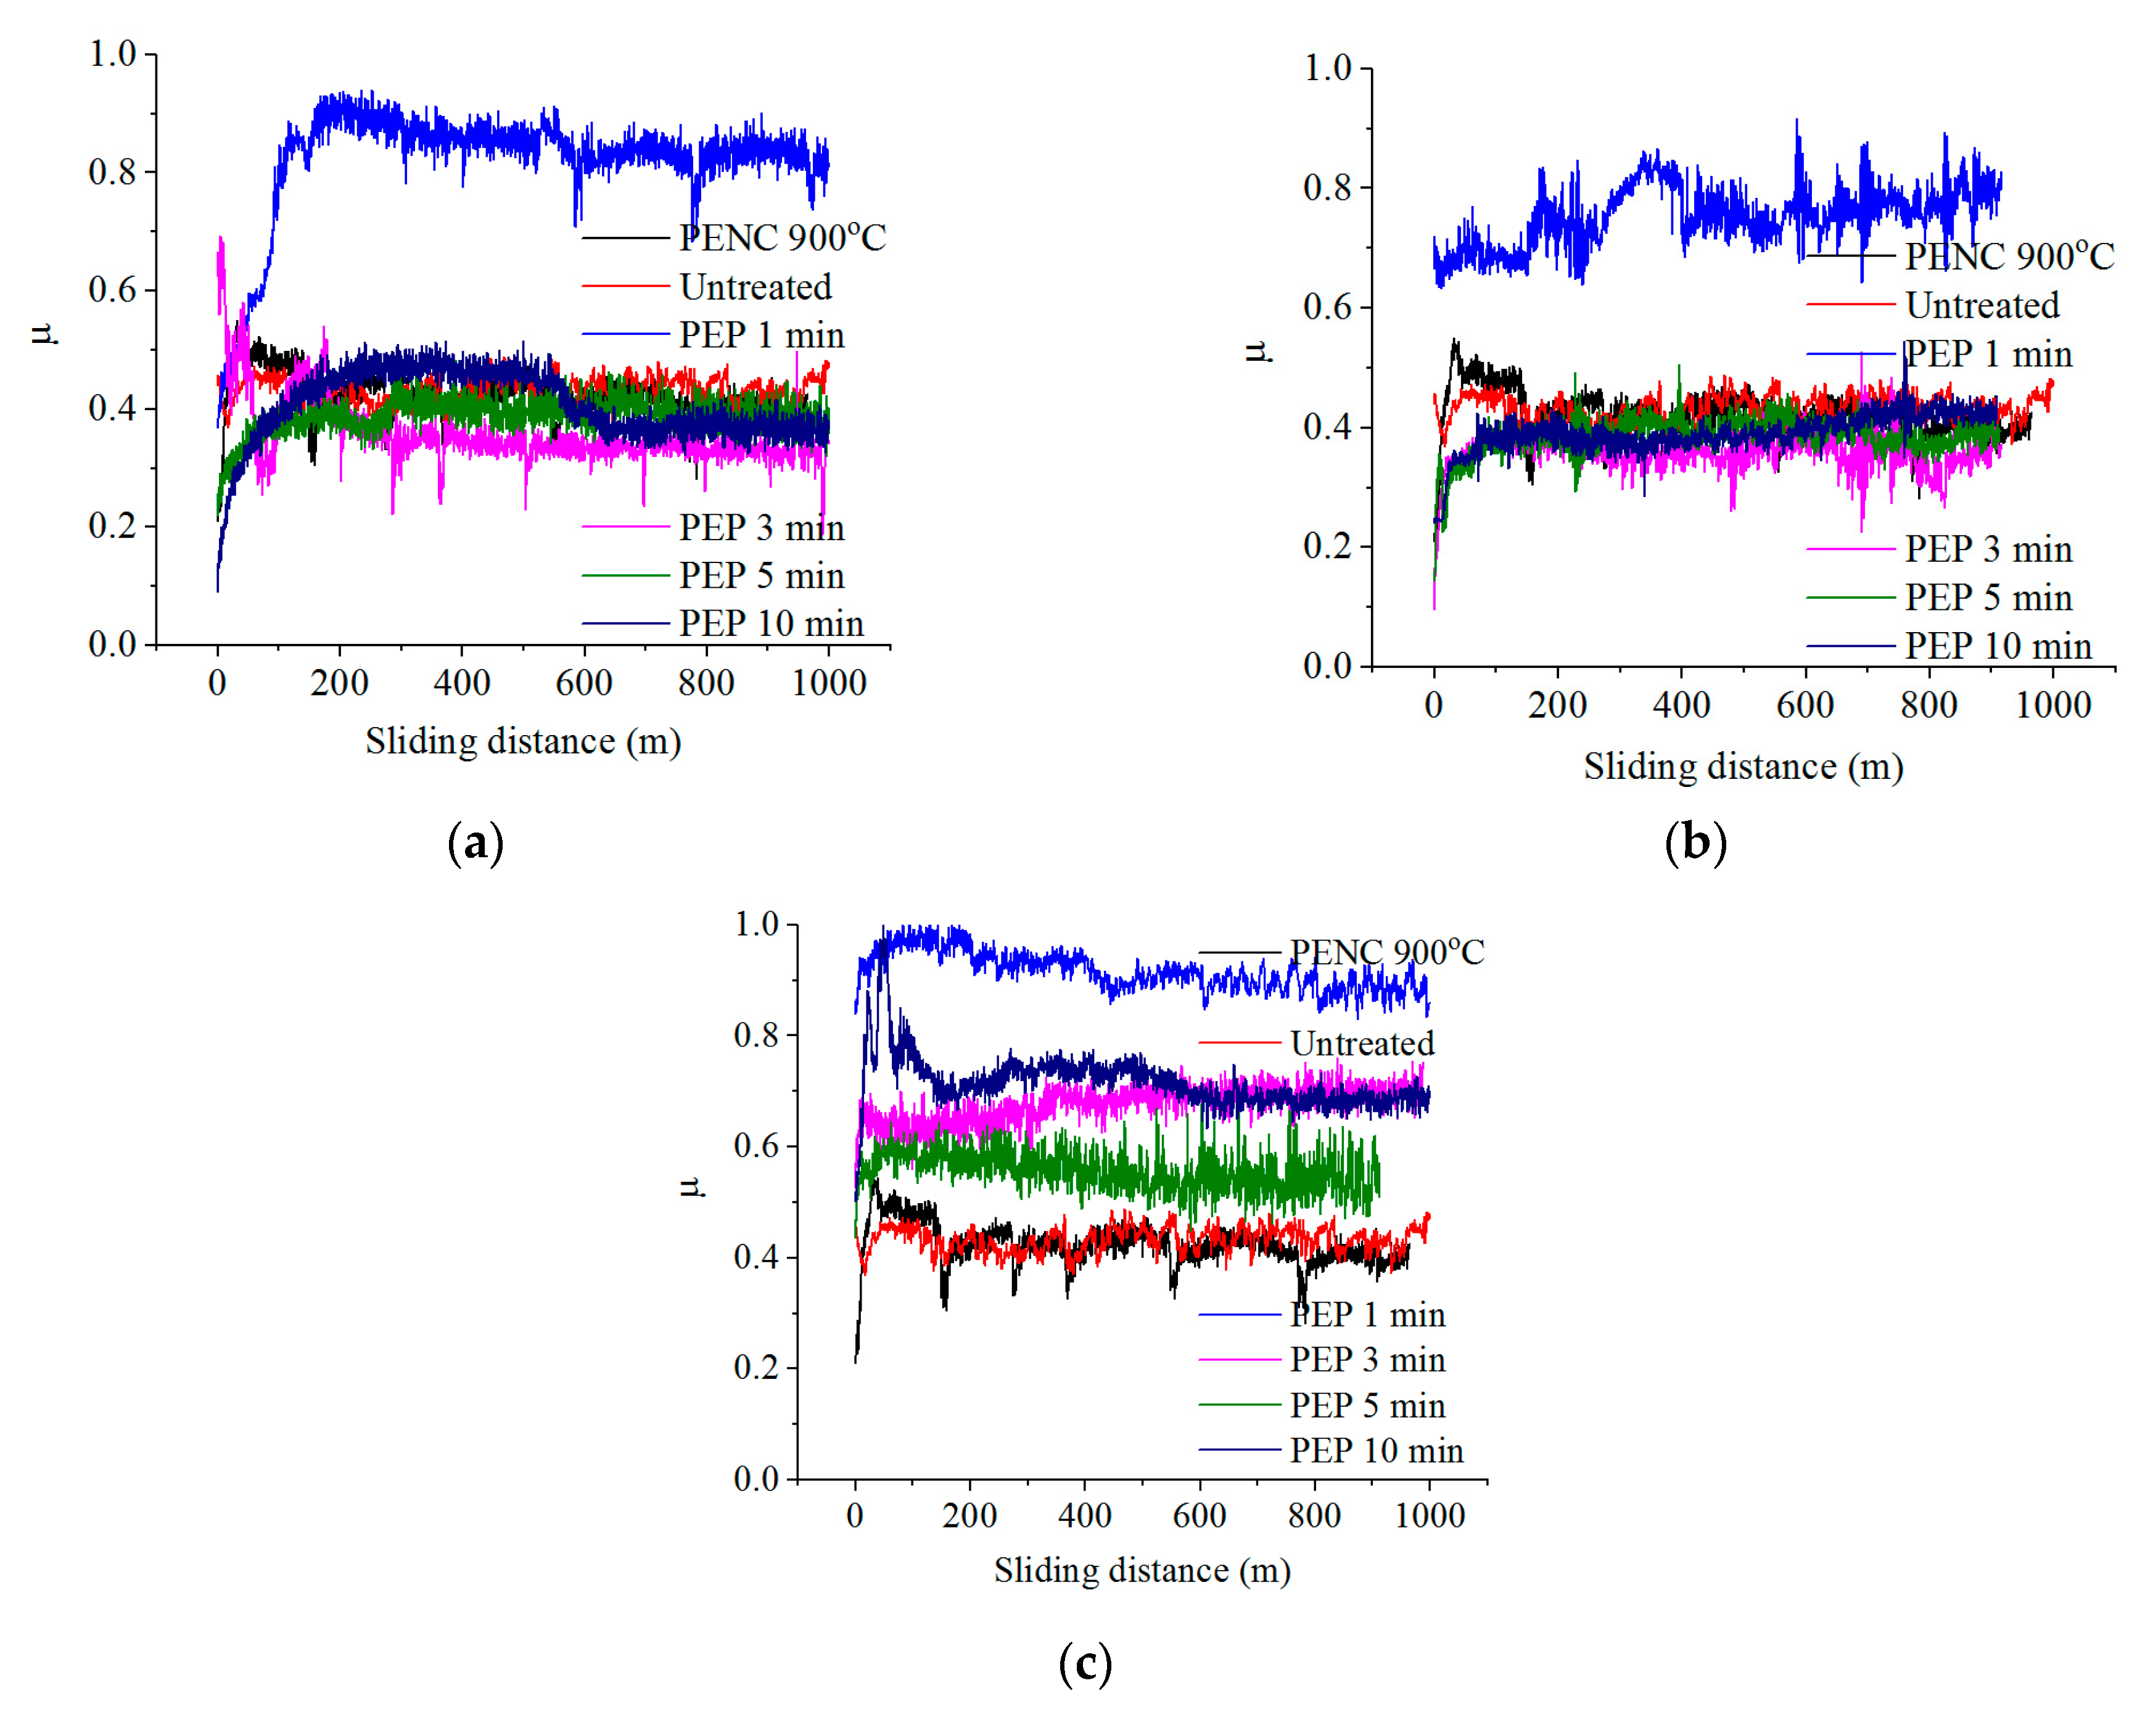
3.2. Morphology and Tribological Properties of the Surface after PEP

Following PENC at 900 °C, the samples were subjected to subsequent PEP, which demonstrated high hardness levels, and the removal of fragile parts of the oxide layer, which are destroyed during friction, will allow for improving the tribological properties, as was demonstrated in the duplex treatment of steels [40].
After PEP in an electrolyte based on ammonium sulfate, the roughness slightly increases but does not exceed the measurement error (Table 2). No dependencies were found. In this case, the minimum material removal rate is observed, caused by additional passivation of the surface by oxygen-containing sulfate ions.
Morphological analysis showed that the surface becomes more uniform due to the removal of the bulges with PEP (Figure 7b).
PEP in an ammonium sulfate solution, despite a slight increase in roughness, showed the possibility of reducing the friction coefficient and weight and volume wear, possibly caused by the removal of an unstable outer oxide layer during PEP and the formation of oxides in its place under the passivating action of sulfate ions (Table 2, Figure 8). The best results were obtained after PEP at 300 V regardless of the treatment time and at 275 V for at least 5 min. Thus, the value of weight wear can be reduced by 7.9 times compared to nitrocarburized surface and by 4.5 times compared to the untreated surface, volume wear by 7.8 and 5.5, and the friction coefficient by 1.7 and 1.9 times, respectively, after PEP at 275 V for 10 min. The temperature in the friction contact zone in all cases exceeds 100 °C. The relative penetration after PEP in any mode for dry friction conditions lies within 0.01 < h/r < 0.1, which means that plastic deformations were realized in the tribocontact, providing a rather mild friction mode without microcutting. It is demonstrated that the minimum values of the Kragelsky–Kombalov criterion correlate with the minimum values of the friction coefficient.
When using a chloride electrolyte, a significant increase in roughness is observed in proportion to the PEP duration, regardless of the magnitude of the applied voltage (Table 3). The removal of the outer oxide layer occurs at a higher rate than that during PEP in a sulfate electrolyte, which leads to the development of surface profile irregularities (Figure 7c) and an increase in roughness.
PEP in an ammonium chloride solution makes it possible to improve the tribological parameters only after treatment at 275 and 300 V for 3–5 min (Table 3, Figure 9): the friction coefficient, weight wear, and volume wear can be reduced, respectively, by 1.2, 2.5, and 1.8 times compared with nitrocarburized samples and 1.4, 1.4, and 1.2 times compared to untreated samples. PEP for 1 min at 275 and 300 V, as well as 1, 3, and 10 min at 325 V, showed high temperature readings in the friction contact zone and a friction coefficient with relatively high microtopology indicators. Under these conditions, there is a transition in the destruction of friction bonds from the soft plastic displacement of the material to microcutting (h/r ≈ 0.1).
When using a fluoride electrolyte, the roughness decreases with an increase in PEP duration, and in the case of PEP at 275 and 300 V for more than 3 min, its value drops below the initial value for the PENC surface (Table 4). During PEP in this electrolyte, the greatest loss of material occurs, leading to a uniform removal of the oxide layer according to the morphological analysis data (Figure 7d). Treatment in the fluoride electrolyte was carried out only up to 5 min since the removal of the diffusion layer occurred at a longer time.
PEP in an ammonium fluoride solution under all varied modes makes it possible to improve the friction and wear characteristics (Table 4, Figure 10). The best results were obtained after PEP at 275 V, regardless of the duration of treatment, and at 300 V for 3–5 min: the coefficient of friction, weight wear, and volume wear can be reduced by 2, 8.3, and 10.7 times, respectively, compared with nitrocarburized samples and 2.2, 4.7, and 7.6 times compared to untreated samples after PEP at 300 V for 3 min. The temperatures in the tribological contact after PEP in a fluoride electrolyte are lower than those in chloride and sulfate ones. The low values of the Kragelsky–Kombalov criterion indicate an increased bearing capacity of the rough profile following this treatment, which is also evident from the low values of the friction coefficient. A small difference between the Δ criterion and the roughness after PEP provides running in with the lowest possible mass wear losses.
The mechanism of sample wear following PEP in a fluoride electrolyte can be described as fatigue in dry friction and plastic contact (0.01 < h/r < 0.1).

4. Discussion

The results of the morphological analysis of the surface showed a competing effect of high-temperature oxidation of the surface and its anodic dissolution, which proves the general similarity of the anodic diffusion saturation of steels and titanium alloys [36,37,38]. When treated at up to 900 °C, anodic dissolution prevails over oxidation and the roughness decreases by almost two-fold. With an increase in temperature to 900 °C, evenly formed irregularities of the oxide coating are revealed on the surface, leading to an increase in roughness. In this case, oxidation prevails over anodic dissolution. Similar to the diffusion saturation of steels [36,37,38], nitrocarburizing of CP-Ti results in the formation of diffusion layers with increased hardness, which increases with rising treatment temperature.
Tribological testing of nitrocarburized surfaces revealed a negative effect of the outer oxide layer on wear characteristics. The observed increase in weight wear with an increase in the PENC temperature is caused by the destruction of the outer oxide layer during triboconjugation, the thickness and uneven development of which increase with the prevalence of high-temperature oxidation. With an increase in the treatment temperature, the bond between the oxides and the base metal is weakened due to different coefficients of thermal expansion, and the oxides easily peel off during friction. The oxide flaking zone can extend beyond the friction track, thereby increasing the mass loss during tribological tests. An increase in temperature in the zone of frictional contact with a similar dependence can be attributed to the increase in the hardness of the diffusion layers and the strength of the adhesive bonds of the sample material on the cut.
The use of the methodology [39] for describing the stress–strain state of the contact of rubbing surfaces and establishing the wear mechanism can be substantiated as follows: Each passing of the surface roughness of the PENC sample over the surface of the counterbody is characterized by residual deformation. The accumulation of residual strains in the near-surface layers of both the sample and the counterbody leads to the emergence of a stress state characterized by low-cycle frictional fatigue of the material. Microscopic sections of the material begin to break off, forming wear particles. The intensity of the formation of wear particles is determined by the stage of the wear process, which can be determined by the transition of the initial roughness to the operational one. After the running-in process is complete, a roughness is formed on the friction surfaces of the PENC sample and the counterbody, which is determined only by the conditions of friction and wear. The resulting roughness is optimal for a given tribological assembly and friction conditions and results in minimal wear. It may be greater or less than the roughness value prior to friction testing. This roughness is called equilibrium and is measured by a dimensionless complex parameter using the Kragelsky–Kombalov criterion Δ. This is what will be reproduced during the period of stationary wear during the subsequent interaction of the friction pair and characterize the bearing capacity of the surface. The more the initial roughness of the friction surface determined by Ra differs from the optimal one, estimated using the Kragelsky–Kombalov criterion Δ, the greater the wear during the running-in period will be, which is one of the components of the total wear for the entirety of the friction test.
Based on the revealed positive complex effect of high hardness of the surface layer and low surface roughness [32], it was proposed to carry out PEP of samples with the highest surface layer hardness, along with poor performance in terms of roughness and surface morphology.
The use of electrolytes for PEP with various anions demonstrated a similar trend with the polishing of diffusion-saturated steels using sulfate and ammonium chloride [40]. PEP in a sulfate electrolyte leads to the formation of a more uniform surface due to the removal of the loose oxide layer and the formation of denser oxide structures in its place under the passivating action of sulfate ions. This leads to an increase in temperature in the zone of frictional contact. The formation of a morphologically homogeneous dense structure of the oxide layer results in an increase in wear resistance. It was found that after PEP in a sulfate electrolyte, the bearing capacity of the friction track profile in tribological contact, which is estimated by the Kragelsky–Kombalov criterion (the lower its value, the higher the bearing capacity), increases. As can be seen from Table 2, PEP at a voltage of 300 V and 275 V (5 and 10 min) provides the maximum bearing capacity of the profile in friction tests, which is confirmed by the minimum values of the friction coefficients for these conditions. PEP in a chloride electrolyte, as in the case of complex processing of steels, leads to an increase in surface inhomogeneity and roughness. This is also reflected in the decrease in tribological properties. The bearing capacity of such a surface decreases, and under certain processing conditions, the destruction of friction bonds changes from soft plastic displacement to microcutting.
It was proposed to carry out PEP of CP-Ti after PENC in a fluoride electrolyte. A more intensive removal of the oxide layer and the formation of a uniform surface with a low roughness value are shown. Such a surface with a retained diffusion layer with high hardness leads to the formation of a friction surface profile with a high bearing capacity. This is reflected in the lower values of the coefficient of friction, mass wear, and volume wear compared to the use of sulfate and ammonium chloride-based electrolytes.

5. Conclusions

The structure, morphology, roughness, and tribological characteristics of the surface of CP-Ti after PENC and subsequent PEP in various electrolytes and conditions have been studied. The possibility of controlling the surface characteristics of products made of titanium alloys using duplex plasma electrolytic treatment is shown. This technology makes it possible to eliminate the existing shortcomings of plasma electrolytic diffusion saturation, which consist in the formation of a morphologically inhomogeneous surface. The influence on the operational characteristics of the surface is proved not only by the structure and composition of the modified surface layers, but also by the surface morphology. This study describes the mechanism of processes, which will allow the future development of technological processes for the surface treatment of products based on titanium alloys to control performance properties.

Author Contributions

Conceptualization, S.K. and S.G.; methodology, T.M., I.T., I.K. and S.S.; validation, S.K., I.S. and M.K.; formal analysis, I.K. and S.S.; investigation, T.M., I.T., R.B. and R.N.; resources, S.K., I.S. and S.G.; writing—original draft preparation, S.K., I.K. and I.S.; writing—review and editing, S.K., M.K. and S.G.; visualization, T.M., I.T. and S.S.; supervision, S.K.; project administration, I.S.; funding acquisition, S.G. All authors have read and agreed to the published version of the manuscript.

Funding

This work was funded by the state assignment of the Ministry of Science and Higher Education of the Russian Federation, Project No. FSFS-2021-0006. The study was carried out using the equipment of the Center of Collective Use of MSUT “STANKIN” supported by the Ministry of Higher Education of the Russian Federation.

Institutional Review Board Statement

Not applicable.

Informed Consent Statement

Not applicable.

Data Availability Statement

Not applicable.

Conflicts of Interest

The authors declare no conflict of interest.

References

  1. Yin, F.; Hu, S.; Xu, R.; Han, X.; Qian, D.; Wei, W.; Hua, L.; Zhao, K. Strain rate sensitivity of the ultrastrong gradient nanocrystalline 316L stainless steel and its rate-dependent modeling at nanoscale. Int. J. Plast. 2020, 129, 102696. [Google Scholar] [CrossRef]
  2. Li, P.; Hu, S.; Liu, Y.; Hua, L.; Yin, F. Surface Nanocrystallization and Numerical Modeling of 316L Stainless Steel during Ultrasonic Shot Peening Process. Metals 2022, 12, 1673. [Google Scholar] [CrossRef]
  3. Chen, Y.; Deng, S.; Zhu, C.; Hu, K.; Yin, F. The effect of ultrasonic shot peening on the fatigue life of alloy materials: A review. Int. J. Comput. Mater. Sci. Surf. Eng. 2021, 10, 209–234. [Google Scholar] [CrossRef]
  4. Yerokhin, A.L.; Nie, X.; Leyland, A.; Matthews, A.; Dowey, S. Plasma electrolysis for surface engineering. Surf. Coat. Technol. 1999, 122, 73–93. [Google Scholar] [CrossRef]
  5. Mora-Sanchez, H.; Pixner, F.; Buzolin, R.; Mohedano, M.; Arrabal, R.; Warchomicka, F.; Matykina, E. Combination of Electron Beam Surface Structuring and Plasma Electrolytic Oxidation for Advanced Surface Modification of Ti6Al4V Alloy. Coatings 2022, 12, 1573. [Google Scholar] [CrossRef]
  6. Perez, H.; Vargas, G.; Magdaleno, C.; Silva, R. Article: Oxy-Nitriding AISI 304 Stainless Steel by Plasma Electrolytic Surface Saturation to Increase Wear Resistance. Metals 2023, 13, 309. [Google Scholar] [CrossRef]
  7. Marcuz, N.; Ribeiro, R.P.; Rangel, E.C.; Cristino da Cruz, N.; Correa, D.R.N. The Effect of PEO Treatment in a Ta-Rich Electrolyte on the Surface and Corrosion Properties of Low-Carbon Steel for Potential Use as a Biomedical Material. Metals 2023, 13, 520. [Google Scholar] [CrossRef]
  8. Aliofkhazraei, M.; Macdonald, D.D.; Matykina, E.; Parfenov, E.V.; Egorkin, V.S.; Curran, J.A.; Troughton, S.C.; Sinebryukhov, S.L.; Gnedenkov, S.V.; Lampke, T.; et al. Review of plasma electrolytic oxidation of titanium substrates: Mechanism, properties, applications and limitations. Appl. Surf. Sci. Adv. 2021, 5, 100121. [Google Scholar] [CrossRef]
  9. Jin, S.; Ma, X.; Wu, R.; Wang, G.; Zhang, J.; Krit, B.; Betsofen, S.; Liu, B. Advances in micro-arc oxidation coatings on Mg-Li alloys. Appl. Surf. Sci. Adv. 2022, 8, 100219. [Google Scholar] [CrossRef]
  10. Bogdashkina, N.L.; Gerasimov, M.V.; Zalavutdinov, R.K.; Kasatkina, I.V.; Krit, B.L.; Lyudin, V.B.; Fedichkin, I.D.; Shcherbakov, A.I.; Apelfeld, A.V. Influence of Nickel Sulfate Additives to Electrolytes Subjected to Microarc Oxidation on the Structure, Composition, and Properties of Coatings Formed on Titanium. Surf. Eng. Appl. Electrochem. 2018, 54, 331–337. [Google Scholar] [CrossRef]
  11. Bordbar-Khiabani, A.; Ebrahimi, S.; Yarmand, B. Highly corrosion protection properties of plasma electrolytic oxidized titanium using rGO nanosheets. Appl. Surf. Sci. 2019, 486, 153–165. [Google Scholar] [CrossRef]
  12. Kim, S.-P.; Kaseem, M.; Choe, H.-C. Plasma electrolytic oxidation of Ti-25Nb-xTa alloys in solution containing Ca and P ions. Surf. Coat. Technol. 2020, 395, 125916. [Google Scholar] [CrossRef]
  13. Maltanava, H.; Stojadinovic, S.; Vasilic, R.; Karpushenkov, S.; Belko, N.; Samtsov, M.; Poznyak, S. Photoluminescent Coatings on Zinc Alloy Prepared by Plasma Electrolytic Oxidation in Aluminate Electrolyte. Coatings 2023, 13, 848. [Google Scholar] [CrossRef]
  14. Stojadinović, S.; Jovović, J.; Petković, M.; Vasilić, R.; Konjević, N. Spectroscopic and Real-Time Imaging Investigation of Tantalum Plasma Electrolytic Oxidation (PEO). Surf. Coat. Technol. 2011, 205, 5406–5413. [Google Scholar] [CrossRef]
  15. Schorn, L.; Wilkat, M.; Lommen, J.; Borelli, M.; Muhammad, S.; Rana, M. Plasma Electrolytic Polished Patient-Specific Orbital Implants in Clinical Use—A Technical Note. J. Pers. Med. 2023, 13, 148. [Google Scholar] [CrossRef]
  16. Danilov, I.; Hackert-Oschatzchen, M.; Zinecker, M.; Meichsner, G.; Edelmann, J.; Schubert, A. Process Understanding of Plasma Electrolytic Polishing through Multiphysics Simulation and Inline Metrology. Micromachines 2019, 10, 214. [Google Scholar] [CrossRef] [Green Version]
  17. Cornelsen, M.; Deutsch, C.; Seitz, H. Electrolytic Plasma Polishing of Pipe Inner Surfaces. Metals 2017, 8, 12. [Google Scholar] [CrossRef] [Green Version]
  18. Navickaitė, K.; Ianniciello, L.; Tušek, J.; Engelbrecht, K.; Bahl, C.R.H.; Penzel, M.; Nestler, K.; Böttger-Hiller, F.; Zeidler, H. Plasma Electrolytic Polishing of Nitinol: Investigation of Functional Properties. Materials 2021, 14, 6450. [Google Scholar] [CrossRef]
  19. Nestler, K.; Böttger-Hiller, F.; Adamitzki, W.; Glowa, G.; Zeidler, H.; Schubert, A. Plasma electrolytic polishing—An overview of applied technologies and current challenges to extend the polishable material range. Procedia CIRP 2016, 42, 503–507. [Google Scholar] [CrossRef]
  20. Ma, G.; Li, S.; Liu, X.; Yin, X.; Jia, Z.; Liu, F. Combination of Plasma Electrolytic Processing and Mechanical Polishing for Single-Crystal 4H-SiC. Micromachines 2021, 12, 606. [Google Scholar] [CrossRef]
  21. Parfenov, E.V.; Farrakhov, R.G.; Mukaeva, V.R.; Gusarov, A.V.; Nevyantseva, R.R.; Yerokhin, A. Electric field effect on surface layer removal during electrolytic plasma polishing. Surf. Coat. Technol. 2016, 307, 1329–1340. [Google Scholar] [CrossRef]
  22. Stepputat, V.N.; Zeidler, H.; Safranchik, D.; Strokin, E.; Böttger-Hiller, F. Investigation of Post-Processing of Additively Manufactured Nitinol Smart Springs with Plasma-Electrolytic Polishing. Materials 2021, 14, 4093. [Google Scholar] [CrossRef] [PubMed]
  23. Ablyaz, T.R.; Shlykov, E.S.; Muratov, K.R.; Osinnikov, I.V.; Bannikov, M.V.; Sidhu, S.S. Investigation of Plasma-Electrolytic Processing on EDMed Austenitic Steels. Materials 2023, 16, 4127. [Google Scholar] [CrossRef] [PubMed]
  24. Zhang, T.; Wu, J.; Jin, L.; Zhang, Z.; Rong, W.; Zhang, B.; Wang, Y.; He, Y.; Liu, W.; Li, X. Enhancing the mechanical and anticorrosion properties of 316L stainless steel via a cathodic plasma electrolytic nitriding treatment with added PEG. J. Mater. Sci. Technol. 2019, 35, 2630–2637. [Google Scholar] [CrossRef]
  25. Nie, X.; Wang, L.; Yao, Z.C.; Zhang, L.; Cheng, F. Sliding wear behaviour of electrolytic plasma nitrided cast iron and steel. Surf. Coat. Technol. 2005, 200, 1745–1750. [Google Scholar] [CrossRef]
  26. Taheri, P.; Dehghanian, C.; Aliofkhazraei, M.; Rouhaghdam, A.S. Evaluation of Nanocrystalline Microstructure, Abrasion, and Corrosion Properties of Carbon Steel Treated by Plasma Electrolytic Boriding. Plasma Process. Polym. 2007, 4, S711–S716. [Google Scholar] [CrossRef]
  27. Kuzenkov, S.E.; Saushkin, B.P. Borating of steel 45 in electrolytic plasma. Surf. Eng. Appl. Electrochem. 1996, 6, 10–15. [Google Scholar]
  28. Aliofkhazraei, M.; Taheri, P.; Sabour Rouhaghdam, A.; Dehghanian, C. Study of nanocrystalline plasma electrolytic carbonitriding for CP-Ti. Mater. Sci. 2007, 43, 791–799. [Google Scholar] [CrossRef]
  29. Dong, Y.-X.; Chen, Y.-S.; Chen, Q.; Liu, B.; Song, Z.-X. Characterization and blood compatibility of TiCxN1−x hard coating prepared by plasma electrolytic carbonitriding. Surf. Coat. Technol. 2007, 201, 8789–8795. [Google Scholar] [CrossRef]
  30. Hu, Z.; Xie, F.; Liu, Y.; Wu, X. Study of plasma electrolytic nitrocarburizing on surface of titanium alloy. Mater. Rev. 2008, 4. Available online: http://en.cnki.com.cn/Article_en/CJFDTOTAL-CLDB200804037.htm (accessed on 5 June 2023).
  31. Li, X.-M.; Han, Y. Mechanical properties of Ti(C0.7N0.3) film produced by plasma electrolytic carbonitriding of Ti6Al4V alloy. Appl. Surf. Sci. 2008, 254, 6350–6357. [Google Scholar] [CrossRef]
  32. Kusmanov, S.A.; Tambovskii, I.V.; Korableva, S.S.; Mukhacheva, T.L.; D’yakonova, A.D.; Nikiforov, R.V.; Naumov, A.R. Wear resistance increase in Ti6Al4V titanium alloy using a cathodic plasma electrolytic nitriding. Surf. Eng. Appl. Electrochem. 2022, 58, 451–455. [Google Scholar] [CrossRef]
  33. Aliofkhazraei, M.; Rouhaghdam, A.S.; Denshmaslak, A.; Jafarian, H.R.; Sabouri, M. Study of bipolar pulsed nanocrystalline plasma electrolytic carbonitriding on nanostructure of compound layer for CP-Ti. J. Coat. Technol. Res. 2008, 5, 497–503. [Google Scholar] [CrossRef]
  34. Aliev, M.K.; Sabour, A.; Taheri, P. Corrosion Protection Study of Nanocrystalline Plasma-Electrolytic Carbonitriding Process for CP-Ti. Prot. Met. Phys. Chem. Surf. 2008, 44, 618–623. [Google Scholar] [CrossRef]
  35. Kong, J.H.; Okumiya, M.; Tsunekavwa, Y.; Takeda, T.; Yun, K.Y.; Yoshida, M.; Kim, S.G. Surface Modification of SCM420 Steel by Plasma Electrolytic Treatment. Surf. Coat. Technol. 2013, 232, 275–282. [Google Scholar] [CrossRef]
  36. Kusmanov, S.A.; Kusmanova, Y.V.; Smirnov, A.A.; Belkin, P.N. Modification of steel surface by plasma electrolytic saturation with nitrogen and carbon. Mater. Chem. Phys. 2016, 175, 164–171. [Google Scholar] [CrossRef]
  37. Tambovskiy, I.; Mukhacheva, T.; Gorokhov, I.; Suminov, I.; Silkin, S.; Dyakov, I.; Kusmanov, S.; Grigoriev, S. Features of Cathodic Plasma Electrolytic Nitrocarburizing of Low-Carbon Steel in an Aqueous Electrolyte of Ammonium Nitrate and Glycerin. Metals 2022, 12, 1773. [Google Scholar] [CrossRef]
  38. Kusmanov, S.A.; Kusmanova, Y.V.; Naumov, A.R.; Belkin, P.N. Formation of diffusion layers by anode plasma electrolytic nitrocarburising of low carbon steel. J. Mater. Eng. Perform. 2015, 24, 3187–3193. [Google Scholar] [CrossRef]
  39. Mukhacheva, T.; Kusmanov, S.; Suminov, I.; Podrabinnik, P.; Khmyrov, R.; Grigoriev, S. Increasing Wear Resistance of Low-Carbon Steel by Anodic Plasma Electrolytic Sulfiding. Metals 2022, 12, 1641. [Google Scholar] [CrossRef]
  40. Kusmanov, S.; Tambovskiy, I.; Korableva, S.; Silkin, S.; Naumov, A. Modification of Steel Surface by Anodic Plasma Electrolytic Boriding and Polishing. Trans. Indian Inst. Met. 2022, 75, 3185–3192. [Google Scholar] [CrossRef]
Figure 1. Schematic diagram for plasma electrolytic treatment: 1—electrolyte; 2—cold water; 3—heat exchanger; 4—power supply; 5—treated sample; 6—electrolytic cell; 7—flowmeter; 8—pump.
Coatings 13 01363 g001
Figure 2. The voltage–temperature characteristic of PENC.
Coatings 13 01363 g002
Figure 3. Friction scheme.
Coatings 13 01363 g003
Figure 4. Morphology of the CP-Ti surface after PENC at different treatment temperatures: (a) 750 °C; (b) 800 °C; (c) 850 °C; (d) 900 °C.
Coatings 13 01363 g004
Figure 5. SEM image of cross-section of the CP-Ti surface after PENC and microhardness distribution at different treatment temperatures: (a) 750 °C; (b) 800 °C; (c) 850 °C; (d) 900 °C. 1—oxide layer; 2—outer hardened layer; 3—diffusion layer; 4—initial structure. Yellow dotted line is the division of structural elements on the microstructure, red curve is the microhardness values.
Coatings 13 01363 g005
Figure 6. Dependence of friction coefficient on sliding distance of the untreated and PENC samples.
Coatings 13 01363 g006
Figure 7. Morphology of the CP-Ti surface after (a) PENC at 900 °C, (b) PEP in a solution of ammonium sulfate (3%) at 300 V for 3 min, (c) PEP in a solution of ammonium chloride (1%) at 300 V for 3 min, and (d) PEP in a solution of ammonium fluoride (4%) at 300 V for 3 min.
Coatings 13 01363 g007
Figure 8. Dependence of friction coefficient on sliding distance of the untreated and treated samples after PENC at 900 °C and subsequent PEP in a solution of ammonium sulfate (3%) at different times and voltages: (a) 275 V; (b) 300 V; (c) 325 V.
Coatings 13 01363 g008
Figure 9. Dependence of friction coefficient on sliding distance of the untreated and treated samples after PENC at 900 °C and subsequent PEP in a solution of ammonium chloride (1%) at different times and voltages: (a) 275 V; (b) 300 V; (c) 325 V.
Coatings 13 01363 g009
Figure 10. Dependence of friction coefficient on sliding distance of the untreated and treated samples after PENC at 900 °C and subsequent PEP in a solution of ammonium fluoride (4%) at different times and voltages: (a) 275 V; (b) 300 V; (c) 325 V.
Coatings 13 01363 g010
Table 1. Values of surface roughness Ra, average friction coefficient over the last 100 m of the path with friction μ per 1 km, friction track temperature over the last 100 m of the path at friction Tfr per 1 km, weight loss during friction at 1 km of the path Δmfr, magnitude of the absolute penetration in the tribocontact h, relative penetration of the deformed surfaces of the tribocontact h/r, and Kragelsky–Kombalov criterion Δ of CP-Ti samples after PENC at different temperatures T.
T (°C)Ra (μm)μTfr (°C)Δmfr (mg)h (μm)h/rΔ
Untreated1.00 ± 0.100.465 ± 0.00556.03.70 ± 0.040.1500.0620.58
7500.61 ± 0.150.318 ± 0.00353.30.85 ± 0.010.1310.0520.51
8000.57 ± 0.140.428 ± 0.00465.01.45 ± 0.020.1340.0580.52
8500.55 ± 0.140.421 ± 0.00487.03.75 ± 0.040.1300.0510.52
9000.80 ± 0.120.417 ± 0.00490.96.50 ± 0.080.1360.0500.54
Table 2. Values of weight loss Δm, surface roughness Ra, average friction coefficient over the last 100 m of the path with friction μ per 1 km, friction track temperature over the last 100 m of the path at friction Tfr per 1 km, weight loss during friction at 1 km of the path Δmfr, volume loss during friction at 1 km of the path ΔVfr, magnitude of the absolute penetration in the tribocontact h, relative penetration of the deformed surfaces of the tribocontact h/r, and Kragelsky–Kombalov criterion Δ of CP-Ti samples after PENC at 900 °C and subsequent PEP in a solution of ammonium sulfate (3%) at different voltage U and time t.
U (V)t (min)Δm (mg)Ra (μm)μTfr (°C)Δmfr (mg)ΔVfr (mm3)h (μm)h/rΔ
Untreated1.00 ± 0.100.465563.705.620.1500.0620.58
PENC at 900 °C0.80 ± 0.120.417916.507.940.1360.0500.54
27511.40.86 ± 0.100.4671302.833.020.1580.0690.56
34.00.89 ± 0.070.4131162.652.990.1550.0670.53
54.70.89 ± 0.080.2571141.141.080.1230.0480.44
106.41.09 ± 0.120.2491020.821.020.1210.0440.40
30012.80.87 ± 0.070.2921100.931.120.1310.0530.48
34.70.90 ± 0.080.3041130.901.140.1350.0570.49
56.50.89 ± 0.130.2991110.901.040.1320.0550.48
109.60.85 ± 0.060.2621080.900.980.1310.0540.45
32513.90.94 ± 0.040.3621071.111.280.1340.0580.50
34.30.92 ± 0.100.3741061.211.240.1350.0600.51
57.10.87 ± 0.090.3721081.101.260.1360.0600.51
109.90.85 ± 0.060.3601061.171.300.1350.0580.50
Table 3. Values of weight loss Δm, surface roughness Ra, average friction coefficient over the last 100 m of the path with friction μ per 1 km, friction track temperature over the last 100 m of the path at friction Tfr per 1 km, weight loss during friction at 1 km of the path Δmfr, volume loss during friction at 1 km of the path ΔVfr, magnitude of the absolute penetration in the tribocontact h, relative penetration of the deformed surfaces of the tribocontact h/r, and Kragelsky–Kombalov criterion Δ of CP-Ti samples after PENC at 900 °C and subsequent PEP in a solution of ammonium chloride (1%) at different voltage U and time t.
U (V)t (min)Δm (mg)Ra (μm)μTfr (°C)Δmfr (mg)ΔVfr (mm3)h (μm)h/rΔ
Untreated1.00 ± 0.100.465563.705.620.1500.0620.58
PENC at 900 °C0.80 ± 0.120.417916.507.940.1360.0500.54
275112.71.69 ± 0.500.7982618.2112.320.2280.0993.05
325.23.02 ± 0.560.3381002.634.820.1310.0520.51
535.25.52 ± 1.080.3761202.864.980.1380.0640.55
1064.97.22 ± 1.050.3821413.085.980.1420.0660.58
300113.01.51 ± 0.180.7732708.0512.020.2220.0803.02
320.93.11 ± 0.470.3721202.634.510.1290.0610.50
528.34.21 ± 0.340.3931333.015.620.1290.0560.49
1068.16.39 ± 0.680.4351444.086.780.1440.0680.57
325112.01.50 ± 0.140.8113108.4012.480.2360.0963.22
326.73.20 ± 0.410.7512817.628.920.2170.0932.97
534.04.25 ± 0.470.5231505.997.130.1480.0720.62
1070.85.20 ± 0.760.6221706.1210.540.2010.0922.85
Table 4. Values of weight loss Δm, surface roughness Ra, average friction coefficient over the last 100 m of the path with friction μ per 1 km, friction track temperature over the last 100 m of the path at friction Tfr per 1 km, weight loss during friction at 1 km of the path Δmfr, volume loss during friction at 1 km of the path ΔVfr, magnitude of the absolute penetration in the tribocontact h, relative penetration of the deformed surfaces of the tribocontact h/r, and Kragelsky–Kombalov criterion Δ of CP-Ti samples after PENC at 900 °C and subsequent PEP in a solution of ammonium fluoride (4%) at different voltage U and time t.
U (V)t (min)Δm (mg)Ra (μm)μTfr (°C)Δmfr (mg)ΔVfr (mm3)h (μm)h/rΔ
Untreated1.00 ± 0.100.465563.705.620.1500.0620.58
PENC at 900 °C0.80 ± 0.120.417916.507.940.1360.0500.54
275117.40.95 ± 0.070.251720.911.030.1230.0480.44
342.90.61 ± 0.050.248760.890.980.1210.0440.40
567.10.52 ± 0.080.225760.800.880.1080.0430.38
300127.41.01 ± 0.050.355852.334.020.1340.0540.56
352.50.75 ± 0.020.211750.780.740.1010.0420.32
588.20.76 ± 0.020.239740.911.030.1220.0430.37
325120.31.02 ± 0.020.360802.554.670.1350.0570.50
329.60.99 ±0.040.384842.905.440.1370.0610.53
537.10.81 ± 0.010.349822.705.010.1330.0540.49
Disclaimer/Publisher’s Note: The statements, opinions and data contained in all publications are solely those of the individual author(s) and contributor(s) and not of MDPI and/or the editor(s). MDPI and/or the editor(s) disclaim responsibility for any injury to people or property resulting from any ideas, methods, instructions or products referred to in the content.

