3.1. Surface Morphology of Metallised Polyester Fabrics
Polyester fabrics were metallised via different chemical processes; via scanning electron microscopy (SEM), changes in the polyester fabric surfaces in different stages, starting from the untreated sample to the Cu-plating sample, were examined, and they are summarised in
Figure 4.
In
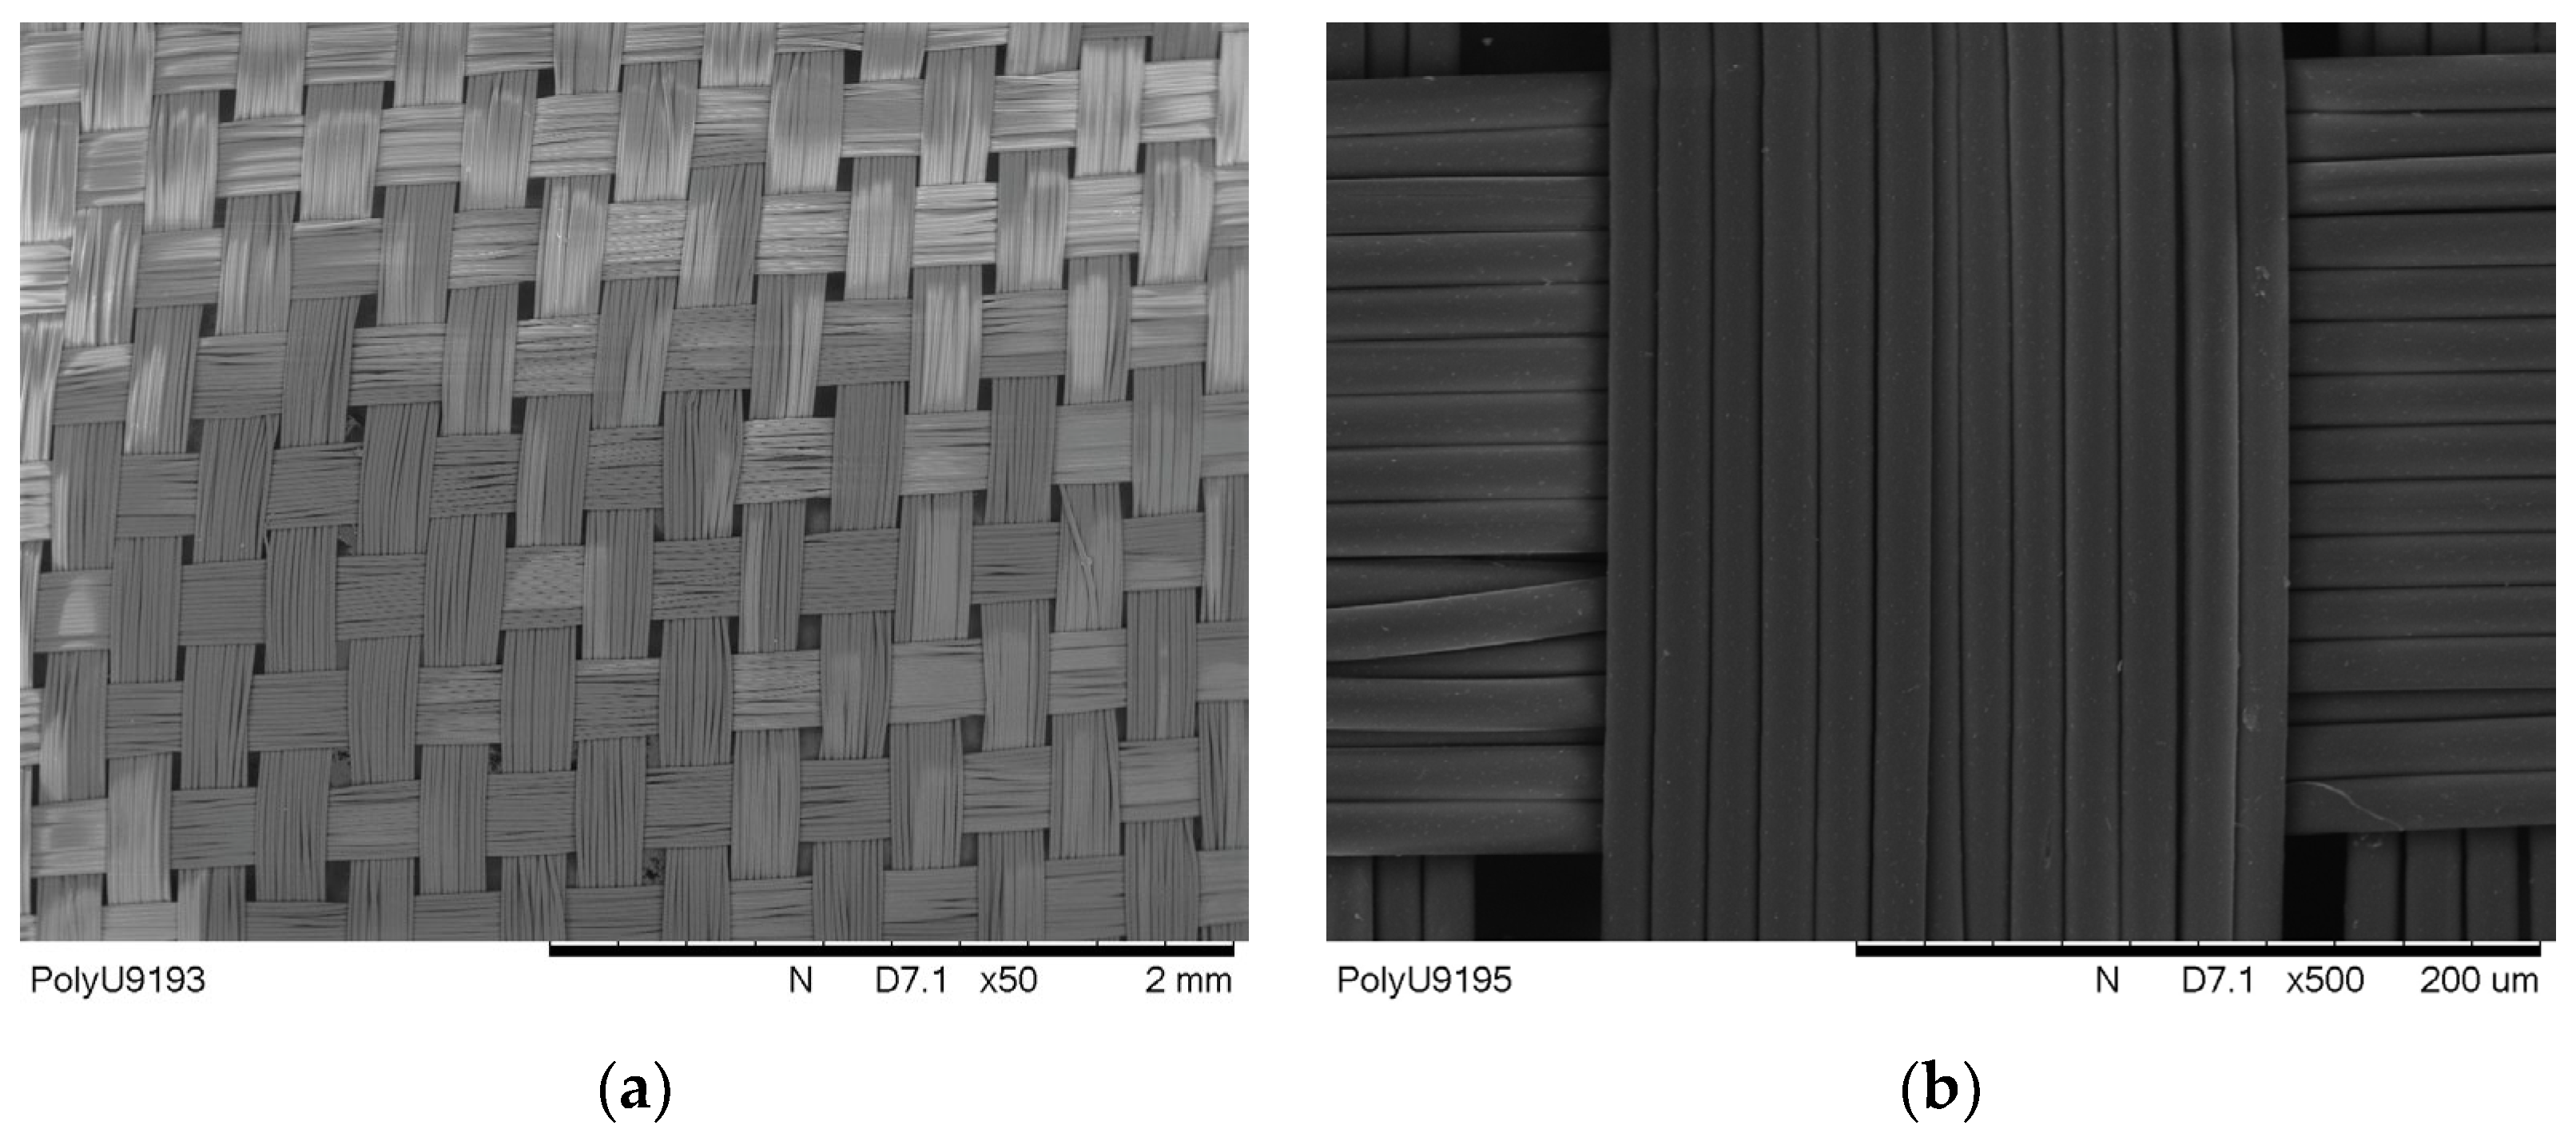
Figure 4a, the untreated polyester fabric has a uniform and clean surface, and as found via SEM estimation, the fibre diameter was 15 μm on average.
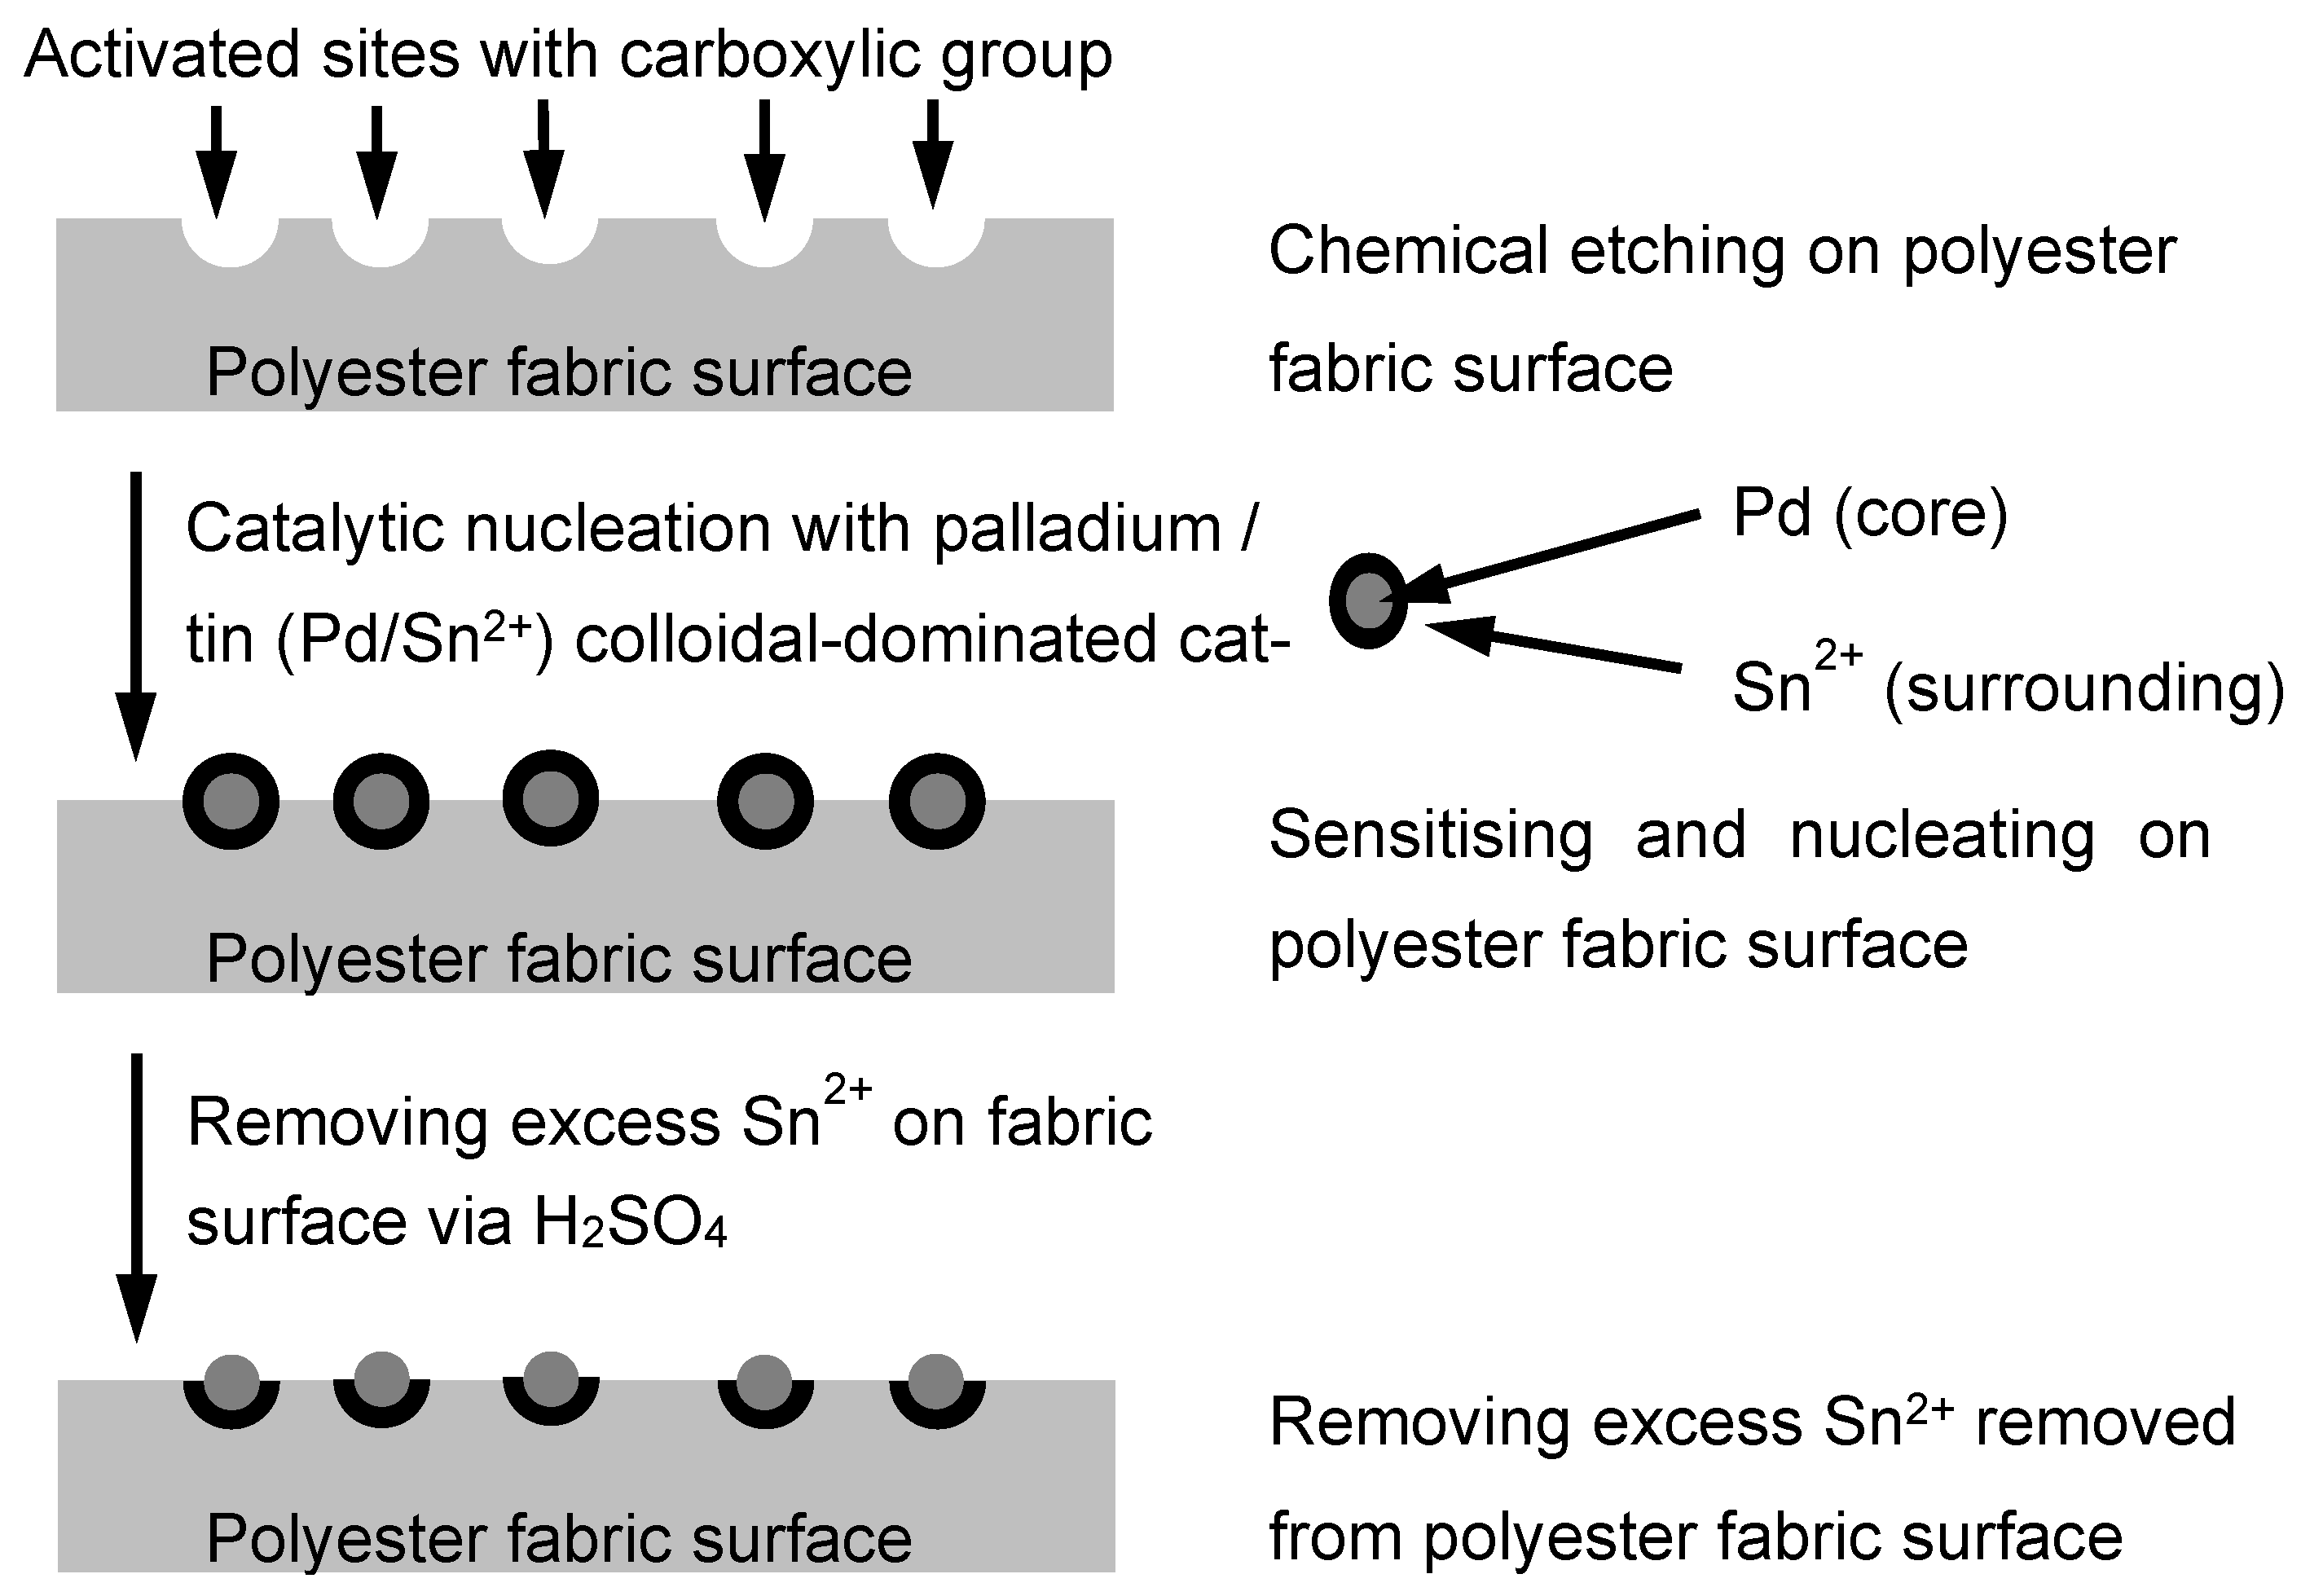
Figure 4b shows that the fabric sample was Pd-coated, a layer of Pd/Sn mixture was uniformly layered on the fibre surface and the diameter of the Pd-coated fibre was observed to be more or less the same as the untreated fibre, on average. After Ni-plating, as observed in
Figure 4c, the fibre surface became shiny, as a layer of Ni had been plated on the fibre surface, and the average diameter of the fibre increased to about 17 μm. The SEM image shows that the estimated thickness of Ni-plating is in the range of the sub-micron (with a few hundred nm). Further, for electroless Cu-plating, a glossy metal coating is noticed on the fibre surface. This Cu coating formed around the fibre surface, as presented in
Figure 4d. Via estimation, the Cu-plated polyester fibre diameter and the thickness of the Cu layer were about 20 μm and 1 μm, respectively. The estimated average fibre diameters in each stage are tabulated in
Table 4.
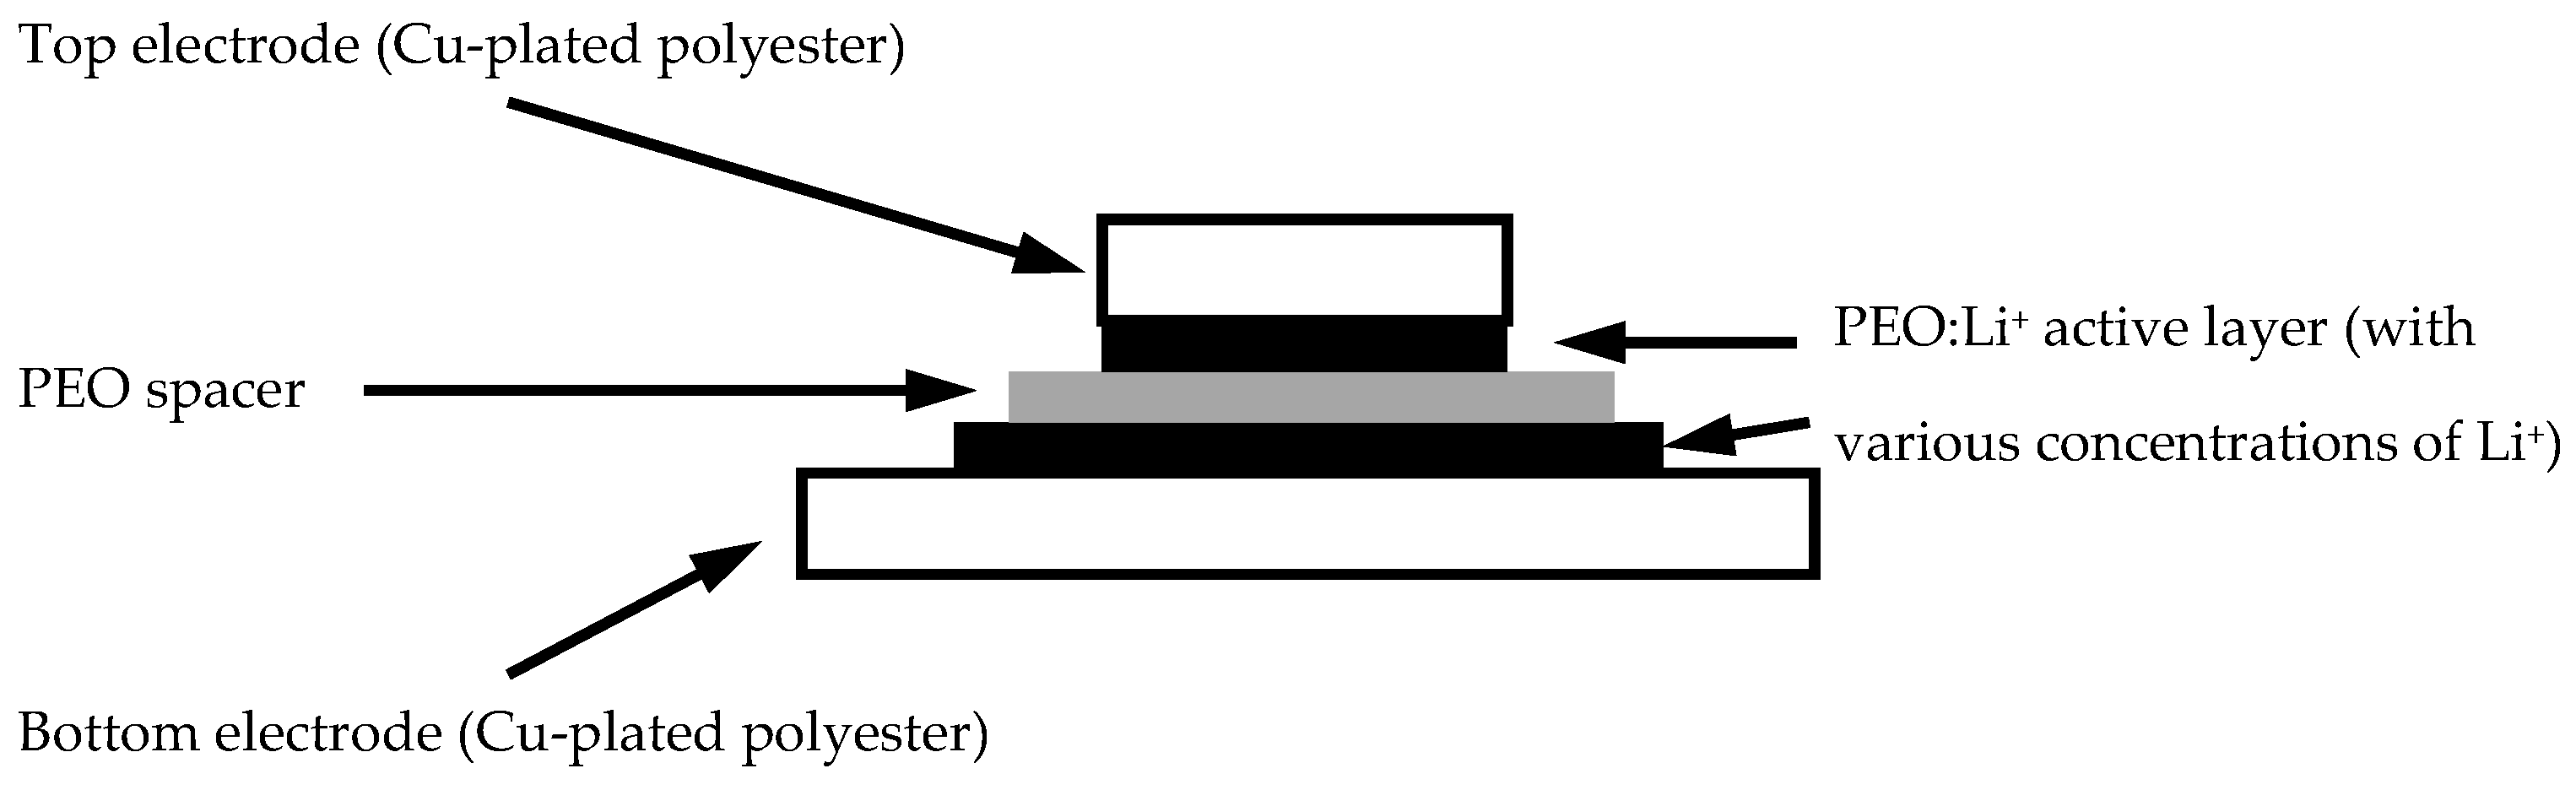
After a series of fabric metallisation processes, a PEO layer was casted on the metallised fabric surface.
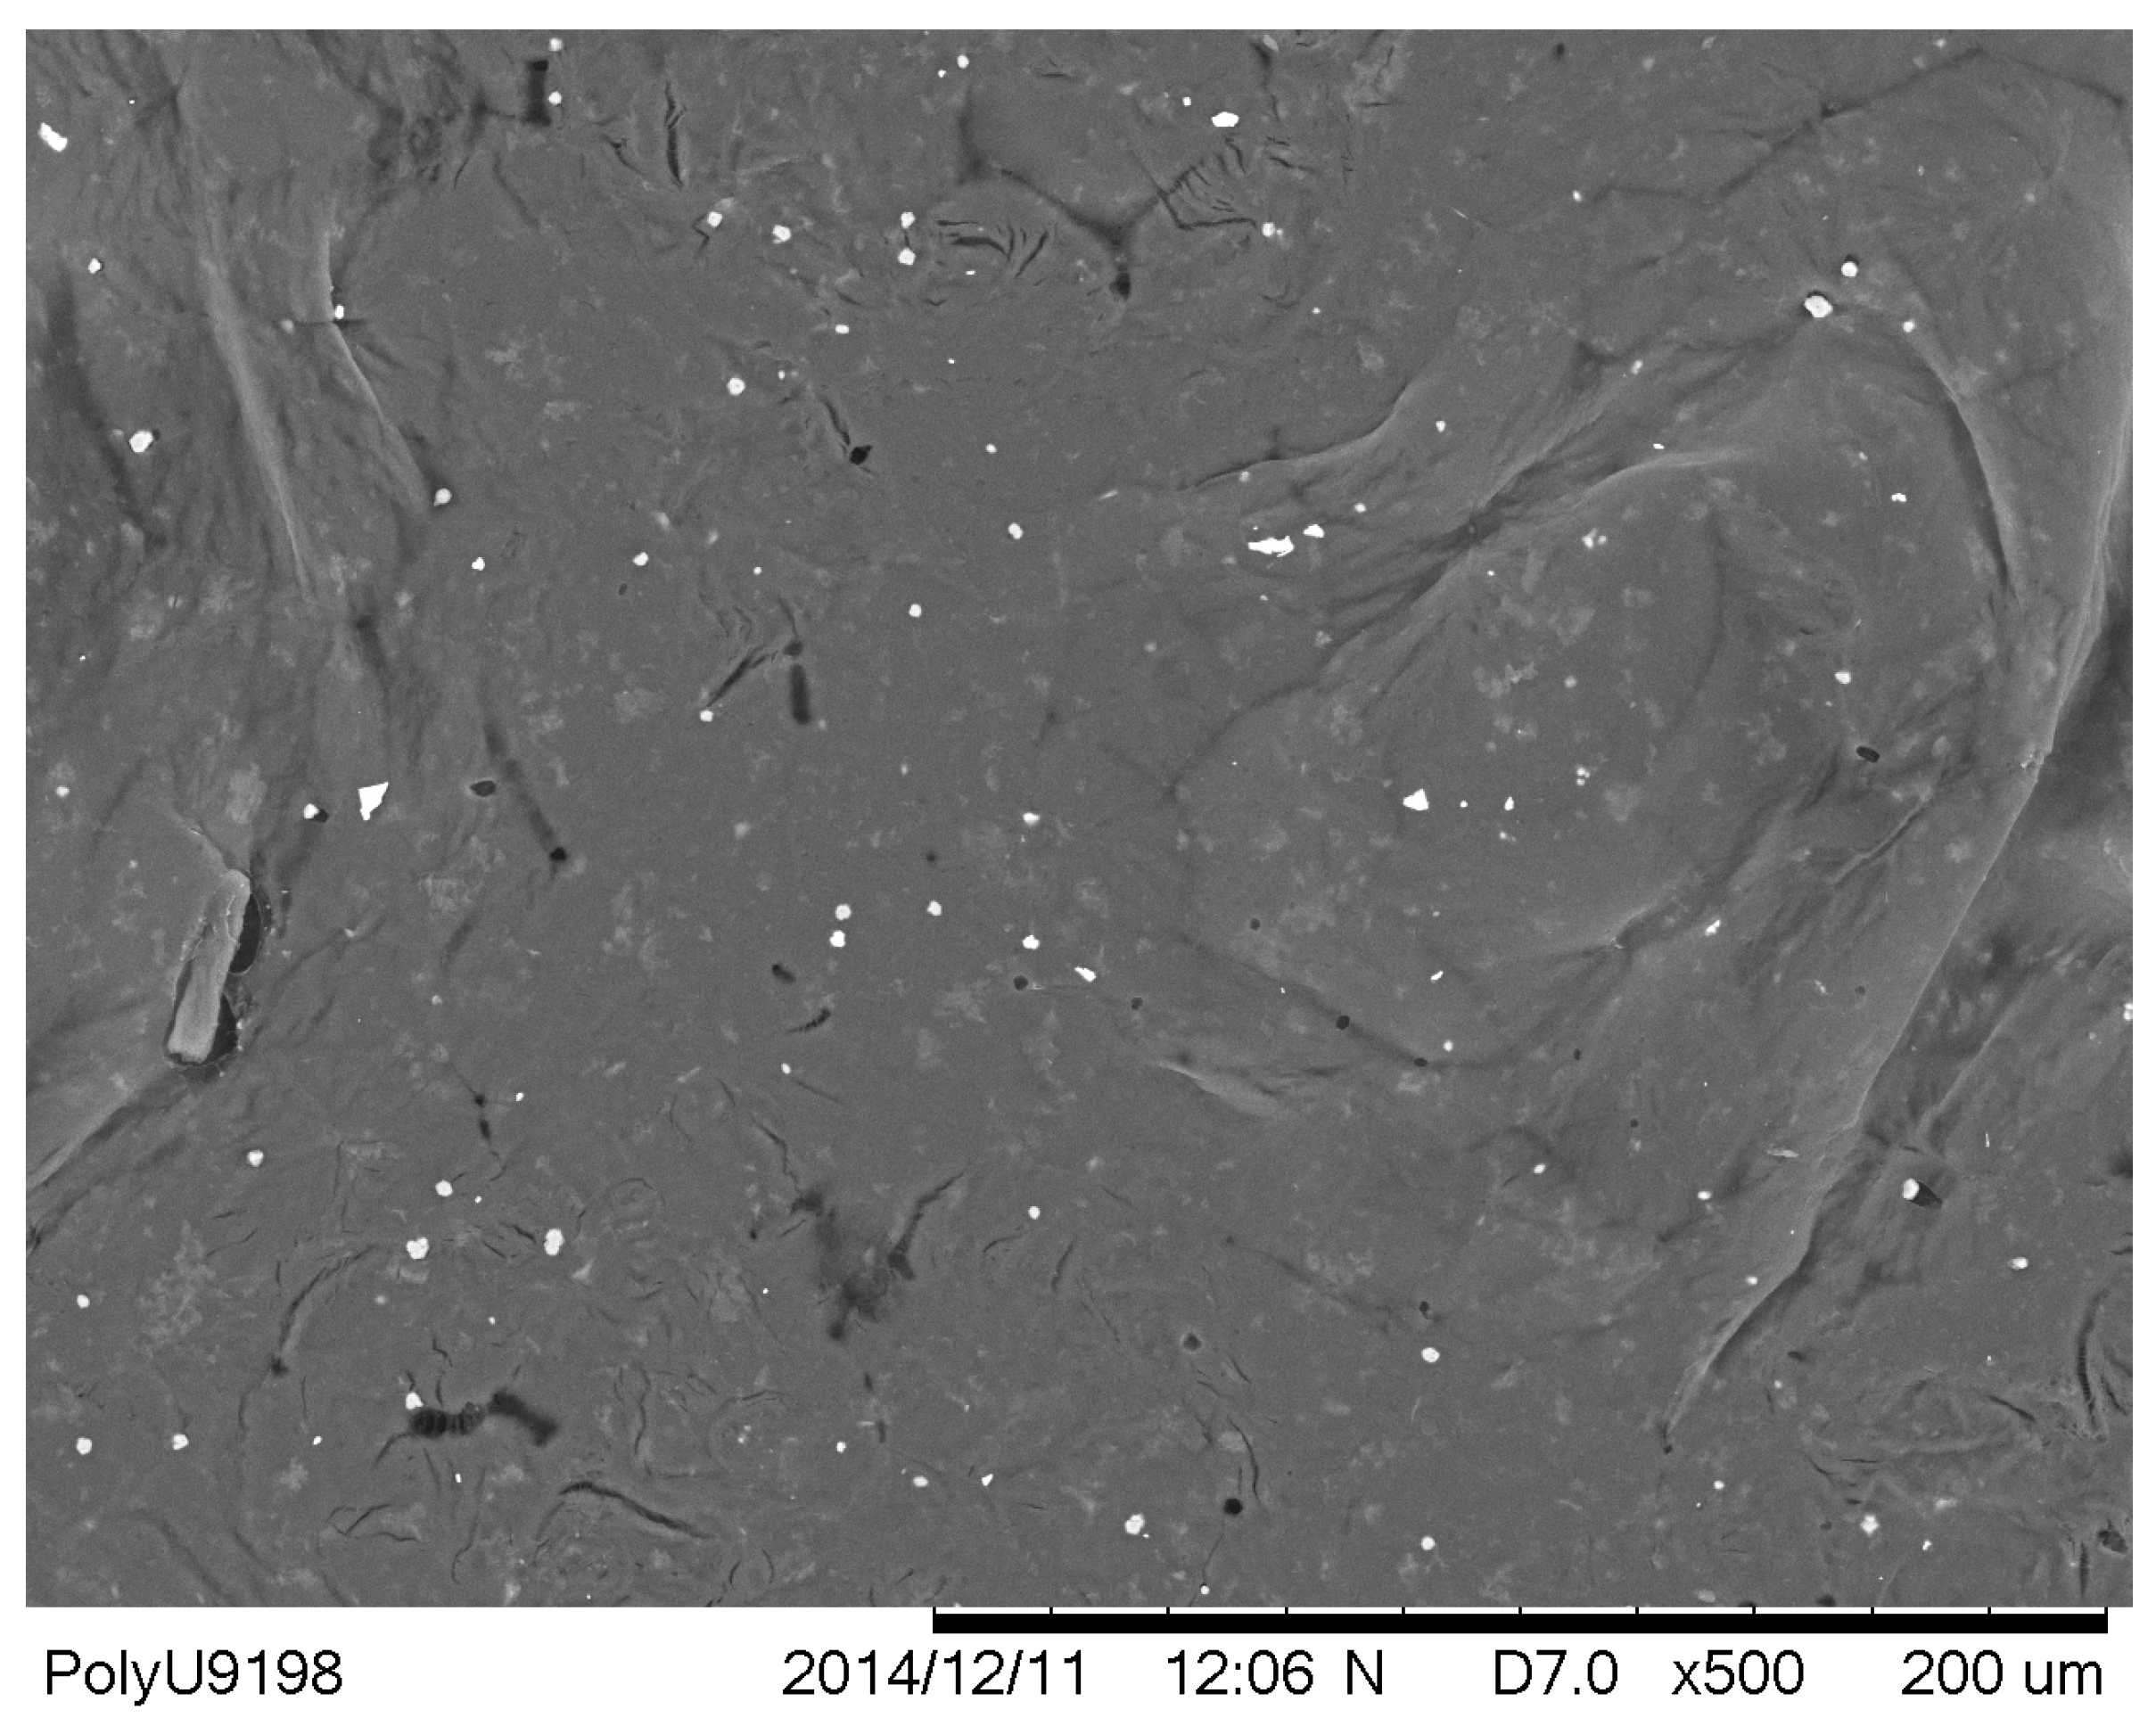
Figure 5 shows that a pure PEO layer was solution casted on the metallised polyester surface without any dopants. In the PEO layer, some particles of a white colour were found, which were crystallised PEOs that could be associated with different ionic dopants like lithium ions in a later part of the experiments, and therefore an efficient response of charging and discharging could be provided in different samples.
Commonly, the transportation of ions is usually related to ion hopping between ranges of adjacent sites in solid polymers. Via the motion of polymer chains, ions within the polymeric electrolyte in the amorphous phase can migrate in a dynamic environment at a temperature above the glass transition (T
g). Suitable coordination sites adjacent to ions are generated due to piston-like movement associated with short fragments of the polymer chains, and hence, the spontaneous hopping of ions can occur. However, if lots of atom motion in the polymer chain occurs in these segmental modes, their motions are usually slow. Therefore, the rate of ion hopping will be limited, and hence, the conductivity of the material will be affected. This mechanism becomes ineffective when crystallinity increases [
29,
30,
31].
Nevertheless, the presence of crystallised sites in some linear polymers such as PEO can exhibit enhancement in ion transport efficiency in the polymer matrix if ionic dopants are present, as both mechanisms are concurrently present and competing in the PEO matrix. Therefore, the amorphous phase of the material will no longer dominate the conductivity of the PEO matrix [
32,
33].
3.3. Frequency Responses of PEO-Based EDL Capacitors with Various LiClO4 Concentrations
Other than surface morphology, electrical properties of various EDL capacitors with different LiClO4 concentrations were examined. An impedance analyser ranging from 40 to 110 MHz was used to investigate the electrical properties of PEO-based samples, parameters involving series capacitance (Cs), the dissipation factor (D), series resistance (R), series reactance (X) and absolute impedance (|Z|), and the phase difference between the resistance and reactance (θ) was measured.
Various PEO-based supercapacitor samples were connected to the impedance analyser, their Cs were measured and their corresponding specific capacitance values were determined. Their specific capacitances at several testing frequencies (40, 1 K, 100 K and 100 MHz) are tabulated in
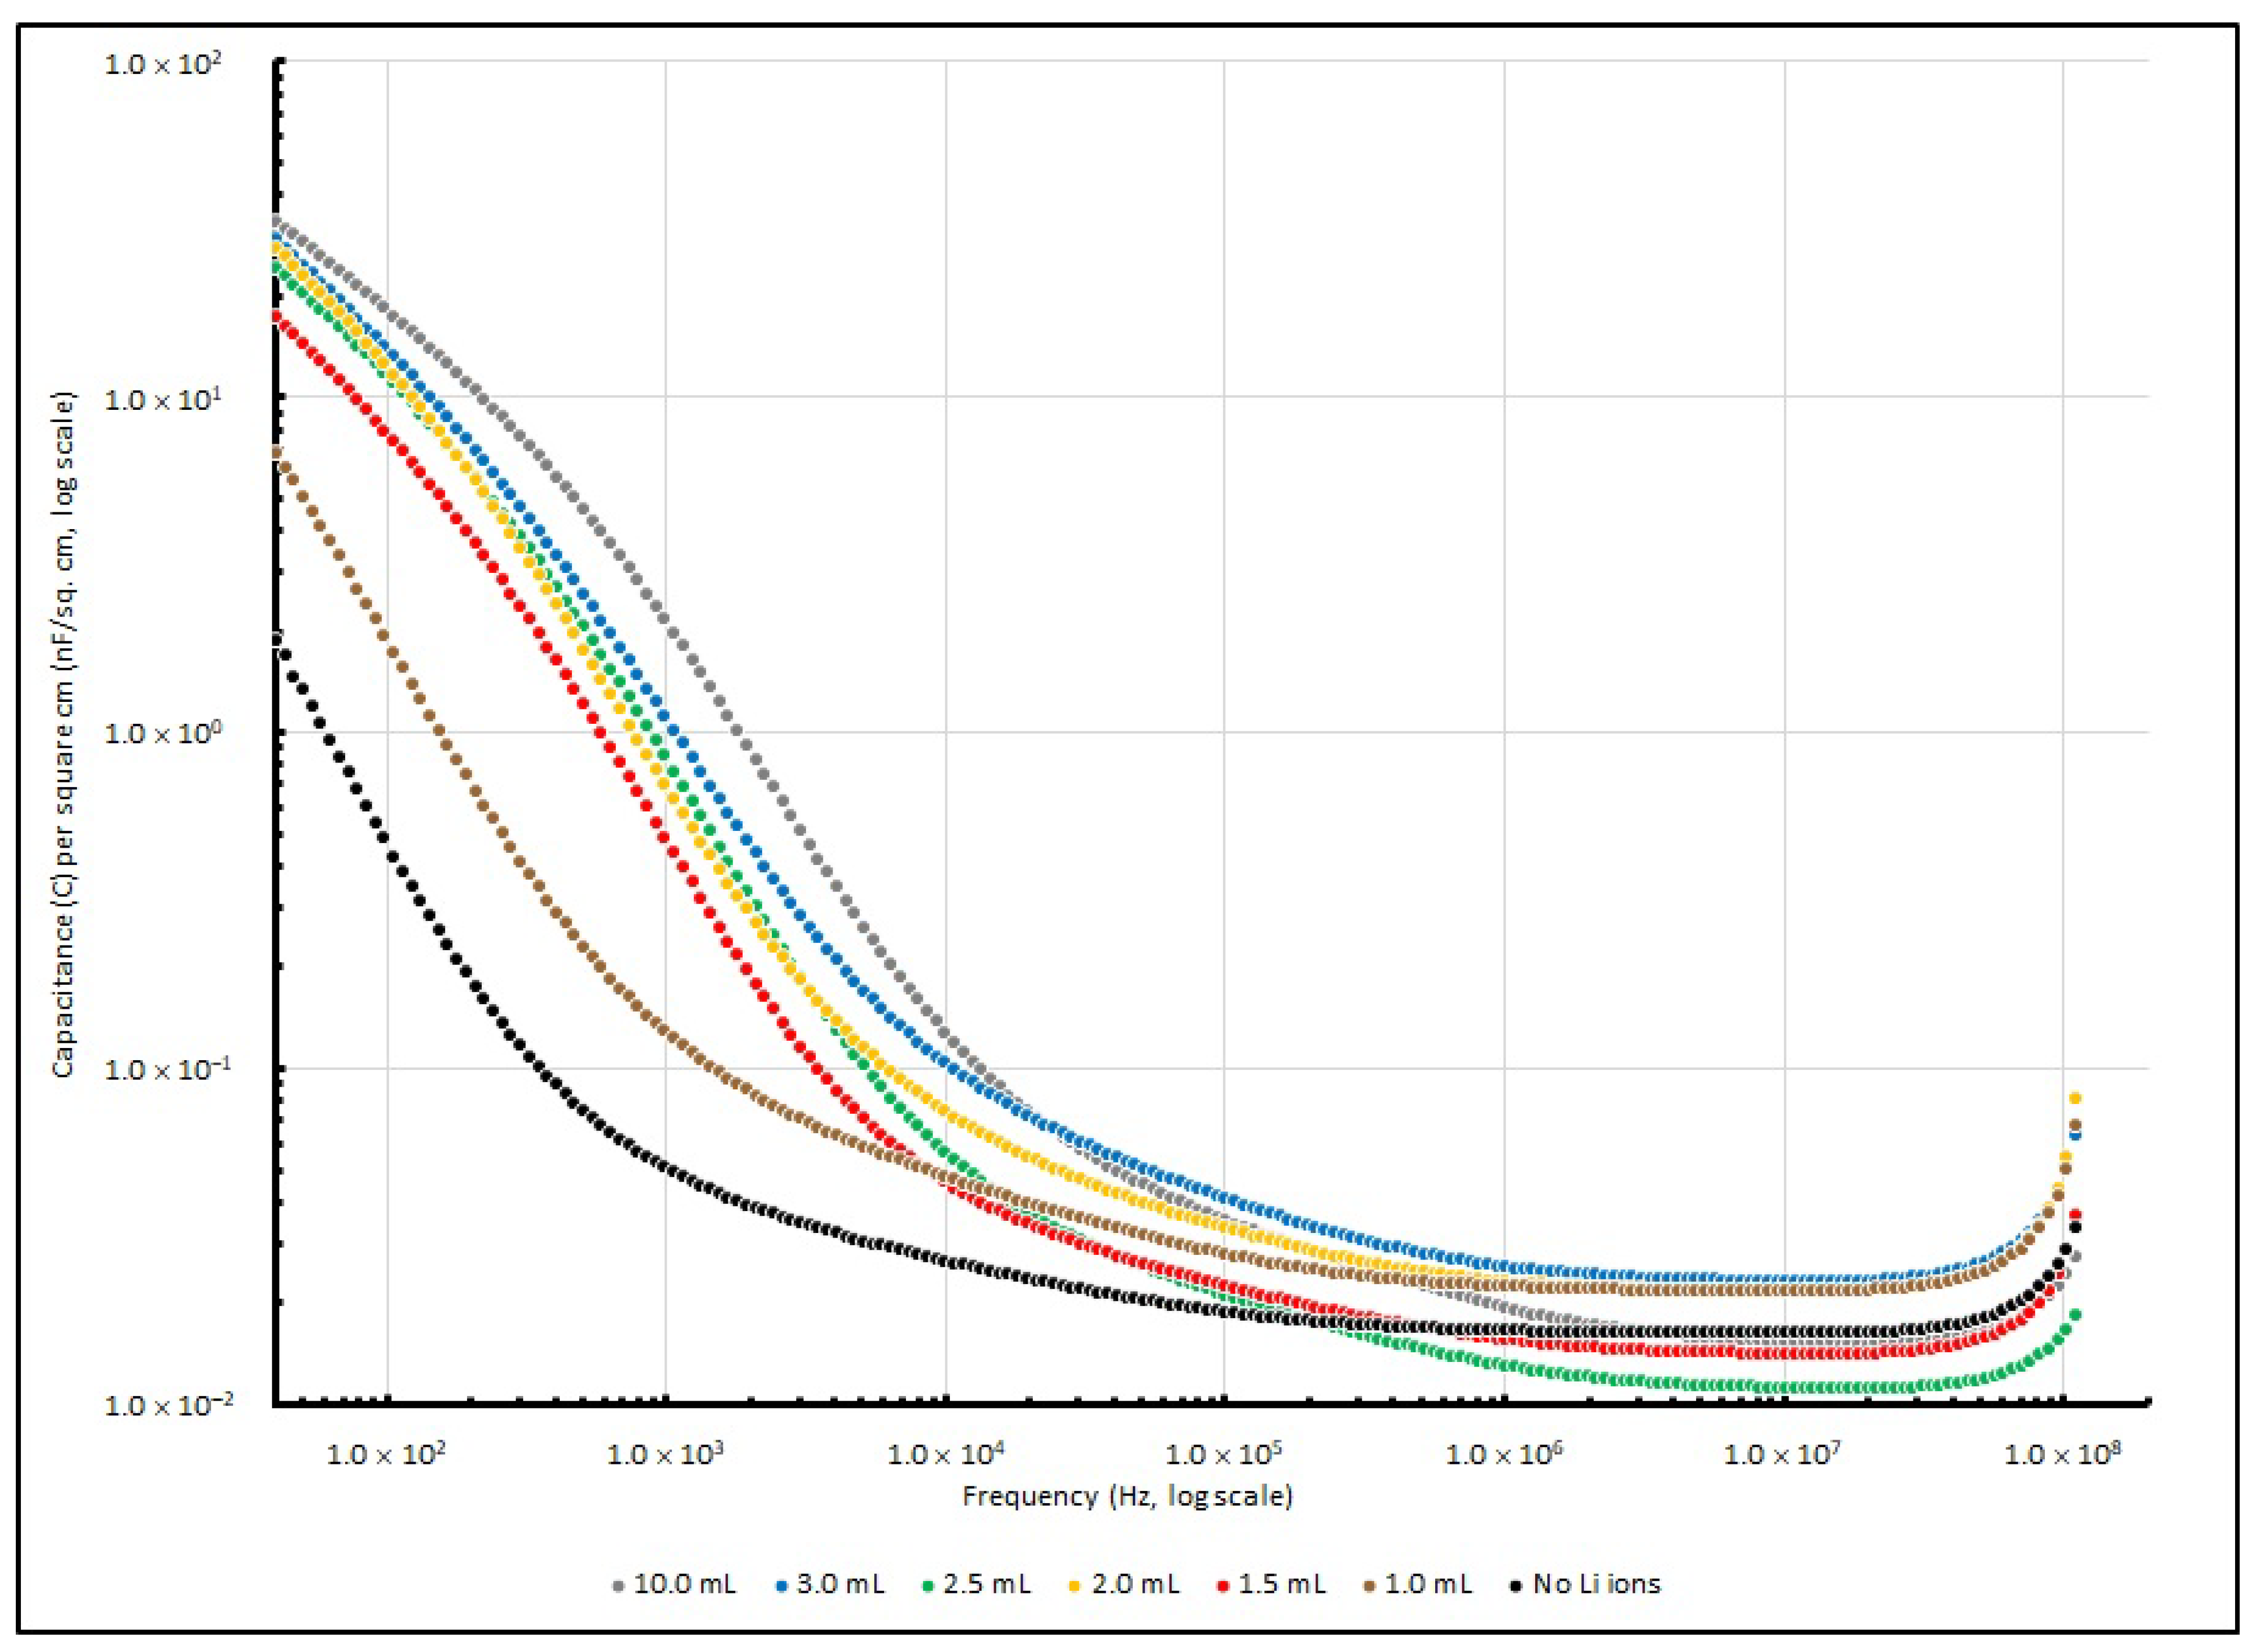
Table 6, while the changes in specific capacitance are illustrated in
Figure 6.
At a lower frequency range (<1 kHz), the increase in Li
+ ions determines the increase in specific capacitance of PEO-based samples. The control sample without any lithium ions exhibited a specific capacitance of 1.89 nF/cm
2 at 40 Hz, and it was significantly increased by 263% to 6.86 nF/cm
2 when the Li
+ amount had raised to 1.0 ml; then, it eventually raised to 33.56 nF/cm
2 after the Li
+ amount was increased to 10.0 ml. When the frequency reached 1 kHz, the specific capacitances of the samples rose with the Li
+ amount from 0.05 nF/cm
2 (no Li
+ added) to 0.12 nF/cm
2 (1.0 ml) and reached 2.00 nF/cm
2 (10.0 mL). Nevertheless, when the frequency was raised to 100 kHz or even higher, the effect from different amounts of LiClO
4 became less significant, and the specific capacitance of the samples with different Li
+ concentrations stayed at around 0.05 nF/cm
2. Generally, PEO is a polymer that is neutral and non-charged. The polymer chains in it are well aligned, or in other words, it is highly crystalline. However, high crystallinity is not favourable for charges to migrate in the polymer matrix. Therefore, when dopants like Li
+ ions are added into the PEO matrix, these ions will reduce the crystallinity of the matrix and the ionic conductivity will increase; hence, the charge storage capability will increase. When the Li
+ concentration increased from 0.001 to 0.01, more ions were found in the PEO matrix, which contributed more to the conductivity of the ions, and the competence of the energy storage in the EDL capacitor system was enhanced. Therefore, the specific capacitance of the capacitor can be increased [
34,
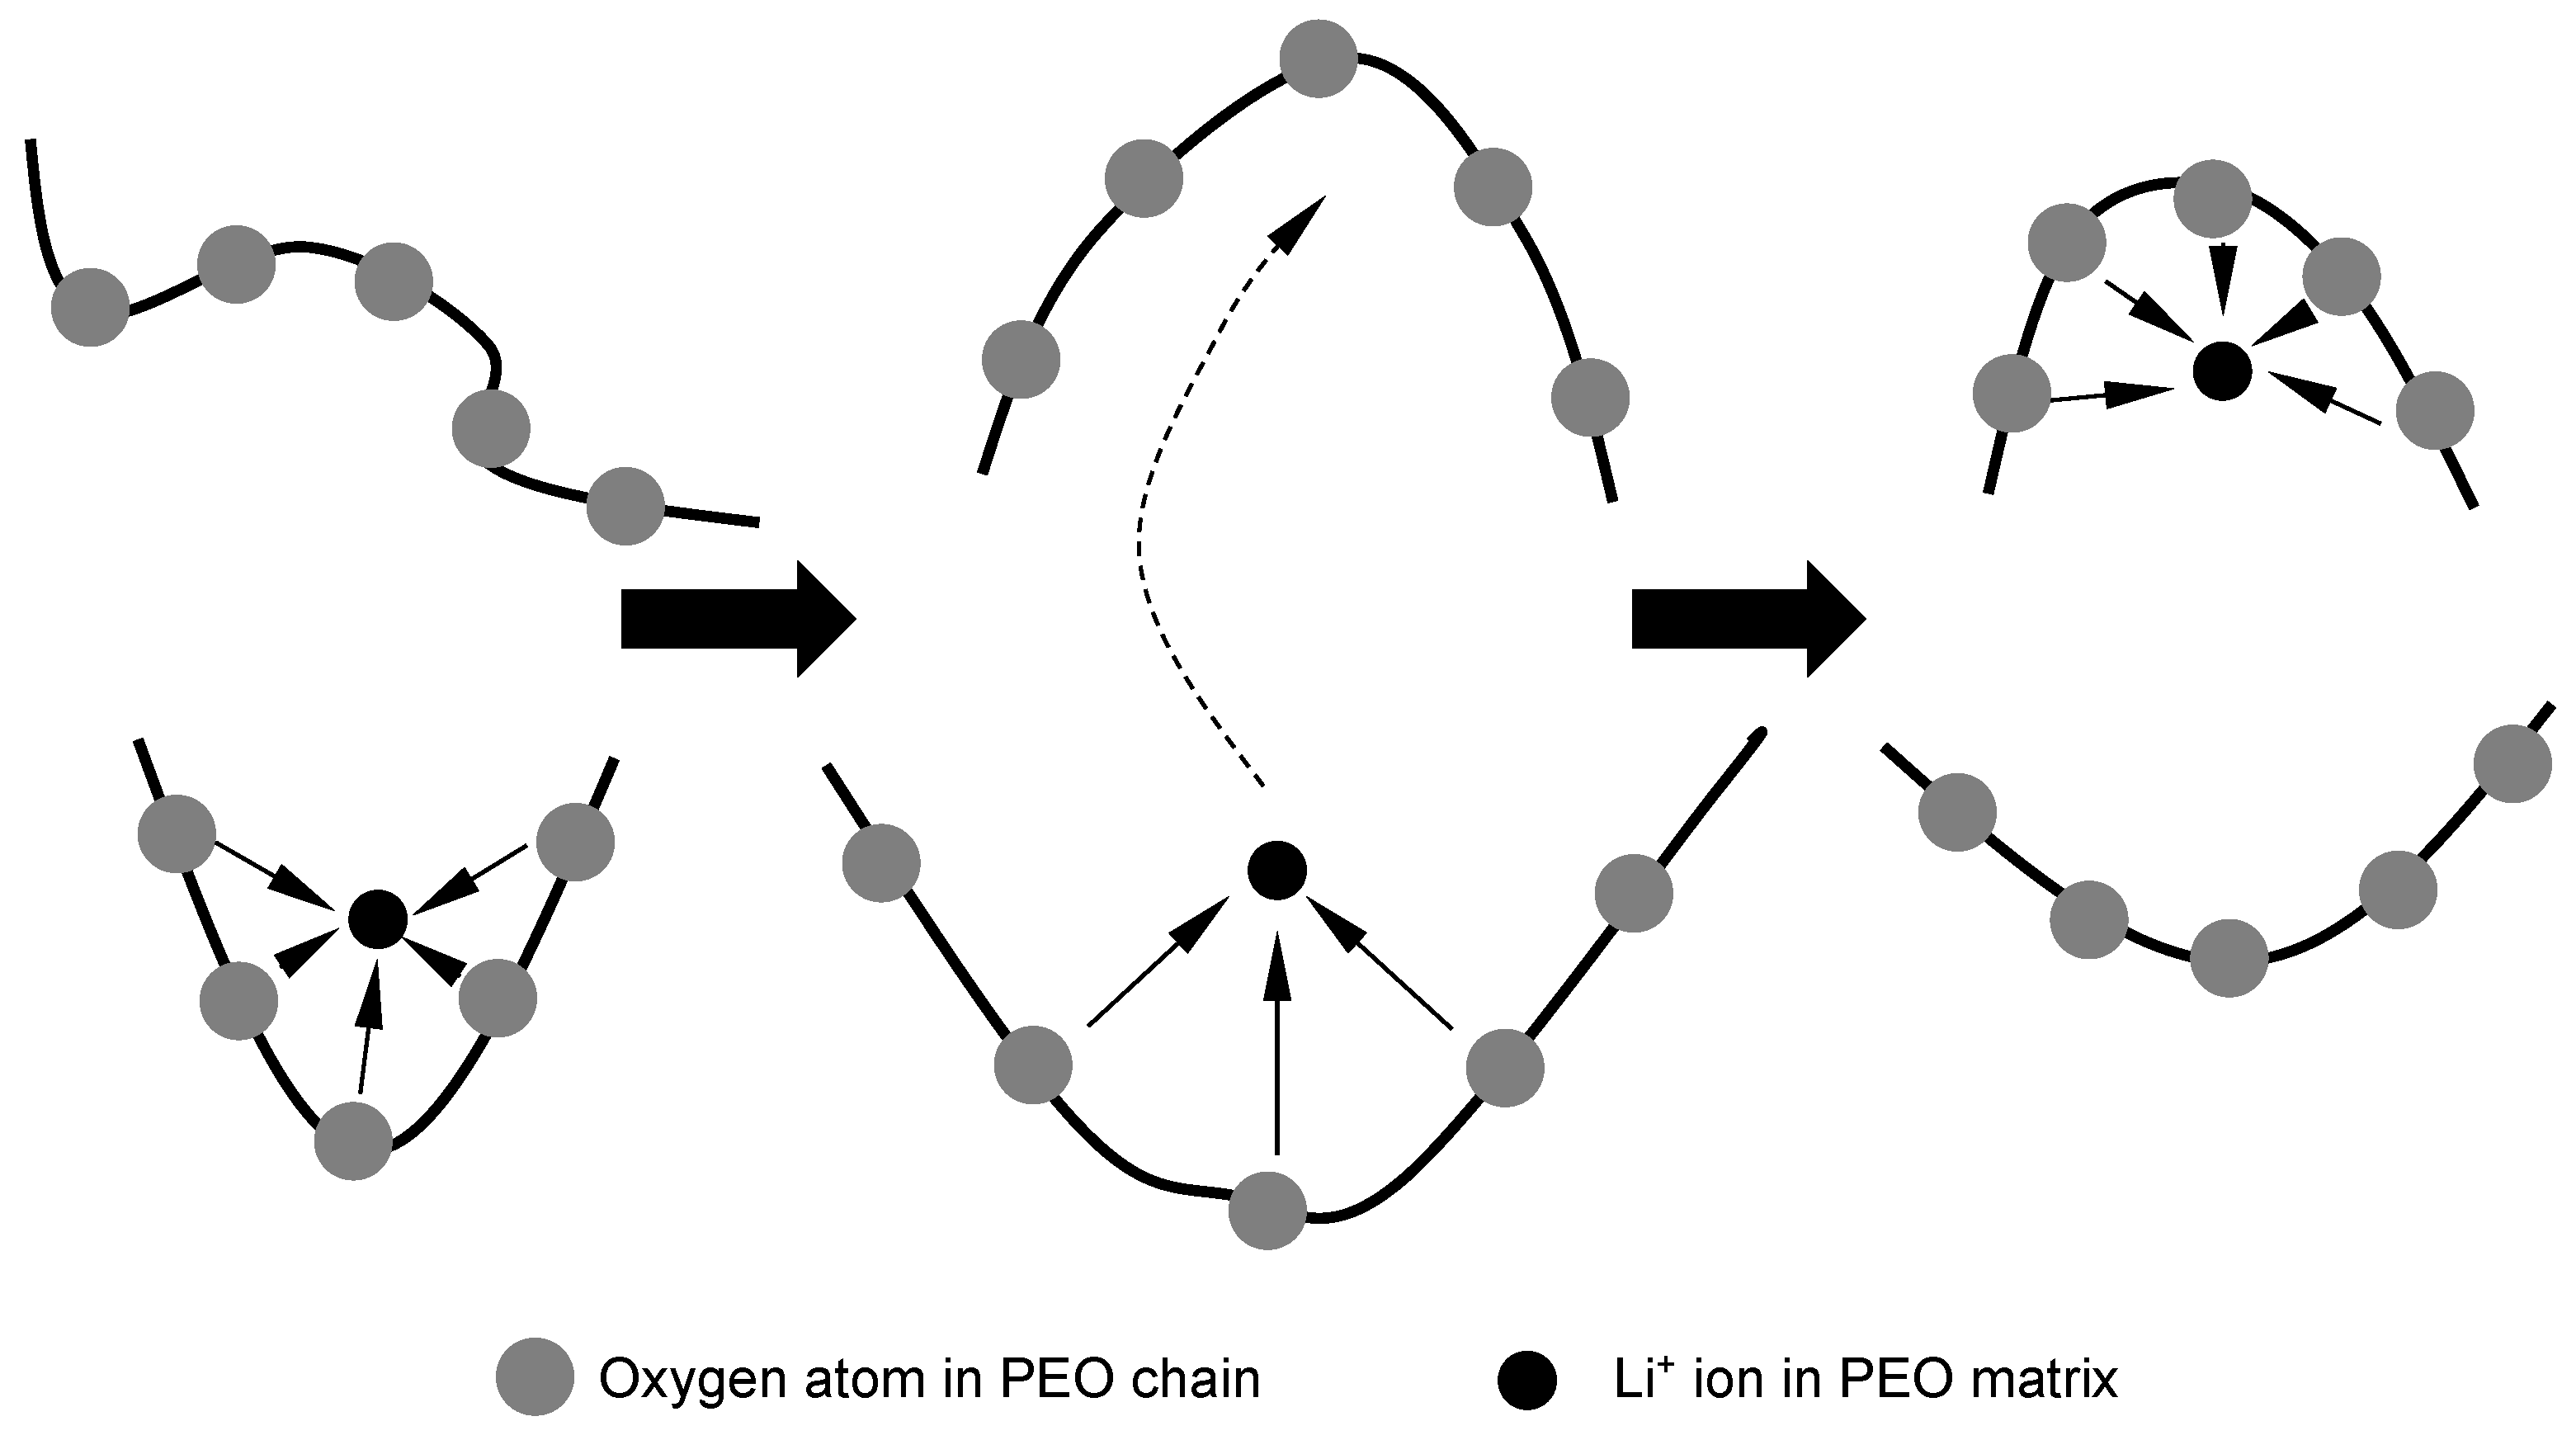
35]. As moieties are the main constitutive units in the oligoether structure, they are beneficial for the dissolving of alkali salts such as LiClO
4, and they can be found in the backbone of polymer chains or their side branches. Additionally, the total lithium salt concentration in the PEO cast ruled the dissociation degree of the salt dissolved in it. Generally speaking, an increase in salt concentration gives a decrease in the dissociation degree. In some of the latest reports, an optimal salt concentration has been suggested by researchers, and lithium ions have been said to form complexes in linear oligo(ethylene oxide), such as PEO with oxygen (of ethylene oxide units) in a molar ratio of around 0.04. Moreover, some researchers have reported that molecular dynamic simulations show that in a PEO chain, approximately five ether oxygen molecules bond with a Li
+ ion to form complexes, and this combination of molecules may hinder the mobility of cations. Therefore, Li
+ ions’ mobility is highly dependent on the motions of Li
+-containing complexation sites with PEO chains. The lithium ion motions between these complexation sites which are maintained by PEO matrix segmental motion are illustrated in
Figure 7 [
36].
On the other hand, in the capacitor, the dissipation factor (
D) can be stated as follows:
where
Xc is the capacitive reactance and
Req is the equivalent resistance of the electrochemical system.
Req signifies the capacitor loss which can be derived with physical origins in both dipole relaxation phenomena and the dielectric’s conduction electrons. The connection can be stated as follows:
where
ε is the lossless permittivity of the dielectric,
C is the lossless capacitance of the dielectric material,
σ is the dielectric material’s conductivity and
ω is the angular frequency of the voltage applied into the electrochemical system. Meanwhile,
Xc is related to
where
f is the sinusoid signal implemented into the measured EDL system. If Equations (2) and (3) are substituted into Equation (1),
D can be expressed as follows:
where
D is a variable that is frequency-dependent.
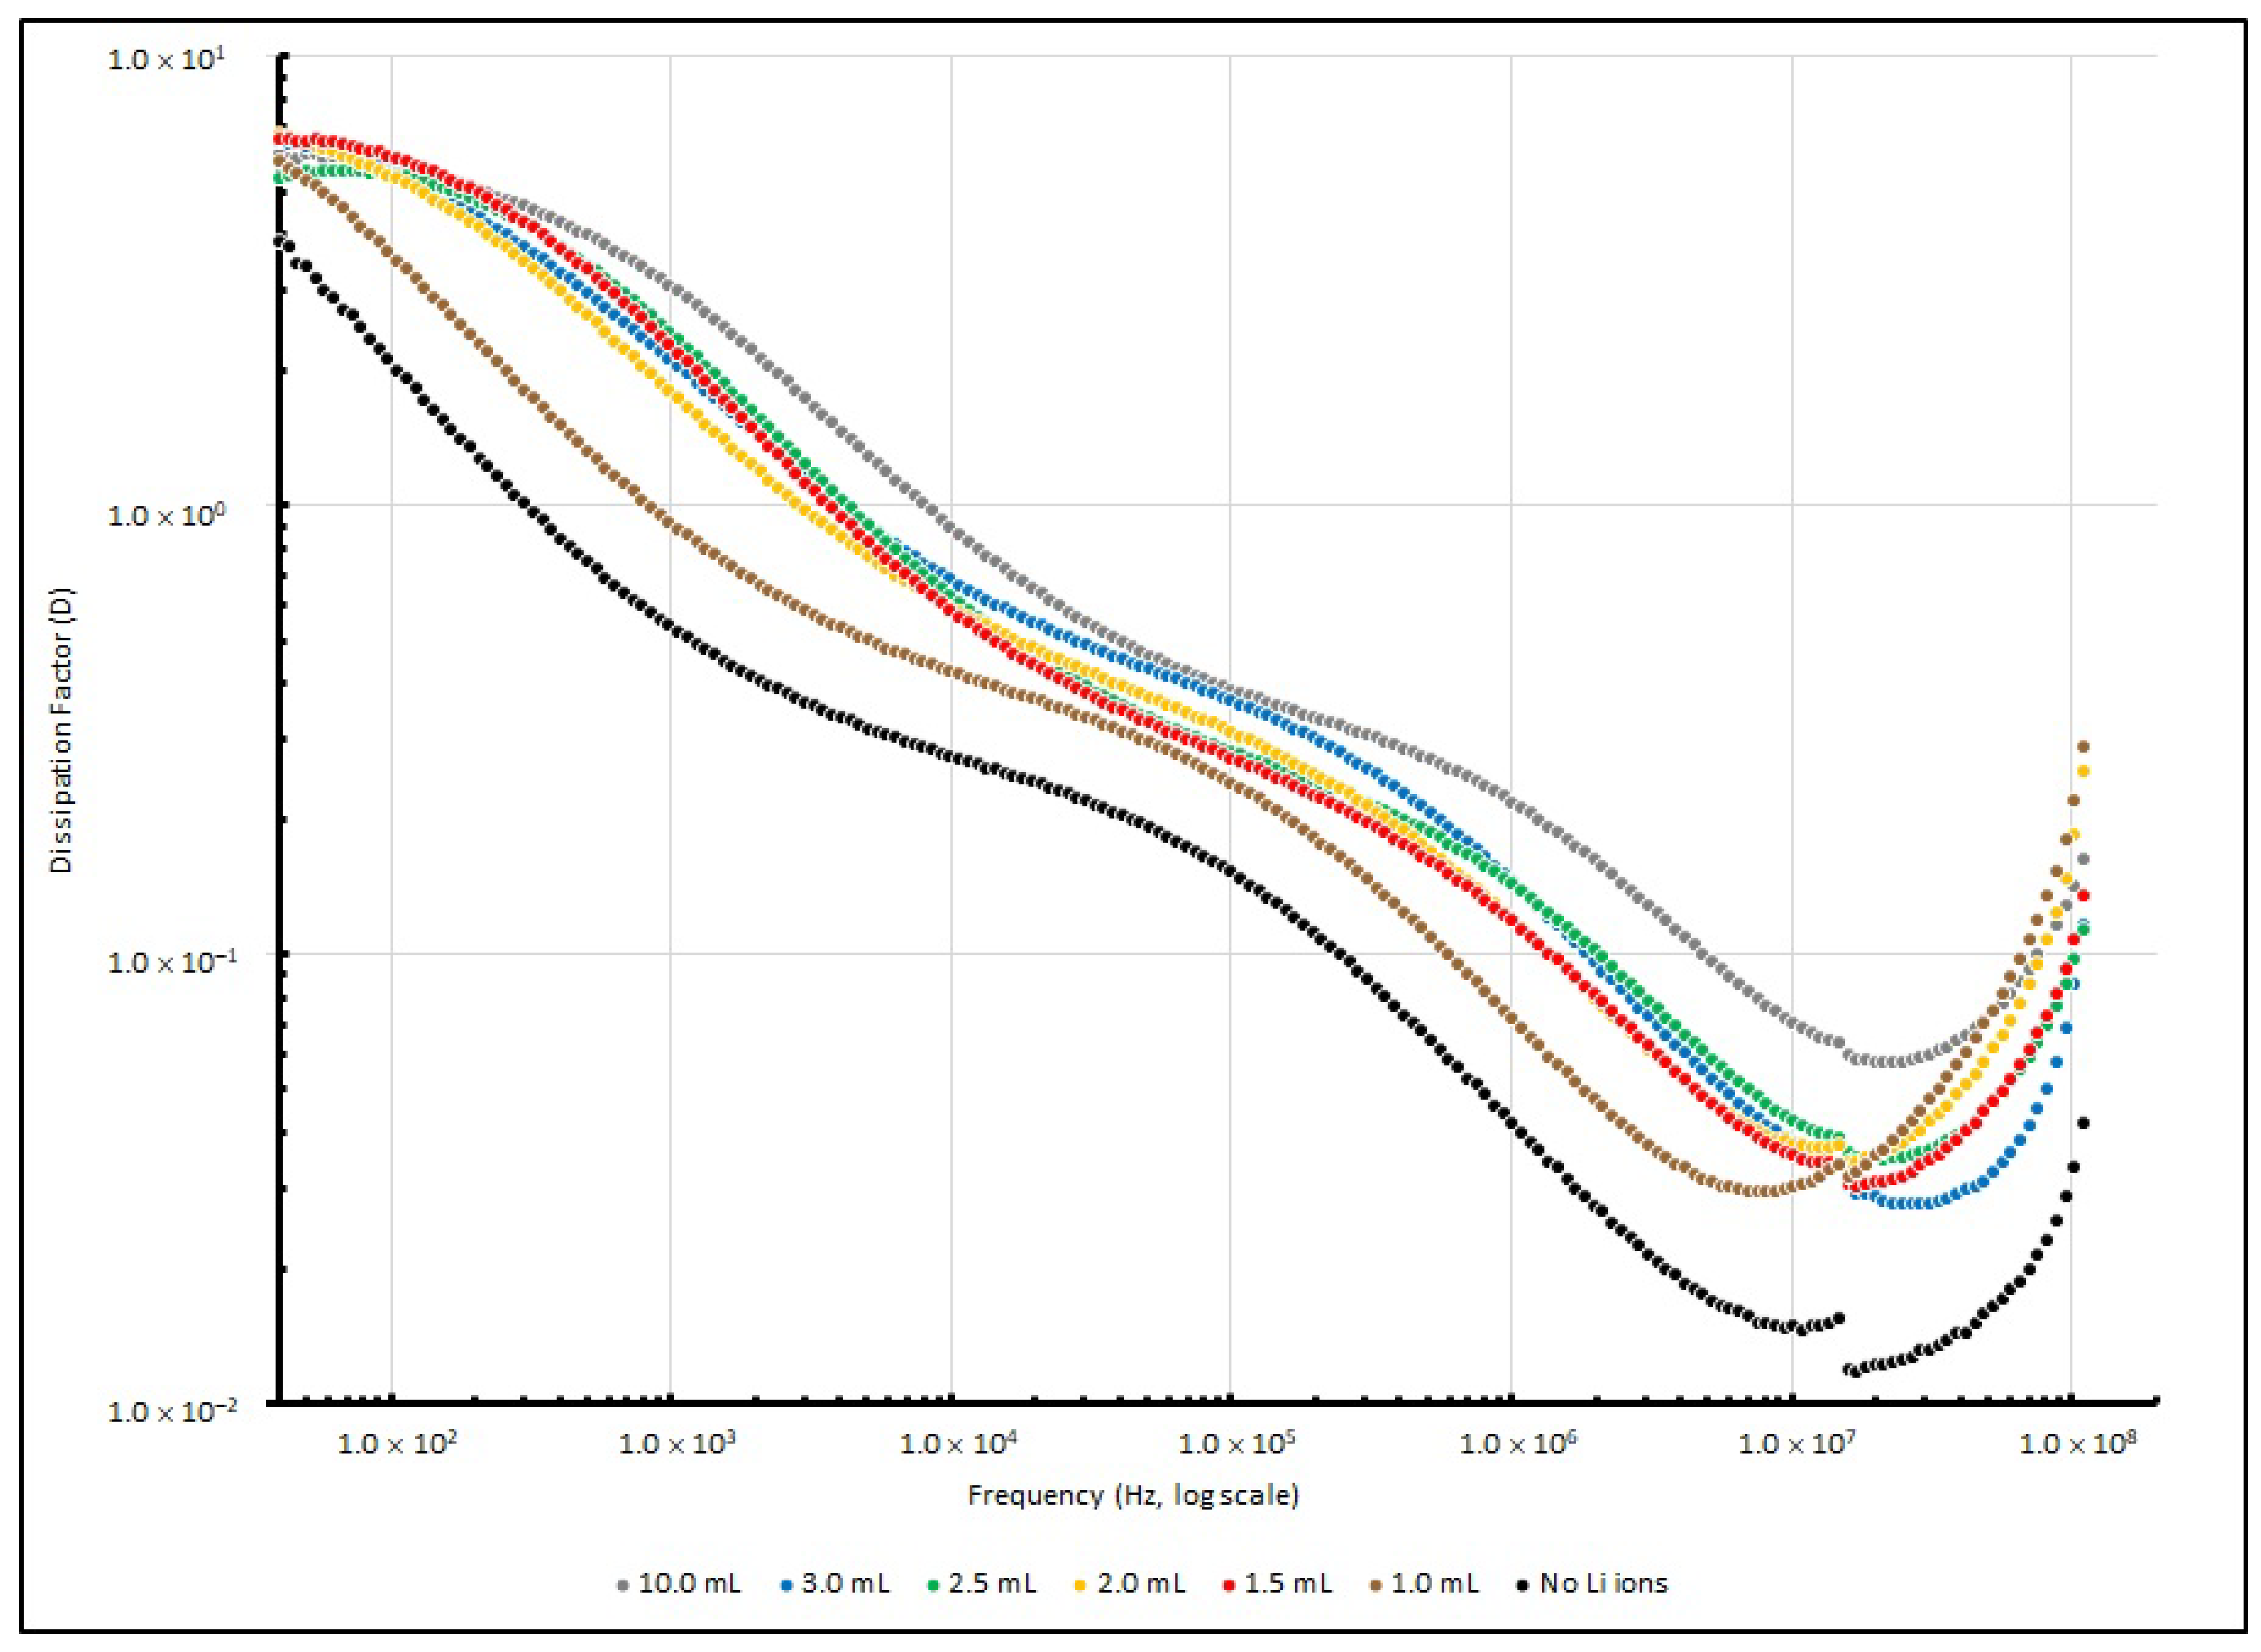
Table 7 summarises the
D values of various EDL samples measured at several testing frequencies (40, 1 K, 100 K and 100 MHz), and
Figure 8 illustrates these changes. After the testing signal was raised to 10 kHz, the dissipation factor of all of the samples decreased to below 1, and reached the lowest point at around 10 MHz. This implies that the PEO-based Li+-doped samples perform with higher efficiency in a higher frequency range than in a lower frequency range.
Other than Cs and D, the values of X and R were also obtained. The measured R and X of the various EDL samples measured at several testing frequencies (40, 1 K, 100 K and 100 MHz) are summarised in
Table 8 and
Table 9, respectively. Moreover,
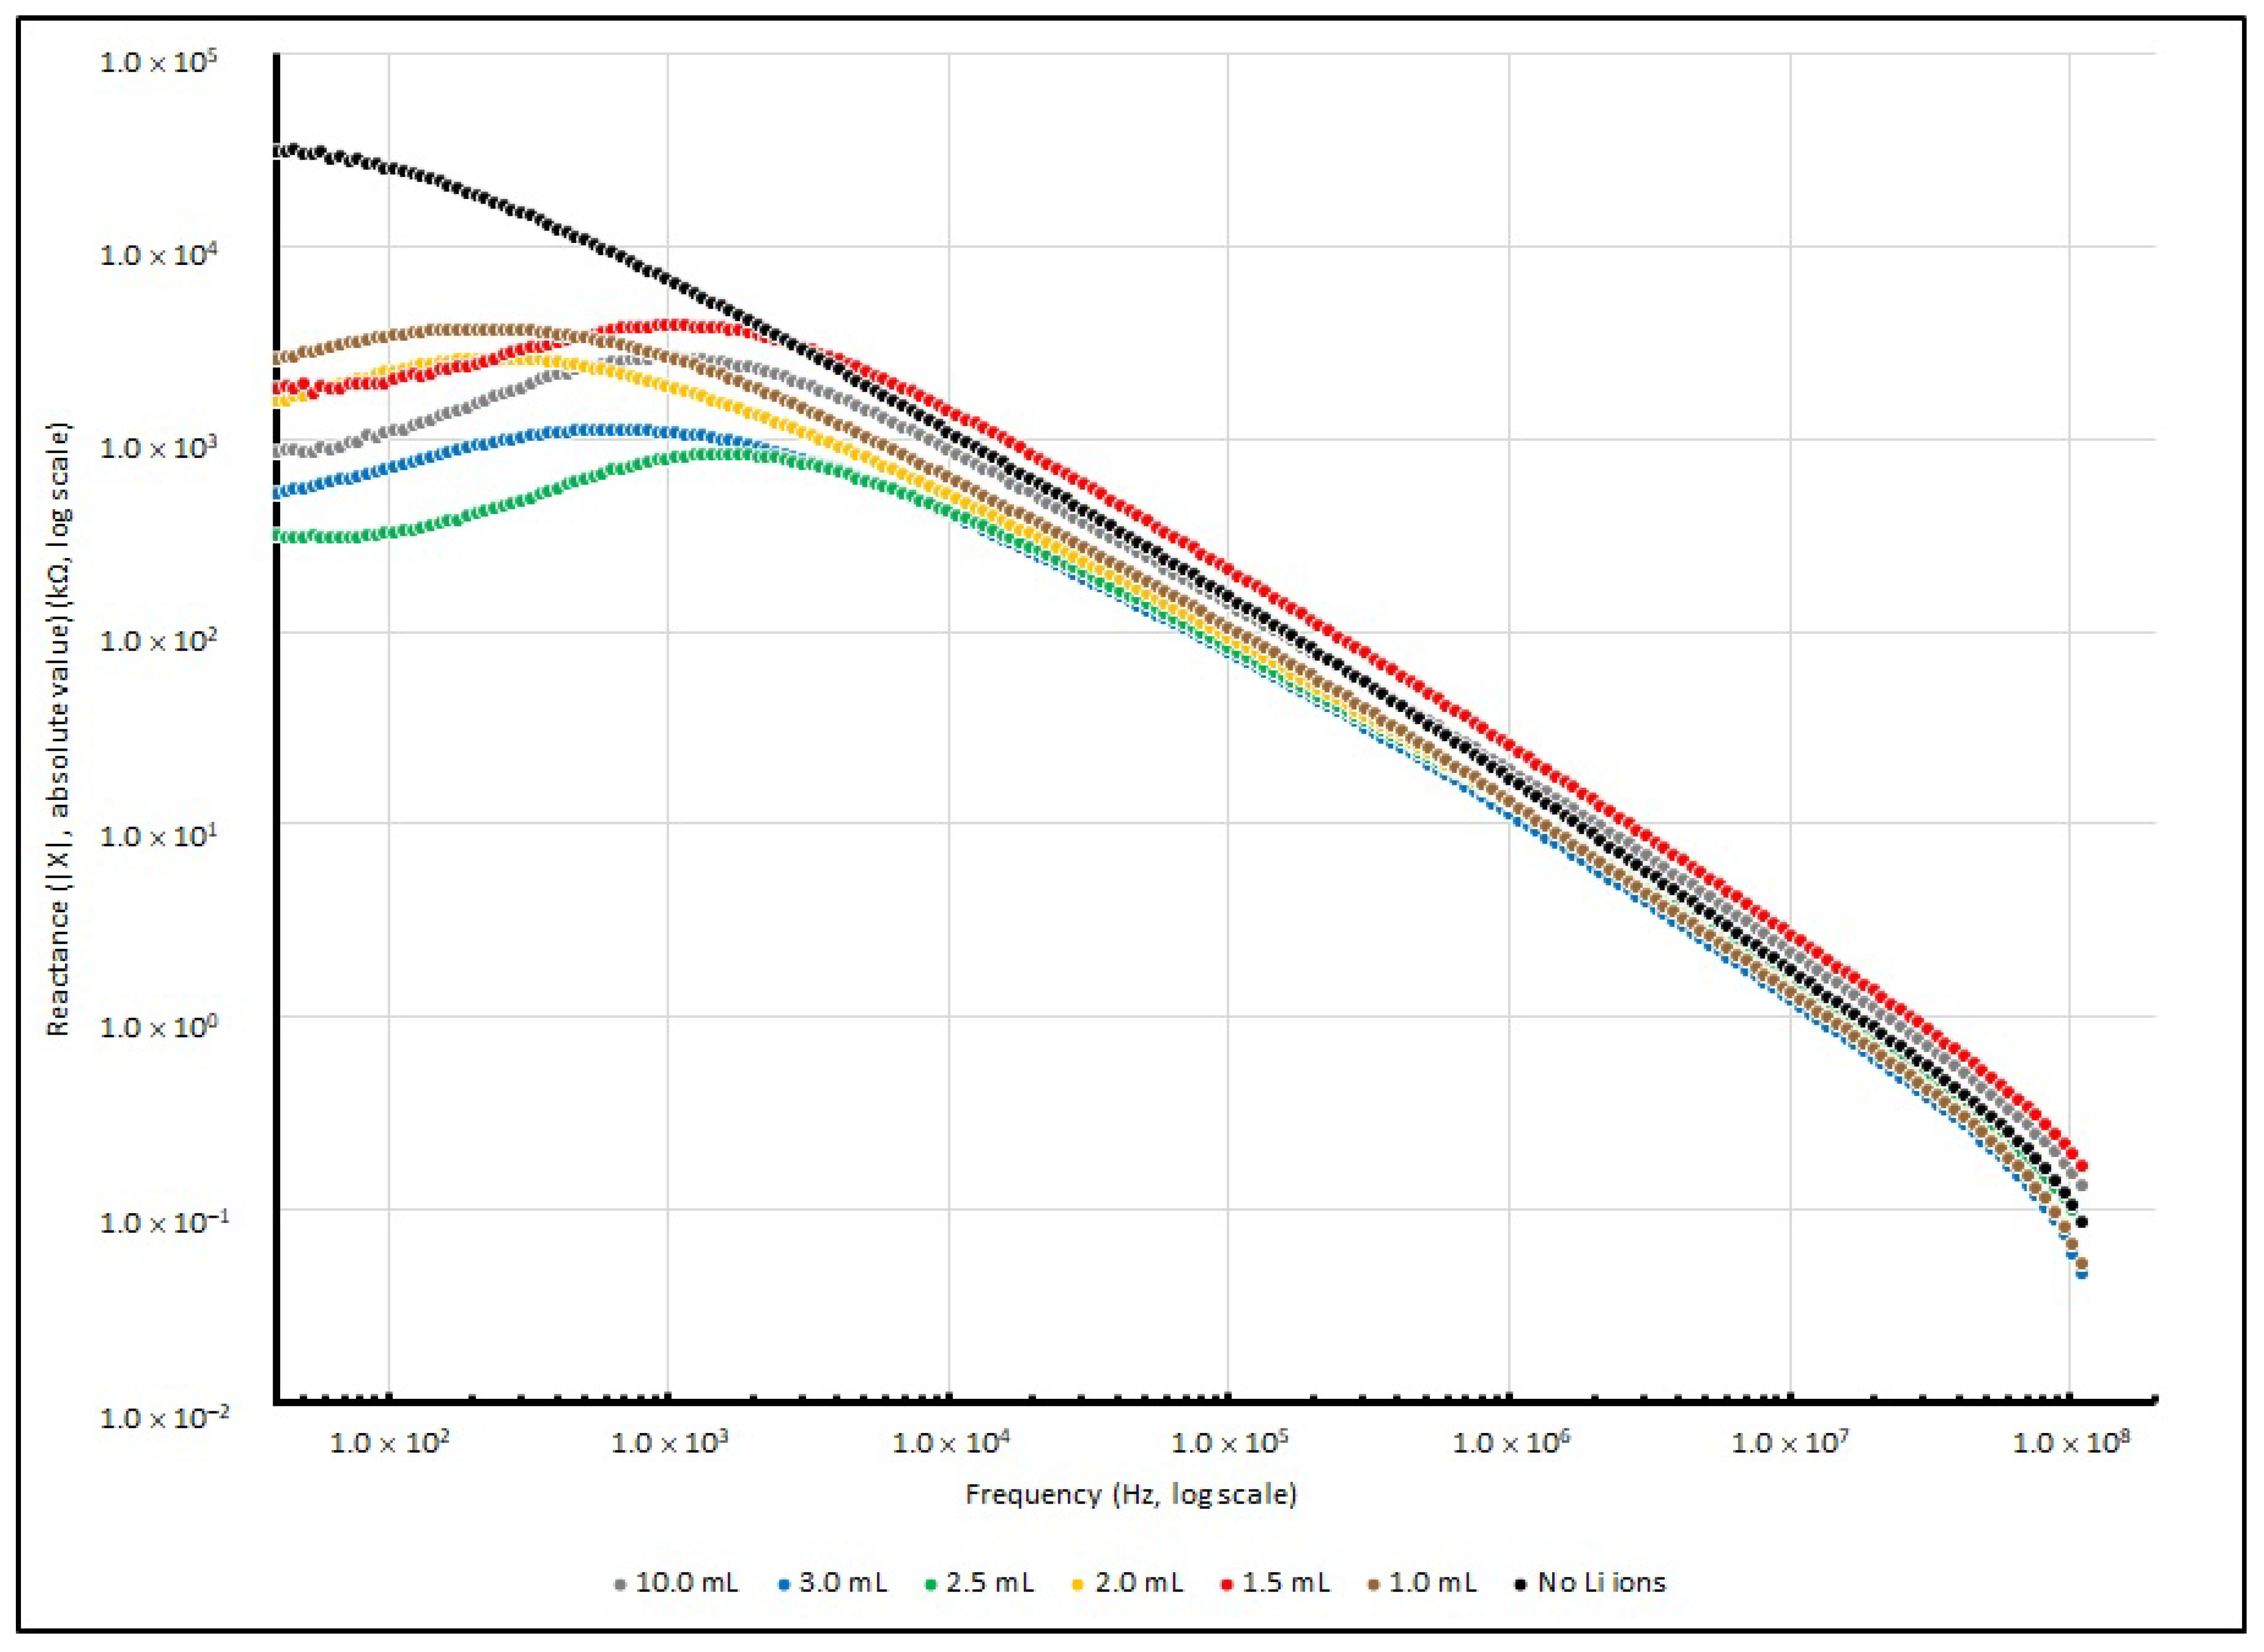
Figure 9 illustrates the changes in series resistance from 40 to 100 MHz. For reactance changes, the absolute reactance (|X|) instead of reactance (X) from 40 to 100 MHz is illustrated in
Figure 10, as the negative magnitude is used to show that the measured reactance is dominated by capacitive elements.
Theoretically, the sample measurement of total impedance (Z) should involve a pair of elements: the real and imaginary part, which represent the resistive element (R) and reactive element (X), respectively. For the control sample with no doped Li+, when the testing frequency increases from 40 to 100 MHz, the resistance (R) decreases from 46 MΩ to only a few Ω. In terms of reactance (X), it changes from −31 MΩ to about 110 Ω when the frequency increases from 40 to 100 MHz.
Additionally, for Li+-ion-doped samples, the resistance decreases from a few MΩ to less than 20 Ω when the frequency increases from 40 to 100 MHz. In terms of reactance (X), it slightly increases from a lower frequency range and touches the highest value at about 1 kHz, and at 100 MHz, it decreases to less than 200 Ω. A negative magnitude is measured, which indicates that the capacitive reactance is dominated in the impedance.
In electrochemical impedance spectroscopy, a sinusoidal signal
E(ω,t) = Eo sin ωt is injected into the sample during measurement, where
Eo is the amplitude of signal and
f is the variable frequency (provided that
ω is the angular frequency, and hence
ω = 2πf). At the same frequencies, the comparable current
I(ω,t) is recorded. Hence, the comparable impedance
Z(ω,t) with respect to the examined samples can be acquired from Ohm’s law, as follows:
Sinusoidal current recorded from samples at a certain angular frequency
ω can appear in the same or opposite phase to the comparable periodic sine wave injected, meaning the current can be written as
I(ω,t) = Io sin (ωt − θ), where
θ is the phase angle between the potential and current and
Io is the current amplitude. In the expression of complex number notation, the AC potential can be rewritten as
E(ω,t) = Eo ejωt and the current signal can be expressed as
I(ω,t) = Io ej(ωt − θ), where
j is the imaginary unit. Through these conversions, Equation (5) can be rewritten as follows:
where
θ is the impedance phase angle and |
Z| is the impedance modulus. By using Euler’s formula, Equation (6) can be further rewritten as follows:
where
Z′ = |
Z|
cosθ and
Z″ = |
Z|
sinθ are the real and imaginary part of the impedance, respectively. Therefore, from Equation (7), the modulus |
Z(
ω)| and the phase angle of impedance
θ(
ω) can be obtained by the following:
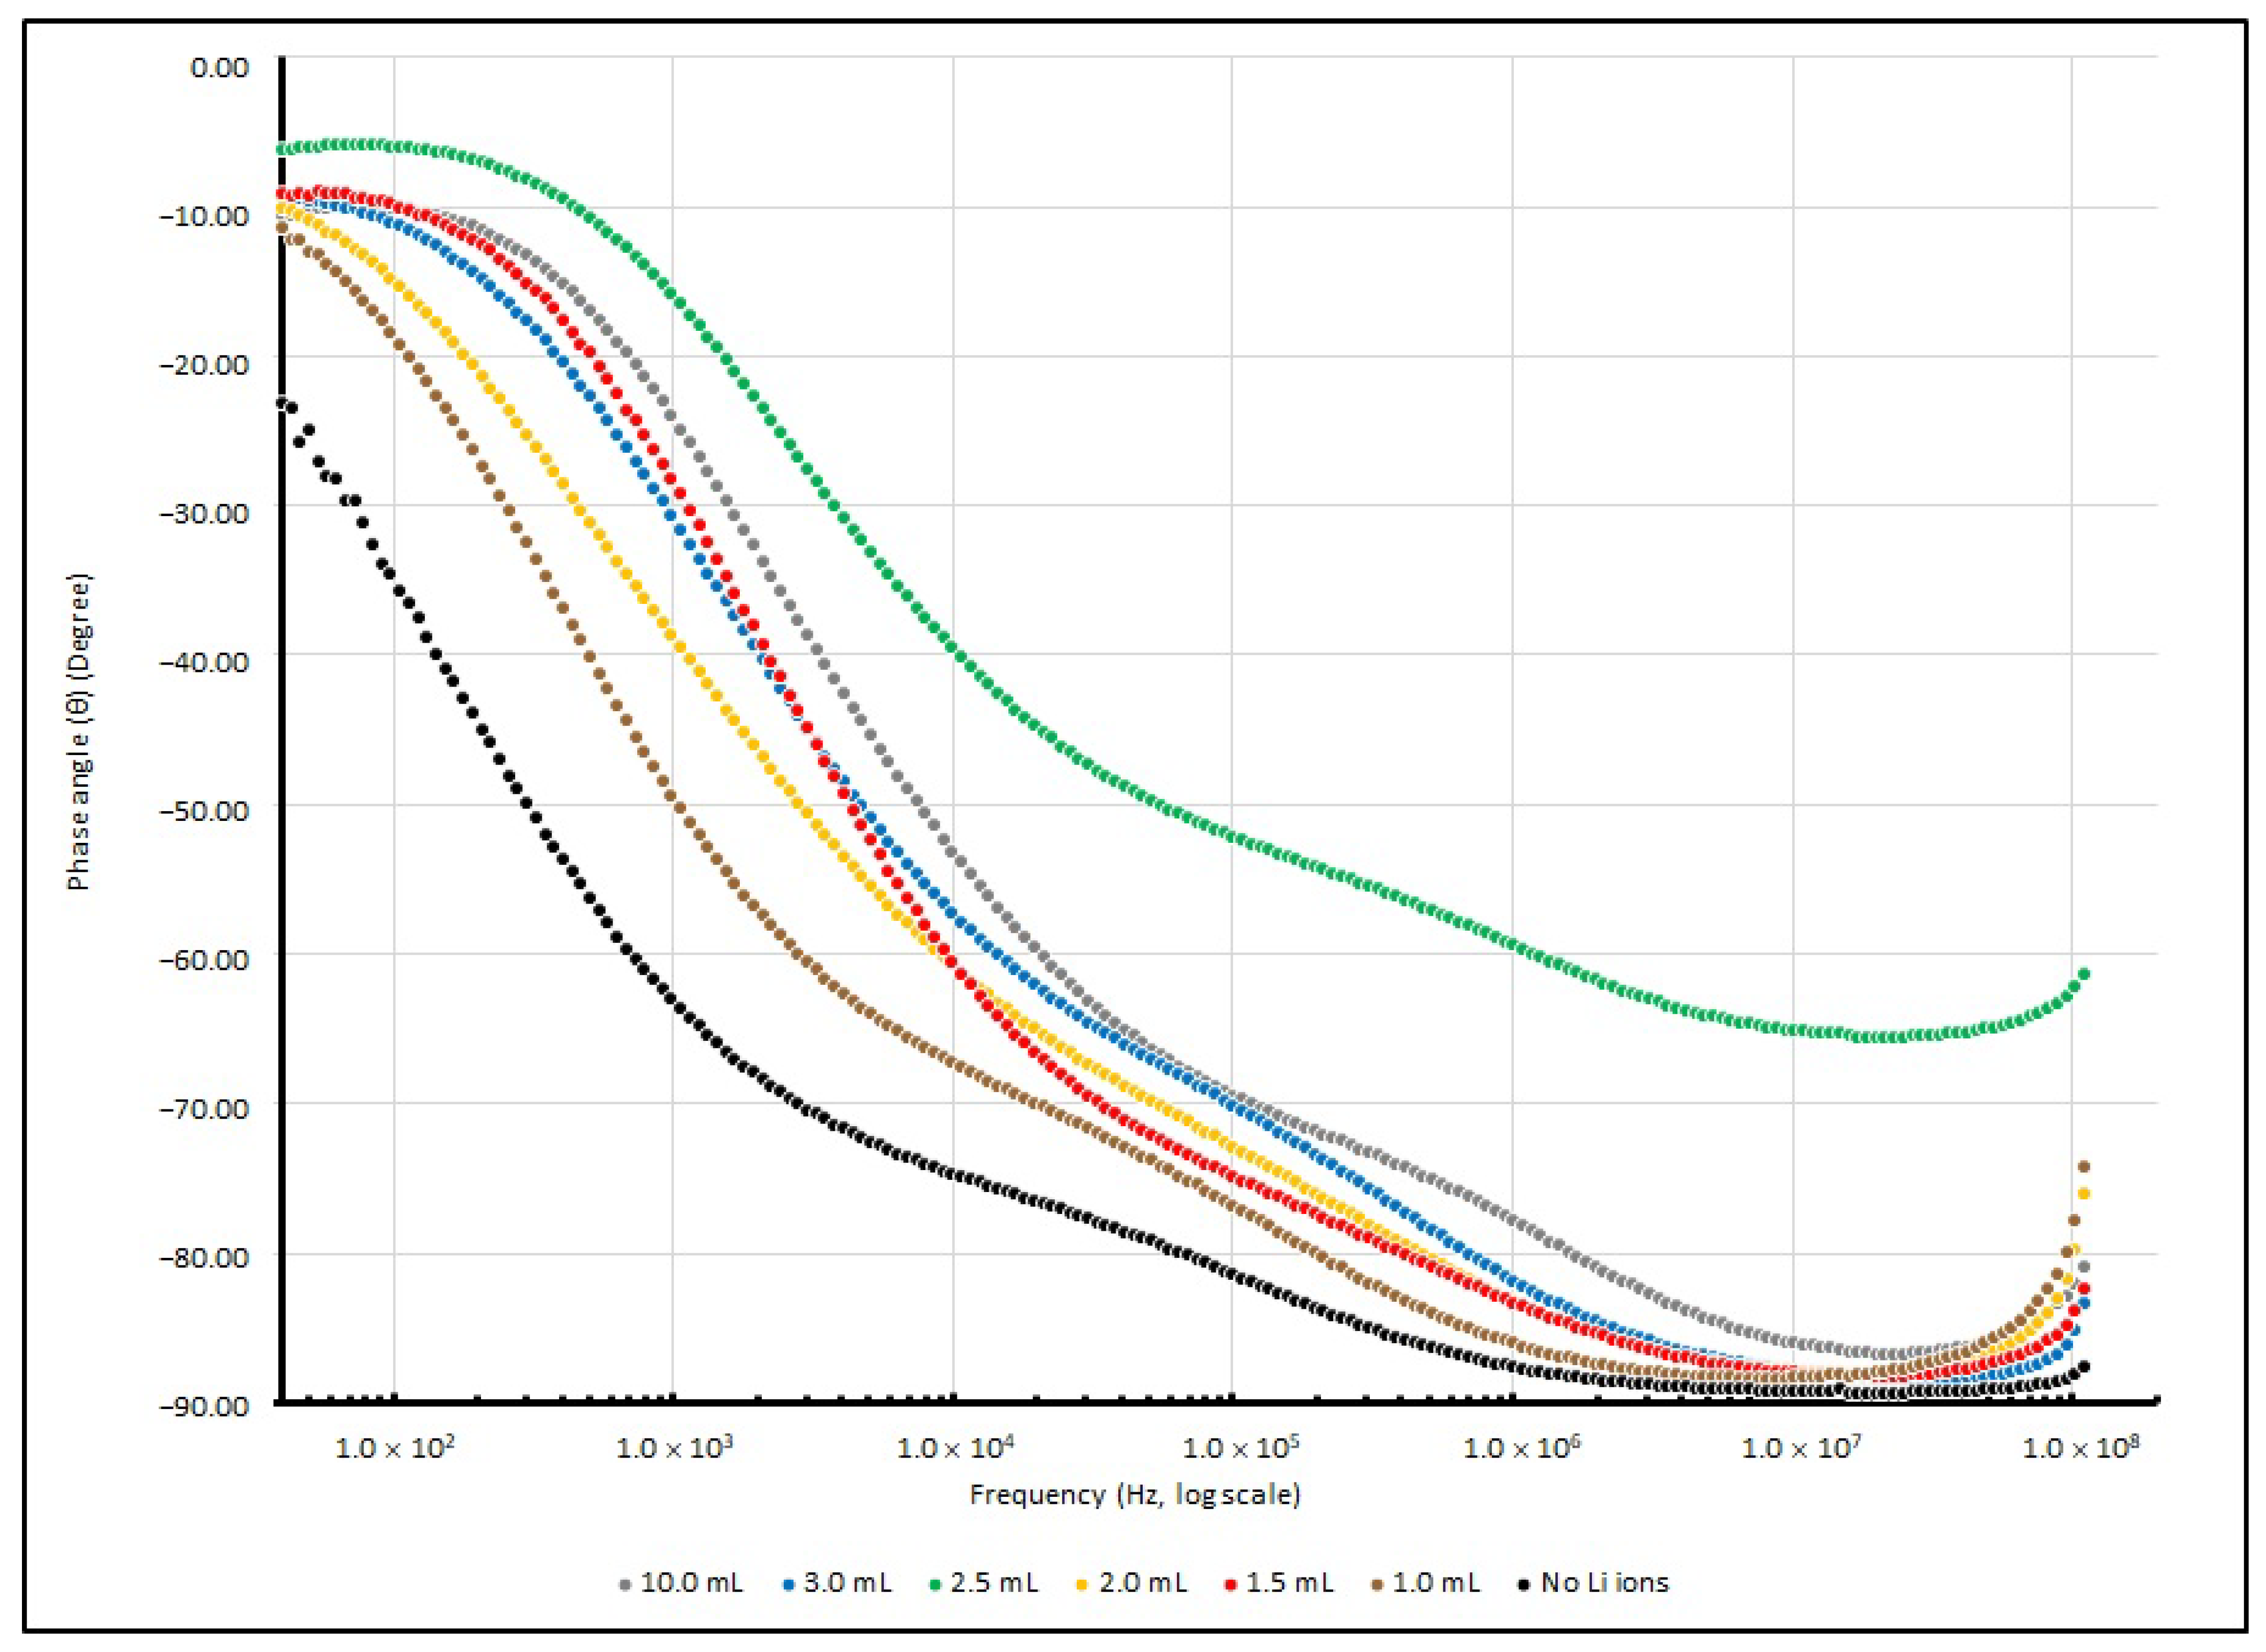
With the relation of Equations (8) and (9), the connection between the resistance and reactance of the EDL system can be derived, and the phase angle (
θ) between R and X and |
Z| can be found throughout the experiment. Hence, |
Z| and
θ measured from various Li+-doped EDL samples at several testing frequencies (40, 1 K, 100 K and 100 MHz) are summarised in
Table 10 and
Table 11. Moreover, their changes in |
Z| and
θ from 40 to 100 MHz are illustrated in
Figure 11 and
Figure 12.
The control sample without doped Li+ ions shows the highest magnitude of |Z| and θ at 40 Hz. It seems that the absence of Li+ ions causes poor charge mobility, and the capacitive element in the reactance causes a large phase difference between the resistive and reactive elements. When the testing frequency increases, the magnitude of |Z| and θ drops and responses are similar to other Li+-doped samples.
A dramatic decrease in R, X and |Z| in different lithium-ion-doped samples can be observed; in a low frequency range, these values dropped to 25% or less of the samples without any dopants. This phenomenon indicates that an enrichment in charge mobility in the electrolyte can occur via the existence of lithium ions in the PEO matrix and establishes an enhancement in the charge storage capability. Furthermore, at around 1 kHz, the existence of lithium ions initiates a particular influence on reactance.
3.4. Cyclic Voltammetry of PEO-Based EDL Capacitors with Various LiClO4 Concentrations
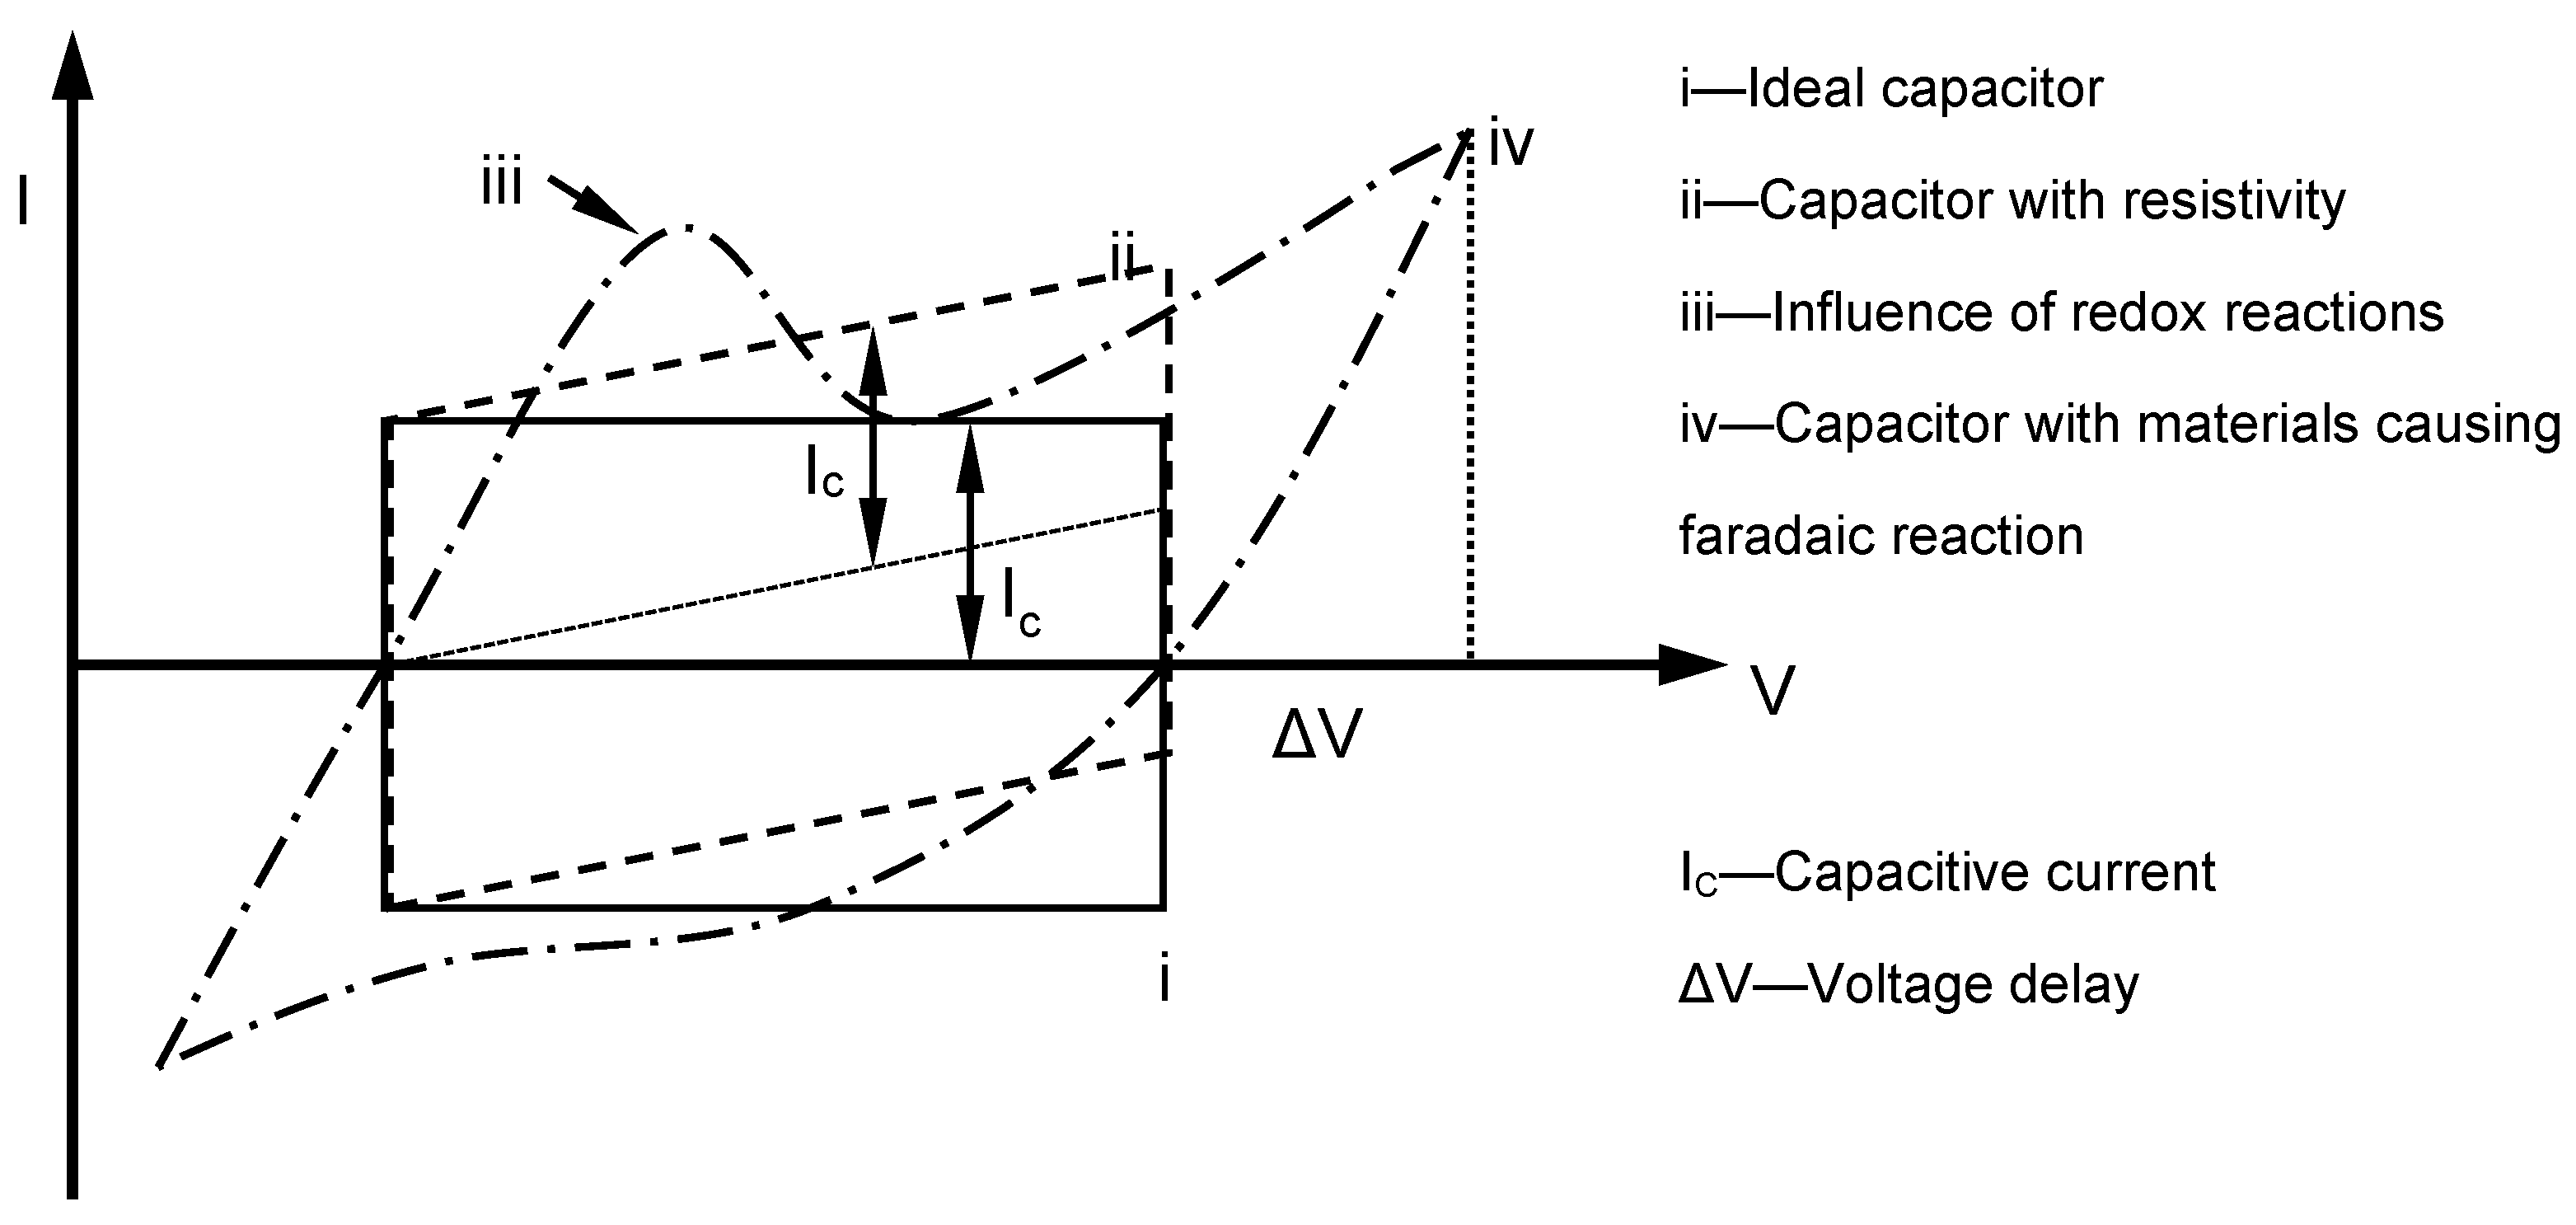
Theoretically, the charging–discharging behaviour of an ideal double-layer capacitor can be illustrated via voltammetry characteristics in a rectangular form (
Figure 13). In the diagram, when the potential direction was reversed, the current flow was reversed immediately. In the system, electrostatic potential can be seen as part of the charge storage mechanism, and generally, the potential and current are mostly independent of each other. If materials with pseudocapacitance properties are used as electrodes, the form of the voltammetry curve changes, and redox peaks due to pseudofaradaic reactions are noticed in some cases. In contrast, the electrode potential dominated charges accumulated in the capacitor in this experiment. As the charging of pseudocapacitance involves kinetically slow processes, during the reverse in potential, a delay in potential change occurs [
37]. In the following
Table 12, the maximum current densities of different scan rates are tabulated.
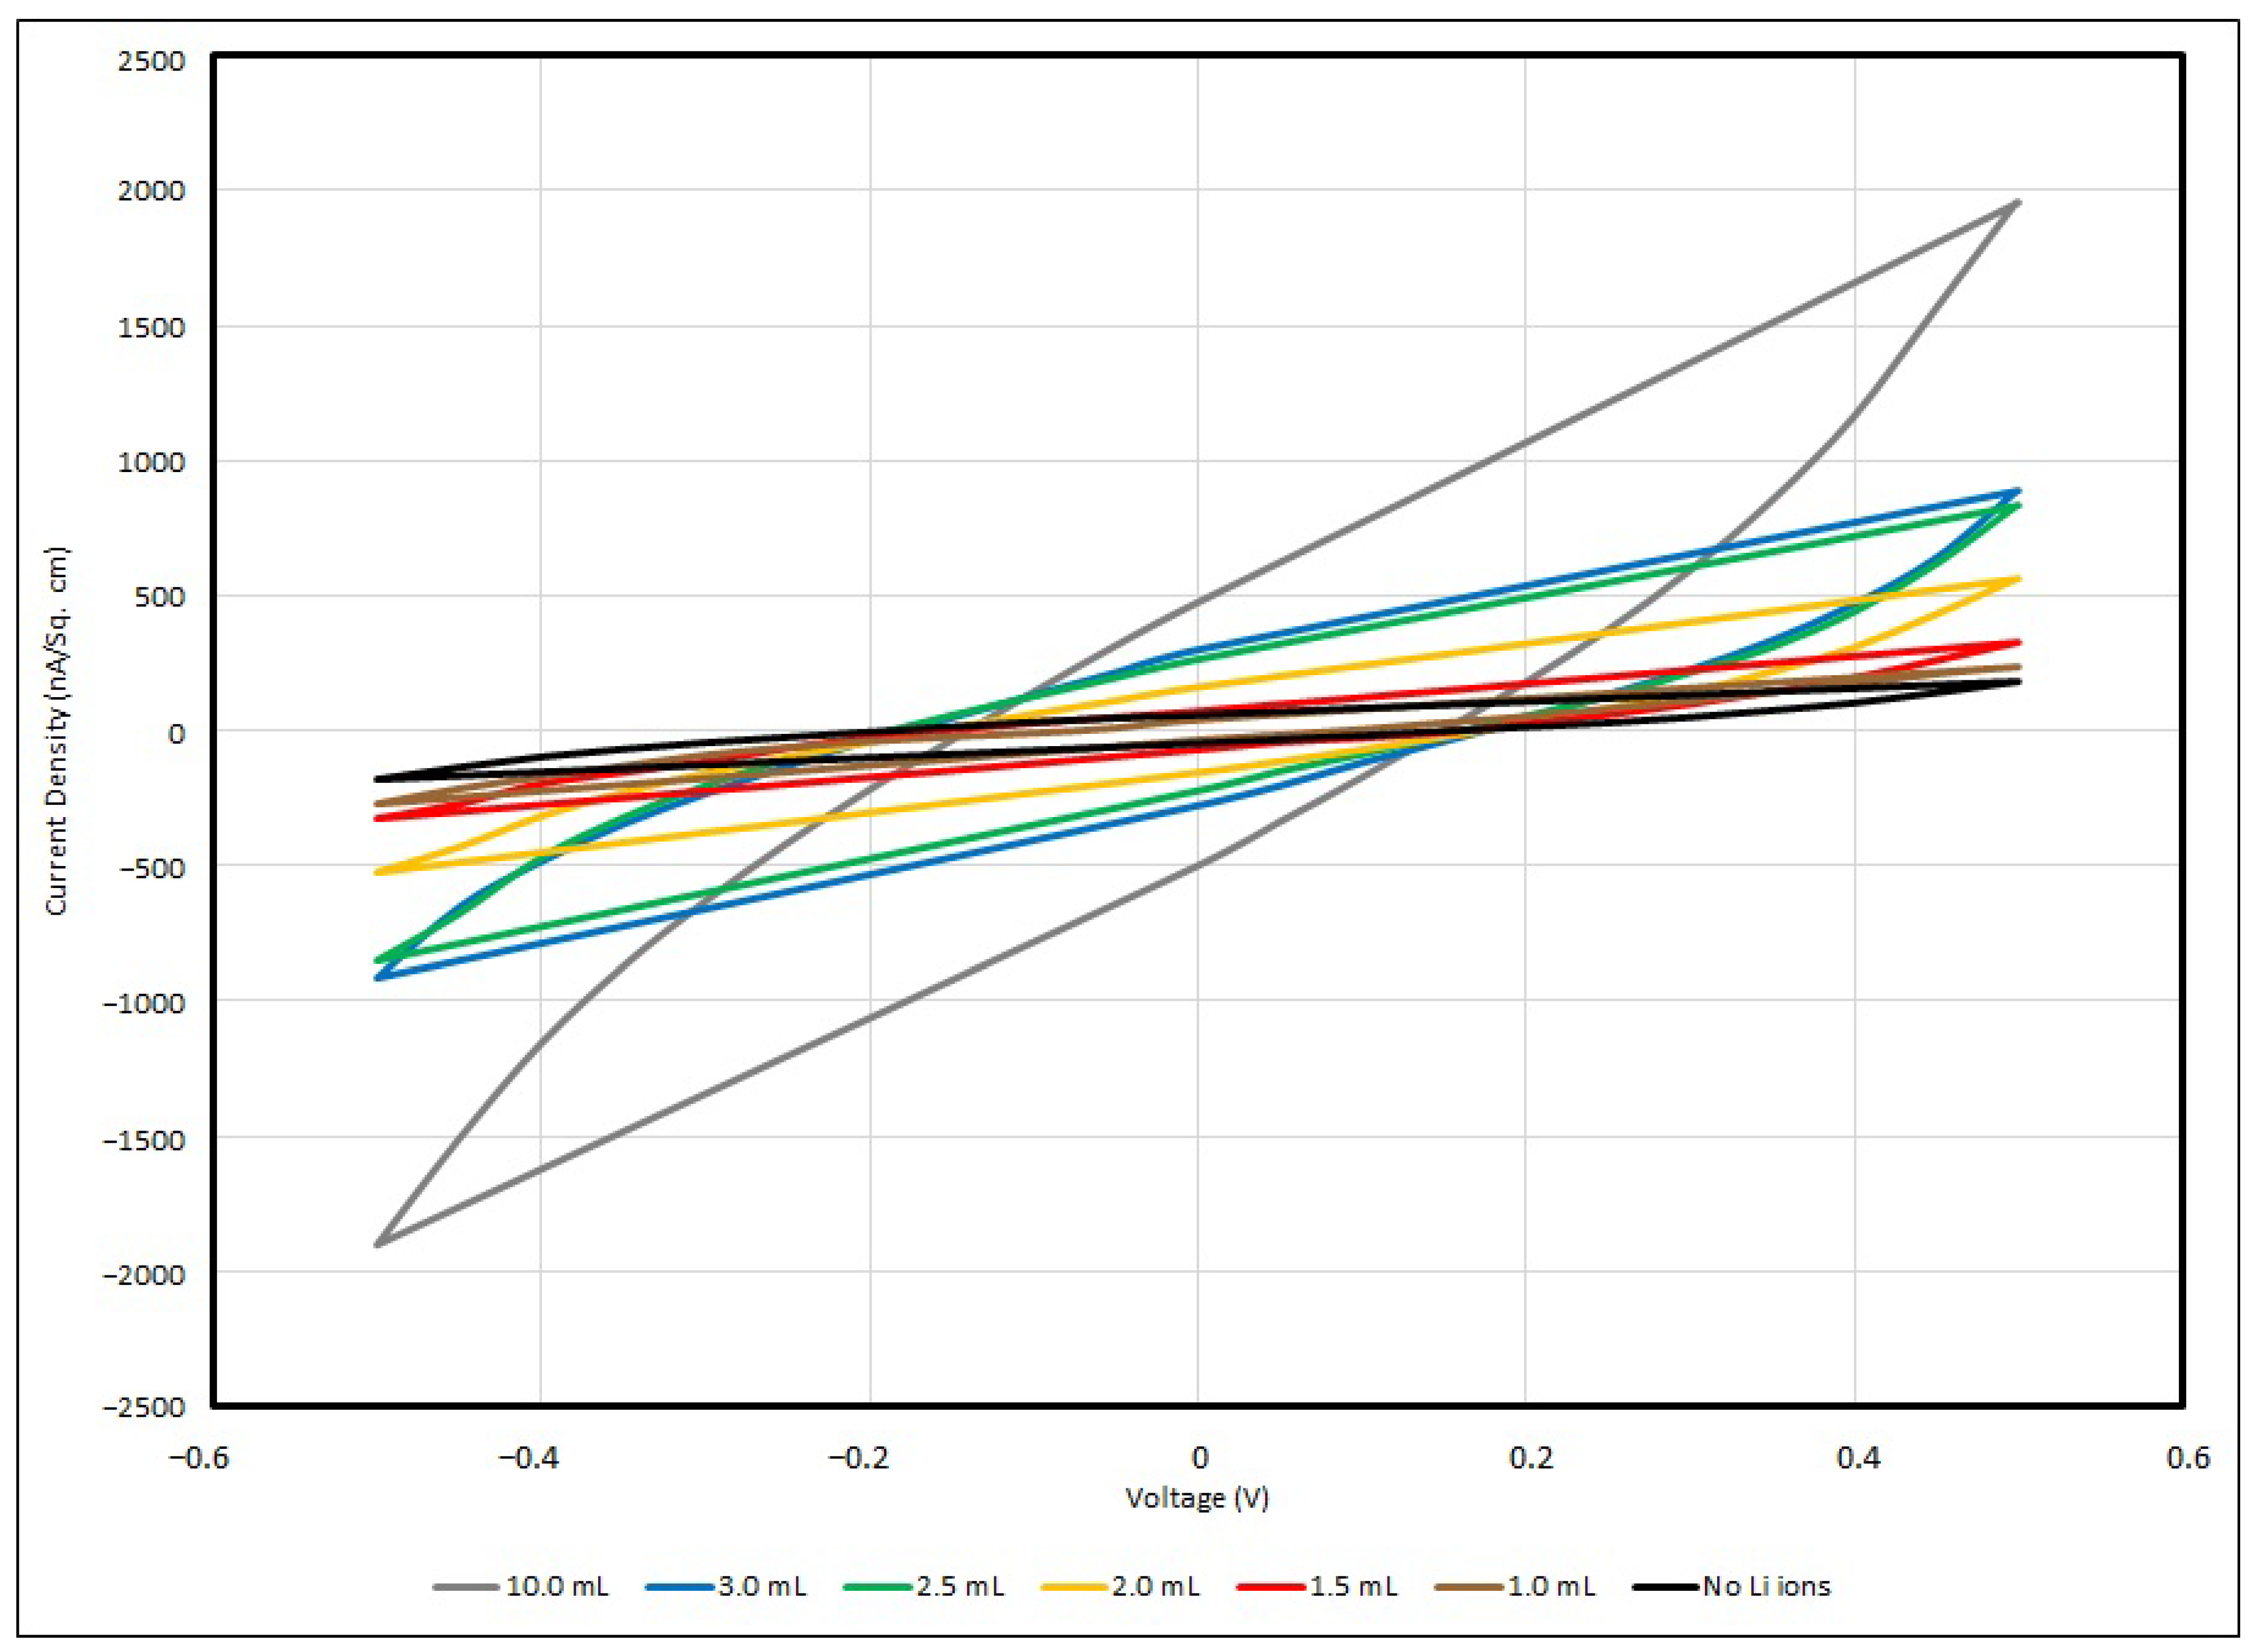
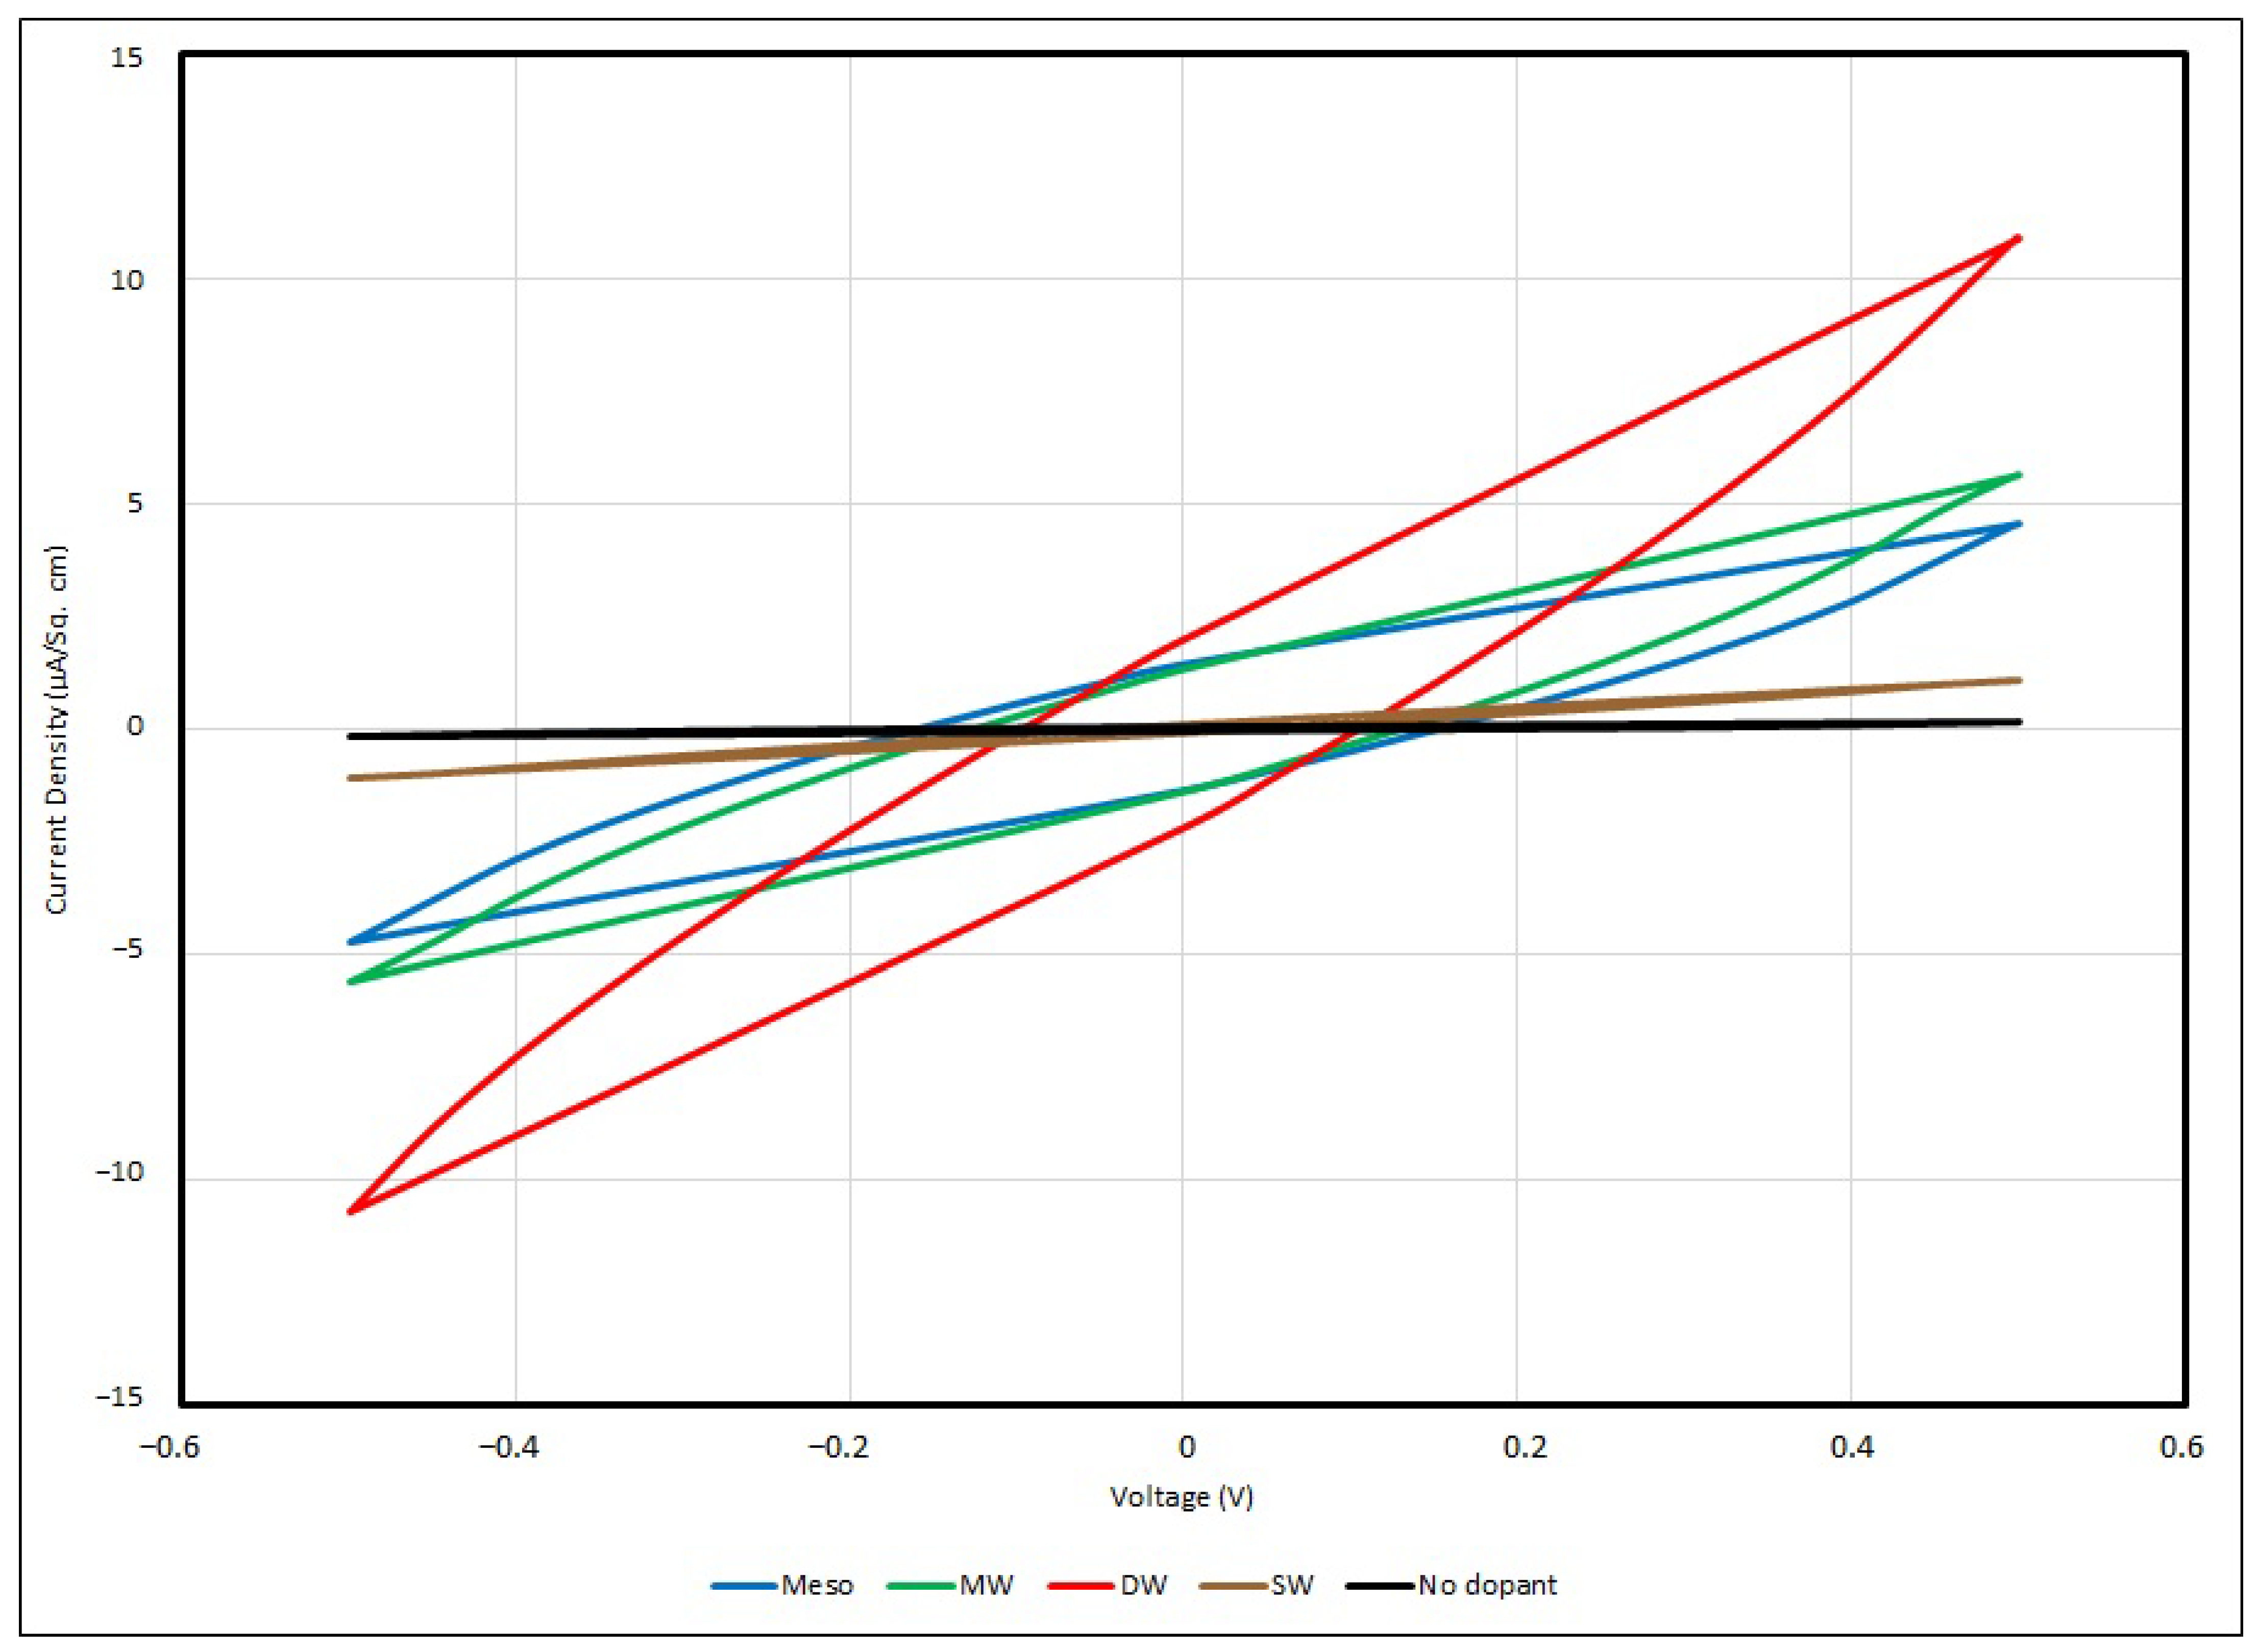
In general, all samples of the PEO-based supercapacitor give voltammograms in an olive shape, and the maximum current densities can be found at 0.5 V and −0.5 V, with respect to the positive or negative potential. In the experiment, a faster scan rate gives a higher value of current density, and vice versa, so that a slower scan rate gives a lower value, and for all samples, no matter how the scan rate is changed, the cyclic voltage–current density responses are quite similar. This can be described in terms of the time taken to record the scan and the size of the diffusion layer. Since the applied potential gradually increases, the current follows the potential to rise correspondingly from its initial value at the negative side, and then shifts to the positive side. Hence, a greater number of reactants in the electrolyte are transformed, and the diffusion layer sufficiently grows above the Cu-plated polyester fabrics.
In practice, the efficiency of charges moving from one active site to another in the PEO matrix is ruled by the diffusion layer formation. The potential applied to the supercapacitor samples is longer when a slower scan rate is used, and therefore, in contrast to using a faster scan rate measurement, the diffusion layer can develop far away from the metallised fabric surface towards the electrolyte, resulting in the potential occurrence of an ineffective charge transfer. In addition, a faster scan rate allows for a relatively larger current flux to pass through the metallised fabric surface than a slower one. As the current density applied to the testing sample during the measurement is proportionate to the current flux towards the metallised surface, at a faster scan rate, a larger magnitude of current density is triggered by a higher flux. This is a fast response process and this electron transfer reaction is usually regarded as being reversible.
From the empirical results, the maximum current density of the control sample is about 177 nA/cm
2 under a scanning rate of 100 mV/s with applied voltage of ± 0.5 V. Once the Li
+ ions have been added into the PEO matrix, the charge mobility becomes enhanced, and when the Li
+ ion concentration has been increased from 0.001 to 0.01, the maximum current density dramatically increases from 243 nA/cm
2 to 1844 nA/cm
2. Lithium ions can migrate among nearby active sites in the PEO backbone and branches when sufficient Li
+ ions are provided to the PEO matrix; hence, the current density flowing through the EDL supercapacitor sample and the charge storage capability are enhanced. Taken from Lim et al., around 0.1 mA/cm
2 was obtained if the Li+ ion concentration was raised to 5 wt% LiClO
4-PEO, with WO
3-coated ITO as the electrode [
14]. The cyclic voltammogram below (
Figure 14) illustrates the responses of voltage–current in different PEO:Li
+-based EDL capacitors with various salt concentrations under a scanning rate of 100 mV/s.
3.5. Frequency Responses of PEO-Based EDL Capacitors with Various Types of Nanocarbons
Other than lithium salt in a previous experiment, PEO-based EDL capacitors were doped with various types of nanocarbons and their electrical properties were examined. These nanocarbons have a similar density to (i) mesoporous nanocarbons (Meso); (ii) multi-walled carbon nanotubes (MW); (iii) double-walled carbon nanotubes (DW) and (iv) single-walled carbon nanotubes (SW). An impedance analyser ranging from 40 to 110 MHz was used to investigate the electrical properties of PEO-based samples, parameters involving series capacitance (Cs), the dissipation factor (D), series resistance (R), series reactance (X), absolute impedance (|Z|) and the phase difference between the resistance and reactance (θ).
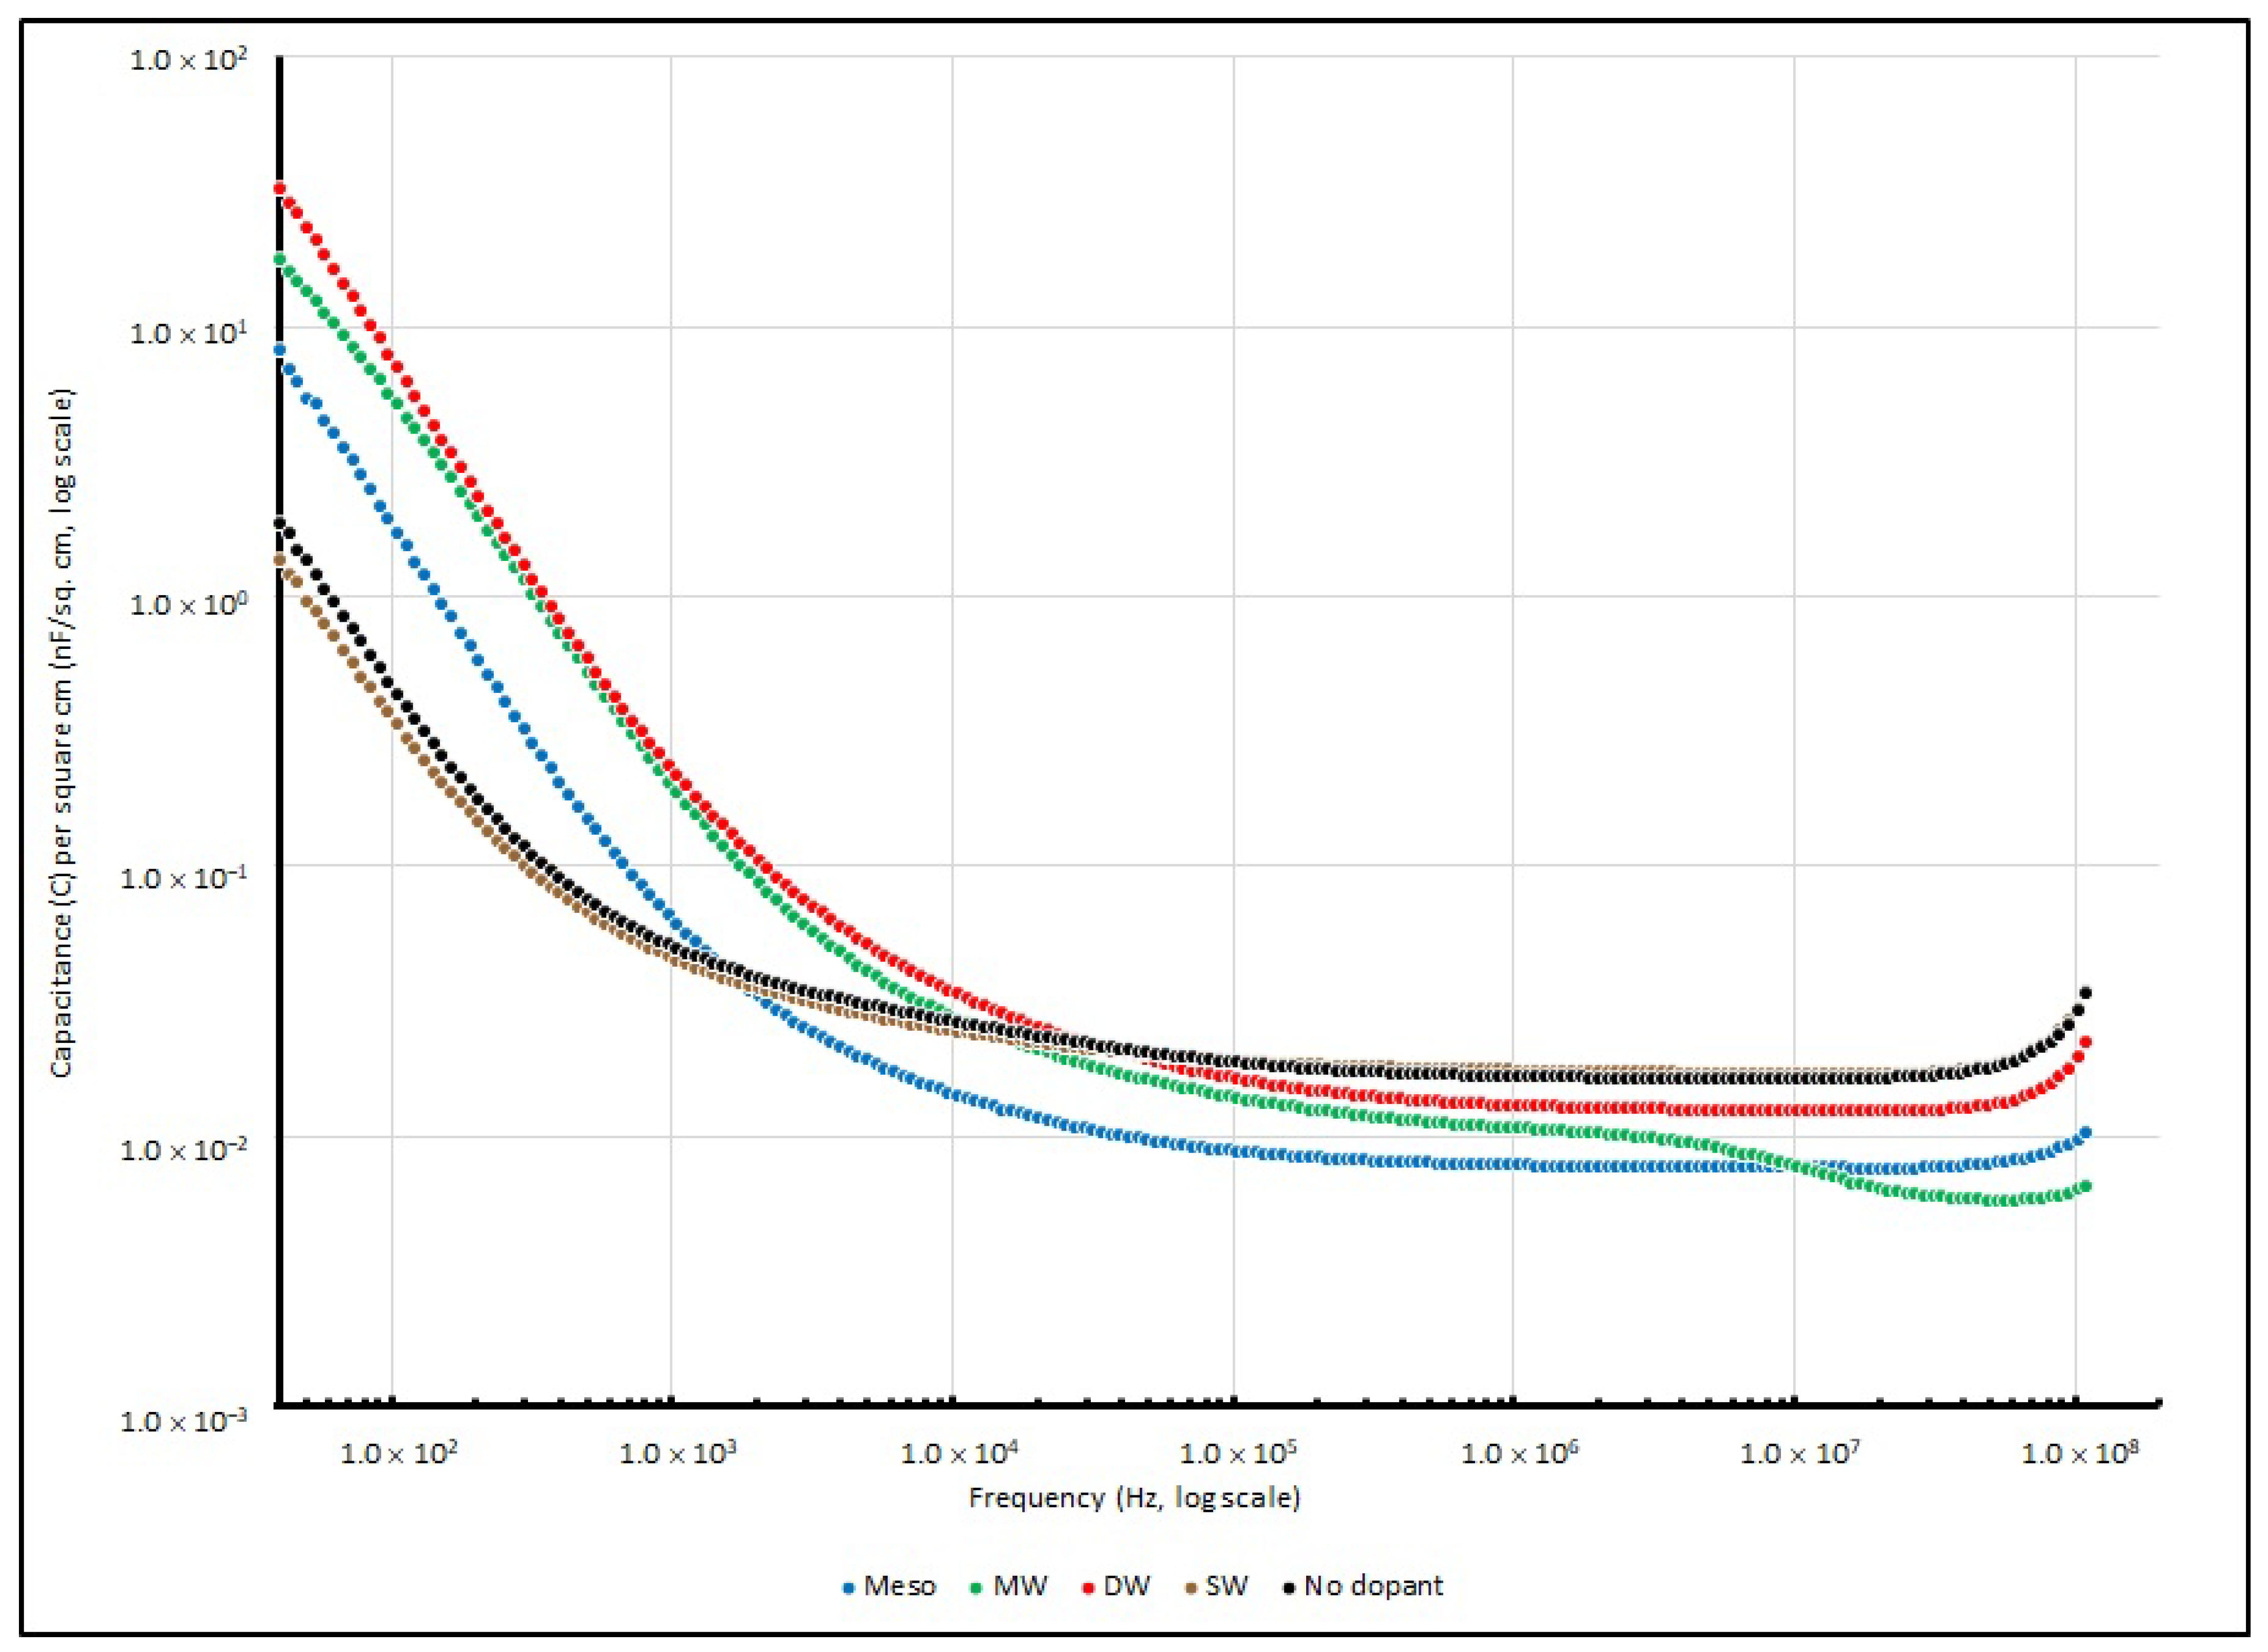
PEO-based supercapacitor samples doped with different types of nanocarbons were connected to the impedance analyser, their Cs were measured and their corresponding specific capacitance values were determined.
Table 13 summarises their specific capacitance at several testing frequencies (40, 1 K, 100 K and 100 MHz), and their change in specific capacitance is illustrated in
Figure 15.
Mostly, in the range of frequencies from 40 to 100 MHz, similar trends can be observed in all four different types of nanocarbon samples. On the other hand, when the frequency is below 1 kHz, all PEO:nanocarbon supercapacitors show higher values of specific capacitance than the other frequency ranges.
Among all four nanocarbon samples, DW shows the best performance and gives a specific capacitance of 32.798 nF/cm2 at 40 Hz, followed by MW, Meso and SW with values of 17.806, 8.238 and 1.353 nF/cm2, respectively. However, the specific capacitances of all samples drastically drop when the testing signal increases to 10 kHz, and they reach the minimum throughout the high frequency range at 100 MHz.
Table 14 summarises the dissipation factors (
D) of all of the PEO:nanocarbon EDL samples recorded at several testing frequencies (40, 1 K, 100 K and 100 MHz), and in
Figure 16, their dissipation factor changes are illustrated.
Similarly to the Li+-doped samples, after the testing frequency was raised to 6 kHz, the dissipation factor of all samples decreased to below 1, and the nanocarbon-doped samples reached the lowest point in the range of 1 MHz to 10 MHz. However, after reaching 10 MHz, their efficiencies slightly bounced back to near 1. The empirical results showed that the working bandwidth of the nanocarbon-doped samples was narrower than that of the Li+-doped samples, and more frequency-dependent in this electrochemical system.
Charge accumulation in this EDL system increases greatly when various nanocarbons are added into the PEO matrix, as these dopants can increase the total surface area in the matrix, and free charges in this system can be easily captured. From the empirical results, the specific capacitance of DW is the highest among the four nanocarbons. Physically, DW consists of two SWs with inner and outer nanotubes, which is a simple form of MW. For nanotube walls, their electronic configurations can either be metallic (M) or semiconducting (S). According to these phenomena, there are four possible combinations that can be obtained in DW; they are M-M, M-S, S-M and S-S (outer nanotube–inner nanotube). These four combinations improve the capability of charge trapping in the system by advancing the electrical conductivity. Researchers have suggested that DW with an M-M configuration can perform like SW in a metallic configuration, where the electrical properties of the material are as good as the metal, and can also perform on an advanced surface for charge trapping in the EDL system [
38,
39,
40]. Other than Cs and D, the value of X and R were also obtained. The measured R and X of various EDL samples measured at several testing frequencies (40, 1K, 100K and 100M Hz) are summarised in
Table 15 and
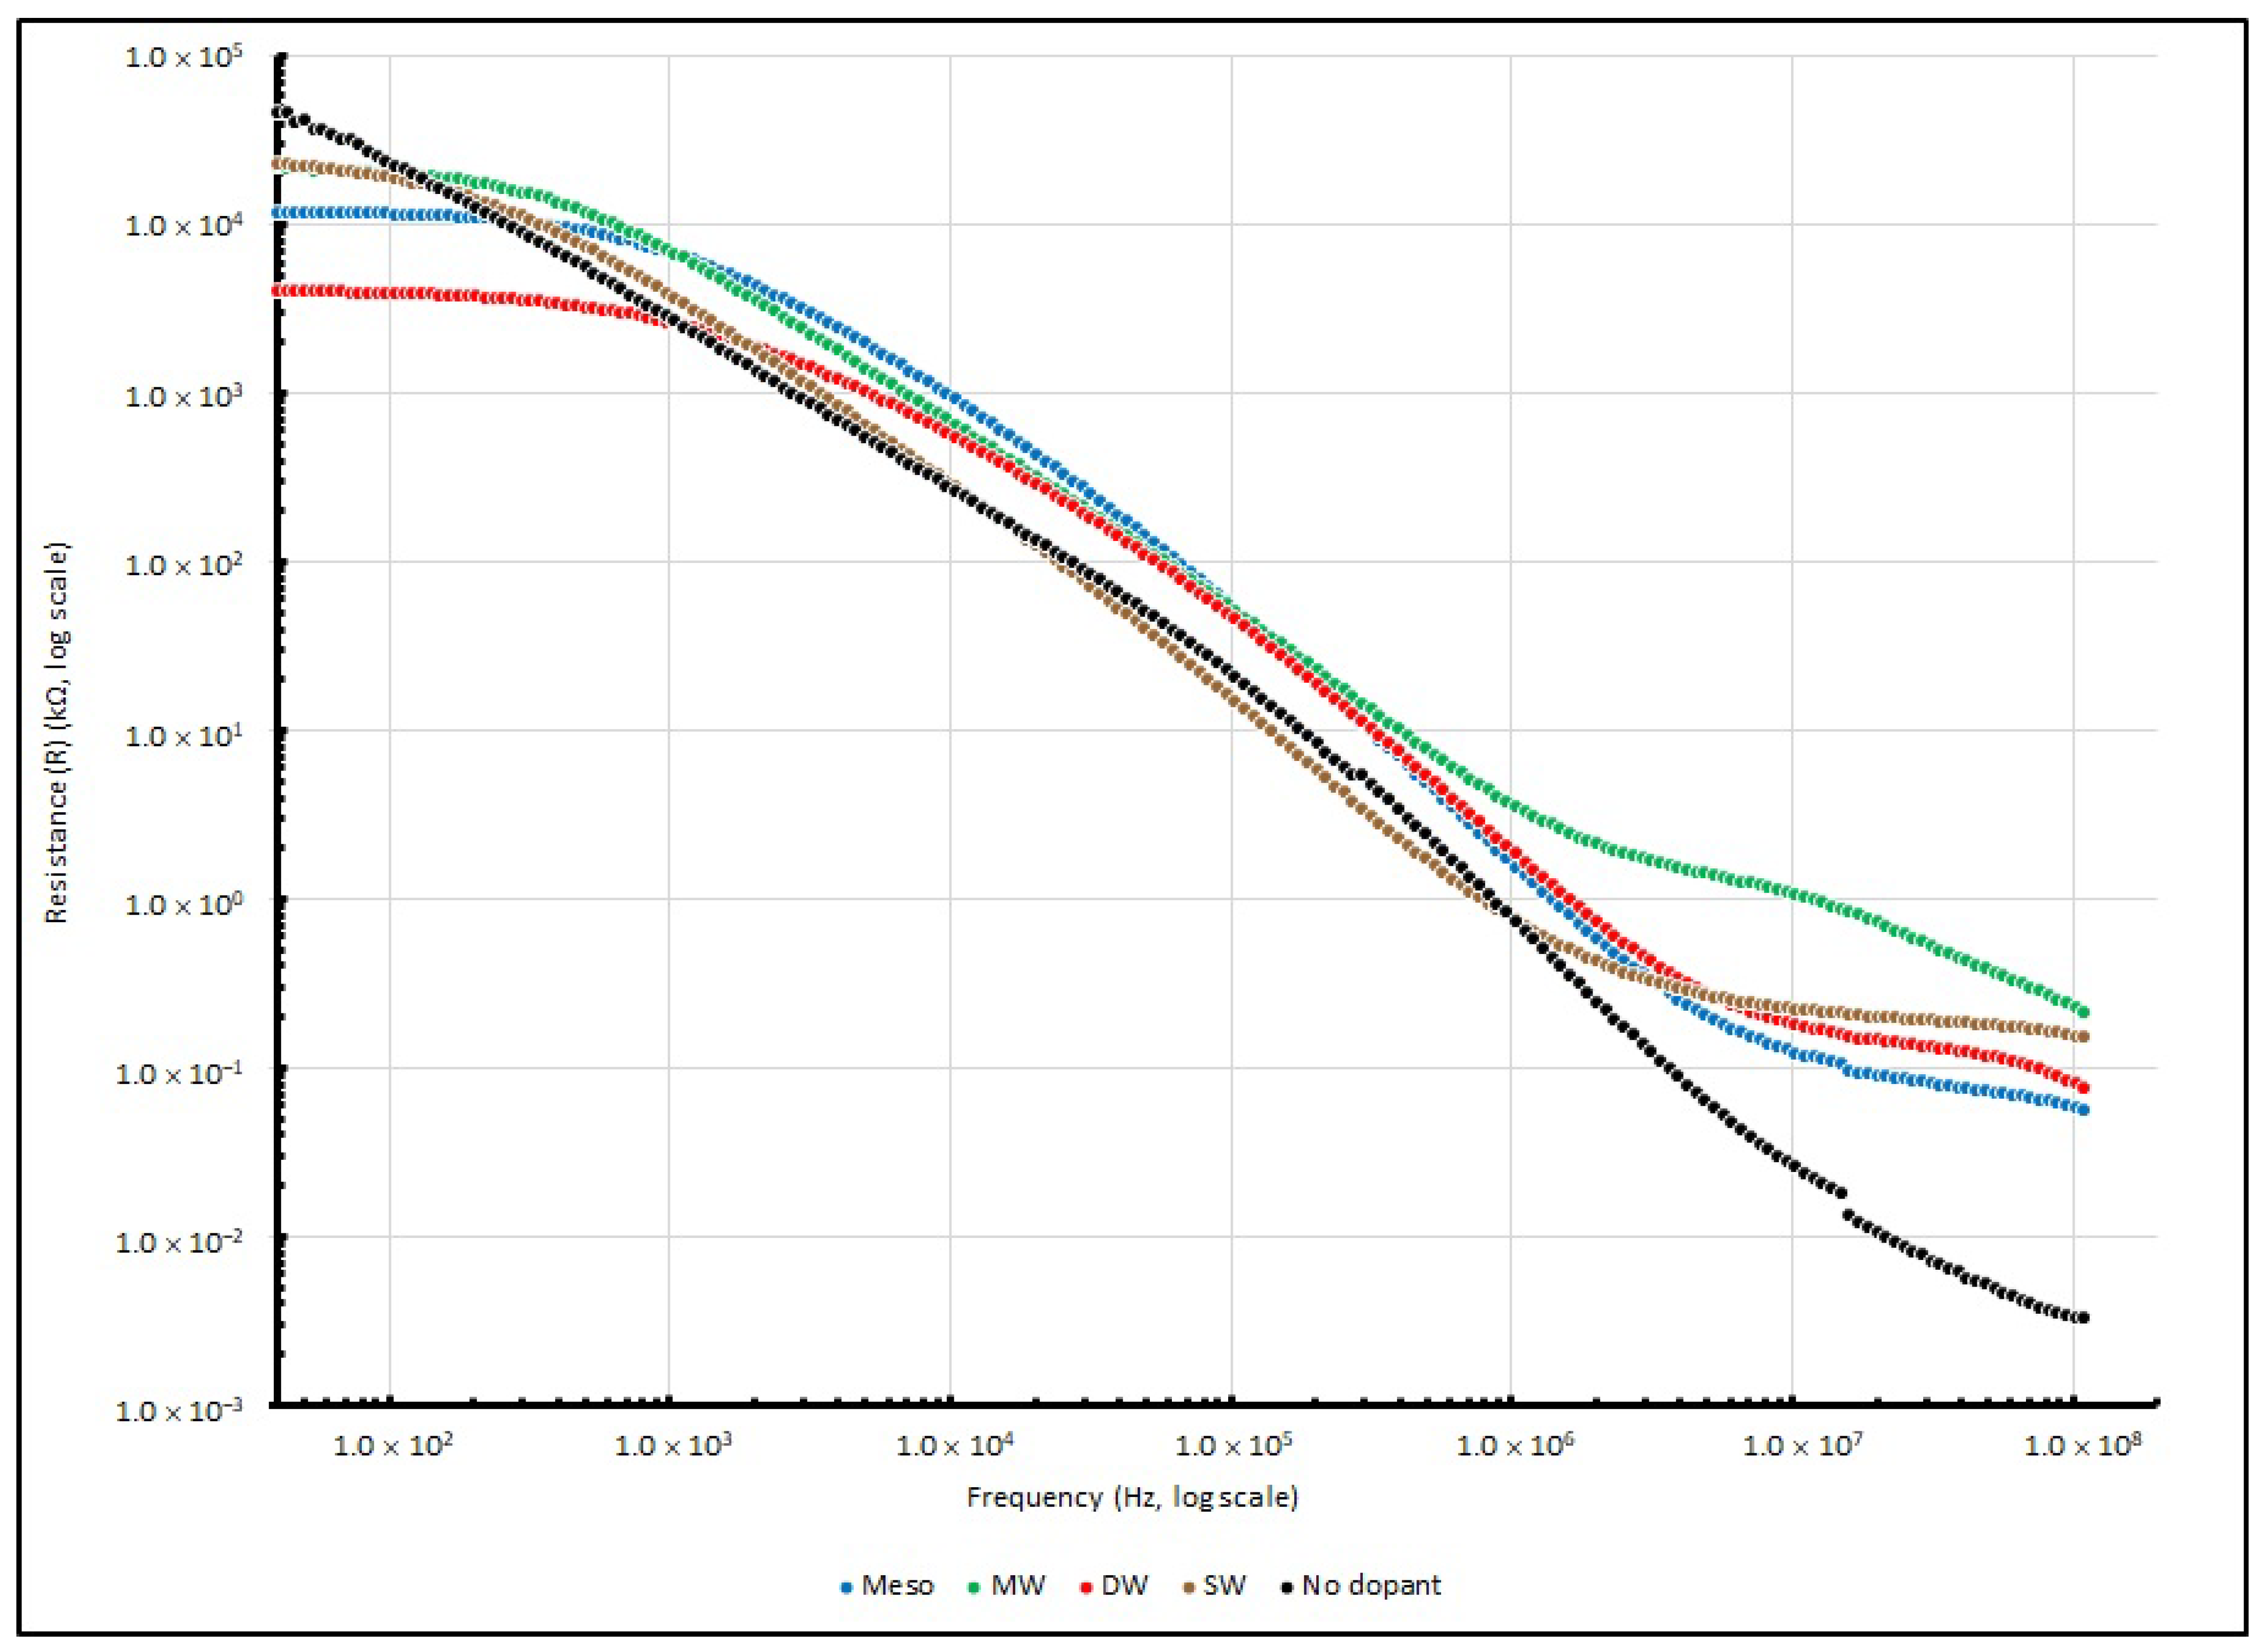
Table 16, respectively. Moreover, the changes in series resistance from 40 to 100 MHz are illustrated in
Figure 17. For the change in reactance, the absolute reactance (|X|) instead of reactance (X) from 40 to 100 MHz is illustrated in
Figure 18, and the negative magnitude is used to show that the measured reactance is dominated by capacitive elements.
Theoretically, the sample measurement of total impedance (Z) should involve a pair of elements: the real and imaginary part, which represent the resistive element (R) and reactive element (X), respectively. In the experiment, when the testing frequency increases and reaches 100 MHz, the resistance of all of the PEO:nanocarbon samples decreases from MΩ to a few tens of Ω. Among the four samples, DW shows the lowest R, which is one order of magnitude less than the other samples. Additionally, when the testing frequency rises, the reactance of all of the PEO:nanocarbon samples decreases from kΩ to tens to hundreds of Ω at 100 MHz. DW shows the lowest X, which is one order of magnitude less than the other samples, as the negative magnitude of X is used to show that the measured reactance is dominated by the capacitive elements.
|
Z| and
θ data from the experiment taken from different nanocarbon-doped EDL samples at several testing frequencies (40, 1 K, 100 K and 100 MHz) are summarised in
Table 17 and
Table 18, respectively. Moreover, their changes in |
Z| and
θ from 40 to 100 MHz are illustrated in
Figure 19 and
Figure 20, respectively.
The magnitude of |Z| for all PEO:nanocarbon samples is more or less the same as the series resistances at 100 Hz or below; it seems that the reactance of all samples exhibits a negligible effect on |Z|. On the other hand, a negative value of θ in all readings shows that capacitive elements dominate the reactance. These phenomena show that resistive elements are largely governed by the frequency responses of an electrochemical system. The reactive element begins to influence |Z| after the testing frequency increases to 1 kHz, and beyond 1 kHz, the phase angle increases as |Z| is influenced by R and X at the same time. When the frequency reaches 100 kHz, the phase angle of all of the nanocarbon-doped samples increases rapidly to more than −75°; this shows that capacitive reactance is the major component affecting the magnitude of |Z|. However, the reactance response of SW becomes different after the frequency is raised beyond 100 kHz. The phase angle decreases along with the increase in frequency, and reaches −30.47° at 100 MHz.
A comparison of all four PEO:nanocarbon samples shows that the resistance, reactance and impedance values of DW are much smaller than those of other PEO:nanocarbon samples. The empirical results suggest that the charge mobility in the PEO electrolyte can be enhanced if DW is doped into the PEO matrix, by providing a more advanced environment than the other three types of nanocarbons, and further improve the charge storage capability. Moreover, for the testing frequency at 1 kHz, the presence of nanocarbons can trigger some effects on reactance.


