Article

The Effect of Yttrium Addition on Microstructure and Mechanical Properties of Refractory TiTaZrHfW High-Entropy Films

1
Laboratory of Mechanical & Material Engineering, Antenne de Nogent—52, Pôle Technologique de Sud—Champagne, 52800 Nogent, France
2
Nogent International Center for CVD Coating (NICCI), LRC CEA-LASMIS, Pôle Technologique de Sud—Champagne, 52800 Nogent, France
3
Centre National de la Recherche Scientifique, Institut Matériaux Microélectronique Nanosciences de Provence, Faculté de Saint-Jérôme, Aix-Marseille Université, Service 142, CEDEX 20, 13397 Marseille, France
*
Author to whom correspondence should be addressed.
Coatings 2023, 13(8), 1380; https://doi.org/10.3390/coatings13081380
Submission received: 17 July 2023 / Revised: 1 August 2023 / Accepted: 2 August 2023 / Published: 7 August 2023

Abstract

:
Refractory high-entropy films (RHEFs) are a new type of high-temperature material with great prospects for applications due to their superior properties. They have the potential to replace nickel-based superalloys in order to develop a new generation of materials that can be used under extreme conditions. (TiTaZrHf)100−xYx RHEFs are prepared using the magnetron sputtering technique. The yttrium (Y) content varies from 0 to 56 at.%. XRD analysis indicates the formation of an amorphous phase in Y-free films, while new phases are formed after the addition of Y. The results are confirmed by TEM analysis, revealing the formation of nano-grains with two phases L12 and Y-P6/mmm structure. With an increasing Y content, the grain size of the nano-grains increases, which has a significant effect on the mechanical properties of the films. Hardness decreases from 9.7 GPa to 5 GPa when the Y amount increases. A similar trend is observed for the Young’s modulus, ranging from 111.6 to 82 GPa. A smooth and featureless morphology is observed on the low Y content films, while those with a larger Y content appear columnar near the substrate. Furthermore, the phase evolution is evaluated by calculating the thermodynamic criteria ΔHmix, ΔSmix, Ω, and δ. The calculation results predict the formation of new phases and are then in good agreement with the experimental characterization.

1. Introduction

High-entropy alloys (HEAs) are of considerable interest due to their superior properties. Since 2004, they have been defined as quasi- or equimolar alloys, and they consist, at least, of five elementary elements with an atomic percentage ranging from 5 to 35 at.% [1,2,3]. Various investigations have been carried out to explore the physical and chemical properties of HEAs for potential applications [4,5]. Due to the high-entropy effect, solid solutions can be formed rather than intermetallic compounds. HEAs tend to form FCC [6], BCC [7], and HC [8] crystalline structures. They exhibit interesting mechanical and physical properties [9,10,11,12] compared to conventional alloys. Refractory high-entropy alloys (RHEAs) are composed of refractory components and have become more attractive for applications in extreme environmental conditions. Refractory transition metal elements are characterized by a high melting point. They can be used in many areas, such as oxidation [13], wear [14], corrosion [15], and high-temperature mechanical impact [16]. Due to the different properties and performances, researchers are striving to develop manufacturing techniques to obtain RHEAs with superior properties.
In fact, RHEAs have relatively high temperature resistance up to 1600 °C and can be exploited for aerospace applications as potential substitutes for nickel-based superalloys. For examples, Senkov et al. developed high-entropy refractory alloys with near-equiatomic concentrations, Nb25Mo25Ta25W25 and V20Nb20Mo20Ta20W20 [17]. The results reveal that the alloys exhibit high compressive yield strength and high thermal stability. Nb25Mo25Ta25W25 has a yield strength of 477 MPa at 1600 °C with a density of 12.36 g/cm3; however, its toughness is low at room temperature (RT). Refractory alloys could be a good alternative for replacing superalloys.
Compared to bulk alloys, films have also been developed and used in surface coating technology to improve the durability of materials in extreme environments. Various technologies have been used to design and synthesize the films, such as laser cladding [18,19,20], magnetron sputtering [21,22,23,24,25,26], and others [27,28]. Among them, magnetron sputtering is the most used technique to synthesize the films in neutral or reactive atmospheres. Good mechanical properties, corrosion resistance, and thermal stability were reported for RHEFs. Alvi et al. [29] have studied TaCuMoW by magnetron sputtering. The films have high hardness and Young’s modulus, with measured values of 21.3 and 278.2 GPa, respectively. Generally, alloys or films can have improved properties when doped with other elements [30]. Bachani et al. [31] reported that VNbMoAlTaW can improve the corrosion resistance of 304L stainless steel (SS) substrates in H2SO4 solution. These results have been obtained by adding Al with different amount into VNbMoAlTaW. The film containing 2.37 at.% Al showed excellent corrosion resistance compared to 304L SS. As the atomic percentage of Al increases, the film tends to form a porous oxide that can be easily affected by acid.
The addition of elements to RHEFs can then strongly affect their properties. For this purpose, rare earths have excellent physical and chemical properties. They play an interesting role in improving the performance of the products. The irradiation hardening of V-4Cr-4Ti-xY alloys as a function of the yttrium amount has been reported [32]. The study reports a hardening effect of all V-4Cr-4Ti-xY alloys under self-ions V2+ irradiation at 550 °C. Moreover, doping materials with rare earth elements can also improve the oxidation resistance. With the appropriate amount, these elements can react with oxygen and hinder the diffusion of the latter [33]. Lu et al. [34] reported the yttrium effect on the oxidation resistance of AlMoNbTaTiZr. The study of the addition of yttrium in small quantities has been carried out at three different temperatures: 800, 900, and 1000 °C. With 0.6 at.% yttrium, the results revealed that the film had better oxidation resistance. The addition of yttrium in a high amount (1 at.%) leads to the formation of local stresses and cracks due to the rapid and aggregate oxidation of Al3Y5 [34]. The addition of rare earth elements has also been reported to improve the mechanical properties of refractory alloys. For example, the addition of rare earth in steels or in aluminum alloys is an effective method to adapt the microstructure and improve their mechanical performances [35,36]. The approach can also be exploited to improve the properties of HEAs/HEFs. In particular, yttrium has been used in HEAs to study its effect on their microstructure evolution and mechanical properties. It is important to note that the enthalpy ΔHmix of yttrium is lower than that of other elements; therefore, its combination with other elements can stabilize the film structure. Due to their performances, RHEFs can then have a wide range of applications in surface modification fields. Up to now, limited investigations have been reported in the literature regarding the yttrium effect on the properties of RHEAs. Long et al. [37] and Li et al. [38] reported that the presence of yttrium and boron elements in HEAs can lead to precipitations due to the formation of negative enthalpy. Nano-phases were also formed for AlCoCrFeNiYx [39], while face-centered cubic (FCC)-phased dendrite and hexagonal (h) interdendrites were reported for YCoCrFeNi [40]. The results showed improved yield strength, toughness, and compressive strength of the alloys after adding yttrium. Hong et al. [41] reported the enhanced solution solid strengthening of CoCrNi medium entropy alloys after increasing the yttrium content.
This study focuses on the influence of Y content from 0 to 56 at.% on the microstructure and the mechanical properties of TiTaZrHfW RHEF. The phase evolution as a function of the yttrium content is predicted by calculating the thermodynamic criteria of the films.

2. Experimental Details

2.1. Deposition Process

TiTaZrHfW100−xYx films are deposited on glass and silicon substrates using the magnetron sputtering technique. Two separate targets, pure Y and equimolar TiTaZrHfW, were used for the preparation of the films. Before the deposition process, substrates are cleaned by subsequent ultrasonication in acetone and ethanol (20 min each) followed by a drying process with hot air. Afterward, the substrates are ion etched in argon under a pressure of 0.5 Pa using a radiofrequency (RF) power of 400 watts for 30 min.
Each target is first cleaned in argon under a pressure of 0.5 Pa for 10 min before the deposition. For the TiTaZrHfW target, a discharge current is kept at 1 A while that of the yttrium target is changed from 0 to 2 A. The distance between the target and the substrate is about 10 cm. During the deposition process, the total pressure is kept constant at 0.3 Pa. No bias or substrate heating is performed during the deposition.

2.2. X-ray Diffraction (XRD)

A D8-Advance Bruker diffractometer (Bruker AXS GmbH, Karlsruhe, Germany) with CuKα radiation (λ = 1.54 Å) was used in order to analyze the microstructure of the TiTaZrHfW100−xYx films and identify the different present phases. The θ–2θ angle range was fixed from 30 to 90°. The scan parameters such as step size and scan speed were fixed at 0.02° and 0.5°/s, respectively.

2.3. Scanning Electron Microscopy (SEM)

The cross-sectional morphology of all films was carried out using a TESCAN SEM (TESCAN FRANCE, Fuveau, France) working with a field emission gun (FEG) (TESCAN FRANCE, Fuveau, France). The chemical composition of TiTaZrHfW100−xYx films is evaluated using an energy dispersive X-ray spectrometer (EDS) in the SEM (Hirow SH-4000M) (Hirox europe, Limonest, France).

2.4. Transmission Electron Microscopy (TEM)

TEM lamellae were prepared by mechanical polishing in order to remove as much of the Si substrate as possible for the observation of the film in the thinnest areas. The lamellae were ground down to a thickness of 1 µm using progressively finer grit SiC abrasive paper (down to 0.1 µ of roughness). Then, they were thinned down to about 100 nm using a Precision Ion Polishing System (PIPS-Gatan) working with Ar and using progressively reduced energies, from 5 to 2 kV, and incidence angles from 8° to 2°, respectively, to the polished face of the lamella.
High-resolution electron microscopy (HREM) images were carried out with a field emission gun FEI Titan Cs-corrected TEM (FEI, Eindhoven, Nederland) operating at 200 kV, and allowing a point-to-point resolution of 1 Å. Selected area ED patterns were acquired using a LaB6 FEI Tecnai TEM (FEI, Eindhoven, The Netherlands) at 200 kV.

2.5. Nano-Indentation

Hardness and Young’s modulus of all TiTaZrHfW100−xYx films are measured using the Nano Indenter, Hysitron TI 980 TriboIndenter (Bruker Nano Surfaces and Metrology, Tucson, AZ, USA), MTS Systems equipped with a three-sided pyramidal diamond tip Berkovitch indenter (Bruker Nano Surfaces and Metrology, Tucson, AZ, USA). The maximum penetration depth is limited to less than 10% of the film thickness in order to avoid the influence of the substrate stiffness. Various indents, around one hundred, were performed for each film to provide an average value of the hardness and Young’s modulus.

3. Results and Discussion

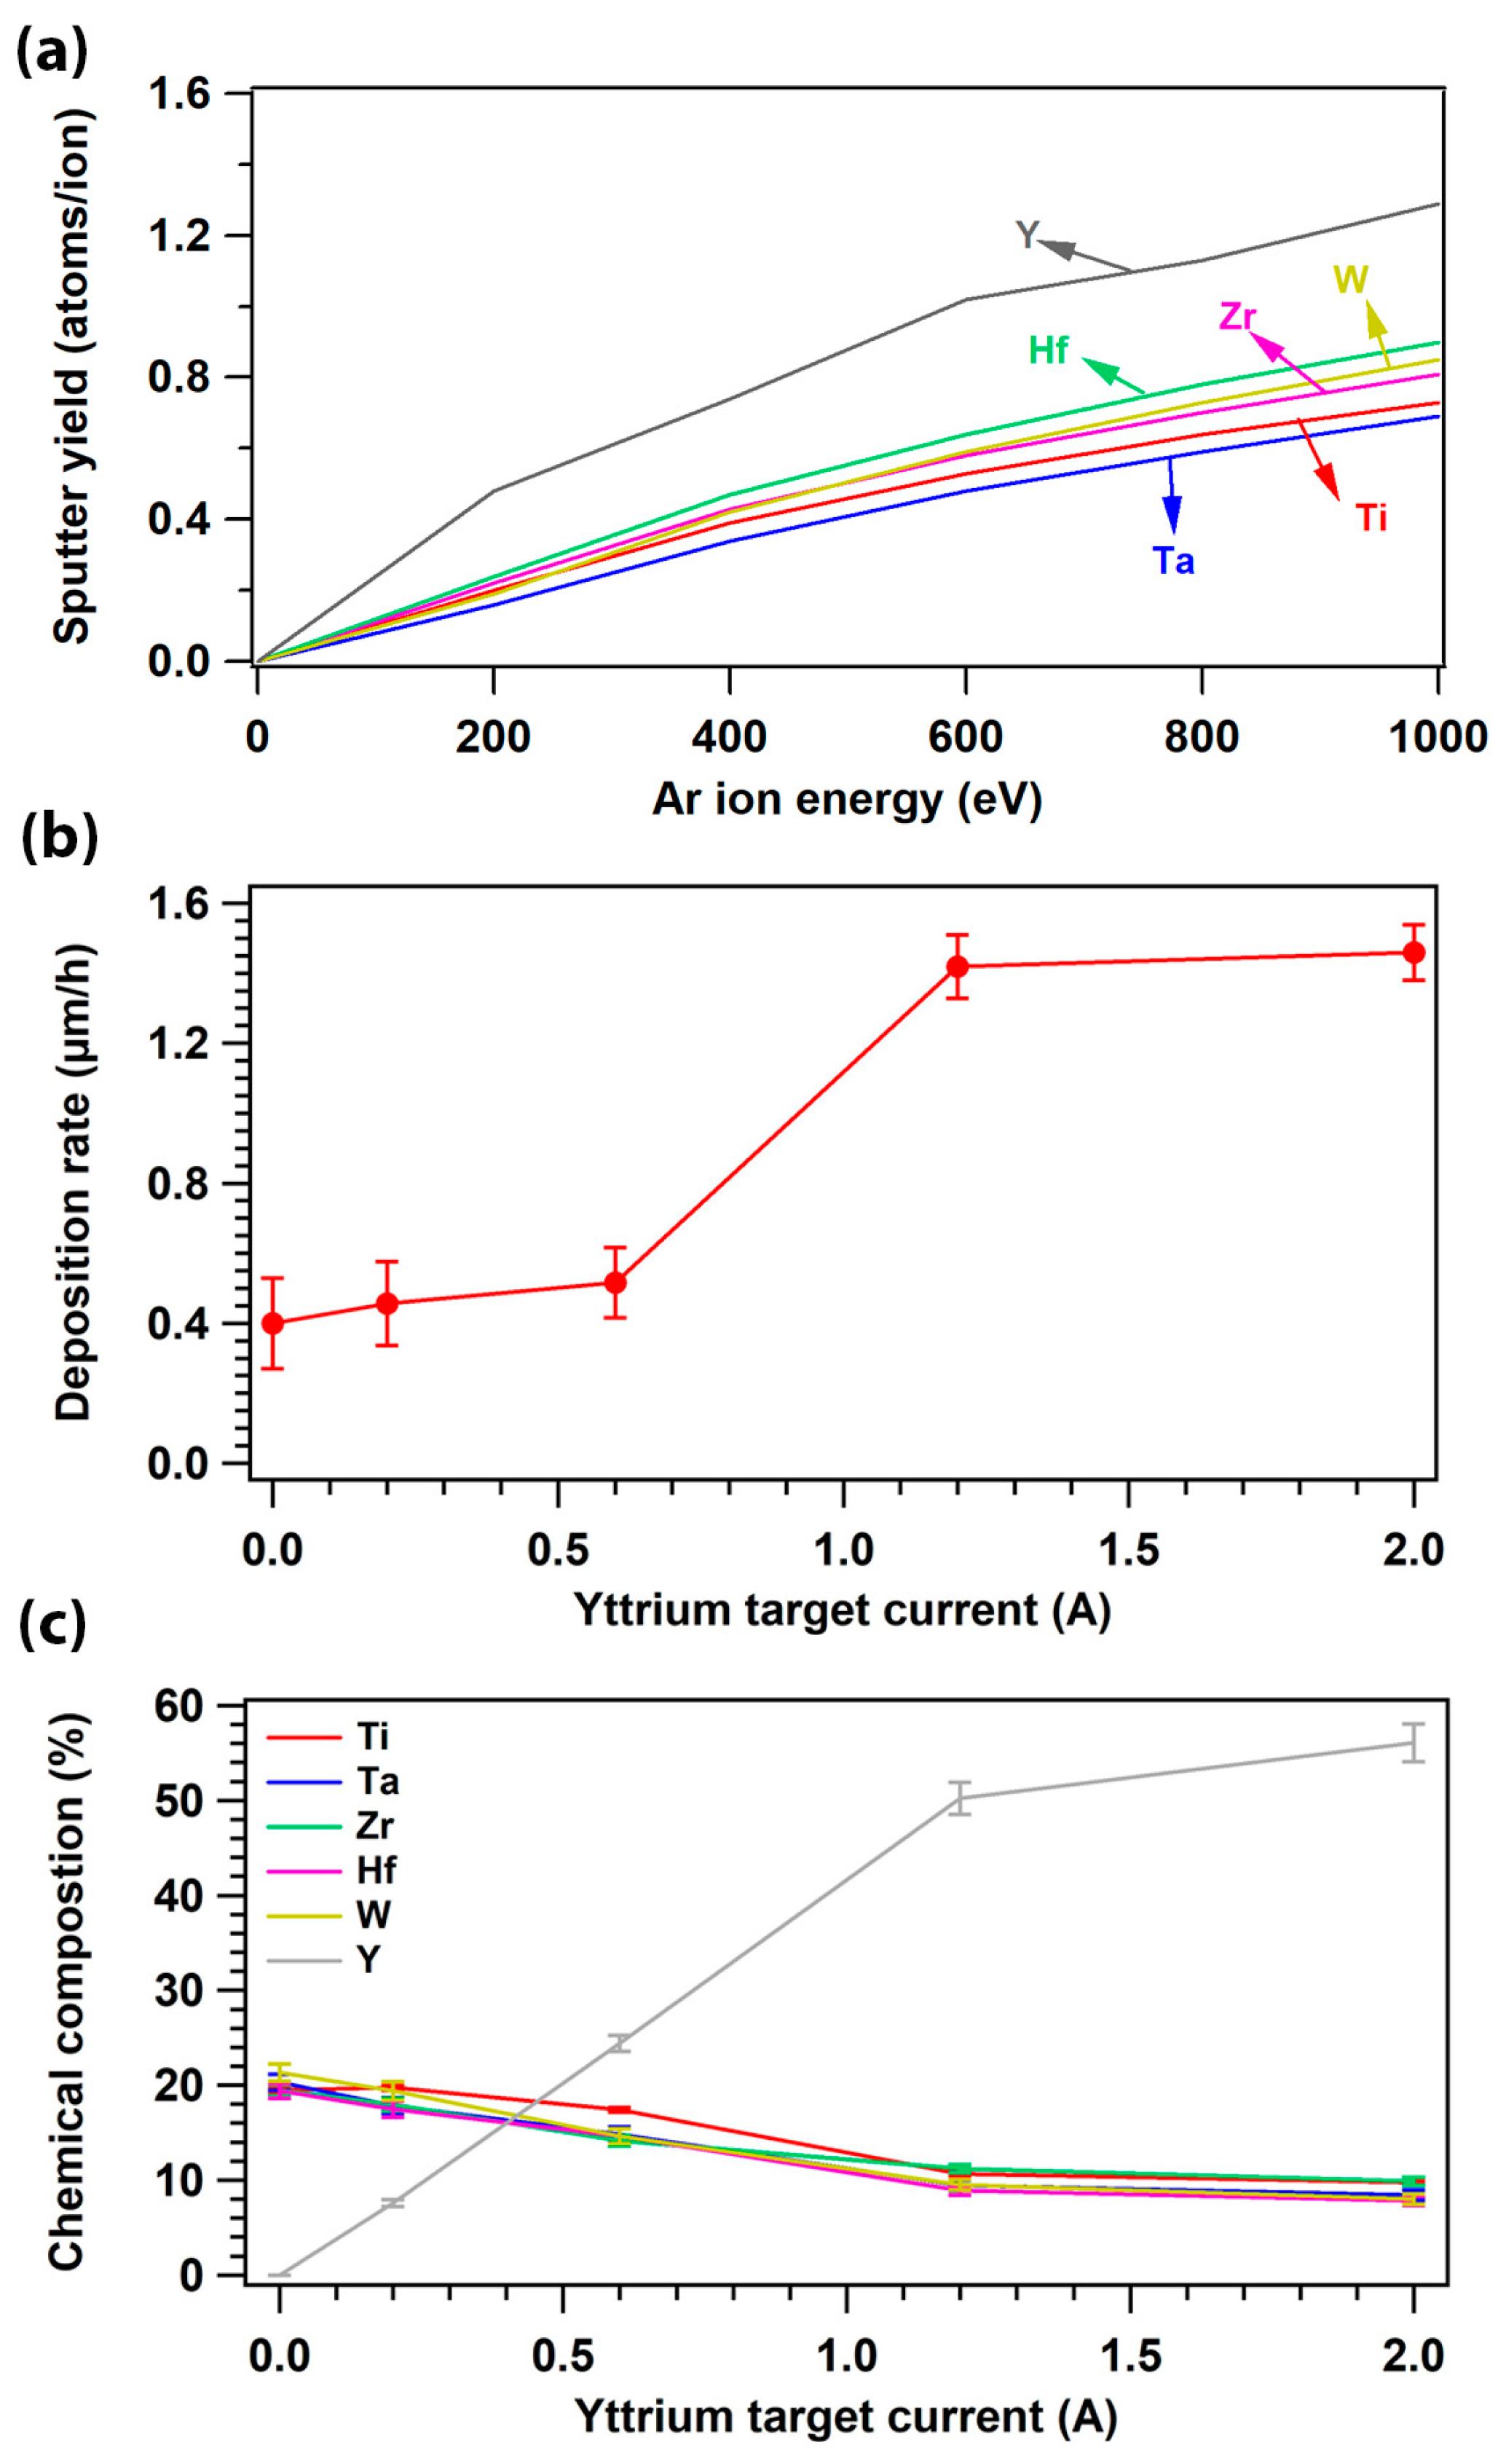
3.1. Sputtering Yield, Deposition Rate, and Chemcial Composition

The sputtering yield of six elements (Ti, Ta, Zr, Hf, W, Y) was calculated using Stopping and Range of Ions in Matter (SRIM) at different energies of Ar+ ions (Figure 1a). Zr and W have almost similar values of the sputtering yield considering Ar+ ions with energies less than 1000 eV, while the values for Ti and Ta are lower. The sputtering yield of Hf is larger than that of the other elements Ti, Ta, Zr, and W. Some studies have been conducted using sectioned target sectors of equal or different sizes to deposit multielement films [42,43]. In this study, a single TiTaZrHfW target was designed to reproduce an equimolar film, while Y was added from another target.
The deposition rate of (TiTaZrHfW)100−xYx HEF is presented in Figure 1b. It is obvious that the deposition rate increases as a supplementary element is added. A slight increase can be observed when the current of the Y target varies between 0 and 0.6 A. However, the deposition rate increases with the current (from 0.6 to 1.2 A) and reaches a maximum of ~1.5 μm/h, which remains almost constant up to 2 A. This rise is due to the high sputtering yield of Y compared to other elements (cf. Figure 1a).
The chemical composition was estimated by Energy Dispersive Spectroscopy (EDS) in a SEM. The results are presented in Figure 1c as a function of the Y target current, which is related to Y content. At 0 A, an equimolar quinary TiTaZrHfW film is formed. By increasing the current, the element content of the HEA target starts to decrease at the same time as the Y content increases. When the current is ranging from 0 to 1.2 A, Y content increases quickly to reach 50 at.%, then more slowly up to 56 at.% at 2 A. The content of other elements is about 9 at.%.

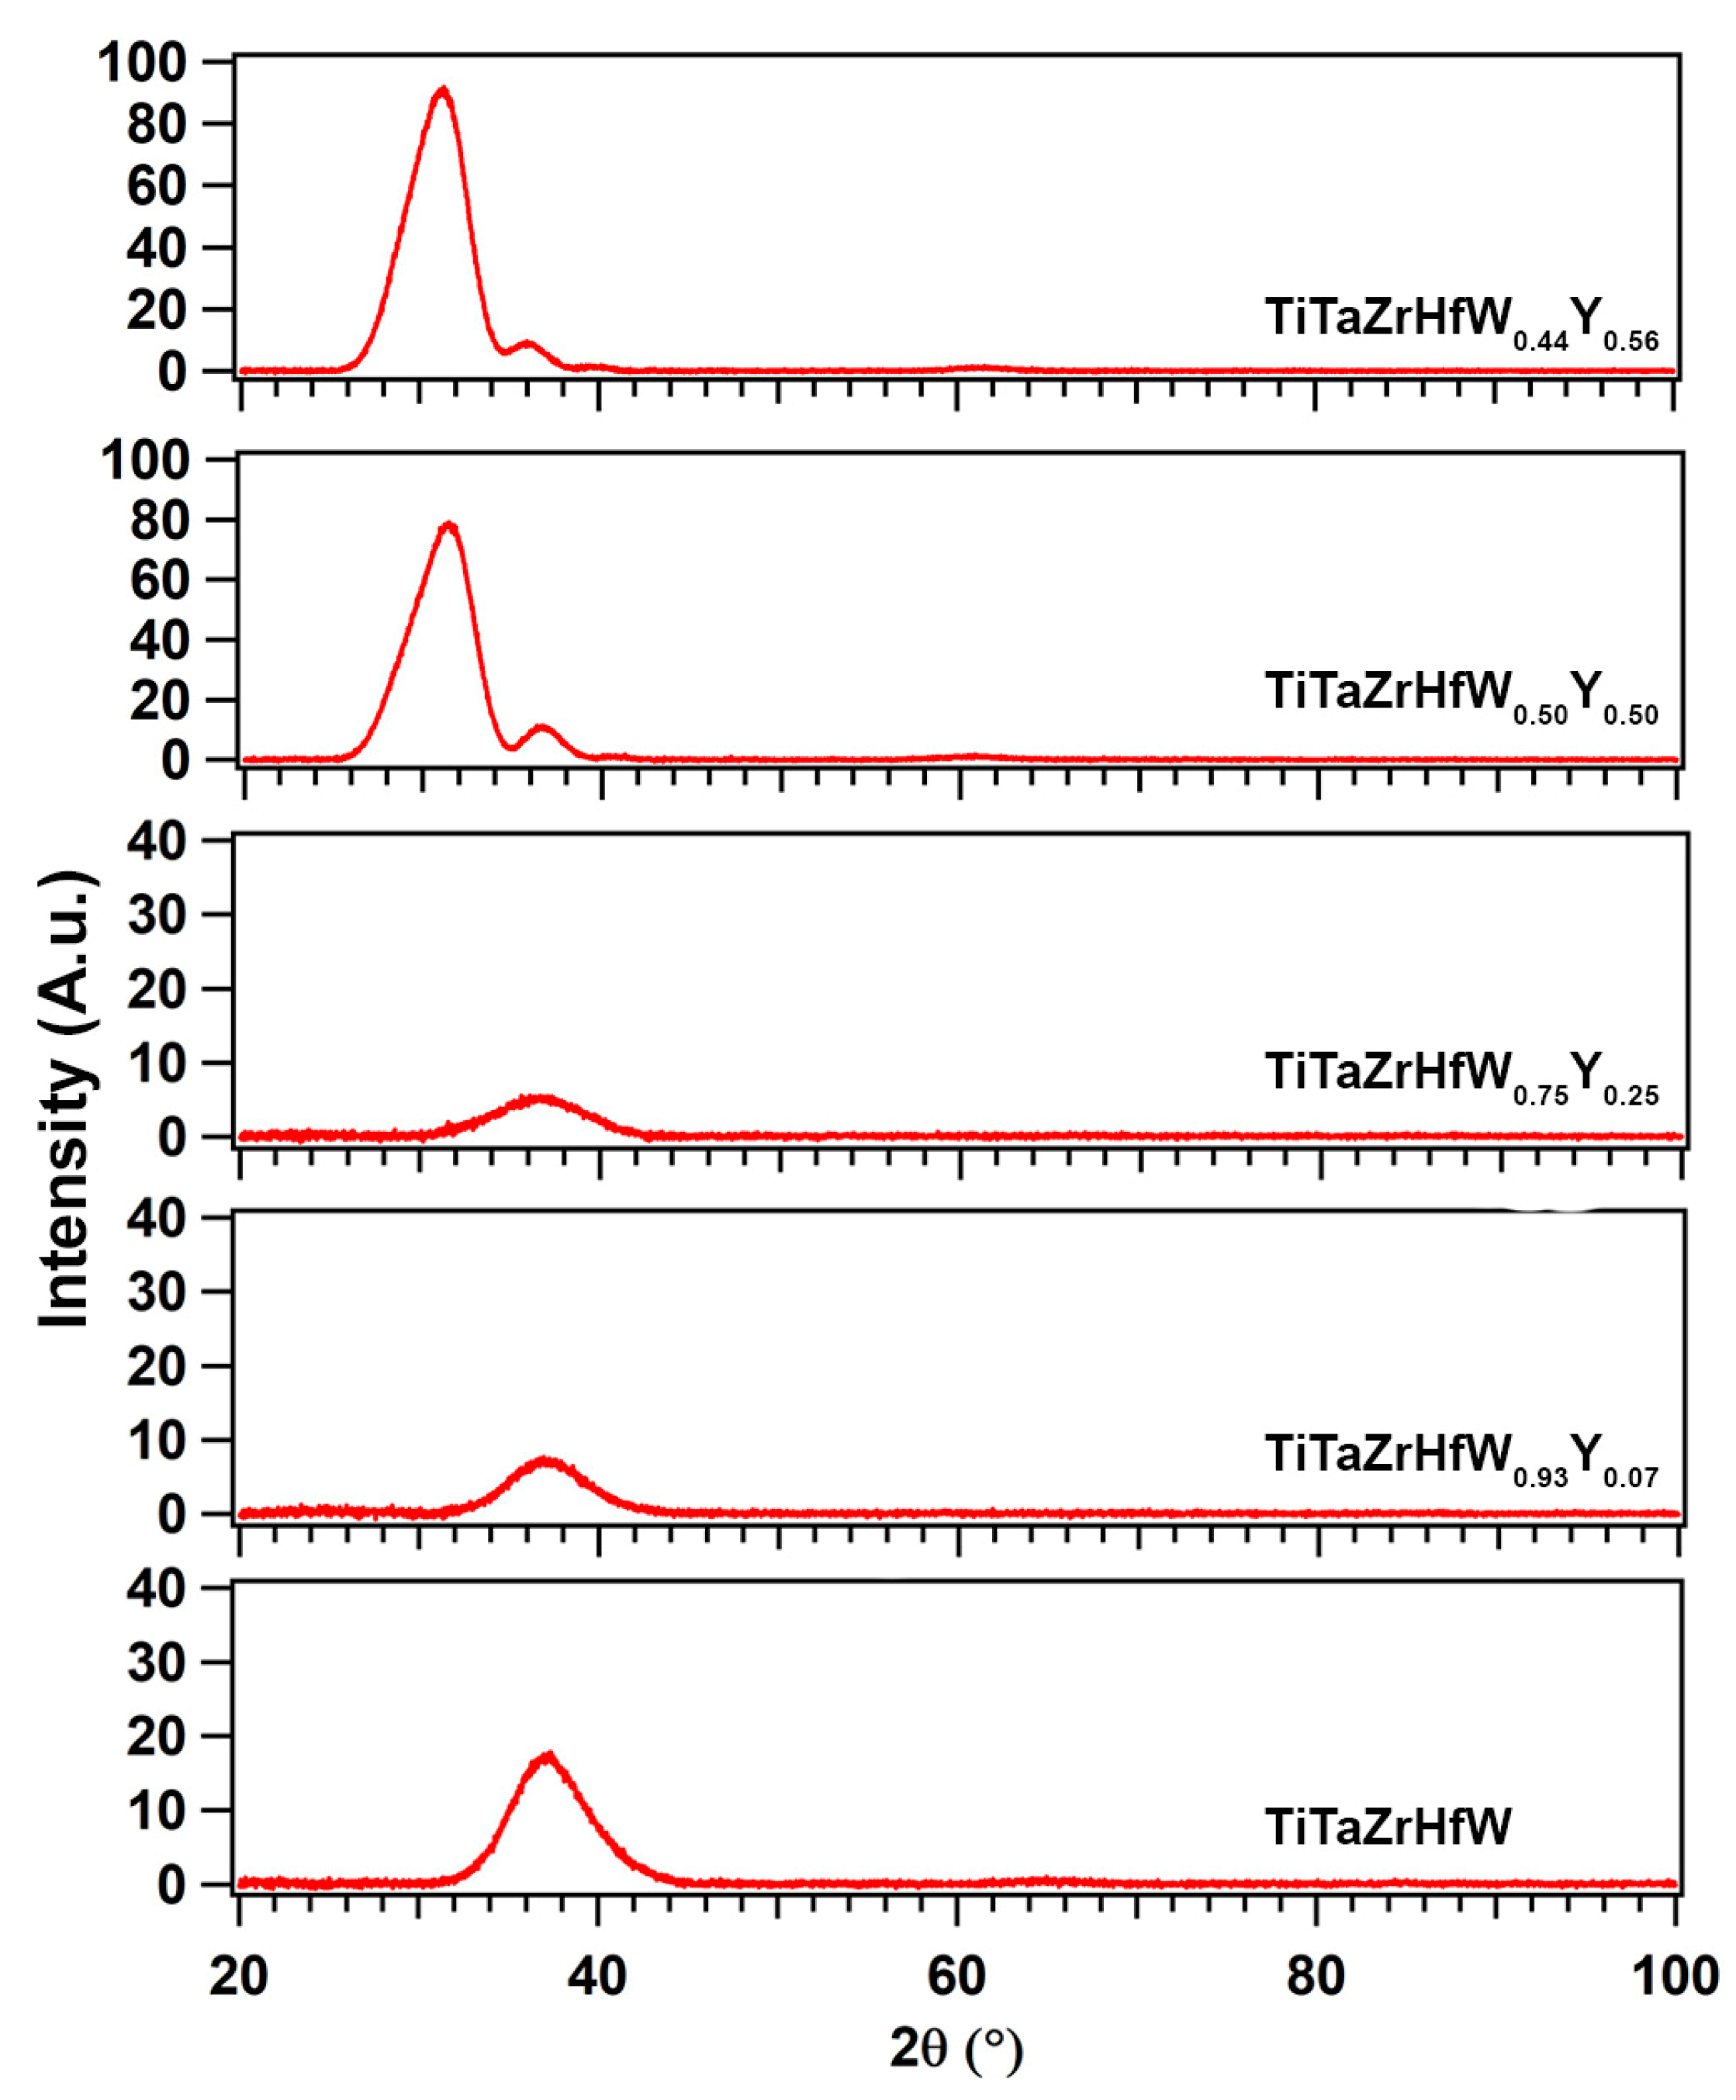
3.2. Strucure of (TiTaZrHfW)100−xYx

The microstructural characterization of the (TiTaZrHfW)100−xYx films by XRD is presented in Figure 2. One halo-shaped peak is present at around 38.5° for Y-free TiTaZrHfW, (TiTaZrHfW)0.93Y0.07, and (TiTaZrHfW)0.75Y0.25 films. We suppose that these three films are amorphous or nanocrystalline. Crystalline nano-domains may be presents, but the X-ray diffraction technique is not relevant to characterize them. By increasing the Y content, two peaks appear on the diffractograms (Figure 2). The first peak is always located at 38.5°, representing the first phase (amorphous or nanocrystalline). A new broad peak appears at 31°, revealing the formation of a new phase. Li et al. [38] studied the FeCoNi1.5CuBYx powder and sintered alloy where two phases have been reported as functions of the Y amount. The sintered alloy has a FCC structure. However, the addition of Y with a content of x = 0.1 leads to the formation of a small amount of precipitates defined in the primitive compact hexagonal (hcp). In our case, XRD analysis shows no significant change in the structure when the film is doped with a small amount of Y. However, adding a large amount of Y can lead to its precipitation, and a new phase is formed. Moreover, Y in a hexagonal structure shows that its main peaks are located between 28° and 30° [44,45]. Thus, we suspect that the new phase formed after adding Y with a high content could correspond to the precipitation of Y in TiTaZrHfW.

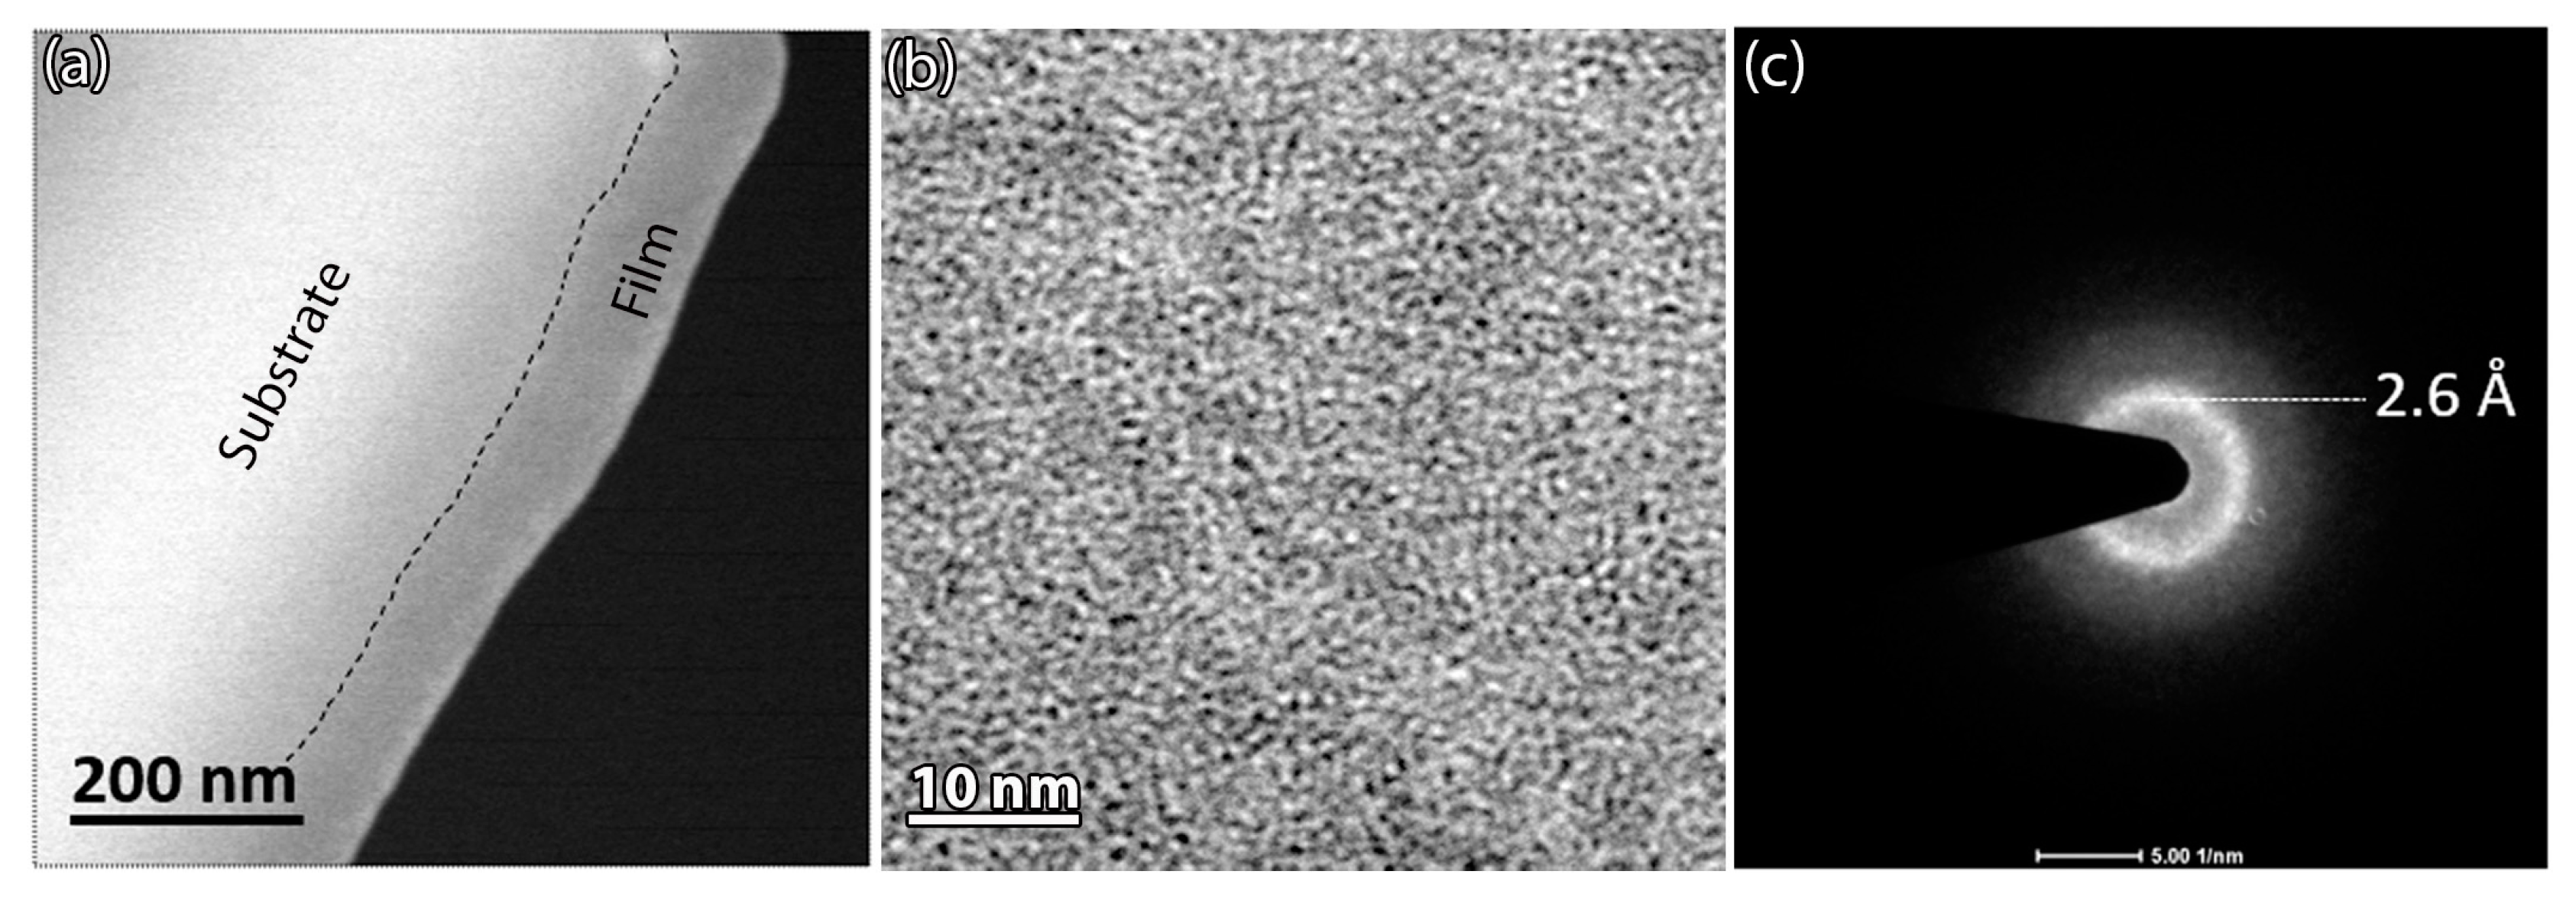
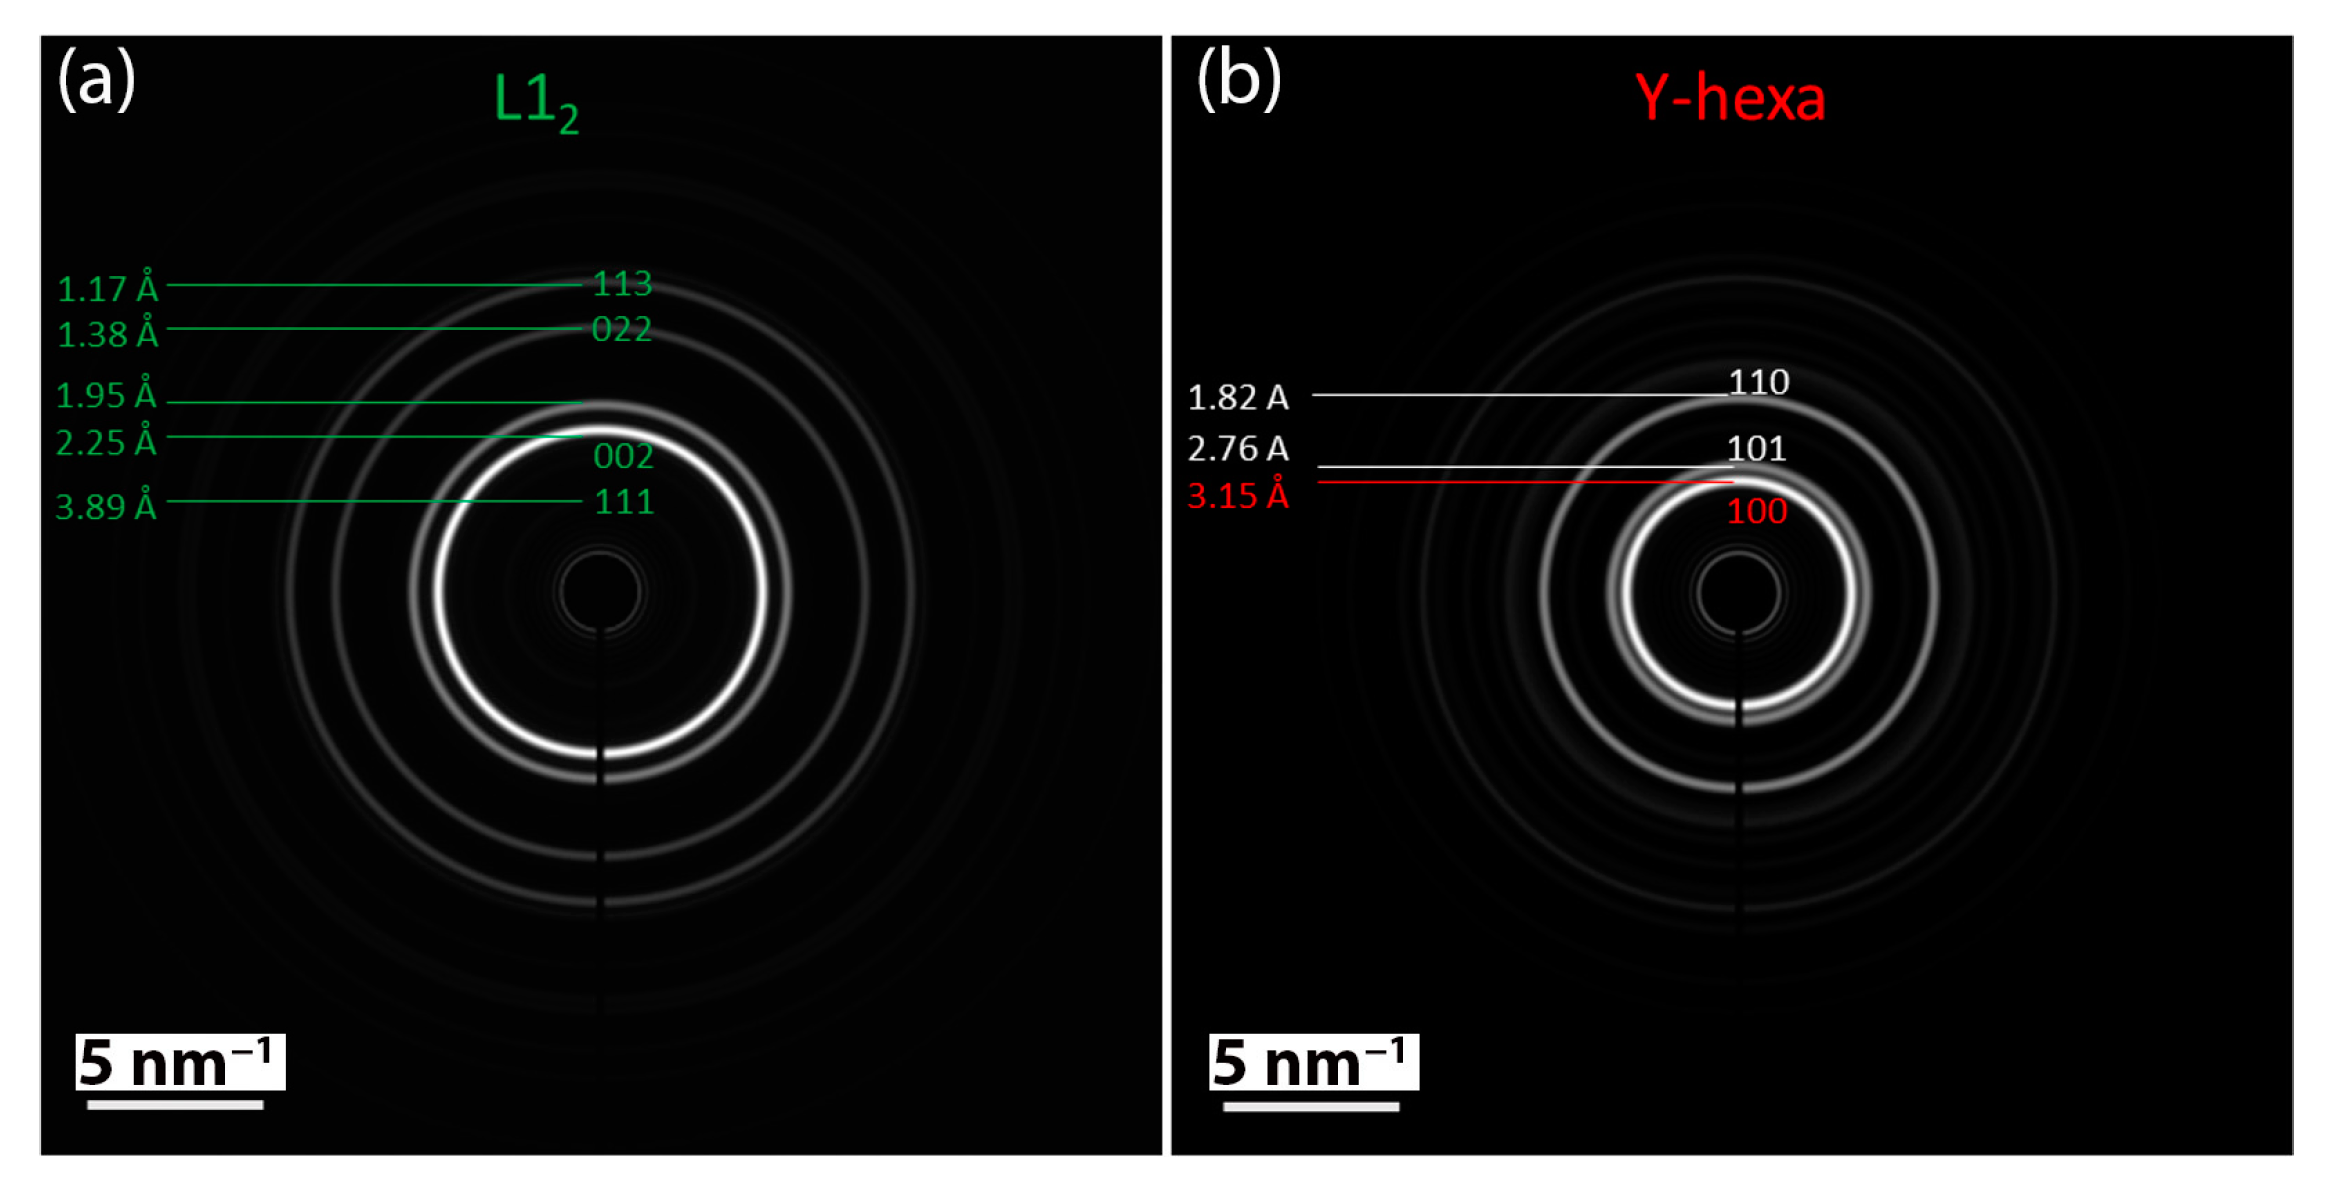
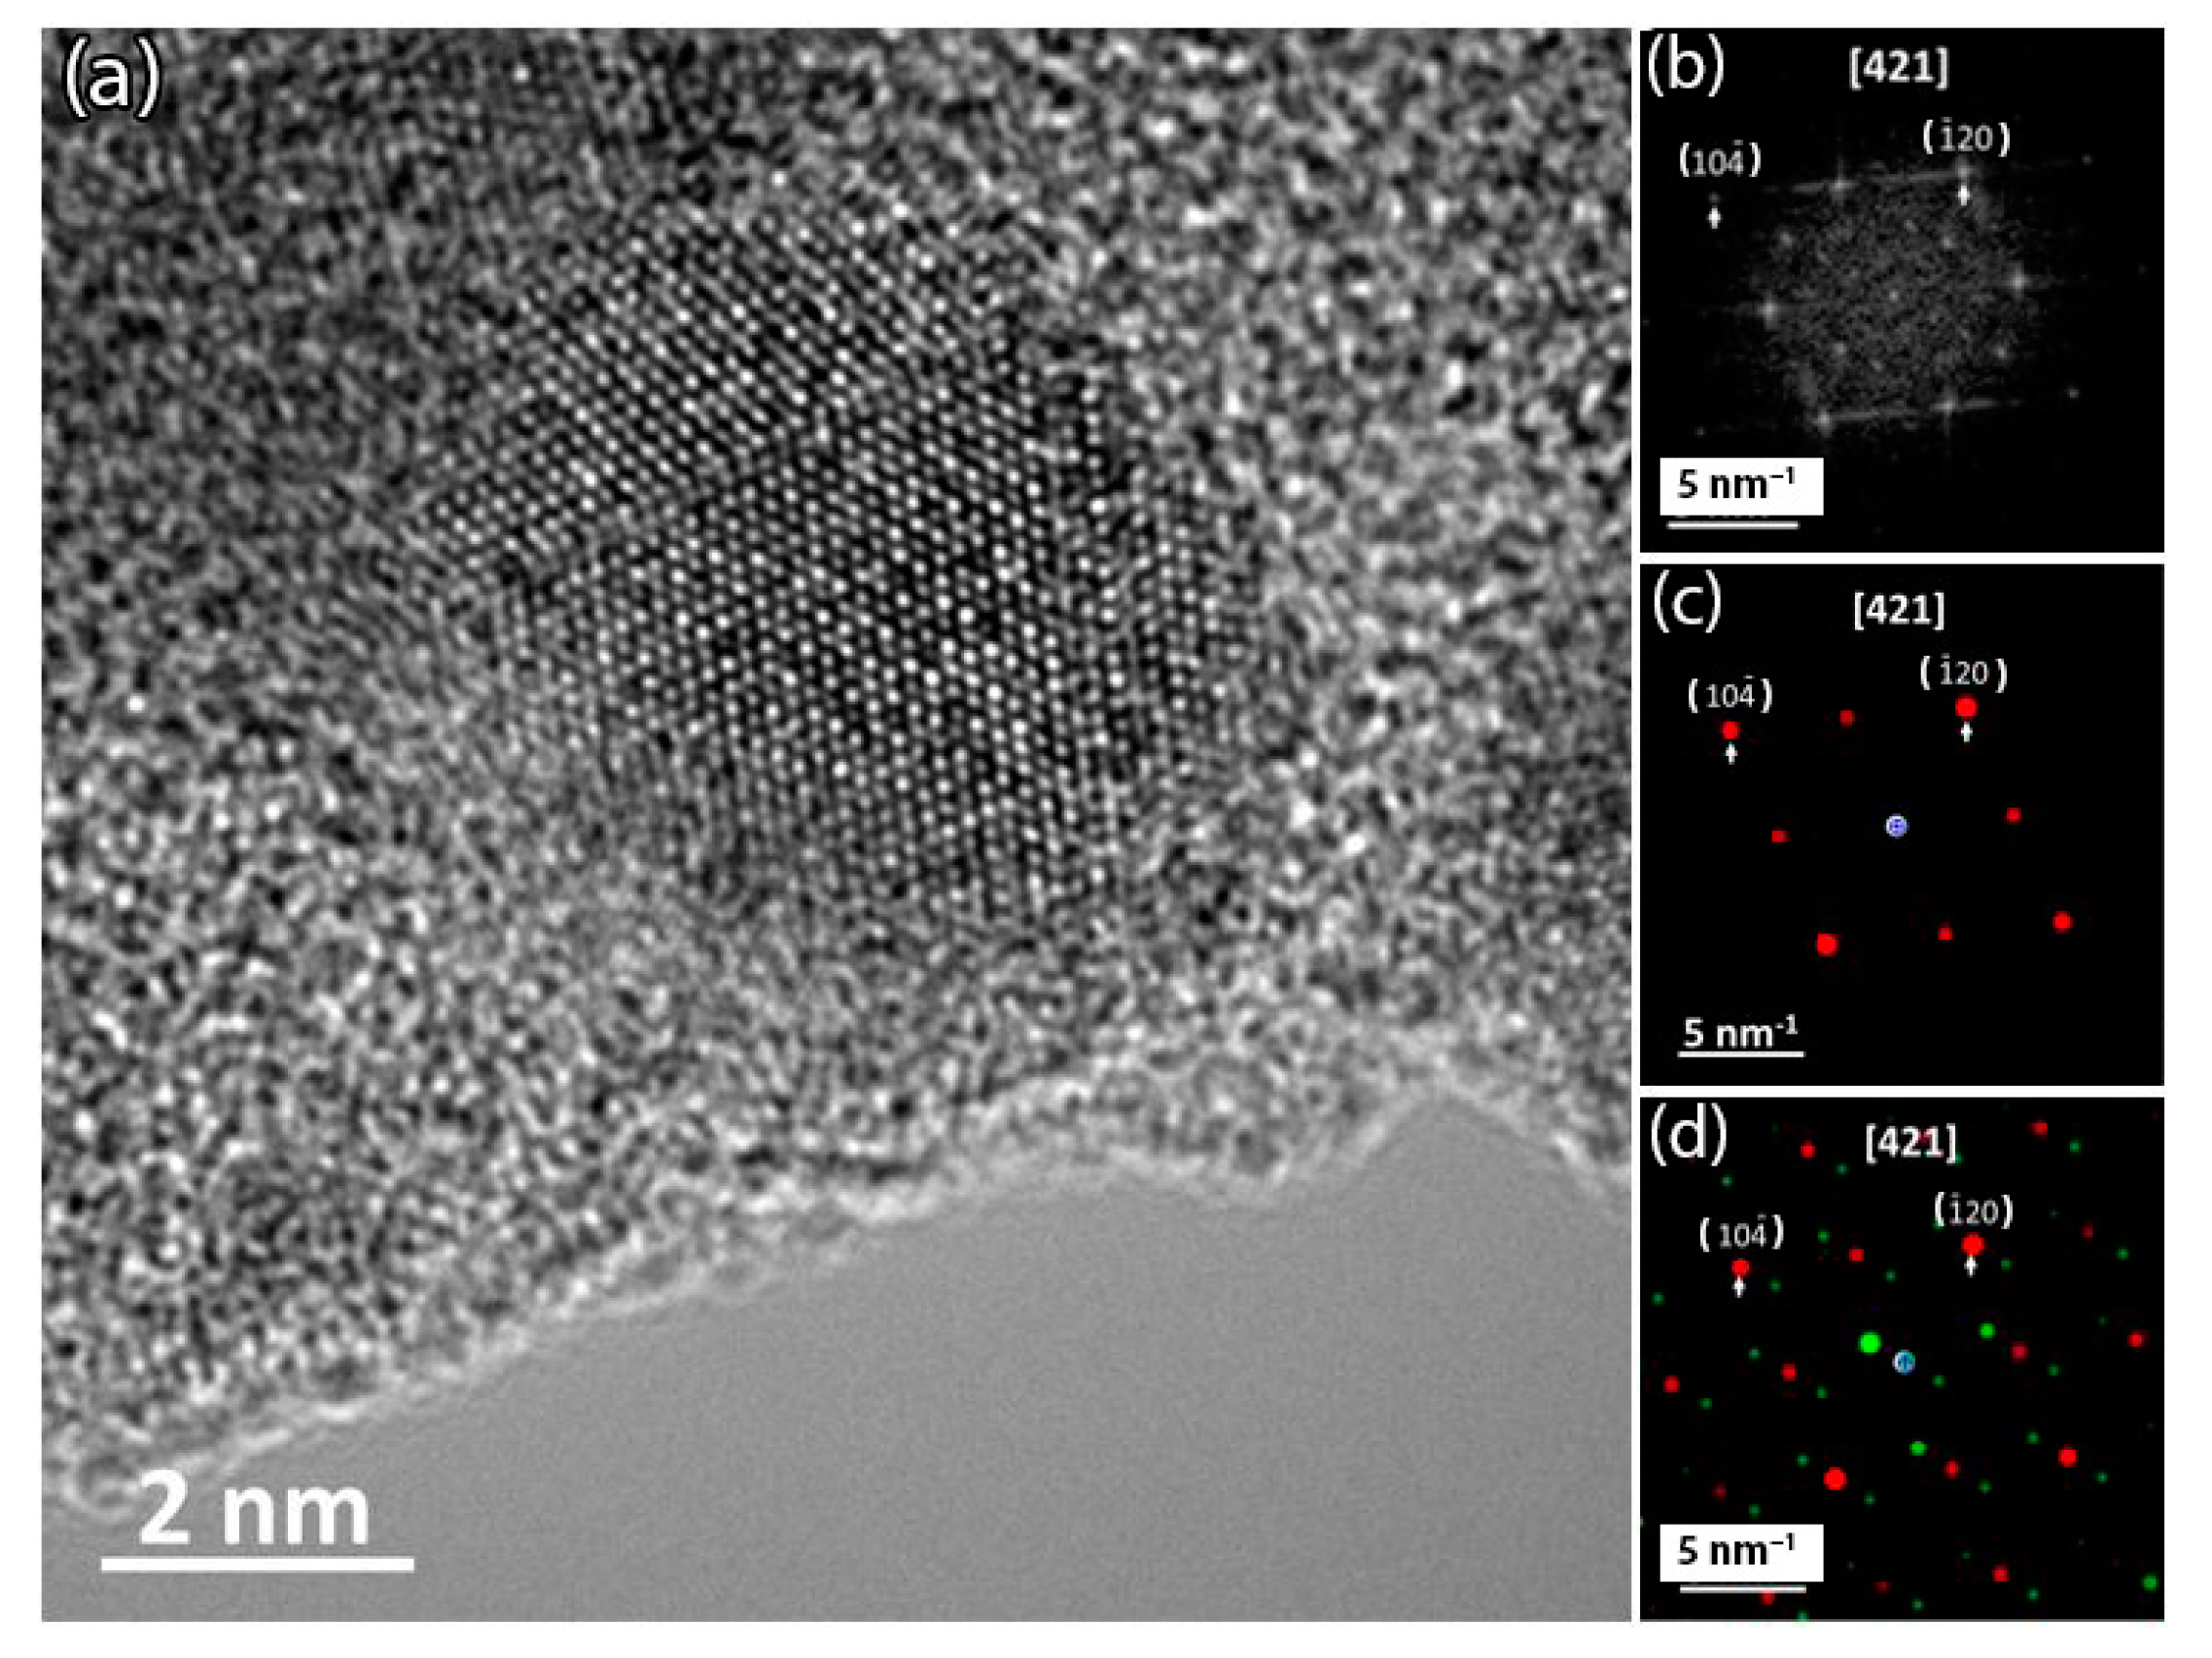
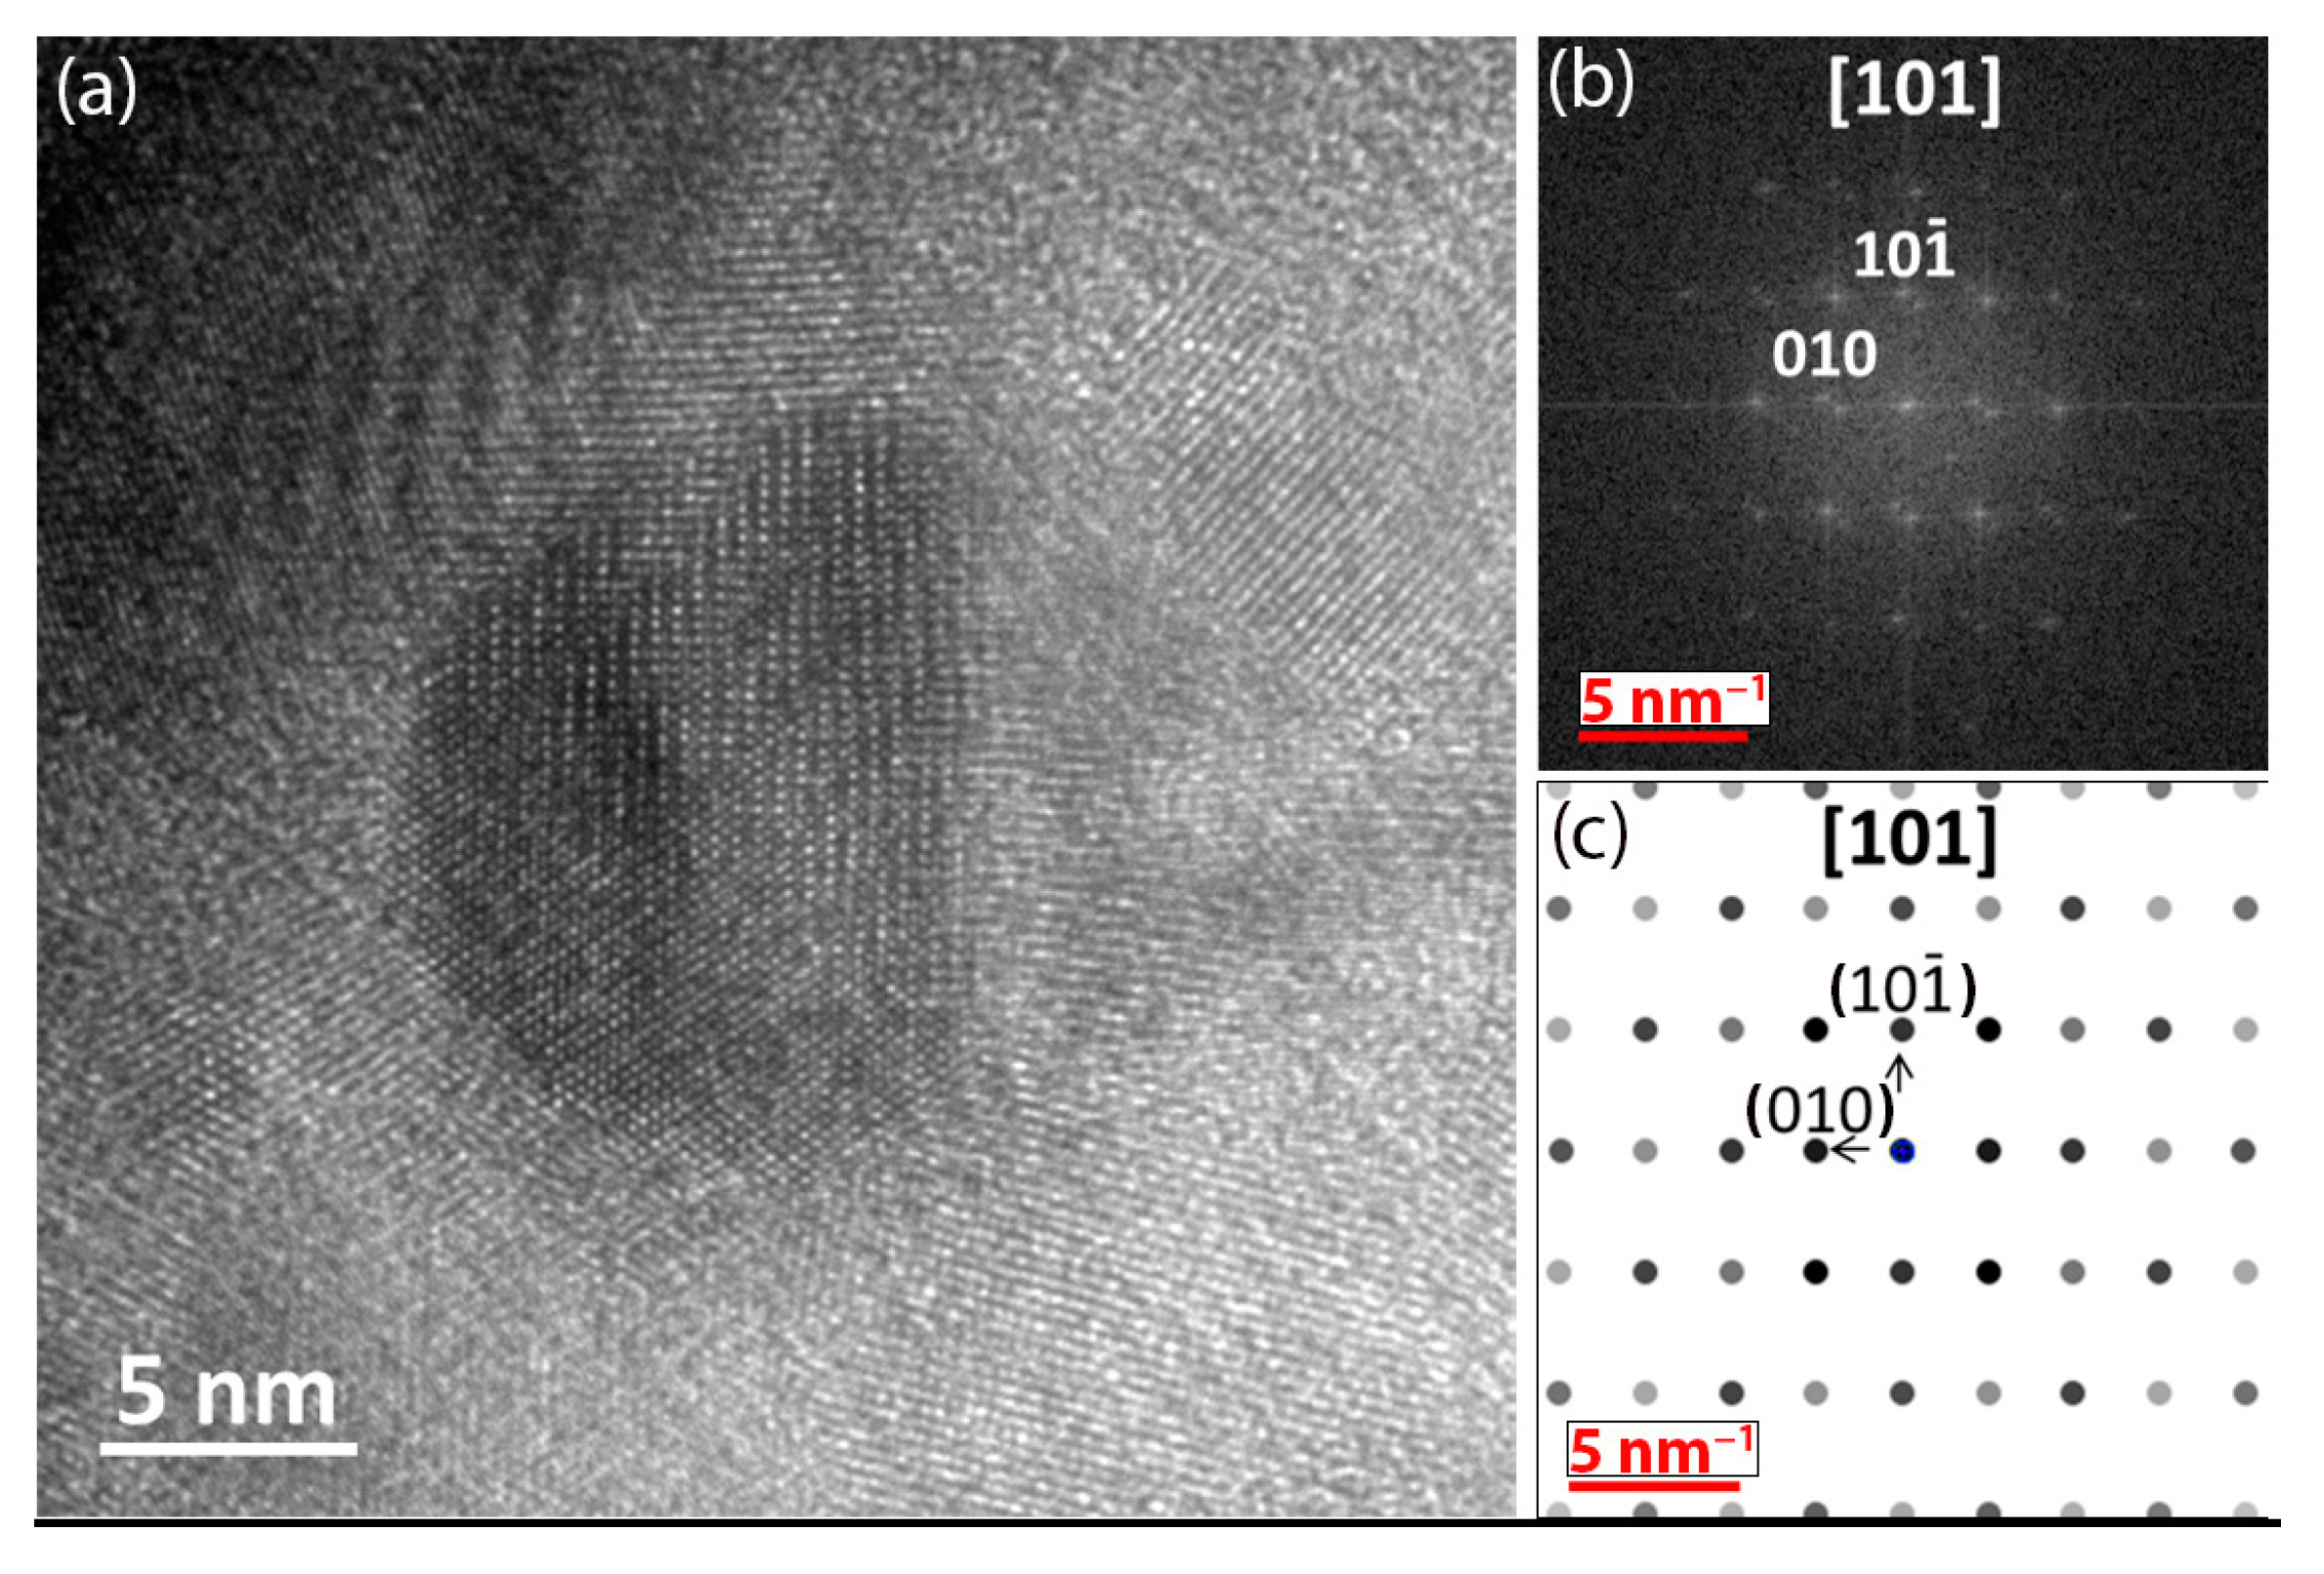
3.3. Microstrucure of (TiTaZrHfW)100−xYx

In order to correlate the XRD analyses obtained on different compositions and identify the two phases formed after the addition of Y, a TEM characterization was carried out on three films, namely TiTaZrHfW, TiTaZrHfW0.75Y0.25, and TiTaZrHfW0.44Y0.56. A low magnification bright-field image obtained in scan mode (BF-STEM) shows the Si substrate as well as the Y-free TiTaZrHfW deposited film (Figure 3a). The latter is observed on the edge of the thinned lamella where the substrate was removed by polishing. A high-magnification image reveals that the Y-free film is amorphous; no crystalline order can be observed. This is confirmed by a selected area electron diffraction (SAED) pattern recorded on the film. The presence of only one bright diffuse ring with a radius of 3.84 nm−1 (2.6 Å) is characteristic of an amorphous film.
At 25 at.% Y, TEM observations clearly show the homogeneous nanometric crystalline grains (~10 nm) embedded in a likely amorphous matrix (Figure 4a), as well as the growth of a nanocomposite film. The corresponding SAED pattern exhibits bright spots distributed on several circular rings corresponding to a polycrystalline microstructure (Figure 4b). As discussed above in Section 3.3, XRD analysis showed the presence of one large peak, revealing the formation of an amorphous or nanocrystalline phase for three Y-free TiTaZrHfW, TiTaZrHfW0.93Y0.07, and TiTaZrHfW0.75Y0.25 films. However, according to TEM characterization, these films are bi-phased after adding Y in a low amount (the image of TiTaZrHfW0.93Y0.07 is not shown as its XRD diffractogram is similar to the first composition). The first phase can be attributed to the amorphous when Y is added in a very low amount (7 at.% in this case). By increasing the Y content to 25 at.%, small grains (~10 nm) are formed. Their phase is difficult to identify by XRD, but the corresponding SAED pattern (Figure 5c) reveals a FCC structure (L12) attributed to TiTaZrHfWY.
At 56 at.% of Y content, the size of the grains has increased to about ~200 nm (Figure 4c). Moreover, it can be clearly seen that the grains are also bi-phased (grains contain other small ones that are around 10 nm in size). The corresponding SAED pattern (Figure 4d) exhibits one much more intense additional ring of 3.2 nm−1 radius (3.12 Å), confirming the presence of a second crystal phase. As mentioned above, the Y atoms crystalize in a hexagonal structure, and precipitation can be obtained by adding them in high content. A first family of nanoparticles constituting large grains around 200 nm can therefore be attributed to the L12 phase. The small grains (those inside of the big ones) present the L12 phase. A second family of nanoparticles located outside the large grains is defined in the Y hexagonal structure. The addition of Y in large amounts first leads to the dissolution of a small part to form the L12 phase, while the rest is precipitated into the Y hexagonal structure. By comparing XRD and TEM analyses, TiTaZrHfW is amorphous, while the addition of Y with a large content leads to the formation of two nanocrystalline phases (L12 and Hexagonal). Besides, the grain size is proportional to the Y content.
The calculation of the polycrystalline electron diffraction (ED) pattern [46] of both phase L12 (Figure 5a) and Y-hexagonal (Figure 5b) structures indicates their presence in the film at a high Y concentration (56 at.%). Indeed, diffraction rings located at 4.44 nm−1 (2.25 Å) and 5.13 nm−1 (1.95 Å) corresponding to the L12 structure as well as those at (3.17 nm−1) 3.15 Å and (3.62 nm−1) 2.76 Å attributed to the Y-hexagonal structure, are present in the experimental pattern.
An HREM image was recorded on an individual nanoparticle about 4 nm wide located outside the large grains (Figure 6a). From the corresponding fast fourier transformation, the pattern is indexed in the [421] zone axis of the Y-hexagonal structure (Figure 6b). Indeed, the corresponding ED calculations are in agreement with the experiment. The bright dots, like those indexed (104) and (120), belong to a zero-order Laüe Zone (red dots in Figure 6c) while the weaker dots belong to a first-order Laüe Zone (green dots in Figure 6d).
Concerning the second-phase L12, an HREM image was recorded on an individual nanoparticle of about 12 nm wide located in a large grain (Figure 7a). The corresponding FFT is indexed in the [010] zone axis of the FCC structure (Figure 7b), which is in agreement with the calculation (Figure 7c).

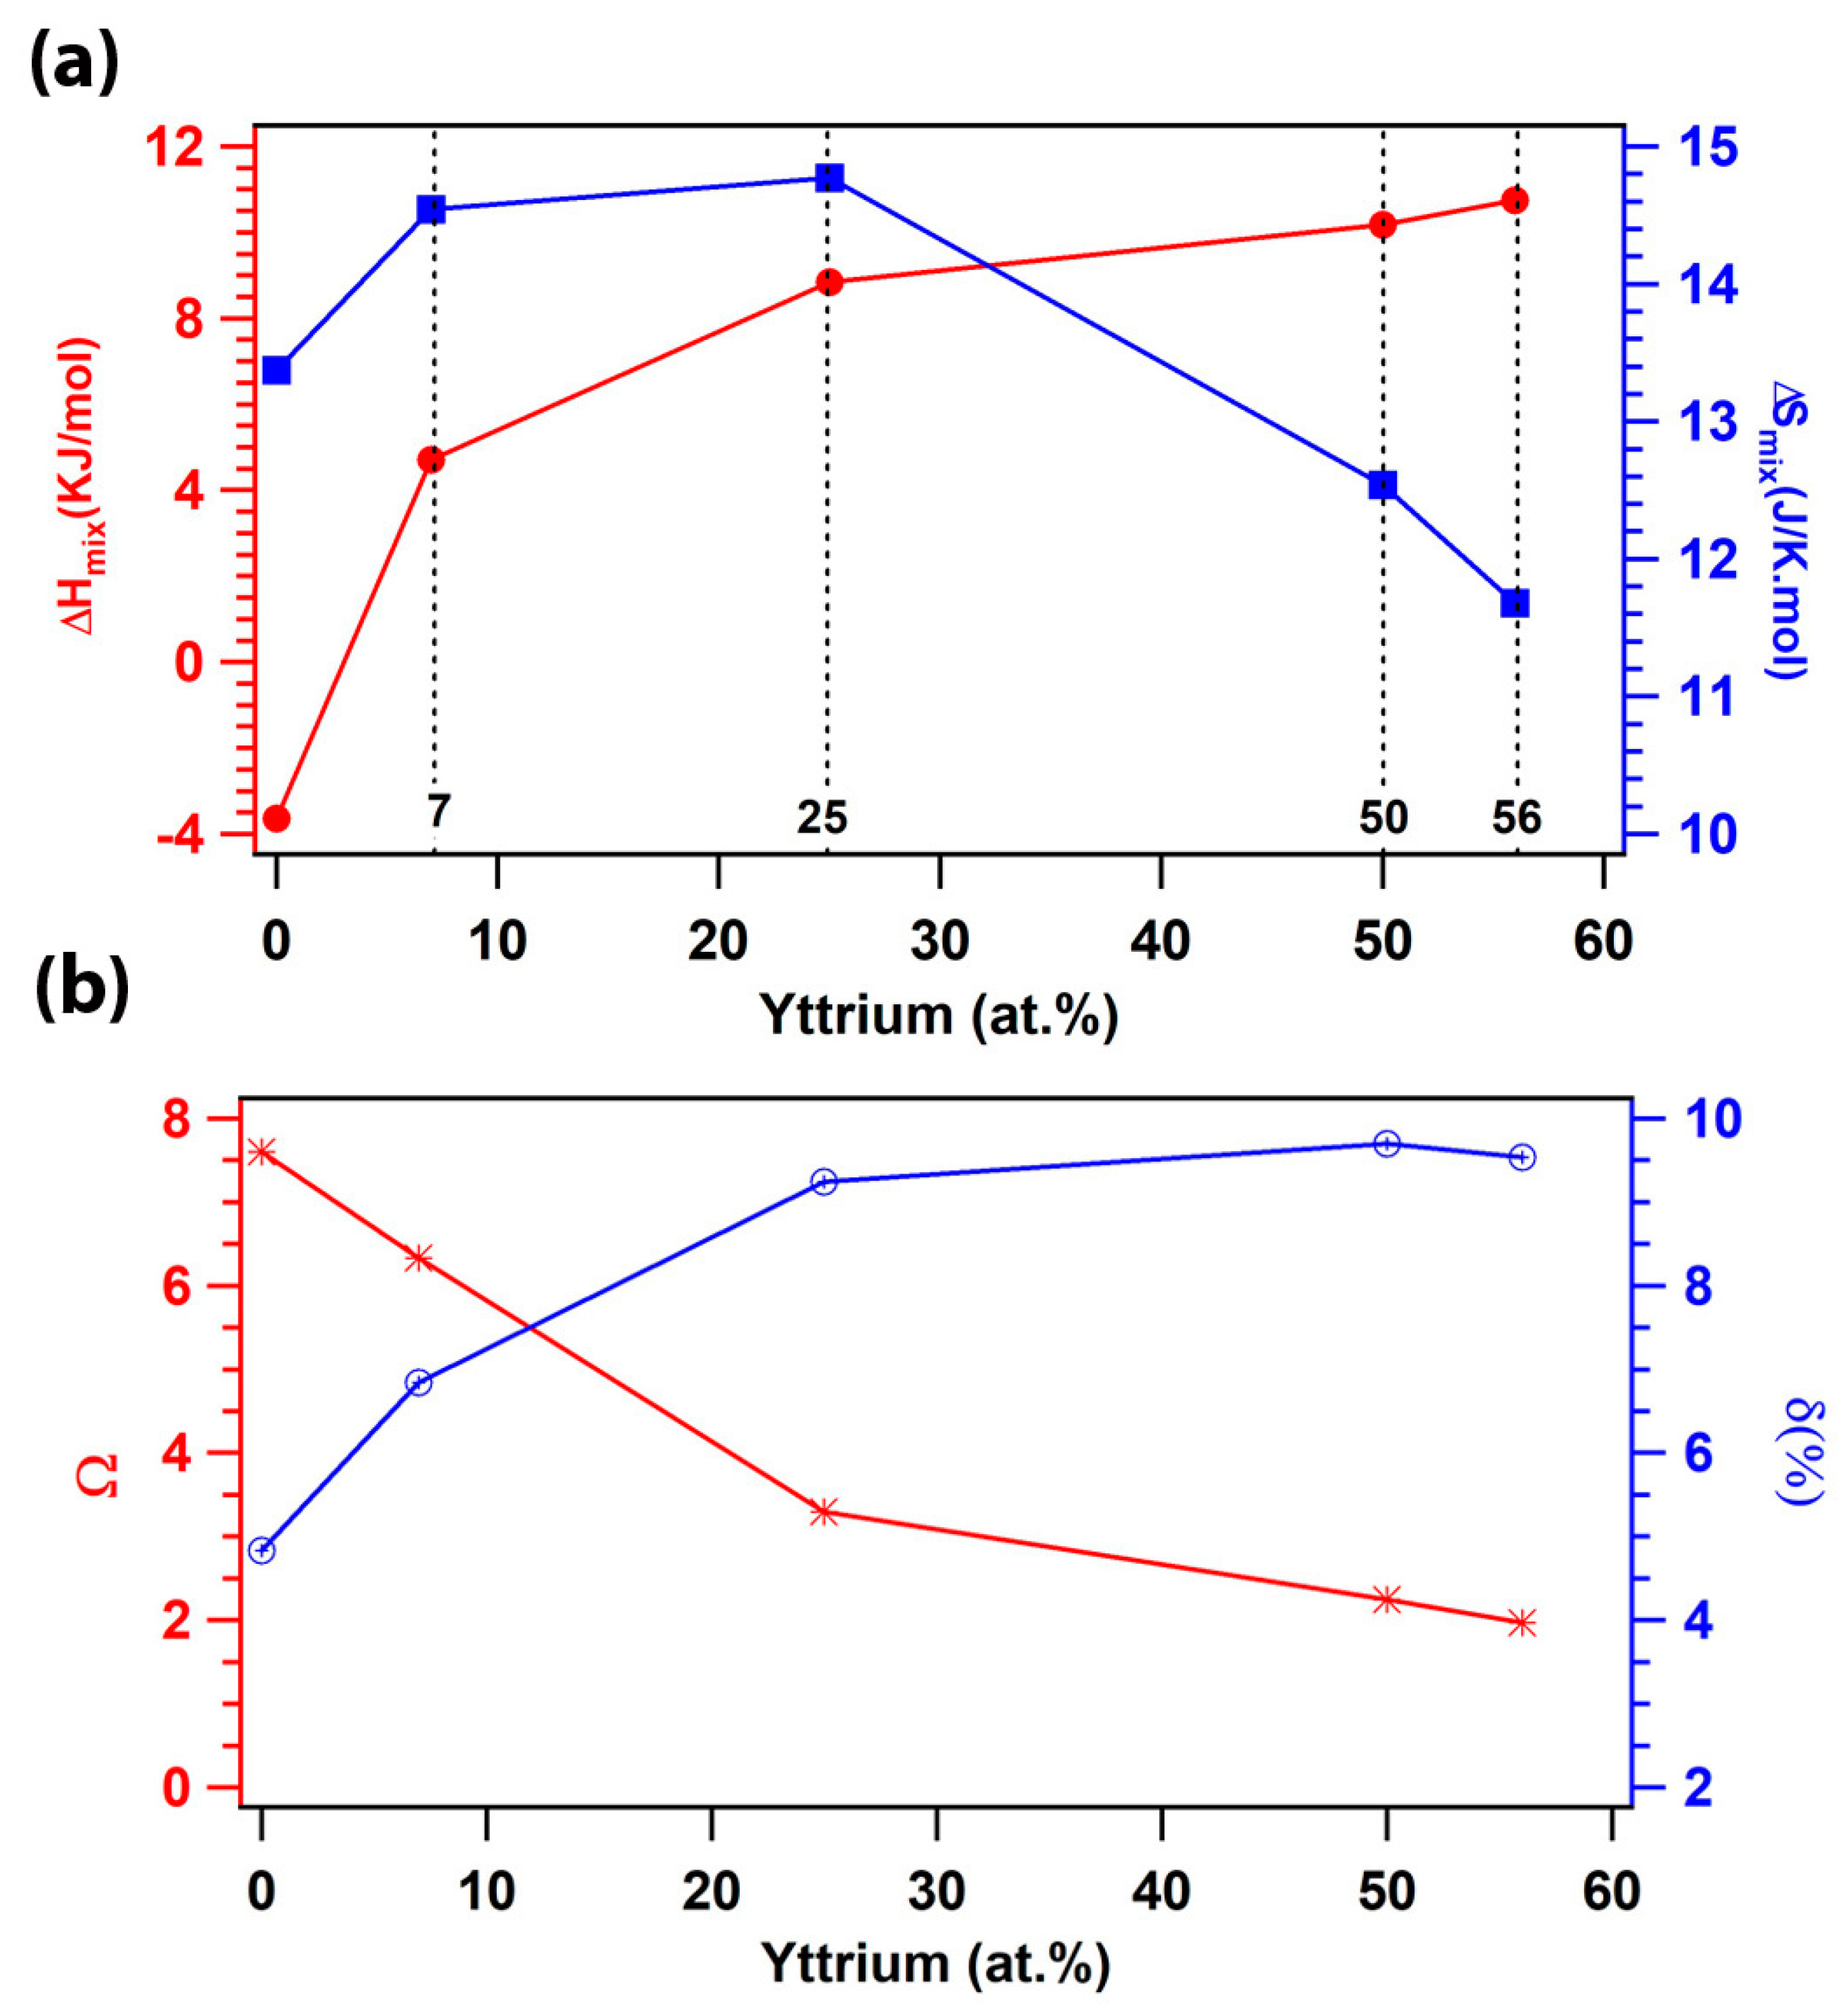
3.4. Thermodynamic Criteria

The formulas of different phase selection criteria are presented by the following equations:
S m i x = R i = 1 n c i l n c i
Δ H m i x = i = 1 ,   j 1 n 4 H A B m i x c i c j
Ω = T m S m i x | H m i x |
T m = i = 1 n c i ( T m ) i
δ = i = 1 n c i ( 1 r i / j = 1 n c j r j ) ²
where n and c i present the number of the element and the concentration, respectively. H A B m i x is the enthalpy of binary systems. Ω is the thermodynamic parameter showing the influence of the enthalpy and the entropy of elements as well as their melting temperatures T m .
Basing on the equations above, the variations of mixed enthalpy and mixed entropy are presented in Figure 8a, as well as the evolutions of calculated Ω and δ. The results reveal a strong dependence of the films on Y content. ΔHmix is calculated from the mixed enthalpy of each binary system as presented in the Table 1. It displays an increasing trend as Y content increases up to 11 kJ/mol at 56% at. Y. However, ΔSmix increases to 14.8 J/K.mol with Y content up to 25 at.%, then decreases to 11.6 J/K.mol at 56 at.% (Figure 8a). In the case of HEAs, the increase in ΔSmix can promote the formation of solid solutions. However, a drop of ΔSmix can favor the formation of intermetallic compounds. In this study, when ΔSmix increases by adding Y in a small amount, a single-phase solid solution is obtained, which is in good agreement with TEM analysis showing the presence of the L12 phase. At high content (>25 at.%), the ΔSmix drop reveals the formation of another compound identified as nanoparticles (Y-hexagonal) formed besides nano-composites ((TiTaZrHf)100−xYx—L12).
On the other hand, it has been reported that the solid solution of HEAs can be obtained in cases where Ω > 1.1 and δ < 6.6% [47]. From our results, δ shows values less than 6.6% for the films having a low Y concentration, indicating the formation of a solid solution (Figure 8b). However, δ is higher at Y contents >25 at.%, which can be attributed to the formation of intermetallic compounds or nanocomposites. Ω presents values higher than 1.1 but decreasing as a function of Y content. This confirms the trend for the formation of metal compounds. As mentioned above, XRD and TEM showed the formation of a (TiTaZrHfW)100−xYx solid solution at low Y content, while nanocomposites were formed at high Y content.

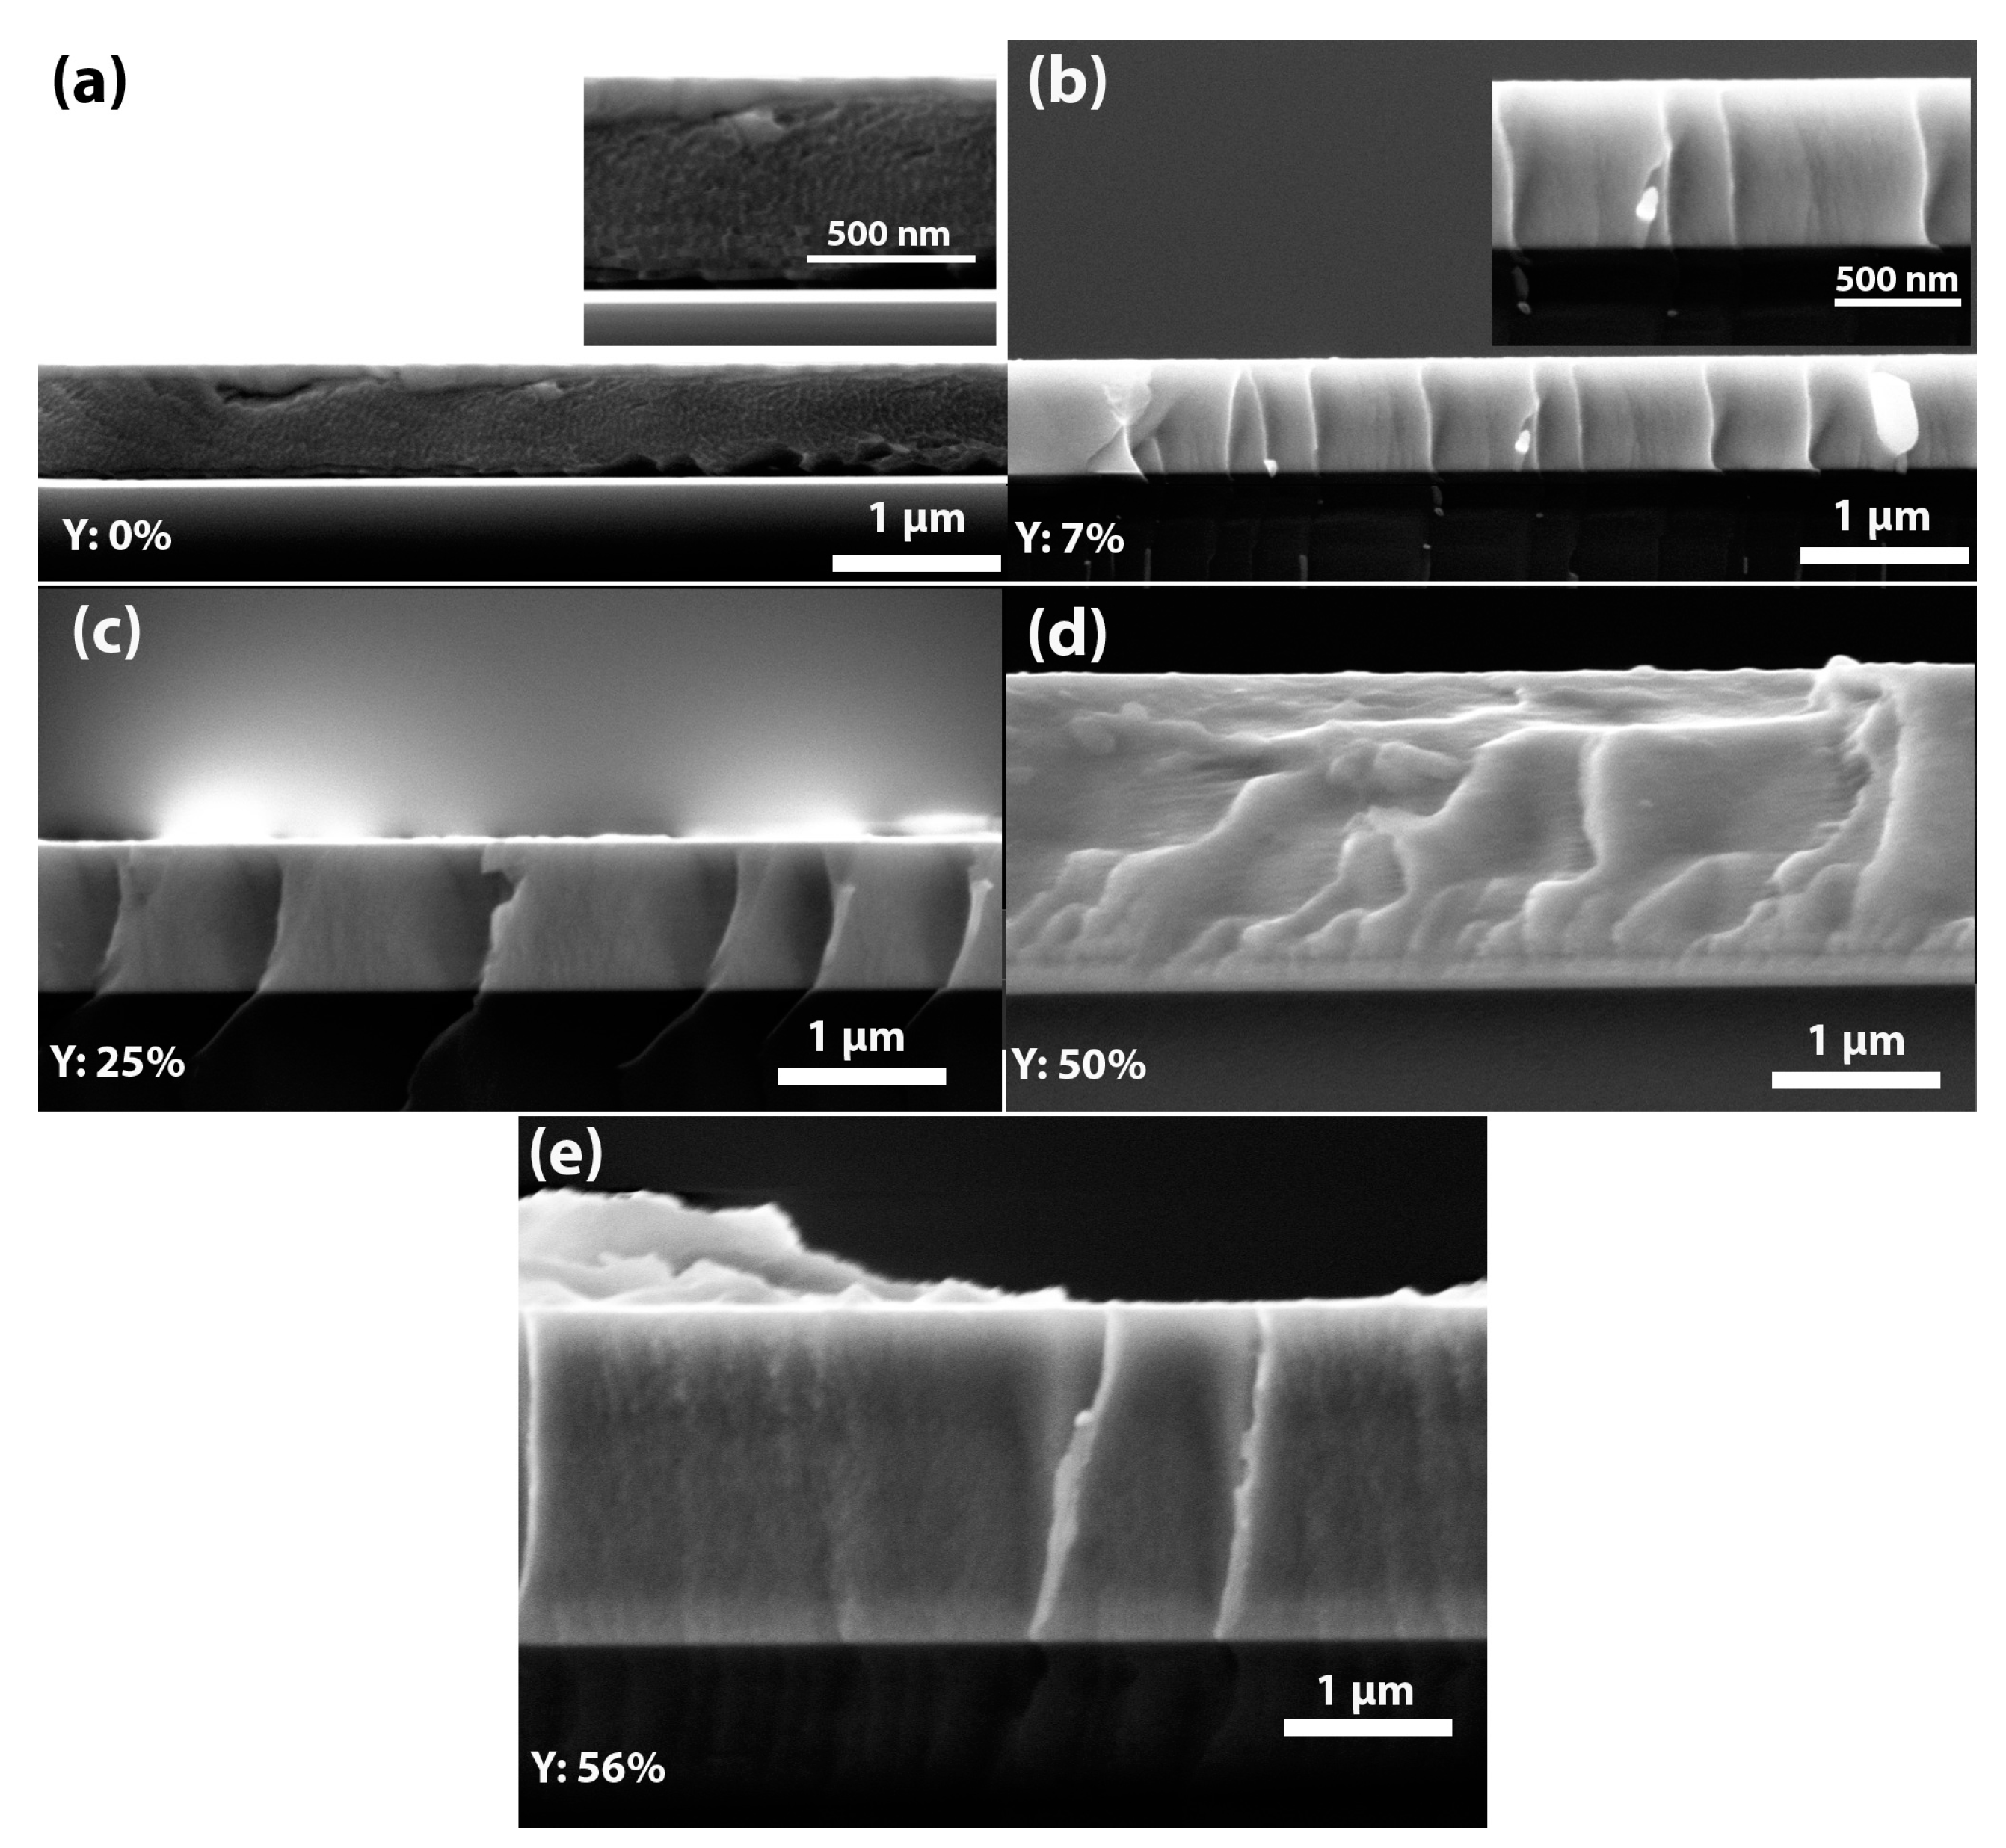
3.5. Morphology of (TiTaZrHfW)100−xYx

From the cross-section SEM images, the morphology of (TiTaZrHfW)100−xYx films without Y exhibits viscous-like features with shear striations and partial vein patterns corresponding to the characteristics of metallic glass films (Figure 9a) [48,49]. Stratification can be clearly observed on the zoomed SEM. We assume that the film is metallic glass and the that stratifications result from the breaking away of the substrate during SEM analysis. When the Y content increases to 7 at.%, 25 at.%, and 50 at.%, the morphology of the films becomes dense, smooth, and featureless (Figure 9b–d). At 56 at.% Y, it appears columnar, especially near the substrate (Figure 9e). Additionally, the thickness of the film increases from 0.6 to 2 μm as a function of Y content.

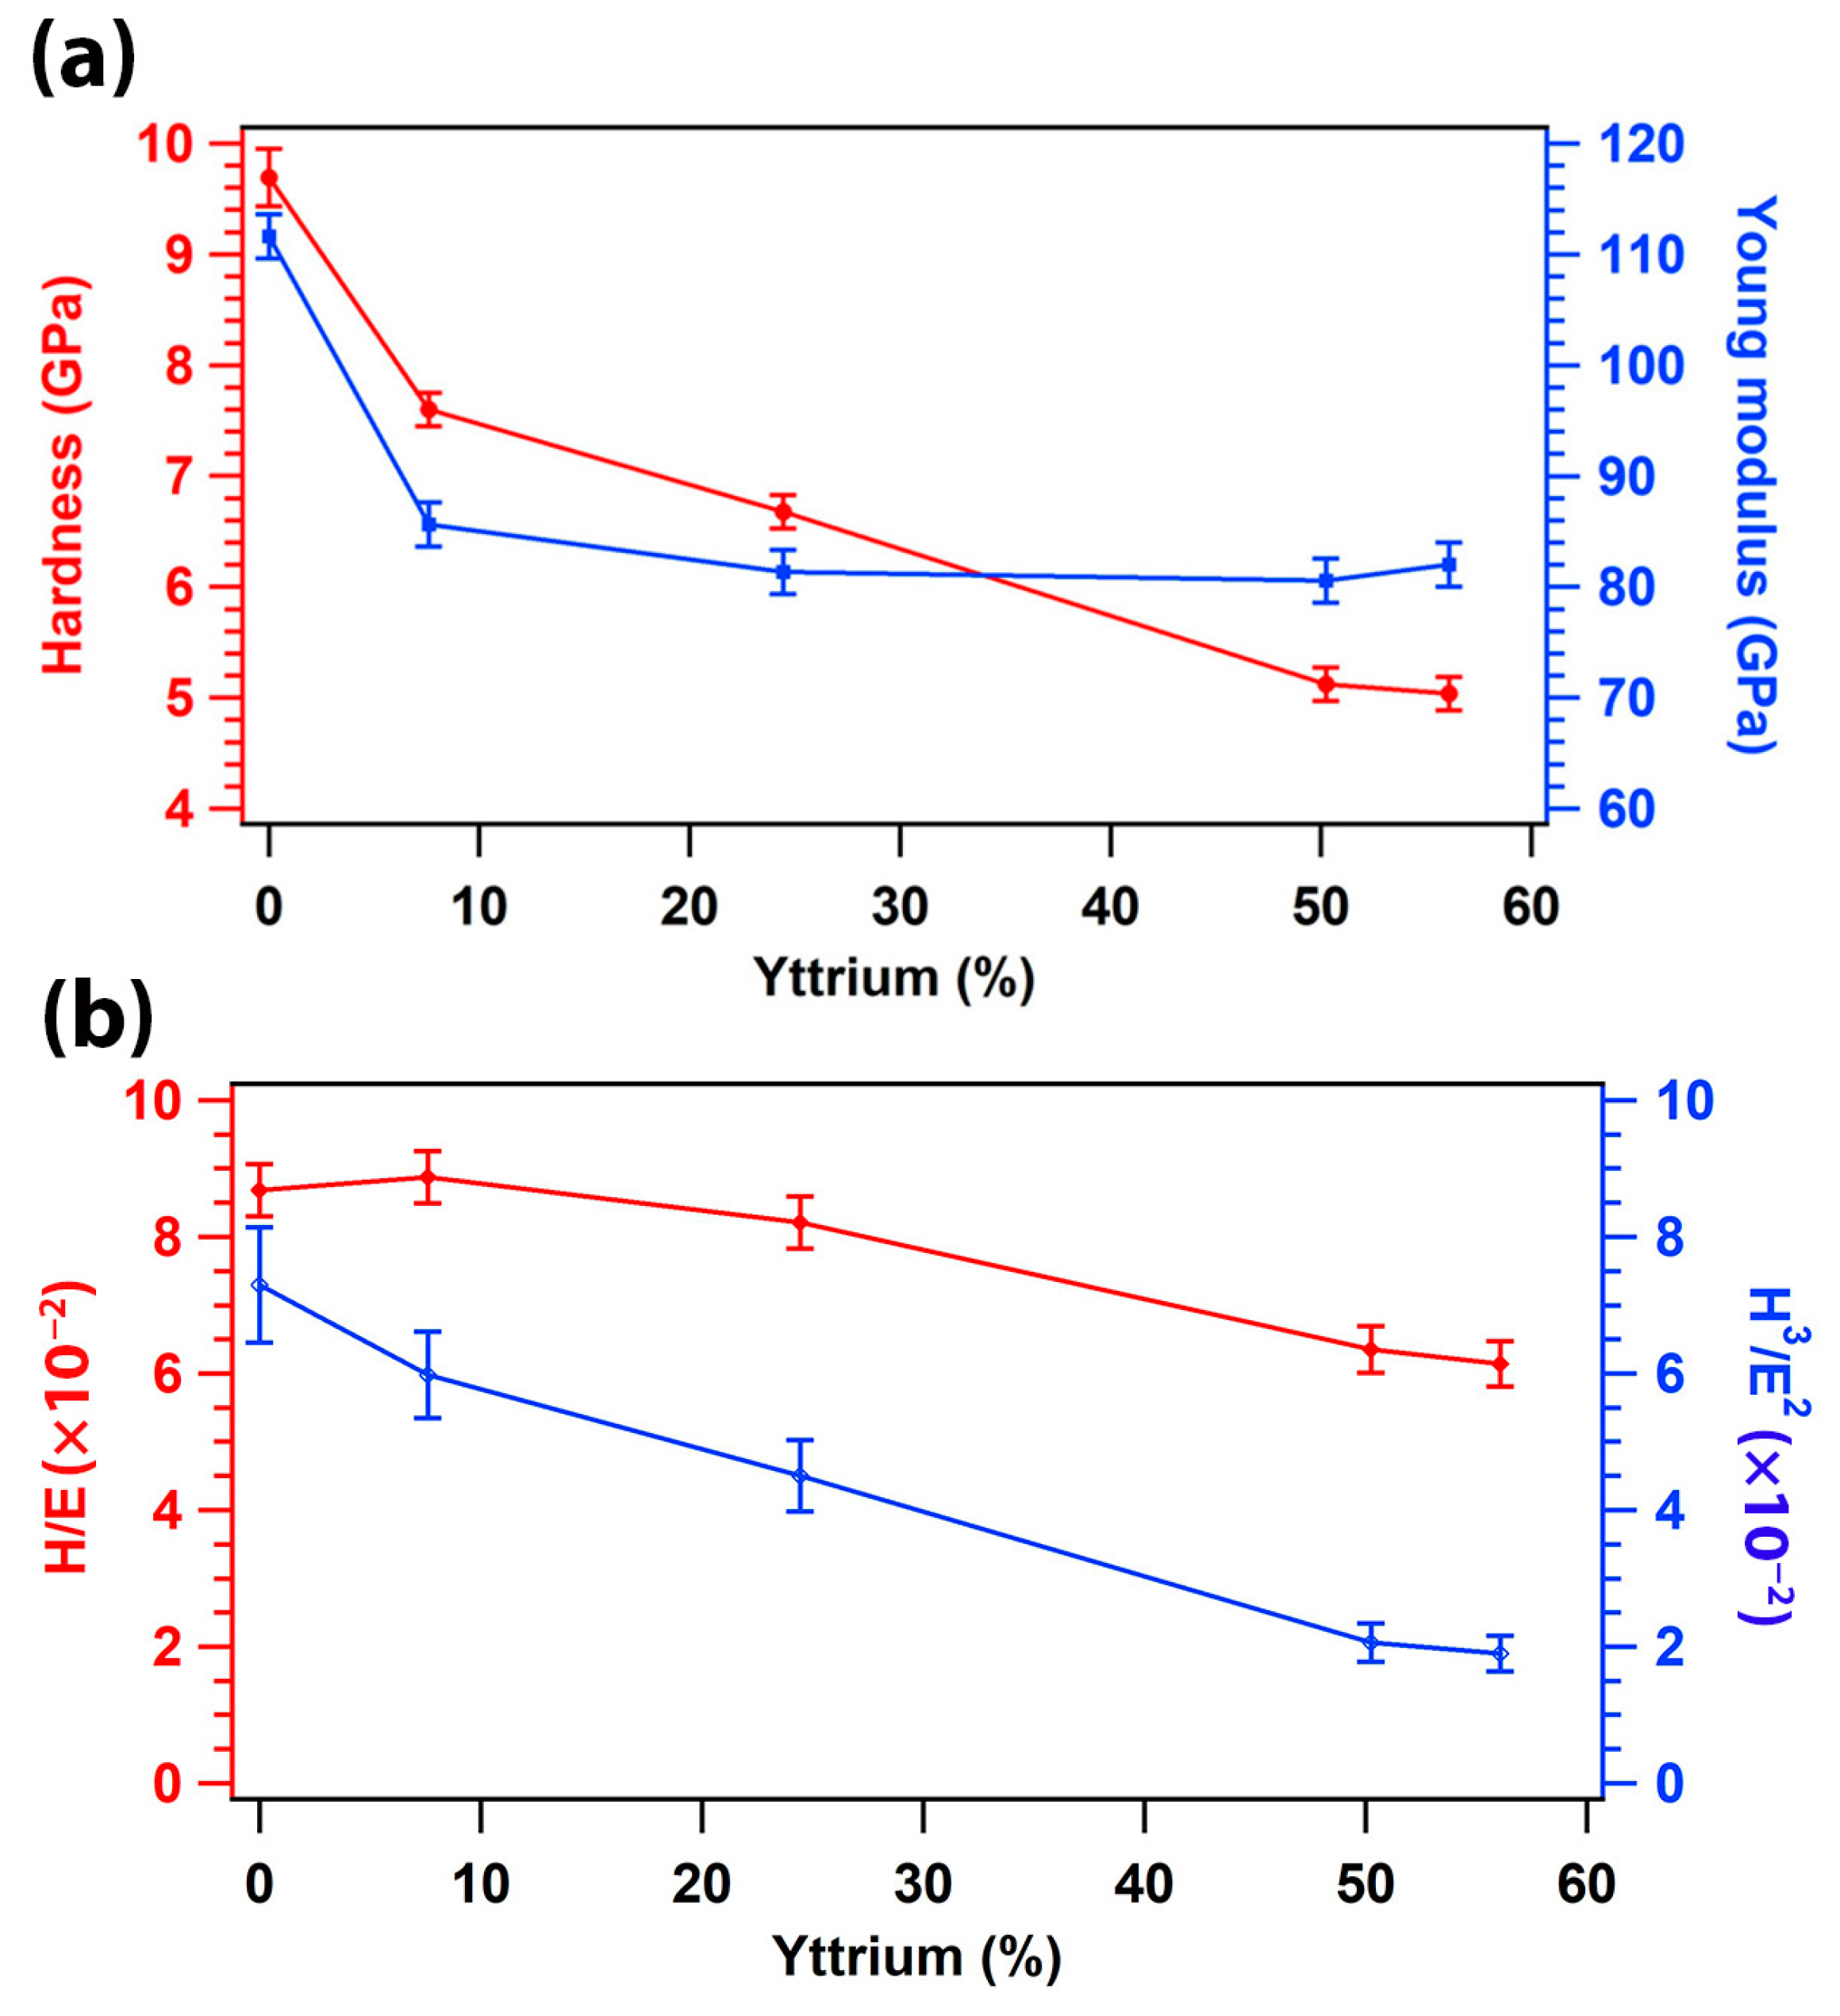
3.6. Mechanical Properties of (TiTaZrHfW)100−xYx

The mechanical properties of (TiTaZrHfW)100−xYx HEFs were characterized by nano-indentation measurements (Figure 10a). When the Y content increases, the hardness and Young’s modulus (YM) of films decrease from 9.69 GPa to 5.04 GPa and 111.63 GPa to 82 GPa, respectively. The maximum values are obtained for the film without the Y element. Hardness and YM quickly decrease when Y varies from 0 at.% to 25 at.% and then stabilizes at a higher content (Figure 10a). Zhang et al. reported the influence of Y content on the mechanical properties of the CoCrFeNiYx alloy (x = 0, 0.05, 0.1, 0.2, and 0.3) [40]. The addition of Y to the CoCrFeNi alloy leads to the formation of two phases: face-centered cubic (FCC) and hexagonal structure. The latter one was composed of two crystalline phases: HS1: P6/mmm (CaCu5 type) and HS2: P63/mmc (Ni3Y type). The results report an increase in the nano-hardness and Young’s modulus of the FCC phase from 2.9 GPa (without Y) to 3.3 Gpa (CoCrFeNiY0.3). HS1 and HS2 showed a stable evolution (around 10.5 Gpa). In our case, the results reveal the opposite tendency, i.e., the hardness decreases as the Y content increases (Figure 10a). The main reasons for this behavior could be explained by the increase in the mean grain size, as shown in Section 3.3. Small grains were formed when Y was added in low amounts to the TiTaZrHfW film. Their size, according to TEM analysis, was estimated at ~10 nm. However, the grain size increases with the Y content, up to about 200 nm. The precipitation of Y and the formation of large grains lead to the diminution of the film’s hardness.
In general, the tribological performance of films can be estimated from their mechanical properties. They can be predicted by two indices: elasticity (H/E) and plasticity (H3/E2), respectively. H/E and H3/E2 ratios characterize the resistance of the material and its ability to dissipate energy during the plastic deformation. High values of H/E and H3/E2 ratios may indicate good tribological properties. In Figure 10b, it can be observed that the variation of both ratios is consistent with the hardness and Young’s modulus evolution of (TiTaZrHfW)100−xYx HEF. The maximum values of H/E (8.87 × 10⁻²) and the H3/E2 (7.3 × 10⁻²) obtained at 0 at.% Y indicate that the (TiTaZrHfW) film has good toughness and resistance to elastic deformation. However, as the Y content increases, the H/E and H3/E2 ratios decrease. This is mainly due to the drop in hardness and Young’s modulus with the increasing Y content.

4. Conclusions

In this work, the microstructure and mechanical properties of TiTaZrHfW RHEFs were examined as a function of Y content. When Y is added in a small amount, the films exhibit an amorphous structure. TEM analysis revealed the formation of a nanocrystalline structure with grain sizes of tens of nanometers. However, when Y was added in high amounts, a bi-phased system was formed with two distinct identified structures ((TiTaZrHf)100−xYx—L12 and Y-hexagonal). The grains that are about 200 nm wide are composed of nanograins defined in the L12 structure. The other family of nanograins, located in an amorphous matrix apart from the large grains, is defined in the Y-hexagonal structure (space group P63/mmc). The grain coarsening after the addition of Y caused a degradation of hardness from 9.69 GPa for Y-free TiTaZrHfW RHEFs to 5.04 GPa for (TiTaZrHfW)0.44Y0.56. Calculations of thermodynamic phase selection criteria (ΔHmix, ΔSmix, Ω and δ) predict the formation of metallic compounds when Y is added in high amounts to the RHEFs. However, with a low Y amount, the films exhibit a single phase that can be attributed to L12 according to TEM analyses.
The formation of nanoparticles in RHEFs, especially when doped with rare earth elements, could have great potential for developing coatings to improve resistance to high temperature oxidation. The addition of Y in an appropriate amount could help reach this objective. Such an approach will be the subject of future experiments.

Author Contributions

Conceptualization, M.E.G.; methodology, M.E.G. and L.P.; validation, M.E.G., A.C. and F.S.; formal analysis, M.E.G. and L.P.; investigation, M.E.G., L.P. and A.B.; writing—original draft preparation, M.E.G.; writing—review and editing, M.E.G., L.P., A.B., A.C. and F.S.; visualization, M.E.G.; supervision, M.E.G.; project administration, M.E.G., A.C. and F.S.; funding acquisition, M.E.G. All authors have read and agreed to the published version of the manuscript.

Funding

This works was financially supported by University of Technology of Troyes (UTT), Conseil Departemental de l’Aube (CD10), and the University of Aix Marseille.

Institutional Review Board Statement

Not applicable.

Informed Consent Statement

Not applicable.

Data Availability Statement

Not applicable.

Conflicts of Interest

The authors declare no conflict of interest.

References

  1. Yeh, J.-W.; Chen, S.-K.; Lin, S.-J.; Gan, J.-Y.; Chin, T.-S.; Shun, T.-T.; Tsau, C.-H.; Chang, S.-Y. Nanostructured High-Entropy Alloys with Multiple Principal Elements: Novel Alloy Design Concepts and Outcomes. Adv. Eng. Mater. 2004, 6, 299–303. [Google Scholar] [CrossRef]
  2. Cantor, B.; Chang, I.T.H.; Knight, P.; Vincent, A.J.B. Microstructural Development in Equiatomic Multicomponent Alloys. Mater. Sci. Eng. A 2004, 375–377, 213–218. [Google Scholar] [CrossRef]
  3. Zhang, W.; Liaw, P.K.; Zhang, Y. Science and Technology in High-Entropy Alloys. Sci. China Mater. 2018, 61, 2–22. [Google Scholar] [CrossRef]
  4. Zhang, F.; Zhang, C.; Chen, S.-L.; Zhu, J.; Cao, W.-S.; Kattner, U.R. An Understanding of High Entropy Alloys from Phase Diagram Calculations. Calphad 2014, 45, 1–10. [Google Scholar] [CrossRef]
  5. Gludovatz, B.; Hohenwarter, A.; Catoor, D.; Chang, E.H.; George, E.P.; Ritchie, R.O. A Fracture-Resistant High-Entropy Alloy for Cryogenic Applications. Science 2014, 345, 1153–1158. [Google Scholar] [CrossRef] [PubMed]
  6. Tsai, D.-C.; Chang, Z.-C.; Kuo, B.-H.; Chang, S.-Y.; Shieu, F.-S. Effects of Silicon Content on the Structure and Properties of (AlCrMoTaTi)N Coatings by Reactive Magnetron Sputtering. J. Alloys Compd. 2014, 616, 646–651. [Google Scholar] [CrossRef]
  7. Wang, W.-R.; Wang, W.-L.; Wang, S.-C.; Tsai, Y.-C.; Lai, C.-H.; Yeh, J.-W. Effects of Al Addition on the Microstructure and Mechanical Property of AlxCoCrFeNi High-Entropy Alloys. Intermetallics 2012, 26, 44–51. [Google Scholar] [CrossRef]
  8. Chang, Z.-C. Structure and Properties of Duodenary (TiVCrZrNbMoHfTaWAlSi)N Coatings by Reactive Magnetron Sputtering. Mater. Chem. Phys. 2018, 220, 98–110. [Google Scholar] [CrossRef]
  9. Cheng, J.B.; Liang, X.B.; Xu, B.S. Effect of Nb Addition on the Structure and Mechanical Behaviors of CoCrCuFeNi High-Entropy Alloy Coatings. Surf. Coat. Technol. 2014, 240, 184–190. [Google Scholar] [CrossRef]
  10. Liang, H.; Miao, J.; Gao, B.; Deng, D.; Wang, T.; Lu, Y.; Cao, Z.; Jiang, H.; Li, T.; Kang, H. Microstructure and Tribological Properties of AlCrFe2Ni2W0.2Mo0.75 High-Entropy Alloy Coating Prepared by Laser Cladding in Seawater, NaCl Solution and Deionized Water. Surf. Coat. Technol. 2020, 400, 126214. [Google Scholar] [CrossRef]
  11. Jadhav, M.S.; Sahane, D.; Verma, A.; Singh, S. Thermal Stability and Thermal Expansion Behavior of FeCoCrNi2Al High Entropy Alloy. Adv. Powder Technol. 2021, 32, 378–384. [Google Scholar] [CrossRef]
  12. Chen, S.; Cai, Z.; Lu, Z.; Pu, J.; Chen, R.; Zheng, S.; Mao, C.; Chen, S. Tribo-Corrosion Behavior of VAlTiCrCu High-Entropy Alloy Film. Mater. Charact. 2019, 157, 109887. [Google Scholar] [CrossRef]
  13. Yan, Y.; McGarrity, K.A.; Delia, D.J.; Fekety, C.; Wang, K. The Oxidation-Resistance Mechanism of WTaNbTiAl Refractory High Entropy Alloy. Corros. Sci. 2022, 204, 110377. [Google Scholar] [CrossRef]
  14. Luo, J.; Sun, W.; Duan, R.; Yang, W.; Chan, K.C.; Ren, F.; Yang, X.-S. Laser Surface Treatment-Introduced Gradient Nanostructured TiZrHfTaNb Refractory High-Entropy Alloy with Significantly Enhanced Wear Resistance. J. Mater. Sci. Technol. 2022, 110, 43–56. [Google Scholar] [CrossRef]
  15. Wang, Z.; Yan, Y.; Wu, Y.; Huang, X.; Zhang, Y.; Su, Y.; Qiao, L. Corrosion and Tribocorrosion Behavior of Equiatomic Refractory Medium Entropy TiZr (Hf, Ta, Nb) Alloys in Chloride Solutions. Corros. Sci. 2022, 199, 110166. [Google Scholar] [CrossRef]
  16. Cao, B.X.; Yang, T.; Fan, L.; Luan, J.H.; Jiao, Z.B.; Liu, C.T. Refractory Alloying Additions on the Thermal Stability and Mechanical Properties of High-Entropy Alloys. Mater. Sci. Eng. A 2020, 797, 140020. [Google Scholar] [CrossRef]
  17. Senkov, O.N.; Wilks, G.B.; Scott, J.M.; Miracle, D.B. Mechanical Properties of Nb25Mo25Ta25W25 and V20Nb20Mo20Ta20W20 Refractory High Entropy Alloys. Intermetallics 2011, 19, 698–706. [Google Scholar] [CrossRef]
  18. Huang, C.; Zhang, Y.; Shen, J.; Vilar, R. Thermal Stability and Oxidation Resistance of Laser Clad TiVCrAlSi High Entropy Alloy Coatings on Ti–6Al–4V Alloy. Surf. Coat. Technol. 2011, 206, 1389–1395. [Google Scholar] [CrossRef]
  19. Zhang, H.; Pan, Y.; He, Y.-Z. Synthesis and Characterization of FeCoNiCrCu High-Entropy Alloy Coating by Laser Cladding. Mater. Des. 2011, 32, 1910–1915. [Google Scholar] [CrossRef]
  20. Qiu, X.-W.; Liu, C.-G. Microstructure and Properties of Al2CrFeCoCuTiNi High-Entropy Alloys Prepared by Laser Cladding. J. Alloys Compd. 2013, 553, 216–220. [Google Scholar] [CrossRef]
  21. Chen, T.K.; Shun, T.T.; Yeh, J.W.; Wong, M.S. Nanostructured Nitride Films of Multi-Element High-Entropy Alloys by Reactive DC Sputtering. Surf. Coat. Technol. 2004, 188–189, 193–200. [Google Scholar] [CrossRef]
  22. Achache, S.; Lamri, S.; Arab Pour Yazdi, M.; Billard, A.; François, M.; Sanchette, F. Ni-Free Superelastic Binary Ti–Nb Coatings Obtained by DC Magnetron Co-Sputtering. Surf. Coat. Technol. 2015, 275, 283–288. [Google Scholar] [CrossRef]
  23. Shen, W.-J.; Tsai, M.-H.; Chang, Y.-S.; Yeh, J.-W. Effects of Substrate Bias on the Structure and Mechanical Properties of (Al1.5CrNb0.5Si0.5Ti)Nx Coatings. Thin Solid Film. 2012, 520, 6183–6188. [Google Scholar] [CrossRef]
  24. Liu, L.; Zhu, J.B.; Hou, C.; Li, J.C.; Jiang, Q. Dense and Smooth Amorphous Films of Multicomponent FeCoNiCuVZrAl High-Entropy Alloy Deposited by Direct Current Magnetron Sputtering. Mater. Des. (1980–2015) 2013, 46, 675–679. [Google Scholar] [CrossRef]
  25. El Garah, M.; Achache, S.; Michau, A.; Schuster, F.; Sanchette, F. Structural and Mechanical Properties of AlTiTaZr( N) Medium Entropy Films (MEF) Obtained by DC Magnetron Sputtering in Dynamic Mode. Surf. Coat. Technol. 2020, 396, 125941. [Google Scholar] [CrossRef]
  26. El Garah, M.; Achache, S.; Michau, A.; Schuster, F.; Sanchette, F. AlTiTaZr(-N) Medium-Entropy Films Deposited by Magnetron Sputtering with a Combinatorial Approach. J. Mater. Eng. Perform. 2021, 30, 4063–4071. [Google Scholar] [CrossRef]
  27. Yao, C.-Z.; Zhang, P.; Liu, M.; Li, G.-R.; Ye, J.-Q.; Liu, P.; Tong, Y.-X. Electrochemical Preparation and Magnetic Study of Bi–Fe–Co–Ni–Mn High Entropy Alloy. Electrochim. Acta 2008, 53, 8359–8365. [Google Scholar] [CrossRef]
  28. Yue, T.; Xie, H.; Lin, X.; Yang, H.; Meng, G. Microstructure of Laser Re-Melted AlCoCrCuFeNi High Entropy Alloy Coatings Produced by Plasma Spraying. Entropy 2013, 15, 2833–2845. [Google Scholar] [CrossRef]
  29. Alvi, S.; Jarzabek, D.M.; Kohan, M.G.; Hedman, D.; Jenczyk, P.; Natile, M.M.; Vomiero, A.; Akhtar, F. Synthesis and Mechanical Characterization of a CuMoTaWV High-Entropy Film by Magnetron Sputtering. ACS Appl. Mater. Interfaces 2020, 12, 21070–21079. [Google Scholar] [CrossRef]
  30. Radhika, N.; Sasikumar, J.; Arulmozhivarman, J. Tribo-Mechanical Behaviour of Ti-Based Particulate Reinforced As-Cast and Heat Treated A359 Composites. Silicon 2020, 12, 2769–2782. [Google Scholar] [CrossRef]
  31. Bachani, S.K.; Wang, C.-J.; Lou, B.-S.; Chang, L.-C.; Lee, J.-W. Microstructural Characterization, Mechanical Property and Corrosion Behavior of VNbMoTaWAl Refractory High Entropy Alloy Coatings: Effect of Al Content. Surf. Coat. Technol. 2020, 403, 126351. [Google Scholar] [CrossRef]
  32. Luo, H.; Luo, F.; Chen, Y.; Wang, J.; Liu, Q.; Li, F.; Zhou, X.; Guo, L. The Effect of Yttrium Addition on the Microstructure and Irradiation Hardening in V-4Cr-4Ti Alloy under Self-Ion Irradiation. Metals 2021, 11, 1024. [Google Scholar] [CrossRef]
  33. Chinnasamy, M.; Rathanasamy, R.; Pal, S.K.; Palaniappan, S.K. Effectiveness of Cryogenic Treatment on Cutting Tool Inserts: A Review. Int. J. Refract. Met. Hard Mater. 2022, 108, 105946. [Google Scholar] [CrossRef]
  34. Lu, S.; Li, X.; Liang, X.; He, J.; Shao, W.; Li, K.; Chen, J. Effect of Y Additions on the Oxidation Behavior of Vacuum Arc Melted Refractory High-Entropy Alloy AlMo0.5NbTa0.5TiZr at Elevated Temperatures. Vacuum 2022, 201, 111069. [Google Scholar] [CrossRef]
  35. Jiang, W.; Fan, Z.; Dai, Y.; Li, C. Effects of Rare Earth Elements Addition on Microstructures, Tensile Properties and Fractography of A357 Alloy. Mater. Sci. Eng. A 2014, 597, 237–244. [Google Scholar] [CrossRef]
  36. Tong, G.; Liu, H.; Liu, Y. Effect of Rare Earth Additions on Microstructure and Mechanical Properties of AZ91 Magnesium Alloys. Trans. Nonferrous Met. Soc. China 2010, 20, s336–s340. [Google Scholar] [CrossRef]
  37. Long, Y.; Che, J.; Wu, Z.; Lin, H.-T.; Zhang, F. High Entropy Alloy Borides Prepared by Powder Metallurgy Process and the Enhanced Fracture Toughness by Addition of Yttrium. Mater. Chem. Phys. 2021, 257, 123715. [Google Scholar] [CrossRef]
  38. Li, G.R.; Liu, M.; Wang, H.M.; Zhang, D.; Tang, F.; Wang, C.W.; Zhao, Y.T.; Chen, G.; Kai, X.Z. Effect of the Rare Earth Element Yttrium on the Structure and Properties of Boron-Containing High-Entropy Alloy. JOM 2020, 72, 2332–2339. [Google Scholar] [CrossRef]
  39. Sha, M.; Zhou, Y.; Wang, N.; Yu, D.; Wang, Z.; Ai, X.; Wang, H.; Shen, M.; Li, S. Precipitation Behavior of Yttrium-Rich Nano-Phases in AlCoCrFeNi2.1Yx High-Entropy Alloy. Mater. Res. Express 2020, 7, 126510. [Google Scholar] [CrossRef]
  40. Zhang, L.J.; Zhang, M.D.; Zhou, Z.; Fan, J.T.; Cui, P.; Yu, P.F.; Jing, Q.; Ma, M.Z.; Liaw, P.K.; Li, G.; et al. Effects of Rare-Earth Element, Y, Additions on the Microstructure and Mechanical Properties of CoCrFeNi High Entropy Alloy. Mater. Sci. Eng. A 2018, 725, 437–446. [Google Scholar] [CrossRef]
  41. Hong, X.; Hsueh, C.-H. Effects of Yttrium Addition on Microstructures and Mechanical Properties of CoCrNi Medium Entropy Alloy. Intermetallics 2022, 140, 107405. [Google Scholar] [CrossRef]
  42. Kauffmann, A.; Stüber, M.; Leiste, H.; Ulrich, S.; Schlabach, S.; Szabó, D.V.; Seils, S.; Gorr, B.; Chen, H.; Seifert, H.-J.; et al. Combinatorial Exploration of the High Entropy Alloy System Co-Cr-Fe-Mn-Ni. Surf. Coat. Technol. 2017, 325, 174–180. [Google Scholar] [CrossRef]
  43. Cemin, F.; Jimenez, M.J.M.; Leidens, L.M.; Figueroa, C.A.; Alvarez, F. A Thermodynamic Study on Phase Formation and Thermal Stability of AlSiTaTiZr High-Entropy Alloy Thin Films. J. Alloys Compd. 2020, 838, 155580. [Google Scholar] [CrossRef]
  44. Demchyna, R.O.; Chykhrij, S.I.; Kuz’ma, Y.B. Y–Cu–P System. J. Alloys Compd. 2002, 345, 170–174. [Google Scholar] [CrossRef]
  45. Spedding, F.H.; Daane, A.H.; Herrmann, K.W. The Crystal Structures and Lattice Parameters of High-Purity Scandium, Yttrium and the Rare Earth Metals. Acta Cryst. 1956, 9, 559–563. [Google Scholar] [CrossRef]
  46. Stadelmann, P. Image Analysis and Simulation Software in Transmission Electron Microscopy. Microsc. Microanal. 2003, 9, 60–61. [Google Scholar] [CrossRef]
  47. Miracle, D.B.; Senkov, O.N. A Critical Review of High Entropy Alloys and Related Concepts. Acta Mater. 2017, 122, 448–511. [Google Scholar] [CrossRef]
  48. Dalla Torre, F.H.; Dubach, A.; Schällibaum, J.; Löffler, J.F. Shear Striations and Deformation Kinetics in Highly Deformed Zr-Based Bulk Metallic Glasses. Acta Mater. 2008, 56, 4635–4646. [Google Scholar] [CrossRef]
  49. Achache, S.; Sanchette, F. Effect of Tantalum Addition on Properties of Cu–Zr–Based Thin Film Metallic Glasses (TFMGs). Coatings 2020, 10, 515. [Google Scholar] [CrossRef]
Figure 1. Sputter yield of (Ti, Ta, Zr, Hf, W, Y) elements at different Ar+ ions calculated from SRIM (a), deposition rate (b), and chemical composition (c) of (TiTaZrHfW)100−xYx HEFs.
Coatings 13 01380 g001
Figure 2. Normalized X-ray diffractograms of (TiTaZrHfW)100−xYx HEF.
Coatings 13 01380 g002
Figure 3. (a) BF-STEM image showing the Si substrate (left) and the film (right) on either side of the hatched line. (b) HRTEM image of the Y-free film. (c) SAED pattern of the corresponding film showing an amorphous structure.
Coatings 13 01380 g003
Figure 4. Bright-field images and corresponding SAED patterns of (TiTaZrHfW)0.75Y0.25 (a,b) and (TiTaZrHfW)0.44Y0.56 (c,d) films. The green and red indices correspond to the L12 and hexagonal yttrium structures, respectively.
Coatings 13 01380 g004
Figure 5. Simulated SAED polycrystalline patterns showing the L12 (a) and Y-P6/mmm (b) microstructures.
Coatings 13 01380 g005
Figure 6. (a) HREM image of an yttrium nanoparticle present in the (TiTaZrHfW)0.44Y0.56 film. (b) Experimental FFT. (c) Calculated FFT with ZOLZ (red) reflections. (d) ZOLZ and FOLZ (green) reflections.
Coatings 13 01380 g006
Figure 7. (a) HREM image of a nanoparticle present in the (TiTaZrHfW)0.44Y0.56 film showing the L12 phase. (b) Experimental FFT. (c) Calculated ED pattern.
Coatings 13 01380 g007
Figure 8. (a) Calculated ΔHmix and ΔSmix of (TiTaZrHfW)100−xYx HEF. (b) Calculated Ω and δ of (TiTaZrHfW)100−xYx HEF.
Coatings 13 01380 g008
Figure 9. Cross-sectional SEM image of Y-free TiTaZrHfW (a), (TiTaZrHfW)0.93Y0.07 (b), (TiTaZrHfW)0.75Y0.25 (c), (TiTaZrHfW)0.50Y0.50 (d) and (TiTaZrHfW)0.44Y0.56 (e).
Coatings 13 01380 g009
Figure 10. (a) Hardness (red) and Young’s modulus (blue) of (TiTaZrHfW)100−xYx HEFs. (b) H/E and H3/E2 ratios of (TiTaZrHfW)100−xYx HEF.
Coatings 13 01380 g010
Table 1. Mixed enthalpy KJ/mol between different elements constituting the film (Ti, Ta, Zr, Hf, W, Y).
Element (Melting Point, Atomic Size)TiTaZrHfWY
Ti (1660 °C, 176 pm)-100−615
Ta (2850 °C, 200 pm)--33−727
Zr (1852 °C, 206 pm)---0−99
Hf (2200 °C, 208 pm)----−611
W (3410 °C, 193 pm)-----24
Y (1500 °C, 212 pm)------
Disclaimer/Publisher’s Note: The statements, opinions and data contained in all publications are solely those of the individual author(s) and contributor(s) and not of MDPI and/or the editor(s). MDPI and/or the editor(s) disclaim responsibility for any injury to people or property resulting from any ideas, methods, instructions or products referred to in the content.

